Regression as a Method to Predict Copy Numbers in Comparative Genomic Hybridization Studies on Bacteria Guri Feten * , Trygve Almøy, Lars Snipen, Ȧgot Aakra, and Are H. Aastveit Department of Chemistry, Biotechnology and Food Science, Norwegian University of Life Sciences, P.O. Box 5003, N-1432 As, Norway Received 6 April 2005, revised 15 October 2005, accepted 28 October 2005 Summary Comparative genomic hybridizations (CGH) using microarrays are performed with bacteria in order to determine the level of genomic similarity between various strains. The microarrays applied in CGH experiments are constructed on the basis of the genome sequence of one strain, which is used as a control, or reference, in each experiment. A strain being compared with the known strain is called the unknown strain. The ratios of fluorescent intensities obtained from the spots on the microarrays can be used to determine which genes are divergent in the unknown strain, as well as to predict the copy number of actual genes in the unknown strain. In this paper, we focus on the prediction of gene copy number based on data from CGH experiments. We assumed a linear connection between the log 2 of the copy number and the observed log 2 -ratios, then predictors based on the factor analysis model and the linear random model were proposed in an attempt to identify the copy numbers. These predictors were compared to using the ratio of the intensities directly. Simulations indicated that the proposed predictors improved the prediction of the copy number in most situations. The predictors were applied on CGH data obtained from experiments with Enterococ- cus faecalis strains in order to determine copy number of relevant genes in five different strains. Key words: Microarray experiment; Comparative genomic hybridization; Factor analysis model; Linear random model. 1 Introduction Comparative genomic hybridization (CGH) studies are performed to examine genomic similarity be- tween organisms (Behr et al., 1999; BjȰrkholm et al., 2001). An introduction to CGH-technology can be found in e.g. Sassetti and Rubin (2002), and Mantripragada et al. (2004). In such comparative studies, the genome sequence of one of the strains is known, and a microarray has been constructed on this basis, where every gene has been (repeatedly) spotted. In the CGH experiment the gene con- tent of an unknown strain is compared to the known strain by hybridization of fluorescently labelled genomic DNA from the known and the unknown strains to the microarray. Prior to labelling and hybridization, the genomic DNA from the two strains is usually fragmented, either physically or en- zymatically. The fragmented DNA is labelled with dyes (e.g. Cy3 and Cy5), one colour for the known strain and one colour for the unknown strain. Upon scanning the dyes fluoresce, and the fluorescent intensities from each spot (representing a gene) are estimated. Scanning and image analysis are de- scribed by Nguyen et al. (2002). From the obtained intensities we try to draw conclusions about which genes are divergent in the unknown strain. For genes that are present in the unknown strain, we try to draw conclusions about the copy number of the genes. * Corresponding author: e-mail: [email protected], Phone: +47 64 96 58 28, Fax: +47 64 96 59 01 Biometrical Journal 48 (2006) 2, 255 – 270 DOI: 10.1002/bimj.200510208 # 2006 WILEY-VCH Verlag GmbH &Co. KGaA, Weinheim

Welcome message from author
This document is posted to help you gain knowledge. Please leave a comment to let me know what you think about it! Share it to your friends and learn new things together.
Transcript
Regression as a Method to Predict Copy Numbersin Comparative Genomic Hybridization Studies on Bacteria
Guri Feten*, Trygve Almøy, Lars Snipen, �got Aakra, and Are H. Aastveit
Department of Chemistry, Biotechnology and Food Science, Norwegian University of Life Sciences,P.O. Box 5003, N-1432 �As, Norway
Received 6 April 2005, revised 15 October 2005, accepted 28 October 2005
Summary
Comparative genomic hybridizations (CGH) using microarrays are performed with bacteria in order todetermine the level of genomic similarity between various strains. The microarrays applied in CGHexperiments are constructed on the basis of the genome sequence of one strain, which is used as acontrol, or reference, in each experiment. A strain being compared with the known strain is called theunknown strain. The ratios of fluorescent intensities obtained from the spots on the microarrays can beused to determine which genes are divergent in the unknown strain, as well as to predict the copynumber of actual genes in the unknown strain. In this paper, we focus on the prediction of gene copynumber based on data from CGH experiments.
We assumed a linear connection between the log2 of the copy number and the observed log2-ratios, thenpredictors based on the factor analysis model and the linear random model were proposed in an attempt toidentify the copy numbers. These predictors were compared to using the ratio of the intensities directly.
Simulations indicated that the proposed predictors improved the prediction of the copy number inmost situations. The predictors were applied on CGH data obtained from experiments with Enterococ-cus faecalis strains in order to determine copy number of relevant genes in five different strains.
Key words: Microarray experiment; Comparative genomic hybridization; Factor analysismodel; Linear random model.
1 Introduction
Comparative genomic hybridization (CGH) studies are performed to examine genomic similarity be-tween organisms (Behr et al., 1999; Bj�rkholm et al., 2001). An introduction to CGH-technology canbe found in e.g. Sassetti and Rubin (2002), and Mantripragada et al. (2004). In such comparativestudies, the genome sequence of one of the strains is known, and a microarray has been constructedon this basis, where every gene has been (repeatedly) spotted. In the CGH experiment the gene con-tent of an unknown strain is compared to the known strain by hybridization of fluorescently labelledgenomic DNA from the known and the unknown strains to the microarray. Prior to labelling andhybridization, the genomic DNA from the two strains is usually fragmented, either physically or en-zymatically. The fragmented DNA is labelled with dyes (e.g. Cy3 and Cy5), one colour for the knownstrain and one colour for the unknown strain. Upon scanning the dyes fluoresce, and the fluorescentintensities from each spot (representing a gene) are estimated. Scanning and image analysis are de-scribed by Nguyen et al. (2002).
From the obtained intensities we try to draw conclusions about which genes are divergent in theunknown strain. For genes that are present in the unknown strain, we try to draw conclusions aboutthe copy number of the genes.
* Corresponding author: e-mail: [email protected], Phone: +47 64 96 58 28, Fax: +47 64 96 59 01
Biometrical Journal 48 (2006) 2, 255–270 DOI: 10.1002/bimj.200510208
# 2006 WILEY-VCH Verlag GmbH & Co. KGaA, Weinheim
Kim et al. (2002) introduced a method for dividing the genes into two groups, divergent and pre-sent. The method selects a log2-ratio value, based on the variation in strain composition and thequality of hybridization, used as a cutoff between the two groups. In addition the method provides anestimate of the probability that a given gene is present.
Autio et al. (2003) used k-means clustering and dynamic programming to divide the genes intothree groups, divergent, equally present, and amplified (genes with higher copy number in the un-known strain compared to the known strain).
A refinement of dividing the genes into three groups is to divide the genes into sets with equalcopy number. Instead of finding the copy numbers, methods for identifying copy number changeshave been worked out by aim of an unsupervised hidden markov models approach (Fridlyand et al.,2004), and standard t-statistic and a modification with variances smoothed along the genome (Wangand Guo, 2004).
The observed ratios for each gene are unknown functions of the copy number. There are, of course,many disturbances before the ratios are observed: In CGH experiments, fragments of labelled genomicDNA are hybridized to the microarray. In general, the strategy chosen for DNA fragmentation will notgive fragments with exact match to the DNA fragments (here: PCR products) on the arrays. We maytherefore be faced with an unspecific hybridization, which could be viewed as noise in the end.
Traditionally, genes in bacterial genomes have been regarded as non-redundant, i.e. the majority ofbacterial genes were believed to be present in one copy per genome. Natural selection has beenassumed to favour the elimination of gene redundancy in bacteria. Today, this view is being somewhatrevised. The complete genome sequences of bacteria that are available today show that nearly allbacteria contain multiple copies of certain genes, so called ‘‘paralog” gene families (Pushker, Mira,and Rodr�guez-Valera, 2004).
In this paper we will describe various predictors to predict the gene copy number, along with twodifferent criteria to validate these predictors (Section 2). The predictors are well known in statistics,but, as far as we know, previously not used in prediction of copy numbers. In Section 3 the predictorsare illustrated by an example. Section 4 contains the design and the results of a simulation study inorder to compare the different predictors. Finally, in Section 5 we discuss the results obtained fromboth the study of real data and the simulation study, and raise some questions for further studies.
2 Methods
2.1 General model
Let y be the log2-ratio of the intensity of a gene with copy number c, with c ¼ ½0; 1; . . . ;K�. Assumethat w ¼ y; x½ �t follows the Probability Density Function (PDF) f ðw; qÞ, where x ¼ log2ðcþ eÞ, and eis a small positive number introduced since the logarithm of zero does not exist. The Best Predictor(BP) for x (under expected quadratic loss) is
xxBP ¼ EðxjyÞ;where Eðx� xxÞ2 ¼ Var ðxjyÞ (Bickel and Doksum, 1977). Since the PDF of w is unknown, xxBP cannotbe found, and we need to take some further assumptions into account. Let index j always refers togenes. We assume that for each of p genes there is a linear relationship between x and the log2-ratioy. Hence for gene j we have
yj ¼ b0 þ b1ðxj � �xxÞ þ ej; ð1Þ
where �xx is the average of xj over all genes, and where common assumptions about ej are made.If calibration data with known copy numbers were available, and one assumes x in (1) to be ran-
dom, the natural predictor of x is (Brown, 1993)
xx ¼ �xxþ sxy
syyðy� �yyÞ;
256 G. Feten et al.: Prediction of gene copy number
# 2006 WILEY-VCH Verlag GmbH & Co. KGaA, Weinheim www.biometrical-journal.com

where �xx and �yy are the sample means from the calibration data and sxy ¼Ppj¼1ðxj � �xxÞðyj � �yyÞ, and
syy ¼Ppj¼1ðyj � �yyÞ2.
Let index i always refers to spots. An extension of Model (1) arises if we have nj measures on gene j,
yj ¼ b01þ b1ðxj � �xxÞ 1þ ej; ð2Þ
where yj is a vector of the nj observations for gene j, and where common assumptions about the errorsej are made. If nothing else is mentioned, a balanced experiment is assumed (nj ¼ n for all genes).
If we assume that xj is a random variable with variance f2, the unconditional variance of yj and thecovariance between yj and xj are
Var ðyjÞ ¼ f2b2111t þ s2I; and Cov ðyj; xjÞ ¼ f2b11: ð3Þ
Since a calibration set is not available, other techniques have to be taken into account in order toestimate the unknown parameters in (3). Three predictors, all based on a linear model, are proposedhere. In addition, a predictor without any model assumptions is proposed. The predictors are summar-ized in Table 1.
2.2 The predictors
2.2.1 Ratio
The simplest predictor, in this paper called Ratio (R), predicts the copy number by considering theaverage of the observed ratios for a gene, i.e. the predictor does not consider the log2-ratio (Bj�rk-holm et al., 2001). If we let zij ¼ 2yij be the observed ratio for gene j on spot i, then the predictedcopy number for gene j is based on
�zzj ¼1n
Pni¼1
zij: ð4Þ
2.2.2 The factor analysis model
Model (2) with x regarded as random can be viewed as a factor analysis model with one commonfactor given by
yj ¼ mþ gfj þ ej; ð5Þ
where m ¼ m1 ðn� 1Þ is a vector of constants, g ¼ g1 ðn� 1Þ is a vector of factor loadings, fj is thefactor score, and ej ðn� 1Þ is a vector of specific factors (Lawley and Maxwell, 1973). Assume fj andej to be independent, fj distributed with expectation 0 and variance 1, and ej independently distributedej � Nð0;yIÞ. (In factor analysis it is common to assume that fj is normally distributed.) The uncondi-tional variance of yj and the covariance between yj and fj are given by (3) with xj ¼ fj,f2 ¼ 1; b1 ¼ g, and s2 ¼ y. The factor analysis model in (5) corresponds to the model in (2) ifm ¼ m1 and g ¼ g1. Known methods to predict fj can now be applied to predict ðxj � �xxÞ.
The Best Linear Predictor (BLP) for fj based on Model (5) becomes
ffT1;j ¼1
yngþ g
ð�yyj � mÞ; ð6Þ
where �yyj is the average of the log2-ratios for gene j. (If fj is normally distributed this is an unbiasedpredictor). This predictor is also known as Thompson’s factor score (Mardia, Kent, and Bibby, 1979).
Biometrical Journal 48 (2006) 2 257
# 2006 WILEY-VCH Verlag GmbH & Co. KGaA, Weinheim www.biometrical-journal.com

The unknown parameters (g, y, and m) are estimated by
gg2 ¼ 2nðn�1Þ
Pl<l0
sðyÞll0 ¼ �ssðyÞll0 ;
yy ¼ 1n
Pnl¼1
sðyÞll � 2nðn�1Þ
Pl<l0
sðyÞll0 ¼ �ssðyÞll � �ssðyÞll0 ;
mm ¼ 1np
Pni¼1
Ppj¼1
yij ¼ �yy;
ð7Þ
where sðyÞll0 is the element l; l0 in the covariance matrix Syy ¼ 1p
Ppj¼1ðyj � �yyÞðyj � �yyÞt, �yy ¼ 1
p
Ppj¼1
yj, and yj
is the vector containing the n observations for gene j. (If fj is normally distributed, these estimators aremaximum likelihood estimators, Mardia et al., 1979.) The estimators in (7) inserted in (6) lead to thepredictor we call T1 in this paper.
The previous models do not take into account any effect of array, neither in the expectation, nor inthe variance. Let index k refers to arrays. Each of the q arrays consists of mkj replicates of each genePq
k¼1mkj ¼ nj
!. A balanced experiment is assumed (mkj ¼ m for all arrays and genes). An extension
of the model given by Eq. (5) can be given as
ykj ¼ mk1þ g1fj þ ekj;
where mk is the array effect and ekj is assumed independently distributed, ekj � Nð0;ykIÞ. Since�yykj ¼ 1
m1tykj, a factor model which simultaneously models all arrays is
�yyj ¼ mþ gfj þ �eej; ð8Þ
with g ¼ g1, and the �eej’s independently distributed �eej � Nð0; 1m YÞ, where Y is a diagonal matrix with
yk as element k; k.Thompson’s factor score based on the model given by Equation (8) becomes
ffT2;j ¼ mgð1þ mg21tY�11Þ�1 1tY�1ð�yyj � mÞ: ð9Þ
The estimators for g, Y, and m inserted in (9) give a predictor we call T2.The parameters are estimated by
gg2 ¼ 2qðq�1Þ
Pl<l0
sð�yyÞll0 ¼ �ssð�yyÞll0 ;
YY ¼ diag m sð�yyÞkk � 2qðq�1Þ
Pl<l0
sð�yyÞll0� �� �
¼ diag ðmðsð�yyÞkk � �ssð�yyÞll0 ÞÞ;
mm ¼ 1p
Ppj¼1
�yyj;
where sð�yyÞll0 is the off diagonal element l; l0 in the covariance matrix S�yy�yy ¼ 1p
Ppj¼1ð�yyj � ~�yy�yyÞð�yyj � ~�yy�yyÞt,
~�yy�yy ¼ 1p
Ppj¼1
�yyj. (If fj is normally distributed, these estimators are also maximum likelihood estimators,
Mardia et al., 1979.)
2.2.3 The linear random model
For unbalanced experiments iterative procedures have to be used to achieve estimates of the parametersin Eq. (6). If Model (2) is treated as a random model, the unknown parameters can be directly estimatedfrom the sum of squares within genes, the sum of squares between genes, and the total sum of squares.
258 G. Feten et al.: Prediction of gene copy number
# 2006 WILEY-VCH Verlag GmbH & Co. KGaA, Weinheim www.biometrical-journal.com
If the genes are assumed to be randomly chosen from the population of genes, the effect of gene j,here denoted aj, is assumed to be random. The effect of gene j is a function of the correspondingcopy number. The linear random model is given by
yij ¼ mþ aj þ eij; ð10Þ
where aj and eij are independent random variables. Assume aj is distributed with expectation 0 andvariance s2
a, hence aj
sais distributed with variance 1, and eij � Nð0; s2Þ. (It is common in analysis of
variance to assume that aj is normally distributed.)A closer inspection of the models in (5) and (10) shows they are similar if y ¼ s2, g2 ¼ s2
a, and
fj ¼aj
sa: ð11Þ
The estimators of s2a and s2 can be found in e.g. Montgomery (1997).
The Best Linear Predictor (BLP) of aj is
aaj ¼s2
as2
njþ s2
a
�yyj �
Ppj¼1
nj
nj s2aþs2 �yyj
Ppj¼1
nj
nj s2aþs2
0BBB@1CCCA ð12Þ
(Searle, 1987). By inserting the estimated values of s2a and s2 into (12) a prediction of aj is achieved.
If these predicted values, together with the square root of the estimate of s2a are substituted into (11),
we receive ffL;j, a predictor we call L.For equal sample sizes we get a predictor equal to Thompson’s factor score in (6), but due to
different methods of estimation, the maximum likelihood procedure does not take into account thedegrees of freedom lost for estimation of the fixed parameters, their predictions are only approxi-mately equal.
Biometrical Journal 48 (2006) 2 259
Table 1 Overview of the predictors with the acronyms used in the text. The numbers in thebrackets refer to the number of the corresponding equation in the text. The unknown param-eters in the equations are estimated (see the text). The predicted copy number for the regres-
sion predictors is given by ccj ¼ round 12tþ1
Pjþt
r¼j�t2ffrþ�yy
!, while the predicted copy number for
Ratio is given by ccj ¼ round 12tþ1
Pjþt
r¼j�t�zzj
!.
Name of predictor Equation Model
Ratio R �zzj ¼ 1n
Pni¼1
zij ð4Þ No model
Thompson’s factorscore
T1 ffT1;j ¼ 1yngþgð�yyj � mÞ ð6Þ yj ¼ mþ gfj þ ej ð5Þ
Thompson’s factorscore
T2 ffT2;j ¼ mg1tY�1
1þmg21tY�11ð�yyj � mÞ ð9Þ �yyj ¼ mþ gfj þ �eej ð8Þ
Linear randommodel
L ffL;j ¼ aj
sað11Þ yij ¼ mþ aj þ eij ð10Þ
# 2006 WILEY-VCH Verlag GmbH & Co. KGaA, Weinheim www.biometrical-journal.com

2.3 Prediction of copy numbers
If we assume that ffj ¼ ð dxj � �xxxj � �xxÞ ¼ xxj � �xx�xx, the predicted values of fj could have been used to predict xj,i.e. xxj ¼ ffj þ �xx�xx, but �xx�xx is unknown, hence xxj cannot be found. To avoid this problem we assume that theaverage of the x’s and the average of the y’s (log2-ratios) are approximately equal, then xxj � ffj þ �yy.Our final interest is the predicted value of cj, where cj ¼ 2xj � e with e ignorable.
It is common to assume that a genome consists of regions of genes with equal copy number (Wangand Guo, 2004). To take advantage of this spatial information, the predicted copy numbers could besmoothed by moving average with 2t neighbours. The predicted copy number of gene j is then
~ccj ¼1
2t þ 1
Pjþt
r¼j�t2ffrþ�yy
for the regression methods, and
~ccj ¼1
2t þ 1
Pjþt
r¼j�t�zzr
for Ratio. In this paper we have used two neighbours (t ¼ 1). Since ~ccj is continuous, and the actualcopy number is discrete, we convert the continuous numbers into discrete by rounding the predictedvalues to the nearest integer, or
ccj ¼ round ð~ccjÞ:
2.4 Validation of predictors
If the true copy numbers were known, there are different criteria, depending on the aspect of interest,to use in the validation of the predictors. If the focus is on predicting the copy number as well aspossible, the common criterion is the Root Mean Square Error of Prediction (RMSEP),
RMSEP ¼ffiffiffiffiffiffiffiffiffiffiffiffiffiffiffiffiffiffiffiffiffiffiffiffiffiffiffi1p
Ppj¼1ðcj � ccjÞ2
s;
where p is the number of genes, cj is the copy number of gene j, and ccj is the predicted copy numberof the corresponding gene. The RMSEP is an estimator of the expected square error of prediction,ffiffiffiffiffiffiffiffiffiffiffiffiffiffiffiffiffiffiffi
Eðc� ccÞ2q
, where large errors are heavier weighted than small errors.When the main focus is on grouping the genes into three classes, absent (c ¼ 0), equally present
(c ¼ 1), and present in multiple copies (c � 2), a natural choice for validation is the Error of Classifi-cation (EC), where
EC ¼ 1p
Ppj¼1
Iðcj ¼ 0 and ccj 6¼ 0Þ þPpj¼1
Iðcj ¼ 1 and ccj 6¼ 1Þ þPpj¼1
Iðcj � 2 and ccj < 2Þ !
;
where Ið�Þ equals 1 if the expression is true and 0 otherwise. The EC measure is an estimator of theprobability of predicting wrong group.
The practical difficulty is that the true copy number is seldom known, the exceptions are experi-ments where the genome sequences are available (known-known hybridization). Since we have nosuch data available, we simulate data for validation of the predictors. The predictors are alsocompared, but not validated, based on results from real data where the genome sequences areunknown.
260 G. Feten et al.: Prediction of gene copy number
# 2006 WILEY-VCH Verlag GmbH & Co. KGaA, Weinheim www.biometrical-journal.com
3 Example
3.1 Data
As an example we applied the predictors on data where the known strain is the Enterococcus faecalisV583 bacterium (Paulsen et al., 2003). The genomic DNA of V583 was compared to five otherE. faecalis strains, denoted NCDO 581, NCDO 642, EF BRIDGE, JH2SS and V24.
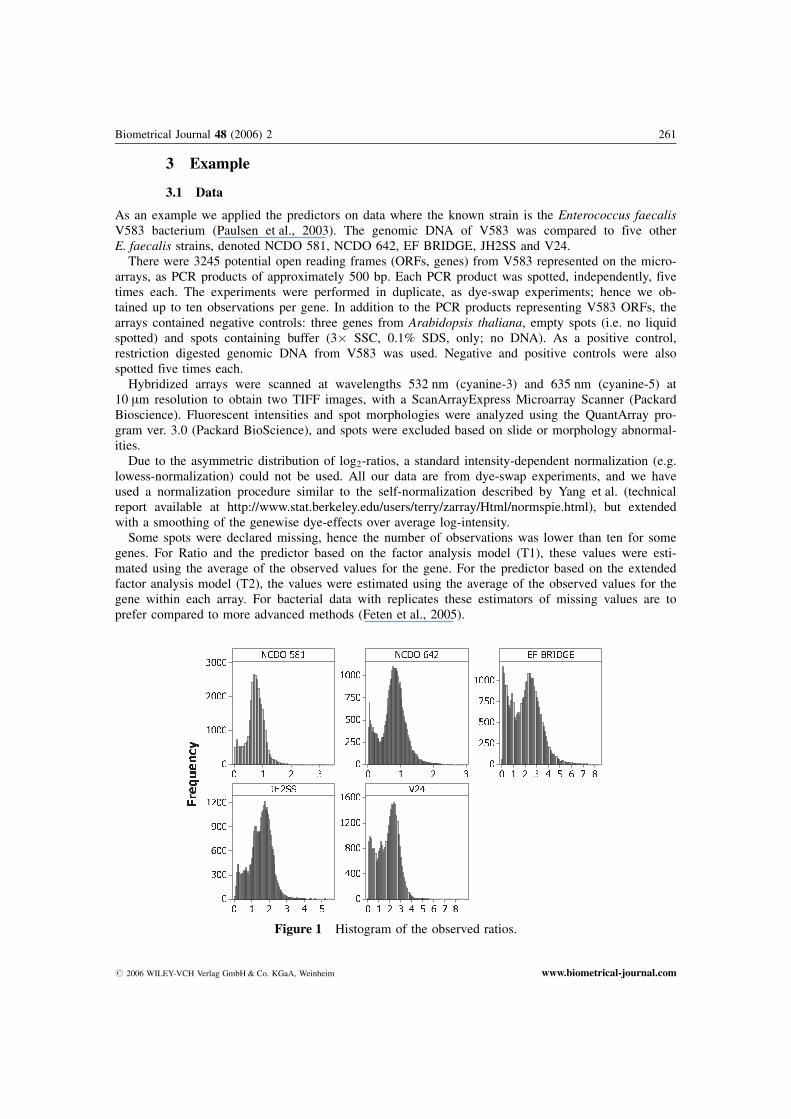
There were 3245 potential open reading frames (ORFs, genes) from V583 represented on the micro-arrays, as PCR products of approximately 500 bp. Each PCR product was spotted, independently, fivetimes each. The experiments were performed in duplicate, as dye-swap experiments; hence we ob-tained up to ten observations per gene. In addition to the PCR products representing V583 ORFs, thearrays contained negative controls: three genes from Arabidopsis thaliana, empty spots (i.e. no liquidspotted) and spots containing buffer (3� SSC, 0.1% SDS, only; no DNA). As a positive control,restriction digested genomic DNA from V583 was used. Negative and positive controls were alsospotted five times each.
Hybridized arrays were scanned at wavelengths 532 nm (cyanine-3) and 635 nm (cyanine-5) at10 mm resolution to obtain two TIFF images, with a ScanArrayExpress Microarray Scanner (PackardBioscience). Fluorescent intensities and spot morphologies were analyzed using the QuantArray pro-gram ver. 3.0 (Packard BioScience), and spots were excluded based on slide or morphology abnormal-ities.
Due to the asymmetric distribution of log2-ratios, a standard intensity-dependent normalization (e.g.lowess-normalization) could not be used. All our data are from dye-swap experiments, and we haveused a normalization procedure similar to the self-normalization described by Yang et al. (technicalreport available at http://www.stat.berkeley.edu/users/terry/zarray/Html/normspie.html), but extendedwith a smoothing of the genewise dye-effects over average log-intensity.
Some spots were declared missing, hence the number of observations was lower than ten for somegenes. For Ratio and the predictor based on the factor analysis model (T1), these values were esti-mated using the average of the observed values for the gene. For the predictor based on the extendedfactor analysis model (T2), the values were estimated using the average of the observed values for thegene within each array. For bacterial data with replicates these estimators of missing values are toprefer compared to more advanced methods (Feten et al., 2005).
Biometrical Journal 48 (2006) 2 261
Figure 1 Histogram of the observed ratios.
# 2006 WILEY-VCH Verlag GmbH & Co. KGaA, Weinheim www.biometrical-journal.com
Restriction enzyme digestion of genomic DNA was performed using the restriction endonucleaseRsaI. The recognition sequence of RsaI is GT#AC/CA"TG. Digestion of a completely random DNAsequence with RsaI would generate fragments of 44 bp = 256 bp. The actual average fragment lengthobtained by RsaI digestion of V583 genomic DNA was 402 bp (http://www.tigr.org/tigr-scripts/CMR2/restrict display.pl). It was assumed that a similar average fragment size would be obtained by diges-tion of genomic DNA from other strains within the E. faecalis species.
Figure 1 shows histograms of the observed ratios. Notice that strain EF BRIDGE and strain V24have some relatively large observed ratios.
In Table 2 the total averages for each array, the variances between the genes for each array, and theratios between the corresponding largest and smallest variance are given. The strains with some largeobserved ratios (EF BRIDGE and V24) have large average for each array. The variances for the arraysare approximately equal for strain EF BRIDGE and V24, while for strain NCDO 581 the variance forone of the arrays is approximately twice as large as for the other array.
3.2 Results
Table 3 shows the number of genes predicted as divergent for the different strains using the differentpredictors. For strains EF BRIDGE and V24 Ratio predicted more genes as divergent than L and T1,while for strains NCDO 581 and JH2SS the results were opposite. For strain NCDO 642 the numberof genes predicted as divergent were approximately equal for these three predictors. Notice that T1and L predicted approximately the same number of genes as divergent. For all the strains, and espe-cially for NCDO 581, but except V24, there was a large difference between the number of genespredicted as divergent by T2 and T1. The strains NCDO 581 and V24 were the strains with the largestand smallest effect of array. The last column in the table shows the total number of genes predicted asdivergent by all predictors.
Table 4 shows the number of genes predicted as equally present (cc ¼ 1) for each strain. The differ-ence between Ratio and the regression predictors was relatively large for all strains, especially forstrain EF BRIDGE. For four of the strains, strain NCDO 581, EF BRIDGE, JH2SS, and V24, there
262 G. Feten et al.: Prediction of gene copy number
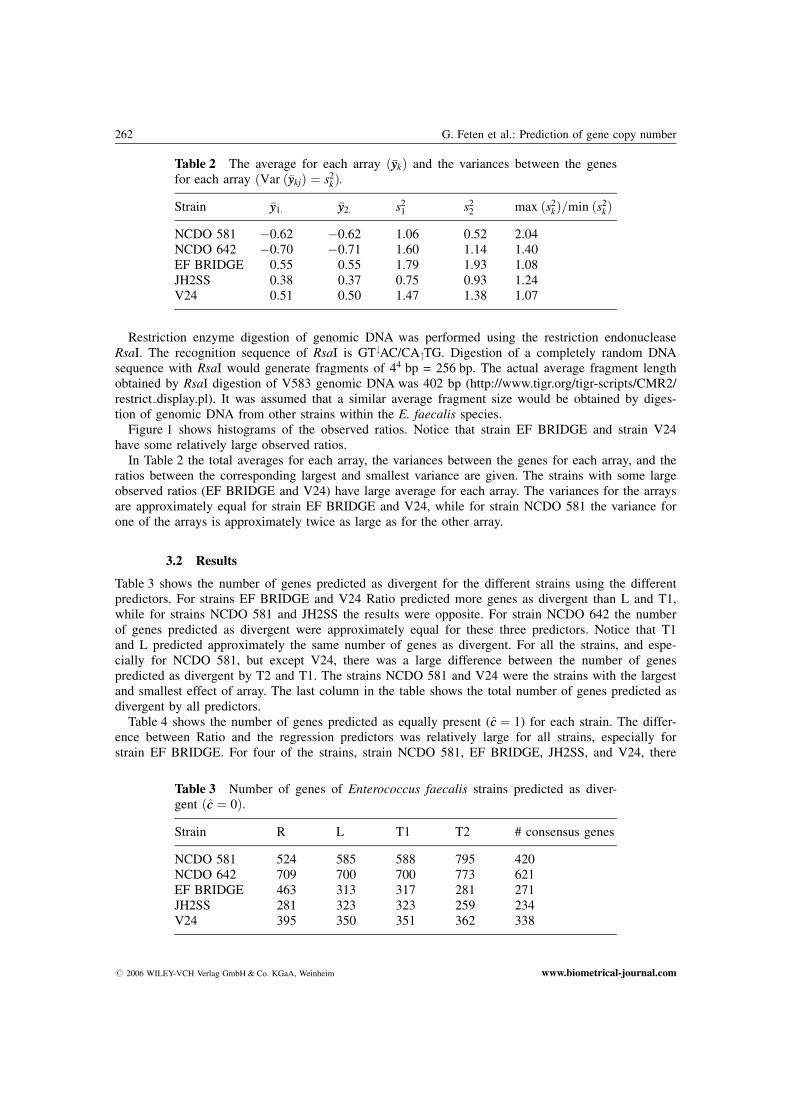
Table 2 The average for each array ð�yykÞ and the variances between the genesfor each array ðVar ð�yykjÞ ¼ s2
kÞ.
Strain �yy1: �yy2: s21 s2
2 max ðs2kÞ=min ðs2
kÞ
NCDO 581 �0.62 �0.62 1.06 0.52 2.04NCDO 642 �0.70 �0.71 1.60 1.14 1.40EF BRIDGE 0.55 0.55 1.79 1.93 1.08JH2SS 0.38 0.37 0.75 0.93 1.24V24 0.51 0.50 1.47 1.38 1.07
Table 3 Number of genes of Enterococcus faecalis strains predicted as diver-gent ðcc ¼ 0Þ.
Strain R L T1 T2 # consensus genes
NCDO 581 524 585 588 795 420NCDO 642 709 700 700 773 621EF BRIDGE 463 313 317 281 271JH2SS 281 323 323 259 234V24 395 350 351 362 338
# 2006 WILEY-VCH Verlag GmbH & Co. KGaA, Weinheim www.biometrical-journal.com
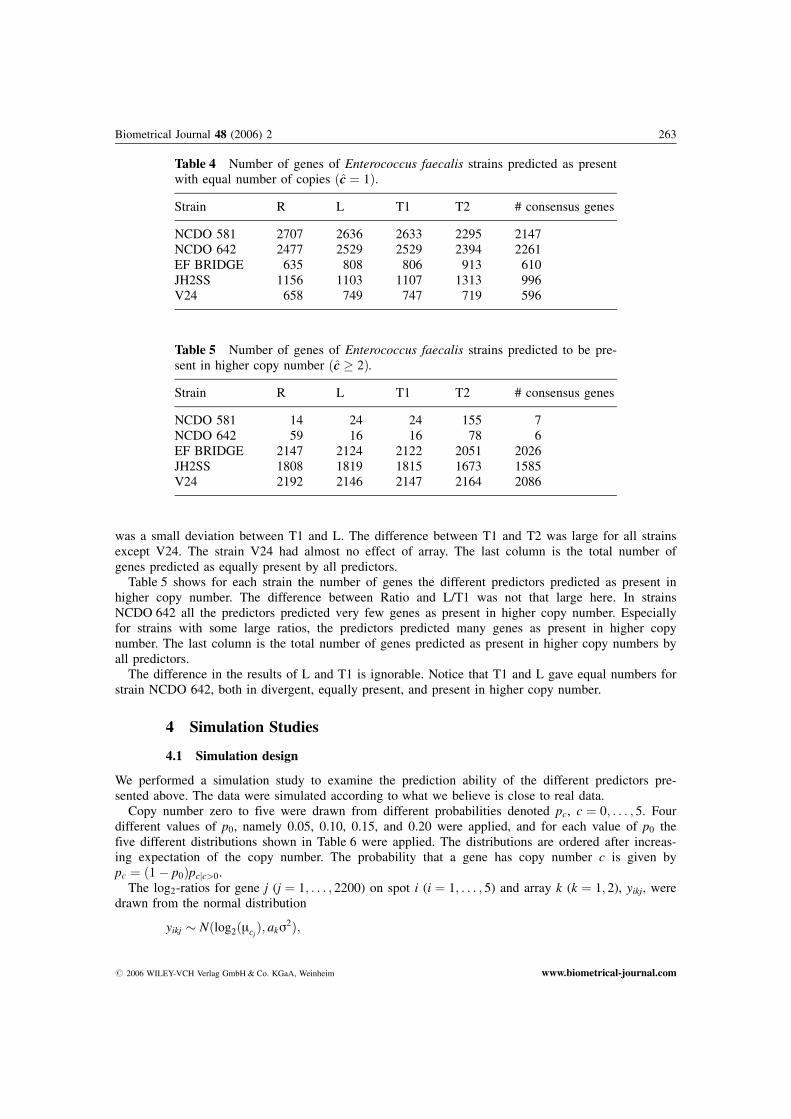
was a small deviation between T1 and L. The difference between T1 and T2 was large for all strainsexcept V24. The strain V24 had almost no effect of array. The last column is the total number ofgenes predicted as equally present by all predictors.
Table 5 shows for each strain the number of genes the different predictors predicted as present inhigher copy number. The difference between Ratio and L/T1 was not that large here. In strainsNCDO 642 all the predictors predicted very few genes as present in higher copy number. Especiallyfor strains with some large ratios, the predictors predicted many genes as present in higher copynumber. The last column is the total number of genes predicted as present in higher copy numbers byall predictors.
The difference in the results of L and T1 is ignorable. Notice that T1 and L gave equal numbers forstrain NCDO 642, both in divergent, equally present, and present in higher copy number.
4 Simulation Studies
4.1 Simulation design
We performed a simulation study to examine the prediction ability of the different predictors pre-sented above. The data were simulated according to what we believe is close to real data.
Copy number zero to five were drawn from different probabilities denoted pc, c ¼ 0; . . . ; 5. Fourdifferent values of p0, namely 0.05, 0.10, 0.15, and 0.20 were applied, and for each value of p0 thefive different distributions shown in Table 6 were applied. The distributions are ordered after increas-ing expectation of the copy number. The probability that a gene has copy number c is given bypc ¼ ð1� p0Þpcjc>0.
The log2-ratios for gene j (j ¼ 1; . . . ; 2200) on spot i (i ¼ 1; . . . ; 5) and array k (k ¼ 1; 2), yikj, weredrawn from the normal distribution
yikj � Nðlog2ðmcjÞ; aks2Þ;
Biometrical Journal 48 (2006) 2 263
Table 4 Number of genes of Enterococcus faecalis strains predicted as presentwith equal number of copies ðcc ¼ 1Þ.
Strain R L T1 T2 # consensus genes
NCDO 581 2707 2636 2633 2295 2147NCDO 642 2477 2529 2529 2394 2261EF BRIDGE 635 808 806 913 610JH2SS 1156 1103 1107 1313 996V24 658 749 747 719 596
Table 5 Number of genes of Enterococcus faecalis strains predicted to be pre-sent in higher copy number ðcc � 2Þ.
Strain R L T1 T2 # consensus genes
NCDO 581 14 24 24 155 7NCDO 642 59 16 16 78 6EF BRIDGE 2147 2124 2122 2051 2026JH2SS 1808 1819 1815 1673 1585V24 2192 2146 2147 2164 2086
# 2006 WILEY-VCH Verlag GmbH & Co. KGaA, Weinheim www.biometrical-journal.com
where a1 was equal to one, and the values of a2 were 1 and 1/6, the values of s were 0.25, 0.50, 0.75,and 1.00, and where mcj
was drawn from the gamma distribution
mcj� Ga
c2j
t2;t2
cj
!:
Hence EðmcjÞ ¼ cj and Var ðmcj
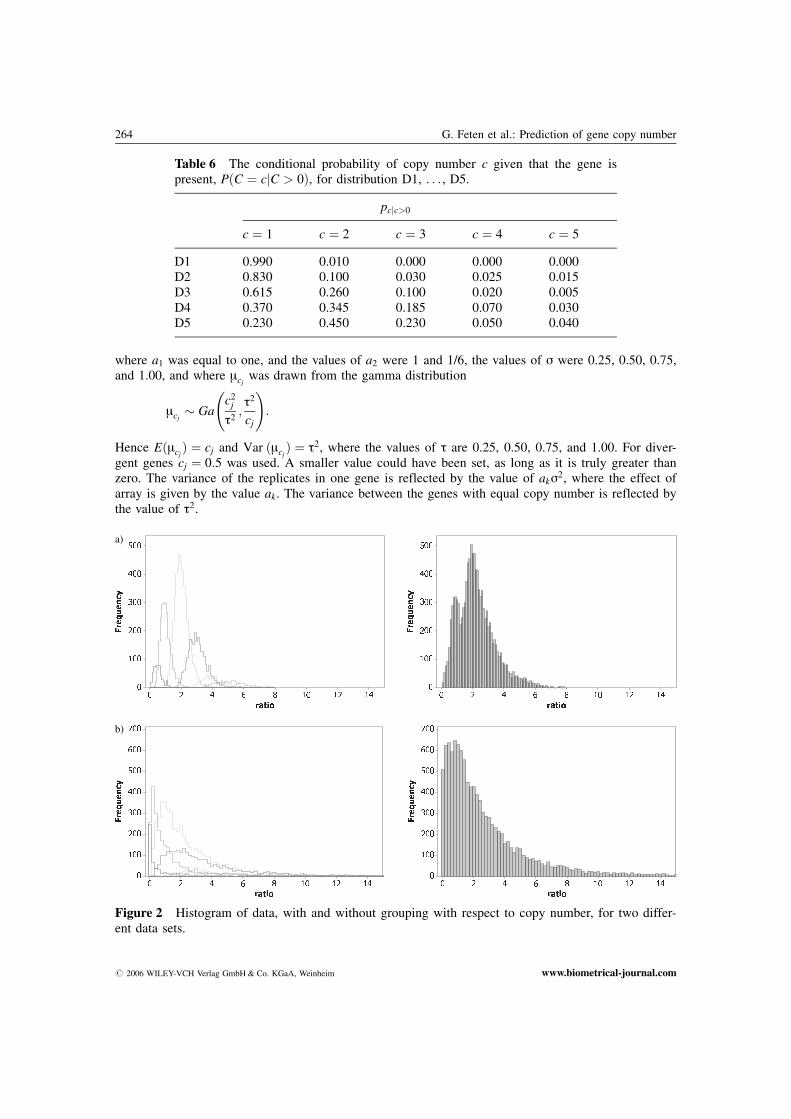
Þ ¼ t2, where the values of t are 0.25, 0.50, 0.75, and 1.00. For diver-gent genes cj ¼ 0:5 was used. A smaller value could have been set, as long as it is truly greater thanzero. The variance of the replicates in one gene is reflected by the value of aks2, where the effect ofarray is given by the value ak. The variance between the genes with equal copy number is reflected bythe value of t2.
264 G. Feten et al.: Prediction of gene copy number
Table 6 The conditional probability of copy number c given that the gene ispresent, PðC ¼ cjC > 0Þ, for distribution D1, . . . , D5.
pcjc>0
c ¼ 1 c ¼ 2 c ¼ 3 c ¼ 4 c ¼ 5
D1 0.990 0.010 0.000 0.000 0.000D2 0.830 0.100 0.030 0.025 0.015D3 0.615 0.260 0.100 0.020 0.005D4 0.370 0.345 0.185 0.070 0.030D5 0.230 0.450 0.230 0.050 0.040
a)
Figure 2 Histogram of data, with and without grouping with respect to copy number, for two differ-ent data sets.
b)
# 2006 WILEY-VCH Verlag GmbH & Co. KGaA, Weinheim www.biometrical-journal.com
The choice of mcjas a random parameter is due to the fact that there may exist some discrepancy
between the observations and the underlying copy number. Imagine all replicates for one gene haveratios from 1.08 to 1.12, and another gene has replicates from 0.88 to 0.92. In both cases we willprobably say that the underlying copy number is one, with a clear discrepancy between the copynumber and the observations.
Figure 2 shows histograms of ratios, with and without grouping with respect to copy number, fortwo different data sets. Both data sets are simulated with p0 ¼ 0:05 and pcjc>0 ¼ ½0:230, 0:450, 0:230,0:050, 0:040�. Data in Figure 2a are generated from a distribution with ak ¼ 1, s ¼ 0:25, andt ¼ 0:25, while data in Figure 2b are generated from a distribution with ak ¼ 1, s ¼ 1:00, andt ¼ 1:00. Notice that in the latter situation it is hard to separate the different groups from each other,and prediction of copy numbers is more difficult.
Studying the histograms of the simulated data (Figure 2) together with the histograms of the ob-served data (Figure 1) we see that the data are well comparable.
4.2 Results
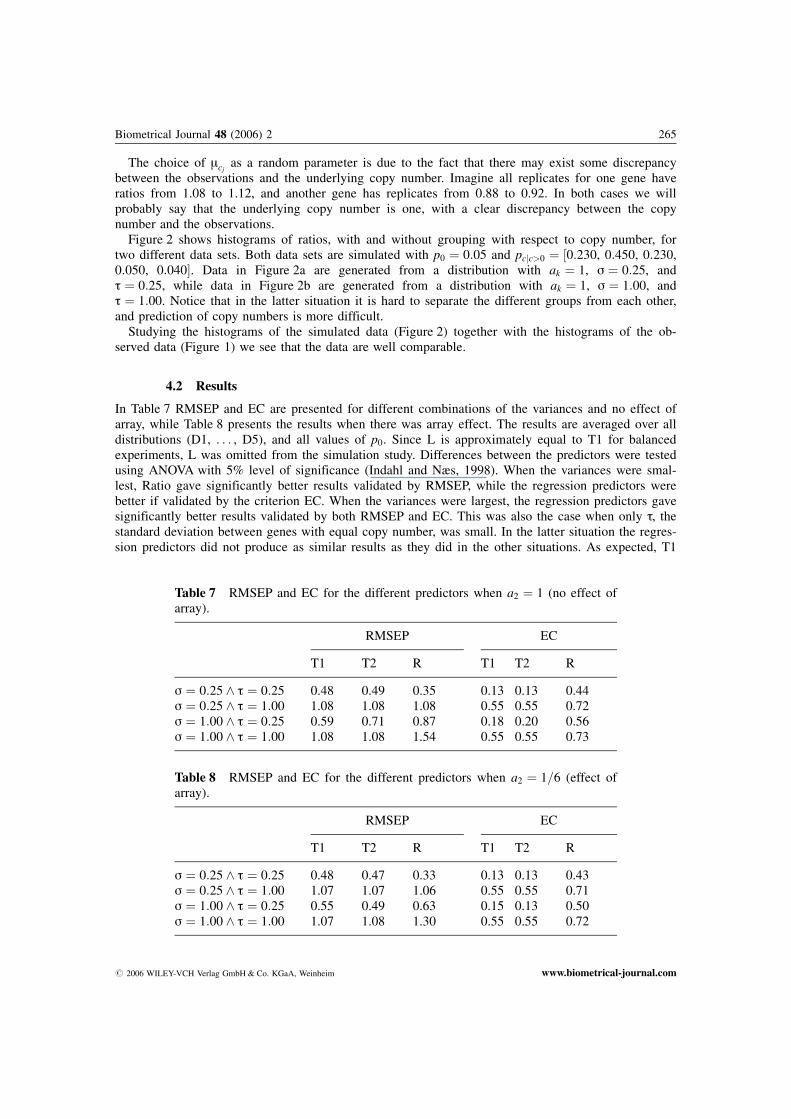
In Table 7 RMSEP and EC are presented for different combinations of the variances and no effect ofarray, while Table 8 presents the results when there was array effect. The results are averaged over alldistributions (D1, . . . , D5), and all values of p0. Since L is approximately equal to T1 for balancedexperiments, L was omitted from the simulation study. Differences between the predictors were testedusing ANOVA with 5% level of significance (Indahl and Næs, 1998). When the variances were smal-lest, Ratio gave significantly better results validated by RMSEP, while the regression predictors werebetter if validated by the criterion EC. When the variances were largest, the regression predictors gavesignificantly better results validated by both RMSEP and EC. This was also the case when only t, thestandard deviation between genes with equal copy number, was small. In the latter situation the regres-sion predictors did not produce as similar results as they did in the other situations. As expected, T1
Biometrical Journal 48 (2006) 2 265
Table 7 RMSEP and EC for the different predictors when a2 ¼ 1 (no effect ofarray).
RMSEP EC
T1 T2 R T1 T2 R
s ¼ 0:25 ^ t ¼ 0:25 0.48 0.49 0.35 0.13 0.13 0.44s ¼ 0:25 ^ t ¼ 1:00 1.08 1.08 1.08 0.55 0.55 0.72s ¼ 1:00 ^ t ¼ 0:25 0.59 0.71 0.87 0.18 0.20 0.56s ¼ 1:00 ^ t ¼ 1:00 1.08 1.08 1.54 0.55 0.55 0.73
Table 8 RMSEP and EC for the different predictors when a2 ¼ 1=6 (effect ofarray).
RMSEP EC
T1 T2 R T1 T2 R
s ¼ 0:25 ^ t ¼ 0:25 0.48 0.47 0.33 0.13 0.13 0.43s ¼ 0:25 ^ t ¼ 1:00 1.07 1.07 1.06 0.55 0.55 0.71s ¼ 1:00 ^ t ¼ 0:25 0.55 0.49 0.63 0.15 0.13 0.50s ¼ 1:00 ^ t ¼ 1:00 1.07 1.08 1.30 0.55 0.55 0.72
# 2006 WILEY-VCH Verlag GmbH & Co. KGaA, Weinheim www.biometrical-journal.com
266 G. Feten et al.: Prediction of gene copy number
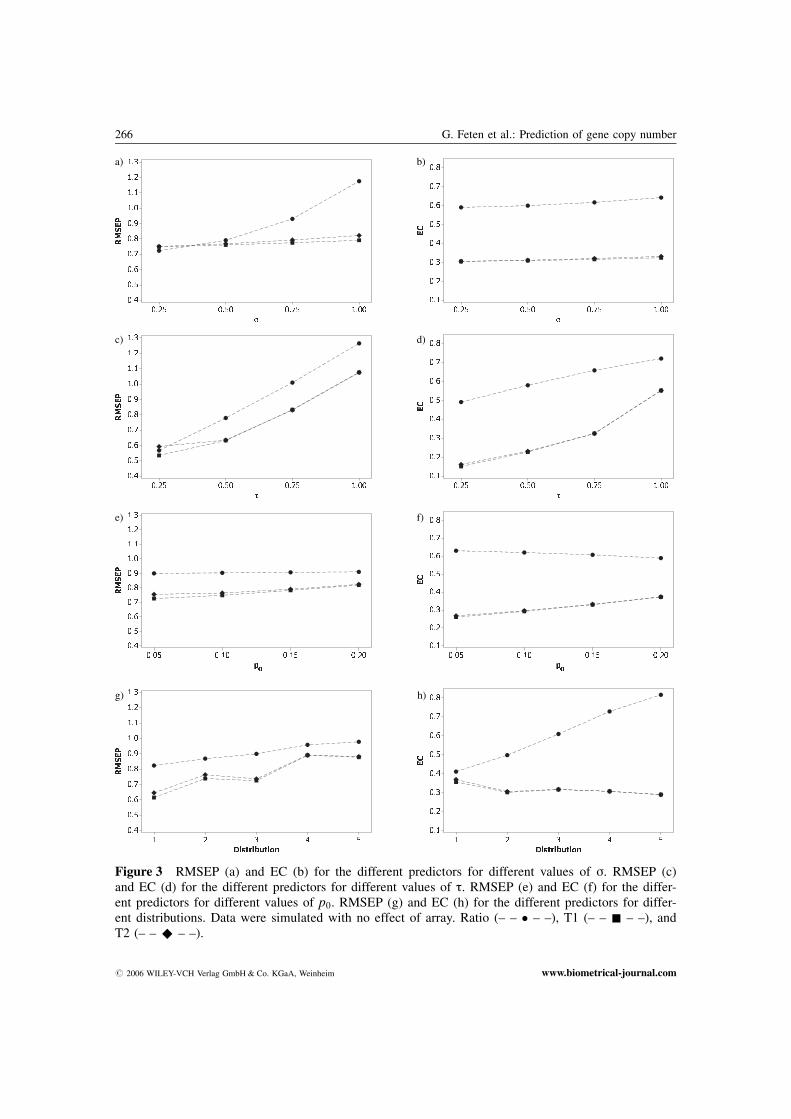
Figure 3 RMSEP (a) and EC (b) for the different predictors for different values of s. RMSEP (c)and EC (d) for the different predictors for different values of t. RMSEP (e) and EC (f) for the differ-ent predictors for different values of p0. RMSEP (g) and EC (h) for the different predictors for differ-ent distributions. Data were simulated with no effect of array. Ratio (– – � – –), T1 (– – & – –), andT2 (– – ^ – –).
a) b)
c) d)
e) f)
g) h)
# 2006 WILEY-VCH Verlag GmbH & Co. KGaA, Weinheim www.biometrical-journal.com
Biometrical Journal 48 (2006) 2 267
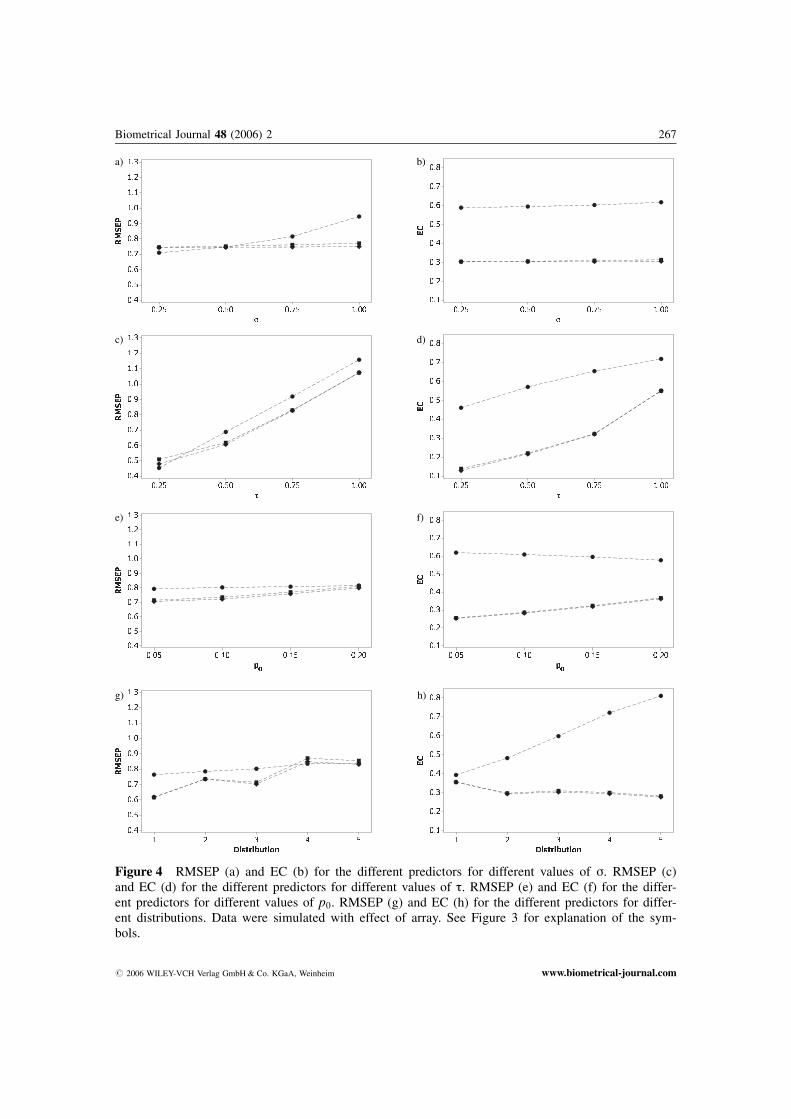
Figure 4 RMSEP (a) and EC (b) for the different predictors for different values of s. RMSEP (c)and EC (d) for the different predictors for different values of t. RMSEP (e) and EC (f) for the differ-ent predictors for different values of p0. RMSEP (g) and EC (h) for the different predictors for differ-ent distributions. Data were simulated with effect of array. See Figure 3 for explanation of the sym-bols.
a) b)
c) d)
e) f)
g) h)
# 2006 WILEY-VCH Verlag GmbH & Co. KGaA, Weinheim www.biometrical-journal.com
seemed to be better than T2 when there was no effect of array, while T2 was better than T1 (signifi-cantly better when validated by RMSEP) when there was effect of array. In these situations the var-iance of the log2-ratios was large for genes with equal copy number, but the conditional distributionwas symmetrical. When only s, the standard deviation for each gene, was small, the regression predic-tors gave significantly better results validated by EC, but not by RMSEP. The regression predictorsshowed a great improvement compared to random classification, even when the data were noisy. (Forrandom classification EC equals 0.67.) On the contrary, Ratio did not improve compared to randomclassification in situations where the variance was large (and skewed) between genes with equal copynumber.
How RMSEP depended on s and t is shown in Figures 3a and 3c without array effect and inFigures 4a and 4c with array effect. The results are averaged over all distributions (D1, . . . , D5), andall values of p0. Ratio was a significantly better predictor than the regression predictors for smallvalues of s. When there was no effect of array and s increased (�0:50), T2, and especially T1, gavesignificantly better results than Ratio. For larger values of s (�0:75) and with array effect included,all the predictors were significantly different, with T2 as the superior. For small values of t all thepredictors were significantly different, with both T1 and T2 better than Ratio. As expected, T1 wasthe superior when there was no array effect, while T2 was the superior when there was effect of array.The difference between the regression predictors increased for increasing values of s, while it de-creased for increasing values of t.
Figures 3b and 3d show how EC altered with different values of s and t when there was no effectof array. Figures 4b and 4d show the corresponding figures with effect of array. The regression predic-tors were significantly better than Ratio for all values of both s and t.
The dependence of RMSEP and EC on p0, without array effect, is shown in Figures 3e and 3f, andwith effect of array in Figures 4e and 4f. The results are averaged over all distributions (D1, . . ., D5),and all values of s and t. In the case of no array effect the predictors were ranked equally for allvalues of p0, but with the regression predictors significantly better than Ratio. When the predictorswere validated by RMSEP, T1 was significantly better than T2 for p0 equal to 0.05 and 0.10. Whenthere was an array effect, the predictors were equally ranked by RMSEP and EC, with equal rankingfor all values of p0. The regression predictors were significantly better than Ratio when evaluated byEC. Evaluated by RMSEP, T2 was significantly better than T1 for p0 equal to 0.10 and 0.15, while forp0 equal to 0.20, only T2 was significantly better than Ratio.
Figures 3g and 3h show RMSEP and EC for the different distributions introduced in Table 6 whenthere was no effect of array, while Figures 4g and 4h are with effect of array. The results are averagedover all values of p0, s, and t. For all distributions and no effect of array the regression predictorsgave significantly better results than Ratio with respect to both RMSEP and EC. With array effect, theregression predictors gave significantly better results than Ratio with respect to both RMSEP and ECfor all distributions except D4 and D5. For distribution D4, Ratio was significantly better than T2,while T2 was significantly better than T1. For distribution D5 Ratio and T2 were significantly betterthan T1. The regression predictors gave significantly better results than Ratio for the two latter distri-butions when validated by EC.
5 Discussion and Conclusion
5.1 Discussion
Predictors based on factor analysis models and linear random models can be used to test for genomicsimilarities between two strains in comparative genomic hybridization analyses. Making use of thesemodels (among others), we have studied the ability of four predictors to predict the copy number ofgenes.
The predictors based on linear models achieved better prediction than Ratio in almost all situations.When there was differences between the arrays, either in the mean level of the ratios, or in the var-
268 G. Feten et al.: Prediction of gene copy number
# 2006 WILEY-VCH Verlag GmbH & Co. KGaA, Weinheim www.biometrical-journal.com
iance between genes, the results differ between the predictor that takes this information into accountand the other predictors.
The predictors, and especially Ratio, do not have the quality to adjust for systematic deviationsfrom symmetrical distributed intensities. When the variance of the mean of genes with equal copynumber increases, the distributions of the intensities get skewed, and the predictors fail to divide thegenes into groups of correct copy number.
Since the ratios cannot be negative, all observed ratios for divergent genes have to be greater thanor equal to zero, and the assumption about a linear relationship between the copy number and theobserved ratio is not true for small copy numbers. Due to this, the intercept is overestimated and theslope is underestimated, and the regression predictors predict larger copy numbers too small. On thecontrary, this involves that Ratio predicts the copy numbers too high.
As an attempt to improve the prediction ability by the linear models, we could divide the genes intotwo groups, divergent and present. Then the divergent genes are removed, and a linear model may befitted to the group of present genes. Hopefully this will improve the estimation of the intercept andthe slope. For higher copy numbers the linear models are probably an advantage, few genes with highcopy number make other methods (e.g. methods based on mixture models) less suited.
Another attempt to improve the prediction ability is the use of mixture models, either on the origi-nal log2-ratio or on the predicted copy numbers on the continuous scale. This might improve thetransformation from continuous to discrete copy numbers, but the mixture models also handles thefact that the mode of the graphs not necessarily corresponds to an integer. Another feature of mixturemodels is the assignment of a posterior probability for each gene belonging to each class (copy num-ber). However, the predicted values of the copy numbers on the continuous scale also contain informa-tion about the uncertainty of the predicted copy numbers. As an example a gene with value 2.1 ismore likely to have copy number two than a gene with the value 2.4.
In this paper all the model fits are made on the log2-ratios instead of the ratios, for the purpose ofan approximation to the normal distributions. The models could be fitted using ratio to keep theinteger of the copy number, but this will obscure the normality of the data. Methods for model ade-quacy checking and outlier detection known from analysis of variance and regression analysis couldbe used to identify replicates that should be considered omitted from the analysis (Montgomery,1997).
We assumed all genes in the known strain to be in one copy, hence we assumed the true ratio(unknown/known) to be an integer. If this ratio is not an integer, the copy number of the known straincould be modelled as known, and the copy number of the unknown strain could be modelled directly.
Apart from studying both the root mean square error of prediction and the error of classification,we have not discussed the cost of predicting incorrectly. In some situations it may be more serious topredict e.g. a gene as present when it is truly divergent, or vice versa, and the methods should takethis into consideration.
5.2 Conclusion
The simulation study showed that predictors based on factor analysis models and linear random mod-els could be used to predict the copy number of a gene. These predictors achieved better results thanusing the ratio when the data were noisy. If there are effect of array in the data, either in the expectedlevel of the ratios, or in the variance between genes, the predictor based on the factor model thatmodels different expectation and different variance should be applied. If there are no effect of arraythe predictor based on the linear random model, or the predictor based on the factor analysis modelwith common mean and variance are to prefer, dependent on whether the experiment is balanced ornot.
Acknowledgements We would like to thank two anonymous referees for constructive criticism. This work hasbeen financed by the Norwegian University of Life Sciences.
Biometrical Journal 48 (2006) 2 269
# 2006 WILEY-VCH Verlag GmbH & Co. KGaA, Weinheim www.biometrical-journal.com

References
Autio, R., Hautaniemi, S., Kauraniemi, P., Yli-Harja, O., Astola, J., Wolf, M., and Kallioniemi, A. (2003). CGH-Plotter: MATLAB toolbox for CGH-data analysis. Bioinformatics 19, 1714–1715.
Behr, M. A., Wilson, M. A., Gill, W. P., Salamon, H., Schoolnik, G. K., Rane, S., and Small, P. M. (1999).Comparative genomics of BCG vaccines by whole-genome DNA microarray. Science 284, 1520–1523.
Bickel, P. J. and Doksum, K. A. (1977). Mathematical Statistics: Basic Ideas and Selected Topics. Prentice-Hall,New Jersey.
Bj�rkholm, B., Lundin, A., Sill�n, A., Guillemin, K., Salama, N., Rubio, C., Gordon, J. I., Falk, P., and Eng-strand, L. (2001). Comparison of genetic divergence and fitness between two subclones of Helicobacterpylori. Infection and Immunity 69, 7832–7838.
Brown, P. J. (1993). Measurement, Regression, and Calibration. Oxford University Press.Feten, G., Alm�y, T., and Aastveit, A. H. (2005). Prediction of missing values in microarray and use of mixed
models to evaluate the predictors. Statistical Applications in Genetics and Molecular Biology 4 No. 1, Arti-cle 10. http://www.bepress.com/sagmb/vol4/iss1/art10
Fridlyand, J., Snijders, A. M., Pinkel, D., Albertson, D. G., and Jain, A. N. (2004). Hidden Markov modelsapproach to the analysis of array CGH data. Journal of Multivariate Analysis 90, 132–153.
Indahl, U. G., and Næs, T. (1998). Evaluation of alternative spectral feature extraction methods of textural imagesfor multivariate modeling. Journal of Chemometrics 12, 261–278.
Kim, C. C., Joyce, E. A., Chan, K., and Falkow, S. (2002). Improved analytical methods for microarray-basedgenome-composition analysis. Genome Biology 3, research0065.1–0065.17.
Lawley, D. N. and Maxwell, A. E. (1973). Regression and factor-analysis. Biometrika 60, 331–338.Mantripragada, K. K., Buckley, P. G., de St�hl, T. D., and Dumanski, J. P. (2004). Genomic microarrays in the
spotlight. Trends in Genetics 20, 87–94.Mardia, K. V., Kent, J. T., and Bibby, J. M. (1979). Multivariate Analysis. Academic Press, London.Montgomery, D. C. (1997). Design and Analysis of Experiments. John Wiley Sons.Nguyen, D. V., Arpat, A. B., Wang, N. Y., and Carroll, R. J. (2002). DNA Microarray Experiments: Biological
and Technological Aspects. Biometrics 58, 701–717.Paulsen, I. T., Banerjei, L., Myers, G. S. A., Nelson, K. E, Seshadri, R., Read, T. D., Fouts, D. E., Eisen, J. A.,
Gill, S. R., Heidelberg, J. F., Tettelin, H., Dodson, R.J., Umayam, L., Brinkac, L., Beanan, M., Daugherty, S.,DeBoy, R. T., Durkin, S., Kolonay, J., Madupu, R., Nelson, W., Vamathevan, J., Tran, B., Upton, J., Han-sen, T., Shetty, J., Khouri, H., Utterback, T., Radune, D., Ketchum, K. A., Dougherty, B. A., and Fraser,C. M. (2003). Role of mobile DNA in the evolution of vancomycin-resistant Enterococcus faecalis. Science299, 2071–2074.
Pushker, R., Mira, A., and Rodr�guez-Valera, F. (2004). Comparative genomics of gene-family size in closelyrelated bacteria. Genome Biology 5, R27.
Sassetti, C. and Rubin, E. J. (2002). Genomic analyses of microbial virulence. Current Opinion in Microbiology5, 27–32.
Searle, S. R. (1987). Linear Models for Unbalanced Data. John Wiley Sons.Wang, Y. D. and Guo, S. W. (2004). Statistical methods for detecting genomic alterations through array-based
comparative genomic hybridization (CGH). Frontiers in Bioscience 9, 540–549.
270 G. Feten et al.: Prediction of gene copy number
# 2006 WILEY-VCH Verlag GmbH & Co. KGaA, Weinheim www.biometrical-journal.com
Related Documents