Welcome message from author
This document is posted to help you gain knowledge. Please leave a comment to let me know what you think about it! Share it to your friends and learn new things together.
Transcript

Region 20 AVATARRegional Local Data

AEIS Data from TEA, 2010-2011 Harlandale H.S. Student Body
Students Number
1,920
Grade 9 574
Grade 10 505
Grade 11 454
Grade 12 387
Graduating class 380
% Minimum Curriculum
13.7
% Recommended Curriculum
86.3
*State Comparison:Minimum 17.3%Recommended 82.7%

AEIS Data from TEA, 2010-2011McCollum H.S. Student Body
Students Number
1,690
Grade 9 512
Grade 10 439
Grade 11 396
Grade 12 343
Graduating class 361
% Minimum Curriculum
12.5
%Recommended Curriculum
87.5
*State Comparison:Minimum 17.3%Recommended 82.7%

AEIS Data from TEA, 2010-2011Harlandale H.S.
Ethnicity of Student Body in Percentages
Ethnic Distribution Percentage
African American 0.6
Hispanic 97.9
White 1.3
American Indian 0.0
Asian 0.1
Pacific Islander 0.0
Two or More Races 0.1

AEIS Data from TEA, 2010-2011McCollum H.S.
Ethnicity of Student Body in Percentages
Ethnic Distribution Percentage
African American 0.5
Hispanic 94.9
White 4.3
American Indian 0.0
Asian 0.1
Pacific Islander 0.0
Two or More Races 0.2
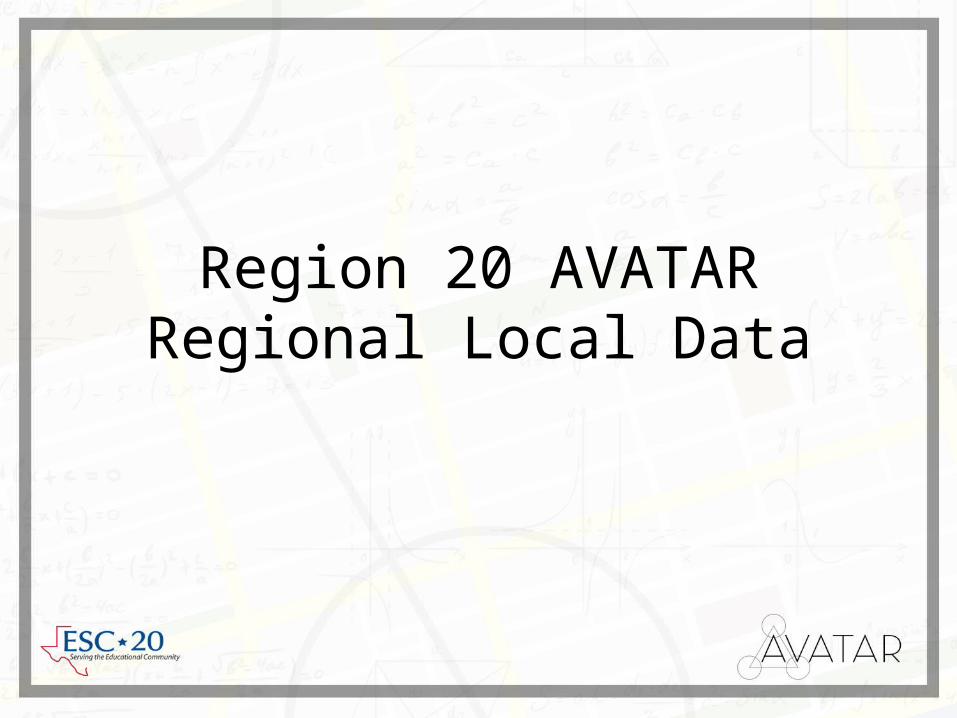
AEIS Data from TEA, 2010-2011Harlandale H.S.
Other Descriptors of Student Body in Percentages
Demographic Student Information Percentage
Economically Disadvantaged 83.6
Limited English Proficient (LEP) 5.3
Students w/Disciplinary Placements(2009-10)
2.3
*At-Risk 63.4
Mobility (2009-10)
16.1
Number of Students per Teacher n/a
*At Risk of dropping out of school based on performance and status indicators listed in the AEIS glossary.

AEIS Data from TEA, 2010-2011McCollum H.S.
Other Descriptors of Student Body in Percentages
Demographic Student Information Percentage
Economically Disadvantaged 78.3
Limited English Proficient (LEP) 2.8
Students w/Disciplinary Placements(2009-10)
3.7
*At-Risk 60.0
Mobility (2009-10)
22.2
Number of Students per Teacher n/a
*At Risk of dropping out of school based on performance and status indicators listed in the AEIS glossary.

AEIS Data from TEA, 2010-2011% Enrolled in Advanced Placement Dual Credit
Harlandale HS
Year All African American
Hispanic White American Indian
Asian Pacific Islander
Two or more Races
2009-2010 22.6 30.0 22.4 37.5 - * - *
2008-2009 20.5 8.3 20.4 31.0 - n/a n/a n/a

Year All African American
Hispanic White American Indian
Asian Pacific Islander
Two or more Races
2009-2010 20.7 * 20.8 17.3 * * - *
2008-2009 14.2 33.3 13.6 20.2 * n/a n/a n/a
AEIS Data from TEA, 2010-2011% Enrolled in Advanced Placement Dual Credit
McCollum HS
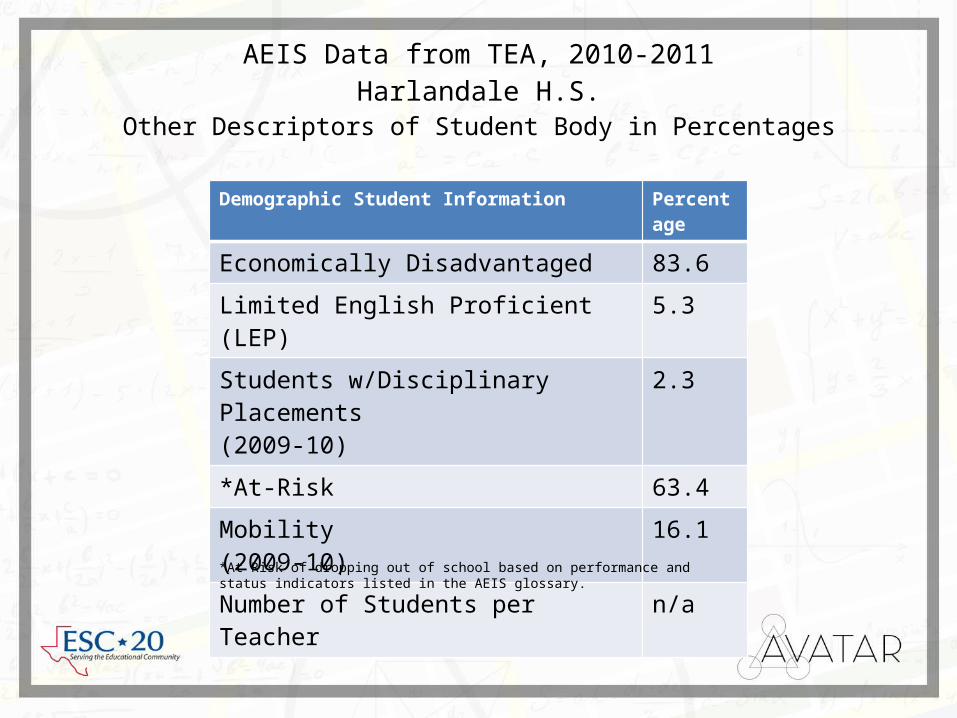
AEIS Data from TEA, 2010-2011AP/IB Percentages Tests and Examinees who Met Criteria
Harlandale HS
Year All African American
Hispanic White American Indian
Asian Pacific Islander
Two or more Races
2009-2010 10.3 - 10.6 * - - - -
2008-2009 6.1 * 6.4 0.0 n/a n/a n/a n/a
Year All African American
Hispanic White American Indian
Asian Pacific Islander
Two or more Races
2009-2010 22.0 * 21.9 40.0 - * - *
2008-2009 21.6 20.0 21.3 45.5 - n/a n/a n/a
AP/IB Percentage Tested
AP/IB Percent Examinees Met or Exceeded Criteria

AEIS Data from TEA, 2010-2011AP/IB Percentages Tests and Examinees who Met Criteria
McCollum HS
Year All African American
Hispanic White American Indian
Asian Pacific Islander
Two or more Races
2009-2010 6.4 - 6.9 0.0 * - - *
2008-2009 7.6 * 8.4 0.0 * n/a n/a n/a
Year All African American
Hispanic White American Indian
Asian Pacific Islander
Two or more Races
2009-2010 17.4 - 16.7 24.0 * - - *
2008-2009 18.4 * 17.9 25.0 * n/a n/a n/a
AP/IB Percentage Tested
AP/IB Percent Examinees Met or Exceeded Criteria

AEIS Data from TEATexas Success Initiative - Harlandale HS
All African American
Hispanic White Amer.Indian
Asian Pacific Islander
Two or more Races
ELA 2011 72 * 73 * * * * *ELA 2010 58 * 58 >99 * * * *
All African American
Hispanic White Amer.Indian
Asian Pacific Islander
Two or more Races
Math 2011 70 * 70 * * * * *Math 2010 62 * 61 80 * * * *
English Language Arts, Percent Passing
Math, Percent Passing

AEIS Data from TEATexas Success Initiative - McCollum HS
All African American
Hispanic White Amer. Indian
Asian Pacific Islander
Two or more Races
ELA 2011 68 * 67 81 * * * *ELA 2010 60 * 61 50 * * * *
All African American
Hispanic White Amer. Indian
Asian Pacific Islander
Two or more Races
Math 2011 60 * 59 70 * * * *Math 2010 50 * 50 70 * * * *
English Language Arts, Percent Passing
Math, Percent Passing

AEIS Data from TEA College Ready Graduates
Harlandale HS
Subject All African American
Hispanic White American Indian
Asian Pacific Islander
Two or more Races
ELA 66 * 66 >99 * * * *Math 52 * 52 17 * * * *Both 42 * 43 17 * * * *
Class of 2010, Percentage

AEIS Data from TEA College Ready Graduates
McCollum HS
Subject All African American
Hispanic White American Indian
Asian Pacific Islander
Two or more Races
ELA 64 * 64 67 * * * *Math 44 * 43 57 * * * *Both 38 * 36 57 * * * *
Class of 2010, Percentage
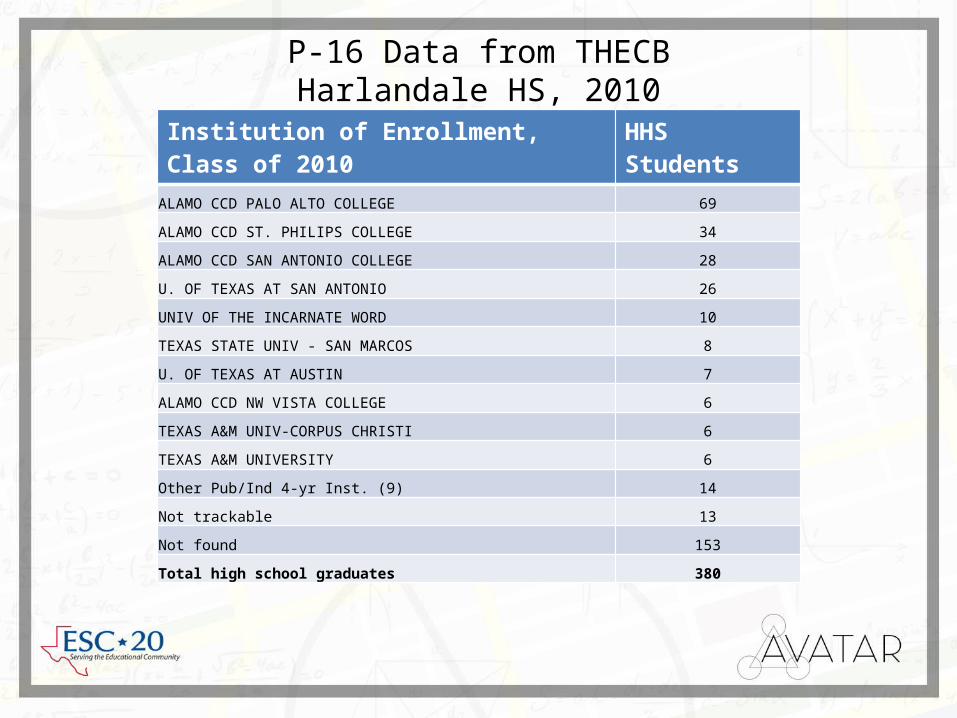
P-16 Data from THECBHarlandale HS, 2010
Institution of Enrollment, Class of 2010 HHSStudents
ALAMO CCD PALO ALTO COLLEGE 69
ALAMO CCD ST. PHILIPS COLLEGE 34
ALAMO CCD SAN ANTONIO COLLEGE 28
U. OF TEXAS AT SAN ANTONIO 26
UNIV OF THE INCARNATE WORD 10
TEXAS STATE UNIV - SAN MARCOS 8
U. OF TEXAS AT AUSTIN 7
ALAMO CCD NW VISTA COLLEGE 6
TEXAS A&M UNIV-CORPUS CHRISTI 6
TEXAS A&M UNIVERSITY 6
Other Pub/Ind 4-yr Inst. (9) 14
Not trackable 13
Not found 153
Total high school graduates 380

P-16 Data from THECBMcCollum HS, 2010
Institution of Enrollment, Class of 2010 MHSStudents
ALAMO CCD PALO ALTO COLLEGE 100
ALAMO CCD SAN ANTONIO COLLEGE 13
ALAMO CCD ST. PHILIPS COLLEGE 13
TEXAS A&M UNIVERSITY 9
U. OF TEXAS AT SAN ANTONIO 9
ST. MARY'S UNIVERSITY 7
UNIV OF THE INCARNATE WORD 7
TEXAS STATE UNIV - SAN MARCOS 5
Other Pub/Ind 4-yr Inst. (9) 18
Other Pub/Ind 2-yr Inst. (5) 7
Not trackable 11
Not found 151
Total high school graduates 350

P-16 Date from THECBPublic Education First Year Grades of High School Graduates In FY 2011
Harlandale HS
IHE Type Total Graduates
<2.0 2.0-2.49 2.5-2.99 3.0-3.49 >3.5 Unk
Four-Year Public University 39 13 8 10 7 0 1
Two-Year Public Colleges 171 61 29 14 24 12 31
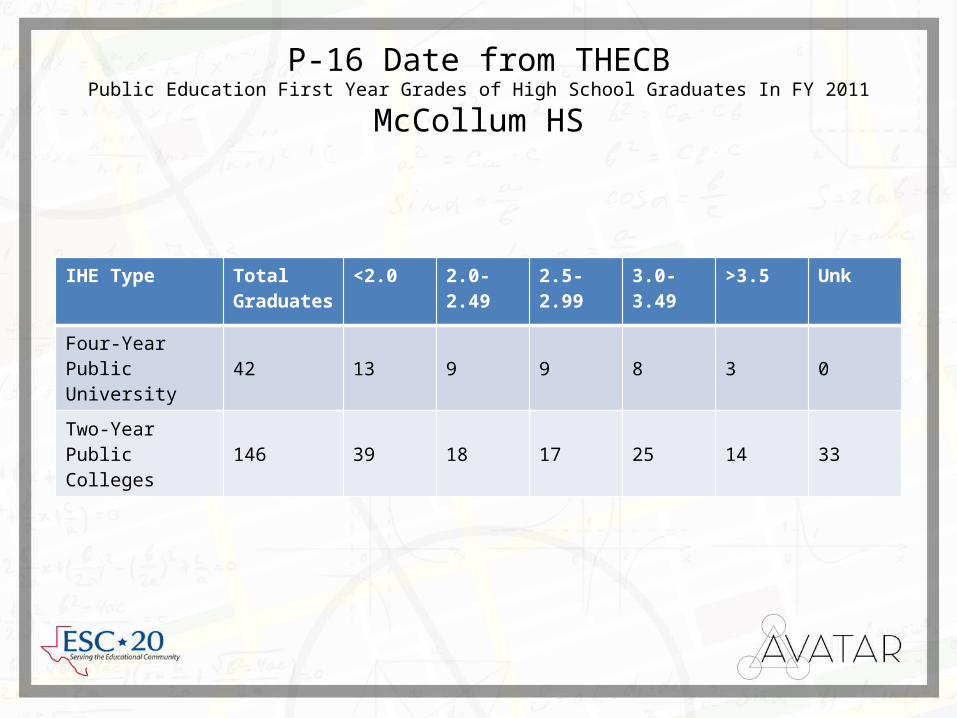
P-16 Date from THECBPublic Education First Year Grades of High School Graduates In FY 2011
McCollum HS
IHE Type Total Graduates
<2.0 2.0-2.49 2.5-2.99 3.0-3.49 >3.5 Unk
Four-Year Public University 42 13 9 9 8 3 0
Two-Year Public Colleges 146 39 18 17 25 14 33

Participation Data from THECBEnrollment by Year and by Ethnicity Percentage
University of Texas at San Antonio Fall 2011Institution 2010 2011UTSA 30,258 30,968Palo Alto College 8,965 9,163San Antonio College 25,269 25,567
Institution White Hispanic African American
Multi-Racial
Asian/ Pacific
Internat’l Other/Unk
UTSA 31.8 44.8 8.6 0.9 5.1 4.9 3.8
Palo Alto College
25.0 69.5 2.8 0.3 0.9 0.1 1.5
San Antonio College
35.0 52.7 6.3 0.8 2.9 1.1 1.3

Online Institutional Resumes: THECBGraduation/Completion Numbers
Institution Degrees and Certificates Awarded
2011
UTSA Bachelor’s 4,148
Master’s 1,007
Doctoral 68
Palo Alto College Associate’s 1,470
Certificate 1 382
Certificate 2 18
San Antonio College Associate’s 1,470
Certificate 1 382
Certificate 2 18

P-16 Data from THECBDual Credit Enrollment
Dual Credit Enrollment 2011
UTSA 28
Palo Alto College 1,986
San Antonio College 2,514

Participation Data from THECBPalo Alto College, 2011
Developmental Education, Fall 2008 Cohort Tracked for 2 years
FTIC Students Not Needing Dev. Ed
N % Attempting College Courses
% Attempting and Completing
Palo Alto College 234
Math 63.2 60.1
Reading 90.6 67.5
Writing 86.8 68
FTIC Students Requiring Dev. Ed
N % Attempting College Courses
% Attempting and Completing
Math 646 19 74
Reading 337 66.8 60
Writing 96 58.3 66.1

Participation Data from THECBSan Antonio College, 2011
Developmental Education, Fall 2008 Cohort Tracked for 2 years
FTIC Students Not Needing Dev. Ed
N % Attempting College Courses
% Attempting and Completing
San Antonio College 808
Math 33.4 70.4
Reading 78.6 69.1
Writing 79.3 72.2
FTIC Students Requiring Dev. Ed
N % Attempting College Courses
% Attempting and Completing
Math 1,454 9.7 71.6
Reading 883 48.1 66.4
Writing 190 47.9 74.7
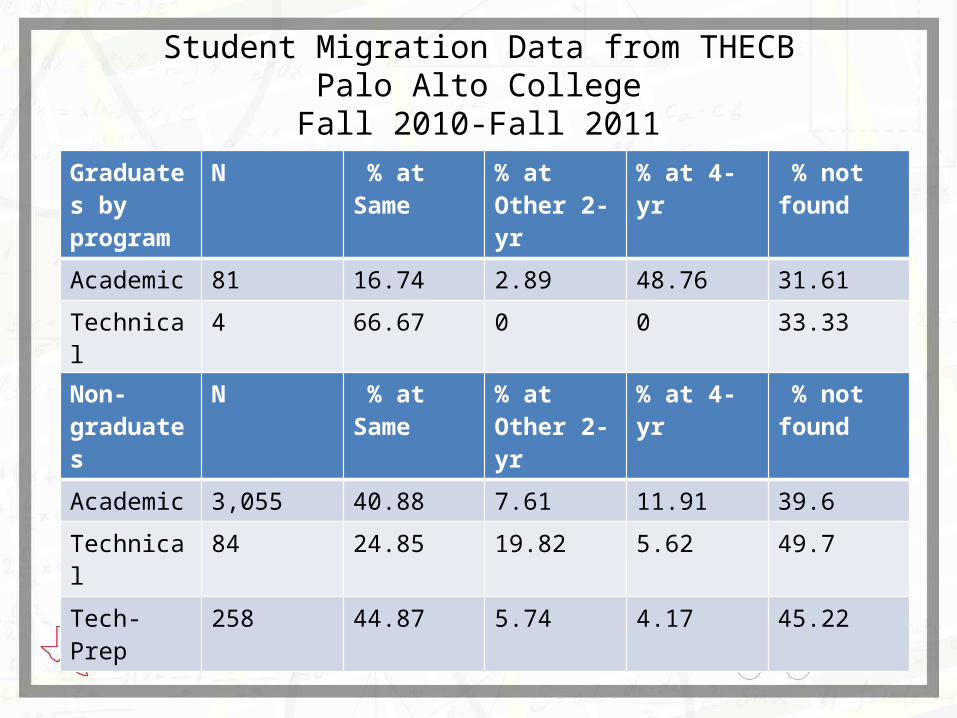
Student Migration Data from THECBPalo Alto College
Fall 2010-Fall 2011Graduates by program
N % at Same % at Other 2-yr
% at 4-yr % not found
Academic 81 16.74 2.89 48.76 31.61
Technical 4 66.67 0 0 33.33
Tech-Prep 20 31.75 3.17 11.11 53.97
Non-graduates
N % at Same % at Other 2-yr
% at 4-yr % not found
Academic 3,055 40.88 7.61 11.91 39.6
Technical 84 24.85 19.82 5.62 49.7
Tech-Prep 258 44.87 5.74 4.17 45.22
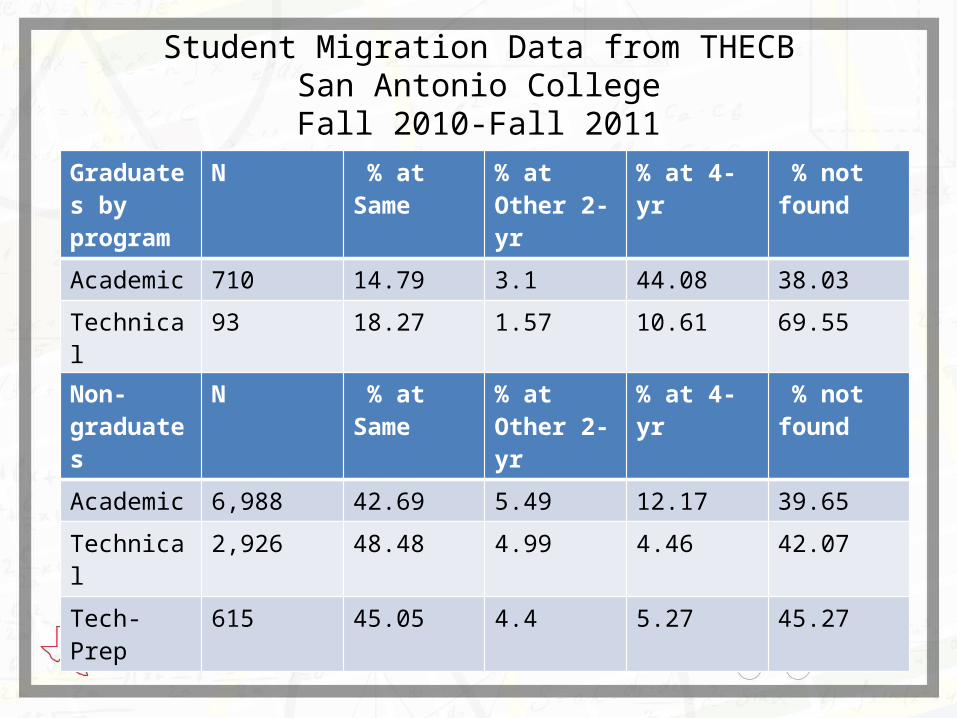
Student Migration Data from THECBSan Antonio CollegeFall 2010-Fall 2011
Graduates by program
N % at Same % at Other 2-yr
% at 4-yr % not found
Academic 710 14.79 3.1 44.08 38.03
Technical 93 18.27 1.57 10.61 69.55
Tech-Prep 38 27.94 2.94 17.65 51.47
Non-graduates
N % at Same % at Other 2-yr
% at 4-yr % not found
Academic 6,988 42.69 5.49 12.17 39.65
Technical 2,926 48.48 4.99 4.46 42.07
Tech-Prep 615 45.05 4.4 5.27 45.27

Academic Performance of Transfer Students from Palo Alto College
Developmental Education vs. No Developmental Education, Fall 2010Developmental Education prior to Transfer
Total N <2.0 2.0-2.49
2.5-2.99
3.0-3.49 >3.5 UNK Enroll Fall 2011
Texas A&M – San Antonio
245 163 33 14 25 36 53 2 123
University of Texas – San Antonio
93 54 12 9 16 10 5 2 46
UTHSCSA 5 0 0 0 0 0 0 0 0
Other public 4-yr 19 12 3 1 4 1 2 1 7
No Developmental Education
Total N <2.0 2.0-2.49
2.5-2.99
3.0-3.49 >3.5 UNK Enroll Fall 2011
Texas A&M – San Antonio
245 82 9 9 9 21 31 3 64
University of Texas – San Antonio
93 39 4 7 11 10 5 2 29
UTHSCSA 5 5 0 3 1 0 1 0 4
Other public 4-yr 19 7 1 1 1 2 2 0 6

Academic Performance of Transfer Students from San Antonio College
Developmental Education vs. No Developmental Education, Fall 2010
Developmental Education prior to Transfer
Total N <2.0 2.0-2.49
2.5-2.99
3.0-3.49 >3.5 UNK Enroll Fall 2011
Texas A&M – San Antonio
145 90 13 8 12 17 39 1 72
University of Texas – San Antonio
404 243 38 46 52 63 41 3 200
UTHSCSA 43 18 0 2 6 8 2 0 12
Other public 4-yr 33 13 3 4 0 2 4 0 6
No Developmental Education
Total N <2.0 2.0-2.49
2.5-2.99
3.0-3.49 >3.5 UNK Enroll Fall 2011
Texas A&M – San Antonio
145 55 9 4 4 15 22 1 43
University of Texas – San Antonio
404 161 24 25 29 36 46 1 128
UTHSCSA 43 25 3 8 5 6 3 0 18
Other public 4-yr 33 20 1 5 2 7 4 1 15

Academic Performance of Transfer Students from Palo Alto College
Academic or Technical Associate Degrees, Fall 2010Associate of Arts Degree Total N <2.0 2.0-
2.492.5-2.99
3.0-3.49 >3.5 UNK Enroll Fall 2011
Texas A&M – San Antonio
245 142 17 16 19 34 53 3 116
University of Texas – San Antonio
93 27 3 5 5 9 5 0 24
UTHSCSA 5 1 0 0 1 0 0 0 1
Other public 4-yr 19 5 0 0 1 1 3 0 5
Technical Associate Degree Total N <2.0 2.0-2.49
2.5-2.99
3.0-3.49 >3.5 UNK Enroll Fall 2011
Texas A&M – San Antonio
245 5 0 0 1 1 2 1 4
University of Texas – San Antonio
93 1 1 0 0 0 0 0 1
UTHSCSA 5 0 0 0 0 0 0 0 0
Other public 4-yr 19 0 0 0 0 0 0 0 0

Academic Performance of Transfer Students from San Antonio College
Academic or Technical Associate Degrees, Fall 2010Associate of Arts Degree Total N <2.0 2.0-
2.492.5-2.99
3.0-3.49 >3.5 UNK Enroll Fall 2011
Texas A&M – San Antonio
145 38 3 0 2 5 28 0 31
University of Texas – San Antonio
404 82 10 6 10 18 38 0 68
UTHSCSA 43 7 0 2 2 2 1 0 7
Other public 4-yr 33 3 1 0 0 1 1 0 1
Technical Associate Degree Total N <2.0 2.0-2.49
2.5-2.99
3.0-3.49 >3.5 UNK Enroll Fall 2011
Texas A&M – San Antonio
145 12 1 1 3 2 5 0 10
University of Texas – San Antonio
404 9 0 2 1 3 3 0 7
UTHSCSA 43 0 0 0 0 0 0 0 0
Other public 4-yr 33 3 0 0 1 0 2 0 2

Academic Performance of Transfer Students from UTSA, 2011 Developmental vs. No Developmental Education, Fall 2010
Developmental Education prior to Transfer Total N <2.0 2.0-2.49 2.5-2.99 3.0-3.49 >3.5 Unk Enroll Fall ’10
ACCD Lakeview 8 6 0 2 2 2 0 0 5ACCD NW Vista 369 232 60 53 34 48 31 6 188ACCD Palo Alto 93 54 12 9 16 10 5 2 46ACCD San Antonio College 404 243 38 46 52 63 41 3 200ACCD St. Philips 96 60 15 11 7 13 11 3 44Austin Community College 77 34 9 10 5 7 3 0 24Blinn College 48 16 4 3 2 6 1 0 14Central Texas College 11 5 1 1 0 1 2 0 5Cisco College 6 1 0 0 1 0 0 0 1Coastal Bend College 12 6 3 1 2 0 0 0 4Collin Co Comm College District 13 6 1 0 0 2 3 0 6DCCCD Richland College 5 3 0 1 1 1 0 0 3Del Mar College 25 6 0 2 2 0 1 1 5El Paso Community College District 22 17 8 3 3 2 0 1 10Houston Community College 16 8 1 3 2 1 1 0 6Laredo Community College District 39 13 6 2 2 2 1 0 8Lone Star College – Cy-Fair 13 7 1 1 3 1 1 0 7Lone Star College – Kingwood 11 6 2 0 1 2 1 0 2Lone Star College – Montgomery 7 4 0 1 2 1 0 0 2Lone Star College – Tomball 5 3 1 0 2 0 0 0 0Midland College 5 4 0 1 1 2 0 0 4Navarro College 6 2 0 1 0 1 0 0 2San Jacinto College Cen Campus 7 2 0 0 2 0 0 0 2San Jacinto College S Campus 9 3 0 1 0 2 0 0 2South Plains College 9 5 0 1 0 2 2 0 4South Texas College 23 8 4 1 1 0 1 1 4SW TX Jr College 46 22 6 4 3 7 2 0 18Tarrant Co SE Campus 5 4 0 1 0 3 0 0 4Temple College 8 2 1 0 0 1 0 0 1TX Southmost Coll 17 2 0 1 1 0 0 0 2Texas State T.C. Harlingen 5 2 1 0 1 0 0 0 1Wharton County JR. Coll 12 0 0 0 0 0 0 0 0Other Public 2YR Institution 103 42 15 10 11 5 1 0 28Unduplicated University Total 1,484 835 194 169 164 184 108 16 657

Academic Performance of Transfer Students from UTSA, 2011 Developmental vs. No Developmental Education, Fall 2010
No Developmental Education Total N <2.0 2.0-2.49 2.5-2.99 3.0-3.49 >3.5 Unk Enroll Fall ’10
ACCD Lakeview 8 2 0 1 1 0 0 0 1ACCD NW Vista 369 137 20 24 30 31 30 2 111ACCD Palo Alto 93 39 4 7 11 10 5 2 29ACCD San Antonio College 404 161 24 25 29 36 46 1 128ACCD St. Philips 96 36 7 12 5 8 3 1 21Austin Community College 77 43 6 10 8 9 10 0 36Blinn College 48 32 9 6 9 4 4 0 24Central Texas College 11 6 0 0 2 3 0 1 3Cisco College 6 5 1 2 0 0 1 1 4Coastal Bend College 12 6 2 1 0 0 3 0 5Collin Co Comm College District 13 7 1 0 3 2 1 0 4DCCCD Richland College 5 2 0 0 1 0 0 1 1Del Mar College 25 19 1 4 6 6 2 0 16El Paso Community College District 22 5 1 2 0 1 1 0 4Houston Community College 16 8 1 1 2 3 1 0 5Laredo Community College District 39 26 5 5 5 9 1 1 19Lone Star College – Cy-Fair 13 6 1 1 2 1 0 1 3Lone Star College – Kingwood 11 5 0 3 2 0 0 0 3Lone Star College – Montgomery 7 3 1 0 0 2 0 0 2Lone Star College – Tomball 5 2 1 0 1 0 0 0 1Midland College 5 1 0 0 1 0 0 0 1Navarro College 6 4 2 0 0 1 1 0 2San Jacinto College Cen Campus 7 5 1 0 2 2 0 0 2San Jacinto College S Campus 9 6 2 1 2 1 0 0 4South Plains College 9 4 0 0 2 1 1 0 4South Texas College 23 15 8 1 3 2 1 0 12SW TX Jr College 46 24 7 4 4 6 3 0 19Tarrant Co SE Campus 5 1 0 1 0 0 0 0 1Temple College 8 6 0 1 0 3 2 0 4TX Southmost Coll 17 15 4 3 5 3 0 0 13Texas State T.C. Harlingen 5 3 2 0 0 0 1 0 2Wharton County JR. Coll 12 12 3 3 3 3 0 0 10Other Public 2YR Institution 103 61 11 8 11 19 11 1 48Unduplicated University Total 1,484 649 109 113 139 151 125 12 503

Academic Performance of Transfer Students from UTSA, 2011 Core Curriculum Completed Prior to Transfer, Fall 2010
Core Curriculum Completed Prior to Transfer Total N <2.0 2.0-2.49 2.5-2.99 3.0-3.49 >3.5 Unk Enroll Fall ’10
ACCD Lakeview 8 1 0 0 0 1 0 0 1ACCD NW Vista 369 127 22 20 20 32 29 4 104ACCD Palo Alto 93 20 4 3 5 4 4 0 18ACCD San Antonio College 404 4 0 1 0 0 3 0 3ACCD St. Philips 96 7 3 1 0 2 1 0 2Austin Community College 77 4 1 0 0 1 2 0 3Blinn College 48 0 0 0 0 0 0 0 0Central Texas College 11 0 0 0 0 0 0 0 0Cisco College 6 2 0 1 0 0 1 0 2Coastal Bend College 12 0 0 0 0 0 0 0 0Collin Co Comm College District 13 6 1 0 1 1 3 0 5DCCCD Richland College 5 0 0 0 0 0 0 0 0Del Mar College 25 5 0 1 1 1 1 1 4El Paso Community College District 22 6 4 0 0 2 0 0 4Houston Community College 16 1 0 0 0 0 1 0 1Laredo Community College District 39 8 0 2 2 3 1 0 6Lone Star College – Cy-Fair 13 0 0 0 0 0 0 0 0Lone Star College – Kingwood 11 1 0 0 1 0 0 0 1Lone Star College – Montgomery 7 1 0 0 0 1 0 0 0Lone Star College – Tomball 5 0 0 0 0 0 0 0 0Midland College 5 2 0 0 1 1 0 0 2Navarro College 6 4 2 1 0 0 1 0 2San Jacinto College Cen Campus 7 1 1 0 0 0 0 0 0San Jacinto College S Campus 9 3 1 1 1 0 0 0 2South Plains College 9 0 0 0 0 0 0 0 0South Texas College 23 5 3 0 1 0 1 0 4SW TX Jr College 46 10 3 0 0 5 2 0 8Tarrant Co SE Campus 5 1 0 1 0 0 0 0 1Temple College 8 0 0 0 0 0 0 0 0TX Southmost Coll 17 2 0 1 0 1 0 0 2Texas State T.C. Harlingen 5 0 0 0 0 0 0 0 0Wharton County JR. Coll 12 1 1 0 0 0 0 0 1Other Public 2YR Institution 103 8 1 2 2 2 1 0 6Unduplicated University Total 1,484 233 47 36 35 58 52 5 184

Academic Performance of Transfer Students from UTSA, 2011 Earned Field of Study Degree Prior to Transfer, Fall 2010
No Developmental Education Total N <2.0 2.0-2.49 2.5-2.99 3.0-3.49 >3.5 Unk Enroll Fall ’10
ACCD Lakeview 8 0 0 0 0 0 0 0 0ACCD NW Vista 369 0 0 0 0 0 0 0 0ACCD Palo Alto 93 0 0 0 0 0 0 0 0ACCD San Antonio College 404 5 0 0 1 2 2 0 5ACCD St. Philips 96 0 0 0 0 0 0 0 0Austin Community College 77 0 0 0 0 0 0 0 0Blinn College 48 1 1 0 0 0 0 0 0Central Texas College 11 0 0 0 0 0 0 0 0Cisco College 6 0 0 0 0 0 0 0 0Coastal Bend College 12 0 0 0 0 0 0 0 0Collin Co Comm College District 13 0 0 0 0 0 0 0 0DCCCD Richland College 5 0 0 0 0 0 0 0 0Del Mar College 25 0 0 0 0 0 0 0 0El Paso Community College District 22 1 1 0 0 0 0 0 1Houston Community College 16 0 0 0 0 0 0 0 0Laredo Community College District 39 0 0 0 0 0 0 0 0Lone Star College – Cy-Fair 13 0 0 0 0 0 0 0 0Lone Star College – Kingwood 11 0 0 0 0 0 0 0 0Lone Star College – Montgomery 7 0 0 0 0 0 0 0 0Lone Star College – Tomball 5 0 0 0 0 0 0 0 0Midland College 5 0 0 0 0 0 0 0 0Navarro College 6 0 0 0 0 0 0 0 0San Jacinto College Cen Campus 7 0 0 0 0 0 0 0 0San Jacinto College S Campus 9 1 0 1 0 0 0 0 1South Plains College 9 0 0 0 0 0 0 0 0South Texas College 23 0 0 0 0 0 0 0 0SW TX Jr College 46 0 0 0 0 0 0 0 0Tarrant Co SE Campus 5 0 0 0 0 0 0 0 0Temple College 8 0 0 0 0 0 0 0 0TX Southmost Coll 17 0 0 0 0 0 0 0 0Texas State T.C. Harlingen 5 0 0 0 0 0 0 0 0Wharton County JR. Coll 12 0 0 0 0 0 0 0 0Other Public 2YR Institution 103 0 0 0 0 0 0 0 0Unduplicated University Total 1,484 8 2 1 1 2 2 0 7

Participation Data from THECBUniversity of Texas at San Antonio, 2011
Developmental Education, Fall 2008 Cohort Tracked for 2 years
FTIC Students Not Needing Dev. Ed
N % Attempting College Courses
% Attempting and Completing
UTSA 4,042
Math 84.5 85.7
Reading 99.4 92.9
Writing 95.9 89.3
FTIC Students Requiring Dev. Ed
N % Attempting College Courses
% Attempting and Completing
Math 346 71.7 88.7
Reading 260 93.5 87.7
Writing 207 86.5 81.0
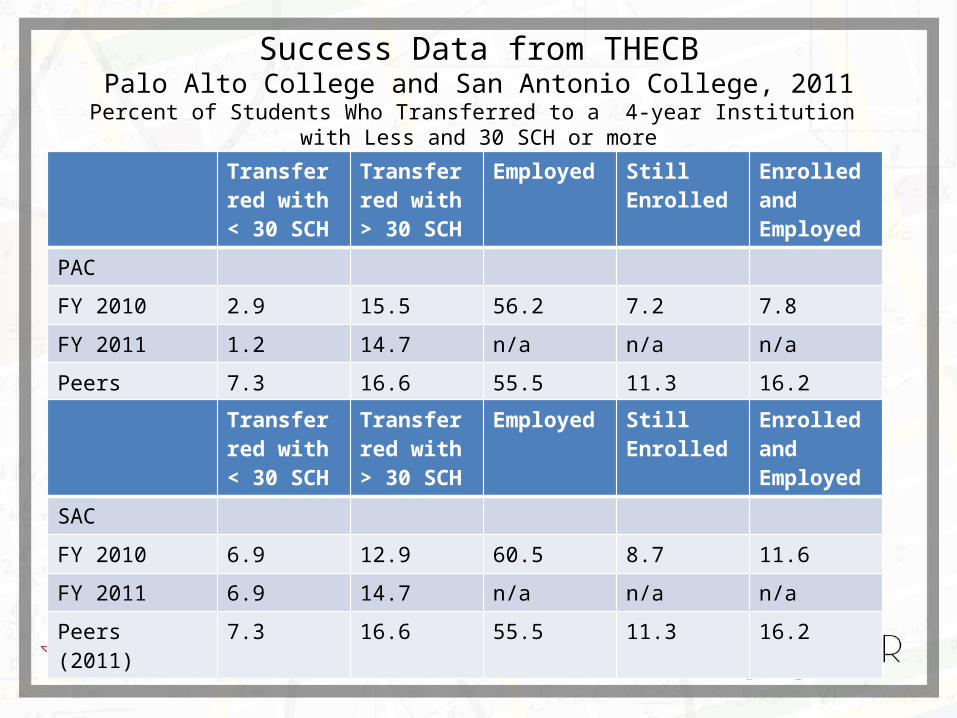
Success Data from THECBPalo Alto College and San Antonio College, 2011Percent of Students Who Transferred to a 4-year Institution
with Less and 30 SCH or moreTransferred with < 30 SCH
Transferred with > 30 SCH
Employed Still Enrolled Enrolled and Employed
PACFY 2010 2.9 15.5 56.2 7.2 7.8FY 2011 1.2 14.7 n/a n/a n/aPeers (2011) 7.3 16.6 55.5 11.3 16.2
Transferred with < 30 SCH
Transferred with > 30 SCH
Employed Still Enrolled Enrolled and Employed
SACFY 2010 6.9 12.9 60.5 8.7 11.6FY 2011 6.9 14.7 n/a n/a n/aPeers (2011) 7.3 16.6 55.5 11.3 16.2

Success Data from THECBUniversity of Texas at San Antonio, 2011
Graduation Rate of First-time, Full-time Degree-Seeking Students
Student Baccalaureate Success Rate
4-year rate2006
5-year rate2005
6-year rate2004
UTSA
Same Institution 12.6 29.3 44
Other Institution 9.8 21.8 26.3
Total 2.9 7.5 17.7
Related Documents