Reevaluation of Photoluminescence Intensity as an Indicator of Efficiency in Perovskite Solar Cells Valerio Campanari, Faustino Martelli,* Antonio Agresti, Sara Pescetelli, Narges Yaghoobi Nia, Francesco Di Giacomo, Daniele Catone, Patrick O’Keeffe, Stefano Turchini, Bowen Yang, Jiajia Suo, Anders Hagfeldt, and Aldo Di Carlo* 1. Introduction As for most semiconductors, steady-state photoluminescence (PL) (or continuous- wave PL, cw-PL) is extensively used to char- acterize perovskite solar cells (PSCs). The PL intensity and spectrum are not only used to investigate the properties of the constituent materials but are also often directly linked to the device efficiency. The carrier density in semiconductors under illumination is determined by the recombination dynamics of charge carriers that can be summarized by the simplified rate equation [1–3] dn dt ¼k oc 1 n k 2 n 2 k 3 n 3 þ g ¼ 0 (1) where n is the electronic charge carrier density, k 1 oc is the first- order ShockleyReadHall (SRH) recombination (nonradiative) rate constant, k 2 is the second-order band-to-band (radiative) recombination rate constant, k 3 is the third-order Auger (nonradiative) recombination rate constant, and g is the genera- tion rate. We specified a particular value of k 1 for open-circuit (OC) conditions (k 1 oc ) to distinguish it in general from the SRH rate at short-circuit (SC) (that we will indicate as k 1 sc ). Ideally, for a perfectly homogeneous device, they should be equal but any kind of device inhomogeneity in terms of recombination centers (e.g., at interfaces respect to the bulk), together with the change of carrier distribution occurring between OC and SC conditions, can create a discrepancy between these two values. The need for this correction will be explained more clearly in the discussion of results and in the Supporting Information (SI). Under steady-state conditions, such as those of a cw-PL mea- surement, the variation of carrier density over time is zero. Once a certain density of excited carriers is produced by illumination, the amount of radiative recombination will be determined by the competition between the radiative (∞k 2 n 2 ) and the nonradiative recombination (∞k oc 1 n). In general, at the carrier density typically photoexcited in operating solar cells, we can neglect the Auger recombination and the most important limitation to PL emission is the SRH recombination. When a perovskite film is placed between two transport materials and metal contacts, forming a solar cell, the dynamics of the charge carriers is modified with respect to the bare perovskite layer. The presence of selective materials for the extraction of electrons and holes makes it V. Campanari, A. Agresti, S. Pescetelli, N. Y. Nia, F. Di Giacomo, A. Di Carlo CHOSE (Centre for Hybrid and Organic Solar Energy) Department of Electronic Engineering University of Rome Tor Vergata Via del Politecnico 1, 00133 Rome, Italy E-mail: [email protected] F. Martelli CNR-IMM Area della Ricerca di Roma Tor Vergata 100 Via del Fosso del Cavaliere, 00133 Rome, Italy E-mail: [email protected] D. Catone, S. Turchini, A. Di Carlo Istituto di Struttura della Materia – CNR (ISM-CNR) EuroFEL Support Laboratory (EFSL) Area della Ricerca di Roma Tor Vergata Via del Fosso del Cavaliere 100, 00133 Rome, Italy P. O’Keeffe Istituto di Struttura della Materia – CNR (ISM-CNR) EuroFEL Support Laboratory (EFSL) Area della Ricerca di Roma 1, 00015 Monterotondo Scalo, Italy B. Yang, J. Suo, A. Hagfeldt Department of Chemistry - Ångström Laboratory Uppsala University Box 523, SE-75120 Uppsala, Sweden The ORCID identification number(s) for the author(s) of this article can be found under https://doi.org/10.1002/solr.202200049. © 2022 The Authors. Solar RRL published by Wiley-VCH GmbH. This is an open access article under the terms of the Creative Commons Attribution License, which permits use, distribution and reproduction in any medium, provided the original work is properly cited. DOI: 10.1002/solr.202200049 The photoluminescence (PL) intensity is often used as an indicator of the per- formance of perovskite solar cells and indeed the PL technique is often used for the characterization of these devices and their constituent materials. Herein, a systematic approach is presented to the comparison of the conversion efficiency and the PL intensity of a cell in both open-circuit (OC) and short-circuit (SC) conditions and its application to multiple heterogeneous devices. It is shown that the quenching of the PL observed in SC conditions is a good parameter to assess the device efficiency. The authors explain the dependence of the PL quenching ratio between OC and SC on the cell efficiency with a simple model that is also able to estimate the carrier extraction time of a device. RESEARCH ARTICLE www.solar-rrl.com Sol. RRL 2022, 6, 2200049 2200049 (1 of 9) © 2022 The Authors. Solar RRL published by Wiley-VCH GmbH

Welcome message from author
This document is posted to help you gain knowledge. Please leave a comment to let me know what you think about it! Share it to your friends and learn new things together.
Transcript

Reevaluation of Photoluminescence Intensity as anIndicator of Efficiency in Perovskite Solar Cells
Valerio Campanari, Faustino Martelli,* Antonio Agresti, Sara Pescetelli,Narges Yaghoobi Nia, Francesco Di Giacomo, Daniele Catone, Patrick O’Keeffe,Stefano Turchini, Bowen Yang, Jiajia Suo, Anders Hagfeldt, and Aldo Di Carlo*
1. Introduction
As for most semiconductors, steady-statephotoluminescence (PL) (or continuous-wave PL, cw-PL) is extensively used to char-acterize perovskite solar cells (PSCs). ThePL intensity and spectrum are not onlyused to investigate the properties of theconstituent materials but are also oftendirectly linked to the device efficiency.The carrier density in semiconductorsunder illumination is determined by therecombination dynamics of charge carriersthat can be summarized by the simplifiedrate equation[1–3]
dndt
¼ �koc1 n� k2n2 � k3n3 þ g ¼ 0 (1)
where n is the electronic charge carrier density, k1oc is the first-
order Shockley�Read�Hall (SRH) recombination (nonradiative)rate constant, k2 is the second-order band-to-band (radiative)recombination rate constant, k3 is the third-order Auger(nonradiative) recombination rate constant, and g is the genera-tion rate. We specified a particular value of k1 for open-circuit(OC) conditions (k1
oc) to distinguish it in general from theSRH rate at short-circuit (SC) (that we will indicate as k1
sc).Ideally, for a perfectly homogeneous device, they should be equalbut any kind of device inhomogeneity in terms of recombinationcenters (e.g., at interfaces respect to the bulk), together with thechange of carrier distribution occurring between OC and SCconditions, can create a discrepancy between these two values.The need for this correction will be explained more clearly inthe discussion of results and in the Supporting Information (SI).
Under steady-state conditions, such as those of a cw-PL mea-surement, the variation of carrier density over time is zero. Oncea certain density of excited carriers is produced by illumination,the amount of radiative recombination will be determined by thecompetition between the radiative (∞k2n2) and the nonradiativerecombination (∞koc1 n). In general, at the carrier density typicallyphotoexcited in operating solar cells, we can neglect the Augerrecombination and the most important limitation to PL emissionis the SRH recombination. When a perovskite film is placedbetween two transport materials and metal contacts, forming asolar cell, the dynamics of the charge carriers is modified withrespect to the bare perovskite layer. The presence of selectivematerials for the extraction of electrons and holes makes it
V. Campanari, A. Agresti, S. Pescetelli, N. Y. Nia, F. Di Giacomo,A. Di CarloCHOSE (Centre for Hybrid and Organic Solar Energy)Department of Electronic EngineeringUniversity of Rome Tor VergataVia del Politecnico 1, 00133 Rome, ItalyE-mail: [email protected]
F. MartelliCNR-IMMArea della Ricerca di Roma Tor Vergata100 Via del Fosso del Cavaliere, 00133 Rome, ItalyE-mail: [email protected]
D. Catone, S. Turchini, A. Di CarloIstituto di Struttura della Materia – CNR (ISM-CNR)EuroFEL Support Laboratory (EFSL)Area della Ricerca di Roma Tor VergataVia del Fosso del Cavaliere 100, 00133 Rome, Italy
P. O’KeeffeIstituto di Struttura della Materia – CNR (ISM-CNR)EuroFEL Support Laboratory (EFSL)Area della Ricerca di Roma 1, 00015 Monterotondo Scalo, Italy
B. Yang, J. Suo, A. HagfeldtDepartment of Chemistry - Ångström LaboratoryUppsala UniversityBox 523, SE-75120 Uppsala, Sweden
The ORCID identification number(s) for the author(s) of this articlecan be found under https://doi.org/10.1002/solr.202200049.
© 2022 The Authors. Solar RRL published by Wiley-VCH GmbH. This is anopen access article under the terms of the Creative Commons AttributionLicense, which permits use, distribution and reproduction in any medium,provided the original work is properly cited.
DOI: 10.1002/solr.202200049
The photoluminescence (PL) intensity is often used as an indicator of the per-formance of perovskite solar cells and indeed the PL technique is often used forthe characterization of these devices and their constituent materials. Herein, asystematic approach is presented to the comparison of the conversion efficiencyand the PL intensity of a cell in both open-circuit (OC) and short-circuit (SC)conditions and its application to multiple heterogeneous devices. It is shown thatthe quenching of the PL observed in SC conditions is a good parameter to assessthe device efficiency. The authors explain the dependence of the PL quenchingratio between OC and SC on the cell efficiency with a simple model that is alsoable to estimate the carrier extraction time of a device.
RESEARCH ARTICLEwww.solar-rrl.com
Sol. RRL 2022, 6, 2200049 2200049 (1 of 9) © 2022 The Authors. Solar RRL published by Wiley-VCH GmbH
possible to separate the excited carriers and generate power fromthe device when it is placed in an external circuit. Under solar celloperation, both nonradiative recombination and extraction ofcharge carriers from the active layers contribute to the reductionof the PL intensity, subtracting carriers from the radiative recom-bination process, while having an opposite impact on device per-formances: nonradiative recombination is detrimental for deviceefficiency while an extraction faster than any carrier recombina-tion is desirable. Indeed, we can consider the extraction of thecarriers from the cell as a phenomenon which competes withthe other channels of recombination
dndt
¼ �ksc1 n� IscqV
� k2n2 þ g ¼ 0 (2)
where Isc is the SC current, V the device volume, and q theelementary charge.
To provide a detailed model of carrier dynamics in theseconditions, we would require a numerical solution of the driftdiffusion equations. However, in the framework of this work,as it will be clarified later, we can approximate Isc simply by intro-ducing a second linear nonradiative term, namely, the extractionrate (ke ¼ 1/τe), that underlies all the processes involved in car-rier separation and extraction (more details in SI). The rateEquation (2) then becomes
dndt
¼ �ðksc1 þ keÞn� k2n2 þ g ¼ 0 (3)
As already mentioned, to be general we considered a differentvalue of k1 for SC.
cw-PL is often able to provide important information aboutmaterials and device physics. For example, the PL quantum yield(PLQY) of a perovskite film can be directly linked to thequasi-Fermi-level splitting (QFLS), establishing the ideal Voc ofa photovoltaic device. This information can be used to evaluatedifferent features of a PSC, like bulk recombination and surfacerecombination.[4,5]
In a complete device, an often used equation, based on thereciprocity relation, links PLQY to Voc
[6–8]
Voc ¼ V radoc � kBT
qjInðηÞj (4)
where V radoc is the maximum theoretical Voc achievable at the radi-
ative limit, η is the PL (or electroluminescence, EL) quantumyield, kB is the Boltzmann constant, and q is the elementarycharge. This equation indicates that the Voc loss of the solar cellwith respect to its radiative limit is mostly determined by thenonradiative recombination due to defects. However, the useof Equation (4), that represents a general model in the field ofphotovoltaic devices, suffers from simplifications that are criticalto delicate materials like perovskites and to the devices in whichthey are used.[4,9,10]
In general, all the information that can be extracted from thePL should be always analyzed taking into account the variablesthat arise from the strong nonideality and great variability ofperovskite materials and the related devices.
The intensity of cw-PL is also used to directly compare PSCsperformances while neglecting some important features. An
example of characterization method that is sometimes used toestablish the quality of PSCs is to consider the PL quenchingoccurring when a bare perovskite layer is embedded in a morecomplex structure containing one or more transport layers. Theclaim is that a greater quenching induced by the cell structureembedding the perovskite layer corresponds to a better carrierseparation[11–17] and hence to a potentially greater cell efficiency.However, those measurements are always performed in OC con-ditions (in most of the cases the device is simply disconnected),where no charge carrier is truly extracted from the device. Underthese conditions, we can only imagine a partial polarization of thecharge carrier distribution, due to their accumulation near therespective interfaces to compensate the build-in electric field gen-erated by the band alignment of all the materials forming thesolar cell. The reduction of the PL intensity for a device withrespect to a bare film is instead induced by the enhancementof nonradiative loss because of the creation of nonradiative defec-tive centers at the interfaces[18,19] and cannot be uniquely consid-ered a sign of better carrier extraction for a particular cellstructure. In general, the overall evaluation of the device per-formances cannot be provided by single PL measurements atOC because they do not take into account the carrier extractionin the working cell.
An approach, that overcomes some of the previous limitations,is to consider the PL intensity in different device operating con-ditions. In this way the carrier extraction capacity of the solar cellcan also be considered. Many studies have investigated thebehavior of PL intensity at different bias voltage conditions, bothin PSCs[19–22] and in solar cells based on other technologies.[23–25]
For example, it has been found that the PL intensity, taken at arange of solar cell voltages, accurately reflects the J–V curve of thesame device, giving also the opportunity to obtain information onthe fill factor (FF)[19] directly from the variation of PL when theoperating cell is driven from OC to the maximum power point(MPP) conditions.
Further, simple analyses to include the real device character-istics were performed comparing the PL quenching between OCand SC conditions.[21,26–28] In particular, Du et al.[21] found a lin-ear relationship between the logarithm of the PL quenching andthe power conversion efficiency (PCE) or the Voc. This linearrelationship was found by analyzing three devices containingthe same absorbing layer.
Owing to the simplicity and fast use of the proposed approachthat does not make use of a biasing supply (only OC and SC con-ditions are required), we define the model and the procedure toproperly compare the performances of different PSCs in a verygeneral way. To understand the versatility of this characterizationtechnique, it is important to compare systematically a large num-ber of heterogeneous devices with different architectures andcoming from different runs. Moreover, there is another, well-known but often neglected, aspect that should be consideredto design a reliable characterization technique based on PL thatcan be of broad use: the PL intensity in perovskites is not stableover time and can undergo both increasing and decreasingtrends that can occur both on short (seconds and minutes) orlong timescales (hours).[29–38] This peculiar behavior can havesignificant impact on the characterization results.
In this work, we measure the cw-PL at 1 sun, in both OC andSC conditions, of several perovskite-based solar cells with
www.advancedsciencenews.com www.solar-rrl.com
Sol. RRL 2022, 6, 2200049 2200049 (2 of 9) © 2022 The Authors. Solar RRL published by Wiley-VCH GmbH
different active layers, charge transporting layers, and devicestructures. These cells have different performances with theirPCE ranging from 5.63% to 21.5%. We show that the straight-forward technique based on the quenching ratio between PLocand PLsc (PL under SC conditions) can be directly used to evalu-ate the PSC performances with a surprisingly high level of gen-erality and precision despite all the involved approximations,simultaneously giving information on the characteristic timefor carrier extraction in the photovoltaic devices. We also show thatthe dependence of the PL intensity on the illumination time,which is generally neglected, must be taken into account in anyattempt to provide a reliable characterization of PSCs based on PL.
2. Devices and Design of the Experiment.
The main aim of our experiment is to test in a systematic way therelationship between the performances of PSCs and the cw-PLunder different operating conditions. Our intention is twofold:verify if a reliable and established figure of merit (FOM) exists,which can be defined with a simple PL experiment (refining theexperimental protocol to make it as precise as possible) and alsoto obtain from it further information on carrier dynamics in thedevice. The experiments were therefore performed on a largenumber of different device structures.
Starting from the works of Stolterfoht et al.[19] and Du et al.,[21]
we will propose a FOM based on a simple formula that uses therelative intensity quenching (PLQoc-sc) between PLoc and PLsc(i.e., PL at SC)
PLQoc�sc ¼PLoc � PLsc
PLoc(5)
Referring to Equations (1) and (3) we can associate a simplifiedmeaning to this value. Solving Equations (1) and (3) in steady-state conditions (see SI for details about the model), wheredn/dt ¼ 0, we can find the carrier concentration in both OC(noc(k1
oc)) and SC conditions (nsc(k1sc,ke)). Using these values
we can estimate the rate of emitted photons, that is proportionalto the PL (∞k2n2), and consequently
PLQoc�sc ¼ðnocðkoc1 ÞÞ2 � ðnscðksc1 , keÞÞ2
ðnocðkoc1 ÞÞ2(6)
We can also extrapolate from the model the approximate rela-tionship, PCE ¼ ðVocIscFFÞ=Pin, where Voc is the open-circuitvoltage, Isc is the short-circuit current, FF is the fill factor, andPin is the input light power. Indeed, we can approximate Isc fromthe value of ke as Isc ¼ qVkensc where V is the perovskite volumeand Voc as qVoc�, QFLS ¼ kBT ln ðnocðkoc1 ÞÞ2=n2i [4] where ni isthe intrinsic carrier concentration. The value of the FF is notevaluable by the model and is considered to be constant.
If we plot PLQoc-sc versus PCE while varying randomlyk1
oc and ke (see Figure S1a and Figure S1b in SI), it is possibleto observe that the resulting curve is mainly dependent on theratio between ke and k1
oc and only slightly on their absolutevalues. It is also possible to observe that the higher theextraction rate with respect to the nonradiative recombinationrate, the greater is the value of PLQoc-sc and PCE. Moreover,the relation between the log of PLQoc-sc and PCE is not linear
and the curve describing the relationship between the twofollows a saturating trend.
Our aim is to test the validity of this relation by measuring thePLoc and the PLsc of a heterogeneous set of devices, designed toprovide different performances (Table 1). In particular, wedecided to vary not only the single transport layers, as often madein such comparisons, but also the perovskite itself and the wholecell structure, aspects that are usually not varied in this kind ofcomparison. In three PSCs a single cation MAPbI3 (M) perov-skite was used as the active material, while in all the other cellsthe active layer was a triple cation, mixed halide (T) perovskite((Csy1MAy2FAy3)Pb(I1-xBrx)3). All the devices are summarizedin Table 1. To underline the importance of taking into accountmaterials and/or device variability, we highlight that T devicesare produced in different runs, indicated by a number(T1, T2, T3, T4, and T5) and that in some cases the triple cationperovskite was also prepared with different processes and withslightly different resulting stoichiometry indicated by a letter A,B, C in Table 1 (the details of production are reported in SI).In all the devices, except for T4 and T5, a TiO2 electron transportlayer (ETL) was used. In the two M solar cell types, the hole trans-port layer (HTL) was different, in particular we used Spiro-MeOTAD and a copper derivative corrole CutBuTPC.[39] Boththe T1-based devices have Spiro-MeOTAD as the HTL, but inone of them we added an interlayer based on phenethylammo-nium iodide (PEAI) that is used for surface passivation and tofavor the charge carrier transfer into the HTL[40]. The T2 andT3 devices have two different HTLs ((poly[bis(4-phenyl)(2,5,6-tri-methylphenyl)amine) hereafter (PTAA) and and poly(3-hexylthio-phene) hereafter (P3HT) and for both structure different MW ofpolymers were applied and investigated.[41,42]. T4 and T5devices[43] have an inverted structure (see Table 1) with NiOxas the HTL and two different ETLs. Finally, also the T6 deviceshave Spiro-MeOTAD and TiO2 as the HTL and the ETL, respec-tively, but with a different passivation based on 2-cyclohexylethy-lammonium iodide (CEAI).
A FOM such as PLQoc-sc cannot discriminate among deviceswith different absorption coefficients. For example, if an activematerial has a bandgap that is much larger than another one,but a similar PLQoc-sc, the PCE of the first material will be over-estimated. In the analysis of our results the differences in theabsorption are expected to be very small but, in any case, we havetaken into account this small difference in the bandgaps for M,T4, T5, and T6[44–48] and have suitably corrected the valuesPLQoc-sc normalizing them with respect to the other devices(more details in SI).
For each device we first measured the characteristic parame-ters (Voc, Jsc, FF, and PCE) through a standard J–V characteriza-tion to determine the reference values for the deviceperformances. PSCs can suffer from low reproducibility andeven with the same manufacturing process sometimes differentdevice efficiencies are achieved. In such cases, we performed thePL measurements also on two nominally equal devices if theyshowed significantly different performances.
All devices were masked with a 0.1 cm2 mask to normalize thedevice area that was illuminated with a white light from a LEDilluminator at 1 sun. We chose to excite the device with acontinuous white spectrum instead of a monochromatic(and/or pulsed) light, as is often used for PL characterization,
www.advancedsciencenews.com www.solar-rrl.com
Sol. RRL 2022, 6, 2200049 2200049 (3 of 9) © 2022 The Authors. Solar RRL published by Wiley-VCH GmbH
because the excitation conditions can modify the PL response ofthe perovskites[49,50] and because we want to use excitation con-ditions as similar as possible to the operational ones.Monochromatic excitation for example can also produce a differ-ent penetration depth profile of the light in the absorbing layerwith respect to the white light, thus leading to a change in theexcited carrier density profile. On the other hand, if the lightsource is pulsed, while at the same time maintaining a meanpower density equal to device operation conditions, it wouldinduce a different carrier distribution and dynamics with respectto the continuous case. The temporal change of PLoc and PLscintensities impacts the evaluation of PLQoc-sc. The most reliablecorrelation between PL quenching and conversion efficiency hasbeen found using the values of PLoc and PLsc measured in thefirst minute of illumination after the first fast transient (see SI formore details). In this time span, we first measure the PL intensityin OC and SC conditions taking the values measured immedi-ately before and after the switch from OC to SC. Then werepeated the measurement to investigate the PL variation bothin OC and SC (more details on the procedure and the reasonsbehind our choices are reported in SI).
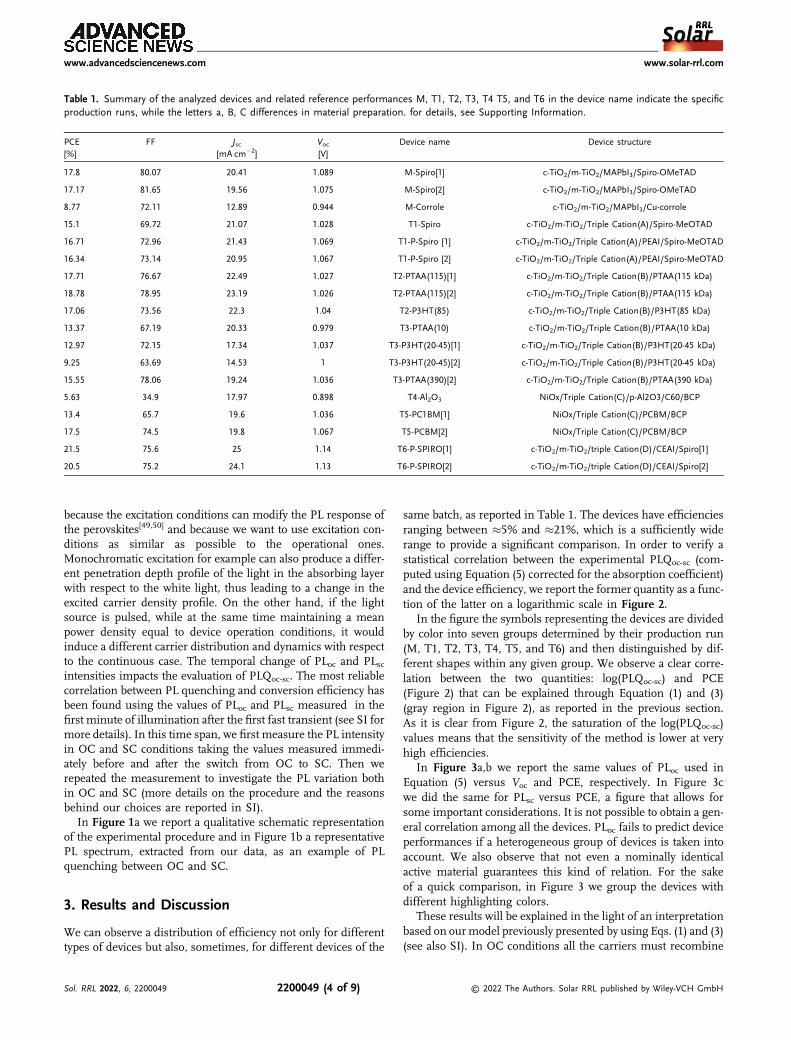
In Figure 1a we report a qualitative schematic representationof the experimental procedure and in Figure 1b a representativePL spectrum, extracted from our data, as an example of PLquenching between OC and SC.
3. Results and Discussion
We can observe a distribution of efficiency not only for differenttypes of devices but also, sometimes, for different devices of the
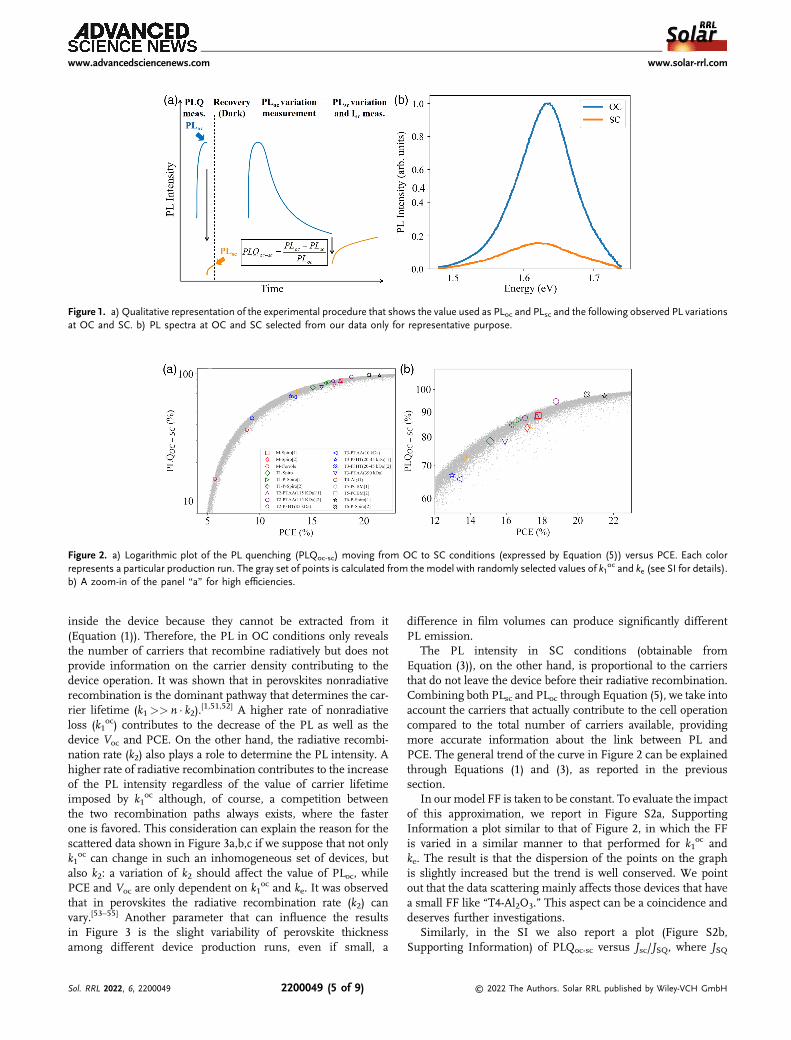
same batch, as reported in Table 1. The devices have efficienciesranging between �5% and �21%, which is a sufficiently widerange to provide a significant comparison. In order to verify astatistical correlation between the experimental PLQoc-sc (com-puted using Equation (5) corrected for the absorption coefficient)and the device efficiency, we report the former quantity as a func-tion of the latter on a logarithmic scale in Figure 2.
In the figure the symbols representing the devices are dividedby color into seven groups determined by their production run(M, T1, T2, T3, T4, T5, and T6) and then distinguished by dif-ferent shapes within any given group. We observe a clear corre-lation between the two quantities: log(PLQoc-sc) and PCE(Figure 2) that can be explained through Equation (1) and (3)(gray region in Figure 2), as reported in the previous section.As it is clear from Figure 2, the saturation of the log(PLQoc-sc)values means that the sensitivity of the method is lower at veryhigh efficiencies.
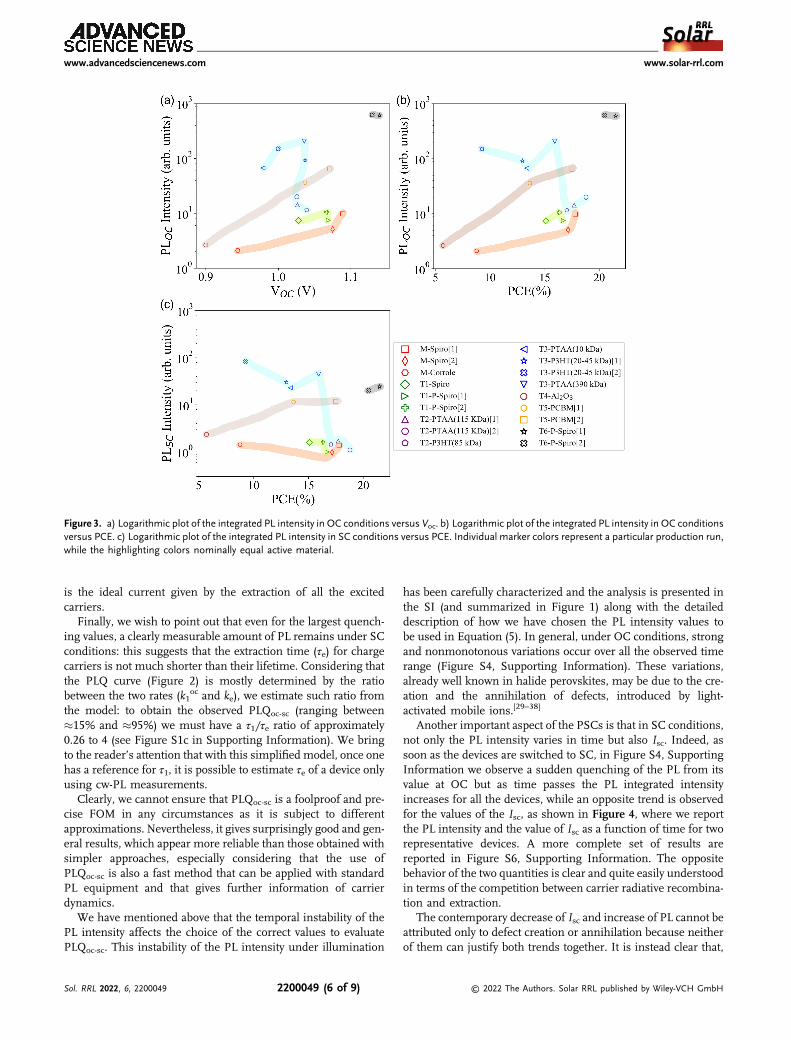
In Figure 3a,b we report the same values of PLoc used inEquation (5) versus Voc and PCE, respectively. In Figure 3cwe did the same for PLsc versus PCE, a figure that allows forsome important considerations. It is not possible to obtain a gen-eral correlation among all the devices. PLoc fails to predict deviceperformances if a heterogeneous group of devices is taken intoaccount. We also observe that not even a nominally identicalactive material guarantees this kind of relation. For the sakeof a quick comparison, in Figure 3 we group the devices withdifferent highlighting colors.
These results will be explained in the light of an interpretationbased on ourmodel previously presented by using Eqs. (1) and (3)(see also SI). In OC conditions all the carriers must recombine
Table 1. Summary of the analyzed devices and related reference performances M, T1, T2, T3, T4 T5, and T6 in the device name indicate the specificproduction runs, while the letters a, B, C differences in material preparation. for details, see Supporting Information.
PCE[%]
FF Jsc[mA cm�2]
Voc[V]
Device name Device structure
17.8 80.07 20.41 1.089 M-Spiro[1] c-TiO2/m-TiO2/MAPbI3/Spiro-OMeTAD
17.17 81.65 19.56 1.075 M-Spiro[2] c-TiO2/m-TiO2/MAPbI3/Spiro-OMeTAD
8.77 72.11 12.89 0.944 M-Corrole c-TiO2/m-TiO2/MAPbI3/Cu-corrole
15.1 69.72 21.07 1.028 T1-Spiro c-TiO2/m-TiO2/Triple Cation(A)/Spiro-MeOTAD
16.71 72.96 21.43 1.069 T1-P-Spiro [1] c-TiO2/m-TiO2/Triple Cation(A)/PEAI/Spiro-MeOTAD
16.34 73.14 20.95 1.067 T1-P-Spiro [2] c-TiO2/m-TiO2/Triple Cation(A)/PEAI/Spiro-MeOTAD
17.71 76.67 22.49 1.027 T2-PTAA(115)[1] c-TiO2/m-TiO2/Triple Cation(B)/PTAA(115 kDa)
18.78 78.95 23.19 1.026 T2-PTAA(115)[2] c-TiO2/m-TiO2/Triple Cation(B)/PTAA(115 kDa)
17.06 73.56 22.3 1.04 T2-P3HT(85) c-TiO2/m-TiO2/Triple Cation(B)/P3HT(85 kDa)
13.37 67.19 20.33 0.979 T3-PTAA(10) c-TiO2/m-TiO2/Triple Cation(B)/PTAA(10 kDa)
12.97 72.15 17.34 1.037 T3-P3HT(20-45)[1] c-TiO2/m-TiO2/Triple Cation(B)/P3HT(20-45 kDa)
9.25 63.69 14.53 1 T3-P3HT(20-45)[2] c-TiO2/m-TiO2/Triple Cation(B)/P3HT(20-45 kDa)
15.55 78.06 19.24 1.036 T3-PTAA(390)[2] c-TiO2/m-TiO2/Triple Cation(B)/PTAA(390 kDa)
5.63 34.9 17.97 0.898 T4-Al2O3 NiOx/Triple Cation(C)/p-Al2O3/C60/BCP
13.4 65.7 19.6 1.036 T5-PC1BM[1] NiOx/Triple Cation(C)/PCBM/BCP
17.5 74.5 19.8 1.067 T5-PCBM[2] NiOx/Triple Cation(C)/PCBM/BCP
21.5 75.6 25 1.14 T6-P-SPIRO[1] c-TiO2/m-TiO2/triple Cation(D)/CEAI/Spiro[1]
20.5 75.2 24.1 1.13 T6-P-SPIRO[2] c-TiO2/m-TiO2/triple Cation(D)/CEAI/Spiro[2]
www.advancedsciencenews.com www.solar-rrl.com
Sol. RRL 2022, 6, 2200049 2200049 (4 of 9) © 2022 The Authors. Solar RRL published by Wiley-VCH GmbH
inside the device because they cannot be extracted from it(Equation (1)). Therefore, the PL in OC conditions only revealsthe number of carriers that recombine radiatively but does notprovide information on the carrier density contributing to thedevice operation. It was shown that in perovskites nonradiativerecombination is the dominant pathway that determines the car-rier lifetime (k1>> n · k2).
[1,51,52] A higher rate of nonradiativeloss (k1
oc) contributes to the decrease of the PL as well as thedevice Voc and PCE. On the other hand, the radiative recombi-nation rate (k2) also plays a role to determine the PL intensity. Ahigher rate of radiative recombination contributes to the increaseof the PL intensity regardless of the value of carrier lifetimeimposed by k1
oc although, of course, a competition betweenthe two recombination paths always exists, where the fasterone is favored. This consideration can explain the reason for thescattered data shown in Figure 3a,b,c if we suppose that not onlyk1
oc can change in such an inhomogeneous set of devices, butalso k2: a variation of k2 should affect the value of PLoc, whilePCE and Voc are only dependent on k1
oc and ke. It was observedthat in perovskites the radiative recombination rate (k2) canvary.[53–55] Another parameter that can influence the resultsin Figure 3 is the slight variability of perovskite thicknessamong different device production runs, even if small, a
difference in film volumes can produce significantly differentPL emission.
The PL intensity in SC conditions (obtainable fromEquation (3)), on the other hand, is proportional to the carriersthat do not leave the device before their radiative recombination.Combining both PLsc and PLoc through Equation (5), we take intoaccount the carriers that actually contribute to the cell operationcompared to the total number of carriers available, providingmore accurate information about the link between PL andPCE. The general trend of the curve in Figure 2 can be explainedthrough Equations (1) and (3), as reported in the previoussection.
In our model FF is taken to be constant. To evaluate the impactof this approximation, we report in Figure S2a, SupportingInformation a plot similar to that of Figure 2, in which the FFis varied in a similar manner to that performed for k1
oc andke. The result is that the dispersion of the points on the graphis slightly increased but the trend is well conserved. We pointout that the data scattering mainly affects those devices that havea small FF like “T4-Al2O3.” This aspect can be a coincidence anddeserves further investigations.
Similarly, in the SI we also report a plot (Figure S2b,Supporting Information) of PLQoc-sc versus Jsc/JSQ, where JSQ
Figure 1. a) Qualitative representation of the experimental procedure that shows the value used as PLoc and PLsc and the following observed PL variationsat OC and SC. b) PL spectra at OC and SC selected from our data only for representative purpose.
Figure 2. a) Logarithmic plot of the PL quenching (PLQoc-sc) moving from OC to SC conditions (expressed by Equation (5)) versus PCE. Each colorrepresents a particular production run. The gray set of points is calculated from the model with randomly selected values of k1
oc and ke (see SI for details).b) A zoom-in of the panel “a” for high efficiencies.
www.advancedsciencenews.com www.solar-rrl.com
Sol. RRL 2022, 6, 2200049 2200049 (5 of 9) © 2022 The Authors. Solar RRL published by Wiley-VCH GmbH
is the ideal current given by the extraction of all the excitedcarriers.
Finally, we wish to point out that even for the largest quench-ing values, a clearly measurable amount of PL remains under SCconditions: this suggests that the extraction time (τe) for chargecarriers is not much shorter than their lifetime. Considering thatthe PLQ curve (Figure 2) is mostly determined by the ratiobetween the two rates (k1
oc and ke), we estimate such ratio fromthe model: to obtain the observed PLQoc-sc (ranging between�15% and �95%) we must have a τ1/τe ratio of approximately0.26 to 4 (see Figure S1c in Supporting Information). We bringto the reader’s attention that with this simplified model, once onehas a reference for τ1, it is possible to estimate τe of a device onlyusing cw-PL measurements.
Clearly, we cannot ensure that PLQoc-sc is a foolproof and pre-cise FOM in any circumstances as it is subject to differentapproximations. Nevertheless, it gives surprisingly good and gen-eral results, which appear more reliable than those obtained withsimpler approaches, especially considering that the use ofPLQoc-sc is also a fast method that can be applied with standardPL equipment and that gives further information of carrierdynamics.
We have mentioned above that the temporal instability of thePL intensity affects the choice of the correct values to evaluatePLQoc-sc. This instability of the PL intensity under illumination
has been carefully characterized and the analysis is presented inthe SI (and summarized in Figure 1) along with the detaileddescription of how we have chosen the PL intensity values tobe used in Equation (5). In general, under OC conditions, strongand nonmonotonous variations occur over all the observed timerange (Figure S4, Supporting Information). These variations,already well known in halide perovskites, may be due to the cre-ation and the annihilation of defects, introduced by light-activated mobile ions.[29–38]
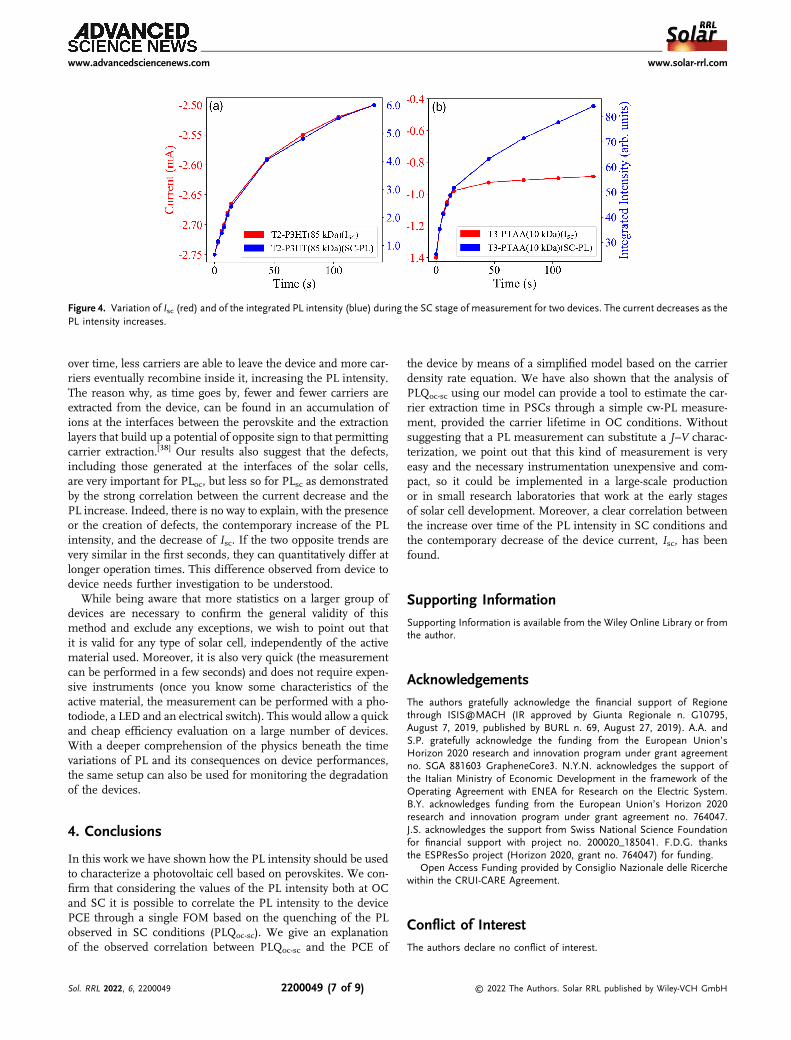
Another important aspect of the PSCs is that in SC conditions,not only the PL intensity varies in time but also Isc. Indeed, assoon as the devices are switched to SC, in Figure S4, SupportingInformation we observe a sudden quenching of the PL from itsvalue at OC but as time passes the PL integrated intensityincreases for all the devices, while an opposite trend is observedfor the values of the Isc, as shown in Figure 4, where we reportthe PL intensity and the value of Isc as a function of time for tworepresentative devices. A more complete set of results arereported in Figure S6, Supporting Information. The oppositebehavior of the two quantities is clear and quite easily understoodin terms of the competition between carrier radiative recombina-tion and extraction.
The contemporary decrease of Isc and increase of PL cannot beattributed only to defect creation or annihilation because neitherof them can justify both trends together. It is instead clear that,
Figure 3. a) Logarithmic plot of the integrated PL intensity in OC conditions versus Voc. b) Logarithmic plot of the integrated PL intensity in OC conditionsversus PCE. c) Logarithmic plot of the integrated PL intensity in SC conditions versus PCE. Individual marker colors represent a particular production run,while the highlighting colors nominally equal active material.
www.advancedsciencenews.com www.solar-rrl.com
Sol. RRL 2022, 6, 2200049 2200049 (6 of 9) © 2022 The Authors. Solar RRL published by Wiley-VCH GmbH
over time, less carriers are able to leave the device and more car-riers eventually recombine inside it, increasing the PL intensity.The reason why, as time goes by, fewer and fewer carriers areextracted from the device, can be found in an accumulation ofions at the interfaces between the perovskite and the extractionlayers that build up a potential of opposite sign to that permittingcarrier extraction.[38] Our results also suggest that the defects,including those generated at the interfaces of the solar cells,are very important for PLoc, but less so for PLsc as demonstratedby the strong correlation between the current decrease and thePL increase. Indeed, there is no way to explain, with the presenceor the creation of defects, the contemporary increase of the PLintensity, and the decrease of Isc. If the two opposite trends arevery similar in the first seconds, they can quantitatively differ atlonger operation times. This difference observed from device todevice needs further investigation to be understood.
While being aware that more statistics on a larger group ofdevices are necessary to confirm the general validity of thismethod and exclude any exceptions, we wish to point out thatit is valid for any type of solar cell, independently of the activematerial used. Moreover, it is also very quick (the measurementcan be performed in a few seconds) and does not require expen-sive instruments (once you know some characteristics of theactive material, the measurement can be performed with a pho-todiode, a LED and an electrical switch). This would allow a quickand cheap efficiency evaluation on a large number of devices.With a deeper comprehension of the physics beneath the timevariations of PL and its consequences on device performances,the same setup can also be used for monitoring the degradationof the devices.
4. Conclusions
In this work we have shown how the PL intensity should be usedto characterize a photovoltaic cell based on perovskites. We con-firm that considering the values of the PL intensity both at OCand SC it is possible to correlate the PL intensity to the devicePCE through a single FOM based on the quenching of the PLobserved in SC conditions (PLQoc-sc). We give an explanationof the observed correlation between PLQoc-sc and the PCE of
the device by means of a simplified model based on the carrierdensity rate equation. We have also shown that the analysis ofPLQoc-sc using our model can provide a tool to estimate the car-rier extraction time in PSCs through a simple cw-PL measure-ment, provided the carrier lifetime in OC conditions. Withoutsuggesting that a PL measurement can substitute a J–V charac-terization, we point out that this kind of measurement is veryeasy and the necessary instrumentation unexpensive and com-pact, so it could be implemented in a large-scale productionor in small research laboratories that work at the early stagesof solar cell development. Moreover, a clear correlation betweenthe increase over time of the PL intensity in SC conditions andthe contemporary decrease of the device current, Isc, has beenfound.
Supporting InformationSupporting Information is available from the Wiley Online Library or fromthe author.
AcknowledgementsThe authors gratefully acknowledge the financial support of Regionethrough ISIS@MACH (IR approved by Giunta Regionale n. G10795,August 7, 2019, published by BURL n. 69, August 27, 2019). A.A. andS.P. gratefully acknowledge the funding from the European Union’sHorizon 2020 research and innovation program under grant agreementno. SGA 881603 GrapheneCore3. N.Y.N. acknowledges the support ofthe Italian Ministry of Economic Development in the framework of theOperating Agreement with ENEA for Research on the Electric System.B.Y. acknowledges funding from the European Union’s Horizon 2020research and innovation program under grant agreement no. 764047.J.S. acknowledges the support from Swiss National Science Foundationfor financial support with project no. 200020_185041. F.D.G. thanksthe ESPResSo project (Horizon 2020, grant no. 764047) for funding.
Open Access Funding provided by Consiglio Nazionale delle Ricerchewithin the CRUI-CARE Agreement.
Conflict of InterestThe authors declare no conflict of interest.
Figure 4. Variation of Isc (red) and of the integrated PL intensity (blue) during the SC stage of measurement for two devices. The current decreases as thePL intensity increases.
www.advancedsciencenews.com www.solar-rrl.com
Sol. RRL 2022, 6, 2200049 2200049 (7 of 9) © 2022 The Authors. Solar RRL published by Wiley-VCH GmbH

Author ContributionsV.C., F.M., and A.D.C. conceived this project. V.C. performed the measure-ments and the analysis of the results with the help and supervision of F.M.The results were discussed among all the authors. The devices were fabri-cated and the related J–Vmeasurements were performed by A.A. (M and T1),S.P. (M and T1), N.Y.N. (T2 and T3), and F.D.G. (T4 and T5), and all of themalso wrote the related experimental section. F.D.G. performed the J–Vmeasurements for the T6 devices, which were fabricated by B.Y. and J.S.A.A., S.P., and N.Y.N. contributed to design the optimal device configurationfor PL measurements. V.C. and F.M. wrote the first draft of the manuscriptand all authors contributed to its final form.
Data Availability StatementThe data that support the findings of this study are available from thecorresponding author upon reasonable request.
Keywordsperovskites, photoluminescence, solar cells
Received: February 2, 2022Revised: April 28, 2022
Published online: May 14, 2022
[1] D. W. deQuilettes, K. Frohna, D. Emin, T. Kirchartz, V. Bulovic,D. S. Ginger, S. D. Stranks, Chem. Rev. 2019, 119, 11007.
[2] T. Kirchartz, J. A. Márquez, M. Stolterfoht, T. Unold, Adv. EnergyMater. 2020, 10, 1904134.
[3] J. Richter, M. Abdi-Jalebi, A. Sadhanala, M. Tabachnyk, J. P. H. Rivett,L. M. Pazos-Outón, K. C. Gödel, M. Price, F. Deschler, R. H. Friend,Nat. Commun. 2016, 7, 13941.
[4] P. Caprioglio, M. Stolterfoht, C. M. Wolff, T. Unold, B. Rech,S. Albrecht, D. Neher, Adv. Energy Mater. 2019, 9, 1901631.
[5] S. Kavadiya, A. Onno, Caleb C. Boyd, X. Wang, A. Cetta,M. D. McGehee, Z. C. Holman, Sol. RRL, 2021, 5, 2100107.
[6] E. Yablonovitch, O. D. Miller, S. R. Kurtz, AIP Conf. Proc. 2013, 1519, 9.[7] R. T. Ross, J.Chem. Phys. 1967, 46, 4590.[8] U. Rau, Phys. Rev. B 2007, 76, 085303.[9] M. Stolterfoht, P. Caprioglio, C. M. Wolff, J. A. Márquez,
J. Nordmann, S. Zhang, D. Rothhardt, U. Hörmann, Y. Amir,A. Redinger, L. Kegelmann, F. Zu, S. Albrecht, N. Koch, T. Kirchartz,M. Saliba, T. Unold, D. Neher, Energy Environ. Sci. 2019, 12, 2778.
[10] M. Auf der Maur, A. Di Carlo, Sol. Energy, 2019, 187, 358.[11] H. Coskun, F. H. Isikgor, Z. Chen, M. Imran, B. Li, Q. Xu, J. Ouyang,
J. Mater. Chem. A 2019, 7, 4759.[12] X. Jin, X. Lei, C. Wu, G. Jiang, W. Liu, H. Zeng, T. Chen, C. Zhu,
J. Mater. Chem. A 2017, 5, 19884.[13] J. Wang, J. Xu, Z. Li, X. Lin, C. Yu, H. Wu, H. Wang, ACS Applied Energy
Materials 2020, 3, 6344.[14] F. Wang, M. Endo, S. Mouri, Y. Miyauchi, Y. Ohno, A. Wakamiya,
Y. Murata, K. Matsuda, Nanoscale 2016, 8, 11882.[15] C. Xu, Z. Liu, E.-C. Lee, J. Mater. Chem. C 2018, 6, 6975.[16] X.-H. Zhang, J.-J. Ye, L.-Z. Zhu, H.-Y. Zheng, X.-P. Liu, X. Pan,
S.-Y. Dai, ACS Appl. Mater. Interfaces 2016, 8, 35440.[17] L. Xu, L.-L. Deng, J. Cao, X. Wang, W.-Y. Chen, Z. Jiang, Res. Lett.
2017, 12, 159.[18] M. Stolterfoht, C. M. Wolff, J. A. Márquez, S. Zhang, C. J. Hages,
D. Rothhardt, S. Albrecht, P. L. Burn, P. Meredith, T. Unold,D. Neher, Nat. Energy 2018, 3, 847.
[19] M. Stolterfoht, V. M. Le Corre, M. Feuerstein, P. Caprioglio,L. J. A. Koster, D. Neher, ACS Energy Lett. 2019, 4, 2887.
[20] C. Dreessen, D. P. del-Rey, P. P. Boix, H. J. Bolink, J. Lumin. 2020, 222,117106.
[21] T. Du, W. Xu, M. Daboczi, J. Kim, S. Xu, C.-T. Lin, H.; Kang, K.; Lee,M. J. Heeney, J.-S. Kim, J. R. Durrant, M. A. McLachlan, J. Mater.Chem. A 2019, 7, 18971.
[22] K. Tvingstedt, O. Malinkiewicz, A. Baumann, C. Deibel, H. J. Snaith,V. Dyakonov, H. J. Bolink, Sci. Rep. 2014, 4, 6071.
[23] K. Tvingstedt, K. Vandewal, F. Zhang, O. Inganäs, J. Phys. Chem. C2010, 114, 21824.
[24] U. Rau, V. Huhn, B. E. Pieters, Phys. Rev. Applied 2020, 14,014046.
[25] D. Hinken, K. Bothe, K. Ramspeck, S. Herlufsen, R. Brendel, J. of Appl.Phys. 2009, 105, 104516.
[26] C.-T. Lin, W. Xu, T. J. Macdonald, J. Ngiam, J.-H. Kim, T. Du, S. Xu,P. S. Tuladhar, H. Kang, K. Lee, J. R. Durrant, and M. A. McLachlan,ACS Appl. Mater. Interfaces 2021, 13, 43505.
[27] E. Regalado-Pérez, Evelyn B. Díaz-Cruz, J. Landa-Bautista,N. R. Mathews, X. Mathew, ACS Appl. Mater. Interfaces 2021, 13,11833.
[28] T. Du, W. Xu, S. Xu, S. R. Ratnasingham, C.-T. Lin, J. Kim,J. Briscoe, M. A. McLachlan, J. R. Durrant, J. Mater. Chem. C2020, 8, 12648.
[29] Y. Tian, M. Peter, E. Unger, M. Abdellah, K. Zheng, T. Pullerits,A. Yartsev, V. Sundströma, I. G. Scheblykin, Phys. Chem. Chem.Phys. 2015, 17, 24978.
[30] J. F. Galisteo-López, M. Anaya, M. E. Calvo, H. Míguez, J. of Phys.Chem. Lett. 2015, 6, 2200.
[31] X. Fu, D. A. Jacobs, F. J. Beck, T. Duong, H. Shen, K. R. Catchpole,T. P. White, Phys. Chem. Chem. Phys. 2016, 18, 22557.
[32] D. deQuilettes, W. Zhang, V. Burlakov, D. J. Graham, T. Leijtens,A. Osherov, V. Bulovic, H. J. Snaith, D. S. Ginger, S. D. Stranks,Nat Commun. 2016, 7, 11683.
[33] H. Lou, C. Lin, Z. Fang, L. Jiang, X. Chen, Z. Ye, H. He, RSC Adv. 2020,10, 11054.
[34] X. Wen, S. Huang, S. Chen, X. Deng, F. Huang, Cheng, Yi-Bing,M. Green, A. Ho-Baillie, Adv. Mater. Interfaces 2016, 3,1600467.
[35] Y. Zhong, C. A. Melo Luna, R. Hildner, C. Li, S. Huettner, APLMaterials 2019, 7, 041114.
[36] W. Nie, J. C. Blancon, A. Neukirch, K. Appavoo, H. Tsai,M. Chhowalla, M. A. Alam, M. Y. Sfeir, C. Katan, J. Even,S. Tretiak, J. J. Crochet, G. Gupta, A. D. Mohite. Nat Commun2016, 7, 11574.
[37] R. Gottesmanan, L. Gouda, B. S. Kalanoor, E. Haltzi, S. Tirosh,E. Rosh-Hodesh, Y. Tischler, A. Zaban, C. Quarti, E. Mosconi,F. De Angelis, J. Phys. Chem. Lett. 2015, 6, 2332.
[38] X. Deng, X. Wen, J. Zheng, T. Young, C. F. J. Lau, J. Kim, M. Green,S. Huang, A. Ho-Baillie, Nano Energy 2018, 46, 356.
[39] A. Agresti, B. Berionni, S. Pescetelli, A. Catini, F. Menchini,C. Di, R. Paolesse, A. Di Carlo, Adv. Funct. Mater. 2020, 30,2003790.
[40] T. Zhu, D. Zheng, J. Liu, L. Coolen, Thierry Pauporté, ACS Appl. Mater.Interfaces 2020, 12, 37197.
[41] N. Y. Nia, M. Zendehdel, M. Abdi-Jalebi, L. A. Castriotta,F. U. Kosasih, E. Lamanna, M. M. Abolhasani, Z. Zheng,Z. Andaji-Garmaroudi, K. Asadi, G. Divitini, C. Ducati,R. H. Friend, A. Di Carlo, Nano Energy 2021, 82, 105685.
[42] N. Yaghoobi Nia, M. Méndez, A. Di Carlo, E. Palomares, Philos. Trans.A Math. Phys. Eng. Sci. 2019, 377, 20180315.
[43] F. Di Giacomo, L. A. Castriotta, F. U. Kosasih, D. Di Girolamo,C. Ducati, A. Di Carlo, Micromachines 2020, 11, 1127.
www.advancedsciencenews.com www.solar-rrl.com
Sol. RRL 2022, 6, 2200049 2200049 (8 of 9) © 2022 The Authors. Solar RRL published by Wiley-VCH GmbH
[44] A. Agresti, A. Pazniak, S. Pescetelli, A. Di Vito, D. Rossi, A. Pecchia,M. Auf der Maur, A. Lied, R. Larciprete, D. V. Kuznetsov, D. Saranin,A. Di Carlo, Nat. Mater. 2019, 18, 1228-.
[45] M. Saliba, T. Matsui, J.-Y. Seo, K. Domanski, J.-P. Correa-Baena,M. K. Nazeeruddin, S. M. Zakeeruddin, W. Tress, A. Abate, EnergyEnviron. Sci. 2016, 9, 1989.
[46] L. Krückemeier, U. Rau, M. Stolterfoht, T. Kirchartz, Adv. EnergyMater. 2020, 10, 1902573.
[47] M. Saidaminov, A. M. Abdelhady, B. Murali, E. Alarousu,V. M. Burlakov, W. Peng, I. Dursun, L. Wang, Y. He, G. Maculan,A. Goriely, T. Wu, O. F. Mohammed, O. M. Bakr, Nat Commun2015, 6, 7586.
[48] A. M. A. Leguy, P. A. Azarhoosh, M. I. Alonso, M. Campoy-Quiles,O. J. M. Weber, O. J. Yao, Nanoscale 2015, 8, 6317.
[49] V. Campanari, A. Agresti, S. Pescetelli, A. K. Sivan, D. Catone,P. O’Keeffe, S. Turchini, A. Di Carlo, F. Martelli, Phys. Rev. Mater.2021, 5, 035409.
[50] W.-A. Quitsch, D. W. deQuilettes, O. Pfingsten, A. Schmitz,S. Ognjanovic, S. Jariwala, S. Koch, M. Winterer, J. Phys. Chem.Lett. 2018, 9, 2062.
[51] M. B. Johnston, L. M. Herz. Acc. Chem. Res. 2016, 49, 146.[52] A. Al-Ashouri, A. Magomedov, M. Roß, M. Jošt, M. Talaikis,
G. Chistiakova, T. Bertram, J. A. Márquez, E. Köhnen,E. Kasparavicius, S. Levcenco, L. Gil-Escrig, C. J. Hages,R. Schlatmann, B. Rech, T. Malinauskas, T. Unold, C. A. Kaufmann,L. Korte, G. Niaura, V. Getautis, S. Albrecht, Energy Environ. Sci.,2019, 12, 3356.
[53] M. Bonn, K. Miyata, E. Hendry, X.-Y. Zhu, ACS Energy Lett. 2017, 2,2555.
[54] F. Zheng, L. Z. Tan, S. Liu, A. M. Rappe, Nano Lett. 2015, 15, 7794.[55] L. M. Pazos-Outón, M. Szumilo, R. Lamboll, J. M. Richter, M. Crespo-
Quesada, M. Abdi-Jalebi, H. J. Beeson, M. Vrucinic, M. Alsari,H. J. Snaith, B. Ehrler, R. H. Friend, Felix Deschler, Science 2016,351, 1430.
www.advancedsciencenews.com www.solar-rrl.com
Sol. RRL 2022, 6, 2200049 2200049 (9 of 9) © 2022 The Authors. Solar RRL published by Wiley-VCH GmbH
Related Documents