Passaic River Tidal – General Reevaluation Report Geotechnical Report April 6, 2016

Welcome message from author
This document is posted to help you gain knowledge. Please leave a comment to let me know what you think about it! Share it to your friends and learn new things together.
Transcript

Passaic River Tidal – General Reevaluation Report
Geotechnical Report
April 6, 2016
PASSAIC RIVER TIDAL - GRR
GEOTECH REPORT
Page | 2
Table of Contents 1. Introduction................................................................................................................... 3
2. subsurface conditions ................................................................................................... 3
2.1. previous Subsurface investigation ................................................................................ 3
2.2. Recommendations ........................................................................................................ 4
3. geotechnical analysis and evaluation ............................................................................ 5
3.1. Seismic considerations ................................................................................................. 5
3.2. Levee ............................................................................................................................. 5
3.2.1. Seepage and Slope Stability Analysis ........................................................................... 5
3.2.1.1. Methodology ................................................................................................................. 5
3.2.1.2. Results and Recommendations ..................................................................................... 6
3.2.2. Settlement ANALYSIS ................................................................................................ 8
3.2.2.1. METHODOLOGY ....................................................................................................... 8
3.2.2.2. Results and Recommendations ..................................................................................... 8
3.3. Floodwall ...................................................................................................................... 8
3.3.1. SEEpage and deap-seated sliding analysis ................................................................... 8
3.3.2. Pile Bearing Capacity ................................................................................................... 9
3.3.3. Pile Foundation Recommendations .............................................................................. 9
4. preliminary information and Assumptions ................................................................. 10
5. Conclusion .................................................................................................................. 10
5.1. Levee ........................................................................................................................... 10
5.2. Floodwall .................................................................................................................... 11
6. REFERENCES ........................................................................................................... 12
List of Tables Table 1. Slope Stability Analysis Results for 12 ft High Levee ..................................................... 7
Table 2. Slope Stability Analysis Results for 6 ft High Levee on 4 ft Fill ..................................... 7
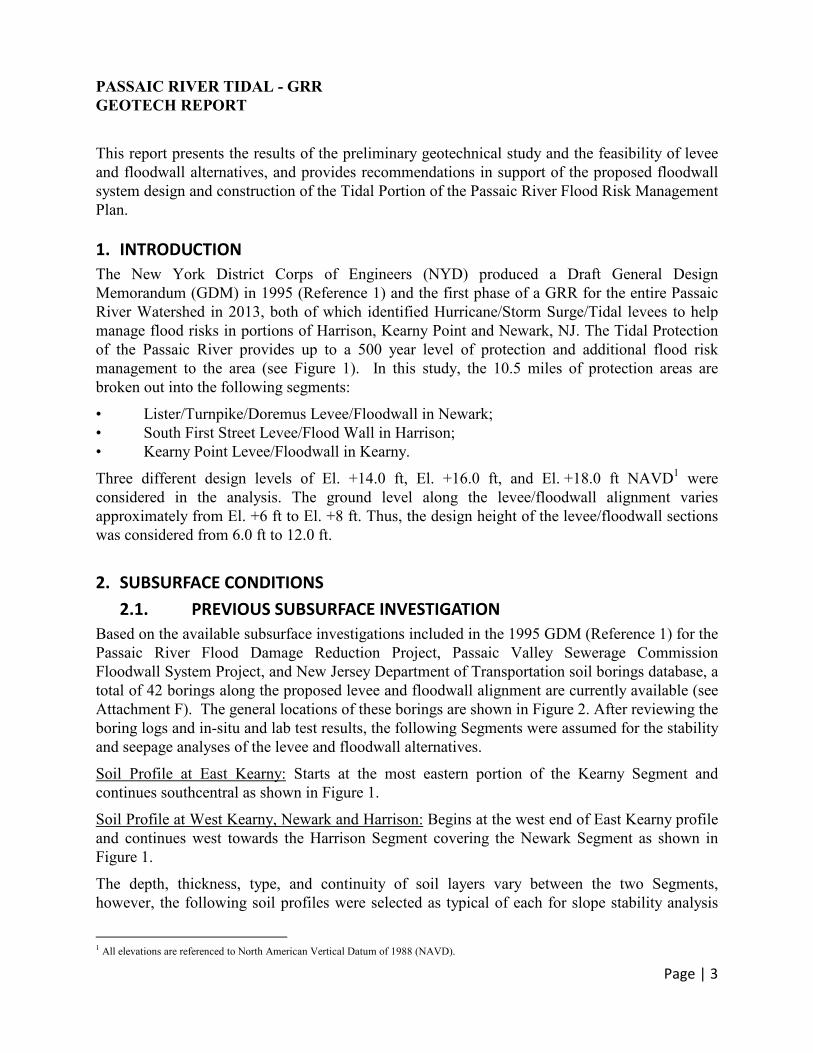
List of Figures Figure 1. Site Location Plan and Segments .................................................................................. 13
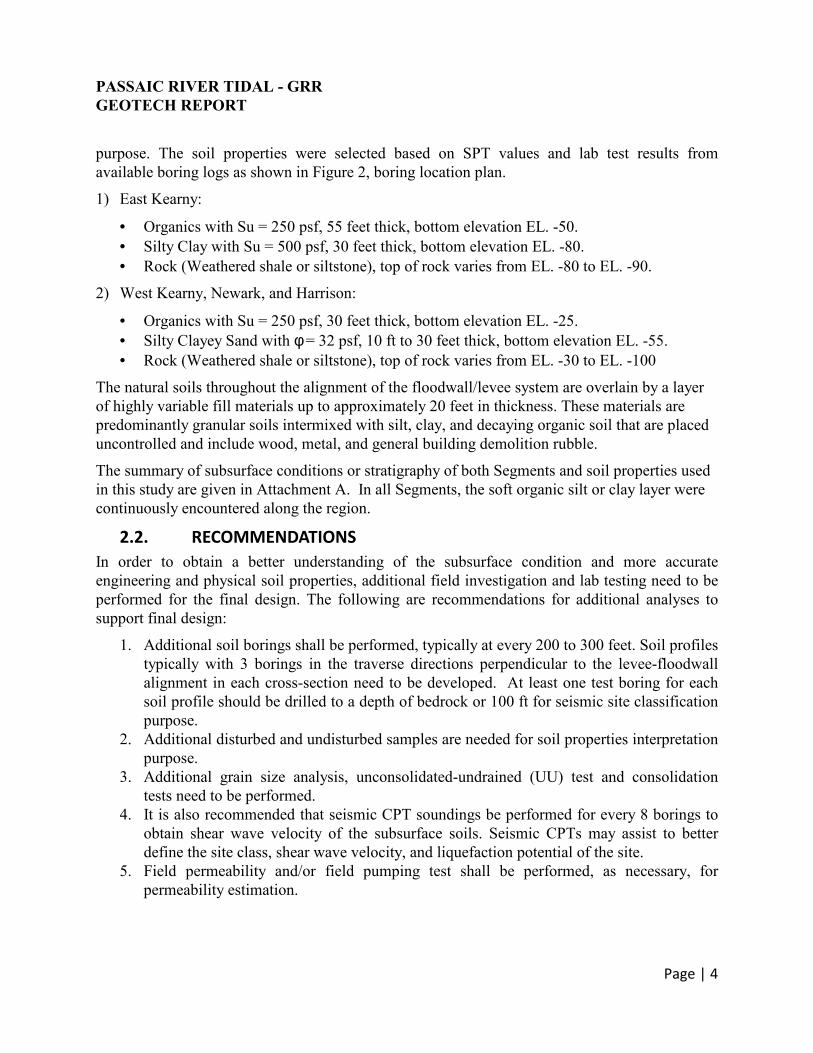
Figure 2. Boring Location Plan ..................................................................................................... 14
Figure 3. FOS Against Liquefaction – East Kearny ...................................................................... 15
Figure 4. FOS Against Liquefaction – West Kearny, Newark, and Harrison ............................... 16
Figure 5. Typical Section of Proposed 6ft High Levee ................................................................ 17
Figure 6. Typical Section of Floodwall ......................................................................................... 18
Attachments Attachment A: Levee Seepage and Stability Analysis
Attachment B: Liquefaction Evaluation
Attachment C: Levee Consolidation Settlement Analysis
Attachment D: Floodwall Seepage and Deep-Seated Sliding Analysis
Attachment E: Pile Capacity Analysis
Attachment F: Boring Log
PASSAIC RIVER TIDAL - GRR
GEOTECH REPORT
Page | 3
This report presents the results of the preliminary geotechnical study and the feasibility of levee
and floodwall alternatives, and provides recommendations in support of the proposed floodwall
system design and construction of the Tidal Portion of the Passaic River Flood Risk Management
Plan.
1. INTRODUCTION
The New York District Corps of Engineers (NYD) produced a Draft General Design
Memorandum (GDM) in 1995 (Reference 1) and the first phase of a GRR for the entire Passaic
River Watershed in 2013, both of which identified Hurricane/Storm Surge/Tidal levees to help
manage flood risks in portions of Harrison, Kearny Point and Newark, NJ. The Tidal Protection
of the Passaic River provides up to a 500 year level of protection and additional flood risk
management to the area (see Figure 1). In this study, the 10.5 miles of protection areas are
broken out into the following segments:
• Lister/Turnpike/Doremus Levee/Floodwall in Newark;
• South First Street Levee/Flood Wall in Harrison;
• Kearny Point Levee/Floodwall in Kearny.
Three different design levels of El. +14.0 ft, El. +16.0 ft, and El. +18.0 ft NAVD1 were
considered in the analysis. The ground level along the levee/floodwall alignment varies
approximately from El. +6 ft to El. +8 ft. Thus, the design height of the levee/floodwall sections
was considered from 6.0 ft to 12.0 ft.
2. SUBSURFACE CONDITIONS
2.1. PREVIOUS SUBSURFACE INVESTIGATION
Based on the available subsurface investigations included in the 1995 GDM (Reference 1) for the
Passaic River Flood Damage Reduction Project, Passaic Valley Sewerage Commission
Floodwall System Project, and New Jersey Department of Transportation soil borings database, a
total of 42 borings along the proposed levee and floodwall alignment are currently available (see
Attachment F). The general locations of these borings are shown in Figure 2. After reviewing the
boring logs and in-situ and lab test results, the following Segments were assumed for the stability
and seepage analyses of the levee and floodwall alternatives.
Soil Profile at East Kearny: Starts at the most eastern portion of the Kearny Segment and
continues southcentral as shown in Figure 1.
Soil Profile at West Kearny, Newark and Harrison: Begins at the west end of East Kearny profile
and continues west towards the Harrison Segment covering the Newark Segment as shown in
Figure 1.
The depth, thickness, type, and continuity of soil layers vary between the two Segments,
however, the following soil profiles were selected as typical of each for slope stability analysis
1 All elevations are referenced to North American Vertical Datum of 1988 (NAVD).
PASSAIC RIVER TIDAL - GRR
GEOTECH REPORT
Page | 4
purpose. The soil properties were selected based on SPT values and lab test results from
available boring logs as shown in Figure 2, boring location plan.
1) East Kearny:
• Organics with Su = 250 psf, 55 feet thick, bottom elevation EL. -50.
• Silty Clay with Su = 500 psf, 30 feet thick, bottom elevation EL. -80.
• Rock (Weathered shale or siltstone), top of rock varies from EL. -80 to EL. -90.
2) West Kearny, Newark, and Harrison:
• Organics with Su = 250 psf, 30 feet thick, bottom elevation EL. -25.
• Silty Clayey Sand with φ = 32 psf, 10 ft to 30 feet thick, bottom elevation EL. -55.
• Rock (Weathered shale or siltstone), top of rock varies from EL. -30 to EL. -100
The natural soils throughout the alignment of the floodwall/levee system are overlain by a layer
of highly variable fill materials up to approximately 20 feet in thickness. These materials are
predominantly granular soils intermixed with silt, clay, and decaying organic soil that are placed
uncontrolled and include wood, metal, and general building demolition rubble.
The summary of subsurface conditions or stratigraphy of both Segments and soil properties used
in this study are given in Attachment A. In all Segments, the soft organic silt or clay layer were
continuously encountered along the region.
2.2. RECOMMENDATIONS
In order to obtain a better understanding of the subsurface condition and more accurate
engineering and physical soil properties, additional field investigation and lab testing need to be
performed for the final design. The following are recommendations for additional analyses to
support final design:
1. Additional soil borings shall be performed, typically at every 200 to 300 feet. Soil profiles
typically with 3 borings in the traverse directions perpendicular to the levee-floodwall
alignment in each cross-section need to be developed. At least one test boring for each
soil profile should be drilled to a depth of bedrock or 100 ft for seismic site classification
purpose.
2. Additional disturbed and undisturbed samples are needed for soil properties interpretation
purpose.
3. Additional grain size analysis, unconsolidated-undrained (UU) test and consolidation
tests need to be performed.
4. It is also recommended that seismic CPT soundings be performed for every 8 borings to
obtain shear wave velocity of the subsurface soils. Seismic CPTs may assist to better
define the site class, shear wave velocity, and liquefaction potential of the site.
5. Field permeability and/or field pumping test shall be performed, as necessary, for
permeability estimation.

PASSAIC RIVER TIDAL - GRR
GEOTECH REPORT
Page | 5
3. GEOTECHNICAL ANALYSIS AND EVALUATION
3.1. SEISMIC CONSIDERATIONS
The recommended seismic site classification is Site Class E for all Segments. Depending on the
severity of the expected earthquake and the importance of the levee, seismic analyses to
determine liquefaction susceptibility may be required (Reference 2). A site-specific liquefaction
assessment using the methods outlined in Reference 3 was performed for pockets of granular
soils located below the groundwater level in the area of map blocks or sheets #1, 9, 10, 11, 14
and 17 as shown in Figure 1. These analyses require a peak ground surface acceleration (PGA)
and an earthquake magnitude (Mw) to estimate the seismic shear stresses. Based on the 2008
USGS seismic hazard maps for return period of 2,475 years (Reference 4), a PGA of 0.32g (g is
gravitational acceleration) and an Mw of 5.5 that is primarily based on historical earthquake
information in the northeast is used in the analyses.
The factors of safety (FOS) against liquefaction using the site specific analysis for both Segments
are shown in Figure 3 and Figure 4. According to Reference 5, the acceptable FOS against
liquefaction triggering is 1.2. The results indicate that there is a potential for liquefaction within
limited elevations in both Segments, which are 1) a 15 feet thick layer between El. +1 and El. -14
ft in the East Kearny Segment; and 2) a 25 feet thick layer between El. +3 and El. -22 ft in the
West Kearny, Newark, and Harrison Segment. The details of the liquefaction analyses are
provided in Attachment B.
Because of the liquefaction potential at specific soil layers contingency budgetary costs should be
included for liquefaction mitigation measures. Additional subsurface investigations and
additional soil boring and lab test data, as well as a more thorough detailed evaluation of the
proximity of structures, utilities, etc. are necessary to evaluate the feasibility of the liquefaction
mitigation methods such as Deep Dynamic Compaction (DDC)..
3.2. LEVEE
Three different design levels of El. +14.0 ft, El. +16.0 ft, and El. +18.0 ft NAVD were
considered in the analysis as shown in Figure 1. The ground level at the line of protection is
approximately at El. +6 ft to El. +8 ft. Thus, the design height of the levee varies from 6 ft to 12
ft. A typical levee cross-section with 12 ft height was selected for seepage and slope stability
analysis. It is also assumed that riverside toe of levees are away from the top edge of the
riverbank for proper stability. The new subsurface investigation and bathymetry survey of the
river would be needed to evaluate the minimum distance from the river bank. It is certain that the
minimum distance of the levee toe from the riverbank will vary along the line of protection. The
maximum height of the levee that meets the minimum required safety factors was obtained by
performing a similar slope stability analysis.
3.2.1. SEEPAGE AND SLOPE STABILITY ANALYSIS
3.2.1.1. METHODOLOGY
For preliminary analyses, one typical section for each Segment as described in Section 2.1 was
selected for the analyses. The maximum height of the levee section is 12 ft with identical
PASSAIC RIVER TIDAL - GRR
GEOTECH REPORT
Page | 6
upstream and downstream slopes of 3H:1V. In general, these cross-sections include an
impervious clay core, a layer of high strength geotextile (Synteen® SC30K or approved
equivalent) reinforcement at the bottom of proposed levees where necessary and a toe drain at the
landside toe.
The seepage and slope stability analyses were performed using commercially available general
purpose software SEEP/W and SLOPE/W (2007). According to the requirement of USACE
EM 1110-2-1913 “Design and Construction of Levees”, the following four different loading
cases were considered for each Segment analysis:
1. Case I: End of Construction;
2. Case II: Steady Seepage from Full Flood Stage, fully developed phreatic surface;
3. Case III: Rapid Drawdown from Full Flood Stage; and,
4. Case IV: Seismic Loading, with groundwater conditions.
Selected soil shear strength parameters for free drain soils and low permeability soils are in
accordance with the requirements of USACE EM 1110-2-1913. The permeability of each
material was conservatively estimated based on soil types. Spencer’s procedure for the method
of slices was used to determine the minimum FOS values and the controlling/critical slip surface
associated with the FOS values for all four loading cases.
For the Case I (end of construction) stability analyses, groundwater depth was modeled at El. +0
ft for all Segments. Considering that Case I is a short-term scenario, undrained strength
parameters were used for soft organic and medium clay soils in the foundation layers.
Case II was analyzed at flood level elevation of El. +16.0 ft to estimate the conditions at a full
flood stage. A seepage analysis was performed for this case to estimate flow and exit gradient
characteristics and to develop the phreatic surface for use in the stability analyses.
Case III (rapid drawdown) was performed to estimate the conditions when the water level
adjacent to the riverside slope lowers rapidly. This case generally has a greater influence on soils
with lower permeability since the dissipation of pore pressure is slower in these materials. For
this case, the phreatic surface was conservatively modeled as in Case II while keeping the flood
level lowered along the riverside/upstream slope to the toe.
Case IV (seismic loading) utilizes the pseudo-static slope stability analysis. The piezometric line
was modeled the same as in Case I. It is standard practice to consider the pseudo-static
coefficient as 2/3 of PGA/g. Accordingly, a pseudo-static coefficient of 0.21 (2/3x0.32g/g)
estimated from 2008 USGS seismic Hazard maps for return period of 2,475 years was estimated
and used in the stability analyses. Further, it was assumed that liquefaction mitigation measures
will be implemented if liquefaction is a concern.
3.2.1.2. RESULTS AND RECOMMENDATIONS
A summary of the calculated FOS and the corresponding required minimum factor of safety
values are shown in Table 1, compared with the parameters for the 8-foot levee on 8 to 10 feet of
fill, either inspected and approved for use in the foundation or excavated and replaced with
controlled structural fill, calculated for the 1995 GDM. As seen from the table, the calculated

PASSAIC RIVER TIDAL - GRR
GEOTECH REPORT
Page | 7
FOS values are lower than the minimum requirements of Reference 2 specifically for Case I and
II. This is due to the presence of soft or organic soil stratum continuously along the region. Using
geotextile slightly increased the stability safety factors but still the minimum required values
weren’t met. The details of all stability and seepage analysis results for both Segments are
provided in Attachment A.
After performing similar slope stability and seepage analysis on levee with different heights it was obtained
that 6 ft high levee would meet the minimum required stability safety factors if 4 ft from the subgrade level is
replaced with controlled structural fill or the existing fill is at least 4 ft thick and is acceptable for use as
foundation. An inspection trench along the centerline of the levee should be excavated to evaluate the existing
fill. The slope stability safety factors and their comparison with the minimum required values are provided in
Table 2. The typical section of the proposed levee is shown in Figure 5.
Table 1. Slope Stability Analysis Results for 12 ft High Levee
Required
Minimum
Factor of Safety
(USACE)
Calculated
Factor of Safety
1995 GDM
Calculated Factor
of Safety (8’ levee
on fill)
East Kearny Segment:
Case I: End of Construction 1.3 1.0 1.7
Case II: Steady State - Full Flood Stage 1.4 1.0 2.4
Case III: Rapid Drawdown 1.0 1.0 1.2
Case IV: Seismic Load 1.0 0.9 n/a
West Kearny, Newark, and Harrison Segment:
Case I: End of Construction 1.3 1.0 1.5
Case II: Steady State - Full Flood Stage 1.4 1.0 2.8
Case III: Rapid Drawdown 1.0 1.0 1.4
Case IV: Seismic Load 1.0 0.9 n/a
Table 2. Slope Stability Analysis Results for 6 ft High Levee on 4 ft Fill
Required
Minimum
Factor of Safety
(USACE)
Calculated Factor
of Safety
1995 GDM
Calculated Factor
of Safety
(8’ levee on fill)
Both Segment:
Case I: End of Construction 1.3 2.0 1.7
Case II: Steady State - Full Flood Stage 1.4 1.4 2.4
Case III: Rapid Drawdown 1.0 1.3 1.2
Case IV: Seismic Load 1.0 1.1 n/a

PASSAIC RIVER TIDAL - GRR
GEOTECH REPORT
Page | 8
3.2.2. SETTLEMENT ANALYSIS
Based on the generalized soil profiles, the top 30 to 85 ft of the natural soil in the flood
protection area consists of soft and organic soil and silty clay. The immediate or elastic
settlement of soils will take place during the construction. Therefore, settlement analysis was
only performed to estimate the primary consolidation settlement of the clayey soil layers.
3.2.2.1. METHODOLOGY
The generalized soil profile for East Kearny Segment was used to estimate the consolidation
settlement of 6 ft high levee. The levee is underlain by a 4 ft thick existing fill or structural fill
material.
One consolidation test data for silty clay soil is available at East Kearny Segment. The
consolidation parameters as recommended in USACE 1995 memorandum was used for the top
12 ft of the organic soil.
In the settlement analysis, the compressible soil layers were divided into sub-layers of 2 feet
thicknesses for obtaining better accuracy of calculations. Increase in vertical stresses at the mid
depth of each sub-layer due to the embankment load was calculated using the elastic stress
distribution methods as outlined in Reference 6.
The time rate of primary consolidation and secondary consolidation was not estimated in this
analysis due to lack of sufficient deformation-time data. Additional consolidation testing on
undisturbed sample(s) will be required for obtaining information regarding the rate of
consolidation.
3.2.2.2. RESULTS AND RECOMMENDATIONS
It is estimated that a total primary consolidation settlement of 8-inch will occur in the
compressible soils at the project site due to the construction of 6 ft high levee. In order to
minimize the effect of permanent settlement on the levee, the estimated 8-inch consolidation
settlement can be added to the construction height of the levee. The detail of the consolidation
settlement calculation is provided in Attachment C.
3.3. FLOODWALL
Much of the proposed line of protection (LOP) does not have adequate space for levee
construction; therefore, a floodwall alternative is considered in those reaches. Due to the soft
foundation soils and unsatisfactory FOS obtained for levee over 6 ft high and also a need to
remove unsuitable and uncontrolled existing fill material with varying thickness as discussed in
Section 3.2, the floodwall alternative was considered for the entirety of each reach. A typical
section of floodwall with sheetpile cutoff is shown in Figure 6.
3.3.1. SEEPAGE AND DEAP-SEATED SLIDING ANALYSIS
The seepage analyses of 12 ft high floodwall for all Segments were performed to estimate the
exit gradient and flow rates with and without sheetpile cutoff. The exit gradient at the landside of
floodwall with no sheetpile cutoff was 0.86 for both Segments. Per Reference 7, underseepage
controls are needed where the calculated exit gradient exceeds an allowable gradient of typically
PASSAIC RIVER TIDAL - GRR
GEOTECH REPORT
Page | 9
0.5. Using 20 ft deep sheetpile cutoff reduced the exit gradient to an acceptable value of 0.16.
The flow rate for steady state seepage condition could be as high as 14 gallons/day per foot
length of the wall. The details of floodwall seepage analyses are provided in Attachment D.
Deep-seated sliding analysis was performed to check the sliding within weak layers beneath the
sheetpile. The vertical water pressure due to the flood was conservatively assumed to be a
surcharge load on the ground surface. The minimum global stability safety factor obtained for the
critical slipping surface is 1.50 which meets the minimum required value per EM 1110-2-2502
(Reference 7). In this analysis the lateral resistances of the foundation piles and sheetpiles were
conservatively neglected.
3.3.2. PILE BEARING CAPACITY
Pile capacity analyses were performed on three different pile options: H-Piles (HP14x73), 14”
precast prestressed concrete piles2, and Caissons or Micropiles with 8 and 12 inch diameter rock
sockets. ENSOFT Software “APILE” was utilized for axial capacity analyses on driven H-piles
and precast prestressed concrete piles (see Attachment E). To be conservative, skin resistance for
the top 10 ft of the piles was eliminated. Downdrag effects were ignored due to limited
information and shall be considered based on the results of additional borings and lab tests.
The compression and tension capacities of rock sockets for caissons were calculated using the
spreadsheets with details as provided in Attachment E.
3.3.3. PILE FOUNDATION RECOMMENDATIONS
Due to the existing soft or Organic soil, proposed piles shall be advanced to a stiffer or denser
soil stratum to achieve required compression and tension capacities. Based on the soil
stratification and results of the pile capacity analysis, an 80 ft long H-Pile (HP14x73) bearing on
silty clay can provide an ultimate compression and uplift capacity of approximately 95 kips at the
East Kearny Segment. In West Kearny, Newark, and Harrison Segment, a 60 ft long H-Pile
bearing on silty clayey sand can provide approximately 110 kips of ultimate compression
capacity and 100 kips of ultimate uplift capacity. For H-Piles bearing on a competent rock the
ultimate compression capacity will be determined by structural capacity with the limit of 200
kips.
Similar pile capacity analysis performed on 14-inch prestressed precast concrete piles, showed
that an 80 ft long concrete pile bearing on silty clay at the East Kearny Segment can provide 100
kips and 95 kips of ultimate compression and uplift capacities, respectively. In West Kearny,
Newark, and Harrison Segment, a 60 ft long concrete pile bearing on silty clayey sand can
provide approximately 205 kips of ultimate compression capacity and 160 kips of ultimate uplift
capacity.
The allowable compression and tension capacities of 20 ft long (12-inch O.D.) rock socket for
Caissons/Micropiles were estimated 240 and 150 tons, respectively.
The final design shall include a study of pile group effect and pile deflections under lateral,
2 Precast prestressed concrete (PPC) piles were analyzed as a potential alternative for construction in areas considered still impacted by HTRW.
Use of PPC is not considered in the design at this stage of the analysis.
PASSAIC RIVER TIDAL - GRR
GEOTECH REPORT
Page | 10
compression, and uplift loads, and potential downdrag effects.
4. PRELIMINARY INFORMATION AND ASSUMPTIONS
The preliminary information and assumptions made in this report that could have significant
impacts on the project costs are summarized below:
1. The analyses and calculations performed in this report are preliminary in nature and all
estimates were based on limited available data. The new subsurface investigation and
laboratory testing program as recommended in Section 2.2 are necessary to meet USACE
requirements.
2. A layer of highly variable fill materials up to approximately 20 feet in thickness exists in
the area of protection. The top 4 ft of the fill needs to be removed and replaced with
controlled structural fill if the existing fill is not acceptable for use in foundation.
3. Because of the liquefaction potential at specific soil layers contingency budgetary costs
should be included for liquefaction mitigation measures. Where necessary, liquefaction
mitigation methods such as dynamic compaction can be further studied at the project site.
4. The riverside toe of levees is assumed to be away from the top edge of the riverbank for
proper stability. The new subsurface investigation and bathymetry of the river would be
needed to evaluate the minimum distance from the river bank. It is certain that the
minimum distance of the levee toe from the riverbank will vary along the line of
protection.
5. For pile depth calculations, rock depths vary along the line of protection but pile lengths
are assumed to be conservative (exceeding 100 feet in some locations).
5. CONCLUSION
The analyses and calculations performed in this report are preliminary in nature and all estimates
were based on limited available data. The new subsurface investigation and laboratory testing
program as recommended in Section 2.2 are necessary to meet USACE requirements.
5.1. LEVEE
Due to the presence of organic soils along the Segment, the proposed 6 ft high levee system
requires a 4 ft of structural fill (or existing fill, if inspected and approved) beneath the levee to
meet the minimum required stability. The fill material and soft soil along the Segments possess
hydraulic exit gradient within an acceptable range. If it is intended to reduce the quantity of flow
through the foundation below 7 gallons/day per foot, some seepage control methods such as
sheetpile cutoff should be evaluated and utilized.
The recommended flood protection system for the areas with the top of wall elevation at El. +14
and ground surface at El. +8 ft in both Segments should be evaluated based on the construction
cost of levee and floodwall. For the levee alternative inspecting the existing fill and possibly
replacing it with a 4 ft thick structural fill should be considered in the cost estimate Depending
on the severity of the expected earthquake and the importance of the levee, seismic analyses to
determine liquefaction susceptibility may be required (Reference 2). Based on the evaluation

PASSAIC RIVER TIDAL - GRR
GEOTECH REPORT
Page | 11
performed, there is liquefaction potential at specific locations as mentioned in Section 3.1 (see
Figure 3 and Figure 4) and contingency budgetary costs should be included for liquefaction
mitigation measures.
5.2. FLOODWALL
For the areas with lower ground elevation than El. +8 ft or higher top of wall elevation than El.
+14 ft the levee system cannot be recommended due to the stability issues as discussed in Section
3.2.1. For these areas, it is recommended to use a floodwall system (T-Wall or I-Wall) with 20 ft
deep sheetpile cutoff to control the seepage through the foundation. In areas with deeper rock
elevation H-Pile or PPC piles may provide sufficient allowable compression and tension
capacities. Micropiles or Caissons with rock socket can be utilized in areas with relatively
shallow rock depth especially in West Kearny, Newark, and Harrison Segment.

PASSAIC RIVER TIDAL - GRR
GEOTECH REPORT
Page | 12
6. REFERENCES
1. USACE (1995), General Design Memorandum (GDM), Passaic River Flood Damage
Reduction Project, Appendix E- Geotechnical Design, Levees, Floodwalls and
Miscellaneous, United States Army Corps of Engineers, dated September 1995.
2. “Design and Construction of Levees”, EM1110-2-1913, United States Army Corps of
Engineers, dated April 30, 2000.
3. Idriss, I. M., & Boulanger, R. W. (2008). Soil liquefaction during earthquakes.
Earthquake engineering research institute.
4. “http://earthquake.usgs.gov/hazards/products/conterminous/2008/”, Accessed December
14, 2015.
5. “AASHTO LRFD Bridge Design Specifications”, 7th
ed., American Association of State
Highway and Transportation Officials, dated 2014.
6. Das, B. M. (2006). Principles of geotechnical engineering, Nelson, Ontario, Canada, 686
p.
7. “Retaining & Flood Walls”, EM 1110-2-2502, United States Army Corps of Engineers,
dated September 29, 1989.
8. “Design Guidance for Levee Underseepage”, ETL-1110-2-569, United States Army
Corps of Engineers, dated May a, 2005.

PASSAIC RIVER TIDAL - GRR
GEOTECH REPORT
Page | 13
Figure 1. Site Location Plan and Segments
East Kearny:
Blocks 12 through 18
West Kearny, Newark, and Harrison:
Blocks 1 through 11 and 19 through 25

PASSAIC RIVER TIDAL - GRR
GEOTECH REPORT
Page | 14
Figure 2. Boring Location Plan

PASSAIC RIVER TIDAL - GRR
GEOTECH REPORT
Page | 15
Figure 3. FOS Against Liquefaction – East Kearny

PASSAIC RIVER TIDAL - GRR
GEOTECH REPORT
Page | 16
Figure 4. FOS Against Liquefaction – West Kearny, Newark, and Harrison

PASSAIC RIVER TIDAL - GRR
GEOTECH REPORT
Page | 17
Figure 5. Typical Section of Proposed 6ft High Levee

PASSAIC RIVER TIDAL - GRR
GEOTECH REPORT
Page | 18
Figure 6. Typical Section of Floodwall
SEEPAGE & SLOPE STABILITY ANALYSES PASSAIC RIVER FLOOD RISK MANAGEMENT PROJECT TIDAL AREAS IN HARRISON, KEARNEY, AND NEWARK, NJ
SUBJECT : Levee Seepage & Slope Stability Analysis JOB NO. : 60442748 BY: MS DATE : 01/12/16 CHKD. BY: SK DATE: 02/01/16 SHEET 1 OF 5 I:\Projects\60442748(Passaic-River)\Report\Attachment_A_PDFs\Passaic-River Flood Protection Study-Attachment_A.doc AECOM
Attachment A
LEVEE SEEPAGE & SLOPE STABILITY ANALYSES
SEEPAGE & SLOPE STABILITY ANALYSES PASSAIC RIVER FLOOD RISK MANAGEMENT PROJECT TIDAL AREAS IN HARRISON, KEARNEY, AND NEWARK, NJ
SUBJECT : Levee Seepage & Slope Stability Analysis JOB NO. : 60442748 BY: MS DATE : 01/12/16 CHKD. BY: SK DATE: 02/01/16 SHEET 2 OF 5 I:\Projects\60442748(Passaic-River)\Report\Attachment_A_PDFs\Passaic-River Flood Protection Study-Attachment_A.doc AECOM
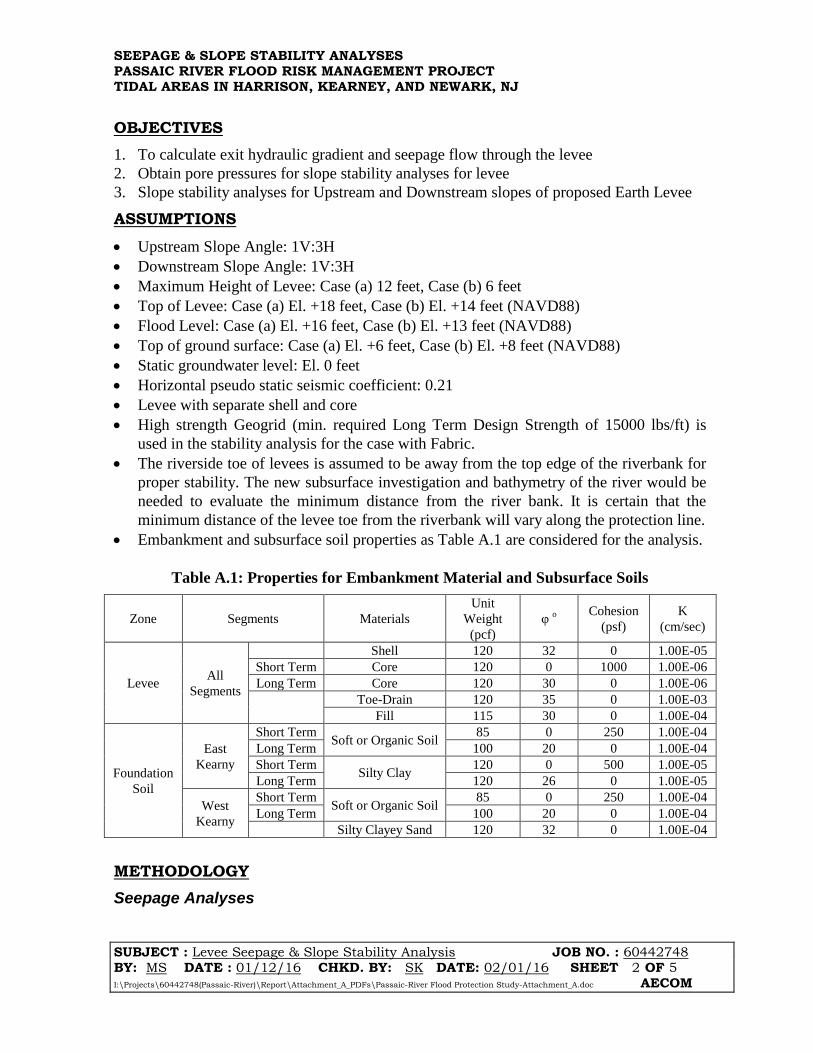
OBJECTIVES
1. To calculate exit hydraulic gradient and seepage flow through the levee
2. Obtain pore pressures for slope stability analyses for levee
3. Slope stability analyses for Upstream and Downstream slopes of proposed Earth Levee
ASSUMPTIONS
Upstream Slope Angle: 1V:3H
Downstream Slope Angle: 1V:3H
Maximum Height of Levee: Case (a) 12 feet, Case (b) 6 feet
Top of Levee: Case (a) El. +18 feet, Case (b) El. +14 feet (NAVD88)
Flood Level: Case (a) El. +16 feet, Case (b) El. +13 feet (NAVD88)
Top of ground surface: Case (a) El. +6 feet, Case (b) El. +8 feet (NAVD88)
Static groundwater level: El. 0 feet
Horizontal pseudo static seismic coefficient: 0.21
Levee with separate shell and core
High strength Geogrid (min. required Long Term Design Strength of 15000 lbs/ft) is
used in the stability analysis for the case with Fabric.
The riverside toe of levees is assumed to be away from the top edge of the riverbank for
proper stability. The new subsurface investigation and bathymetry of the river would be
needed to evaluate the minimum distance from the river bank. It is certain that the
minimum distance of the levee toe from the riverbank will vary along the protection line.
Embankment and subsurface soil properties as Table A.1 are considered for the analysis.
Table A.1: Properties for Embankment Material and Subsurface Soils
Zone Segments Materials
Unit
Weight
(pcf)
φ o Cohesion
(psf)
K
(cm/sec)
Levee All
Segments
Shell 120 32 0 1.00E-05
Short Term Core 120 0 1000 1.00E-06
Long Term Core 120 30 0 1.00E-06
Toe-Drain 120 35 0 1.00E-03
Fill 115 30 0 1.00E-04
Foundation
Soil
East
Kearny
Short Term Soft or Organic Soil
85 0 250 1.00E-04
Long Term 100 20 0 1.00E-04
Short Term Silty Clay
120 0 500 1.00E-05
Long Term 120 26 0 1.00E-05
West
Kearny
Short Term Soft or Organic Soil
85 0 250 1.00E-04
Long Term 100 20 0 1.00E-04
Silty Clayey Sand 120 32 0 1.00E-04
METHODOLOGY
Seepage Analyses

SEEPAGE & SLOPE STABILITY ANALYSES PASSAIC RIVER FLOOD RISK MANAGEMENT PROJECT TIDAL AREAS IN HARRISON, KEARNEY, AND NEWARK, NJ
SUBJECT : Levee Seepage & Slope Stability Analysis JOB NO. : 60442748 BY: MS DATE : 01/12/16 CHKD. BY: SK DATE: 02/01/16 SHEET 3 OF 5 I:\Projects\60442748(Passaic-River)\Report\Attachment_A_PDFs\Passaic-River Flood Protection Study-Attachment_A.doc AECOM
A commercially available, general purpose seepage computer program, SEEP/W, was used
to perform seepage analyses. Seepage flow and hydraulic exit gradient at toe were estimated
for the steady state hydraulic conditions. The estimated exit gradient values were compared
with allowable values recommended by the Army Corps of Engineers ETL 1110-2-569
(Reference 8) to assess the need for underseepage controls.
Slope Stability Analyses
A commercially available, general purpose slope stability computer program, SLOPE/W,
was used to perform the slope stability analyses. SLOPE/W uses the limit equilibrium
methods to compute the factor of safety (FOS) for a given slope geometry and loading
conditions. Spencer’s Procedure for the method of slices for circular failure was used to
evaluate the slope stability as this procedure satisfies the complete static equilibrium for
each slice. SLOPE/Wautomatically searches for the circular slip surface associated with the
minimum FOS, which is considered the critical or controlling slip surface. The stability
analyses were performed for the end of construction case and for piezometric conditions
anticipated during flood events as listed below. In addition, stability under seismic loading
and rapid drawdown conditions was also analyzed. All these analyses were performed with
estimated effective stress strength parameters. However, for the end of construction case,
total stress strength parameters were used for the clayey soils. In general accordance with
EM 1110-2-1913, the following cases were analyzed:
Case I: End of Construction - Upstream/Downstream Slopes
Case II: Steady Seepage from Maximum Flood Level - Downstream Slope
Case III: Rapid Drawdown (from a fully developed steady state condition) - Upstream Slope
Case IV: Seismic Loading (Pseudo Static Coefficient of 0.21) - Downstream Slope
Pore pressures for use in the corresponding slope stability analyses were estimated from
seepage analysis results for Cases II & III. The groundwater level was used for slope stability
analyses of Cases I and IV.
Earthquake Conditions
It is a standard practice to consider the pseudo static coefficient as 2/3 of PGA/g in design
where the PGA is Peak Ground Acceleration and the g is gravity acceleration. The seismic
site class of this project site could be “E”. Using the 2008 USGS seismic hazard maps, a
PGA value of 0.32g was estimated for a 2,475 years seismic event. Accordingly, pseudo
static coefficient of 0.21 (<= 2/3x0.32g/g) was estimated and used in the stability analyses.
RESULTS AND DISCUSSIONS
Seepage Analyses
Steady-state seepage analysis results for Case (a) levee are provided in Figure A.6
and Figure A.12. As discussed below, Case (a) levee didn’t meet the minimum
required stability safety factors thus, seepage analysis results aren’t discussed.

SEEPAGE & SLOPE STABILITY ANALYSES PASSAIC RIVER FLOOD RISK MANAGEMENT PROJECT TIDAL AREAS IN HARRISON, KEARNEY, AND NEWARK, NJ
SUBJECT : Levee Seepage & Slope Stability Analysis JOB NO. : 60442748 BY: MS DATE : 01/12/16 CHKD. BY: SK DATE: 02/01/16 SHEET 4 OF 5 I:\Projects\60442748(Passaic-River)\Report\Attachment_A_PDFs\Passaic-River Flood Protection Study-Attachment_A.doc AECOM
Based on steady state seepage analyses, seepage flow under/through 6 ft high levee,
Case (b), is estimated to be approximately 7 gpd per feet in both segments (see
Figure A.17).
Based on steady seepage analyses vertical hydraulic exit gradient for 6 ft high levee,
Case (b), is approximately 0.14 in both segments (see Figure A.17). Note that this
value is lower than the allowable gradient. Typically, the allowable hydraulic exit
gradient is considered as 0.2, but it can be as much as 0.5 (Reference 8).
The fill material and soft soil along the Segments are estimated to possess hydraulic exit
gradient within an acceptable range. This must be confirmed following the subsequent
geotechnical investigation. If it is intended to reduce the quantity of flow through the
foundation, some seepage control methods such as sheetpile cutoff should be evaluated and
utilized.
Note that the estimated flow and exit hydraulic gradient values depend on the assumed
permeability of embankment and subsurface soils. However, it is likely that nominal seepage
control measures such as a toe drain may be sufficient to handle the flow through/under the
proposed levee. Based on the estimated seepage flow, seepage flow will not likely exist
through the embankment slope for steady seepage case. However, it is recommended that
nominal slope protection measures such as vegetative cover (top soil/grass) be provided for
both upstream and downstream slopes and the base as required.
Slope Stability Analyses
A summary of the calculated factors of safety and the corresponding required minimum
factors of safety for 12 feet high (Case (a)) and 6 ft high (Case (b)) levees are given in
Table A.2 and Table A.3, respectively. The output slope stability slip surfaces and seepage
contours also shown in Figures A.1 through A.12 for Case (a) and Figures A.13 through
A.17 for Case (b). As seen from the results, case (a) levee is not stable even with a layer of
high strength geotextile reinforcement at the foundation interface. The calculated factors of
safety satisfied the minimum required values for Case (b) levee which is 6 ft high levee
underlain by 4 ft thick structural fill or inspected existing fill. Note that, for the End of
Construction case, results are presented only for the downstream slope as the upstream slope
is identical (both are 1V:3H) to the downstream slope.

SEEPAGE & SLOPE STABILITY ANALYSES PASSAIC RIVER FLOOD RISK MANAGEMENT PROJECT TIDAL AREAS IN HARRISON, KEARNEY, AND NEWARK, NJ
SUBJECT : Levee Seepage & Slope Stability Analysis JOB NO. : 60442748 BY: MS DATE : 01/12/16 CHKD. BY: SK DATE: 02/01/16 SHEET 5 OF 5 I:\Projects\60442748(Passaic-River)\Report\Attachment_A_PDFs\Passaic-River Flood Protection Study-Attachment_A.doc AECOM
Table A.2: Summary of Slope Stability and Seepage Analyses Results for Case (a)
Levee (12 ft high)
Req. Minimum Estimated Flow Rate Exit Gradient
ft3/sec/ft
End of Construction Levee Without Fabric Downstream 1.3 1.0
Seismic Loading Levee Without Fabric Downstream 1.0 0.9
Steady Seepage with Full Flood Stage Levee Without Fabric Downstream 1.4 1.0 1.564E-05 0.21
Rapid Drawdown from the Full Flood Levee Without Fabric Upstream 1.0 1.0
End of Construction Levee With Fabric Downstream 1.3 1.1
End of Construction Levee Without Fabric Downstream 1.3 1.0
Seismic Loading Levee Without Fabric Downstream 1.0 0.9
Steady Seepage with Full Flood Stage Levee Without Fabric Downstream 1.4 1.0 1.645E-05 0.20
Rapid Drawdown from the Full Flood Levee Without Fabric Upstream 1.0 1.0
End of Construction Levee With Fabric Downstream 1.3 1.0
Steady-State Seepage
East Kearny
West Kearny,
Newark,
Harrison
Analyzed
SlopeCaseDesign ConditionLocation
Factor of Safety (FOS)
Table A.3: Summary of Slope Stability and Seepage Analyses Results for Case (b)
Levee (6 ft high)
Req. Minimum Estimated Value Flow Rate Exit Gradient
ft3/sec/ft
End of Construction Levee With 4ft thick fill Downstream 1.3 2.0
Seismic Loading Levee With 4ft thick fill Downstream 1.0 1.1
Steady Seepage with Full Flood Levee With 4ft thick fill Downstream 1.4 1.4 1.077E-05 0.14
Rapid Drawdown from the Full Levee With 4ft thick fill Upstream 1.0 1.3
* 4 ft thick existing fill material will be excavated and replaced with imported fill (The fill properties assumed in the analysis are provided in Table A.1).
Steady-State Seepage
All
Segments
Analyzed
SlopeCase*Design ConditionLocation
Factor of Safety (FOS)
REFERENCES
EM 1110-2-1913, 2000. “Design and Construction of Levees”, US Army Corps of
Engineers.
ETL 1110-2-569, “Design Guidance for Levee Underseepage”, US Army Corps of
Engineers.
GEOSTUDIO 2007 with Slope/W and Seep/W package.
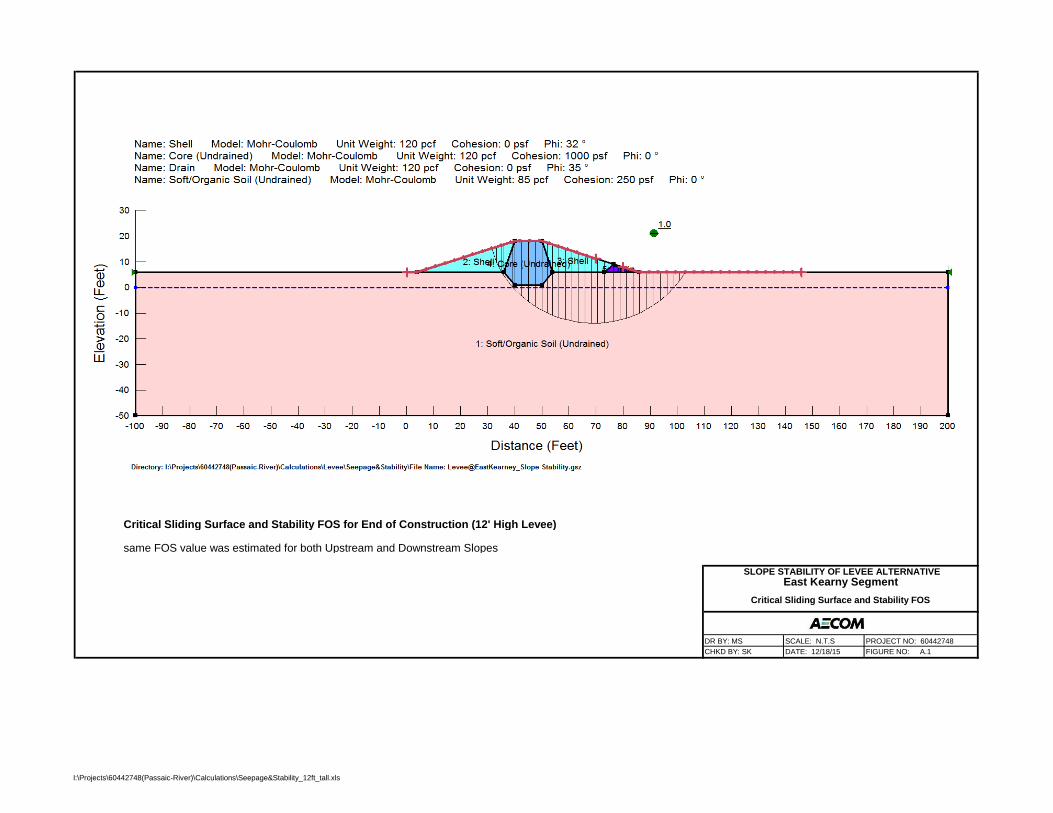
Critical Sliding Surface and Stability FOS for End of Construction (12' High Levee)
same FOS value was estimated for both Upstream and Downstream Slopes
DR BY: MS SCALE: N.T.S PROJECT NO: 60442748
CHKD BY: SK DATE: 12/18/15 FIGURE NO: A.1
SLOPE STABILITY OF LEVEE ALTERNATIVEEast Kearny Segment
Critical Sliding Surface and Stability FOS
I:\Projects\60442748(Passaic-River)\Calculations\Seepage&Stability_12ft_tall.xls
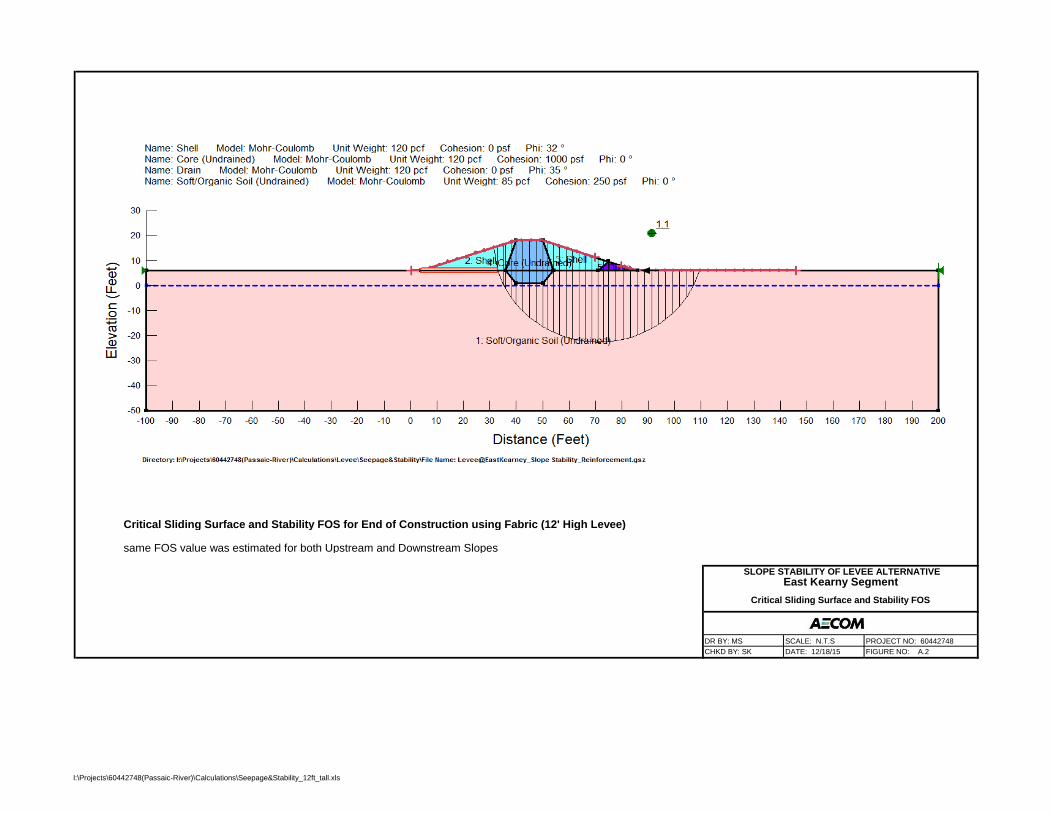
Critical Sliding Surface and Stability FOS for End of Construction using Fabric (12' High Levee)
same FOS value was estimated for both Upstream and Downstream Slopes
DR BY: MS SCALE: N.T.S PROJECT NO: 60442748
CHKD BY: SK DATE: 12/18/15 FIGURE NO: A.2
SLOPE STABILITY OF LEVEE ALTERNATIVEEast Kearny Segment
Critical Sliding Surface and Stability FOS
I:\Projects\60442748(Passaic-River)\Calculations\Seepage&Stability_12ft_tall.xls

Critical Sliding Surface and Stability FOS for Steady Seepage (12' High Levee)
Steady Seepage with Full Flood Pool (El. +16 Feet)
DR BY: MS SCALE: N.T.S PROJECT NO: 60442748
CHKD BY: SK DATE: 12/18/15 FIGURE NO: A.3
SLOPE STABILITY OF LEVEE ALTERNATIVEEast Kearny Segment
Critical Sliding Surface and Stability FOS
I:\Projects\60442748(Passaic-River)\Calculations\Seepage&Stability_12ft_tall.xls

Critical Sliding Surface and Stability FOS for Rapid Drawdown (12' High Levee)
Rapid Drawdown from the Full Flood Stage
DR BY: MS SCALE: N.T.S PROJECT NO: 60442748
CHKD BY: SK DATE: 12/18/15 FIGURE NO: A.4
SLOPE STABILITY OF LEVEE ALTERNATIVEEast Kearny Segment
Critical Sliding Surface and Stability FOS
I:\Projects\60442748(Passaic-River)\Calculations\Seepage&Stability_12ft_tall.xls

Critical Sliding Surface and Stability FOS for Seismic Condition (12' High Levee)
Seismic Loading (Pseudo-Static Coefficient of 0.21)
DR BY: MS SCALE: N.T.S PROJECT NO: 60442748
CHKD BY: SK DATE: 12/18/15 FIGURE NO: A.5
SLOPE STABILITY OF LEVEE ALTERNATIVEEast Kearny Segment
Critical Sliding Surface and Stability FOS
I:\Projects\60442748(Passaic-River)\Calculations\Seepage&Stability_12ft_tall.xls

Steady-State Seepage with Flood Pool at El. 16 ft (12' High Levee)
DR BY: MS SCALE: N.T.S PROJECT NO: 60442748
CHKD BY: SK DATE: 12/18/15 FIGURE NO: A.6
SEEPAGE ANALYSIS OF LEVEE ALTERNATIVEEast Kearny Segment
Estimated Piezometric Conditions, Flow Rate, and Exit
Gradient
I:\Projects\60442748(Passaic-River)\Calculations\Seepage&Stability_12ft_tall.xls
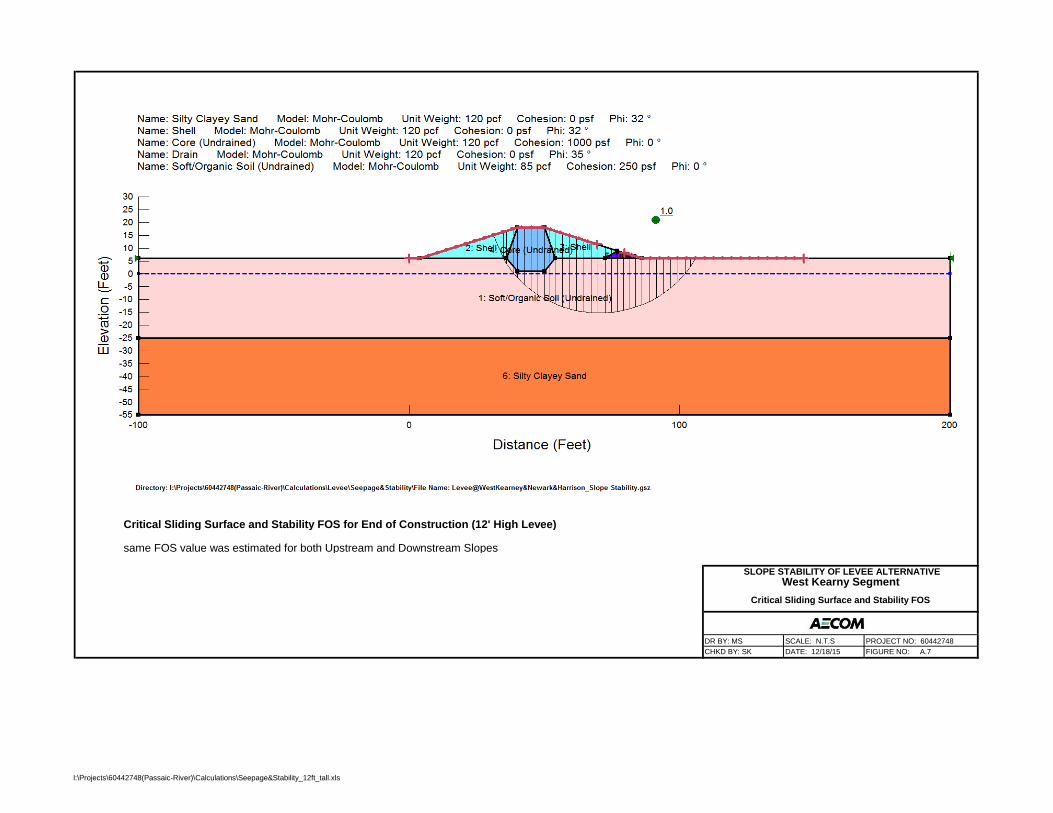
Critical Sliding Surface and Stability FOS for End of Construction (12' High Levee)
same FOS value was estimated for both Upstream and Downstream Slopes
DR BY: MS SCALE: N.T.S PROJECT NO: 60442748
CHKD BY: SK DATE: 12/18/15 FIGURE NO: A.7
SLOPE STABILITY OF LEVEE ALTERNATIVEWest Kearny Segment
Critical Sliding Surface and Stability FOS
I:\Projects\60442748(Passaic-River)\Calculations\Seepage&Stability_12ft_tall.xls
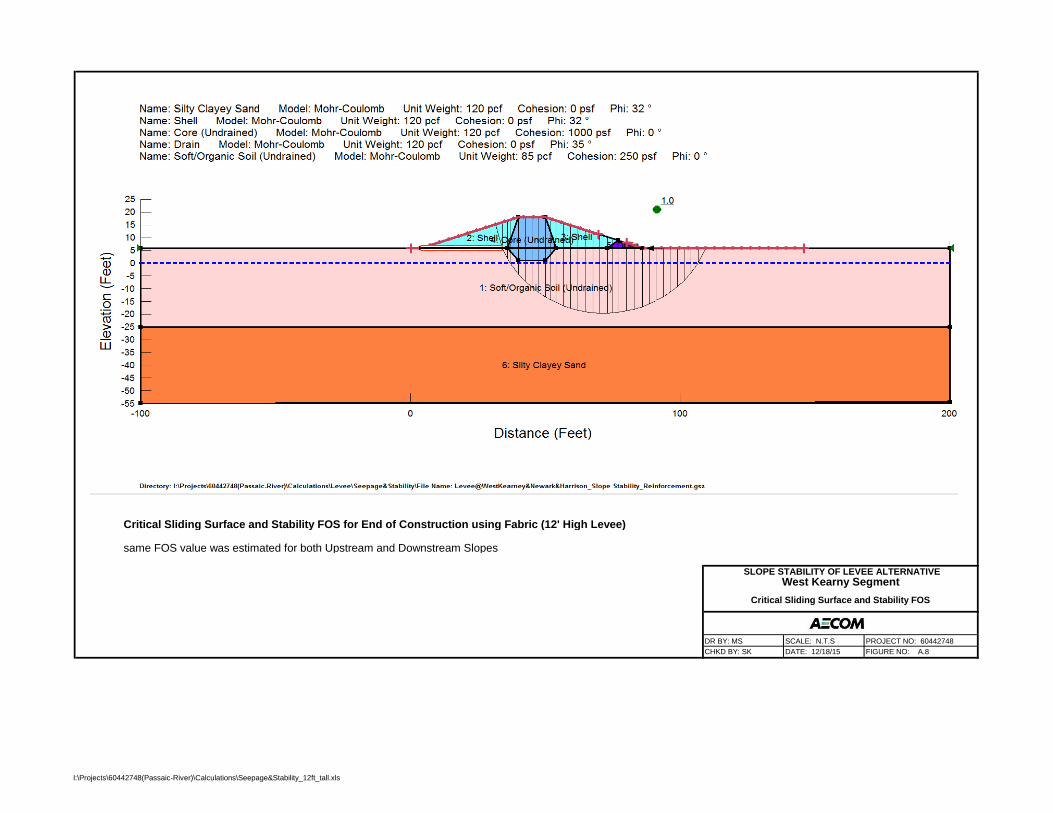
Critical Sliding Surface and Stability FOS for End of Construction using Fabric (12' High Levee)
same FOS value was estimated for both Upstream and Downstream Slopes
DR BY: MS SCALE: N.T.S PROJECT NO: 60442748
CHKD BY: SK DATE: 12/18/15 FIGURE NO: A.8
SLOPE STABILITY OF LEVEE ALTERNATIVEWest Kearny Segment
Critical Sliding Surface and Stability FOS
I:\Projects\60442748(Passaic-River)\Calculations\Seepage&Stability_12ft_tall.xls
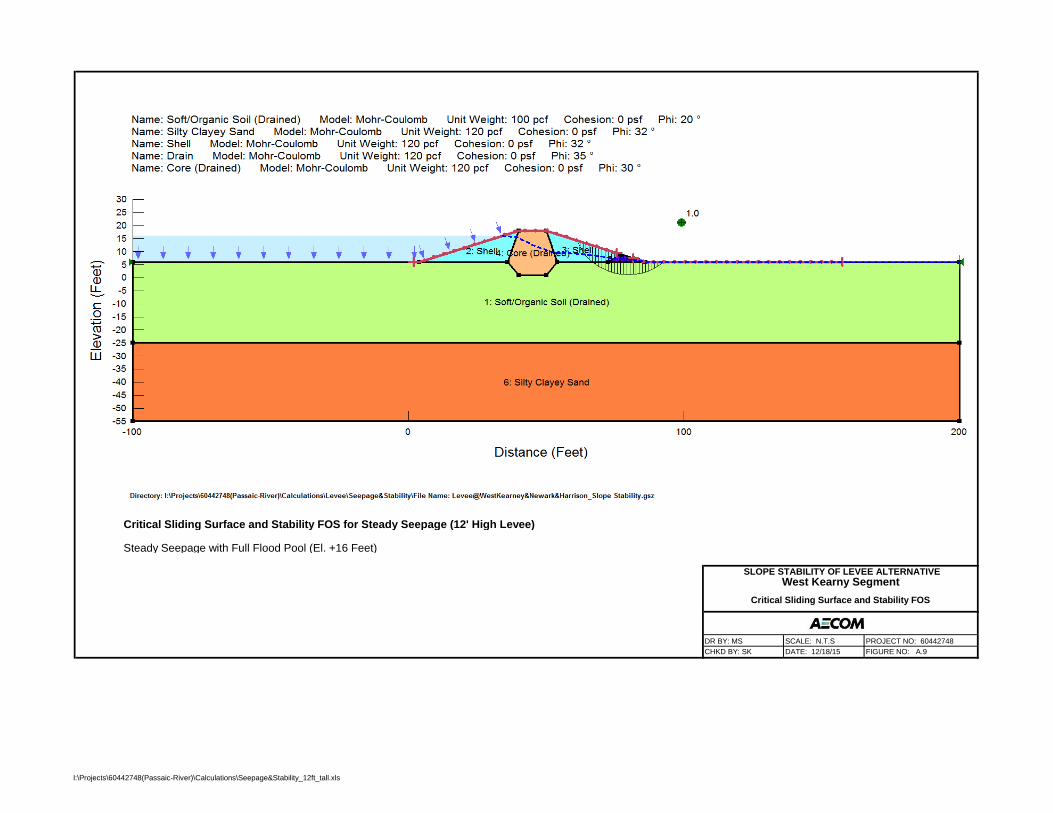
Critical Sliding Surface and Stability FOS for Steady Seepage (12' High Levee)
Steady Seepage with Full Flood Pool (El. +16 Feet)
DR BY: MS SCALE: N.T.S PROJECT NO: 60442748
CHKD BY: SK DATE: 12/18/15 FIGURE NO: A.9
SLOPE STABILITY OF LEVEE ALTERNATIVEWest Kearny Segment
Critical Sliding Surface and Stability FOS
I:\Projects\60442748(Passaic-River)\Calculations\Seepage&Stability_12ft_tall.xls

Critical Sliding Surface and Stability FOS for Rapid Drawdown (12' High Levee)
Rapid Drawdown from the Full Flood Stage
DR BY: MS SCALE: N.T.S PROJECT NO: 60442748
CHKD BY: SK DATE: 12/18/15 FIGURE NO: A.10
SLOPE STABILITY OF LEVEE ALTERNATIVEWest Kearny Segment
Critical Sliding Surface and Stability FOS
I:\Projects\60442748(Passaic-River)\Calculations\Seepage&Stability_12ft_tall.xls
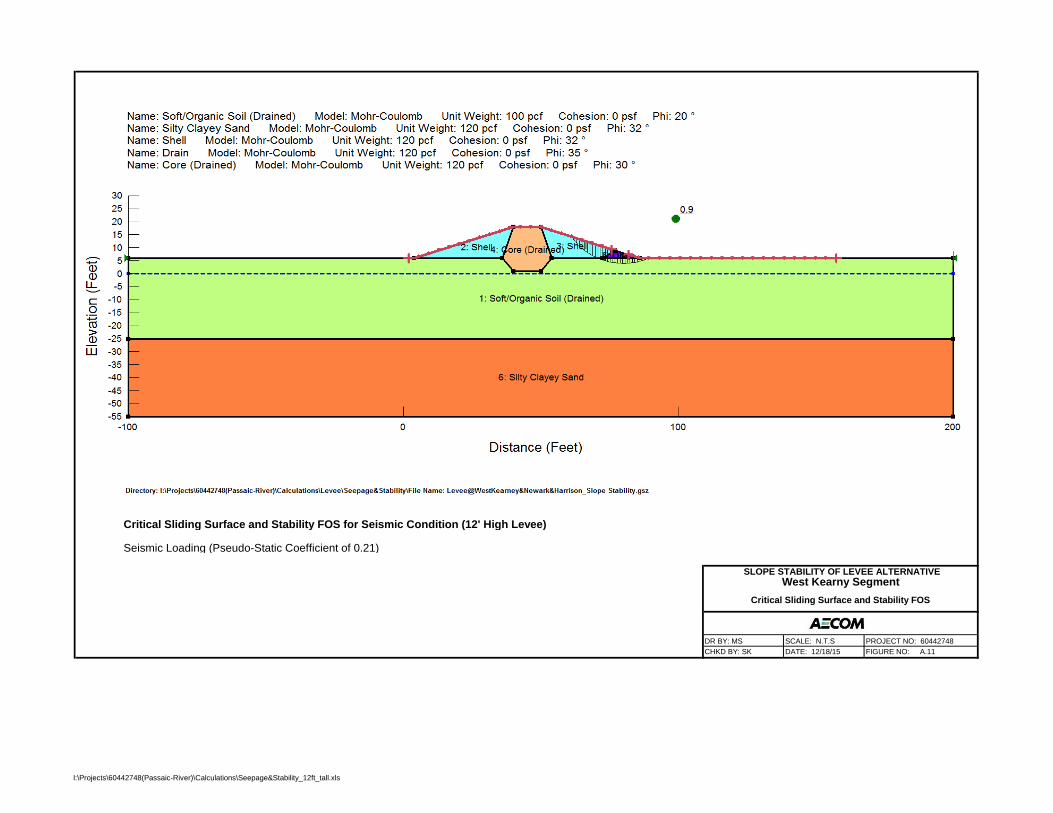
Critical Sliding Surface and Stability FOS for Seismic Condition (12' High Levee)
Seismic Loading (Pseudo-Static Coefficient of 0.21)
DR BY: MS SCALE: N.T.S PROJECT NO: 60442748
CHKD BY: SK DATE: 12/18/15 FIGURE NO: A.11
SLOPE STABILITY OF LEVEE ALTERNATIVEWest Kearny Segment
Critical Sliding Surface and Stability FOS
I:\Projects\60442748(Passaic-River)\Calculations\Seepage&Stability_12ft_tall.xls
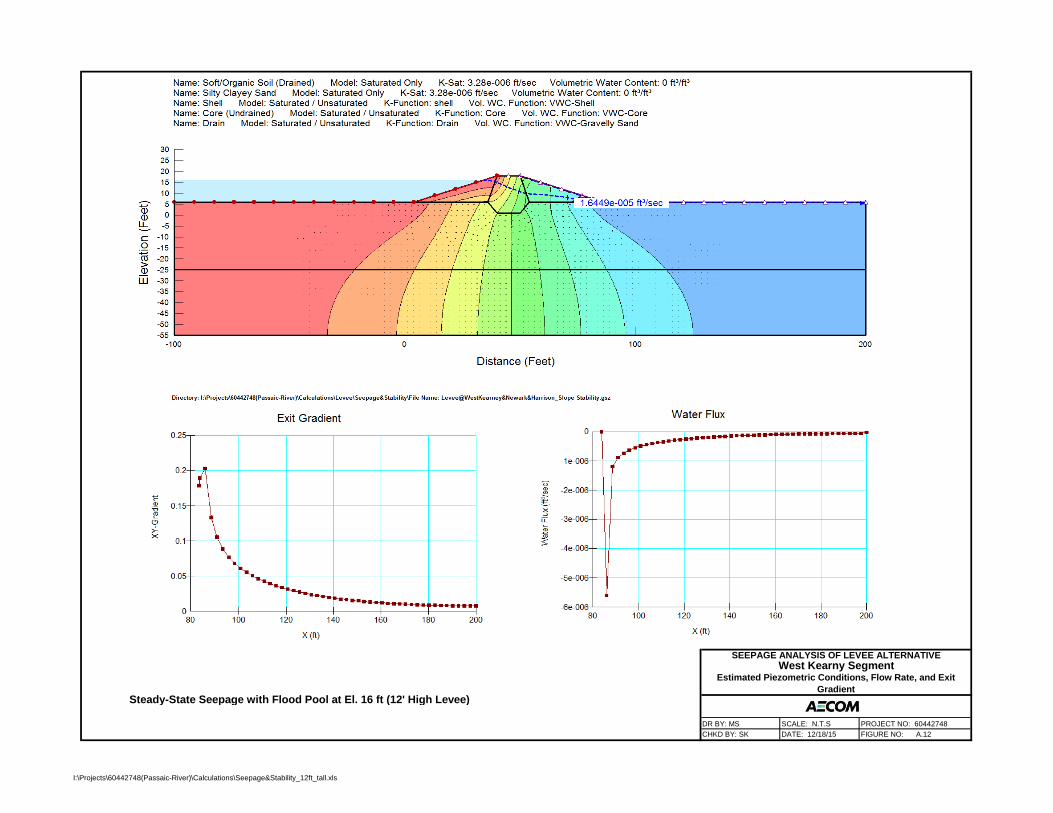
Steady-State Seepage with Flood Pool at El. 16 ft (12' High Levee)
DR BY: MS SCALE: N.T.S PROJECT NO: 60442748
CHKD BY: SK DATE: 12/18/15 FIGURE NO: A.12
SEEPAGE ANALYSIS OF LEVEE ALTERNATIVEWest Kearny Segment
Estimated Piezometric Conditions, Flow Rate, and Exit
Gradient
I:\Projects\60442748(Passaic-River)\Calculations\Seepage&Stability_12ft_tall.xls
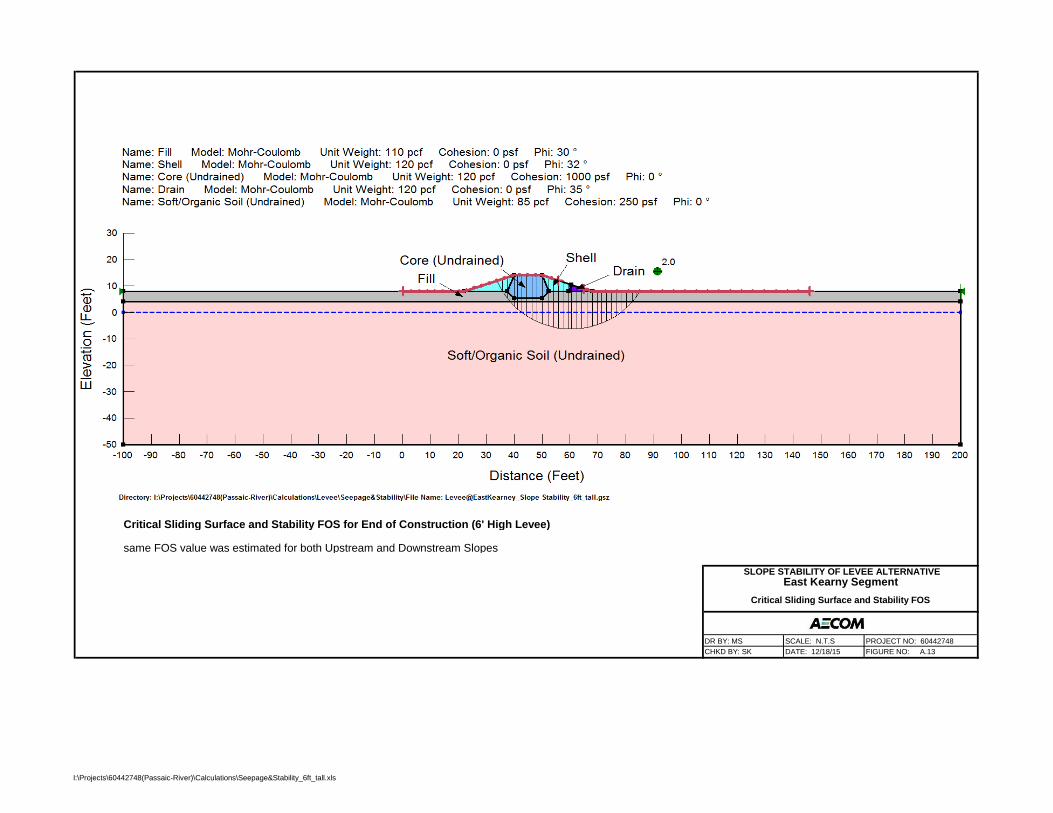
Critical Sliding Surface and Stability FOS for End of Construction (6' High Levee)
same FOS value was estimated for both Upstream and Downstream Slopes
DR BY: MS SCALE: N.T.S PROJECT NO: 60442748
CHKD BY: SK DATE: 12/18/15 FIGURE NO: A.13
SLOPE STABILITY OF LEVEE ALTERNATIVEEast Kearny Segment
Critical Sliding Surface and Stability FOS
I:\Projects\60442748(Passaic-River)\Calculations\Seepage&Stability_6ft_tall.xls

Critical Sliding Surface and Stability FOS for Steady Seepage (6' High Levee)
Steady Seepage with Full Flood Pool (El. +16 Feet)
DR BY: MS SCALE: N.T.S PROJECT NO: 60442748
CHKD BY: SK DATE: 12/18/15 FIGURE NO: A.14
SLOPE STABILITY OF LEVEE ALTERNATIVEEast Kearny Segment
Critical Sliding Surface and Stability FOS
I:\Projects\60442748(Passaic-River)\Calculations\Seepage&Stability_6ft_tall.xls

Critical Sliding Surface and Stability FOS for Rapid Drawdown (6' High Levee)
Rapid Drawdown from the Full Flood Stage
DR BY: MS SCALE: N.T.S PROJECT NO: 60442748
CHKD BY: SK DATE: 12/18/15 FIGURE NO: A.15
SLOPE STABILITY OF LEVEE ALTERNATIVEEast Kearny Segment
Critical Sliding Surface and Stability FOS
I:\Projects\60442748(Passaic-River)\Calculations\Seepage&Stability_6ft_tall.xls
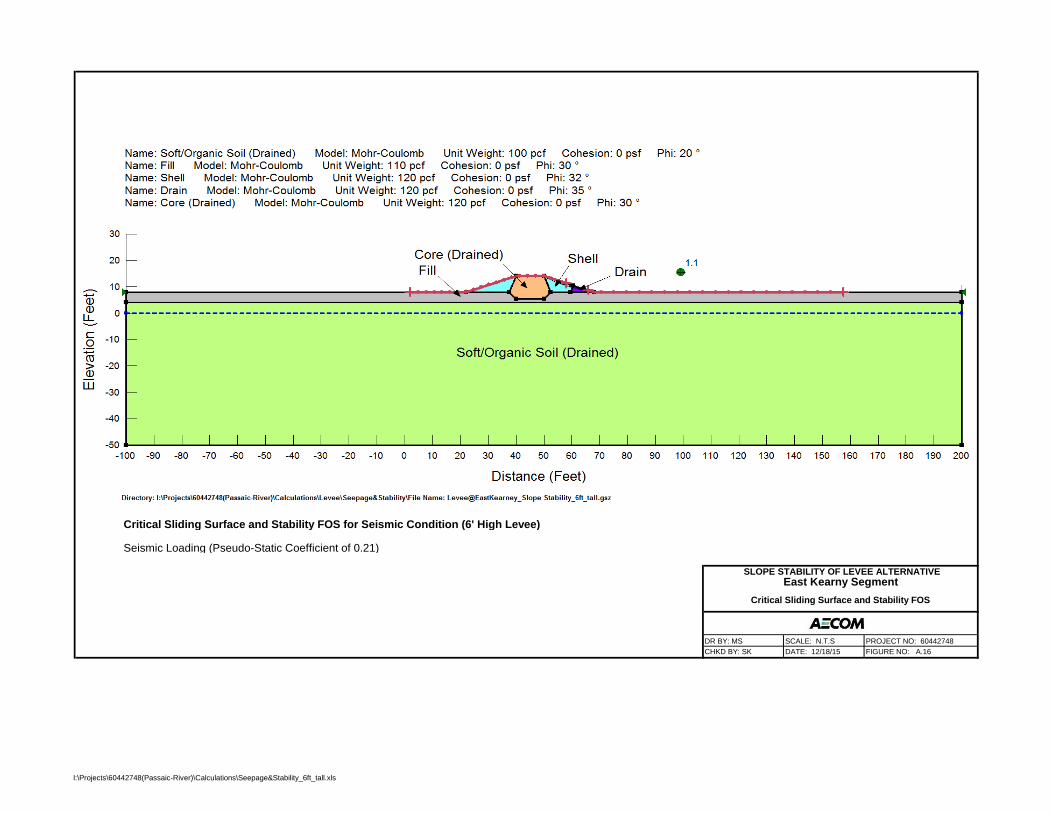
Critical Sliding Surface and Stability FOS for Seismic Condition (6' High Levee)
Seismic Loading (Pseudo-Static Coefficient of 0.21)
DR BY: MS SCALE: N.T.S PROJECT NO: 60442748
CHKD BY: SK DATE: 12/18/15 FIGURE NO: A.16
SLOPE STABILITY OF LEVEE ALTERNATIVEEast Kearny Segment
Critical Sliding Surface and Stability FOS
I:\Projects\60442748(Passaic-River)\Calculations\Seepage&Stability_6ft_tall.xls

Steady-State Seepage with Flood Pool at El. 13 ft (6' High Levee)
DR BY: MS SCALE: N.T.S PROJECT NO: 60442748
CHKD BY: SK DATE: 12/18/15 FIGURE NO: A.17
SEEPAGE ANALYSIS OF LEVEE ALTERNATIVEEast Kearny Segment
Estimated Piezometric Conditions, Flow Rate, and Exit
Gradient
I:\Projects\60442748(Passaic-River)\Calculations\Seepage&Stability_6ft_tall.xls
LIQUEFACTION EVALUATION PASSAIC RIVER FLOOD RISK MANAGEMENT PROJECT TIDAL AREAS IN HARRISON, KEARNY, AND NEWARK, NJ
SUBJECT : Liquefaction Evaluation JOB NO. :_ 60442748
BY : AH DATE : 1/25/16 CHKD. BY: _SK_ DATE: _02/01/2016_ SHEET 1 OF 3 I:\Projects\60442748(Passaic-River)\Calculations\Levee\Liquefaction\Liquefaction Resistance Calculation Package.doc AECOM
Attachment B
LIQUEFACTION EVALUATION
LIQUEFACTION EVALUATION PASSAIC RIVER FLOOD RISK MANAGEMENT PROJECT TIDAL AREAS IN HARRISON, KEARNY, AND NEWARK, NJ
SUBJECT : Liquefaction Evaluation JOB NO. :_ 60442748
BY : AH DATE : 1/25/16 CHKD. BY: _SK_ DATE: _02/01/2016_ SHEET 2 OF 3 I:\Projects\60442748(Passaic-River)\Calculations\Levee\Liquefaction\Liquefaction Resistance Calculation Package.doc AECOM
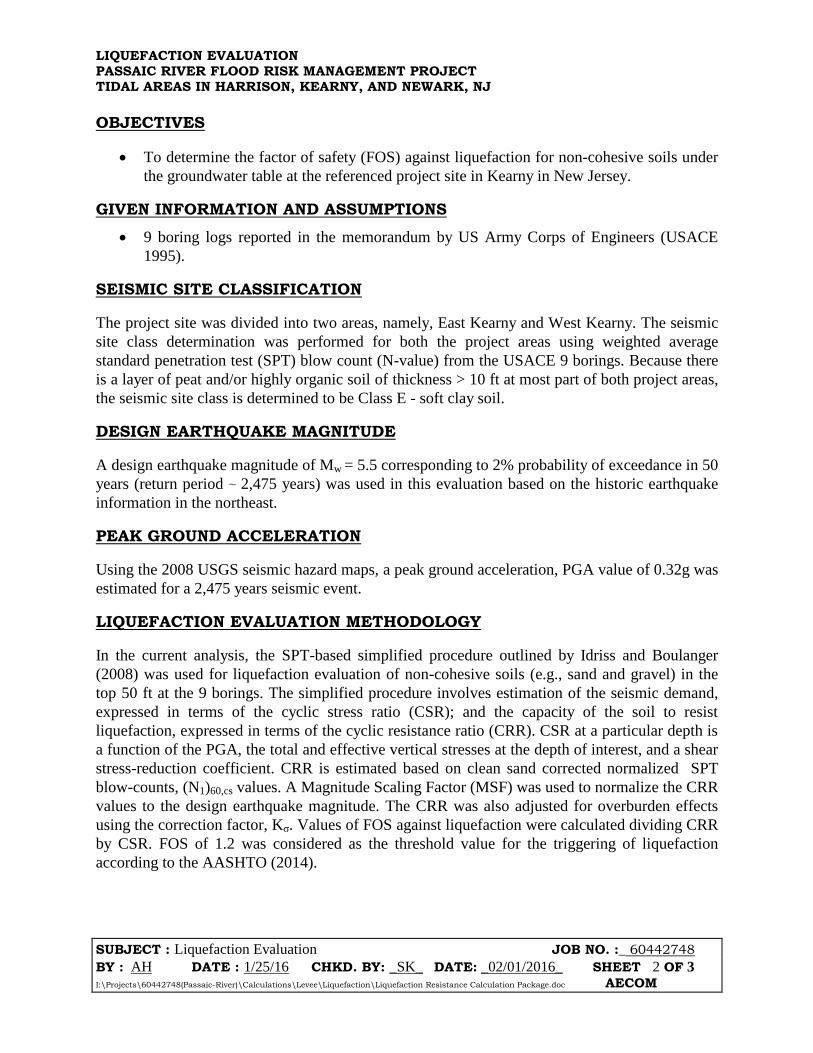
OBJECTIVES
To determine the factor of safety (FOS) against liquefaction for non-cohesive soils under
the groundwater table at the referenced project site in Kearny in New Jersey.
GIVEN INFORMATION AND ASSUMPTIONS
9 boring logs reported in the memorandum by US Army Corps of Engineers (USACE
1995).
SEISMIC SITE CLASSIFICATION
The project site was divided into two areas, namely, East Kearny and West Kearny. The seismic
site class determination was performed for both the project areas using weighted average
standard penetration test (SPT) blow count (N-value) from the USACE 9 borings. Because there
is a layer of peat and/or highly organic soil of thickness > 10 ft at most part of both project areas,
the seismic site class is determined to be Class E - soft clay soil.
DESIGN EARTHQUAKE MAGNITUDE
A design earthquake magnitude of Mw = 5.5 corresponding to 2% probability of exceedance in 50
years (return period ~ 2,475 years) was used in this evaluation based on the historic earthquake
information in the northeast.
PEAK GROUND ACCELERATION
Using the 2008 USGS seismic hazard maps, a peak ground acceleration, PGA value of 0.32g was
estimated for a 2,475 years seismic event.
LIQUEFACTION EVALUATION METHODOLOGY
In the current analysis, the SPT-based simplified procedure outlined by Idriss and Boulanger
(2008) was used for liquefaction evaluation of non-cohesive soils (e.g., sand and gravel) in the
top 50 ft at the 9 borings. The simplified procedure involves estimation of the seismic demand,
expressed in terms of the cyclic stress ratio (CSR); and the capacity of the soil to resist
liquefaction, expressed in terms of the cyclic resistance ratio (CRR). CSR at a particular depth is
a function of the PGA, the total and effective vertical stresses at the depth of interest, and a shear
stress-reduction coefficient. CRR is estimated based on clean sand corrected normalized SPT
blow-counts, (N1)60,cs values. A Magnitude Scaling Factor (MSF) was used to normalize the CRR
values to the design earthquake magnitude. The CRR was also adjusted for overburden effects
using the correction factor, Kσ. Values of FOS against liquefaction were calculated dividing CRR
by CSR. FOS of 1.2 was considered as the threshold value for the triggering of liquefaction
according to the AASHTO (2014).

LIQUEFACTION EVALUATION PASSAIC RIVER FLOOD RISK MANAGEMENT PROJECT TIDAL AREAS IN HARRISON, KEARNY, AND NEWARK, NJ
SUBJECT : Liquefaction Evaluation JOB NO. :_ 60442748
BY : AH DATE : 1/25/16 CHKD. BY: _SK_ DATE: _02/01/2016_ SHEET 3 OF 3 I:\Projects\60442748(Passaic-River)\Calculations\Levee\Liquefaction\Liquefaction Resistance Calculation Package.doc AECOM
RESULTS
Based on the liquefaction evaluation, occasional pockets of potentially liquefiable soils exists in
the area of Blocks 1, 9, 10, 11, 14 and 17 shown in Figure 1. The thickness of liquefiable soil
pockets ranges from approximately 2 ft at Block 17 to 7 ft at Block 14.
REFERENCES
1. US Army Corps of Engineers (1995). “General design memorandum: Passaic River flood
damage reduction project”. New York.
2. Das, B. M. (2006). Principles of geotechnical engineering, Nelson, Ontario, Canada, 686
p.
3. Idriss, I. M., & Boulanger, R. W. (2008). Soil liquefaction during earthquakes.
Earthquake engineering research institute.
4. “AASHTO LRFD Bridge Design Specifications”, 7th ed., American Association of State
Highway and Transportation Officials, dated 2014.
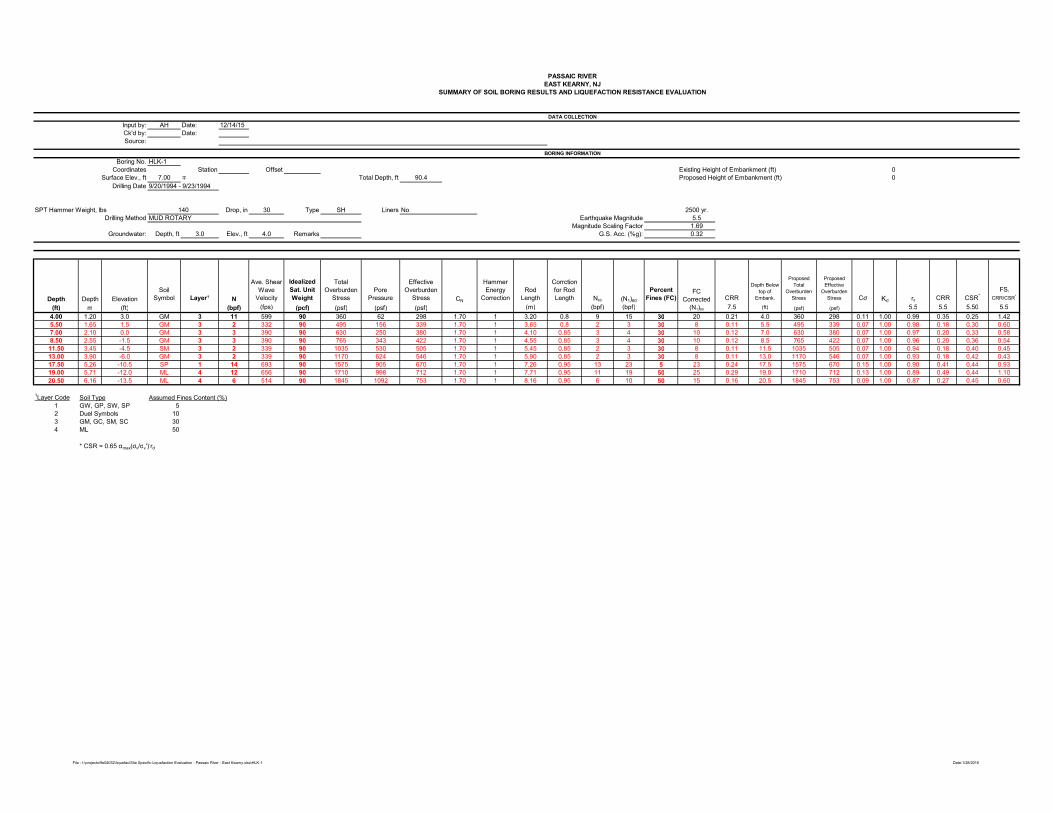
PASSAIC RIVER
EAST KEARNY, NJ
SUMMARY OF SOIL BORING RESULTS AND LIQUEFACTION RESISTANCE EVALUATION
DATA COLLECTION
Input by: AH Date: 12/14/15
Ck'd by: Date:
Source:
BORING INFORMATION
Boring No. HLK-1
Coordinates Station Offset Existing Height of Embankment (ft) 0
Surface Elev., ft 7.00 ∓ Total Depth, ft 90.4 Proposed Height of Embankment (ft) 0
Drilling Date
SPT Hammer Weight, lbs 140 Drop, in 30 Type SH Liners No 2500 yr.
Drilling Method MUD ROTARY Earthquake Magnitude 5.5
Magnitude Scaling Factor 1.69
Groundwater: Depth, ft 3.0 Elev., ft 4.0 Remarks G.S. Acc. (%g): 0.32
Depth Depth Elevation
Soil
Symbol Layer¹ N
Ave. Shear
Wave
Velocity
Idealized
Sat. Unit
Weight
Total
Overburden
Stress
Pore
Pressure
Effective
Overburden
Stress CN
Hammer
Energy
Correction
Rod
Length
Corrction
for Rod
Length N60 (N1)60
Percent
Fines (FC) CRR
Depth Below
top of
Embank.
Proposed
Total
Overburden
Stress
Proposed
Effective
Overburden
Stress Cσ Kσ rd CRR CSR*
FSl
CRR/CSR*
(ft) m (ft) (bpf) (fps) (pcf) (psf) (psf) (psf) (m) (bpf) (bpf) 7.5 (ft) (psf) (psf) 5.5 5.5 5.50 5.5
4.00 1.20 3.0 GM 3 11 599 90 360 62 298 1.70 1 3.20 0.8 9 15 30 20 0.21 4.0 360 298 0.11 1.00 0.99 0.35 0.25 1.42
5.50 1.65 1.5 GM 3 2 332 90 495 156 339 1.70 1 3.65 0.8 2 3 30 8 0.11 5.5 495 339 0.07 1.00 0.98 0.18 0.30 0.60
7.00 2.10 0.0 GM 3 3 390 90 630 250 380 1.70 1 4.10 0.85 3 4 30 10 0.12 7.0 630 380 0.07 1.00 0.97 0.20 0.33 0.58
8.50 2.55 -1.5 GM 3 3 390 90 765 343 422 1.70 1 4.55 0.85 3 4 30 10 0.12 8.5 765 422 0.07 1.00 0.96 0.20 0.36 0.54
11.50 3.45 -4.5 SM 3 2 339 90 1035 530 505 1.70 1 5.45 0.85 2 3 30 8 0.11 11.5 1035 505 0.07 1.00 0.94 0.18 0.40 0.45
13.00 3.90 -6.0 GM 3 2 339 90 1170 624 546 1.70 1 5.90 0.85 2 3 30 8 0.11 13.0 1170 546 0.07 1.00 0.93 0.18 0.42 0.43
17.50 5.26 -10.5 SP 1 14 693 90 1575 905 670 1.70 1 7.26 0.95 13 23 5 23 0.24 17.5 1575 670 0.15 1.00 0.90 0.41 0.44 0.93
19.00 5.71 -12.0 ML 4 12 656 90 1710 998 712 1.70 1 7.71 0.95 11 19 50 25 0.29 19.0 1710 712 0.13 1.00 0.89 0.49 0.44 1.10
20.50 6.16 -13.5 ML 4 6 514 90 1845 1092 753 1.70 1 8.16 0.95 6 10 50 15 0.16 20.5 1845 753 0.09 1.00 0.87 0.27 0.45 0.60
1Layer Code Soil Type Assumed Fines Content (%)
1 GW, GP, SW, SP 5
2 Duel Symbols 10
3 GM, GC, SM, SC 30
4 ML 50
* CSR = 0.65 αmax(σv/σv').rd
9/20/1994 - 9/23/1994
FC
Corrected
(N1)60
File : I:\projects\9e04032\liquefac\Site Specific Liquefaction Evaluation - Passaic River - East Kearny.xlsx\HLK-1 Date:1/28/2016

PASSAIC RIVER
WEST KEARNY, NJ
SUMMARY OF SOIL BORING RESULTS AND LIQUEFACTION RESISTANCE EVALUATION
DATA COLLECTION
Input by: AH Date: 12/14/15
Ck'd by: Date:
Source:
BORING INFORMATION
Boring No. HLK-2
Coordinates Station Offset Existing Height of Embankment (ft) 0
Surface Elev., ft 8.00 ∓ Total Depth, ft 101.5 Proposed Height of Embankment (ft) 0
Drilling Date
SPT Hammer Weight, lbs 140 Drop, in 30 Type SH Liners No 2500 yr.
Drilling Method MUD ROTARY Earthquake Magnitude 5.5
Magnitude Scaling Factor 1.69
Groundwater: Depth, ft 6.0 Elev., ft 2.0 Remarks G.S. Acc. (%g): 0.32
Depth Depth Elevation
Soil
Symbol Layer¹ N
Ave. Shear
Wave
Velocity
Idealized
Sat. Unit
Weight
Total
Overburden
Stress
Pore
Pressure
Effective
Overburden
Stress CN
Hammer
Energy
Correction
Rod
Length
Corrction
for Rod
Length N60 (N1)60
Percent
Fines (FC) CRR
Depth Below
top of
Embank.
Proposed
Total
Overburden
Stress
Proposed
Effective
Overburden
Stress Cσ Kσ rd CRR CSR*
FSl
CRR/CSR*
(ft) m (ft) (bpf) (fps) (pcf) (psf) (psf) (psf) (m) (bpf) (bpf) 7.5 (ft) (psf) (psf) 5.5 5.5 5.50 5.5
7.00 2.10 1.0 ML 4 30 874 90 630 62 568 1.69 1 4.10 0.85 26 43 50 49 0.60 7.0 630 568 0.30 1.00 0.97 0.60 0.22 2.68
10.00 3.00 -2.0 SM 3 6 495 90 900 250 650 1.70 1 5.00 0.85 5 9 30 14 0.15 10.0 900 650 0.09 1.00 0.95 0.25 0.27 0.91
11.50 3.45 -3.5 GM 3 2 339 90 1035 343 692 1.70 1 5.45 0.85 2 3 30 8 0.11 11.5 1035 692 0.07 1.00 0.94 0.18 0.29 0.61
14.50 4.35 -6.5 SM-SP 2 19 773 90 1305 530 775 1.59 1 6.35 0.95 18 29 10 30 0.47 14.5 1305 775 0.19 1.00 0.92 0.79 0.32 2.46
16.00 4.80 -8.0 SM-SP 2 17 742 90 1440 624 816 1.57 1 6.80 0.95 16 25 10 27 0.33 16.0 1440 816 0.17 1.00 0.91 0.56 0.33 1.68
17.50 5.26 -9.5 SM-SP 2 16 727 90 1575 718 857 1.55 1 7.26 0.95 15 24 10 25 0.28 17.5 1575 857 0.15 1.00 0.90 0.48 0.34 1.39
23.50 7.06 -15.5 SM-SP 2 19 773 90 2115 1092 1023 1.40 1 9.06 0.95 18 25 10 26 0.33 23.5 2115 1023 0.16 1.00 0.85 0.55 0.37 1.50
25.00 7.51 -17.0 SM-SP 2 22 814 90 2250 1186 1064 1.35 1 9.51 0.95 21 28 10 29 0.44 25.0 2250 1064 0.19 1.00 0.84 0.75 0.37 2.04
26.50 7.96 -18.5 SM-SP 2 19 773 90 2385 1279 1106 1.35 1 9.96 0.95 18 24 10 25 0.30 26.5 2385 1106 0.16 1.00 0.83 0.51 0.37 1.37
28.00 8.41 -20.0 SM-SP 2 17 756 90 2520 1373 1147 1.33 1 10.41 1 17 23 10 24 0.26 28.0 2520 1147 0.15 1.00 0.81 0.45 0.37 1.20
29.50 8.86 -21.5 SM-SP 2 10 627 90 2655 1466 1189 1.37 1 10.86 1 10 14 10 15 0.15 29.5 2655 1189 0.11 1.00 0.80 0.26 0.37 0.70
1Layer Code Soil Type Assumed Fines Content (%)
1 GW, GP, SW, SP 5
2 Duel Symbols 10
3 GM, GC, SM, SC 30
4 ML 50
* CSR = 0.65 αmax(σv/σv').rd
FC
Corrected
(N1)60
12/5/1994 - 12/7/1994
File : I:\projects\9e04032\liquefac\Site Specific Liquefaction Evaluation - Passaic River - West Kearny.xlsx\HLK-2 Date:1/28/2016

PASSAIC RIVER
WEST KEARNY, NJ
SUMMARY OF SOIL BORING RESULTS AND LIQUEFACTION RESISTANCE EVALUATION
DATA COLLECTION
Input by: AH Date: 12/14/15
Ck'd by: Date:
Source:
BORING INFORMATION
Boring No. HLK-3
Coordinates Station Offset Existing Height of Embankment (ft) 0
Surface Elev., ft 7.00 ∓ Total Depth, ft 70.2 Proposed Height of Embankment (ft) 0
Drilling Date
SPT Hammer Weight, lbs 140 Drop, in 30 Type SH Liners No 2500 yr.
Drilling Method MUD ROTARY Earthquake Magnitude 5.5
Magnitude Scaling Factor 1.69
Groundwater: Depth, ft 6.0 Elev., ft 1.0 Remarks G.S. Acc. (%g): 0.32
Depth Depth Elevation
Soil
Symbol Layer¹ N
Ave. Shear
Wave
Velocity
Idealized
Sat. Unit
Weight
Total
Overburden
Stress
Pore
Pressure
Effective
Overburden
Stress CN
Hammer
Energy
Correction
Rod
Length
Corrction for
Rod Length N60 (N1)60
Percent
Fines (FC) CRR
Depth Below
top of
Embank.
Proposed
Total
Overburden
Stress
Proposed
Effective
Overburden
Stress Cσ Kσ rd CRR CSR*
FSl
CRR/CSR*
(ft) (m) (ft) (bpf) (fps) (pcf) (psf) (psf) (psf) (m) (bpf) (bpf) 7.5 (ft) (psf) (psf) 5.5 5.5 5.50 5.5
7.00 2.10 0.0 GM 3 38 952 90 630 62 568 1.58 1 4.10 0.85 32 51 30 56 0.60 7.0 630 568 0.30 1.00 0.97 0.60 0.22 2.68
10.00 3.00 -3.0 GM 3 15 683 90 900 250 650 1.70 1 5.00 0.85 13 22 30 27 0.35 10.0 900 650 0.14 1.00 0.95 0.59 0.27 2.14
11.50 3.45 -4.5 GM 3 24 807 90 1035 343 692 1.63 1 5.45 0.85 20 33 30 39 0.60 11.5 1035 692 0.24 1.00 0.94 0.60 0.29 2.05
14.50 4.35 -7.5 SM 3 18 758 90 1305 530 775 1.60 1 6.35 0.95 17 27 30 33 0.60 14.5 1305 775 0.18 1.00 0.92 0.60 0.32 1.86
16.00 4.80 -9.0 SM 3 19 773 90 1440 624 816 1.55 1 6.80 0.95 18 28 30 33 0.60 16.0 1440 816 0.18 1.00 0.91 0.60 0.33 1.80
19.00 5.71 -12.0 GM 3 15 710 90 1710 811 899 1.53 1 7.71 0.95 14 22 30 27 0.35 19.0 1710 899 0.14 1.00 0.89 0.59 0.35 1.69
23.50 7.06 -16.5 GM 3 25 852 90 2115 1092 1023 1.35 1 9.06 0.95 24 32 30 37 0.60 23.5 2115 1023 0.22 1.00 0.85 0.60 0.37 1.64
26.50 7.96 -19.5 GM 3 21 801 90 2385 1279 1106 1.33 1 9.96 0.95 20 27 30 32 0.60 26.5 2385 1106 0.17 1.00 0.83 0.60 0.37 1.62
46.00 13.81 -39.0 SM 3 22 829 90 4140 2496 1644 1.11 1 15.81 1 22 25 30 30 0.48 46.0 4140 1644 0.16 1.00 0.67 0.80 0.35 2.30
51.00 15.32 -44.0 SM 3 75 1295 90 4590 2808 1782 1.02 1 17.32 1 75 77 30 82 0.60 51.0 4590 1782 0.30 1.00 0.63 0.60 0.34 1.78
1Layer Code Soil Type Assumed Fines Content (%)
1 GW, GP, SW, SP 5
2 Duel Symbols 10
3 GM, GC, SM, SC 30
4 ML 50
* CSR = 0.65 αmax(σv/σv').rd
8/10/1994 - 8/16/1994
FC
Corrected
(N1)60
File : I:\projects\9e04032\liquefac\Site Specific Liquefaction Evaluation - Passaic River - West Kearny.xlsx\HLK-3 Date:1/28/2016
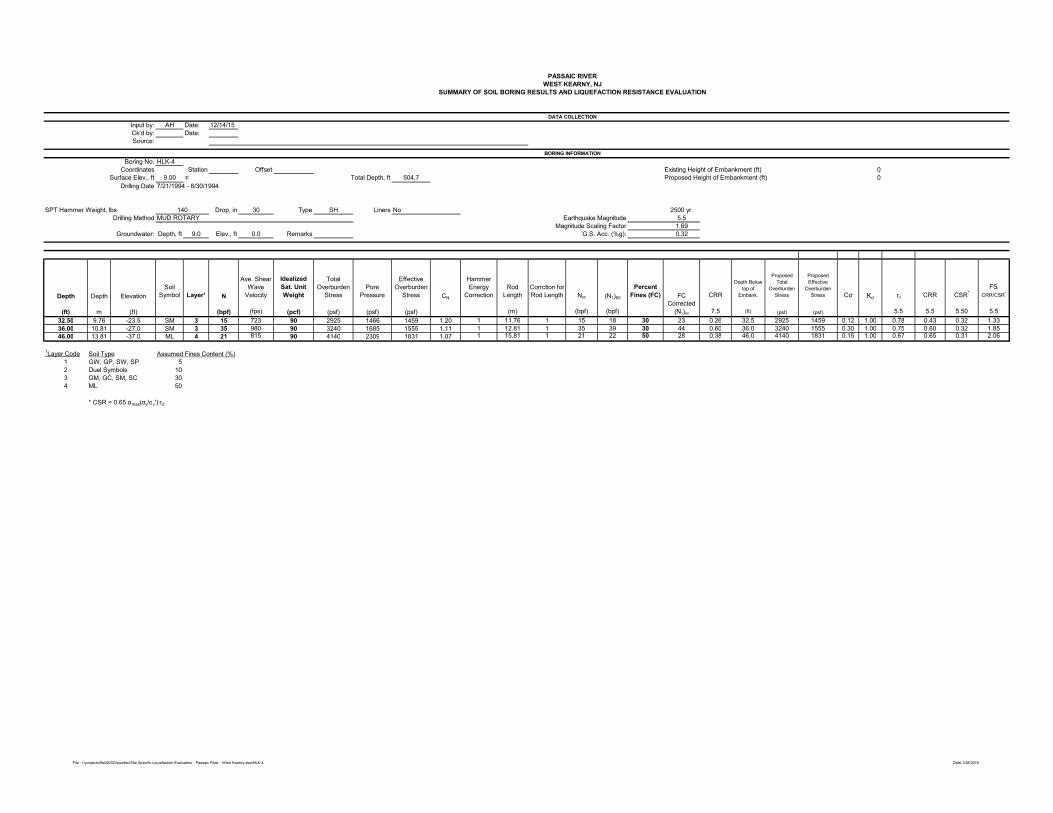
PASSAIC RIVER
WEST KEARNY, NJ
SUMMARY OF SOIL BORING RESULTS AND LIQUEFACTION RESISTANCE EVALUATION
DATA COLLECTION
Input by: AH Date: 12/14/15
Ck'd by: Date:
Source:
BORING INFORMATION
Boring No. HLK-4
Coordinates Station Offset Existing Height of Embankment (ft) 0
Surface Elev., ft 9.00 ∓ Total Depth, ft 504.7 Proposed Height of Embankment (ft) 0
Drilling Date
SPT Hammer Weight, lbs 140 Drop, in 30 Type SH Liners No 2500 yr.
Drilling Method MUD ROTARY Earthquake Magnitude 5.5
Magnitude Scaling Factor 1.69
Groundwater: Depth, ft 9.0 Elev., ft 0.0 Remarks G.S. Acc. (%g): 0.32
Depth Depth Elevation
Soil
Symbol Layer¹ N
Ave. Shear
Wave
Velocity
Idealized
Sat. Unit
Weight
Total
Overburden
Stress
Pore
Pressure
Effective
Overburden
Stress CN
Hammer
Energy
Correction
Rod
Length
Corrction for
Rod Length N60 (N1)60
Percent
Fines (FC) CRR
Depth Below
top of
Embank.
Proposed
Total
Overburden
Stress
Proposed
Effective
Overburden
Stress Cσ Kσ rd CRR CSR*
FSl
CRR/CSR*
(ft) m (ft) (bpf) (fps) (pcf) (psf) (psf) (psf) (m) (bpf) (bpf) 7.5 (ft) (psf) (psf) 5.5 5.5 5.50 5.5
32.50 9.76 -23.5 SM 3 15 723 90 2925 1466 1459 1.20 1 11.76 1 15 18 30 23 0.26 32.5 2925 1459 0.12 1.00 0.78 0.43 0.32 1.33
36.00 10.81 -27.0 SM 3 35 980 90 3240 1685 1555 1.11 1 12.81 1 35 39 30 44 0.60 36.0 3240 1555 0.30 1.00 0.75 0.60 0.32 1.85
46.00 13.81 -37.0 ML 4 21 815 90 4140 2309 1831 1.07 1 15.81 1 21 22 50 28 0.38 46.0 4140 1831 0.15 1.00 0.67 0.65 0.31 2.06
1Layer Code Soil Type Assumed Fines Content (%)
1 GW, GP, SW, SP 5
2 Duel Symbols 10
3 GM, GC, SM, SC 30
4 ML 50
* CSR = 0.65 αmax(σv/σv').rd
7/21/1994 - 8/30/1994
FC
Corrected
(N1)60
File : I:\projects\9e04032\liquefac\Site Specific Liquefaction Evaluation - Passaic River - West Kearny.xlsx\HLK-4 Date:1/28/2016
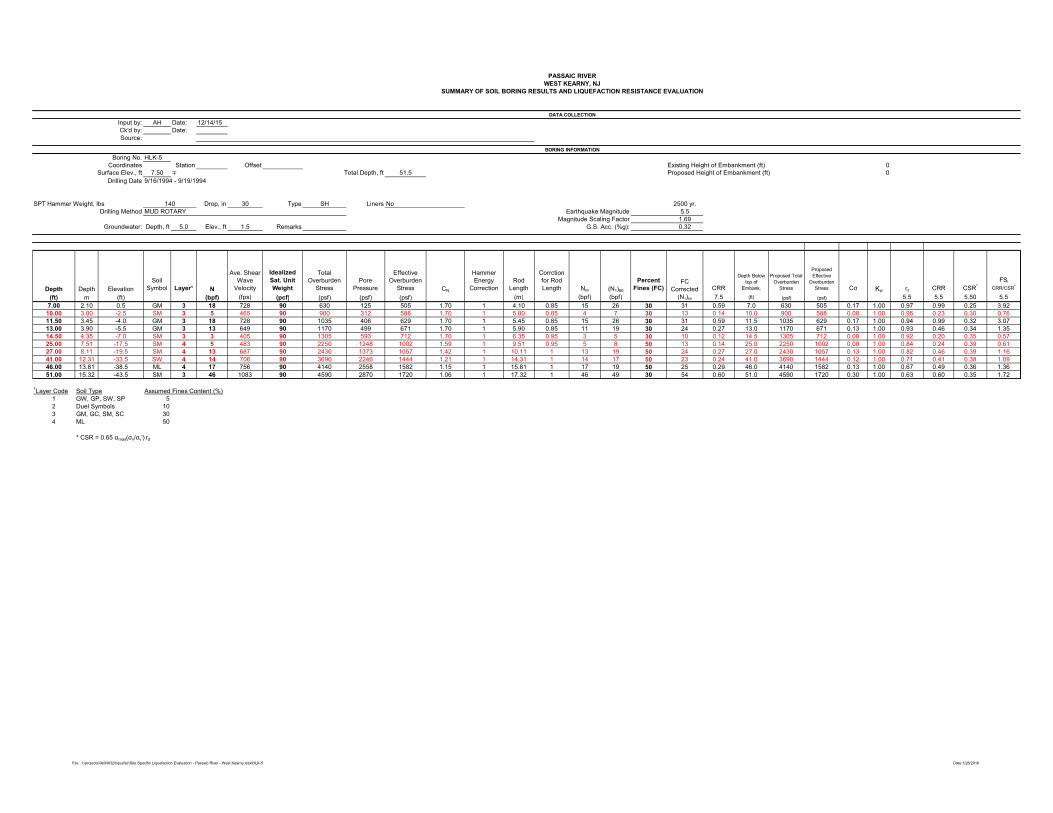
PASSAIC RIVER
WEST KEARNY, NJ
SUMMARY OF SOIL BORING RESULTS AND LIQUEFACTION RESISTANCE EVALUATION
DATA COLLECTION
Input by: AH Date: 12/14/15
Ck'd by: Date:
Source:
BORING INFORMATION
Boring No. HLK-5
Coordinates Station Offset Existing Height of Embankment (ft) 0
Surface Elev., ft 7.50 ∓ Total Depth, ft 51.5 Proposed Height of Embankment (ft) 0
Drilling Date
SPT Hammer Weight, lbs 140 Drop, in 30 Type SH Liners No 2500 yr.
Drilling Method MUD ROTARY Earthquake Magnitude 5.5
Magnitude Scaling Factor 1.69
Groundwater: Depth, ft 5.0 Elev., ft 1.5 Remarks G.S. Acc. (%g): 0.32
Depth Depth Elevation
Soil
Symbol Layer¹ N
Ave. Shear
Wave
Velocity
Idealized
Sat. Unit
Weight
Total
Overburden
Stress
Pore
Pressure
Effective
Overburden
Stress CN
Hammer
Energy
Correction
Rod
Length
Corrction
for Rod
Length N60 (N1)60
Percent
Fines (FC) CRR
Depth Below
top of
Embank.
Proposed Total
Overburden
Stress
Proposed
Effective
Overburden
Stress Cσ Kσ rd CRR CSR*
FSl
CRR/CSR*
(ft) m (ft) (bpf) (fps) (pcf) (psf) (psf) (psf) (m) (bpf) (bpf) 7.5 (ft) (psf) (psf) 5.5 5.5 5.50 5.5
7.00 2.10 0.5 GM 3 18 728 90 630 125 505 1.70 1 4.10 0.85 15 26 30 31 0.59 7.0 630 505 0.17 1.00 0.97 0.99 0.25 3.92
10.00 3.00 -2.5 SM 3 5 465 90 900 312 588 1.70 1 5.00 0.85 4 7 30 13 0.14 10.0 900 588 0.08 1.00 0.95 0.23 0.30 0.76
11.50 3.45 -4.0 GM 3 18 728 90 1035 406 629 1.70 1 5.45 0.85 15 26 30 31 0.59 11.5 1035 629 0.17 1.00 0.94 0.99 0.32 3.07
13.00 3.90 -5.5 GM 3 13 649 90 1170 499 671 1.70 1 5.90 0.85 11 19 30 24 0.27 13.0 1170 671 0.13 1.00 0.93 0.46 0.34 1.35
14.50 4.35 -7.0 SM 3 3 405 90 1305 593 712 1.70 1 6.35 0.95 3 5 30 10 0.12 14.5 1305 712 0.08 1.00 0.92 0.20 0.35 0.57
25.00 7.51 -17.5 SM 4 5 483 90 2250 1248 1002 1.59 1 9.51 0.95 5 8 50 13 0.14 25.0 2250 1002 0.08 1.00 0.84 0.24 0.39 0.61
27.00 8.11 -19.5 SM 4 13 687 90 2430 1373 1057 1.42 1 10.11 1 13 19 50 24 0.27 27.0 2430 1057 0.13 1.00 0.82 0.46 0.39 1.16
41.00 12.31 -33.5 SW 4 14 706 90 3690 2246 1444 1.21 1 14.31 1 14 17 50 23 0.24 41.0 3690 1444 0.12 1.00 0.71 0.41 0.38 1.09
46.00 13.81 -38.5 ML 4 17 756 90 4140 2558 1582 1.15 1 15.81 1 17 19 50 25 0.29 46.0 4140 1582 0.13 1.00 0.67 0.49 0.36 1.36
51.00 15.32 -43.5 SM 3 46 1083 90 4590 2870 1720 1.06 1 17.32 1 46 49 30 54 0.60 51.0 4590 1720 0.30 1.00 0.63 0.60 0.35 1.72
1Layer Code Soil Type Assumed Fines Content (%)
1 GW, GP, SW, SP 5
2 Duel Symbols 10
3 GM, GC, SM, SC 30
4 ML 50
* CSR = 0.65 αmax(σv/σv').rd
9/16/1994 - 9/19/1994
FC
Corrected
(N1)60
File : I:\projects\9e04032\liquefac\Site Specific Liquefaction Evaluation - Passaic River - West Kearny.xlsx\HLK-5 Date:1/28/2016

PASSAIC RIVER
WEST KEARNY, NJ
SUMMARY OF SOIL BORING RESULTS AND LIQUEFACTION RESISTANCE EVALUATION
DATA COLLECTION
Input by: AH Date: 12/14/15
Ck'd by: Date:
Source:
BORING INFORMATION
Boring No. DC-5
Coordinates Station Offset Existing Height of Embankment (ft) 0
Surface Elev., ft 8.90 ∓ Total Depth, ft 510.2 Proposed Height of Embankment (ft) 0
Drilling Date
SPT Hammer Weight, lbs 140 Drop, in 30 Type SH Liners No 2500 yr.
Drilling Method MUD ROTARY Earthquake Magnitude 5.5
Magnitude Scaling Factor 1.69
Groundwater: Depth, ft 8.9 Elev., ft 0.0 Remarks G.S. Acc. (%g): 0.32
Depth Depth Elevation
Soil
Symbol Layer¹ N
Ave. Shear
Wave
Velocity
Idealized
Sat. Unit
Weight
Total
Overburden
Stress
Pore
Pressure
Effective
Overburden
Stress CN
Hammer
Energy
Correction
Rod
Length
Corrction for
Rod Length N60 (N1)60
Percent
Fines (FC) CRR
Depth Below
top of
Embank.
Proposed
Total
Overburden
Stress
Proposed
Effective
Overburden
Stress Cσ Kσ rd CRR CSR*
FSl
CRR/CSR*
(ft) m (ft) (bpf) (fps) (pcf) (psf) (psf) (psf) (m) (bpf) (bpf) 7.5 (ft) (psf) (psf) 5.5 5.5 5.50 5.5
23.00 6.91 -14.1 SM 3 12 656 90 2070 880 1190 1.35 1 8.91 0.95 11 15 30 21 0.22 23.0 2070 1190 0.11 1.00 0.85 0.36 0.31 1.18
39.00 11.71 -30.1 SM 3 9 604 90 3510 1878 1632 1.16 1 13.71 1 9 10 30 16 0.16 39.0 3510 1632 0.09 1.00 0.72 0.27 0.32 0.85
43.00 12.91 -34.1 SP-SM 2 26 880 90 3870 2128 1742 1.08 1 14.91 1 26 28 10 29 0.44 43.0 3870 1742 0.19 1.00 0.69 0.74 0.32 2.33
1Layer Code Soil Type Assumed Fines Content (%)
1 GW, GP, SW, SP 5
2 Duel Symbols 10
3 GM, GC, SM, SC 30
4 ML 50
* CSR = 0.65 αmax(σv/σv').rd
FC
Corrected
(N1)60
File : I:\projects\9e04032\liquefac\Site Specific Liquefaction Evaluation - Passaic River - West Kearny.xlsx\DC-5 Date:1/28/2016

PASSAIC RIVER
WEST KEARNY, NJ
SUMMARY OF SOIL BORING RESULTS AND LIQUEFACTION RESISTANCE EVALUATION
DATA COLLECTION
Input by: AH Date: 12/14/15
Ck'd by: Date:
Source:
BORING INFORMATION
Boring No. HLD-1
Coordinates Station Offset Existing Height of Embankment (ft) 0
Surface Elev., ft 7.00 ∓ Total Depth, ft 90.4 Proposed Height of Embankment (ft) 0
Drilling Date
SPT Hammer Weight, lbs 140 Drop, in 30 Type SH Liners No 2500 yr.
Drilling Method MUD ROTARY Earthquake Magnitude 5.5
Magnitude Scaling Factor 1.69
Groundwater: Depth, ft 3.0 Elev., ft 4.0 Remarks G.S. Acc. (%g): 0.32
Depth Depth Elevation
Soil
Symbol Layer¹ N
Ave. Shear
Wave
Velocity
Idealized
Sat. Unit
Weight
Total
Overburden
Stress
Pore
Pressure
Effective
Overburden
Stress CN
Hammer
Energy
Correction
Rod
Length
Corrction
for Rod
Length N60 (N1)60
Percent
Fines (FC) CRR
Depth Below
top of
Embank.
Proposed
Total
Overburden
Stress
Proposed
Effective
Overburden
Stress Cσ Kσ rd CRR CSR*
FSl
CRR/CSR*
(ft) m (ft) (bpf) (fps) (pcf) (psf) (psf) (psf) (m) (bpf) (bpf) 7.5 (ft) (psf) (psf) 5.5 5.5 5.50 5.5
4.00 1.20 3.0 SM 3 5 455 90 360 62 298 1.70 1 3.20 0.8 4 7 30 12 0.13 4.0 360 298 0.08 1.00 0.99 0.23 0.25 0.91
5.50 1.65 1.5 SM 3 2 332 90 495 156 339 1.70 1 3.65 0.8 2 3 30 8 0.11 5.5 495 339 0.07 1.00 0.98 0.18 0.30 0.60
7.00 2.10 0.0 SM 3 0 0 90 630 250 380 1.70 1 4.10 0.85 0 0 30 5 0.09 7.0 630 380 0.05 1.00 0.97 0.15 0.33 0.44
17.50 5.26 -10.5 SM 3 4 447 90 1575 905 670 1.70 1 7.26 0.95 4 6 30 12 0.13 17.5 1575 670 0.08 1.00 0.90 0.22 0.44 0.50
19.00 5.71 -12.0 SM 3 3 405 90 1710 998 712 1.70 1 7.71 0.95 3 5 30 10 0.12 19.0 1710 712 0.08 1.00 0.89 0.20 0.44 0.45
20.50 6.16 -13.5 SM 3 3 405 90 1845 1092 753 1.70 1 8.16 0.95 3 5 30 10 0.12 20.5 1845 753 0.08 1.00 0.87 0.20 0.45 0.45
22.00 6.61 -15.0 SM 3 3 405 90 1980 1186 794 1.70 1 8.61 0.95 3 5 30 10 0.12 22.0 1980 794 0.08 1.00 0.86 0.20 0.45 0.45
25.00 7.51 -18.0 SM 3 10 615 90 2250 1373 877 1.62 1 9.51 0.95 10 15 30 21 0.22 25.0 2250 877 0.11 1.00 0.84 0.36 0.45 0.81
26.50 7.96 -19.5 SM 3 8 569 90 2385 1466 919 1.61 1 9.96 0.95 8 12 30 18 0.18 26.5 2385 919 0.10 1.00 0.83 0.30 0.45 0.68
28.00 8.41 -21.0 SM 3 14 706 90 2520 1560 960 1.48 1 10.41 1 14 21 30 26 0.32 28.0 2520 960 0.14 1.00 0.81 0.54 0.44 1.21
29.50 8.86 -22.5 SW 1 16 740 90 2655 1654 1001 1.43 1 10.86 1 16 23 5 23 0.25 29.5 2655 1001 0.15 1.00 0.80 0.42 0.44 0.94
36.00 10.81 -29.0 SW 1 27 893 120 3435 2059 1376 1.18 1 12.81 1 27 32 5 32 0.60 36.0 3435 1376 0.22 1.00 0.75 0.60 0.39 1.55
41.00 12.31 -34.0 ML 4 22 829 120 4035 2371 1664 1.11 1 14.31 1 22 24 50 30 0.48 41.0 4035 1664 0.16 1.00 0.71 0.82 0.36 2.29
1Layer Code Soil Type Assumed Fines Content (%)
1 GW, GP, SW, SP 5
2 Duel Symbols 10
3 GM, GC, SM, SC 30
4 ML 50
* CSR = 0.65 αmax(σv/σv').rd
9/20/1994 - 9/23/1994
FC
Corrected
(N1)60
File : I:\projects\9e04032\liquefac\Site Specific Liquefaction Evaluation - Passaic River - West Kearny.xlsx\HLD-1 Date:1/28/2016
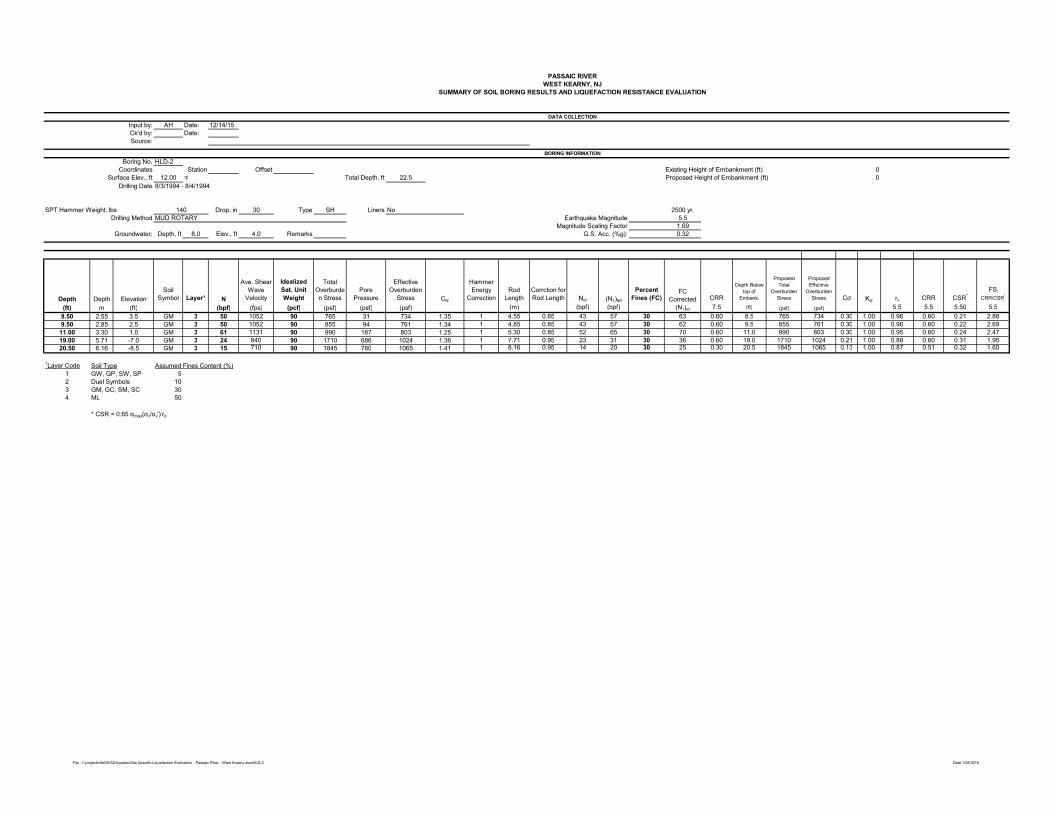
PASSAIC RIVER
WEST KEARNY, NJ
SUMMARY OF SOIL BORING RESULTS AND LIQUEFACTION RESISTANCE EVALUATION
DATA COLLECTION
Input by: AH Date: 12/14/15
Ck'd by: Date:
Source:
BORING INFORMATION
Boring No. HLD-2
Coordinates Station Offset Existing Height of Embankment (ft) 0
Surface Elev., ft 12.00 ∓ Total Depth, ft 22.5 Proposed Height of Embankment (ft) 0
Drilling Date
SPT Hammer Weight, lbs 140 Drop, in 30 Type SH Liners No 2500 yr.
Drilling Method MUD ROTARY Earthquake Magnitude 5.5
Magnitude Scaling Factor 1.69
Groundwater: Depth, ft 8.0 Elev., ft 4.0 Remarks G.S. Acc. (%g): 0.32
Depth Depth Elevation
Soil
Symbol Layer¹ N
Ave. Shear
Wave
Velocity
Idealized
Sat. Unit
Weight
Total
Overburde
n Stress
Pore
Pressure
Effective
Overburden
Stress CN
Hammer
Energy
Correction
Rod
Length
Corrction for
Rod Length N60 (N1)60
Percent
Fines (FC) CRR
Depth Below
top of
Embank.
Proposed
Total
Overburden
Stress
Proposed
Effective
Overburden
Stress Cσ Kσ rd CRR CSR*
FSl
CRR/CSR*
(ft) m (ft) (bpf) (fps) (pcf) (psf) (psf) (psf) (m) (bpf) (bpf) 7.5 (ft) (psf) (psf) 5.5 5.5 5.50 5.5
8.50 2.55 3.5 GM 3 50 1052 90 765 31 734 1.35 1 4.55 0.85 43 57 30 63 0.60 8.5 765 734 0.30 1.00 0.96 0.60 0.21 2.88
9.50 2.85 2.5 GM 3 50 1052 90 855 94 761 1.34 1 4.85 0.85 43 57 30 62 0.60 9.5 855 761 0.30 1.00 0.96 0.60 0.22 2.69
11.00 3.30 1.0 GM 3 61 1131 90 990 187 803 1.25 1 5.30 0.85 52 65 30 70 0.60 11.0 990 803 0.30 1.00 0.95 0.60 0.24 2.47
19.00 5.71 -7.0 GM 3 24 840 90 1710 686 1024 1.36 1 7.71 0.95 23 31 30 36 0.60 19.0 1710 1024 0.21 1.00 0.89 0.60 0.31 1.95
20.50 6.16 -8.5 GM 3 15 710 90 1845 780 1065 1.41 1 8.16 0.95 14 20 30 25 0.30 20.5 1845 1065 0.13 1.00 0.87 0.51 0.32 1.60
1Layer Code Soil Type Assumed Fines Content (%)
1 GW, GP, SW, SP 5
2 Duel Symbols 10
3 GM, GC, SM, SC 30
4 ML 50
* CSR = 0.65 αmax(σv/σv').rd
8/3/1994 - 8/4/1994
FC
Corrected
(N1)60
File : I:\projects\9e04032\liquefac\Site Specific Liquefaction Evaluation - Passaic River - West Kearny.xlsx\HLD-2 Date:1/28/2016

PASSAIC RIVER
WEST KEARNY, NJ
SUMMARY OF SOIL BORING RESULTS AND LIQUEFACTION RESISTANCE EVALUATION
DATA COLLECTION
Input by: AH Date: 12/14/15
Ck'd by: Date:
Source:
BORING INFORMATION
Boring No. HLS-1
Coordinates Station Offset Existing Height of Embankment (ft) 0
Surface Elev., ft 6.50 ∓ Total Depth, ft 61.2 Proposed Height of Embankment (ft) 0
Drilling Date
SPT Hammer Weight, lbs 140 Drop, in 30 Type SH Liners No 2500 yr.
Drilling Method MUD ROTARY Earthquake Magnitude 5.5
Magnitude Scaling Factor 1.69
Groundwater: Depth, ft 5.0 Elev., ft 1.5 Remarks G.S. Acc. (%g): 0.32
Depth Depth Elevation Soil Symbol Layer Code¹ N
Ave. Shear
Wave
Velocity
Idealized
Sat. Unit
Weight
Total
Overburden
Stress
Pore
Pressure
Effective
Overburden
Stress CN
Hammer
Energy
Correction
Rod
Length
Corrction
for Rod
Length N60 (N1)60
Percent
Fines (FC) CRR
Depth Below
top of
Embank.
Proposed
Total
Overburden
Stress
Proposed
Effective
Overburden
Stress Cσ Kσ rd CRR CSR*
FSl
CRR/CSR*
(ft) m (ft) (bpf) (fps) (pcf) (psf) (psf) (psf) (m) (bpf) (bpf) 7.5 (ft) (psf) (psf) 5.5 5.5 5.50 5.5
5.50 1.65 1.0 ML 4 24 790 90 495 31 464 1.70 1 3.65 0.8 19 33 50 38 0.60 5.5 495 464 0.23 1.00 0.98 0.60 0.22 2.76
7.00 2.10 -0.5 SM 3 18 728 90 630 125 505 1.70 1 4.10 0.85 15 26 30 31 0.59 7.0 630 505 0.17 1.00 0.97 0.99 0.25 3.92
8.50 2.55 -2.0 ML 4 10 592 90 765 218 547 1.70 1 4.55 0.85 9 14 50 20 0.21 8.5 765 547 0.11 1.00 0.96 0.35 0.28 1.24
10.00 3.00 -3.5 ML 4 8 547 90 900 312 588 1.70 1 5.00 0.85 7 12 50 17 0.18 10.0 900 588 0.10 1.00 0.95 0.30 0.30 0.98
11.50 3.45 -5.0 ML 4 6 495 90 1035 406 629 1.70 1 5.45 0.85 5 9 50 14 0.15 11.5 1035 629 0.09 1.00 0.94 0.25 0.32 0.79
14.50 4.35 -8.0 ML 4 3 405 90 1305 593 712 1.70 1 6.35 0.95 3 5 50 10 0.12 14.5 1305 712 0.08 1.00 0.92 0.20 0.35 0.58
16.00 4.80 -9.5 SP 1 19 773 120 1485 686 799 1.56 1 6.80 0.95 18 28 5 28 0.39 16.0 1485 799 0.19 1.00 0.91 0.66 0.35 1.88
17.50 5.26 -11.0 SM 3 36 972 120 1665 780 885 1.34 1 7.26 0.95 34 46 30 51 0.60 17.5 1665 885 0.30 1.00 0.90 0.60 0.35 1.71
19.00 5.71 -12.5 SM 3 48 1079 120 1845 874 971 1.23 1 7.71 0.95 46 56 30 61 0.60 19.0 1845 971 0.30 1.00 0.89 0.60 0.35 1.71
20.50 6.16 -14.0 SM 3 26 864 120 2025 967 1058 1.32 1 8.16 0.95 25 33 30 38 0.60 20.5 2025 1058 0.23 1.00 0.87 0.60 0.35 1.72
22.00 6.61 -15.5 SM-SP 2 36 972 120 2205 1061 1144 1.23 1 8.61 0.95 34 42 10 43 0.60 22.0 2205 1144 0.30 1.00 0.86 0.60 0.35 1.74
23.00 6.91 -16.5 SM 3 46 1062 120 2325 1123 1202 1.17 1 8.91 0.95 44 51 30 56 0.60 23.0 2325 1202 0.30 1.00 0.85 0.60 0.34 1.74
25.00 7.51 -18.5 SM 3 35 962 120 2565 1248 1317 1.18 1 9.51 0.95 33 39 30 44 0.60 25.0 2565 1317 0.30 1.00 0.84 0.60 0.34 1.77
26.50 7.96 -20.0 SM 3 51 1103 120 2745 1342 1403 1.11 1 9.96 0.95 48 54 30 59 0.60 26.5 2745 1403 0.30 1.00 0.83 0.60 0.34 1.79
28.00 8.41 -21.5 GM 3 41 1038 120 2925 1435 1490 1.11 1 10.41 1 41 45 30 51 0.60 28.0 2925 1490 0.30 1.00 0.81 0.60 0.33 1.81
29.50 8.86 -23.0 GM 3 29 916 120 3105 1529 1576 1.12 1 10.86 1 29 32 30 38 0.60 29.5 3105 1576 0.23 1.00 0.80 0.60 0.33 1.83
31.00 9.31 -24.5 GM 3 34 970 120 3285 1622 1663 1.09 1 11.31 1 34 37 30 42 0.60 31.0 3285 1663 0.29 1.00 0.79 0.60 0.32 1.85
36.00 10.81 -29.5 GM 3 46 1083 120 3885 1934 1951 1.02 1 12.81 1 46 47 30 52 0.60 36.0 3885 1951 0.30 1.00 0.75 0.60 0.31 1.94
41.00 12.31 -34.5 GM 3 100 1440 120 4485 2246 2239 1.00 1 14.31 1 100 100 30 105 0.60 41.0 4485 2239 0.30 0.98 0.71 0.60 0.29 2.04
47.00 14.11 -40.5 ML-GM 2 100 1440 120 5205 2621 2584 1.00 1 16.11 1 100 100 10 101 0.60 47.0 5205 2584 0.30 0.94 0.66 0.60 0.28 2.17
51.00 15.32 -44.5 SM 3 70 1262 120 5685 2870 2815 0.96 1 17.32 1 70 67 30 73 0.60 51.0 5685 2815 0.30 0.92 0.63 0.60 0.26 2.27
1Layer Code Soil Type Assumed Fines Content (%)
1 GW, GP, SW, SP 5
2 Duel Symbols 10
3 GM, GC, SM, SC 30
4 ML 50
* CSR = 0.65 αmax(σv/σv').rd
11/14/1994 - 11/18/1994
FC
Corrected
(N1)60
File : I:\projects\9e04032\liquefac\Site Specific Liquefaction Evaluation - Passaic River - West Kearny.xlsx\HLS-1 Date:1/29/2016

Site Specific Liquefaction Analysis
PASSAIC RIVER
EAST KEARNY, NJ
CLIFTON, NEW JERSEY
DR. BY: AH SCALE: - NTS PROJ. NO. : 60442748
Ck'D. BY: SK DATE: DEC. 2015 FIG NO: B.1
0
10
20
30
40
50
60
0 0.5 1 1.5 2 2.5 3 3.5 4 4.5 5 5.5 6
De
pth
(ft
)
Factor of Safety Against Liquefaction
HLK-1
FOS = 1.2
I:\Projects\60442748(Passaic-River)\Calculations\Levee\Liquefaction\Site Specific Liquefaction Evaluation - Passaic River - East Kearny.xlsx

Site Specific Liquefaction Analysis
PASSAIC RIVER
WEST KEARNY, NJ
CLIFTON, NEW JERSEY
DR. BY: AH SCALE: - NTS PROJ. NO. : 60442748
Ck'D. BY: SK DATE: DEC. 2015 FIG NO: B.2
0
10
20
30
40
50
60
0 0.5 1 1.5 2 2.5 3 3.5 4 4.5 5 5.5 6
De
pth
(ft
)
Factor of Safety Against Liquefaction
HLK-2 HLK-3 HLK-4 HLK-5 DC-5 HLD-1 HLD-2 HLS-1
FOS = 1.2
I:\Projects\60442748(Passaic-River)\Calculations\Levee\Liquefaction\Site Specific Liquefaction Evaluation - Passaic River - West Kearny.xlsx

CONSOLIDATION SETTLEMENT ANALYSIS PASSAIC RIVER FLOOD RISK MANAGEMENT PROJECT TIDAL AREAS IN HARRISON, KEARNEY, AND NEWARK, NJ
SUBJECT : Levee Consolidation Settlement Analysis JOB NO. : 60442748
BY : AH DATE : 1/25/16 CHKD. BY: SK DATE: 2/1/16 SHEET 1 OF 3 I:\Projects\60442748(Passaic-River)\Calculations\Levee\Settlement\Settlement Calculation Package.doc AECOM
Attachment C
LEVEE CONSOLIDATION SETTLEMENT ANALYSIS

CONSOLIDATION SETTLEMENT ANALYSIS PASSAIC RIVER FLOOD RISK MANAGEMENT PROJECT TIDAL AREAS IN HARRISON, KEARNEY, AND NEWARK, NJ
SUBJECT : Levee Consolidation Settlement Analysis JOB NO. : 60442748
BY : AH DATE : 1/25/16 CHKD. BY: SK DATE: 2/1/16 SHEET 2 OF 3 I:\Projects\60442748(Passaic-River)\Calculations\Levee\Settlement\Settlement Calculation Package.doc AECOM
OBJECTIVES
To estimate the primary consolidation settlement for proposed levee.
GIVEN INFORMATION AND ASSUMPTIONS
The height of proposed embankment is 6 ft.
The soil profile consists of 4 ft of suitable fill, 51 ft of soft/organic soil, and 30 ft of silty
clay.
All soft/organic soil and silty clay are normally consolidated.
Conservatively, East Kearny soil profile was considered for primary conslidation
settlement calculation since the thickness of clayey layers at West Kearny Segment is
lower than the East Kearny Segment.
METHODOLOGY
The consolidation parameters used for the silty clay stratum were obtained from the results of a
consolidation test performed on undisturbed samples reported in the memorandum by US Army
Corps of Engineers (USACE 1995). Consolidation parameters for the soft/organic soil stratum as
recommended in USACE 1995 memorandum was used in this calculation.
The generalized soil profile used in this report for the settlement analysis of the levee system
considered that the soft/organic soil stratum extends to a depth of 55 ft from the existing ground
surface. However, spatial variability at the site exists as evident from the available boring logs.
For example, the undisturbed sample representative of silty clay stratum was taken from the
depths of 28 to 31 ft at Boring HLK-1. To avoid an overly conservative settlement estimate, the
soft/organic stratum was divided into two layers;1) the 12 ft top layer was assigned the same soil
unit weight and consolidation parameters as the soft/organic stratum; and 2) the 39 ft bottom
layer was assigned the same consolidation parameters as the silty clay stratum, while the soil unit
weight remaining the same as the soft/organic stratum.
This report recommends excavating a 4 ft deep inspection trench along the centerline of the levee
prior to construction to evaluate the existing fill for use as a foundation. If the existing fill is
found to be intermixed with unsuitable devaying organic material, debris, woods, metal and
general building demolition rubble, then it is proposed that the top 4 ft of the existing fill to be
removed and replaced by a new compacted structural fill.
In this calculation, the compressible soil layers were divided into sub-layers of 2 feet thicknesses
for obtaining better accuracy of incremental settlement. Increase in vertical stresses at the mid
depth of each sub-layer due to the embankment load was calculated using the procedure outlined
in Das (2006).
The time rate of primary consolidation was not estimated in this analysis due to lack of
deformation-time data. Additional consolidation tests on undisturbed sample(s) will be required
for obtaining information regarding the rate of consolidation.
CONSOLIDATION SETTLEMENT ANALYSIS PASSAIC RIVER FLOOD RISK MANAGEMENT PROJECT TIDAL AREAS IN HARRISON, KEARNEY, AND NEWARK, NJ
SUBJECT : Levee Consolidation Settlement Analysis JOB NO. : 60442748
BY : AH DATE : 1/25/16 CHKD. BY: SK DATE: 2/1/16 SHEET 3 OF 3 I:\Projects\60442748(Passaic-River)\Calculations\Levee\Settlement\Settlement Calculation Package.doc AECOM
RESULTS
It is estimated that a total primary consolidation settlement of 8 inch will occur in the
compressible soils due to the construction of 6 ft high levee.
REFERENCES
1. US Army Corps of Engineers (1995). “General design memorandum: Passaic River flood
damage reduction project”. New York.
2. Das, B. M. (2006). Principles of geotechnical engineering, Nelson, Ontario, Canada, 686
p.

CALCULATED BY: AH DATE: 1/22/2016 CHECKED BY: SK
Layer No. Soil Description Total Unit Weight Layer Thickness Bottom Depth of Layer Initial Void Ratio, e0 Compression Index, Cc
(pcf) (ft) (ft) Embankment top elavation: + 14 ft
1 Fill 115 4 4 Embankment bottom elavation: + 8 ft
2 Soft/organic soil 85 12 16 1.46 0.45 Existing ground elavation: + 8 ft
3 Soft/organic soil 85 39 55 0.94 0.18 Groundwater table elavation: + 4 ft
4 Silty clay 120 30 85 0.94 0.18
H = 6 ft γ = 120 pcf
B1 = 5 ft q0 = 720 psf
B2 = 18 ft
Sub-Layer
No.Thickness
Mid Depth of Sub-
Layer
Initial Overburden
Pressure, σ'0α1 α2
Increase in Overburden
Pressure, Δσ'zσ'0 + Δσ'z Cc Settlement
(ft) (ft) (psf) (rad.) (rad.) (psf) (psf) (ft)
1 2 5 483 0.6 0.8 347 830 0.45 0.086
2 2 7 528 0.7 0.6 334 862 0.45 0.078
3 2 9 573 0.7 0.5 318 891 0.45 0.070
4 2 11 618 0.7 0.4 302 920 0.45 0.063
5 2 13 663 0.7 0.4 286 949 0.45 0.057
6 2 15 709 0.7 0.3 270 979 0.45 0.051
7 2 17 754 0.6 0.3 255 1009 0.18 0.024
8 2 19 799 0.6 0.3 241 1040 0.18 0.021
9 2 21 844 0.6 0.2 228 1073 0.18 0.019
10 2 23 889 0.6 0.2 216 1106 0.18 0.018
11 2 25 935 0.5 0.2 205 1140 0.18 0.016
12 2 27 980 0.5 0.2 195 1175 0.18 0.015
13 2 29 1025 0.5 0.2 185 1210 0.18 0.013
14 2 31 1070 0.5 0.2 177 1247 0.18 0.012
15 2 33 1115 0.5 0.2 169 1284 0.18 0.011
16 2 35 1161 0.4 0.1 161 1322 0.18 0.010
17 2 37 1206 0.4 0.1 154 1360 0.18 0.010
18 2 39 1251 0.4 0.1 148 1399 0.18 0.009
19 2 41 1296 0.4 0.1 142 1438 0.18 0.008
20 2 43 1341 0.4 0.1 136 1478 0.18 0.008
21 2 45 1387 0.4 0.1 131 1518 0.18 0.007
22 2 47 1432 0.3 0.1 127 1558 0.18 0.007
23 2 49 1477 0.3 0.1 122 1599 0.18 0.006
24 2 51 1522 0.3 0.1 118 1640 0.18 0.006
25 2 53 1567 0.3 0.1 114 1681 0.18 0.006
26 2 55 1613 0.3 0.1 110 1723 0.18 0.005
27 2 57 1728 0.3 0.1 107 1835 0.18 0.005
28 2 59 1843 0.3 0.1 103 1946 0.18 0.004
29 2 61 1958 0.3 0.1 100 2059 0.18 0.004
30 2 63 2073 0.3 0.1 97 2171 0.18 0.004
31 2 65 2189 0.3 0.1 95 2283 0.18 0.003
32 2 67 2304 0.3 0.1 92 2396 0.18 0.003
33 2 69 2419 0.2 0.1 90 2509 0.18 0.003
34 2 71 2534 0.2 0.1 87 2621 0.18 0.003
35 2 73 2649 0.2 0.1 85 2734 0.18 0.003
36 2 75 2765 0.2 0.1 83 2848 0.18 0.002
37 2 77 2880 0.2 0.1 81 2961 0.18 0.002
38 2 79 2995 0.2 0.1 79 3074 0.18 0.002
39 2 81 3110 0.2 0.1 77 3187 0.18 0.002
40 2 83 3225 0.2 0.1 75 3301 0.18 0.002
41 2 85 3341 0.2 0.1 74 3414 0.18 0.002
8 in
Increase in Vertical Stress in Soil due to Embankment Load:
SETTLEMENT CALCULATION BASED ON LABORATORY CONSOLIDATION TEST RESUTLS
PASSAIC RIVER
EAST KEARNY, NJ
Settlement Calculation:
TOTAL PRIMARY CONSOLIDATION SETTLEMENT:
Soil Parameters: Elevations:
I:\Projects\60442748(Passaic-River)\Calculations\Levee\Settlement\Primary Consolidation Settlements East Kerny.xlsx
FLOODWALL SEEPAGE & DEEP-SEATED SLIDING ANALYSIS PASSAIC RIVER FLOOD RISK MANAGEMENT PROJECT TIDAL AREAS IN HARRISON, KEARNEY, AND NEWARK, NJ
SUBJECT : Floodwall Seepage and Deep-Seated Sliding Analysis JOB NO. : 60442748 BY: MS DATE : 01/12/16 CHKD. BY: SK DATE: 02/01/16 SHEET: 1 OF 3 I:\Projects\60442748(Passaic-River)\Report\Attachment_D_PDFs\Passaic-River Flood Protection Study-Attachment_D.doc AECOM
Attachment D
FLOODWALL SEEPAGE & DEEP-SEATED SLIDING ANALYSIS

FLOODWALL SEEPAGE & DEEP-SEATED SLIDING ANALYSIS PASSAIC RIVER FLOOD RISK MANAGEMENT PROJECT TIDAL AREAS IN HARRISON, KEARNEY, AND NEWARK, NJ
SUBJECT : Floodwall Seepage and Deep-Seated Sliding Analysis JOB NO. : 60442748 BY: MS DATE : 01/12/16 CHKD. BY: SK DATE: 02/01/16 SHEET: 2 OF 3 I:\Projects\60442748(Passaic-River)\Report\Attachment_D_PDFs\Passaic-River Flood Protection Study-Attachment_D.doc AECOM
OBJECTIVES
1. To calculate exit hydraulic gradient and seepage flow through the floodwall with and
without sheetpile cutoff.
2. To perform deep-seated sliding analysis to check for sliding within weak layers beneath
the floodwall. This is also called a global stability analysis check.
ASSUMPTIONS
Maximum Height of Floodwall: 12 feet
Top of Floodwall: El. +18 feet (NAVD88)
Flood Level: El. +18 feet (NAVD88)
Top of ground surface: El. +6 feet (NAVD88)
Bottom Width of Floodwall: 15 feet
Soil Properties: Given in Table D.1
Table D.1: Properties for Subsurface Soils
Segments Materials Unit Weight
(pcf) φ
o Cohesion
(psf)
K
(cm/sec)
East Kearny
Short Term Soft or Organic Soil
85 0 250 1.00E-04
Long Term 100 20 0 1.00E-04
Short Term Silty Clay
120 0 500 1.00E-05
Long Term 120 26 0 1.00E-05
West Kearny,
Newark, and
Harrison
Short Term Soft or Organic Soil
85 0 250 1.00E-04
Long Term 100 20 0 1.00E-04
Silty Clayey Sand 120 32 0 1.00E-04
METHODOLOGY
Seepage Analyses
A commercially available, general purpose seepage computer program, SEEP/W, was used
to perform seepage analyses for the floodwall alternative with and without sheetpile cutoff.
Seepage flow and hydraulic exit gradient at downstream side were estimated for the steady
state hydraulic conditions. The estimated exit gradient values were compared with allowable
recommended values to assess the need for underseepage controls.
Deep-Seated Stability Analyses
Deep-seated sliding analysis should be performed to check for sliding within weak layers
beneath structures. A commercially available, general purpose seepage computer program,
SLOPE/W, was used for this purpose. In this analysis it is assumed that floodwall is a T-
Wall with 15 ft wide base rested on batter piles. The vertical water pressure due to the flood
is conservatively assumed to be a surcharge load on the ground surface.
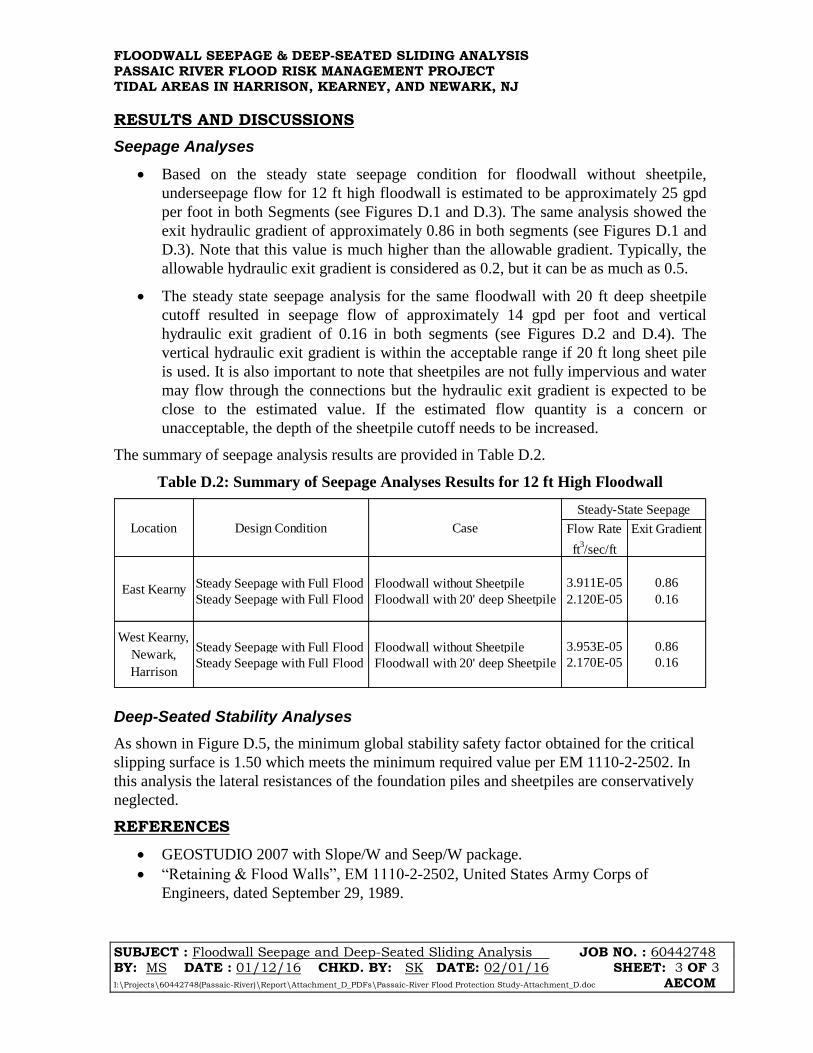
FLOODWALL SEEPAGE & DEEP-SEATED SLIDING ANALYSIS PASSAIC RIVER FLOOD RISK MANAGEMENT PROJECT TIDAL AREAS IN HARRISON, KEARNEY, AND NEWARK, NJ
SUBJECT : Floodwall Seepage and Deep-Seated Sliding Analysis JOB NO. : 60442748 BY: MS DATE : 01/12/16 CHKD. BY: SK DATE: 02/01/16 SHEET: 3 OF 3 I:\Projects\60442748(Passaic-River)\Report\Attachment_D_PDFs\Passaic-River Flood Protection Study-Attachment_D.doc AECOM
RESULTS AND DISCUSSIONS
Seepage Analyses
Based on the steady state seepage condition for floodwall without sheetpile,
underseepage flow for 12 ft high floodwall is estimated to be approximately 25 gpd
per foot in both Segments (see Figures D.1 and D.3). The same analysis showed the
exit hydraulic gradient of approximately 0.86 in both segments (see Figures D.1 and
D.3). Note that this value is much higher than the allowable gradient. Typically, the
allowable hydraulic exit gradient is considered as 0.2, but it can be as much as 0.5.
The steady state seepage analysis for the same floodwall with 20 ft deep sheetpile
cutoff resulted in seepage flow of approximately 14 gpd per foot and vertical
hydraulic exit gradient of 0.16 in both segments (see Figures D.2 and D.4). The
vertical hydraulic exit gradient is within the acceptable range if 20 ft long sheet pile
is used. It is also important to note that sheetpiles are not fully impervious and water
may flow through the connections but the hydraulic exit gradient is expected to be
close to the estimated value. If the estimated flow quantity is a concern or
unacceptable, the depth of the sheetpile cutoff needs to be increased.
The summary of seepage analysis results are provided in Table D.2.
Table D.2: Summary of Seepage Analyses Results for 12 ft High Floodwall
Flow Rate Exit Gradient
ft3/sec/ft
Steady Seepage with Full Flood Floodwall without Sheetpile 3.911E-05 0.86
Steady Seepage with Full Flood Floodwall with 20' deep Sheetpile 2.120E-05 0.16
Steady Seepage with Full Flood Floodwall without Sheetpile 3.953E-05 0.86
Steady Seepage with Full Flood Floodwall with 20' deep Sheetpile 2.170E-05 0.16
West Kearny,
Newark,
Harrison
East Kearny
Steady-State Seepage
CaseDesign ConditionLocation
Deep-Seated Stability Analyses
As shown in Figure D.5, the minimum global stability safety factor obtained for the critical
slipping surface is 1.50 which meets the minimum required value per EM 1110-2-2502. In
this analysis the lateral resistances of the foundation piles and sheetpiles are conservatively
neglected.
REFERENCES
GEOSTUDIO 2007 with Slope/W and Seep/W package.
“Retaining & Flood Walls”, EM 1110-2-2502, United States Army Corps of
Engineers, dated September 29, 1989.

Steady-State Seepage for 12 ft High Floodwall Without Sheetpile (Flood Pool at El. 18 ft)
DR BY: MS SCALE: N.T.S PROJECT NO:
CHKD BY: SK DATE: 12/18/15 FIGURE NO: 1
SEEPAGE ANALYSIS OF FLOODWALLEast Kearny Segment
Estimated Piezometric Conditions, Flow Rate, and Exit
Gradient
I:\Projects\60442748(Passaic-River)\Calculations\Floodwall_Seepage.xls

Steady-State Seepage for 12 ft High Floodwall With 20ft Long Sheetpile (Flood Pool at El. 18 ft)
DR BY: MS SCALE: N.T.S PROJECT NO:
CHKD BY: SK DATE: 12/18/15 FIGURE NO: 2
SEEPAGE ANALYSIS OF FLOODWALL WITH SHEETPILEEast Kearny Segment
Estimated Piezometric Conditions, Flow Rate, and Exit
Gradient
I:\Projects\60442748(Passaic-River)\Calculations\Floodwall_Seepage.xls

Steady-State Seepage for 12 ft High Floodwall Without Sheetpile (Flood Pool at El. 18 ft)
DR BY: MS SCALE: N.T.S PROJECT NO:
CHKD BY: SK DATE: 12/18/15 FIGURE NO: 3
SEEPAGE ANALYSIS OF FLOODWALLWest Kearny Segment
Estimated Piezometric Conditions, Flow Rate, and Exit
Gradient
I:\Projects\60442748(Passaic-River)\Calculations\Floodwall_Seepage.xls

Steady-State Seepage for 12 ft High Floodwall With 20ft Long Sheetpile (Flood Pool at El. 18 ft)
DR BY: MS SCALE: N.T.S PROJECT NO:
CHKD BY: SK DATE: 12/18/15 FIGURE NO: 4
SEEPAGE ANALYSIS OF FLOODWALL WITH SHEETPILEWest Kearny Segment
Estimated Piezometric Conditions, Flow Rate, and Exit
Gradient
I:\Projects\60442748(Passaic-River)\Calculations\Floodwall_Seepage.xls
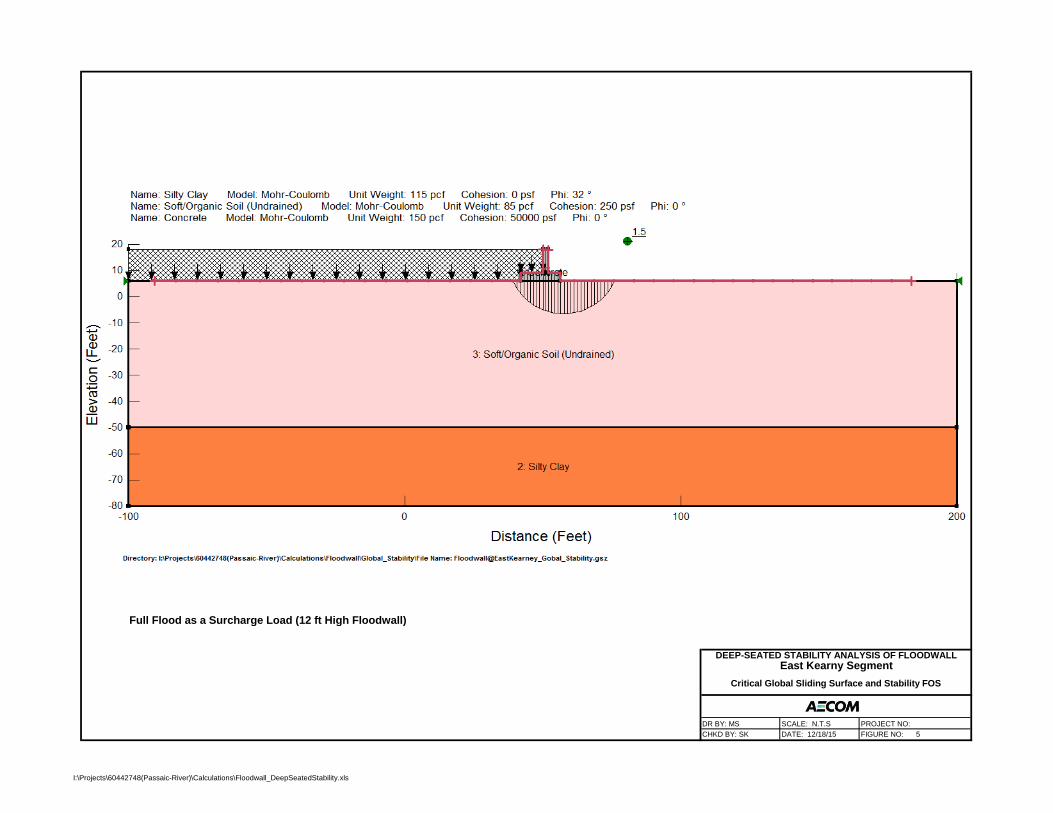
Full Flood as a Surcharge Load (12 ft High Floodwall)
DR BY: MS SCALE: N.T.S PROJECT NO:
CHKD BY: SK DATE: 12/18/15 FIGURE NO: 5
DEEP-SEATED STABILITY ANALYSIS OF FLOODWALLEast Kearny Segment
Critical Global Sliding Surface and Stability FOS
I:\Projects\60442748(Passaic-River)\Calculations\Floodwall_DeepSeatedStability.xls
PILE BEARING CAPACITY STUDY PASSAIC RIVER FLOOD RISK MANAGEMENT PROJECT TIDAL AREAS IN HARRISON, KEARNEY, AND NEWARK, NJ
SUBJECT : Pile Capacity Analysis JOB NO. : 60442748 BY: MS DATE : 01/12/16 CHKD. BY: SK DATE: 02/01/16 SHEET 1 OF 9 I:\Projects\60442748(Passaic-River)\Report\Attachment_E_PDFs\Passaic-River Flood Protection Study-Attachment_E.doc AECOM
Attachment E
PILE CAPACITY ANALYSIS

PILE BEARING CAPACITY STUDY PASSAIC RIVER FLOOD RISK MANAGEMENT PROJECT TIDAL AREAS IN HARRISON, KEARNEY, AND NEWARK, NJ
SUBJECT : Pile Capacity Analysis JOB NO. : 60442748 BY: MS DATE : 01/12/16 CHKD. BY: SK DATE: 02/01/16 SHEET 2 OF 9 I:\Projects\60442748(Passaic-River)\Report\Attachment_E_PDFs\Passaic-River Flood Protection Study-Attachment_E.doc AECOM
OBJECTIVES
1. To calculate compression and tension capacities of H-Piles (HP14x73) bearing on soil
and rock.
2. To calculate compression and tension capacities of 14-inch prestressed precast concrete
(PPC) piles bearing on soil.
3. To calculate compression and tension capacities of 8-inch and 12-inch (O.D.) rock
sockets for Caissons/Micropiles.
ASSUMPTIONS
Depth to Rock at East Kearny Segment: 80 ft or less
Depth to Rock at West Kearny, Newark, and Harrison Segment: 60ft or less
Downdrag effect on piles: Negligible
Allowable bonding resistance of rock-socket interface (compression): 50 psi
Allowable bonding resistance of rock-socket interface (tension): 30 psi
METHODOLOGY
HP and PPC Piles A commercially available, general purpose pile capacity calculation computer program,
APILE v.5.0, was used to perform driven pile capacity calculation analyses for the HP and
PPC piles. The method of FHWA was used in the computation. The engineering properties
of the soil as provided in Table-1 of Attachment A were used. The compression capacities of
the piles were estimated with the assumption of piles bearing on soil.
Micropiles/Caissons The compression and tension capacities of the rock sockets were calculated using the
FHWA Micropile 2005 guidelines. In this project Micropiles with rock-sockets may be used
in the areas with shallower rock depth. In estimating the total capacities of the Micropiles
the skin resistance from the soil was neglected. The geotechnical compression and tension
capacities of the rock sockets were compared with the structural capacities and the minimum
values were recommended for the preliminary design.
RESULTS AND DISCUSSIONS
HP and PPC Piles Based on the soil stratification and results of the pile bearing capacity analysis using APILE,
H-Pile (HP14x73) embedded at least 80 ft into soft/organic clay and silty clay can
approximately provide an ultimate compression and uplift capacity of 95 kips at East Kearny
Segment (see Figure E.1). In West Kearny, Newark, and Harrison Segment H-Pile
embedded at least 60 ft into soft/organic clay and silty clayey sand can provide
approximately 110 kips of ultimate compression capacity and 100 kips of ultimate uplift
capacity (see Figure E.2). For H-Piles bearing on a competent rock the ultimate compression
capacity will be determined by structural capacity with the limit of 200 kips.
Similar pile capacity analysis performed on 14-inch prestressed precast concrete piles
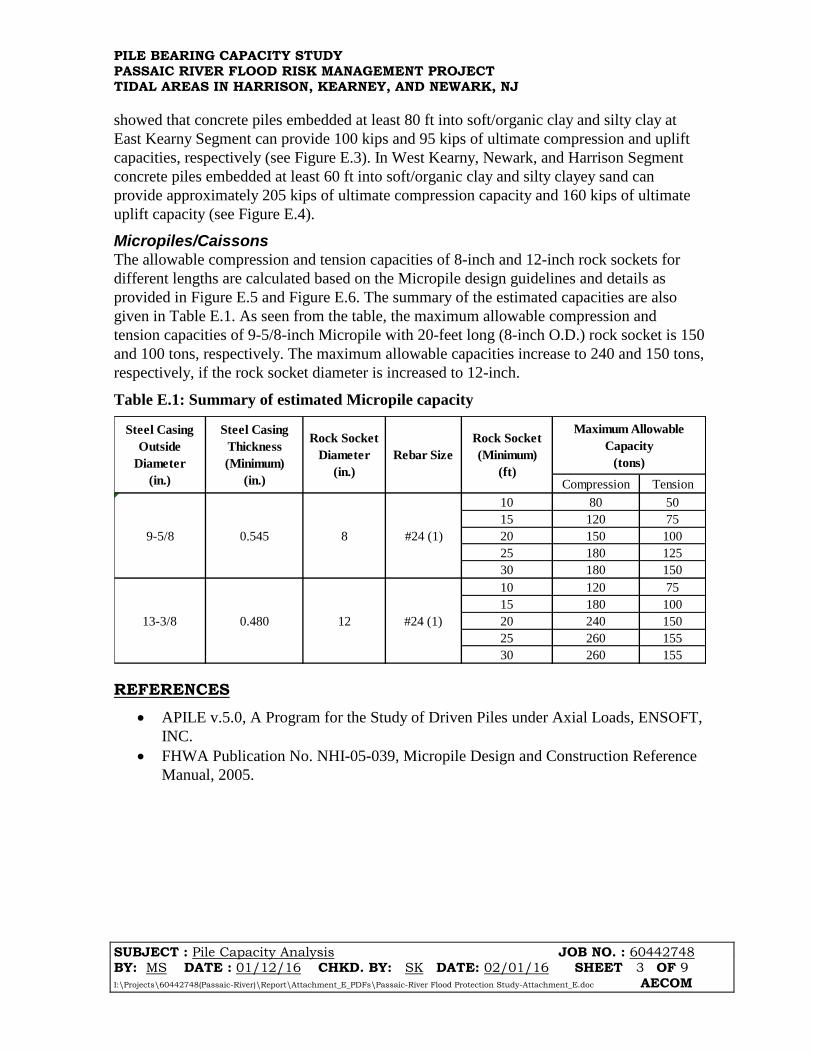
PILE BEARING CAPACITY STUDY PASSAIC RIVER FLOOD RISK MANAGEMENT PROJECT TIDAL AREAS IN HARRISON, KEARNEY, AND NEWARK, NJ
SUBJECT : Pile Capacity Analysis JOB NO. : 60442748 BY: MS DATE : 01/12/16 CHKD. BY: SK DATE: 02/01/16 SHEET 3 OF 9 I:\Projects\60442748(Passaic-River)\Report\Attachment_E_PDFs\Passaic-River Flood Protection Study-Attachment_E.doc AECOM
showed that concrete piles embedded at least 80 ft into soft/organic clay and silty clay at
East Kearny Segment can provide 100 kips and 95 kips of ultimate compression and uplift
capacities, respectively (see Figure E.3). In West Kearny, Newark, and Harrison Segment
concrete piles embedded at least 60 ft into soft/organic clay and silty clayey sand can
provide approximately 205 kips of ultimate compression capacity and 160 kips of ultimate
uplift capacity (see Figure E.4).
Micropiles/Caissons The allowable compression and tension capacities of 8-inch and 12-inch rock sockets for
different lengths are calculated based on the Micropile design guidelines and details as
provided in Figure E.5 and Figure E.6. The summary of the estimated capacities are also
given in Table E.1. As seen from the table, the maximum allowable compression and
tension capacities of 9-5/8-inch Micropile with 20-feet long (8-inch O.D.) rock socket is 150
and 100 tons, respectively. The maximum allowable capacities increase to 240 and 150 tons,
respectively, if the rock socket diameter is increased to 12-inch.
Table E.1: Summary of estimated Micropile capacity
Compression Tension
10 80 50
15 120 75
8 20 150 100
25 180 125
30 180 150
10 120 75
15 180 100
12 20 240 150
25 260 155
30 260 155
Maximum Allowable
Capacity
(tons)
Steel Casing
Outside
Diameter
(in.)
Steel Casing
Thickness
(Minimum)
(in.)
Rock Socket
(Minimum)
(ft)
#24 (1)
Rock Socket
Diameter
(in.)
0.5459-5/8
13-3/8 0.480 #24 (1)
Rebar Size
REFERENCES
APILE v.5.0, A Program for the Study of Driven Piles under Axial Loads, ENSOFT,
INC.
FHWA Publication No. NHI-05-039, Micropile Design and Construction Reference
Manual, 2005.
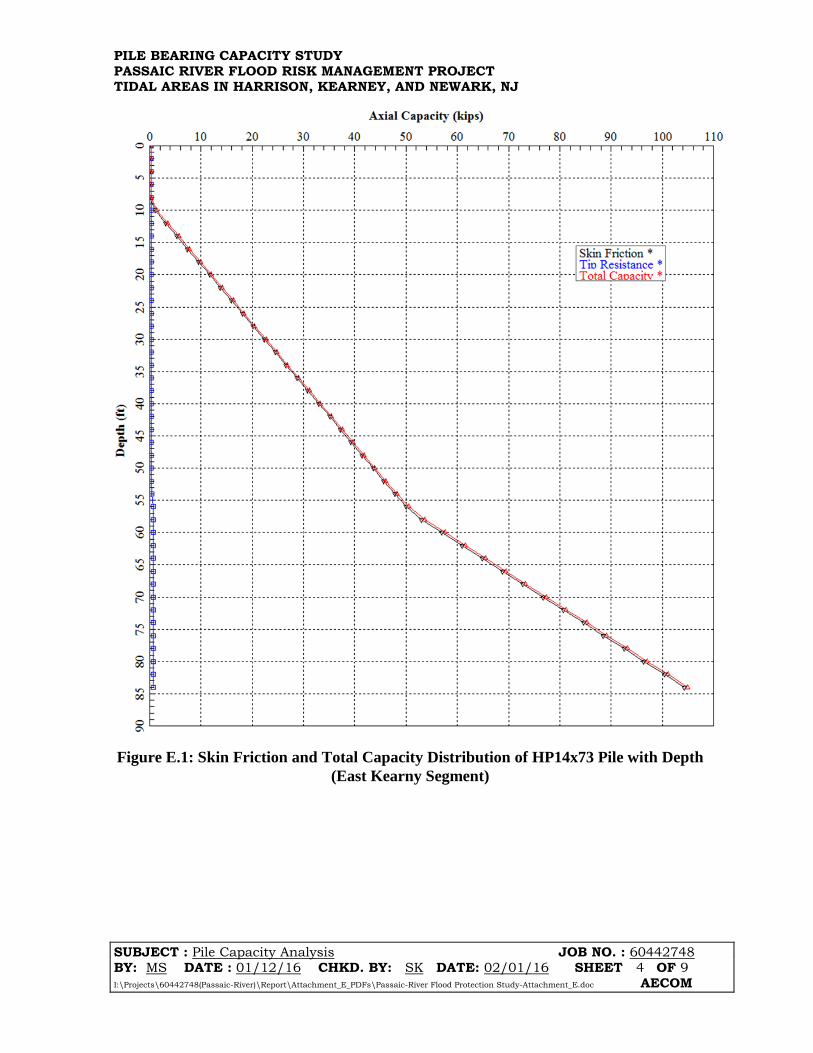
PILE BEARING CAPACITY STUDY PASSAIC RIVER FLOOD RISK MANAGEMENT PROJECT TIDAL AREAS IN HARRISON, KEARNEY, AND NEWARK, NJ
SUBJECT : Pile Capacity Analysis JOB NO. : 60442748 BY: MS DATE : 01/12/16 CHKD. BY: SK DATE: 02/01/16 SHEET 4 OF 9 I:\Projects\60442748(Passaic-River)\Report\Attachment_E_PDFs\Passaic-River Flood Protection Study-Attachment_E.doc AECOM
Figure E.1: Skin Friction and Total Capacity Distribution of HP14x73 Pile with Depth
(East Kearny Segment)

PILE BEARING CAPACITY STUDY PASSAIC RIVER FLOOD RISK MANAGEMENT PROJECT TIDAL AREAS IN HARRISON, KEARNEY, AND NEWARK, NJ
SUBJECT : Pile Capacity Analysis JOB NO. : 60442748 BY: MS DATE : 01/12/16 CHKD. BY: SK DATE: 02/01/16 SHEET 5 OF 9 I:\Projects\60442748(Passaic-River)\Report\Attachment_E_PDFs\Passaic-River Flood Protection Study-Attachment_E.doc AECOM
Figure E.2: Skin Friction and Total Capacity Distribution of HP14x73 Pile with Depth
(West Kearny, Newark, and Harrison Segment)

PILE BEARING CAPACITY STUDY PASSAIC RIVER FLOOD RISK MANAGEMENT PROJECT TIDAL AREAS IN HARRISON, KEARNEY, AND NEWARK, NJ
SUBJECT : Pile Capacity Analysis JOB NO. : 60442748 BY: MS DATE : 01/12/16 CHKD. BY: SK DATE: 02/01/16 SHEET 6 OF 9 I:\Projects\60442748(Passaic-River)\Report\Attachment_E_PDFs\Passaic-River Flood Protection Study-Attachment_E.doc AECOM
Figure E.3: Skin Friction and Total Capacity Distribution of 14-inch Prestressed
Precast Concrete Pile with Depth (East Kearny Segment)

PILE BEARING CAPACITY STUDY PASSAIC RIVER FLOOD RISK MANAGEMENT PROJECT TIDAL AREAS IN HARRISON, KEARNEY, AND NEWARK, NJ
SUBJECT : Pile Capacity Analysis JOB NO. : 60442748 BY: MS DATE : 01/12/16 CHKD. BY: SK DATE: 02/01/16 SHEET 7 OF 9 I:\Projects\60442748(Passaic-River)\Report\Attachment_E_PDFs\Passaic-River Flood Protection Study-Attachment_E.doc AECOM
Figure E.4: Skin Friction and Total Capacity Distribution of 14-inch Prestressed
Precast Concrete Pile with Depth (West Kearny, Newark, and Harrison Segment)

PILE BEARING CAPACITY STUDY PASSAIC RIVER FLOOD RISK MANAGEMENT PROJECT TIDAL AREAS IN HARRISON, KEARNEY, AND NEWARK, NJ
SUBJECT : Pile Capacity Analysis JOB NO. : 60442748 BY: MS DATE : 01/12/16 CHKD. BY: SK DATE: 02/01/16 SHEET 8 OF 9 I:\Projects\60442748(Passaic-River)\Report\Attachment_E_PDFs\Passaic-River Flood Protection Study-Attachment_E.doc AECOM
ESTIMATE OF THE CAPACITY OF DRILLED SHAFTS IN ROCK - FHWA MICROPILE JUNE 2005 GUIDELINES
Project Name: Passic-River Calculated by : M.S.
Project Number : Checked by : S.K.
Outside Diameter of Casing: 9.625 in. Est. Rock Cap. at Bottom : 20 tsf
Thickness of Casing: 0.545 in. Est. Resistance at Bottom : 7 tons
Inside Diameter of Casing 8.535 in.
Diameter of Rock Socket : 8 in.
Perimeter of Rock Socket : 25.1 in.
Plunge Length : 12.0 in.
Area of Rock Socket at Bottom: 50.3 sq.in.
Center to Center Spacing : 10.0 ft
Depth to Rock : 75 ft
Soil Unit Weight : 38 pcf
Soil Weight above Socket : 620 tons Based on a cone with 30 degree angle and CC spacing
Rock unit weight 145 pcf
Allowable Bond Stress (Compression): 50 psi
Allowable Bond Stress (Tension): 33 psi
Geotechnical Capacity - In Accordance with FHWA
A. Compression B. Tension
Length of
Socket
Side
Resistance
(tons)
Allowable
Resistance
(tons)
Length of
Socket
Competent Rock -
Spacing
Consideration (tons)
Fractured
Rock -
Single
Drilled Shaft
(tons)
5 38 45 5 120 153
10 75 82 10 153 153
15 113 120 15 153 153
20 151 158 20 153 153
25 188 184 25 153 153
30 226 184 30 153 153
Structural Capacity - In Accordance with FHWA
Rebar Diameter: 3 in Rebar Number: 24
Number of Rebars: 1
Total Rebar Area: 7.07 sq.in.
Rebar Steel Yield Stress: 75 ksi
Casing Steel Yield Stress : 50 ksi
Conc. Compr. Stress: 6 ksi
Casing Steel Area: 15.5 sq.in.
Grout Area in Casing : 50.1 sq.in.
Grout Area in Socket : 43.2 sq.in.
Cased Length Capacity
Steel Strength (Comp.): 266 tons Steel Strength (Tension): 311 tons
Grout Strength : 60 tons
Total : 326 tons
Rock Socket (Uncased Length) Capacity
Allowable Transfer Load : 8 tons
Steel Strength (Comp.): 125 tons Steel Strength (Tension): 153 tons
Grout Strength : 52 tons
Total : 184 tons
Total Structural Capacity (FHWA) : 184 tons
151
Competent Rock -
Failure at
Grout/Rock
Interface (tons)
25
50
75
101
126
Figure E.5: Estimate of Capacity of 8-inch Rock-Sockets

PILE BEARING CAPACITY STUDY PASSAIC RIVER FLOOD RISK MANAGEMENT PROJECT TIDAL AREAS IN HARRISON, KEARNEY, AND NEWARK, NJ
SUBJECT : Pile Capacity Analysis JOB NO. : 60442748 BY: MS DATE : 01/12/16 CHKD. BY: SK DATE: 02/01/16 SHEET 9 OF 9 I:\Projects\60442748(Passaic-River)\Report\Attachment_E_PDFs\Passaic-River Flood Protection Study-Attachment_E.doc AECOM
ESTIMATE OF THE CAPACITY OF DRILLED SHAFTS IN ROCK - FHWA MICROPILE JUNE 2005 GUIDELINES
Project Name: Passic-River Calculated by : M.S.
Project Number : Checked by : S.K.
Outside Diameter of Casing: 13.375 in. Est. Rock Cap. at Bottom : 20 tsf
Thickness of Casing: 0.48 in. Est. Resistance at Bottom : 16 tons
Inside Diameter of Casing 12.415 in.
Diameter of Rock Socket : 12 in.
Perimeter of Rock Socket : 37.7 in.
Plunge Length : 12.0 in.
Area of Rock Socket at Bottom: 113.1 sq.in.
Center to Center Spacing : 10.0 ft
Depth to Rock : 75 ft
Soil Unit Weight : 38 pcf
Soil Weight above Socket : 624 tons Based on a cone with 30 degree angle and CC spacing
Rock unit weight 145 pcf
Allowable Bond Stress (Compression): 50 psi
Allowable Bond Stress (Tension): 33 psi
Geotechnical Capacity - In Accordance with FHWA
A. Compression B. Tension
Length of
Socket
Side
Resistance
(tons)
Total
Resistance
(tons)
Length of
Socket
Competent Rock -
Spacing
Consideration (tons)
Fractured
Rock -
Single
Drilled Shaft
(tons)
5 57 72 5 120 157
10 113 129 10 157 157
15 170 185 15 157 157
20 226 242 20 157 157
25 283 263 25 157 157
30 339 263 30 157 157
Structural Capacity - In Accordance with FHWA
Rebar Diameter: 3 in Rebar Number: 24
Number of Rebars: 1
Total Rebar Area: 7.07 sq.in.
Rebar Steel Yield Stress: 75 ksi
Casing Steel Yield Stress : 50 ksi
Conc. Compr. Stress: 6 ksi
Casing Steel Area: 19.4 sq.in.
Grout Area in Casing : 114.0 sq.in.
Grout Area in Socket : 106.0 sq.in.
Cased Length Capacity
Steel Strength (Comp.): 312 tons Steel Strength (Tension): 365 tons
Grout Strength : 137 tons
Total : 448 tons
Rock Socket (Uncased Length) Capacity
Allowable Transfer Load : 11 tons
Steel Strength (Comp.): 125 tons Steel Strength (Tension): 157 tons
Grout Strength : 127 tons
Total : 263 tons
Total Structural Capacity (FHWA) : 263 tons
157
Competent Rock -
Failure at
Grout/Rock
Interface (tons)
38
75
113
151
157
Figure E.6: Estimate of Capacity of 12-inch Rock-Sockets
Related Documents