Université de Paris Ecole doctorale STEP’UP – ED n° 560 Institut de Physique du Globe de Paris Dynamique des éruptions pliniennes : réévaluation de l’aléa volcanique en Martinique Par Audrey Michaud-Dubuy Thèse de doctorat de Sciences de la Terre et de l’Environnement Dirigée par Edouard Kaminski Présentée et soutenue publiquement le 18 décembre 2019 Devant un jury composé de : Costanza Bonadonna, Professor, Université de Genève, rapportrice Tomaso Esposti Ongaro, Assistant Professor, INGV Pisa, rapporteur Anne Le Friant, Directrice de recherche, Université de Paris, examinatrice Hélène Balcone-Boissard, Maître de conférences, Sorbonne Université, examinatrice Edouard Kaminski, Professeur, Université de Paris, directeur de thèse Guillaume Carazzo, Physicien-adjoint, Université de Paris, co-encadrant de thèse

Welcome message from author
This document is posted to help you gain knowledge. Please leave a comment to let me know what you think about it! Share it to your friends and learn new things together.
Transcript
Université de Paris Ecole doctorale STEP’UP – ED n° 560
Institut de Physique du Globe de Paris
Dynamique des éruptions pliniennes : réévaluation de
l’aléa volcanique en Martinique
Par Audrey Michaud-Dubuy
Thèse de doctorat de Sciences de la Terre et de
l’Environnement
Dirigée par Edouard Kaminski
Présentée et soutenue publiquement le 18 décembre 2019
Devant un jury composé de :
Costanza Bonadonna, Professor, Université de Genève, rapportrice Tomaso Esposti Ongaro, Assistant Professor, INGV Pisa, rapporteur Anne Le Friant, Directrice de recherche, Université de Paris, examinatrice Hélène Balcone-Boissard, Maître de conférences, Sorbonne Université, examinatrice Edouard Kaminski, Professeur, Université de Paris, directeur de thèse Guillaume Carazzo, Physicien-adjoint, Université de Paris, co-encadrant de thèse

THÈSE de DOCTORATde l’UNIVERSITÉ DE PARIS
Spécialité : Sciences de la Terre et de l’Environnement
présentée parAudrey MICHAUD-DUBUY
pour obtenir le titre deDOCTEURE DE L’UNIVERSITÉ DE PARIS
Sujet de la thèse :
Dynamique des éruptions pliniennes : réévaluation de l’aléavolcanique en Martinique
Soutenue le 18 décembre 2019, devant le jury composé de
Costanza BONADONNA . . . . . . . . . . . . . . . . . . . . . . . . . . . . . . . . . . . . . . . . . . . . . . . . . . . . . . . . RapportriceTomaso ESPOSTI ONGARO . . . . . . . . . . . . . . . . . . . . . . . . . . . . . . . . . . . . . . . . . . . . . . . . . . . . RapporteurHélène BALCONE-BOISSARD . . . . . . . . . . . . . . . . . . . . . . . . . . . . . . . . . . . . . . . . . . . . . . . . ExaminatriceAnne LE FRIANT . . . . . . . . . . . . . . . . . . . . . . . . . . . . . . . . . . . . . . . . . . . . . . . . . . . . . . . . . . . . . ExaminatriceEdouard KAMINSKI . . . . . . . . . . . . . . . . . . . . . . . . . . . . . . . . . . . . . . . . . . . . . . . . . . . . . . Directeur de thèseGuillaume CARAZZO . . . . . . . . . . . . . . . . . . . . . . . . . . . . . . . . . . . . . . . . . . . . . . . . . Co-encadrant de thèse
Équipe de Dynamique des Fluides GéologiquesInstitut de Physique du Globe de Paris
1, rue Jussieu - 75005 Paris


v
Mais un jour la terre s’ouvre
Et le volcan n’en peut plus
Le sol se rompt
On découvre des richesses inconnues
La mer à son tour divague
De violence inemployée
Me voilà comme une vague
Vous ne serez pas noyés
Une sorcière comme les autres - Anne Sylvestre

vii
Remerciements
Un immense merci tout d’abord à Guillaume Carazzo et Edouard Kaminski, mes directeursde thèse, pour m’avoir proposé ce formidable sujet qui me permettait de revenir vers laPelée, mon volcan favori. J’ai énormément appris auprès de vous pendant ces trois ans, duperfectionnement des méthodes scientifiques à la façon de présenter mes résultats comme sil’on racontait une histoire. Merci de m’avoir fait confiance, à moi, une géologue pure, et dem’avoir appris à pleinement apprécier la physique.
Je remercie également les membres de mon jury de thèse : Costanza Bonadonna, TomasoEsposti Ongaro, Hélène Balcone-Boissard et Anne Le Friant pour avoir accepté de juger montravail et pour notre discussion très enrichissante durant la soutenance de thèse. Merci devotre disponibilité, de votre bienveillance, et de vos compliments.
J’adresse mes remerciements les plus chaleureux aux membres de mon comité de thèse,Hélène Balcone-Boissard, Georges Boudon et Anne Mangeney, pour vos précieux conseils etavis prodigués tout au long de ma thèse.
Un grand merci à Steve Tait, Frédéric Girault, Guillaume Le Hir et Frédéric Fluteau pournos collaborations fructueuses, et pour votre aide dans la rédaction de mes tous premiersarticles scientifiques.
Je suis évidemment extrêmement reconnaissante à toute l’équipe (passée et présente)de l’Observatoire Volcanologique et Sismologique de la Martinique. Vous m’avez toujoursaccueillie à bras ouverts, tant en tant que stagiaire de master qu’en tant que thésarde. C’esten partie grâce à vous que j’ai eu le désir de revenir sur la Pelée, et de continuer à mieux laconnaître. Un grand merci.
Un merci spécial à Ulrich Küppers, pour une super mission de terrain ensemble à laMartinique et pour m’avoir invitée à visiter le laboratoire de Munich et voir de jolies ex-plosions de ponces ! Merci beaucoup à Olivier Roche, Julia Eychenne, et Maud Devès pourvotre implication dans mon travail.
Un immense merci à toute l’équipe de Dynamique des Fluides Géologiques de l’IPGP,pour votre accueil et votre soutien durant ces trois années. Un merci spécial aux doctorantsde l’équipe pour nos pauses cafés, thé, rhum, gâteaux et Mario Kart. Bien sûr, je remercieplus que tout ma super co-bureau, Alexandra Morand, sans qui ces trois ans n’auraientpas du tout été aussi agréables. Merci d’être une super amie (et cat-sitter !). Et tu ferasattention, il y a kraken sous phytoplancton.
J’adresse un grand grand merci à toute l’équipe de Sciences de la Terre du Palais de laDécouverte : Arnaud Lemaistre, Olivier Coulon, Vincent Pasquero, Emmanuelle Lambert,Monica Rotaru, et Nathalie Berthier. J’ai énormément appris auprès de vous pendant lesdeux ans de mission au Palais, je crois même que j’ai guéri ma phobie de parler en public! J’étends ces remerciements aux super coachs des Jeunes Chercheurs, Aurélie Massaux,Véronique Polonovski, et Ludovic Fournier, ainsi qu’à mes compères doctorant.e.s/jeuneschercheur.e.s, Lucie Barbier, Alexis Dollion, Marine Martin-Lagarde, Pierre Trinh, et Laeti-tia Zaleski. Cette aventure des Jeunes Chercheurs a été fantastique et très gratifiante, etc’est grâce à vous tous. Les apéros que l’on continue de faire sont également un super bonus;) Cela a été une vraie chance d’évoluer auprès de passionné.e.s de Sciences et de médiationtels que vous tous, un grand merci.
À mes wonderwomen, toutes exceptionnelles, Lorella, Caro, Alicia, Laurie, Aude, Hélène,Stéph, et encore une fois Alex ; et encore plus spécialement à mes soeurs de coeur, Orianne
viii
et Violaine, qui sont auprès de moi depuis plus de 25 ans : que vous dire à part un im-mense, profond, et ému MERCI. Vous toutes savez ce que représentait pour moi de devenirvolcanologue, et votre soutien depuis toutes ces années a toujours été un vrai moteur pouraller dans cette direction. Plein de coeurs sur vous <3. Evidemment, je remercie aussi messupermen, Brice (BroMo) et Nico, ainsi que Batman (aussi appelé Matthieu).
À toute ma famille, un grand grand merci pour votre soutien depuis toujours. J’ai unepensée spéciale pour Juliane, ma cousine chérie, Guillaume, et ma petite filleule Lena ainsique son frère, passionné de volcans aussi, Loris. J’espère aller me balader sur un volcanavec vous bientôt ! Je remercie du fond du coeur Ghislaine et Didier Champion (ainsi queGuillaume, Violaine et Philippe bien sûr), pour m’avoir fait aimer les cailloux depuis montout jeune âge, pour m’avoir emmenée sur des volcans, pour m’avoir hébergée au début dema thèse, pour votre soutien inconditionnel et vos cocottes en papier. Un merci spécial àLucile et Emma, pour votre soutien, nos conversations Harry Potter et pour la tour Eiffeeell! Et évidemment, plus que tout, et avec une grande émotion, un immense, immense, (...),immense merci à ma mamie Pierrette, mon papa et ma maman. Sans vous, rien de toutça n’aurait été possible, vous m’avez portée depuis ma naissance, encouragée, supportée, etpour vous il a toujours été évident que je réussirai à réaliser mon rêve de volcans. Merci devotre soutien, de votre confiance, de votre amour, je vous dois tout. Je vous aime.
Je n’oublie pas mon petit chaton, merci à mon GGadji, pour la patachonnerie et laronronthérapie. La maison est où tu es. Et merci aux autres petits loulous, Sok et Dew.
Je remercie enfin tous ceux qui m’ont encouragée, de près ou de loin, qu’ils soient encorelà ou pas. Je dédie cette thèse à mes grands-parents : Daie, Papy Robert, et Mamie Emma.Je pense à vous chaque jour.
ix
Résumé
Les panaches volcaniques produits par les éruptions explosives représentent un aléa majeur dansles zones à proximité de volcans. Les modèles physiques développés ces quarante dernières annéesont eu pour but de mieux comprendre ces éruptions et de quantifier les aléas associés. Les tests derobustesse de ces modèles prédictifs doivent reposer sur des données de terrain précises et détailléessur les éruptions passées des volcans actifs. Nous proposons dans cette thèse de revisiter l’histoireéruptive plinienne de la montagne Pelée en Martinique (Petites Antilles) sur les vingt-quatre derniersmilliers d’années. Nos résultats combinant travaux de terrain et datations au 14C nous permettentd’établir une nouvelle chronologie des éruptions passées en accord avec les observations réaliséessur un carottage des fonds sous-marins. Nous reconstruisons par la suite l’évolution dynamique deséruptions nouvellement découvertes de Bellefontaine (13 516 ans cal A.P.), Balisier (14 072 cal A.P.),Carbet (18 711 cal A.P.) et Étoile (21 450 cal A.P.) dont le grand intérêt réside dans leur axe dedispersion vers le sud, inhabituel et englobant des zones considérées comme sécurisées sur les cartesd’aléa actuelles. Les fortes similitudes observées entre toutes les éruptions pliniennes documentéesde la montagne Pelée permettent de dresser un portrait du scénario éruptif le plus susceptible dese produire dans le futur. Ce scénario pouvant inclure un effondrement de la colonne éruptive et laproduction de coulées de densité pyroclastiques, nous modifions un modèle physique 1D de panachevolcanique afin d’en améliorer les prédictions. Nous étudions dans un premier temps l’impact dela distribution de taille des fragments volcaniques sur la transition d’une colonne plinienne stableà une fontaine en effondrement. L’effet du vent est ensuite pris en compte grâce à des expériencesen laboratoire inédites permettant de simuler des jets turbulents se formant dans un environnementsoumis au vent. Nous proposons ainsi un nouveau modèle théorique validé par les expériencesqui remet en cohérence les données de plusieurs éruptions pliniennes historiques majeures. Nousétudions ensuite la dispersion des cendres volcaniques lors des éruptions de Bellefontaine et Balisierà l’aide d’un modèle physique 2D pour comprendre l’origine de leur direction préférentielle vers lesud, et donc vers Fort-de-France, chef-lieu de la Martinique. Nos résultats permettent d’identifierdes contextes atmosphériques particuliers durant lesquels le trajet du “jet-stream” subtropical estmodifié, produisant alors des vents venant du nord sur la Martinique et pouvant disperser descendres volcaniques sur les zones les plus peuplées. Cette approche intégrée, mêlant études deterrain, simulations numériques et expériences en laboratoire, nous permet alors de dresser unenouvelle carte d’aléa volcanique pour la Martinique considérant pour la première fois les éruptionspliniennes passées de la montagne Pelée depuis 24 000 ans, ainsi que la variabilité mensuelle desvents atmosphériques.
Mots-clés : montagne Pelée, éruption plinienne, dynamique éruptive, dispersion de cendres, aléavolcanique, tephrostratigraphie

xi
Abstract
Volcanic plumes produced by explosive eruptions represent a major threat in areas located nearvolcanoes. Physical models have been developed over the past forty years with an aim of betterunderstanding these eruptions and assessing associated hazards. To test these models, we needrobust and detailed field data from past and historical eruptions at active volcanoes. In this PhDwork, we revisit the Plinian eruptive history of the Mount Pelée volcano in Martinique (LesserAntilles) for the last 24,000 years. Our results combining new extensive field studies and carbon-dating measurements allow us to establish a new chronology of past eruptions, consistent withvolcanic deposits identified in a deep-sea sediment core. We then reconstruct the dynamical evolutionof the newly discovered eruptions of Bellefontaine (13,516 years cal BP), Balisier (14,072 cal BP),Carbet (18,711 cal BP) and Étoile (21,450 cal BP), whose great interest stems from their unusualsouthward dispersal axis encompassing areas that are considered to be safe in current hazard maps.The strong similarities observed between all documented Plinian eruptions of Mount Pelée volcanoallow us to draw an accurate picture of the Plinian eruptive scenario most likely to occur in thefuture. This scenario may include a column collapse and the production of deadly pyroclastic densitycurrents; we thus upgrade a 1D physical model of volcanic plume in order to improve its predictions.We first study the impact of the total grain-size distribution on the transition from a stable Plinianplume to a collapsing fountain. The effect of wind is then taken into account using laboratoryexperiments simulating turbulent jets rising in a windy environment. This new theoretical model,validated by laboratory experiments, is consistent with field data from several major historicalPlinian eruptions. We then study the southward dispersal axis of the Bellefontaine and Balisiereruptions using a 2D physical model, in order to better understand this unusual dispersion towardsFort-de-France, capital of Martinique. Our results allow identifying peculiar atmospheric circulationsassociated to a modification of the subtropical jet-stream path, thus producing northerly winds overMartinique and spreading tephra towards the most populated areas of the island. This integratedapproach, combining field studies, theoretical predictions and laboratory experiments, allows us tobuild a new volcanic hazard map for Martinique by taking into account for the first time the Plinianeruptions of the Mount Pelée volcano of the last 24,000 years, together with monthly variability ofatmospheric winds.
Keywords: Mount Pelée, Plinian eruption, eruptive dynamics, tephra dispersal, volcanic hazardassessment, tephrostratigraphy

Contents
Introduction générale 1
Part 1 Geological data and possible eruptive scenarii in Martinique 17
1 A revisit of the eruptive history of Mount Pelée volcano 191 Introduction . . . . . . . . . . . . . . . . . . . . . . . . . . . . . . . . . . . . 212 Geological and meteorological setting . . . . . . . . . . . . . . . . . . . . . . 21
2.1 The Lesser Antilles arc . . . . . . . . . . . . . . . . . . . . . . . . . . 212.2 Volcanic activity in Martinique . . . . . . . . . . . . . . . . . . . . . 232.3 Mount Pelée volcano . . . . . . . . . . . . . . . . . . . . . . . . . . . 262.4 Annual meteorological conditions over Martinique . . . . . . . . . . . 28
3 Methodology . . . . . . . . . . . . . . . . . . . . . . . . . . . . . . . . . . . 303.1 Fieldwork . . . . . . . . . . . . . . . . . . . . . . . . . . . . . . . . . 303.2 Radiocarbon dating . . . . . . . . . . . . . . . . . . . . . . . . . . . 323.3 Grain-size analyses . . . . . . . . . . . . . . . . . . . . . . . . . . . . 323.4 Eruptive parameters . . . . . . . . . . . . . . . . . . . . . . . . . . . 34
4 Results . . . . . . . . . . . . . . . . . . . . . . . . . . . . . . . . . . . . . . . 364.1 Stratigraphic sections . . . . . . . . . . . . . . . . . . . . . . . . . . 36
4.1.1 The Mont Parnasse section . . . . . . . . . . . . . . . . . . 364.1.2 The new OVSM section . . . . . . . . . . . . . . . . . . . . 364.1.3 The Bellefontaine stadium section . . . . . . . . . . . . . . 38
4.2 14C ages: chronology of past eruptions . . . . . . . . . . . . . . . . . 404.3 A refined on-land eruptive history . . . . . . . . . . . . . . . . . . . 43
5 Conclusion . . . . . . . . . . . . . . . . . . . . . . . . . . . . . . . . . . . . . 44
2 Reconstruction of the newly discovered eruptions 511 Introduction . . . . . . . . . . . . . . . . . . . . . . . . . . . . . . . . . . . . 532 Field study . . . . . . . . . . . . . . . . . . . . . . . . . . . . . . . . . . . . 53
2.1 Stratigraphy of the units . . . . . . . . . . . . . . . . . . . . . . . . . 532.1.1 The Bellefontaine sequence . . . . . . . . . . . . . . . . . . 532.1.2 The Balisier sequence . . . . . . . . . . . . . . . . . . . . . 542.1.3 The Carbet sequence . . . . . . . . . . . . . . . . . . . . . 562.1.4 The Etoile sequence . . . . . . . . . . . . . . . . . . . . . . 56
2.2 Spatial distributions of the deposits . . . . . . . . . . . . . . . . . . . 572.2.1 The Bellefontaine sequence . . . . . . . . . . . . . . . . . . 572.2.2 The Balisier sequence . . . . . . . . . . . . . . . . . . . . . 582.2.3 The Carbet sequence . . . . . . . . . . . . . . . . . . . . . 622.2.4 The Etoile sequence . . . . . . . . . . . . . . . . . . . . . . 64
2.3 Grain-size analyses . . . . . . . . . . . . . . . . . . . . . . . . . . . . 652.3.1 The Bellefontaine eruption . . . . . . . . . . . . . . . . . . 65
2.3.2 The Balisier eruption . . . . . . . . . . . . . . . . . . . . . 672.3.3 The Carbet eruption . . . . . . . . . . . . . . . . . . . . . . 672.3.4 The Etoile eruption . . . . . . . . . . . . . . . . . . . . . . 68
3 Eruptive dynamics . . . . . . . . . . . . . . . . . . . . . . . . . . . . . . . . 693.1 Erupted volumes . . . . . . . . . . . . . . . . . . . . . . . . . . . . . 703.2 Column heights and exit velocities . . . . . . . . . . . . . . . . . . . 733.3 Mass discharge rates and durations . . . . . . . . . . . . . . . . . . . 74
4 Discussion . . . . . . . . . . . . . . . . . . . . . . . . . . . . . . . . . . . . . 764.1 Summary of eruptive parameters . . . . . . . . . . . . . . . . . . . . 764.2 Possible scenario for hazard assessment . . . . . . . . . . . . . . . . . 77
5 Conclusion . . . . . . . . . . . . . . . . . . . . . . . . . . . . . . . . . . . . . 79
Part 2 Physical model of explosive volcanic plumes 85
3 A revisit of the role of gas entrapment on the stability conditions ofexplosive volcanic columns 871 Introduction . . . . . . . . . . . . . . . . . . . . . . . . . . . . . . . . . . . . 902 Physical model of explosive volcanic columns . . . . . . . . . . . . . . . . . 92
2.1 Conservation equations and constitutive laws . . . . . . . . . . . . . 922.2 Particle sedimentation . . . . . . . . . . . . . . . . . . . . . . . . . . 932.3 Grain-size distribution and amount of gas at the vent . . . . . . . . . 942.4 Exit velocity at the base of the eruptive column . . . . . . . . . . . . 96
3 Results . . . . . . . . . . . . . . . . . . . . . . . . . . . . . . . . . . . . . . . 963.1 Prediction of column collapse . . . . . . . . . . . . . . . . . . . . . . 963.2 Predictions for the dynamics of collapsing fountains . . . . . . . . . 98
4 Comparison with natural cases . . . . . . . . . . . . . . . . . . . . . . . . . 1024.1 The ⇡186 CE Taupo eruption . . . . . . . . . . . . . . . . . . . . . . 1024.2 The 79 CE Vesuvius eruption . . . . . . . . . . . . . . . . . . . . . . 104
5 Discussion . . . . . . . . . . . . . . . . . . . . . . . . . . . . . . . . . . . . . 1065.1 The effect of crater shape on exit velocity . . . . . . . . . . . . . . . 1065.2 Effect of wind on column collapse . . . . . . . . . . . . . . . . . . . . 106
6 Conclusions . . . . . . . . . . . . . . . . . . . . . . . . . . . . . . . . . . . . 107Notation . . . . . . . . . . . . . . . . . . . . . . . . . . . . . . . . . . . . . . . . . 108Appendix A . . . . . . . . . . . . . . . . . . . . . . . . . . . . . . . . . . . . . . . 110Appendix B . . . . . . . . . . . . . . . . . . . . . . . . . . . . . . . . . . . . . . . 110
4 Wind entrainment in reversing buoyant jets: laboratory constraints andimplications for volcanic plumes 1171 Introduction . . . . . . . . . . . . . . . . . . . . . . . . . . . . . . . . . . . . 1192 Laboratory experiments . . . . . . . . . . . . . . . . . . . . . . . . . . . . . 121
2.1 Experimental set up . . . . . . . . . . . . . . . . . . . . . . . . . . . 1212.2 Scaling analysis . . . . . . . . . . . . . . . . . . . . . . . . . . . . . . 122
3 A model for the laboratory experiments . . . . . . . . . . . . . . . . . . . . 1233.1 Conservation equations . . . . . . . . . . . . . . . . . . . . . . . . . 1233.2 No wind case . . . . . . . . . . . . . . . . . . . . . . . . . . . . . . . 1253.3 Negatively buoyant jets in a windy environment . . . . . . . . . . . . 126
4 Results . . . . . . . . . . . . . . . . . . . . . . . . . . . . . . . . . . . . . . . 1274.1 Qualitative observations . . . . . . . . . . . . . . . . . . . . . . . . . 1274.2 The plume/fountain transition . . . . . . . . . . . . . . . . . . . . . 128
4.3 Trajectory of negatively buoyant jets . . . . . . . . . . . . . . . . . . 1295 Volcanological implications . . . . . . . . . . . . . . . . . . . . . . . . . . . 130
5.1 Collapsing regimes of historical eruptions . . . . . . . . . . . . . . . 1305.2 New regime diagram for column collapse in case of wind . . . . . . . 131
6 Conclusion . . . . . . . . . . . . . . . . . . . . . . . . . . . . . . . . . . . . . 132Appendix A . . . . . . . . . . . . . . . . . . . . . . . . . . . . . . . . . . . . . . . 133
Part 3 Volcanic hazard assessment in Martinique 137
5 Modeling volcanic tephra dispersion in Martinique 1391 Introduction . . . . . . . . . . . . . . . . . . . . . . . . . . . . . . . . . . . . 1412 The HAZMAP model . . . . . . . . . . . . . . . . . . . . . . . . . . . . . . 142
2.1 Constitutive equations . . . . . . . . . . . . . . . . . . . . . . . . . . 1422.2 Input parameters . . . . . . . . . . . . . . . . . . . . . . . . . . . . . 143
2.2.1 Volcanological parameters . . . . . . . . . . . . . . . . . . . 1432.2.2 Wind profiles from ERA Interim and ERA 5 . . . . . . . . 143
3 Predictions using mean seasonal wind profiles . . . . . . . . . . . . . . . . . 1453.1 The Bellefontaine eruption (13,516 yr cal BP) . . . . . . . . . . . . . 1453.2 The Balisier eruption (14,072 yr cal BP) . . . . . . . . . . . . . . . . 146
4 Dispersal modeling of eruption products . . . . . . . . . . . . . . . . . . . . 1464.1 Northerly winds in Martinique (1979–2017) . . . . . . . . . . . . . . 1474.2 Can hurricanes explain the Bellefontaine pattern of deposition? . . . 1514.3 Dispersion of the Balisier deposits . . . . . . . . . . . . . . . . . . . 155
5 Impact of wind on volcanic hazard assessment . . . . . . . . . . . . . . . . . 1576 Conclusion . . . . . . . . . . . . . . . . . . . . . . . . . . . . . . . . . . . . . 159
6 Refined hazard maps for tephra fallout in Martinique 1631 Introduction . . . . . . . . . . . . . . . . . . . . . . . . . . . . . . . . . . . . 1652 Current volcanic hazard assessment in Martinique . . . . . . . . . . . . . . . 1653 Input parameters for HAZMAP . . . . . . . . . . . . . . . . . . . . . . . . . 166
3.1 Volcanological parameters: matrix of correlation . . . . . . . . . . . 1673.2 Wind profiles from ERA Interim . . . . . . . . . . . . . . . . . . . . 168
4 Results . . . . . . . . . . . . . . . . . . . . . . . . . . . . . . . . . . . . . . . 1714.1 Classical approach using mean seasonal wind profiles . . . . . . . . . 171
4.1.1 Hazard maps for wet and dry seasons . . . . . . . . . . . . 1714.1.2 Aggregated hazard map . . . . . . . . . . . . . . . . . . . . 173
4.2 Refined method accounting for wind variability . . . . . . . . . . . . 1744.2.1 Monthly hazard maps . . . . . . . . . . . . . . . . . . . . . 1744.2.2 New hazard map for tephra fallout in Martinique . . . . . . 181
5 Discussion . . . . . . . . . . . . . . . . . . . . . . . . . . . . . . . . . . . . . 1835.1 Comparison with previous hazard map for tephra fallout . . . . . . . 1835.2 Other volcanic hazards in Martinique . . . . . . . . . . . . . . . . . . 184
6 Conclusion . . . . . . . . . . . . . . . . . . . . . . . . . . . . . . . . . . . . . 185
Conclusion générale et perspectives 189


Introduction générale
Introduction générale
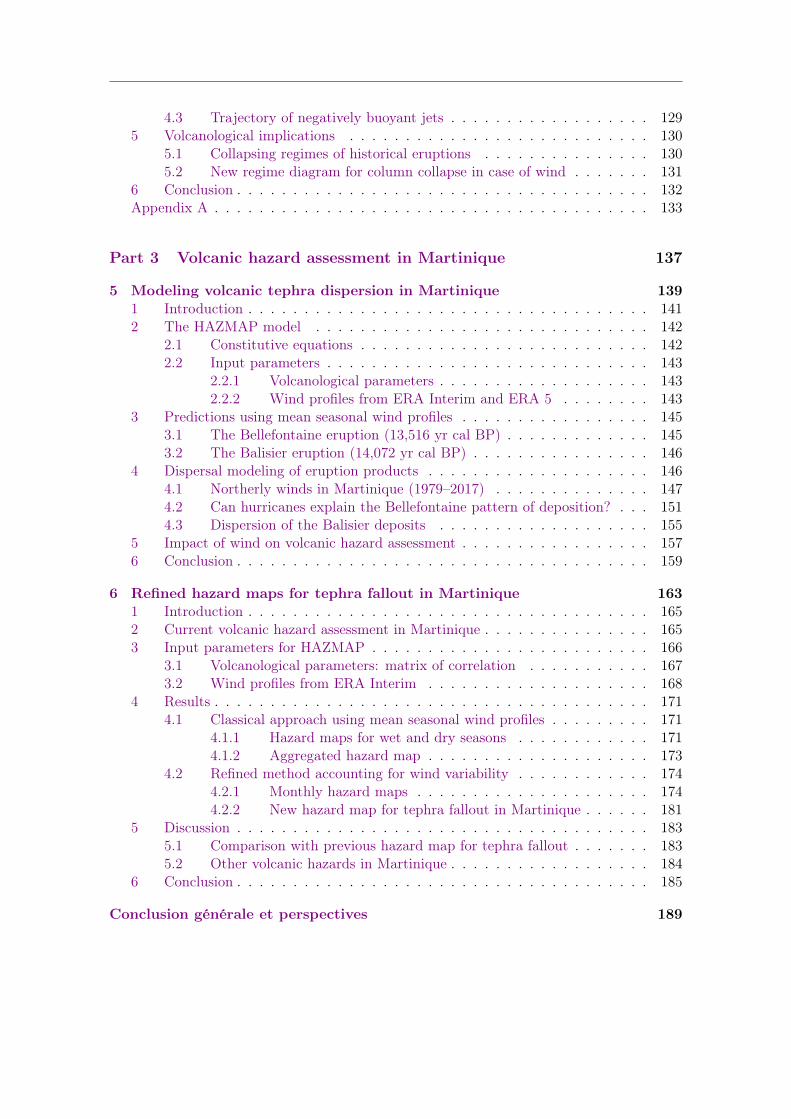
En mai 1902, la ville de Saint-Pierre, au nord de la Martinique, est la capitale intel-lectuelle et culturelle des Petites Antilles. Surnommée “le Petit Paris”, elle accueille 28 000habitants, au pied de la montagne Pelée. Depuis 1889, et de manière accrue depuis avril1902, le volcan donne des signes de réveil (apparition de fumerolles, séismes, grondements,pluies de cendres, coulées de boue...). Le jeudi 8 mai 1902, à 7h52 heure locale, le dômeformé par de la lave très visqueuse au sommet du volcan explose et provoque une nuéeardente (également appelée coulée de densité pyroclastique), qui dévale les pentes du volcanà plus de 500 kilomètres par heure. Elle rase en quelques minutes la totalité de la ville deSaint-Pierre et détruit tous les navires de la rade (Figure 1). Seul un survivant est attesté,Louis-Auguste Cyparis (1875-1929) qui, emprisonné, a été protégé par les murs de sa cellule.L’activité éruptive se poursuivra de manière discontinue jusqu’en 1905, avec de nouvellescroissances et destructions de dômes entraînant 1 500 autres morts (principalement deshabitants de Morne-Rouge, rasée par la nuée ardente du 30 août 1902).
Cette éruption catastrophique, la plus meurtrière du XX
e siècle, est à l’origine de lanaissance de la volcanologie moderne, notamment grâce à Alfred Lacroix (1863-1948) quiobserve et décrit largement cet événement dans son livre La Montagne Pelée et ses éruptions
(Lacroix, 1904). C’est lui qui nomme “nuée ardente” le phénomène ayant ravagé la ville deSaint-Pierre et “éruption péléenne” ce type d’éruption à dômes.
Figure 1: La baie et la ville de Saint-Pierre avant (première ligne) et après (deuxième ligne) l’éruption du8 mai 1902 (Lacroix, 1904).
Les éruptions pliniennes, les plus puissantes des éruptions explosives
Aujourd’hui encore, quand la montagne Pelée, seul volcan actif de la Martinique, estévoquée, c’est souvent pour parler de la crise éruptive de 1902-1905 ayant entraîné la mort depresque 30 000 personnes. La Pelée a pourtant produit dans le passé des éruptions explosivesbien plus puissantes : les éruptions pliniennes, tirant leur nom de la description par Plinele Jeune (61-113) de l’éruption du Vésuve (Italie) du 24 octobre 79, ayant causé la destructionde Pompéi, Herculanum, Stabiae et Oplontis. Ce sont les volcans explosifs situés dans descontextes de subduction (i.e. plongement d’une plaque tectonique -souvent océanique- sous
2
Introduction générale
une autre plaque), tels que le Krakatoa (Indonésie), le Pinatubo (Philippines), le montSaint-Helens (États-Unis), ou la montagne Pelée (France), qui produisent généralement deséruptions pliniennes.
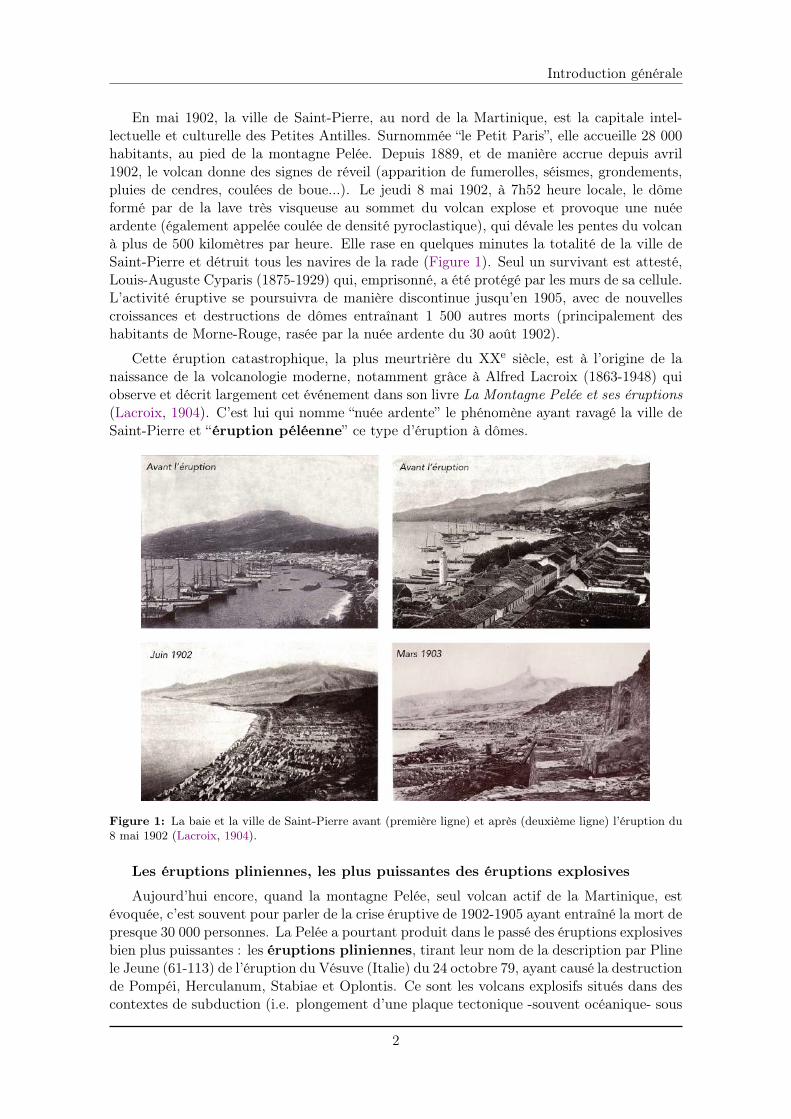
Figure 2: Phénomènes associés à une éruption explosive plinienne, d’après Norton & Company. L’encart(cercle violet, modifié d’après Kaminski & Jaupart 1998) illustre les phénomènes se produisant dans unconduit volcanique. À forte pression, les gaz sont dissous dans le magma (zone rouge). Lorsque le seuil desolubilité est atteint, des bulles de gaz se forment par exsolution, cette phase gazeuse occupe un volumede plus en plus important au fur et à mesure que le mélange magmatique remonte dans le conduit et sedécomprime. Au niveau de fragmentation, le mélange magmatique passe d’un état de “mousse”, tel que lesbulles de gaz sont en suspension dans le liquide, à celui d’un jet de gaz turbulent portant des fragments deliquide.
Afin d’expliquer les phénomènes observés lors de ces éruptions (Figure 2), il faut com-prendre ce qu’il se passe dans le conduit éruptif, à l’intérieur du volcan. Lorsque le magma re-monte dans le conduit du volcan avant l’éruption, des bulles de gaz se forment par exsolution,mais ne peuvent s’échapper librement car ce magma est particulièrement visqueux. Alorsque la pression diminue dans le conduit, le volume occupé par la phase gazeuse augmentejusqu’à atteindre un niveau dit de fragmentation, auquel le magma se pulvérise en fractionsplus ou moins grossières (encart de la Figure 2). Ces fortes explosions projettent gaz, cen-dres volcaniques (fragments de roches volcaniques < 2 mm) et ponces (roches volcaniquestrès poreuses) dans l’atmosphère sous forme d’une colonne éruptive, dont l’ascension estau départ contrôlée uniquement par la quantité de mouvement (“gas-thrust region” ou jetéruptif avec gaz en surpression). Par la suite, durant son ascension, cette colonne turbulenteingère de l’air environnant. Le réchauffement de cet air froid par les matériaux contenusdans la colonne va la dilater et le cas échéant la faire devenir moins dense que l’atmosphère(inversion de flottabilité), ce qui favorisera l’ascension d’un panache convectif par pousséed’Archimède jusqu’à plusieurs dizaines de kilomètres de hauteur. Au niveau de flottabiliténeutre, où la densité du panache devient égale à celle de l’atmosphère, la colonne va ensuites’étaler sous la forme d’une ombrelle volcanique (Sparks, 1986). Au contraire, si la colonneest trop dense parce qu’elle n’ingère pas suffisamment d’air par rapport au flux de pyro-clastes qu’elle transporte, elle aura tendance à s’effondrer sous son propre poids, entraînantla formation de coulées de densité pyroclastiques (Wilson et al., 1980). Ces dernières, de parleurs vitesses et températures élevées, sont les phénomènes volcaniques les plus dangereux.Les deux régimes de panache stable et de colonne en effondrement peuvent se succéder
3
Introduction générale
plusieurs fois au sein d’une même éruption, ce qui ne facilite pas la tâche de surveillancedes volcanologues en observatoires.
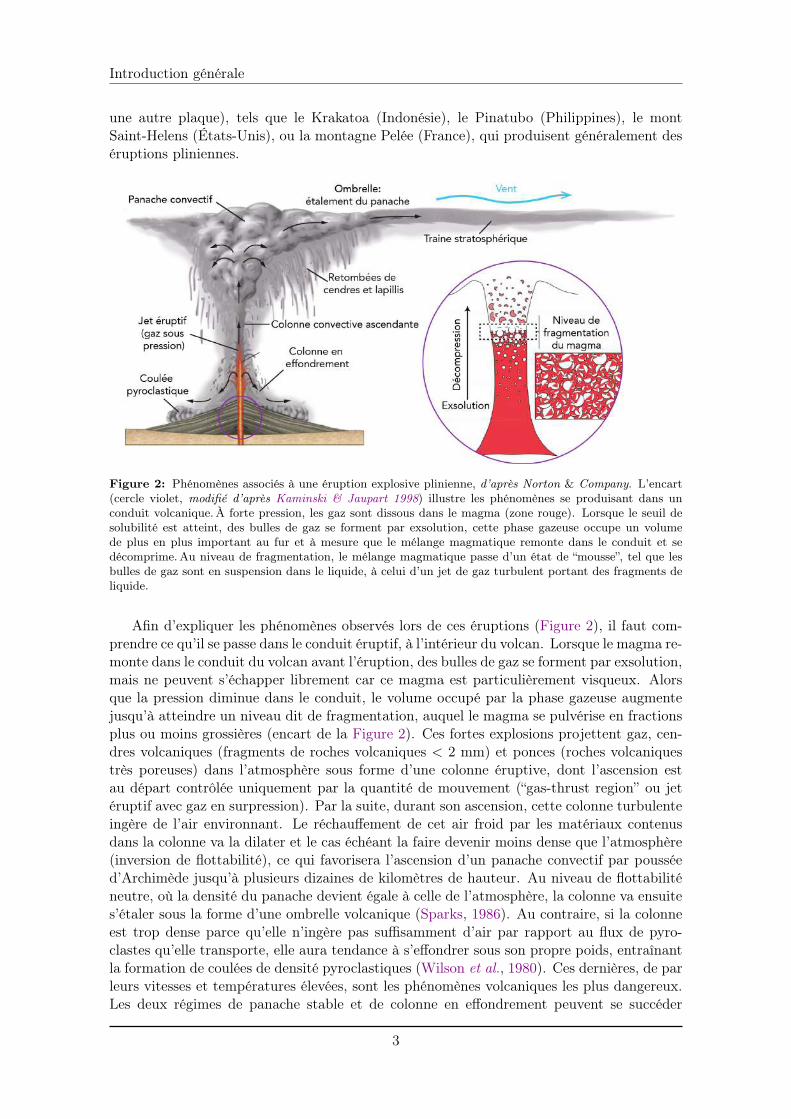
Figure 3: Illustration des deux principaux régimes d’une éruption plinienne : panache plinien stableassocié à des retombées de cendres (colonne de gauche) et colonne en effondrement associée à des coulées dedensité pyroclastiques meurtrières (colonne de droite). De haut en bas et de gauche à droite: éruptions del’Etna (Italie) en décembre 2015 et du Santiaguito (Guatemala) en 2016, voitures et bâtiments recouverts decendres après l’éruption du Rabaul (Papouasie-Nouvelle-Guinée) en 1984, et moulages de corps calcinés parles coulées de densité pyroclastiques du Vésuve (Italie) de 79. Crédits: Conred, USGS, A. Michaud-Dubuy.
Si les volumes produits par les éruptions pliniennes stables ou avec colonnes en effon-drement sont très similaires, leurs conséquences sur l’environnement sont très différentes(Figure 3). Dans le cas du régime plinien stable, le panache et son ombrelle vont injecterdes cendres et des gaz volcaniques à très haute altitude, où les vents stratosphériques lesdispersent sur de très grandes distances à l’échelle d’un hémisphère voire de l’ensemble duglobe terrestre. L’interaction entre le dioxyde de soufre d’origine volcanique et les gaz atmo-sphériques vont entraîner la création d’acide sulfurique sous forme d’aérosols. Ces dernierspeuvent rester en suspension dans l’atmosphère pendant plusieurs semaines, voire plusieursmois, et faire plusieurs fois le tour de la Terre. Ce phénomène peut occasionner des re-froidissements globaux pouvant aller de -0,5 �C (comme à la suite de l’éruption du Pinatubo,Philippines, en 1991, Self et al. 1996) à plus de -6 �C (comme estimé suite à l’éruption dusupervolcan du Toba, Indonésie, il y a 73 000 ans, Williams 2012) et entraîner des pertesde récoltes, famines, épidémies, etc. À l’échelle plus locale, les éruptions pliniennes stablesauront comme conséquences directes des retombées de cendres entraînant des difficultés res-piratoires (Horwell & Baxter, 2006), des dommages matériels sur les habitations, les zonesagricoles, et les routes, ainsi que des perturbations des voies de communication et du traficaérien (Blake et al., 2017) (Figure 3).
4
Introduction générale
Dans le cas d’un régime plinien instable, les conséquences seront autrement plus drama-tiques localement. Les coulées de densité pyroclastiques formées par l’effondrement de lacolonne volcanique sont souvent très concentrées et canalisées dans les vallées, elles dévalentdonc les pentes du volcan à grande vitesse (> 300 km/h). Ces caractéristiques, combinéesà leur haute température (300 à 500 �C) et leur composition (gaz, cendres et roches vol-caniques), en font le phénomène volcanique le plus dévastateur qui soit, ne laissant rienderrière son passage. Les moulages des corps calcinés des victimes de l’éruption du Vésuveen 79, retrouvés lors de fouilles archéologiques à Pompéi, donnent une idée de la brutalitédu phénomène (Figure 3).
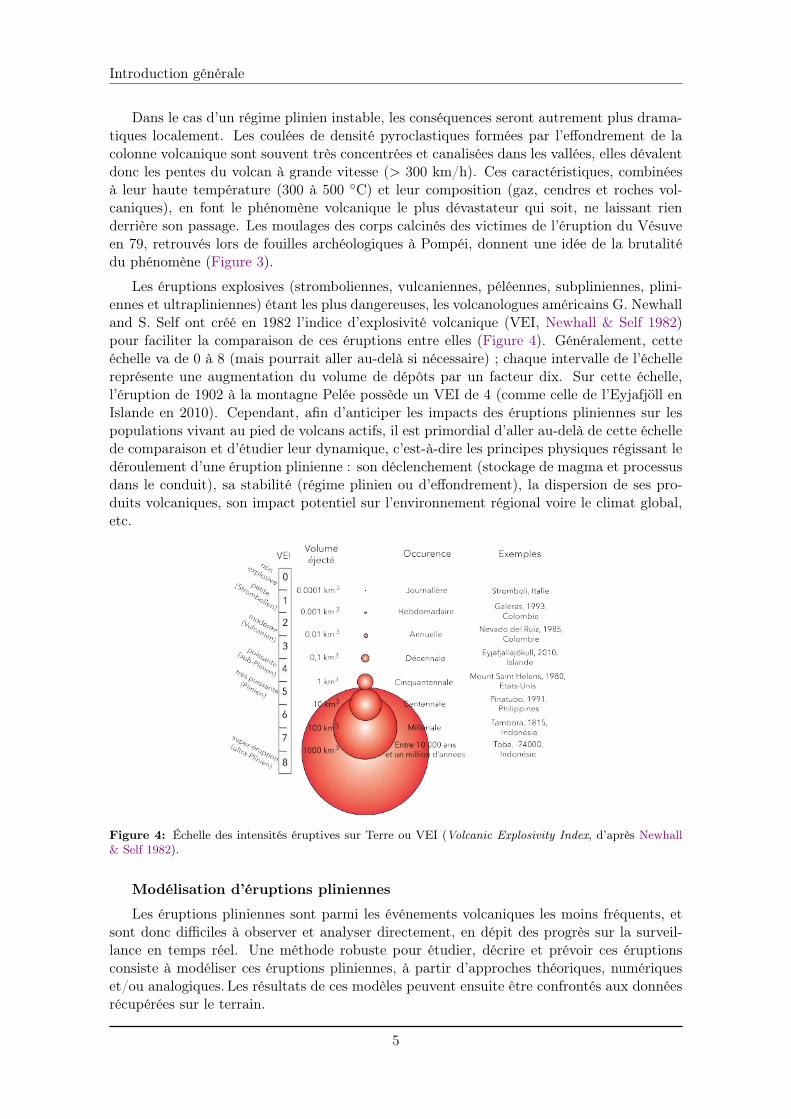
Les éruptions explosives (stromboliennes, vulcaniennes, péléennes, subpliniennes, plini-ennes et ultrapliniennes) étant les plus dangereuses, les volcanologues américains G. Newhalland S. Self ont créé en 1982 l’indice d’explosivité volcanique (VEI, Newhall & Self 1982)pour faciliter la comparaison de ces éruptions entre elles (Figure 4). Généralement, cetteéchelle va de 0 à 8 (mais pourrait aller au-delà si nécessaire) ; chaque intervalle de l’échellereprésente une augmentation du volume de dépôts par un facteur dix. Sur cette échelle,l’éruption de 1902 à la montagne Pelée possède un VEI de 4 (comme celle de l’Eyjafjöll enIslande en 2010). Cependant, afin d’anticiper les impacts des éruptions pliniennes sur lespopulations vivant au pied de volcans actifs, il est primordial d’aller au-delà de cette échellede comparaison et d’étudier leur dynamique, c’est-à-dire les principes physiques régissant ledéroulement d’une éruption plinienne : son déclenchement (stockage de magma et processusdans le conduit), sa stabilité (régime plinien ou d’effondrement), la dispersion de ses pro-duits volcaniques, son impact potentiel sur l’environnement régional voire le climat global,etc.
Figure 4: Échelle des intensités éruptives sur Terre ou VEI (Volcanic Explosivity Index, d’après Newhall& Self 1982).
Modélisation d’éruptions pliniennes
Les éruptions pliniennes sont parmi les événements volcaniques les moins fréquents, etsont donc difficiles à observer et analyser directement, en dépit des progrès sur la surveil-lance en temps réel. Une méthode robuste pour étudier, décrire et prévoir ces éruptionsconsiste à modéliser ces éruptions pliniennes, à partir d’approches théoriques, numériqueset/ou analogiques. Les résultats de ces modèles peuvent ensuite être confrontés aux donnéesrécupérées sur le terrain.
5
Introduction générale
Une première génération de modèles physiques 1D, a été conçue dans les années 1970 à1990 (Wilson, 1976; Woods, 1988). Ces modèles, bien que simplifiés, ont permis d’expliquerles principes fondamentaux des grands processus volcaniques. La deuxième génération demodèles, qui a vu le jour après 1990, est plus sophistiquée. Elle voit le développement demodèles 1D améliorés, 2D, et la naissance des premiers modèles 3D permettant de mieux ap-préhender les processus volcaniques et leurs interactions entre eux. Trois grands “domaines”de processus volcaniques proches de la source sont reproduits par ces modèles : les processusliés à la dynamique des zones de stockage magmatique, ceux liés au conduit volcanique, etenfin les processus de surface. Mes travaux de thèse étant dédiés à l’étude de la dynamiquedes colonnes volcaniques issues d’éruptions pliniennes, je ne détaillerai que l’évolution de cedernier type de modèles.
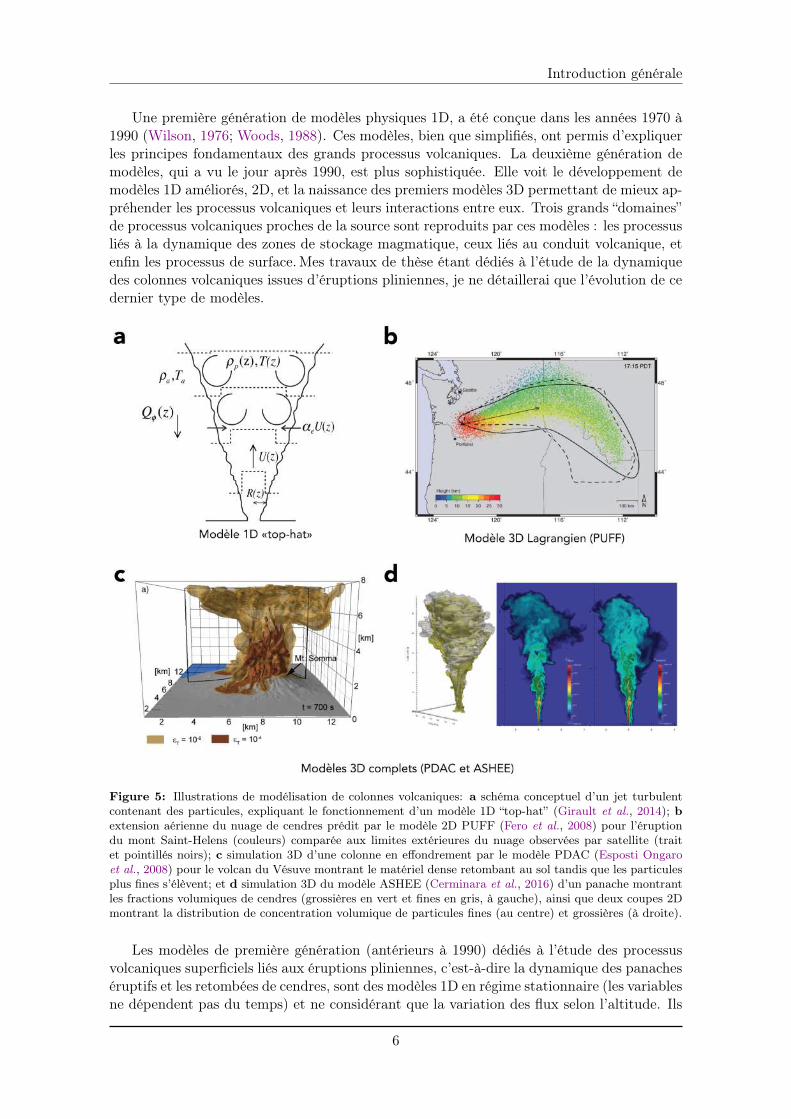
Figure 5: Illustrations de modélisation de colonnes volcaniques: a schéma conceptuel d’un jet turbulentcontenant des particules, expliquant le fonctionnement d’un modèle 1D “top-hat” (Girault et al., 2014); b
extension aérienne du nuage de cendres prédit par le modèle 2D PUFF (Fero et al., 2008) pour l’éruptiondu mont Saint-Helens (couleurs) comparée aux limites extérieures du nuage observées par satellite (traitet pointillés noirs); c simulation 3D d’une colonne en effondrement par le modèle PDAC (Esposti Ongaroet al., 2008) pour le volcan du Vésuve montrant le matériel dense retombant au sol tandis que les particulesplus fines s’élèvent; et d simulation 3D du modèle ASHEE (Cerminara et al., 2016) d’un panache montrantles fractions volumiques de cendres (grossières en vert et fines en gris, à gauche), ainsi que deux coupes 2Dmontrant la distribution de concentration volumique de particules fines (au centre) et grossières (à droite).
Les modèles de première génération (antérieurs à 1990) dédiés à l’étude des processusvolcaniques superficiels liés aux éruptions pliniennes, c’est-à-dire la dynamique des panacheséruptifs et les retombées de cendres, sont des modèles 1D en régime stationnaire (les variablesne dépendent pas du temps) et ne considérant que la variation des flux selon l’altitude. Ils
6
Introduction générale
souvent issus d’une amélioration de la formulation globale (sur un volume de contrôle donné)dérivée de Morton et al. (1956) des principes de conservation de la masse, de la quantitéde mouvement et de l’énergie. On considère dans ce formalisme “top-hat” que toutes lesvariables dynamiques sont constantes à une altitude donnée dans la colonne et nulles endehors (Figure 5a). À une altitude z correspond ainsi une valeur de vitesse, et de densitévalable depuis les bords jusqu’au coeur de la colonne : on suppose donc que le panache estparfaitement mélangé par un entraînement turbulent de fluide ambiant dont le coefficientest supposé constant.
Wilson (1976) analysa seulement la partie basale de la colonne (“gas-thrust region”) enconsidérant son comportement similaire à celui d’un jet pur (se déplaçant uniquement grâceà sa quantité de mouvement). Les résultats de ce travail ont ensuite été appliqués auxpremières études sur l’instabilité et l’effondrement d’une colonne, et sur la production descoulées de densité pyroclastiques (Sparks & Wilson, 1976; Sparks et al., 1978). Les modèlesanalysant seulement la partie convective de la colonne (i.e. le panache ; Sparks 1986; Wilson& Walker 1987) ont permis de démontrer la relation entre la hauteur maximale atteinte parla colonne et son débit, d’étudier les variations de rayon, de densité et de vitesse en fonctionde l’altitude, et de quantifier l’impact de la stratification atmosphérique sur la hauteurmaximale de colonne. Sparks (1986) est le premier à prendre en compte le vent et l’ombrelledans son modèle, ce qui permet de prédire la dispersion du matériel volcanique fin dansl’ombrelle. Sur cette base, Carey & Sparks (1986) ont développé un modèle inverse quifournit la méthode la plus populaire actuellement pour déduire des dépôts retrouvés sur leterrain, la hauteur maximale de la colonne éruptive et les profils de vents. Enfin, les mo-dèles analysant la colonne entière (jet + panache) prennent en compte l’entraînement d’airatmosphérique dans la colonne, et la conservation de l’énergie et son effet sur la densité dupanache (Woods, 1988) ; ainsi que l’effet de la sédimentation et du déséquilibre thermiquesur l’effondrement de colonne (Woods & Bursik, 1991).
Depuis 1990, les modèles eulériens (permettant de calculer l’évolution des grandeurs clefsde l’écoulement) 1D ont notamment été améliorés/développés pour l’étude de la sédimenta-tion (Bursik et al., 1992; Ernst et al., 1996; Bonadonna et al., 1998), de la fragmentation dumagma dans le conduit et de la distribution de tailles de grains (PPM, Kaminski & Jaupart1998, 2001; Girault et al. 2014), de la réduction de l’entraînement dans la partie basalede la colonne (PPM, Kaminski et al. 2005; Carazzo et al. 2006, 2008a,b), de la forme ducratère (Woods & Bower, 1995; Koyaguchi et al., 2010), de la condensation ou de la forma-tion de glace dans la colonne (PLUMERIA, Mastin 2007), et de l’effet du vent (PUFFIN,Bursik 2001; Degruyter & Bonadonna 2013; PLUMERISE, Woodhouse et al. 2013; PPM,Girault et al. 2016) sur la dynamique globale de la colonne volcanique. Ces modèles sontégalement communément utilisés pour reconstruire des éruptions passées (comme celui deKoyaguchi & Ohno 2001a,b) ou dans des buts opérationnels (gestion de crise par exemple).Le modèle PPM (Paris Plume Model), développé dans notre équipe de Dynamique des Flu-ides Géologiques à l’IPGP par les études successives citées plus haut, a permis d’explorerséparément les effets de la fragmentation du magma dans le conduit et de l’entraînementsur la stabilité des colonnes volcaniques, tandis que l’effet de la distribution de tailles degrains et du vent n’ont été testés que sur la hauteur maximale de colonne. L’effet combinéde tous ces phénomènes sur l’effondrement de colonne n’a pour l’instant jamais été étudié.
Des modèles 2D ont également permis de passer du calcul de valeurs moyennes le long del’axe principal de la colonne à une distribution spatiale horizontale. Ces modèles sont ditstransitoires multiphases et permettent de prendre en compte à la fois la partie ascendanteet la partie descendante d’une colonne en effondrement (Neri & Dobran, 1994; Clarke et al.,2002).
7
Introduction générale
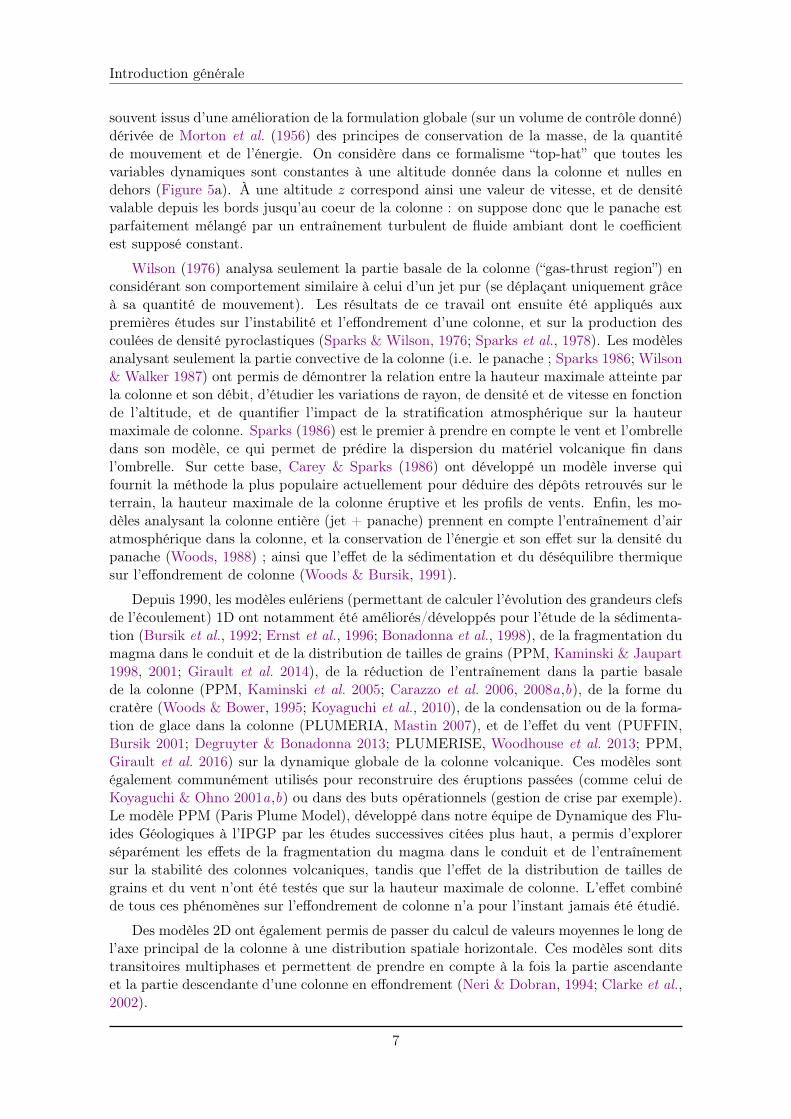
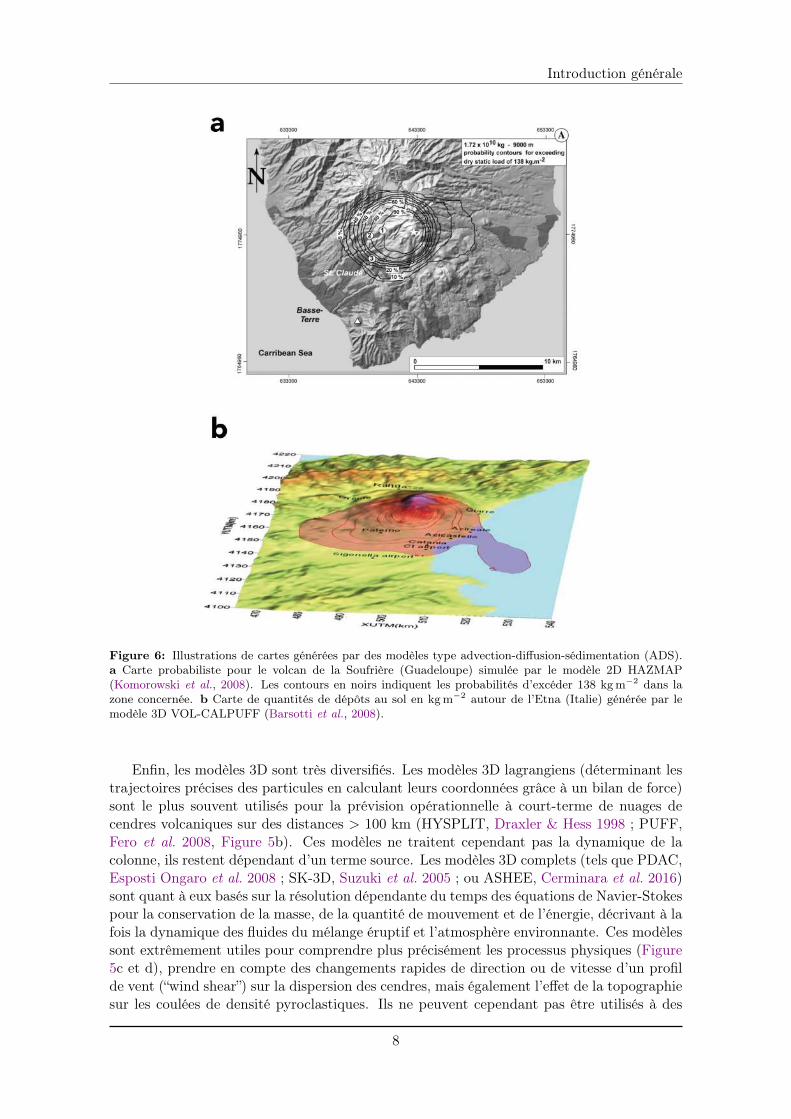
Figure 6: Illustrations de cartes générées par des modèles type advection-diffusion-sédimentation (ADS).a Carte probabiliste pour le volcan de la Soufrière (Guadeloupe) simulée par le modèle 2D HAZMAP(Komorowski et al., 2008). Les contours en noirs indiquent les probabilités d’excéder 138 kgm�2 dans lazone concernée. b Carte de quantités de dépôts au sol en kgm�2 autour de l’Etna (Italie) générée par lemodèle 3D VOL-CALPUFF (Barsotti et al., 2008).
Enfin, les modèles 3D sont très diversifiés. Les modèles 3D lagrangiens (déterminant lestrajectoires précises des particules en calculant leurs coordonnées grâce à un bilan de force)sont le plus souvent utilisés pour la prévision opérationnelle à court-terme de nuages decendres volcaniques sur des distances > 100 km (HYSPLIT, Draxler & Hess 1998 ; PUFF,Fero et al. 2008, Figure 5b). Ces modèles ne traitent cependant pas la dynamique de lacolonne, ils restent dépendant d’un terme source. Les modèles 3D complets (tels que PDAC,Esposti Ongaro et al. 2008 ; SK-3D, Suzuki et al. 2005 ; ou ASHEE, Cerminara et al. 2016)sont quant à eux basés sur la résolution dépendante du temps des équations de Navier-Stokespour la conservation de la masse, de la quantité de mouvement et de l’énergie, décrivant à lafois la dynamique des fluides du mélange éruptif et l’atmosphère environnante. Ces modèlessont extrêmement utiles pour comprendre plus précisément les processus physiques (Figure5c et d), prendre en compte des changements rapides de direction ou de vitesse d’un profilde vent (“wind shear”) sur la dispersion des cendres, mais également l’effet de la topographiesur les coulées de densité pyroclastiques. Ils ne peuvent cependant pas être utilisés à des
8
Introduction générale
fins prévisionnelles car souvent trop longs en temps de calcul.
Treize modèles 1D et 3D ont été comparés lors d’un récent exercice (Costa et al., 2016)durant lequel deux cas ont été simulés par chacun des modèles : un cas de “strong plume”(c’est-à-dire une colonne “forte”) soumis à peu de vent, et un cas de “weak plume” (unecolonne “faible”) soumis à un environnement très venteux. L’exercice a démontré que dansle cas du strong plume, les modèles 1D et 3D prédisent des hauteurs maximales de colonnessimilaires, mais divergent sur les caractéristiques (température, fraction solide, etc) de lacolonne. Dans le cas du weak plume et d’un environnement très venteux, les deux types demodèles divergent fortement dans leurs prédictions de hauteurs de colonnes. Ces conclusionsmettent en avant la nécessité de mieux contraindre l’effet du vent dans les modèles 1D, etde paramétrer plus précisement l’entraînement d’air atmosphérique dans la colonne dû auvent (Costa et al., 2016).
Tous ces modèles 1D, 2D et 3D précédemment décrits ont pour but de simuler le panachevolcanique pour étudier les conditions contrôlant l’altitude maximale de la colonne (quidétermine la hauteur d’injection des cendres dans l’atmosphère) et l’effondrement de colonne(qui rend l’éruption bien plus dangereuse). La dispersion des cendres volcaniques dansl’atmosphère a également été étudiée numériquement à l’aide de modèles basés sur deséquations d’advection-diffusion-sédimentation (ADS). Ces modèles eulériens peuvent être2D (HAZMAP, Macedonio et al. 2005 ; ASHFALL, Hurst & Turner 1999 ; TEPHRA,Bonadonna et al. 2005) ou 3D (FALL3D, Costa et al. 2006 ; VOL-CALPUFF, Barsottiet al. 2008 ; ASH3D, Schwaiger et al. 2012). Les modèles 2D permettent de générer descartes probabilistes basées sur des calculs de masses de particules déposées au sol (Figure 6a).Ils ne prennent pas en compte la dynamique de la colonne, mais seulement un point source.Les modèles 3D permettent de calculer des concentrations de téphra dans l’atmosphèreou des masses de dépôts au sol (Figure 6b) tout en incluant une description détaillée de lacolonne volcanique. Ces deux types de modèles ont été comparés par Scollo et al. (2008), quimontrent que les résultats sont hautement sensibles aux incertitudes des paramètres d’entrée(hauteur maximale de colonne, débit de l’éruption...). Si les erreurs sur ces estimations sontréduites, les prédictions des modèles convergent entre elles. Ces modèles de type ADS sontsouvent utilisés pour des prévisions en quasi temps réel à des fins opérationnelles, maiségalement pour la modélisation d’évènements passés ou pour la caractérisation de l’aléa.
L’aléa volcanique à la Martinique
Les modèles numériques sont couramment utilisés pour caractériser l’aléa volcanique ex-plosif permettant dans un second temps d’évaluer les risques volcaniques. L’aléa représentela probabilité qu’un phénomène naturel (une coulée de lave par exemple) se produise à uncertain endroit et moment, contrairement au risque qui lui représente la combinaison entrel’aléa et la vulnérabilité des enjeux (personnes, bâtiments, biens) présents dans la zone con-sidérée (la destruction totale d’une maison par une coulée de lave par exemple). Le risqueest donc évalué par la relation suivante (United Nations, 1992) :
Risque = Aléa ⇥ Vulnérabilité ⇥ Enjeux
En effet, pour qu’il y ait un risque lié au volcan, il faut qu’en plus du phénomène volcaniqueen lui-même, il y ait des enjeux menacés par ce phénomène (à ce titre, un volcan en éruptionsitué sur une île déserte représente un aléa, mais pas un risque). Pour mettre en oeuvre cesmodèles numériques il faut bien sûr qu’ils soient basés sur une théorie physique solide, et queleurs résultats aient été dûment validés, soit par du benchmarking, soit par des expériencesen laboratoire (comme évoqué dans la précédente section). Mais en complément, ils doiventégalement reposer sur des données de terrain qui permettent de proposer des scénarios
9
Introduction générale
éruptifs. En effet, l’étude des magmas éruptés et des dépôts volcaniques est nécessaire pourétudier et comprendre les éruptions passées (Balcone-Boissard et al., 2010).
Afin de produire une carte d’aléa volcanique, représentant uniquement les zones im-pactées par des phénomènes volcaniques en cas de future éruption, il faut donc tout d’abordconnaître l’histoire passée du volcan. Actuellement, à la Martinique, la carte d’aléa uti-lisée dans le cadre du plan ORSEC (Organisation de la réponse de la sécurité civile) estcelle élaborée par Stieltjes & Mirgon (1998) du BRGM (Bureau de recherches géologiqueset minières) (Figure 7). Elle est basée sur l’histoire éruptive connue de la montagne Peléeétablie par Westercamp & Traineau (1983) sur les 5 000 dernières années. Dans cette périodede référence, 23 éruptions magmatiques (péléennes et pliniennes) ont été identifiées (West-ercamp & Traineau, 1983), généralement associées à des éruptions phréatiques (ne mettanten jeu que le système hydrothermal du volcan, sans expulsion de magma frais - de façonanalogue à la crise de 1976 en Guadeloupe). Ces trois types d’éruptions génèrent plusieursaléas : des retombées de cendres, des intrusions (dômes)/coulées de lave, des coulées de den-sité pyroclastiques, et des émanations de gaz. Les études effectuées sur la montagne Peléeévoquent également des lahars (coulées de boue remobilisant des matériaux volcaniques,Aubaud et al. 2013), des mouvements de terrain (liés à des effondrements de flancs parexemple, Le Friant et al. 2003), et des tsunamis liés à ces lahars et mouvements de terrain.
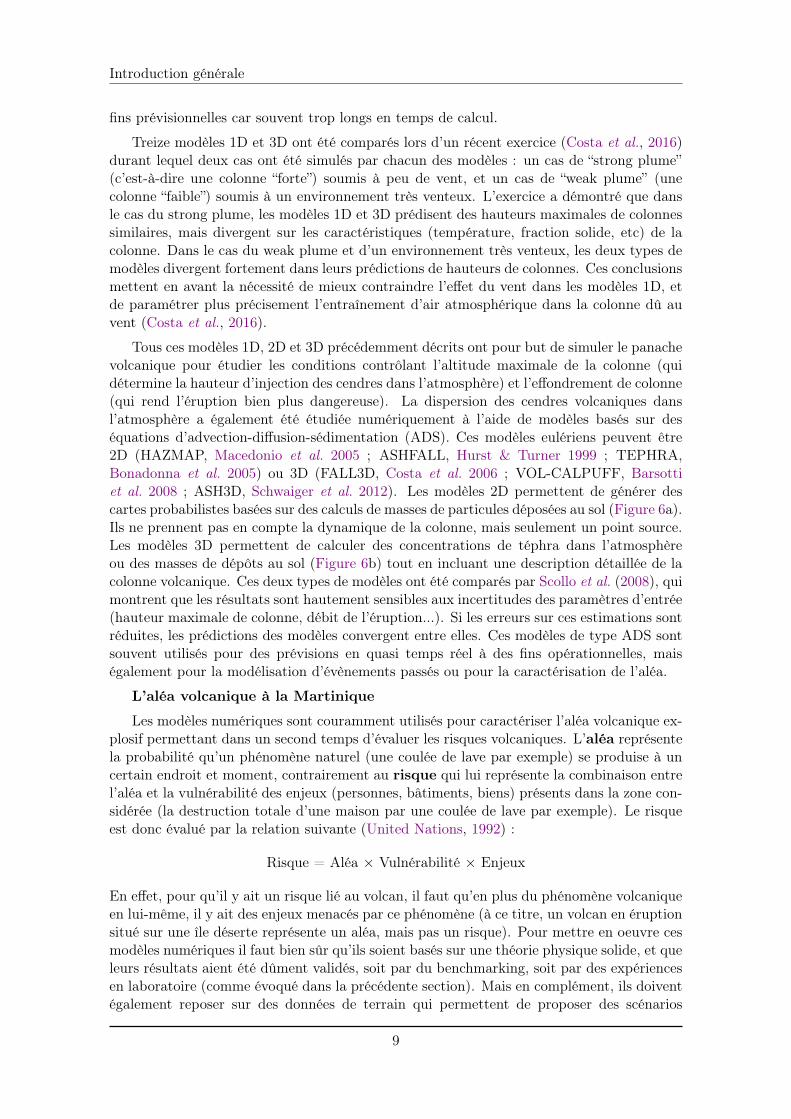
Cependant, seules des informations datant des années 1980 et portant sur les seuleséruptions récentes connues sont incluses dans cette carte : les éruptions pliniennes P1 (⇡ an1300 de notre ère), P2 (⇡ an 280) et P3 (⇡ an 79) (Traineau et al., 1989), et les éruptionspéléennes récentes de 1929-1932, 1902-1905 (Lajoie & Boudon, 1989), Nuées de la rivièredes Pères (NRP, entre 1310 et 1625), Nuées d’Ajoupa Bouillon (NAB, entre -550 et -850)et Nuées de Pointe la Mare (NPM, ⇡ -2450). Les éruptions plus anciennes identifiées parWestercamp & Traineau (1983) n’ont en effet jamais été étudiées en détail. Stieltjes &Mirgon (1998) ont donc établi, en se basant sur ces huit scénarios, des matrices “intensité⇥ fréquence” afin de quantifier pour chaque zone et chacun des aléas cités plus haut, uncoefficient d’exposition à cet aléa. Ils ont ensuite pu construire des cartes pour chaquealéa, qu’ils ont combinées pour produire la carte intégrée d’aléa volcanique à la Martiniqueprésentée en Figure 7. Cette carte synthétise donc l’extension spatiale probable des sept aléasconsidérés, dans l’hypothèse de l’éruption la plus puissante possible à la montagne Pelée. Onobserve que le nord de la Martinique est marqué par un aléa volcanique considérable, maiségalement que certaines zones (principalement côtières) au sud pourraient être menacées encas de future éruption. La ville de Fort-de-France (zone la plus peuplée de l’île) et l’aéroportinternational Aimé Césaire sont quant à eux classés en zone d’exposition faible à nul.
Le risque volcanique peut être quantifié à partir de cette carte d’aléa en utilisant desfonctions de vulnérabilité qui permettent de moduler les risques d’endommagements/pertespotentiels selon les éléments exposés, et l’intensité des phénomènes les menaçant (Leone,2004). En considérant 113 000 bâtiments présents sur l’île de la Martinique dont les tauxd’endommagement ont été modulés par les mêmes niveaux d’intensité d’aléa volcaniquefournis par Stieltjes & Mirgon (1998), il est possible de calculer un indice de risque depertes absolues (encart de la Figure 7). La population est fortement réduite dans le nord del’île (principalement à cause de la catastrophe de 1902 et du relief escarpé), pourtant cettecarte de risque montre que les conséquences d’une éruption volcanique maximale seraienttrès importantes puisque près de 8 500 bâtiments et 308 km de routes et chemins sont situésen zone d’aléa majeur (délimitée par le perimètre potentiel d’évacuation en pointillé sur lacarte). On peut noter que le risque volcanique est nul au-delà de la limite déterminée par lacarte d’aléa, même si les enjeux (population et infrastructures) sont plus importants dansle sud de l’île.
10
Introduction générale
Figure 7: Carte d’aléa volcanique intégrée pour la Martinique montrant le niveau d’exposition potentielmaximal de chaque zone de l’île, simplifiée d’après Stieltjes & Mirgon (1998). Les cercles correspondent auxzones concernées par les aléas de retombées aériennes de cendres, d’émanations de gaz et d’intrusions/couléesde lave ; les figurés autour de la montagne Pelée aux zones concernées par les aléas de coulées de densitépyroclastiques, de lahars et de mouvements de terrain ; et les figurés le long des côtes aux zones concernéespar l’aléa tsunami d’origine volcanique. L’encart montre les niveaux de risque volcanique exprimés parun indice de pertes absolues liées à l’endommagement du bâti en cas d’éruption maximale crédible de lamontagne Pelée, ainsi que le périmètre d’évacuation probable en cas d’éruption magmatique (ligne pointillée,Leone 2004).
Depuis la création de cette carte d’aléa, les trois éruptions pliniennes les plus récentes,P1, P2 et P3 ont été revisitées (Carazzo et al., 2012, 2019, 2020). Ces études nous montrentque ces trois éruptions ont des VEI similaires (4�5) et qu’elles ont toutes les trois alternéentre des phases de panache stable et des phases d’effondrement de colonne avec productionde coulées de densité pyroclastiques. Cependant, elles se différencient dans leurs axes dedispersion. Les éruptions P1 et P3 ont en effet projeté leurs cendres vers les flancs ouest-sud-ouest du volcan tandis que l’éruption P2 a envoyé son matériel en direction du nord-est,ce qui marque l’importance de l’orientation du vent pendant l’éruption. Il apparaît doncimportant de savoir si les éruptions pliniennes plus anciennes de la montagne Pelée repro-duisent ce même schéma ou introduisent une variabilité supplémentaire dans la dispersion,ce qui modifierait fortement la carte d’aléa intégrée et augmenterait sensiblement le risque
11
Bibliographie
dans le sud de l’île.
Une nouvelle étude des éruptions pliniennes de la montagne Pelée
Les travaux de thèse présentés dans ce manuscrit s’organisent en trois grands axes : larevisite de l’histoire éruptive de la montagne Pelée et l’identification de scénarii probablesde futures éruptions (Partie 1), la modélisation physique de colonnes volcaniques en vue depréciser les conditions de stabilité ou d’effondrement de colonne (en présence d’un vent fortnotamment, Partie 2), et enfin la caractérisation de l’aléa volcanique plinien à la Martinique(Partie 3). Chaque partie étant composée de deux chapitres, le manuscrit se décomposecomme suit:
U Le chapitre 1 décrit le contexte de l’étude, les méthodes employées pour revisiterl’histoire éruptive, ainsi que les principaux résultats de deux nouvelles missions de ter-rain menées à la Martinique. Ces dernières nous ont permis d’identifier des éruptionspliniennes encore inconnues à la montagne Pelée.
U Le chapitre 2 présente la reconstruction de ces éruptions en déterminant leurs paramè-tres éruptifs (volume, hauteur de colonne, débit, durée, dispersion), afin de pouvoircomparer ces anciennes éruptions avec celles plus récentes et envisager un ensembleplus complet de scénarii probables.
U Le chapitre 3 détaille comment le modèle 1D PPM a été utilisé pour étudier les effetscombinés de la distribution de tailles de grains et de la réduction d’entraînement à labase de la colonne sur les conditions de stabilité d’une colonne volcanique.
U Le chapitre 4 propose de nouvelles expériences analogiques permettant d’étudier deséruptions pliniennes en laboratoire, afin de caractériser plus précisément l’entraînementd’air atmosphérique dans la colonne dû au vent et d’étudier l’effet de ce dernier surl’effondrement de colonne, grâce à PPM.
U Le chapitre 5 présente l’utilisation qui a été faite du modèle 2D HAZMAP (Macedonioet al., 2005) pour simuler et étudier la dispersion des produits volcaniques issus deséruptions pliniennes connues de la montagne Pelée.
U Enfin, le chapitre 6 combine l’ensemble des résultats précédents afin d’aboutir à unenouvelle carte d’aléa volcanique plinien à la Martinique.
La conclusion synthétise les résultats de cette thèse et propose des éléments de réflexionpour établir de nouvelles pistes de recherche. Le chapitre 3, ainsi qu’une partie des chapitres2 et 5 sont déjà publiés dans Michaud-Dubuy et al. (2018) et Michaud-Dubuy et al. (2019).
BibliographieAubaud, C., Athanase, J.-E., Clouard, V., Barras, A.-V. & Sedan, O. 2013 A review of historical
landslides, floods, and lahars in the Precheur river catchment, Montagne Pelée volcano (Martinique,Lesser Antilles). Bull. Soc. Géol. Fr. 184 (I), 137–154.
Balcone-Boissard, H., Boudon, G. & Villemant, B. 2010 Textural and geochemical constraints oneruptive style of the 79 AD eruption at Vesuvius. Bull. Volcanol. 73, 279–294.
Barsotti, S., Neri, A. & Scire, J.S. 2008 The VOL-CALPUFF model for atmospheric ash dispersal:1. Approach and physical formulation. J. Geophys. Res. 113 (B03208).
12
Bibliographie
Blake, D.M., Deligne, N.I., Wilson, T.M. & Wilson, G. 2017 Improving volcanic ash fragilityfunctions through laboratory studies: example of surface transportation networks. J. Appl. Volcanol.6 (16).
Bonadonna, C., Connor, C.B., Houghton, B.F., Connor, L., Byrne, M., Laing, A. & Hincks,T.K. 2005 Probabilistic modeling of tephra dispersal: Hazard assessment of a multiphase rhyolitic erup-tion at Tarawera, New Zealand. J. Geophys. Res. 110 (B03203).
Bonadonna, C., Ernst, G.G.J. & Sparks, R.S.J. 1998 Thickness variations and volume estimatesof tephra fall deposits: The importance of particle Reynolds number. J. Volcanol. Geotherm. Res. 81,173–187.
Bursik, M. 2001 Effect of wind on the rise height of volcanic plumes. Geophys. Res. Lett. 28, 3621–3624.
Bursik, M.I., Sparks, R.S.J., Gilbert, J.S. & Carey, S.N. 1992 Sedimentation of tephra by volcanicplumes: I. Theory and its comparison with a study of the Fogo A plinian deposit, Sao Miguel (Azores).Bull. Volcanol. 54, 329–344.
Carazzo, G., Kaminski, E. & Tait, S. 2006 The route to self-similarity in turbulent jets and plumes. J.Fluid Mech. 547, 137–148.
Carazzo, G., Kaminski, E. & Tait, S. 2008a On the dynamics of volcanic columns: A comparison offield data with a new model of negatively buoyant jets. J. Volcanol. Geotherm. Res. 178, 94–103.
Carazzo, G., Kaminski, E. & Tait, S. 2008b On the rise of turbulent plumes: Quantitative effects of vari-able entrainment for submarine hydrothermal vents, terrestrial and extra terrestrial explosive volcanism.J. Geophys. Res. Solid Earth 113, 1–19.
Carazzo, G., Tait, S. & Kaminski, E. 2019 Marginally stable recent Plinian eruptions of Mt. Peléevolcano (Lesser Antilles): the P2 AD 280 eruption. Bull. Volcanol. 81, 1–17.
Carazzo, G., Tait, S., Kaminski, E. & Gardner, J. E. 2012 The recent Plinian explosive activity ofMt. Pelée volcano (Lesser Antilles): The P1 AD 1300 eruption. Bull. Volcanol. 74, 2187–2203.
Carazzo, G., Tait, S., Michaud-Dubuy, A., Fries, A. & Kaminski, E. 2020 Transition from stablecolumn to partial collapse during the 79 cal CE P3 Plinian eruption of Mt Pelée volcano (Lesser Antilles).J. Volcanol. Geotherm. Res. In press. https://doi.org/10.1016/j.jvolgeores.2019.106764.
Carey, S. & Sparks, R.S.J. 1986 Quantitative models of the fallout and dispersal of tephra from volcaniceruption columns. Bull. Volcanol. 48, 109–125.
Cerminara, M., Esposti Ongaro, T. & Berselli, L.C. 2016 ASHEE-1.0: A compressible, equilibrium-Eulerian model for volcanic ash plumes. Geosci. Model Dev. 9, 697–730.
Clarke, A.B., Voight, B., Neri, A. & Macedonio, G. 2002 Transient dynamics of vulcanian explosionsand column collapse. Nature 415, 897–901.
Costa, A., Macedonio, G. & Folch, A. 2006 A three-dimensional Eulerian model for transport anddeposition of volcanic ashes. Earth Planet. Sci. Lett. 241 (3-4), 634–647.
Costa, A., Suzuki, Y. J., Cerminara, M., Devenish, B. J., Esposti Ongaro, T., Herzog, M.,Van Eaton, A. R., Denby, L. C., Bursik, M., de’ Michieli Vitturi, M., Engwell, S., Neri, A.,Barsotti, S., Folch, A., Macedonio, G., Girault, F., Carazzo, G., Tait, S., Kaminski, E.,Mastin, L. G., Woodhouse, M. J., Phillips, J. C., Hogg, A. J., Degruyter, W. & Bonadonna,C. 2016 Results of the eruptive column model inter-comparison study. J. Volcanol. Geotherm. Res. 326,2–25.
Degruyter, W. & Bonadonna, C. 2013 Impact of wind on the condition for column collapse of volcanicplumes. Earth Planet. Sci. Lett. 377-378, 218–226.
Draxler, R.R. & Hess, G.D. 1998 An overview of the HYSPLIT4 modelling system for trajectories,dispersion and deposition. Aust. Met. Mag. 47, 295–308.
Ernst, G. J., Stephen, R., Sparks, J., Carey, N. & Bursik, M. I. 1996 Sedimentation from turbulentjets and plumes. J. Geophys. Res. 101 (95), 5575–5589.
13
Bibliographie
Esposti Ongaro, T., Neri, A., Menconi, G., de’Michieli Vitturi, M., Marianelli, P., Cavazzoni,C., Erbacci, G. & Baxter, P. J. 2008 Transient 3D numerical simulations of column collapse andpyroclastic density current scenarios at Vesuvius. J. Volcanol. Geotherm. Res. 178 (3), 378–396.
Fero, J., Carey, S.N. & Merrill, J.T. 2008 Simulation of the 1980 eruption of Mount St. Helens usingthe ash-tracking model PUFF. J. Volcanol. Geotherm. Res. 175, 355–366.
Girault, F., Carazzo, G., Tait, S., Ferrucci, F. & Kaminski, E. 2014 The effect of total grain-sizedistribution on the dynamics of turbulent volcanic plumes. Earth Planet. Sci. Lett. 394, 124–134.
Girault, F., Carazzo, G., Tait, S. & Kaminski, E. 2016 Combined effects of total grain-size distribu-tion and crosswind on the rise of eruptive volcanic columns. J. Volcanol. Geotherm. Res. 326, 103–113.
Horwell, C. J. & Baxter, P. J. 2006 The respiratory health hazards of volcanic ash: A review forvolcanic risk mitigation. Bull. Volcanol. 69 (1), 1–24.
Hurst, A.W. & Turner, R. 1999 Performance of the program ashfall for forecasting ashfall during the1995 and 1996 eruptions of Ruapehu volcano. New Zealand J. Geol. Geophys. 42 (4), 615–622.
Kaminski, E. & Jaupart, C. 1998 The size distribution of pyroclasts and the fragmentation sequence inexplosive volcanic eruptions. J. Geophys. Res. 103, 29759–29779.
Kaminski, E. & Jaupart, C. 2001 Marginal stability of atmospheric eruption columns and pyroclasticflow generation. J. Geophys. Res. 106 (B10), 21785–21798.
Kaminski, E., Tait, S. & Carazzo, G. 2005 Turbulent entrainment in jets with arbitrary buoyancy. J.Fluid Mech. 526, 361–376.
Komorowski, J. C., Legendre, Y., Caron, B. & Boudon, G. 2008 Reconstruction and analysis of sub-plinian tephra dispersal during the 1530 A.D. Soufriere (Guadeloupe) eruption: Implications for scenariodefinition and hazards assessment. J. Volcanol. Geotherm. Res. 178, 491–515.
Koyaguchi, T. & Ohno, M. 2001a Reconstruction of eruption column dynamics on the basis of grain sizeof tephra fall deposits. 1. Methods. J. Geophys. Res. 106, 6499–6512.
Koyaguchi, T. & Ohno, M. 2001b Reconstruction of eruption column dynamics on the basis of grain sizeof tephra fall deposits. 2. Application to the Pinatubo 1991 eruption. J. Geophys. Res. 106, 6513–6533.
Koyaguchi, T., Suzuki, Y. J. & Kozono, T. 2010 Effects of the crater on eruption column dynamics.J. Geophys. Res. 115 (7), 1–26.
Lacroix, A. 1904 La Montagne Pelée et ses éruptions. Masson, Paris.
Lajoie, J. & Boudon, G. 1989 The Peléan deposits in the Fort Cemetery of St. Pierre, Martinique: amodel for the accumulation of turbulent nuées ardentes. J. Volcanol. Geotherm. Res. 38, 113–130.
Le Friant, A., Boudon, G., Deplus, C. & Villemant, B. 2003 Large-scale flank collapse events duringthe activity of Montagne Pelée, Martinique, Lesser Antilles. J. Geophys. Res. 108 (B1), 1–15.
Leone, F. 2004 Une approche quantitative de la cartographie des risques naturels: application expéri-mentale au patrimoine bâti de la Martinique (Antilles Françaises). Géomorphologie: Relief, Processus,Environnement 3, 209–222.
Macedonio, G., Costa, A. & Longo, A. 2005 A computer model for volcanic ash fallout and assessmentof subsequent hazard. Comput. Geosci. 31, 837–845.
Mastin, L. G. 2007 A user-friendly one-dimensional model for wet volcanic plumes. Geochem. Geophys.Geosyst. 8 (Q03014).
Michaud-Dubuy, A., Carazzo, G., Kaminski, E. & Girault, F. 2018 A revisit of the role of gasentrapment on the stability conditions of explosive volcanic columns. J. Volcanol. Geotherm. Res. 357,349–361.
Michaud-Dubuy, A., Carazzo, G., Tait, S., Le Hir, G., Fluteau, F. & Kaminski, E. 2019 Impactof wind direction variability on hazard assessment in Martinique (Lesser Antilles): The example of the13.5 ka cal BP Bellefontaine Plinian eruption of Mount Pelée volcano. J. Volcanol. Geotherm. Res. 381,193–208.
14
Bibliographie
Morton, B.R., Taylor, G.I. & Turner, J.S. 1956 Turbulent gravitational convection from maintainedand instantaneous sources. Philos. Trans. R. Soc. A 234, 1–23.
Neri, A. & Dobran, F. 1994 Influence of eruption parameters on the thermofluid dynamics of collapsingvolcanic columns. J. Geophys. Res. 99 (B6), 11833–11857.
Newhall, Christopher G. & Self, Stephen 1982 The volcanic explosivity index (VEI) an estimate ofexplosive magnitude for historical volcanism. J. Geophys. Res. 87 (C2), 1231–1238.
Schwaiger, H.F., Denlinger, R.P. & Mastin, L.G. 2012 ASH3D: A finite-volume, conservative nu-merical model for ash transport and tephra deposition. J. Geophys. Res. 117 (B04204).
Scollo, S., Folch, A. & Costa, A. 2008 A parametric and comparative study of different tephra falloutmodels. J. Volcanol. Geotherm. Res. 176, 199–211.
Self, S., Zhao, J.-X., Holasek, R.E., Torres, R.C. & King, A.J. 1996 The atmospheric impactof the 1991 Mount Pinatubo eruption. In Fire and Mud: Eruptions and Lahars of Mount Pinatubo,Philippines (ed. C.G. Newhall & R.S. Punongbayan), pp. 1089–1115. Philippine Institute of Volcanologyand Seismology, Queen City and University of Washington Press, Seattle.
Sparks, R. S. J. 1986 The dimensions and dynamics of volcanic eruption columns. Bull. Volcanol. 48,3–15.
Sparks, R. S. J. & Wilson, L. 1976 A model for the formation of ignimbrite by gravitational columncollapse. J. Geol. Soc. Lond. 132, 441–451.
Sparks, R. S. J., Wilson, L. & Hulme, G. 1978 Theoretical modelling of the generation, movement andemplacement of pyroclastic flows by column collapse. J. Geophys. Res. 83, 1727–1739.
Stieltjes, L. & Mirgon, C. 1998 Approche méthodologique de la vulnérabilité aux phénomènes vol-caniques : Test d’application sur les réseaux de la Martinique. In Unpublished Internal Report No. R40098 .Bureau de Recherches Géologiques et Minières, Marseille.
Suzuki, Y. J., Koyaguchi, T., Ogawa, M. & Hachisu, I. 2005 A numerical study of turbulent mixingin eruption clouds using a three-dimensional fluid dynamics model. J. Geophys. Res. 110, B08201.
Traineau, H., Westercamp, D., Bardintzeff, J. M. & Miskovsky, J. C. 1989 The recent pumiceeruptions of Mt. Pelée volcano, Martinique. Part I: Depositional sequences, description of pumiceousdeposits. J. Volcanol. Geotherm. Res. 38, 17–33.
United Nations, ed. 1992 Internationally agreed glossary of basic terms related to Disaster Management .Department of Humanitarian Affairs.
Westercamp, D. & Traineau, H. 1983 The past 5,000 years of volcanic activity at Mt. Pelée Martinique(F.W.I.): Implications for assessment of volcanic hazards. J. Volcanol. Geotherm. Res. 17, 159–185.
Williams, M. 2012 The ⇠ 73 ka Toba super-eruption and its impact: History of a debate. QuaternaryInternational 258, 19–29.
Wilson, L. 1976 Explosive Volcanic Eruptions: III. Plinian Eruption Columns. J. R. Astron. Soc. 45,543–556.
Wilson, L., Sparks, R. S. J. & Walker, G. P. L. 1980 Explosive volcanic eruptions - IV. The controlof magma properties and conduit geometry on eruption column behaviour. Geophys. J. R. Astron. Soc.63, 117–148.
Wilson, L. & Walker, G.P.L. 1987 Explosive volcanic eruptions - VI. Ejecta dispersal in plinian erup-tions: the control of eruption conditions and atmospheric properties. Geophys. J. R. Astron. Soc. 89,657–679.
Woodhouse, M. J., Hogg, A. J., Phillips, J. C. & Sparks, R. S. J. 2013 Interaction between volcanicplumes and wind during the 2010 Eyjafjallajökull eruption, Iceland. J. Geophys. Res. Solid Earth 118,92–109.
Woods, A.W. 1988 The fluid dynamics and thermodynamics of eruption columns. Bull. Volcanol. 50,169–193.
15

Bibliographie
Woods, A. W. & Bower, S. M. 1995 The decompression of volcanic jets in a crater during explosiveeruptions. Earth Planet. Sci. Lett. 131, 189–205.
Woods, A. W. & Bursik, M. I. 1991 Particle fallout, thermal disequilibrium and volcanic plumes. Bull.Volcanol. 53, 559–570.
16
Part 1
Geological data and possible eruptive
scenarii in Martinique

Chapter 1
A revisit of the eruptive history of
Mount Pelée volcano
Table of contents1 Introduction . . . . . . . . . . . . . . . . . . . . . . . . . . . . . . . . . . 212 Geological and meteorological setting . . . . . . . . . . . . . . . . . . . . 21
2.1 The Lesser Antilles arc . . . . . . . . . . . . . . . . . . . . . . . . 212.2 Volcanic activity in Martinique . . . . . . . . . . . . . . . . . . . 232.3 Mount Pelée volcano . . . . . . . . . . . . . . . . . . . . . . . . . 262.4 Annual meteorological conditions over Martinique . . . . . . . . . 28
3 Methodology . . . . . . . . . . . . . . . . . . . . . . . . . . . . . . . . . . 303.1 Fieldwork . . . . . . . . . . . . . . . . . . . . . . . . . . . . . . . 303.2 Radiocarbon dating . . . . . . . . . . . . . . . . . . . . . . . . . . 323.3 Grain-size analyses . . . . . . . . . . . . . . . . . . . . . . . . . . 323.4 Eruptive parameters . . . . . . . . . . . . . . . . . . . . . . . . . 34
4 Results . . . . . . . . . . . . . . . . . . . . . . . . . . . . . . . . . . . . . 364.1 Stratigraphic sections . . . . . . . . . . . . . . . . . . . . . . . . . 36
4.1.1 The Mont Parnasse section . . . . . . . . . . . . . . . . 364.1.2 The new OVSM section . . . . . . . . . . . . . . . . . . 364.1.3 The Bellefontaine stadium section . . . . . . . . . . . . 38
4.2 14C ages: chronology of past eruptions . . . . . . . . . . . . . . . 404.3 A refined on-land eruptive history . . . . . . . . . . . . . . . . . . 43
5 Conclusion . . . . . . . . . . . . . . . . . . . . . . . . . . . . . . . . . . . 44
Chapter 1
Résumé du chapitre 1
Les panaches volcaniques produits par les éruptions explosives représentent un aléa majeurdans les zones proches de stratovolcans. Les modèles physiques développés dans les quarantedernières années ont eu pour but de mieux comprendre ces phénomènes naturels et dequantifier les aléas volcaniques. Pour tester ces modèles, nous avons besoin de données deterrain précises et détaillées sur les éruptions passées des volcans actifs. La montagne Peléesur l’île de la Martinique (Petites Antilles), ayant une histoire éruptive très riche, est uneexcellente candidate pour ces phases de validation. Ce volcan est particulièrement célèbrepour son éruption de 1902-1905, caractérisée par plusieurs cycles de croissance/destructionde dômes de lave et responsable du plus lourd bilan humain pour une éruption volcaniqueau vingtième siècle. Ce type d’éruption a d’ailleurs été nommé “péléenne” en référence à lamontagne Pelée par Alfred Lacroix, qui a étudié cette crise éruptive (Lacroix, 1904). Deprécédentes études de terrain effectuées à la Martinique ont démontré que ce volcan n’acependant pas seulement produit des éruptions péléennes dans le passé, mais égalementdes éruptions pliniennes bien plus puissantes sur lesquelles nous avons peu d’informations(Westercamp & Traineau, 1983).
Dans cette première partie du manuscrit, nous nous proposons de revisiter l’histoireéruptive plinienne de la montagne Pelée sur les vingt-quatre derniers milliers d’années grâceà deux nouvelles campagnes de terrain effectuées à la Martinique, et de dégager de cettehistoire éruptive les scénarii des potentielles futures éruptions du volcan. Dans ce chapitre,nous présentons tout d’abord le contexte géologique et météorologique de la Martinique, ainsique la montagne Pelée et son histoire éruptive connue. Nous détaillons ensuite les méthodesutilisées sur le terrain pour reconnaître les dépôts d’éruption, les analyser et les dater. Nosrésultats combinant travaux de terrain et datations au 14
C nous permettent d’établir unenouvelle chronologie des éruptions passées de la montagne Pelée. Celle-ci inclut six nouvelleséruptions dans les derniers vingt-quatre mille ans, dont quatre éruptions pliniennes et deuxpéléennes. En comparant les nouvelles éruptions pliniennes avec les dépôts volcaniques datésen mer, nous remarquons que trois sur quatre correspondent à des événements identifiés aularge de la Martinique, ce qui renforce notre confiance dans cette nouvelle histoire éruptive.
L’histoire éruptive de la montagne Pelée est donc très riche avec au minimum 34 érup-tions magmatiques au cours des derniers 24 000 ans. En se basant sur cette nouvelle histoireéruptive, nous pouvons estimer qu’une éruption plinienne se produit environ tous les 1 800ans à la Martinique, et une éruption magmatique tous les 700 ans.
Parmi ces éruptions nouvellement découvertes, nous avons collecté assez de données(épaisseurs de dépôts et distribution des fragments lithiques à plusieurs affleurements, ainsique des échantillons pour les analyses de tailles de grains) pour aller plus loin et reconstruireles paramètres éruptifs de quatre des nouvelles éruptions (celles nommées Bellefontaine,Balisier, Carbet et Etoile) en utilisant les méthodes décrites dans ce chapitre. Les résultatssont présentés dans le chapitre 2.
20
Chapter 1 1. Introduction
1 Introduction
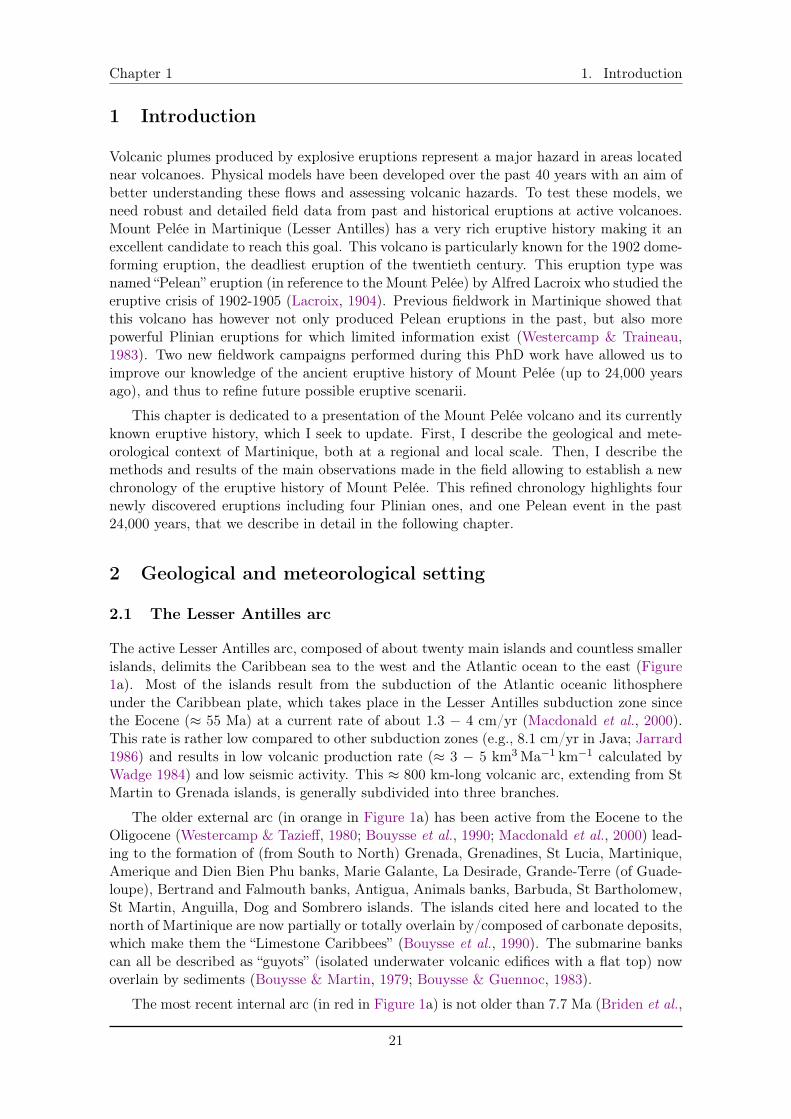
Volcanic plumes produced by explosive eruptions represent a major hazard in areas locatednear volcanoes. Physical models have been developed over the past 40 years with an aim ofbetter understanding these flows and assessing volcanic hazards. To test these models, weneed robust and detailed field data from past and historical eruptions at active volcanoes.Mount Pelée in Martinique (Lesser Antilles) has a very rich eruptive history making it anexcellent candidate to reach this goal. This volcano is particularly known for the 1902 dome-forming eruption, the deadliest eruption of the twentieth century. This eruption type wasnamed “Pelean” eruption (in reference to the Mount Pelée) by Alfred Lacroix who studied theeruptive crisis of 1902-1905 (Lacroix, 1904). Previous fieldwork in Martinique showed thatthis volcano has however not only produced Pelean eruptions in the past, but also morepowerful Plinian eruptions for which limited information exist (Westercamp & Traineau,1983). Two new fieldwork campaigns performed during this PhD work have allowed us toimprove our knowledge of the ancient eruptive history of Mount Pelée (up to 24,000 yearsago), and thus to refine future possible eruptive scenarii.
This chapter is dedicated to a presentation of the Mount Pelée volcano and its currentlyknown eruptive history, which I seek to update. First, I describe the geological and mete-orological context of Martinique, both at a regional and local scale. Then, I describe themethods and results of the main observations made in the field allowing to establish a newchronology of the eruptive history of Mount Pelée. This refined chronology highlights fournewly discovered eruptions including four Plinian ones, and one Pelean event in the past24,000 years, that we describe in detail in the following chapter.
2 Geological and meteorological setting
2.1 The Lesser Antilles arc
The active Lesser Antilles arc, composed of about twenty main islands and countless smallerislands, delimits the Caribbean sea to the west and the Atlantic ocean to the east (Figure1a). Most of the islands result from the subduction of the Atlantic oceanic lithosphereunder the Caribbean plate, which takes place in the Lesser Antilles subduction zone sincethe Eocene (⇡ 55 Ma) at a current rate of about 1.3 � 4 cm/yr (Macdonald et al., 2000).This rate is rather low compared to other subduction zones (e.g., 8.1 cm/yr in Java; Jarrard1986) and results in low volcanic production rate (⇡ 3 � 5 km
3Ma
�1km
�1 calculated byWadge 1984) and low seismic activity. This ⇡ 800 km-long volcanic arc, extending from StMartin to Grenada islands, is generally subdivided into three branches.
The older external arc (in orange in Figure 1a) has been active from the Eocene to theOligocene (Westercamp & Tazieff, 1980; Bouysse et al., 1990; Macdonald et al., 2000) lead-ing to the formation of (from South to North) Grenada, Grenadines, St Lucia, Martinique,Amerique and Dien Bien Phu banks, Marie Galante, La Desirade, Grande-Terre (of Guade-loupe), Bertrand and Falmouth banks, Antigua, Animals banks, Barbuda, St Bartholomew,St Martin, Anguilla, Dog and Sombrero islands. The islands cited here and located to thenorth of Martinique are now partially or totally overlain by/composed of carbonate deposits,which make them the “Limestone Caribbees” (Bouysse et al., 1990). The submarine bankscan all be described as “guyots” (isolated underwater volcanic edifices with a flat top) nowoverlain by sediments (Bouysse & Martin, 1979; Bouysse & Guennoc, 1983).
The most recent internal arc (in red in Figure 1a) is not older than 7.7 Ma (Briden et al.,
21
2. Geological and meteorological setting Chapter 1
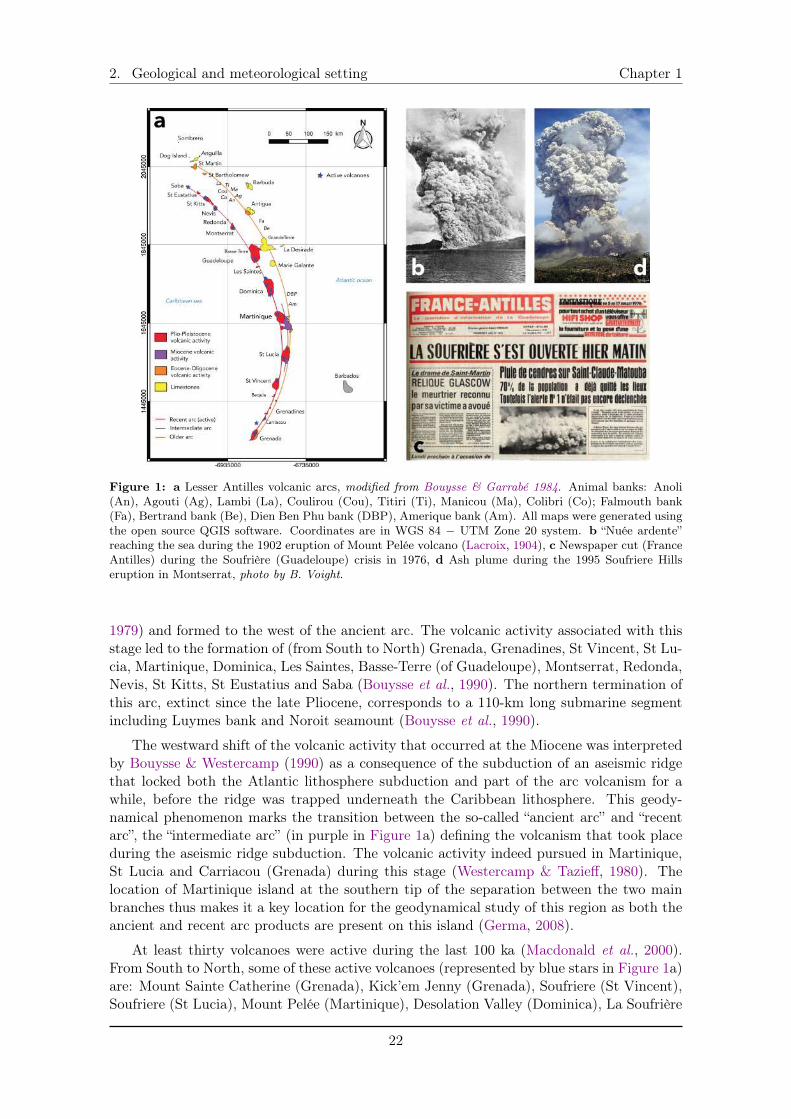
Figure 1: a Lesser Antilles volcanic arcs, modified from Bouysse & Garrabé 1984. Animal banks: Anoli(An), Agouti (Ag), Lambi (La), Coulirou (Cou), Titiri (Ti), Manicou (Ma), Colibri (Co); Falmouth bank(Fa), Bertrand bank (Be), Dien Ben Phu bank (DBP), Amerique bank (Am). All maps were generated usingthe open source QGIS software. Coordinates are in WGS 84 � UTM Zone 20 system. b “Nuée ardente”reaching the sea during the 1902 eruption of Mount Pelée volcano (Lacroix, 1904), c Newspaper cut (FranceAntilles) during the Soufrière (Guadeloupe) crisis in 1976, d Ash plume during the 1995 Soufriere Hillseruption in Montserrat, photo by B. Voight.
1979) and formed to the west of the ancient arc. The volcanic activity associated with thisstage led to the formation of (from South to North) Grenada, Grenadines, St Vincent, St Lu-cia, Martinique, Dominica, Les Saintes, Basse-Terre (of Guadeloupe), Montserrat, Redonda,Nevis, St Kitts, St Eustatius and Saba (Bouysse et al., 1990). The northern termination ofthis arc, extinct since the late Pliocene, corresponds to a 110-km long submarine segmentincluding Luymes bank and Noroit seamount (Bouysse et al., 1990).
The westward shift of the volcanic activity that occurred at the Miocene was interpretedby Bouysse & Westercamp (1990) as a consequence of the subduction of an aseismic ridgethat locked both the Atlantic lithosphere subduction and part of the arc volcanism for awhile, before the ridge was trapped underneath the Caribbean lithosphere. This geody-namical phenomenon marks the transition between the so-called “ancient arc” and “recentarc”, the “intermediate arc” (in purple in Figure 1a) defining the volcanism that took placeduring the aseismic ridge subduction. The volcanic activity indeed pursued in Martinique,St Lucia and Carriacou (Grenada) during this stage (Westercamp & Tazieff, 1980). Thelocation of Martinique island at the southern tip of the separation between the two mainbranches thus makes it a key location for the geodynamical study of this region as both theancient and recent arc products are present on this island (Germa, 2008).
At least thirty volcanoes were active during the last 100 ka (Macdonald et al., 2000).From South to North, some of these active volcanoes (represented by blue stars in Figure 1a)are: Mount Sainte Catherine (Grenada), Kick’em Jenny (Grenada), Soufriere (St Vincent),Soufriere (St Lucia), Mount Pelée (Martinique), Desolation Valley (Dominica), La Soufrière
22
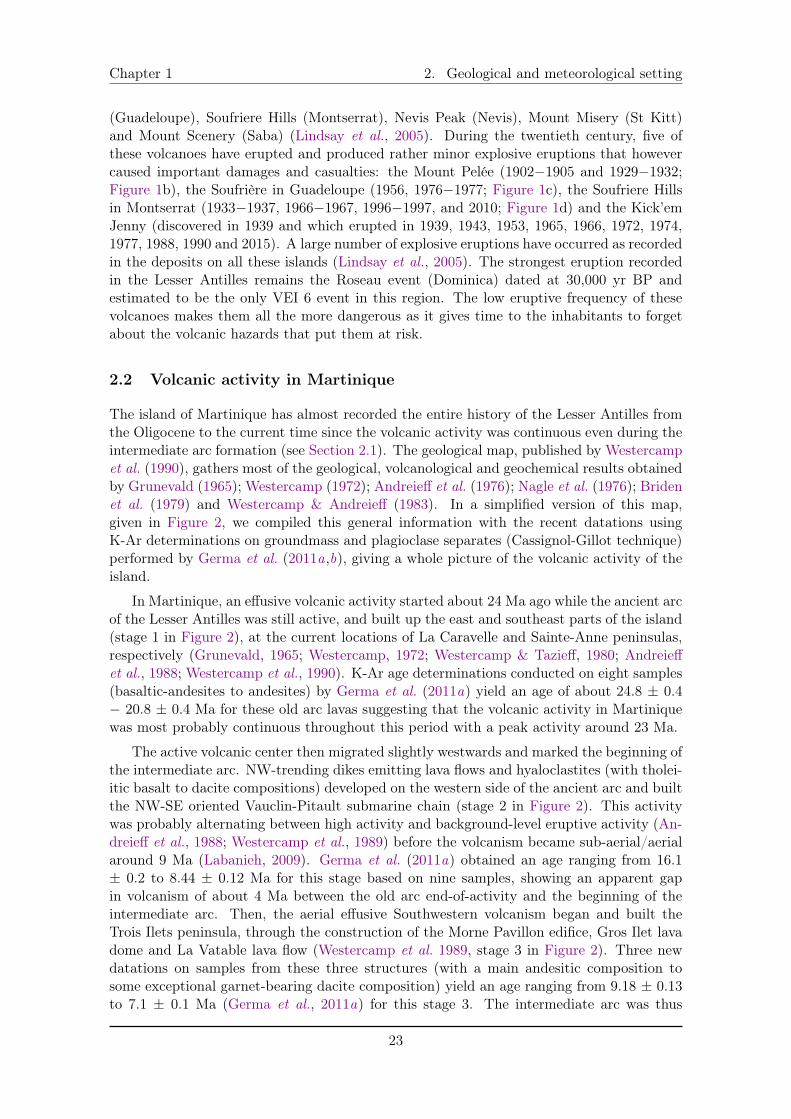
Chapter 1 2. Geological and meteorological setting
(Guadeloupe), Soufriere Hills (Montserrat), Nevis Peak (Nevis), Mount Misery (St Kitt)and Mount Scenery (Saba) (Lindsay et al., 2005). During the twentieth century, five ofthese volcanoes have erupted and produced rather minor explosive eruptions that howevercaused important damages and casualties: the Mount Pelée (1902�1905 and 1929�1932;Figure 1b), the Soufrière in Guadeloupe (1956, 1976�1977; Figure 1c), the Soufriere Hillsin Montserrat (1933�1937, 1966�1967, 1996�1997, and 2010; Figure 1d) and the Kick’emJenny (discovered in 1939 and which erupted in 1939, 1943, 1953, 1965, 1966, 1972, 1974,1977, 1988, 1990 and 2015). A large number of explosive eruptions have occurred as recordedin the deposits on all these islands (Lindsay et al., 2005). The strongest eruption recordedin the Lesser Antilles remains the Roseau event (Dominica) dated at 30,000 yr BP andestimated to be the only VEI 6 event in this region. The low eruptive frequency of thesevolcanoes makes them all the more dangerous as it gives time to the inhabitants to forgetabout the volcanic hazards that put them at risk.
2.2 Volcanic activity in Martinique
The island of Martinique has almost recorded the entire history of the Lesser Antilles fromthe Oligocene to the current time since the volcanic activity was continuous even during theintermediate arc formation (see Section 2.1). The geological map, published by Westercampet al. (1990), gathers most of the geological, volcanological and geochemical results obtainedby Grunevald (1965); Westercamp (1972); Andreieff et al. (1976); Nagle et al. (1976); Bridenet al. (1979) and Westercamp & Andreieff (1983). In a simplified version of this map,given in Figure 2, we compiled this general information with the recent datations usingK-Ar determinations on groundmass and plagioclase separates (Cassignol-Gillot technique)performed by Germa et al. (2011a,b), giving a whole picture of the volcanic activity of theisland.
In Martinique, an effusive volcanic activity started about 24 Ma ago while the ancient arcof the Lesser Antilles was still active, and built up the east and southeast parts of the island(stage 1 in Figure 2), at the current locations of La Caravelle and Sainte-Anne peninsulas,respectively (Grunevald, 1965; Westercamp, 1972; Westercamp & Tazieff, 1980; Andreieffet al., 1988; Westercamp et al., 1990). K-Ar age determinations conducted on eight samples(basaltic-andesites to andesites) by Germa et al. (2011a) yield an age of about 24.8 ± 0.4� 20.8 ± 0.4 Ma for these old arc lavas suggesting that the volcanic activity in Martiniquewas most probably continuous throughout this period with a peak activity around 23 Ma.
The active volcanic center then migrated slightly westwards and marked the beginning ofthe intermediate arc. NW-trending dikes emitting lava flows and hyaloclastites (with tholei-itic basalt to dacite compositions) developed on the western side of the ancient arc and builtthe NW-SE oriented Vauclin-Pitault submarine chain (stage 2 in Figure 2). This activitywas probably alternating between high activity and background-level eruptive activity (An-dreieff et al., 1988; Westercamp et al., 1989) before the volcanism became sub-aerial/aerialaround 9 Ma (Labanieh, 2009). Germa et al. (2011a) obtained an age ranging from 16.1± 0.2 to 8.44 ± 0.12 Ma for this stage based on nine samples, showing an apparent gapin volcanism of about 4 Ma between the old arc end-of-activity and the beginning of theintermediate arc. Then, the aerial effusive Southwestern volcanism began and built theTrois Ilets peninsula, through the construction of the Morne Pavillon edifice, Gros Ilet lavadome and La Vatable lava flow (Westercamp et al. 1989, stage 3 in Figure 2). Three newdatations on samples from these three structures (with a main andesitic composition tosome exceptional garnet-bearing dacite composition) yield an age ranging from 9.18 ± 0.13to 7.1 ± 0.1 Ma (Germa et al., 2011a) for this stage 3. The intermediate arc was thus
23
2. Geological and meteorological setting Chapter 1
Figure 2: The different volcanic stages in Martinique (modified from the geological map of Westercampet al. 1990) associated with their ages (Germa et al., 2011a,b). The dashed lines represent the ancient (inorange), intermediate (in purple) and recent (in red) arcs.
active between 16 and 7 Ma, with an apparent peak activity around 12 Ma, a period duringwhich the volcanic front migrated about 10 km westward from the ancient arc with a meanmigration rate of 1.1 km/Myr (Germa et al., 2011a). This rate is consistent with the rateof 1 km/Myr proposed by Wadge (1986) for the entire Lesser Antilles arc.
After a gap of about 1.6 Ma, the recent arc started to be active around 5.5 Ma with theconstruction of the sub-aerial Morne Jacob shield volcano 25 km to the north of the island(Westercamp et al. 1989, stage 4 in Figure 2). Lavas from this volcano are basaltic andesitesto dacites and a dataset of twenty K-Ar datations yield a time range of activity of 5.14 ±0.07 to 1.53 ± 0.03 Ma for this volcano (Germa et al., 2010). The total volume emittedabove the sea level during this stage was estimated to be 145 ± 32 km
3, meaning a time-averaged sub-aerial effusion rate of 0.04 ± 0.008 km
3/kyr (Germa et al., 2010). The 14-kmdistance westward migration rate from the intermediate arc to the recent one is estimatedto be 1.4 km/Myr, a value consistent with the subduction process (Germa et al., 2011a).During the Morne Jacob last stage of activity, the Trois Ilets volcanism initiated in thesouthwest of the island completing the Trois Ilets peninsula (Westercamp et al. 1989, stage5 in Figure 2). Its aerial eruptive activity alternated mainly between effusive and extrusiveepisodes (with short explosive episodes of low intensity) with compositions ranging frombasaltic-andesite to dacite, and built several edifices from the Diamond islet in the south to
24
Chapter 1 2. Geological and meteorological setting
the Galocha pyroclastic flow in the north of the peninsula (Westercamp et al., 1989; Germaet al., 2011b). Five K-Ar datations yield an age of 2.358 ± 0.034 to 0.346 ± 0.027 Ma forthis stage.
Simultaneously, the more explosive Carbet activity began north of the Trois Ilets penin-sula, on the western flank of Morne Jacob volcano, and built first an old andesitic edificearound 1 Ma (Germa et al., 2011b). Then, a flank collapse of about 30-40 km
3 (Boudonet al., 2007) occurred at 337 ± 5 ka (Samper et al., 2008), leaving a horseshoe-shaped struc-ture opened to the west and characterized by massive debris avalanche deposits. Finally,the Pitons du Carbet, a group of seven voluminous lava domes plus five isolated smallerones with an andesitic to dacitic compositions, were built inside the horseshoe structureproduced by the flank collapse. Amongst those lava domes, five are still more than 1,000meters-high. Five K-Ar datations yield an age of 998 ± 14 ka for the oldest stage (MorneCésaire) and 322 ± 6 ka for the youngest one (Plateau Courbaril, Pitons du Carbet s.s.)(Germa et al., 2011b).
The active volcanic center then moved to the northern end of the island where it built theMount Conil (Germa et al., 2015), whose activity was also contemporary with the Trois Iletsand Carbet volcanisms and characterized by the formation of andesitic breccias, lava domesand lava flows. The beginning of Mount Conil activity was dated to 543 ± 8 ka, and wasprobably associated to subaerial lava flows and lava domes that built a cone-shape edifice,and then to lava domes and flows only until 189 ± 3 ka (Germa et al., 2011b). Between thisdate and 127 ± 2 ka, a new cone was built on the southern flank of the first one, beforea voluminous flank collapse destroyed the southwestern flank of the volcano (Le Prêcheurevent). This collapse produced a 25 km
3 debris avalanche that reached the Caribbean Sea(Le Friant et al., 2003; Germa et al., 2011b; Boudon et al., 2013; Germa et al., 2015; Brunetet al., 2016).
The Mount Pelée has been the only active volcano in Martinique for the last 127 ka(Boudon et al., 2005; Germa et al., 2015). The preserved northern rim of the flank-collapsestructure formed a curved scarp in which the Paleo-Pelée cone (Vincent et al., 1989) grewup during the 127-25 ka building stage (Le Friant et al., 2003; Boudon et al., 2005; Germaet al., 2011b). Two flank collapses occurred during this time period: the St. Pierre event(between 127 and 45 ka, Brunet et al. 2017) destroyed the southwestern flank of the cone andproduced a 13 km
3 debris avalanche into the Caribbean Sea (Le Friant et al., 2015), beforea third flank collapse (the Rivière Sèche event, Le Friant et al. 2003) happened. This lastflank collapse, originally dated at 9 ka, occurred between 45-30 ka and produced a 1.8 km
3
debris avalanche into the Caribbean sea (Le Friant et al., 2003; Le Friant et al., 2015; Brunetet al., 2017). During the St. Vincent period going from 27 to 19.5 ka (Traineau et al., 1983),a new cone was built inside the horseshoe-shaped structure newly formed by the successiveflank collapses. This activity was characterized by a series of open-vent eruptions producingscoria flows (Traineau et al., 1983; Boudon, 1993), followed by a succession of Plinian andsub-Plinian events including the major eruptions SV1 and SV2, respectively dated at ⇡ 25and 22 ka (Traineau et al., 1983). The volcano remained silent for at least 6 ka until thepresent stage of volcanic activity started at 13.5 ka. This “neo-Pelée” period is characterizedby a series of successive dome-forming Pelean and open-vent Plinian eruptions (Roobol &Smith, 1976; Westercamp & Traineau, 1983; Vincent et al., 1989; Boudon et al., 2005).Such an alternation of eruptive style is commonly observed in the Lesser Antilles arc, asinferred from the analysis of past eruption deposits (Roobol & Smith, 1980, 2004; Lindsayet al., 2005). In the following section, we describe more precisely the eruptive record of theneo-Pelée period.
25
2. Geological and meteorological setting Chapter 1
2.3 Mount Pelée volcano
Mount Pelée (1,397 m a.s.l.) is a composite andesitic volcano almost entirely composed ofpyroclastic deposits produced by two eruptive styles: Pelean (dome-forming eruptions), andPlinian (open-vent eruptions producing a sustained eruptive column) (Figure 3).
The recent eruptive history of Mount Pelée is well-documented thanks to several field-based studies (Roobol & Smith, 1976, 1980; Fisher et al., 1980; Westercamp & Traineau,1983; Bardintzeff et al., 1989; Lajoie & Boudon, 1989; Bourdier et al., 1989; Lajoie et al.,1989; Traineau et al., 1989; Boudon et al., 2005; Carazzo et al., 2012; Wright et al., 2016;Carazzo et al., 2019, 2020). On-land stratigraphic studies and measurements of 14C indicatethat at least 28 magmatic eruptions occurred during the last 13,500 years (Westercamp &Traineau, 1983; Boudon et al., 2005), including the 1929-1932 Pelean eruption (Perret,1937), the 1902-1904 Pelean (Lacroix, 1904; Fisher et al., 1980; Lajoie & Boudon, 1989;Lajoie et al., 1989), the 650 BP P1 Plinian (Westercamp & Traineau, 1983; Bardintzeffet al., 1989; Traineau et al., 1989; Carazzo et al., 2012), the 1,670 BP P2 Plinian (Traineauet al., 1989; Carazzo et al., 2019), and the 2,010 BP P3 Plinian events (Westercamp &Traineau, 1983; Traineau et al., 1989; Wright et al., 2016; Carazzo et al., 2020). At least tenPlinian eruptions occurred over the last 13.5 ka according to stratigraphic studies (Roobol& Smith, 1976; Traineau, 1982). Due to the lack of previous carbon-dating measurementsin the literature, and because of the difficulty to recognize deposits that can be very similarto each other in an area often covered with vegetation, the most ancient Plinian eruptionsremain poorly documented and/or require some revision.
During the past 5 ka, at least six Plinian eruptions (namely P1 to P6, from the mostrecent to the older one) and nine dome-forming eruptions occurred in Martinique (West-ercamp & Traineau, 1983; Traineau et al., 1989; Carazzo et al., 2012). We detail here thepowerful Plinian eruptions, which are characterized by the formation of a volcanic columnthat potentially collapsed at some stage during the course of the eruption. For details aboutthe dome-forming eruptions, we refer to Westercamp & Traineau (1983).
The P1 eruption, dated at 650 ± 50 BP (Westercamp & Traineau, 1983; Traineauet al., 1989), began with a dome-forming stage (Villemant & Boudon, 1999). The eruptionthen evolved towards a Plinian phase with the formation of a 19-22 km-high column thatspread volcanic tephra over the southwestern flank of the volcano. After a phase of partialcollapse, a total column collapse on ground occurred and formed a 1.3 km-high fountainwith associated pyroclastic density currents (PDC) (Carazzo et al., 2012).
The P2 eruption occurred at 1,670 ± 40 BP (Westercamp & Traineau, 1983) and startedwith a violent lateral blast directed to the northeast of the volcano. Shortly afterwards, anunstable Plinian column rose up to 23-26 km in the atmosphere, covering the northeasternslopes of Mount Pelée volcano with pumice fall deposits interbedded with low-concentrationPDC deposits. Finally, the column collapsed and produced dense PDC feeding east andsouthwestern valleys (Carazzo et al., 2019).
The P3 eruption, dated at 2,010 ± 140 BP, is probably the most powerful event atMount Pelée volcano over the last 5 ka (Westercamp & Traineau, 1983; Traineau et al., 1989;Carazzo et al., 2020). The eruptive episode was originally divided into three events basedon field observations, namely P3-1, P3-2 and P3-3 (Roobol & Smith, 1980; Westercamp &Traineau, 1983). Traineau et al. (1989) later reduced the P3 eruptive sequence to the P3-1and P3-3 units only. Indeed, further fieldwork performed by the same authors led them toconclude that the P3-2 deposits were older than 2,010 BP, hence that the isopach map ofP3-2 drawn by Westercamp & Traineau (1983) had to be revised (see Chapter 2, Michaud-
26
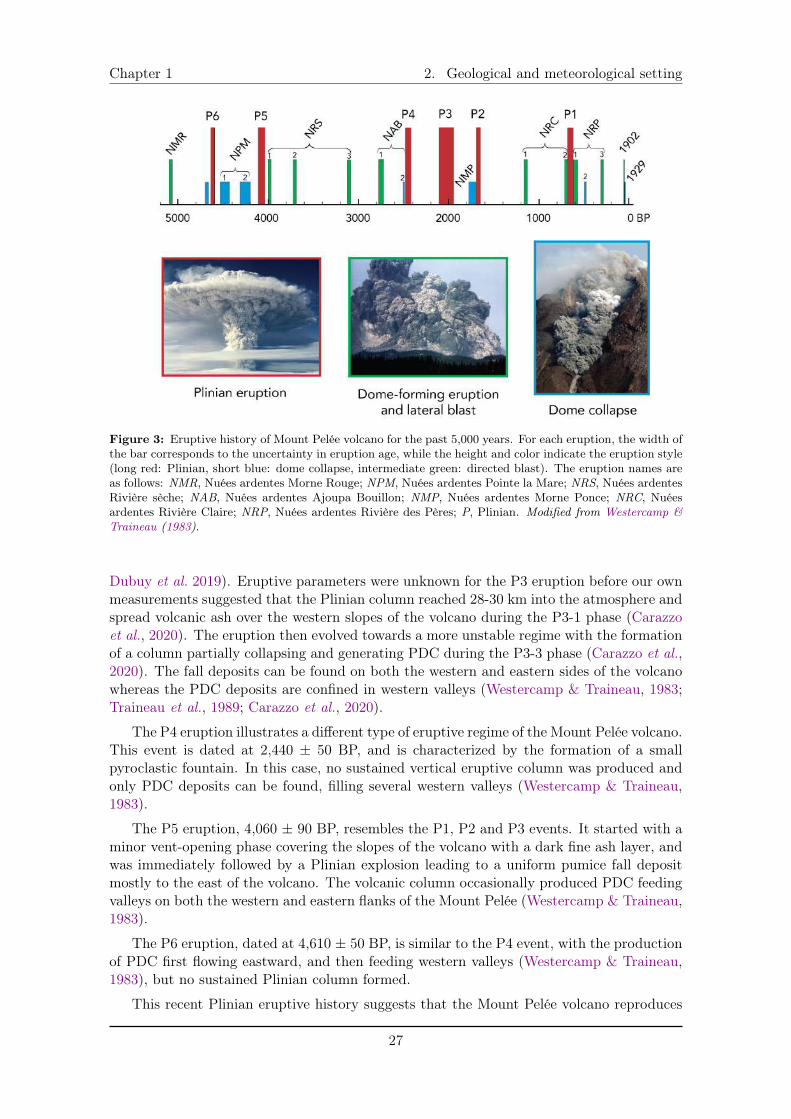
Chapter 1 2. Geological and meteorological setting
Figure 3: Eruptive history of Mount Pelée volcano for the past 5,000 years. For each eruption, the width ofthe bar corresponds to the uncertainty in eruption age, while the height and color indicate the eruption style(long red: Plinian, short blue: dome collapse, intermediate green: directed blast). The eruption names areas follows: NMR, Nuées ardentes Morne Rouge; NPM, Nuées ardentes Pointe la Mare; NRS, Nuées ardentesRivière sèche; NAB, Nuées ardentes Ajoupa Bouillon; NMP, Nuées ardentes Morne Ponce; NRC, Nuéesardentes Rivière Claire; NRP, Nuées ardentes Rivière des Pères; P, Plinian. Modified from Westercamp &Traineau (1983).
Dubuy et al. 2019). Eruptive parameters were unknown for the P3 eruption before our ownmeasurements suggested that the Plinian column reached 28-30 km into the atmosphere andspread volcanic ash over the western slopes of the volcano during the P3-1 phase (Carazzoet al., 2020). The eruption then evolved towards a more unstable regime with the formationof a column partially collapsing and generating PDC during the P3-3 phase (Carazzo et al.,2020). The fall deposits can be found on both the western and eastern sides of the volcanowhereas the PDC deposits are confined in western valleys (Westercamp & Traineau, 1983;Traineau et al., 1989; Carazzo et al., 2020).
The P4 eruption illustrates a different type of eruptive regime of the Mount Pelée volcano.This event is dated at 2,440 ± 50 BP, and is characterized by the formation of a smallpyroclastic fountain. In this case, no sustained vertical eruptive column was produced andonly PDC deposits can be found, filling several western valleys (Westercamp & Traineau,1983).
The P5 eruption, 4,060 ± 90 BP, resembles the P1, P2 and P3 events. It started with aminor vent-opening phase covering the slopes of the volcano with a dark fine ash layer, andwas immediately followed by a Plinian explosion leading to a uniform pumice fall depositmostly to the east of the volcano. The volcanic column occasionally produced PDC feedingvalleys on both the western and eastern flanks of the Mount Pelée (Westercamp & Traineau,1983).
The P6 eruption, dated at 4,610 ± 50 BP, is similar to the P4 event, with the productionof PDC first flowing eastward, and then feeding western valleys (Westercamp & Traineau,1983), but no sustained Plinian column formed.
This recent Plinian eruptive history suggests that the Mount Pelée volcano reproduces
27
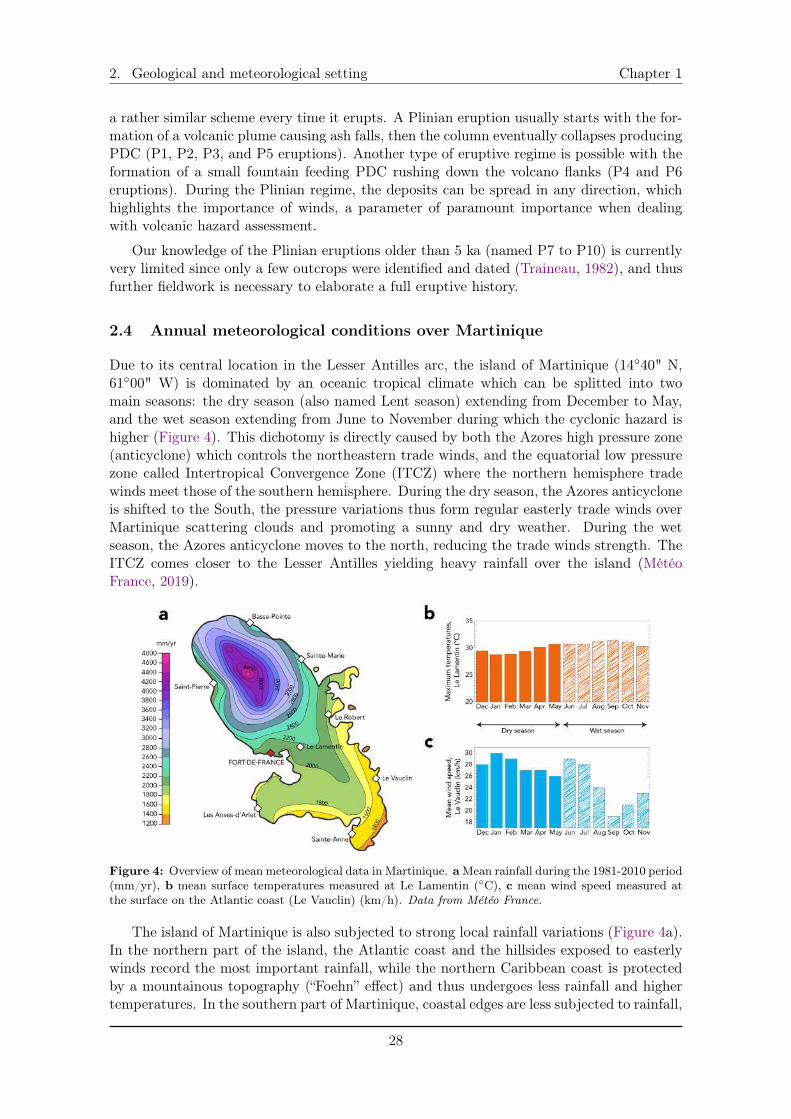
2. Geological and meteorological setting Chapter 1
a rather similar scheme every time it erupts. A Plinian eruption usually starts with the for-mation of a volcanic plume causing ash falls, then the column eventually collapses producingPDC (P1, P2, P3, and P5 eruptions). Another type of eruptive regime is possible with theformation of a small fountain feeding PDC rushing down the volcano flanks (P4 and P6eruptions). During the Plinian regime, the deposits can be spread in any direction, whichhighlights the importance of winds, a parameter of paramount importance when dealingwith volcanic hazard assessment.
Our knowledge of the Plinian eruptions older than 5 ka (named P7 to P10) is currentlyvery limited since only a few outcrops were identified and dated (Traineau, 1982), and thusfurther fieldwork is necessary to elaborate a full eruptive history.
2.4 Annual meteorological conditions over Martinique
Due to its central location in the Lesser Antilles arc, the island of Martinique (14�40" N,61�00" W) is dominated by an oceanic tropical climate which can be splitted into twomain seasons: the dry season (also named Lent season) extending from December to May,and the wet season extending from June to November during which the cyclonic hazard ishigher (Figure 4). This dichotomy is directly caused by both the Azores high pressure zone(anticyclone) which controls the northeastern trade winds, and the equatorial low pressurezone called Intertropical Convergence Zone (ITCZ) where the northern hemisphere tradewinds meet those of the southern hemisphere. During the dry season, the Azores anticycloneis shifted to the South, the pressure variations thus form regular easterly trade winds overMartinique scattering clouds and promoting a sunny and dry weather. During the wetseason, the Azores anticyclone moves to the north, reducing the trade winds strength. TheITCZ comes closer to the Lesser Antilles yielding heavy rainfall over the island (MétéoFrance, 2019).
Figure 4: Overview of mean meteorological data in Martinique. a Mean rainfall during the 1981-2010 period(mm/yr), b mean surface temperatures measured at Le Lamentin (�C), c mean wind speed measured atthe surface on the Atlantic coast (Le Vauclin) (km/h). Data from Météo France.
The island of Martinique is also subjected to strong local rainfall variations (Figure 4a).In the northern part of the island, the Atlantic coast and the hillsides exposed to easterlywinds record the most important rainfall, while the northern Caribbean coast is protectedby a mountainous topography (“Foehn” effect) and thus undergoes less rainfall and highertemperatures. In the southern part of Martinique, coastal edges are less subjected to rainfall,
28
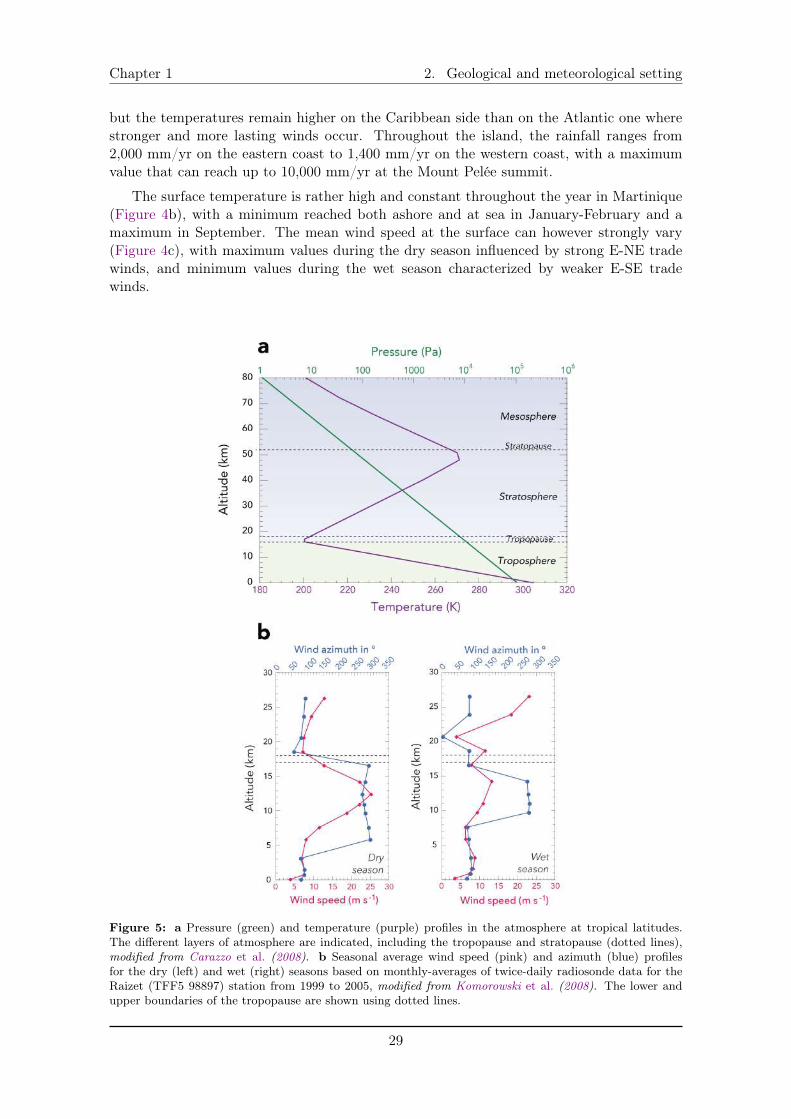
Chapter 1 2. Geological and meteorological setting
but the temperatures remain higher on the Caribbean side than on the Atlantic one wherestronger and more lasting winds occur. Throughout the island, the rainfall ranges from2,000 mm/yr on the eastern coast to 1,400 mm/yr on the western coast, with a maximumvalue that can reach up to 10,000 mm/yr at the Mount Pelée summit.
The surface temperature is rather high and constant throughout the year in Martinique(Figure 4b), with a minimum reached both ashore and at sea in January-February and amaximum in September. The mean wind speed at the surface can however strongly vary(Figure 4c), with maximum values during the dry season influenced by strong E-NE tradewinds, and minimum values during the wet season characterized by weaker E-SE tradewinds.
Figure 5: a Pressure (green) and temperature (purple) profiles in the atmosphere at tropical latitudes.The different layers of atmosphere are indicated, including the tropopause and stratopause (dotted lines),modified from Carazzo et al. (2008). b Seasonal average wind speed (pink) and azimuth (blue) profilesfor the dry (left) and wet (right) seasons based on monthly-averages of twice-daily radiosonde data for theRaizet (TFF5 98897) station from 1999 to 2005, modified from Komorowski et al. (2008). The lower andupper boundaries of the tropopause are shown using dotted lines.
29
3. Methodology Chapter 1
Figure 5a shows the variation of temperature (purple) and pressure (green) with thealtitude at tropical latitudes (Carazzo et al., 2008). This vertical thermal profile exhibitsseveral layers in the atmosphere: the troposphere (about a dozen-kilometers thick), wheremost of the meteorological phenomena occur and characterized by a mean decrease of thetemperature; the stratosphere (from ⇡ 11 to 50 km-high), where the temperature stronglyincreases; the mesosphere (from 50 to 80 km-high), characterized by a rapid decrease ofthe temperature; and beyond 85 km high, the thermosphere where the temperature in-creases again (not shown in Figure 5a). Most of the volcanological phenomena occur inthe troposphere and the stratosphere. The boundary between these two lowest layers ofthe atmosphere is called the tropopause whose altitude varies with the latitude: around16-18 km-high in tropical regions, at 11 km-high at mid-latitudes, and even lower in polarregions (about 6 to 8 km-high). Woods (1995) demonstrated that the tropopause altitudehas a strong effect of the volcanic plume maximum height. This effect can be explained byboth the thermal gradient inversion, and abrupt changes in wind speed and direction at thisaltitude level.
Figure 5b shows the averaged wind speed (pink) and azimuth (blue) profiles in theatmosphere for both the dry (left) and wet (right) season (Komorowski et al., 2008). Asmentionned above, the tropical Caribbean climate is characterized by a strong influence ofthe northern hemisphere trade winds that blow from the east to the west in the low tomid-troposphere (up to ⇡ 5 km-high during the dry season, and to ⇡ 7 km-high duringthe wet season, Figure 5b). In the upper troposphere (between 7 and 18 km-high), thewind field is mostly characterized by westerlies (blowing from the west to the east) counter-trade winds of higher mean velocity compared to the trade winds (especially during the dryseason). Beyond the tropopause, the stratospheric winds blow from the east to the westwith a rather low speed during the dry season, while they have stronger variations both inspeed and azimuth during the wet season. This high seasonal variability of winds has oftena strong impact on tephra dispersal during an eruptive event (Chapters 5 and 6), as anysufficiently high volcanic column is affected by winds (Komorowski et al., 2008).
The cyclonic season takes place in the Lesser Antilles during the wet season, mostlyfrom August to October. In this region, a “cyclone” can either describe a tropical depression(mean wind speed < 63 km/h), a tropical storm (mean wind speed between 63 and 117km/h), or a hurricane (mean wind speed > 117 km/h) (Météo France, 2019). These strongdepression systems are related to eastern waves that form in northern Africa and then movein less than 3 or 5 days across the Atlantic ocean towards the Lesser Antilles. Since the1980’s, about twelve hurricanes form in the northern Atlantic ocean every year. In the last50 years, twelve hurricanes and several tropical storms passed within less than 250 km fromMartinique. Some of these events have caused important casualties on the island: a totalof 60 people died during the hurricanes Dorothy in 1970, Allen in 1980, Klaus in 1990 andEmily in 2011. The hurricanes Dean in 2007 and Maria in 2017 resulted in severe damageson the crops and important economic losses. We will discuss the importance of these extrememeteorological events on tephra dispersal and hazard assessment in Chapter 5.
3 Methodology
3.1 Fieldwork
We identified pumice fallout deposits at 39 locations during two new extensive field studiesperformed in 2017 and 2019 in Martinique. Adding these 39 outcrops to the ones identified
30
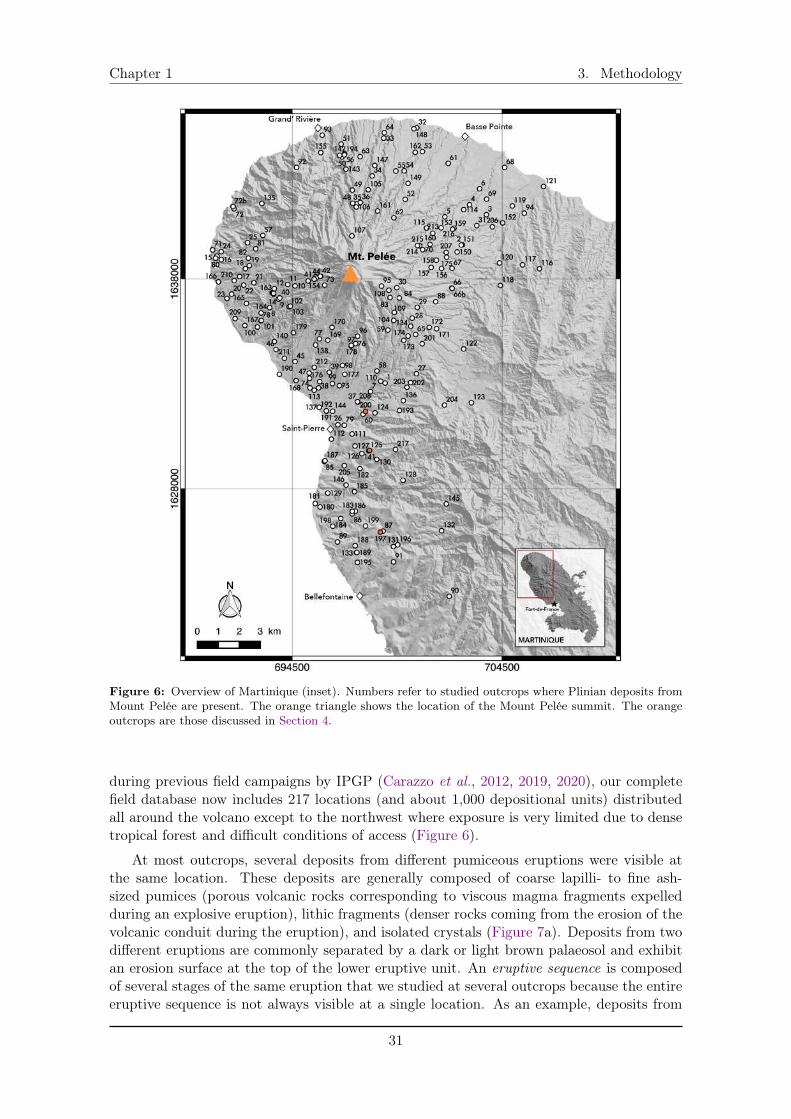
Chapter 1 3. Methodology
Figure 6: Overview of Martinique (inset). Numbers refer to studied outcrops where Plinian deposits fromMount Pelée are present. The orange triangle shows the location of the Mount Pelée summit. The orangeoutcrops are those discussed in Section 4.
during previous field campaigns by IPGP (Carazzo et al., 2012, 2019, 2020), our completefield database now includes 217 locations (and about 1,000 depositional units) distributedall around the volcano except to the northwest where exposure is very limited due to densetropical forest and difficult conditions of access (Figure 6).
At most outcrops, several deposits from different pumiceous eruptions were visible atthe same location. These deposits are generally composed of coarse lapilli- to fine ash-sized pumices (porous volcanic rocks corresponding to viscous magma fragments expelledduring an explosive eruption), lithic fragments (denser rocks coming from the erosion of thevolcanic conduit during the eruption), and isolated crystals (Figure 7a). Deposits from twodifferent eruptions are commonly separated by a dark or light brown palaeosol and exhibitan erosion surface at the top of the lower eruptive unit. An eruptive sequence is composedof several stages of the same eruption that we studied at several outcrops because the entireeruptive sequence is not always visible at a single location. As an example, deposits from
31
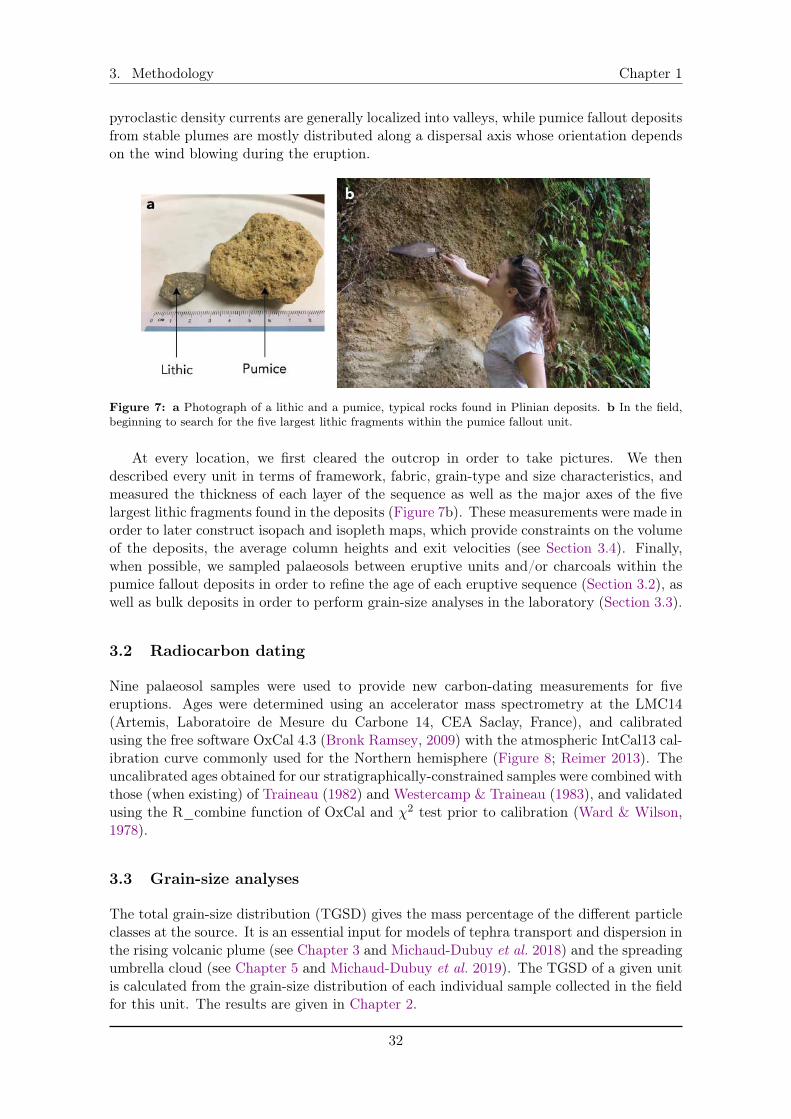
3. Methodology Chapter 1
pyroclastic density currents are generally localized into valleys, while pumice fallout depositsfrom stable plumes are mostly distributed along a dispersal axis whose orientation dependson the wind blowing during the eruption.
Figure 7: a Photograph of a lithic and a pumice, typical rocks found in Plinian deposits. b In the field,beginning to search for the five largest lithic fragments within the pumice fallout unit.
At every location, we first cleared the outcrop in order to take pictures. We thendescribed every unit in terms of framework, fabric, grain-type and size characteristics, andmeasured the thickness of each layer of the sequence as well as the major axes of the fivelargest lithic fragments found in the deposits (Figure 7b). These measurements were made inorder to later construct isopach and isopleth maps, which provide constraints on the volumeof the deposits, the average column heights and exit velocities (see Section 3.4). Finally,when possible, we sampled palaeosols between eruptive units and/or charcoals within thepumice fallout deposits in order to refine the age of each eruptive sequence (Section 3.2), aswell as bulk deposits in order to perform grain-size analyses in the laboratory (Section 3.3).
3.2 Radiocarbon dating
Nine palaeosol samples were used to provide new carbon-dating measurements for fiveeruptions. Ages were determined using an accelerator mass spectrometry at the LMC14(Artemis, Laboratoire de Mesure du Carbone 14, CEA Saclay, France), and calibratedusing the free software OxCal 4.3 (Bronk Ramsey, 2009) with the atmospheric IntCal13 cal-ibration curve commonly used for the Northern hemisphere (Figure 8; Reimer 2013). Theuncalibrated ages obtained for our stratigraphically-constrained samples were combined withthose (when existing) of Traineau (1982) and Westercamp & Traineau (1983), and validatedusing the R_combine function of OxCal and �2 test prior to calibration (Ward & Wilson,1978).
3.3 Grain-size analyses
The total grain-size distribution (TGSD) gives the mass percentage of the different particleclasses at the source. It is an essential input for models of tephra transport and dispersion inthe rising volcanic plume (see Chapter 3 and Michaud-Dubuy et al. 2018) and the spreadingumbrella cloud (see Chapter 5 and Michaud-Dubuy et al. 2019). The TGSD of a given unitis calculated from the grain-size distribution of each individual sample collected in the fieldfor this unit. The results are given in Chapter 2.
32
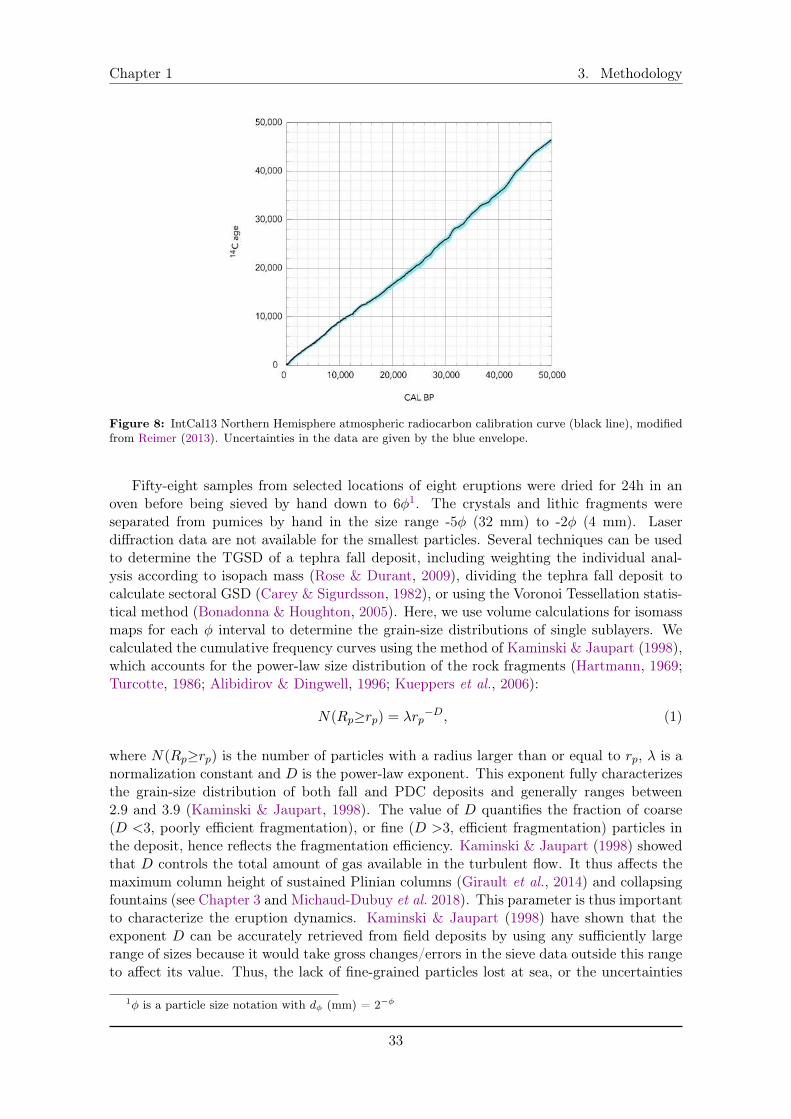
Chapter 1 3. Methodology
Figure 8: IntCal13 Northern Hemisphere atmospheric radiocarbon calibration curve (black line), modifiedfrom Reimer (2013). Uncertainties in the data are given by the blue envelope.
Fifty-eight samples from selected locations of eight eruptions were dried for 24h in anoven before being sieved by hand down to 6�1. The crystals and lithic fragments wereseparated from pumices by hand in the size range -5� (32 mm) to -2� (4 mm). Laserdiffraction data are not available for the smallest particles. Several techniques can be usedto determine the TGSD of a tephra fall deposit, including weighting the individual anal-ysis according to isopach mass (Rose & Durant, 2009), dividing the tephra fall deposit tocalculate sectoral GSD (Carey & Sigurdsson, 1982), or using the Voronoi Tessellation statis-tical method (Bonadonna & Houghton, 2005). Here, we use volume calculations for isomassmaps for each � interval to determine the grain-size distributions of single sublayers. Wecalculated the cumulative frequency curves using the method of Kaminski & Jaupart (1998),which accounts for the power-law size distribution of the rock fragments (Hartmann, 1969;Turcotte, 1986; Alibidirov & Dingwell, 1996; Kueppers et al., 2006):
N(Rp�rp) = �rp�D, (1)
where N(Rp�rp) is the number of particles with a radius larger than or equal to rp, � is anormalization constant and D is the power-law exponent. This exponent fully characterizesthe grain-size distribution of both fall and PDC deposits and generally ranges between2.9 and 3.9 (Kaminski & Jaupart, 1998). The value of D quantifies the fraction of coarse(D <3, poorly efficient fragmentation), or fine (D >3, efficient fragmentation) particles inthe deposit, hence reflects the fragmentation efficiency. Kaminski & Jaupart (1998) showedthat D controls the total amount of gas available in the turbulent flow. It thus affects themaximum column height of sustained Plinian columns (Girault et al., 2014) and collapsingfountains (see Chapter 3 and Michaud-Dubuy et al. 2018). This parameter is thus importantto characterize the eruption dynamics. Kaminski & Jaupart (1998) have shown that theexponent D can be accurately retrieved from field deposits by using any sufficiently largerange of sizes because it would take gross changes/errors in the sieve data outside this rangeto affect its value. Thus, the lack of fine-grained particles lost at sea, or the uncertainties
1� is a particle size notation with d�
(mm) = 2��
33
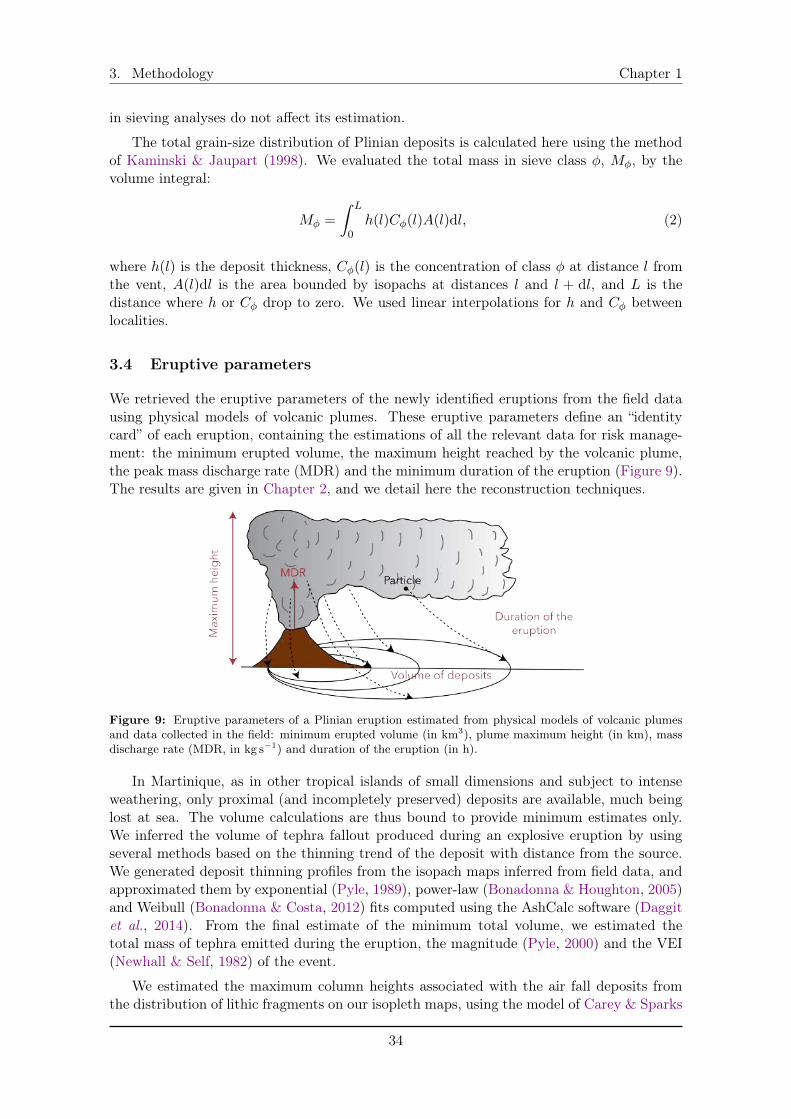
3. Methodology Chapter 1
in sieving analyses do not affect its estimation.
The total grain-size distribution of Plinian deposits is calculated here using the methodof Kaminski & Jaupart (1998). We evaluated the total mass in sieve class �, M�, by thevolume integral:
M� =
Z L
0h(l)C�(l)A(l)dl, (2)
where h(l) is the deposit thickness, C�(l) is the concentration of class � at distance l fromthe vent, A(l)dl is the area bounded by isopachs at distances l and l + dl, and L is thedistance where h or C� drop to zero. We used linear interpolations for h and C� betweenlocalities.
3.4 Eruptive parameters
We retrieved the eruptive parameters of the newly identified eruptions from the field datausing physical models of volcanic plumes. These eruptive parameters define an “identitycard” of each eruption, containing the estimations of all the relevant data for risk manage-ment: the minimum erupted volume, the maximum height reached by the volcanic plume,the peak mass discharge rate (MDR) and the minimum duration of the eruption (Figure 9).The results are given in Chapter 2, and we detail here the reconstruction techniques.
Figure 9: Eruptive parameters of a Plinian eruption estimated from physical models of volcanic plumesand data collected in the field: minimum erupted volume (in km3), plume maximum height (in km), massdischarge rate (MDR, in kg s�1) and duration of the eruption (in h).
In Martinique, as in other tropical islands of small dimensions and subject to intenseweathering, only proximal (and incompletely preserved) deposits are available, much beinglost at sea. The volume calculations are thus bound to provide minimum estimates only.We inferred the volume of tephra fallout produced during an explosive eruption by usingseveral methods based on the thinning trend of the deposit with distance from the source.We generated deposit thinning profiles from the isopach maps inferred from field data, andapproximated them by exponential (Pyle, 1989), power-law (Bonadonna & Houghton, 2005)and Weibull (Bonadonna & Costa, 2012) fits computed using the AshCalc software (Daggitet al., 2014). From the final estimate of the minimum total volume, we estimated thetotal mass of tephra emitted during the eruption, the magnitude (Pyle, 2000) and the VEI(Newhall & Self, 1982) of the event.
We estimated the maximum column heights associated with the air fall deposits fromthe distribution of lithic fragments on our isopleth maps, using the model of Carey & Sparks
34
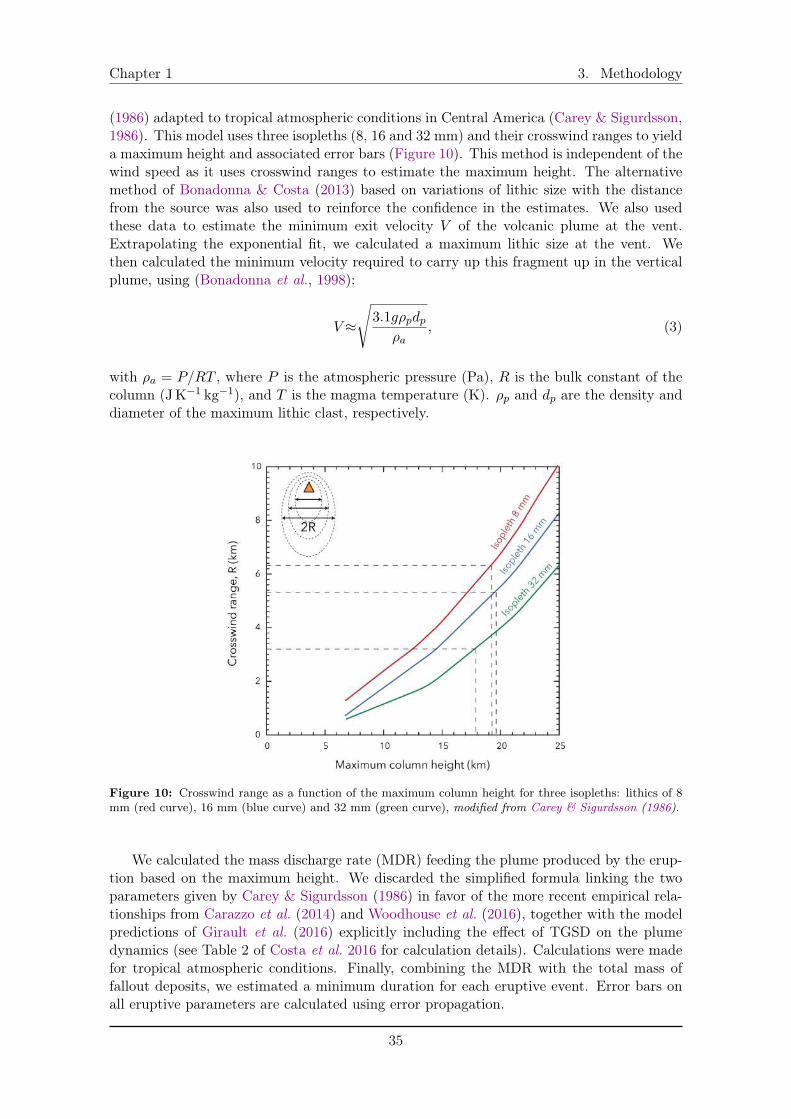
Chapter 1 3. Methodology
(1986) adapted to tropical atmospheric conditions in Central America (Carey & Sigurdsson,1986). This model uses three isopleths (8, 16 and 32 mm) and their crosswind ranges to yielda maximum height and associated error bars (Figure 10). This method is independent of thewind speed as it uses crosswind ranges to estimate the maximum height. The alternativemethod of Bonadonna & Costa (2013) based on variations of lithic size with the distancefrom the source was also used to reinforce the confidence in the estimates. We also usedthese data to estimate the minimum exit velocity V of the volcanic plume at the vent.Extrapolating the exponential fit, we calculated a maximum lithic size at the vent. Wethen calculated the minimum velocity required to carry up this fragment up in the verticalplume, using (Bonadonna et al., 1998):
V⇡
s
3.1g⇢pdp⇢a
, (3)
with ⇢a = P/RT , where P is the atmospheric pressure (Pa), R is the bulk constant of thecolumn (JK�1
kg
�1), and T is the magma temperature (K). ⇢p and dp are the density anddiameter of the maximum lithic clast, respectively.
Figure 10: Crosswind range as a function of the maximum column height for three isopleths: lithics of 8mm (red curve), 16 mm (blue curve) and 32 mm (green curve), modified from Carey & Sigurdsson (1986).
We calculated the mass discharge rate (MDR) feeding the plume produced by the erup-tion based on the maximum height. We discarded the simplified formula linking the twoparameters given by Carey & Sigurdsson (1986) in favor of the more recent empirical rela-tionships from Carazzo et al. (2014) and Woodhouse et al. (2016), together with the modelpredictions of Girault et al. (2016) explicitly including the effect of TGSD on the plumedynamics (see Table 2 of Costa et al. 2016 for calculation details). Calculations were madefor tropical atmospheric conditions. Finally, combining the MDR with the total mass offallout deposits, we estimated a minimum duration for each eruptive event. Error bars onall eruptive parameters are calculated using error propagation.
35
4. Results Chapter 1
4 Results
In this section, we present three key stratigraphic sections where the deposits of past erup-tions of Mt Pelée volcano are clearly visible underneath those of the most recent eruptions(Section 4.1). We estimate the ages of these deposits based on new carbon-dating measure-ments (Section 4.2), and we discuss our results in the light of the current knowledge of theeruptive histoy of Mt Pelée volcano (Section 4.3). The three sections are presented from theclosest to the farthest to the Mount Pelée summit (with a N-S axis).
4.1 Stratigraphic sections
4.1.1 The Mont Parnasse section
The Mont Parnasse section (outcrop 200 in Figure 6) is located at ⇡ 6.5 km from the volcanosummit, on the road D11 between St Pierre and Morne Étoile. Six units separated by brownsoils can be distinguished on this outcrop (Figure 11a and b), which we describe from baseto top.
Unit 0: The basal unit is a 60 cm-thick dark brown very poorly-sorted block-and-ashflow deposit containing bombs up to 150 mm made of porphyrite andesite. This deposit isunconsolidated, very altered, and overlain by a thick light brown silty well-sorted soil.
Unit 1: This layer is a ⇡ 80 cm-thick blanket of clast-supported, white fine lapillipumice bearing moderately coarse lithic fragments. This pumice fallout deposit is inverselygraded and overlain by a brown ashy poorly-sorted soil.
Unit 2: This unit is a moderately coarse lithic-rich white pumice fall with a measuredthickness of ⇡ 60 cm. It is overlain by a light brown soil.
Unit 3: This unit is made of three sub-units not separated by any soil nor weatheredsurface. The first sub-unit (31) is a relatively well-sorted PDC deposit containing whitecoarse lapilli pumices and a few blocks of grey andesite floating in a matrix of ash particles.The total thickness could not be constrained precisely but it is certainly larger than 330cm. The second subunit (32) consists of a thinner (⇡ 150 cm) and much finer-grained PDCdeposit. Finally, the third sub-unit (33) is a very characteristic yellowish sandy ash depositof about 35 cm. The eruptive sequence is overlained by a relatively thin light brown soil.
Unit 4: This unit is also composed of two sub-units. The first one (41) is a verythin layer (⇡ 8 cm) of dark grey lithic-rich pumice fallout, the second one (42) is a muchthicker layer (⇡ 180 cm) of coarse white pumice fallout bearing lithic fragments. This unitis overlain by a thin brown soil.
Unit 5: This final unit is a 200 cm-thick very poorly-sorted block-and-ash flow depositcontaining mostly scoria bombs and a few white fine lapilli pumice. The top of the cliffcould not be seen due to vegetation.
We summarize these observations in the stratigraphic log in Figure 11c.
4.1.2 The new OVSM section
The new OVSM section (outcrop 141 in Figure 6) was located at the construction site ofthe new Observatoire Volcanologique et Sismologique de la Martinique, ⇡ 8.5 km from theMount Pelée. At this outcrop, we identified nine units from different eruptions, three of
36
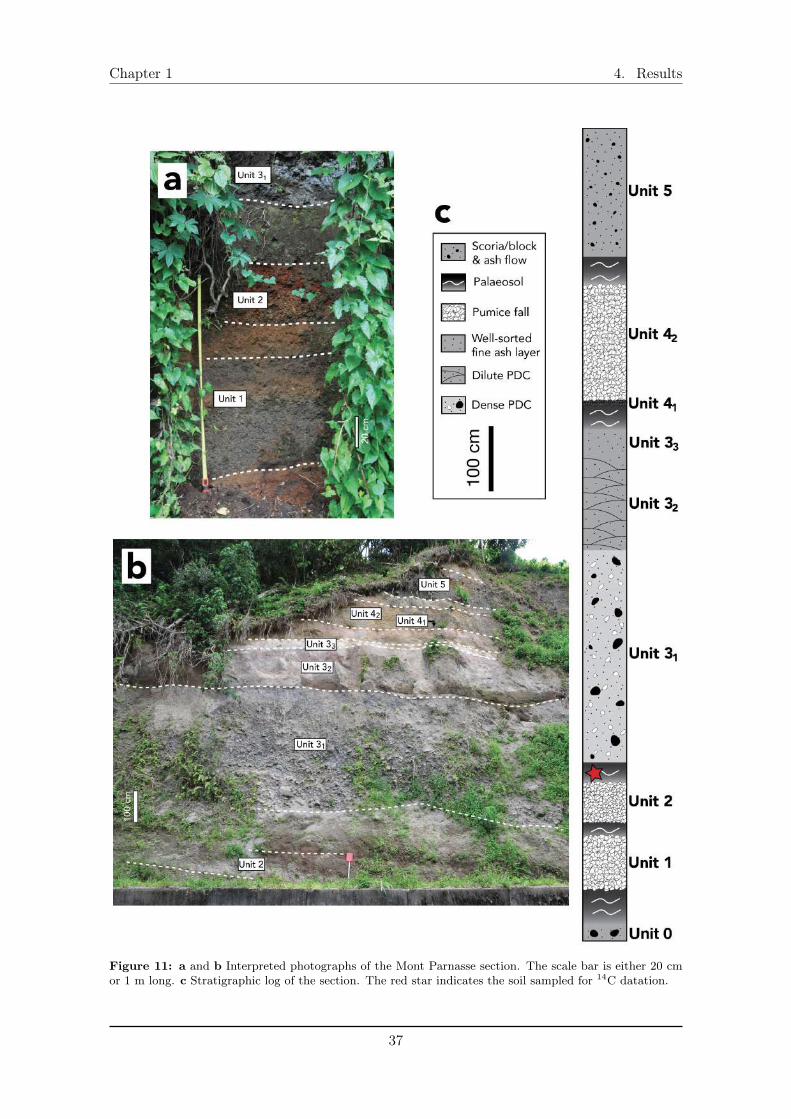
Chapter 1 4. Results
Figure 11: a and b Interpreted photographs of the Mont Parnasse section. The scale bar is either 20 cmor 1 m long. c Stratigraphic log of the section. The red star indicates the soil sampled for 14C datation.
37
4. Results Chapter 1
which were already observed at the Mont Parnasse section (Figure 12a). All units wereseparated from each other by a dark brown pumice-bearing soil.
From base to top:
Unit 3: Only the upper layer of the Unit 3 deposit (i.e., Unit 33) was present here. Wedescribed it as a yellowish sandy ash layer of about 40 cm.
Unit 4: We retrieved the two sub-units of the Unit 4 at this outcrop. Unit 41, a darkgrey lithic-rich pumice fall, is 7-8 cm-thick; while Unit 42 has a thickness of 120 cm and canbe described as a moderately coarse white pumice fallout.
Unit 5: This unit is a 33 cm-thick layer of fine-grained pumice-bearing scoria fallout,which was most likely elutriated from the top of the PDC described at the Mont Parnassesection.
Unit 6: This layer is a 35 cm-thick blanket of clast-supported, white fine lapilli pumicefallout with a grey sandy matrix of coarse ash.
Unit 7: This unit is a very thin (⇡ 6 cm) and fine-grained pumice fallout deposit witha grey sandy matrix of coarse ash particles.
Unit 8: This unit, of about 30 cm in thickness, resembled the Unit 7, and was describedas a fine-grained pumice fall deposit with a grey sandy matrix becoming an ashy soil on top.
Unit 9: This unit is a poorly-sorted lithic-rich fine-grained pumice fallout deposit con-taining a few dark scoria; its measured thickness is ⇡ 75 cm.
Unit 10: This unit has two sub-units, very similar to sub-units 41 and 42 at the MontParnasse section. Indeed, the sub-unit 101 is a very thin layer (about 7 cm) of dark greyfine-grained pumice fallout; whereas the sub-unit 102 is much thicker (about 40 cm) andconsists of a reversely graded pumice fallout deposit. This layer is overlain by a relativelythick brown soil.
Unit 11: This final unit is a fine-grained pumice fall deposit with a grey sandy matrixwhose precise thickness could not be measured as it is grading into a soil bearing vegetation.
We summarize these observations in the stratigraphic log in Figure 12b.
4.1.3 The Bellefontaine stadium section
Finally, the Bellefontaine stadium section (outcrop 197 in Figure 6), located at ⇡ 12.3 kmfrom the volcano, displayed the almost entire sequence from Unit 1 to Unit 10 (Figure 13a).All units are separated by a brown sandy pumice-bearing ashy soil. We describe this sectionfrom base to top and we summarize our observations in the stratigraphic log in Figure 13b.
Unit 1: At base, we retrieved a fine-grained pumice fall deposit with a grey sandymatrix measuring ⇡ 20 cm corresponding to the Unit 1 found at the Mont Parnasse section.
Unit 2: The following unit was approximately 22 cm thick and could be described as amoderately coarse white pumice fall deposit with a grey sandy matrix corresponding to theUnit 2 identified at the Mont Parnasse section.
Unit 3: This very useful stratigraphic marker can be clearly seen in Figure 13, as ayellowish sandy well-sorted ash layer of about 26 cm. This layer corresponds to the sub-unit33 identified at the Mont Parnasse and OVSM sections (Figures 11 and 12).
Unit 4: We identified the two sub-units of Unit 4 at this section. Unit 41 is 2.5�3 cmthick and consists of a grey lithic-rich fine pumice fallout deposit, whereas Unit 42 (⇡ 80
38
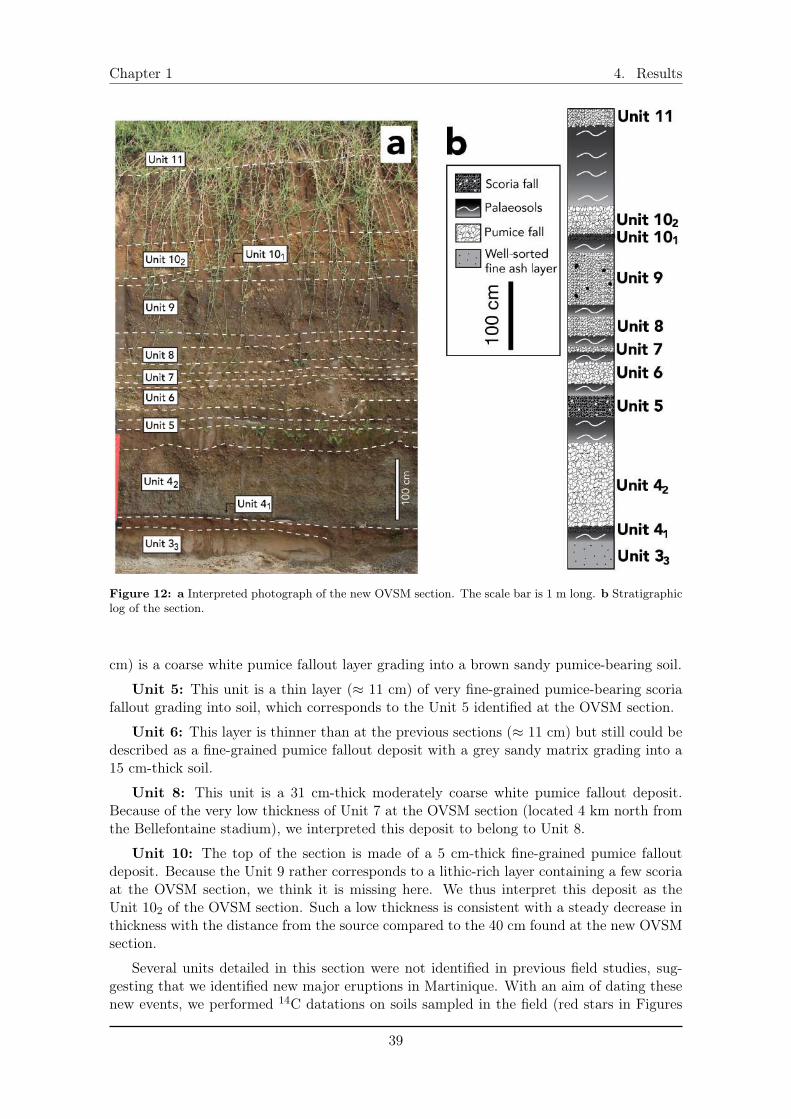
Chapter 1 4. Results
Figure 12: a Interpreted photograph of the new OVSM section. The scale bar is 1 m long. b Stratigraphiclog of the section.
cm) is a coarse white pumice fallout layer grading into a brown sandy pumice-bearing soil.
Unit 5: This unit is a thin layer (⇡ 11 cm) of very fine-grained pumice-bearing scoriafallout grading into soil, which corresponds to the Unit 5 identified at the OVSM section.
Unit 6: This layer is thinner than at the previous sections (⇡ 11 cm) but still could bedescribed as a fine-grained pumice fallout deposit with a grey sandy matrix grading into a15 cm-thick soil.
Unit 8: This unit is a 31 cm-thick moderately coarse white pumice fallout deposit.Because of the very low thickness of Unit 7 at the OVSM section (located 4 km north fromthe Bellefontaine stadium), we interpreted this deposit to belong to Unit 8.
Unit 10: The top of the section is made of a 5 cm-thick fine-grained pumice falloutdeposit. Because the Unit 9 rather corresponds to a lithic-rich layer containing a few scoriaat the OVSM section, we think it is missing here. We thus interpret this deposit as theUnit 102 of the OVSM section. Such a low thickness is consistent with a steady decrease inthickness with the distance from the source compared to the 40 cm found at the new OVSMsection.
Several units detailed in this section were not identified in previous field studies, sug-gesting that we identified new major eruptions in Martinique. With an aim of dating thesenew events, we performed 14C datations on soils sampled in the field (red stars in Figures
39
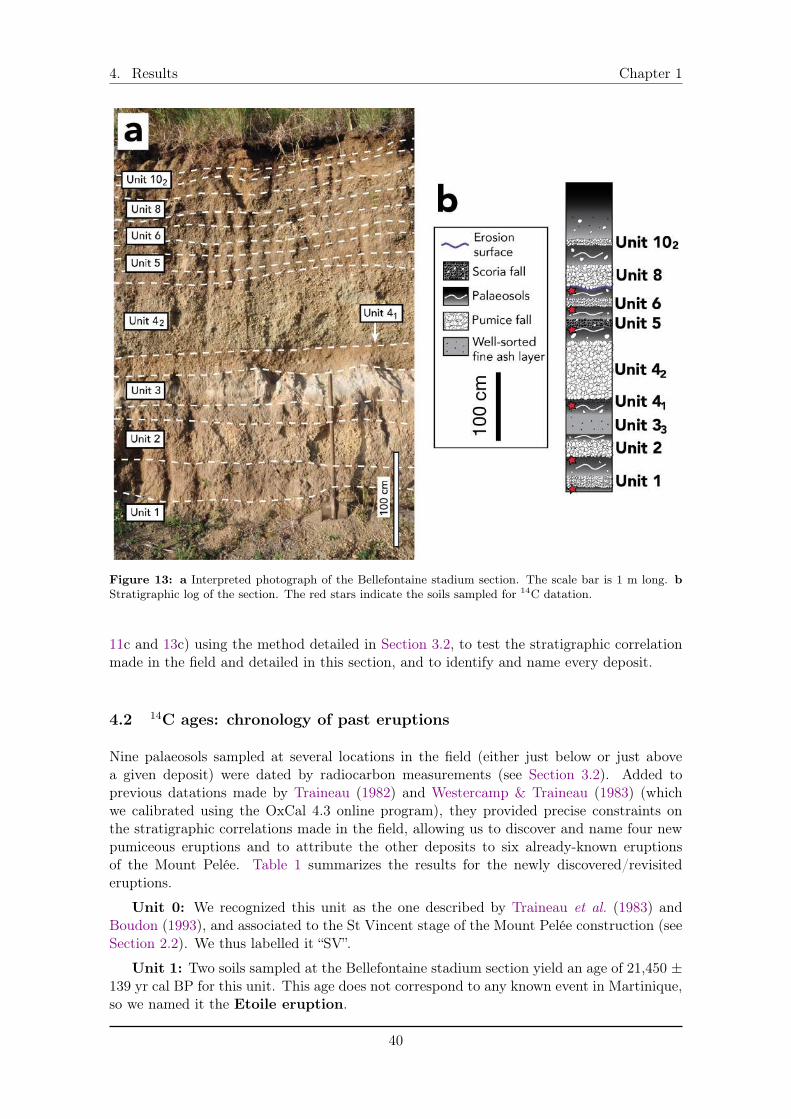
4. Results Chapter 1
Figure 13: a Interpreted photograph of the Bellefontaine stadium section. The scale bar is 1 m long. b
Stratigraphic log of the section. The red stars indicate the soils sampled for 14C datation.
11c and 13c) using the method detailed in Section 3.2, to test the stratigraphic correlationmade in the field and detailed in this section, and to identify and name every deposit.
4.2 14C ages: chronology of past eruptions
Nine palaeosols sampled at several locations in the field (either just below or just abovea given deposit) were dated by radiocarbon measurements (see Section 3.2). Added toprevious datations made by Traineau (1982) and Westercamp & Traineau (1983) (whichwe calibrated using the OxCal 4.3 online program), they provided precise constraints onthe stratigraphic correlations made in the field, allowing us to discover and name four newpumiceous eruptions and to attribute the other deposits to six already-known eruptionsof the Mount Pelée. Table 1 summarizes the results for the newly discovered/revisitederuptions.
Unit 0: We recognized this unit as the one described by Traineau et al. (1983) andBoudon (1993), and associated to the St Vincent stage of the Mount Pelée construction (seeSection 2.2). We thus labelled it “SV”.
Unit 1: Two soils sampled at the Bellefontaine stadium section yield an age of 21,450 ±139 yr cal BP for this unit. This age does not correspond to any known event in Martinique,so we named it the Etoile eruption.
40
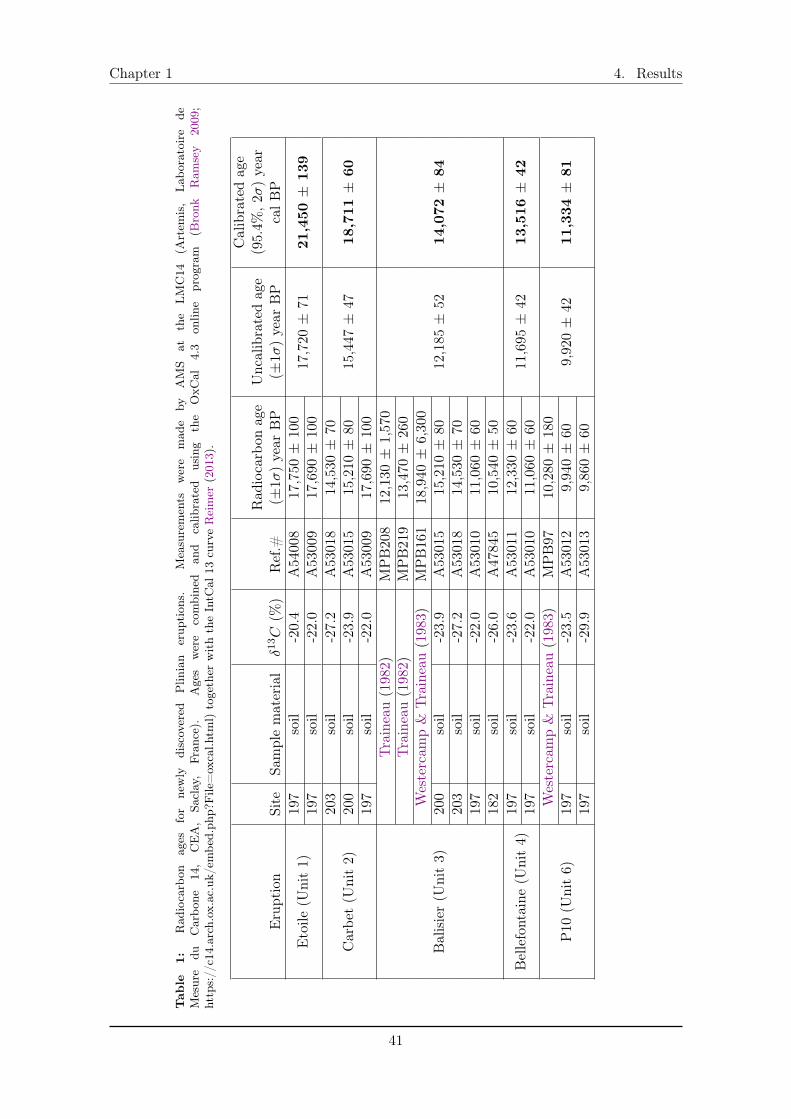
Chapter 1 4. Results
Table
1:
Rad
ioca
rbon
ages
for
new
lydi
scov
ered
Plin
ian
erup
tion
s.M
easu
rem
ents
wer
em
ade
byA
MS
atth
eLM
C14
(Art
emis
,La
bora
toir
ede
Mes
ure
duC
arbo
ne14
,C
EA
,Sa
clay
,Fr
ance
).A
ges
wer
eco
mbi
ned
and
calib
rate
dus
ing
the
OxC
al4.
3on
line
prog
ram
(Bro
nkR
amse
y20
09;
http
s://
c14.
arch
.ox.
ac.u
k/em
bed.
php?
File
=ox
cal.h
tml)
toge
ther
wit
hth
eIn
tCal
13cu
rve
Rei
mer
(201
3).
Eru
ptio
nSi
teSa
mpl
em
ater
ial
�13C
(%)
Ref
.#R
adio
carb
onag
e(±
1�)
year
BP
Unc
alib
rate
dag
e(±
1�)
year
BP
Cal
ibra
ted
age
(95.
4%,2
�)
year
calB
P
Eto
ile(U
nit
1)19
7so
il-2
0.4
A54
008
17,7
50±
100
17,7
20±
7121
,450
±13
919
7so
il-2
2.0
A53
009
17,6
90±
100
Car
bet
(Uni
t2)
203
soil
-27.
2A
5301
814
,530
±70
15,4
47±
4718
,711
±60
200
soil
-23.
9A
5301
515
,210
±80
197
soil
-22.
0A
5300
917
,690
±10
0
Bal
isie
r(U
nit
3)
Trai
neau
(198
2)M
PB
208
12,1
30±
1,57
0
12,1
85±
5214
,072
±84
Trai
neau
(198
2)M
PB
219
13,4
70±
260
Wes
terc
amp
&Tr
aine
au(1
983)
MP
B16
118
,940
±6,
300
200
soil
-23.
9A
5301
515
,210
±80
203
soil
-27.
2A
5301
814
,530
±70
197
soil
-22.
0A
5301
011
,060
±60
182
soil
-26.
0A
4784
510
,540
±50
Bel
lefo
ntai
ne(U
nit
4)19
7so
il-2
3.6
A53
011
12,3
30±
6011
,695
±42
13,5
16±
4219
7so
il-2
2.0
A53
010
11,0
60±
60
P10
(Uni
t6)
Wes
terc
amp
&Tr
aine
au(1
983)
MP
B97
10,2
80±
180
9,92
0±
4211
,334
±81
197
soil
-23.
5A
5301
29,
940±
6019
7so
il-2
9.9
A53
013
9,86
0±
60
41
4. Results Chapter 1
Unit 2: Three soils sampled at the Bellefontaine stadium section, the Mont Parnassesection and at an additional outcrop (numbered 203 in Figure 6) allowed us to date this unitat 18,711 ± 60 yr cal BP. We named this previously unknown event the Carbet eruption.
Unit 3: As this is a very unique deposit (see Chapter 2), we performed four new data-tions on four soils sampled at the Bellefontaine stadium and the Mont Parnasse sections,as well as at two other outcrops (numbered 182 and 203 on Figure 6). Based on the strati-graphic features of this unit, the thicknesses measured in the field, the outcrop locations,and the ages obtained by these new carbon-datations, we identified this unit as the NBCeruption (Nuée de Balisier-Calave) named by Traineau (1982). Because the NBC eruptionis a very poorly known event, for which we found voluminous deposits in a new locationbeyond the current hazard map, we renamed this important event the Balisier eruption.Adding our datations to the previous ones made by Traineau (1982) and Westercamp &Traineau (1983), we dated this eruption at 14,072 ± 84 yr cal BP. We recognized the Unit33 as the “ash hurricane deposit” described by Roobol & Smith (1976) and Traineau et al.
(1989), and originally thought to be much younger than 14 ka cal BP.
Unit 4: Because of the presence of the yellowish ash layer (Unit 33) under the Unit 4,we recognized these deposits as the P3-2 deposits, originally thought to be part of the P3eruption (see Section 2.3). We performed two datations on soils sampled at the Bellefontainestadium section (at the base and top of the deposit). These two datations yield an age of13,516 ± 42 yr cal BP, which do not correspond to any previously-known explosive eruptionof the Mount Pelée. We thus named it the Bellefontaine eruption (Michaud-Dubuy et al.,2019).
Unit 5: Based on the stratigraphic features of this unit, the thicknesses measured inthe field and the outcrop locations, we identified this unit as the NMC eruption (Nuéesardentes de Morne Capot), described and named by Traineau (1982). Based on datationsmade by Traineau (1982) and Boudon et al. (2005), this event was dated at 13,132 ± 133yr cal BP.
Unit 6: Two soils sampled at the Bellefontaine stadium section (at the base and topof the deposit) were dated. Based on the obtained ages, we identified this unit as a Plinianeruption briefly mentionned and dated by Traineau (1982) and Boudon et al. (2005). Addingour 14C ages to a previous datation made by Westercamp & Traineau (1983) yields an ageof 11,334 ± 81 yr cal BP. In agreement with the notation of Westercamp & Traineau (1983)for Plinian eruptions in Martinique, we named this event the P10 eruption.
Unit 7: We identified this unit as the P9 eruption (Traineau, 1982), based on thestratigraphic correlation made in the field. This eruption was previously dated by Traineau(1982) and Boudon et al. (2005) at 10,369 ± 131 yr cal BP.
Unit 8: We identified this unit as the P8 eruption (Traineau, 1982), based on themeasured thicknesses in the field and the outcrop locations. This eruption was previouslydated by Traineau (1982) and Boudon et al. (2005) at 8,587 ± 79 yr cal BP.
Unit 9: Based on the stratigraphic correlation, this unit corresponds to the P7 erup-tion named by Traineau (1982). This author dated this event at 7,515 ± 110 yr cal BP.
Unit 10: Considering the thicknesses measured in the field, the deposit characteristicsand the stratigraphic correlation presented in this chapter, we identified this unit as the P5eruption, a relatively well-known eruption dated by Traineau (1982); Boudon et al. (2005)and Smith & Roobol (1990) at 4,534 ± 98 yr cal BP.
Unit 11: Based on the same evidences as for the Unit 10, we identified this unit as the
42
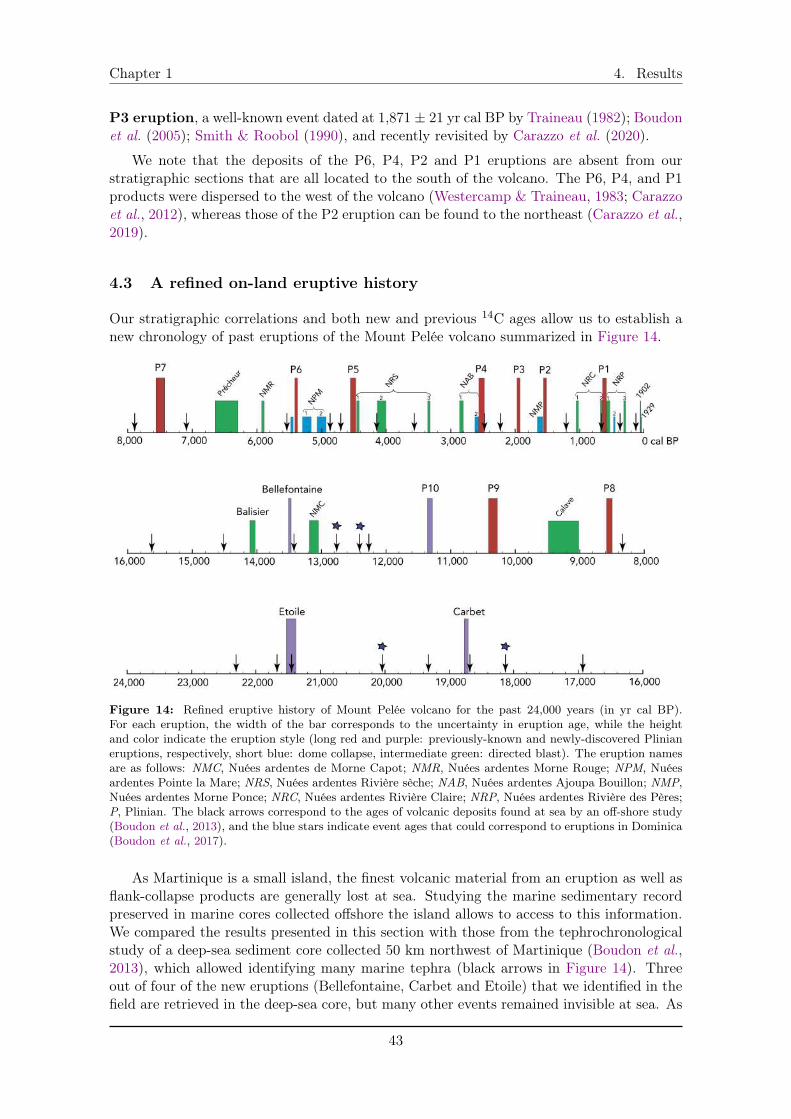
Chapter 1 4. Results
P3 eruption, a well-known event dated at 1,871 ± 21 yr cal BP by Traineau (1982); Boudonet al. (2005); Smith & Roobol (1990), and recently revisited by Carazzo et al. (2020).
We note that the deposits of the P6, P4, P2 and P1 eruptions are absent from ourstratigraphic sections that are all located to the south of the volcano. The P6, P4, and P1products were dispersed to the west of the volcano (Westercamp & Traineau, 1983; Carazzoet al., 2012), whereas those of the P2 eruption can be found to the northeast (Carazzo et al.,2019).
4.3 A refined on-land eruptive history
Our stratigraphic correlations and both new and previous 14C ages allow us to establish anew chronology of past eruptions of the Mount Pelée volcano summarized in Figure 14.
Figure 14: Refined eruptive history of Mount Pelée volcano for the past 24,000 years (in yr cal BP).For each eruption, the width of the bar corresponds to the uncertainty in eruption age, while the heightand color indicate the eruption style (long red and purple: previously-known and newly-discovered Plinianeruptions, respectively, short blue: dome collapse, intermediate green: directed blast). The eruption namesare as follows: NMC, Nuées ardentes de Morne Capot; NMR, Nuées ardentes Morne Rouge; NPM, Nuéesardentes Pointe la Mare; NRS, Nuées ardentes Rivière sèche; NAB, Nuées ardentes Ajoupa Bouillon; NMP,Nuées ardentes Morne Ponce; NRC, Nuées ardentes Rivière Claire; NRP, Nuées ardentes Rivière des Pères;P, Plinian. The black arrows correspond to the ages of volcanic deposits found at sea by an off-shore study(Boudon et al., 2013), and the blue stars indicate event ages that could correspond to eruptions in Dominica(Boudon et al., 2017).
As Martinique is a small island, the finest volcanic material from an eruption as well asflank-collapse products are generally lost at sea. Studying the marine sedimentary recordpreserved in marine cores collected offshore the island allows to access to this information.We compared the results presented in this section with those from the tephrochronologicalstudy of a deep-sea sediment core collected 50 km northwest of Martinique (Boudon et al.,2013), which allowed identifying many marine tephra (black arrows in Figure 14). Threeout of four of the new eruptions (Bellefontaine, Carbet and Etoile) that we identified in thefield are retrieved in the deep-sea core, but many other events remained invisible at sea. As
43
5. Conclusion Chapter 1
the marine core was collected northwest of Martinique, Plinian events whose products wenton the other side of the island could indeed have not reached the location of the drilling site.The marine tephra identified in the deep-sea sediment core, but not corresponding to anyknown eruptive event in Martinique could correspond either to small still-unknown Peleanevents, or to volcanic deposits coming from another island. Four events (blue stars in Figure14) could indeed correspond to pumiceous eruptions of Dominica (Boudon et al., 2017).
This refined on-land eruptive history, now includes thirteen Plinian eruptions and twenty-one Pelean events (most of them characterized by lateral blasts of lava domes), which makesa total of thirty-four magmatic eruptions in the last 24,000 years cal BP. This is a mini-mum estimate as several Pelean events could remain unknown, and as we do not includethe numerous phreatic eruptions that occurred at Mount Pelée volcano. The twenty-threeeruptions that occurred in the last 6 ka cal BP are relatively well-known (Traineau, 1982;Westercamp & Traineau, 1983; Carazzo et al., 2012, 2019, 2020) (Section 2.3). On thecontrary, deposits from the six eruptions of the 6,000�12,000 cal BP period are poorly-preserved, making further interpretation impossible. We were however able to retrieve well-preserved deposits from the oldest (and newly discovered) events of this refined eruptivehistory (between 12,000 and 24,000 cal BP): the Bellefontaine, Balisier, Carbet and Etoileeruptions.
We can now interpret these events in terms of eruptive parameters (volume, columnheight,. . . ) by using the methods described in Section 2, in order to better understandthe global dynamics of Mount Pelée (Chapter 2), to obtain precise constraints for physicalmodels of tephra dispersal (Chapter 5), and to move forward towards a better volcanichazard assessment in Martinique (Chapter 6).
5 Conclusion
Combining new extensive field studies and carbon-dating measurements, we established anew chronology of recent past eruptions of the Mount Pelée volcano. We identified sixnew eruptions in the past 24 ka cal BP, including four Plinians eruptions and two Peleanevents. When comparing our newly-discovered Plinian eruptions (in purple in Figure 14)with eruptive events dated on volcanic deposits found at sea (Boudon et al., 2013) (blackarrows in Figure 14), we find that three out of four correspond to an event spotted off-shore,which reinforces the reliability of this new eruptive history for the Mount Pelée.
This refined eruptive history is thus very rich with at least 34 magmatic eruptions inthe last 24 ka cal BP. This is however only a minimum estimate as it is most probablethat many Pelean eruptions that occurred between 10 ka and 24 ka cal BP could stillremain unknown because of their small volumes which would have not been preserved dueto intense weathering and/or flank collapses. Based on this new chronology, we calculatedthat a Plinian eruption occurs at least every ⇡ 1.8 ka in Martinique.
Amongst these newly-discovered eruptions, we have collected enough data (thicknessesand distribution of lithics at several outcrops, together with samples for grain-size analyses)to go further and fully reconstruct the eruptive parameters of the four eruptions of Belle-fontaine, Balisier, Carbet and Etoile by using the methods described in Section 3.3 andSection 3.4. The results are presented in the following Chapter 2.
44
References
ReferencesAlibidirov, M. & Dingwell, D.B. 1996 Magma fragmentation by rapid decompression. Nature 380,
146–148.
Andreieff, P., Baudron, J.C. & Westercamp, D. 1988 Histoire géologique de la Martinique (Pe-tites Antilles): biostratigraphie (foraminifères), radiochronologie (potassium-argon), évolution volcano-structurale. Géologie de la France 2-3, 39–70.
Andreieff, P., Bellon, H. & Westercamp, D. 1976 Chronométrie et stratigraphie comparée desédifices volcaniques et formations sédimentaires de la Martinique (Antilles Françaises). Bulletin du BRGMSection IV, 335–346, no 4.
Bardintzeff, J.M., Miskovsky, J.C., Traineau, H. & Westercamp, D. 1989 The recent pumiceeruptions of Mt. Pelée, Martinique. Part II: Grain-size studies and modelling the last Plinian phase P1.J. Volcanol. Geotherm. Res. 38, 35–48.
Bonadonna, C. & Costa, A. 2012 Estimating the volume of tephra deposits: A new simple strategy.Geology 40, 415–418.
Bonadonna, C. & Costa, A. 2013 Plume height, volume, and classification of explosive volcanic eruptionsbased on the Weibull function. Bull. Volcanol. 75, 1–19.
Bonadonna, C., Ernst, G.G.J. & Sparks, R.S.J. 1998 Thickness variations and volume estimatesof tephra fall deposits: The importance of particle Reynolds number. J. Volcanol. Geotherm. Res. 81,173–187.
Bonadonna, C. & Houghton, B.F. 2005 Total grain-size distribution and volume of tephra-fall deposits.Bull. Volcanol. 67, 441–456.
Boudon, G. 1993 La montagne Pelée, Martinique : évolution volcanologique. Mem. Soc. geol. France 163,231–238.
Boudon, G., Balcone-Boissard, H., Solaro, C. & Martel, C. 2017 Revised chronostratigraphy ofrecurrent ignimbritic eruptions in Dominica (Lesser Antilles arc): Implications on the behavior of themagma plumbing system. J. Volcanol. Geotherm. Res. 343, 135–154.
Boudon, G., Le Friant, A., Komorowski, J.C. & Deplus, C. 2007 Volcano flank instability in theLesser Antilles Arc: Diversity of scale, processes, and temporal recurrence. J. Geophys. Res. 112, B0825.
Boudon, G., Le Friant, A., Villemant, B. & Viode, J.P. 2005 Martinique. In Volcanic Hazard Atlasof the Lesser Antilles (ed. J.M. Lindsay, R.E.A. Robertson, J.B. Sheperd & S. Ali), pp. 127–146. SeismicResearch Unit, The University of the West Indies, Trinidad and Tobago, W.I.
Boudon, G., Villemant, B., Le Friant, A., Paterne, M. & Cortijo, E. 2013 Role of large flank-collapse events on magma evolution of volcanoes: Insights from the Lesser Antilles Arc. J. Volcanol.Geotherm. Res. 263, 224–237.
Bourdier, J.L., Boudon, G. & Gourgaud, A. 1989 Stratigraphy of the 1902 and 1929 nuée-ardentedeposits, Mt. Pelée, Martinique. J. Volcanol. Geotherm. Res. 38, 77–96.
Bouysse, P. & Garrabé, F. 1984 Neogene tectonic Evolution of the Limestone Caribees in the GuadeloupeArchipelago. C.R. Acad. Sc. Paris Serie I 298, 763–766.
Bouysse, P. & Guennoc, P. 1983 Données sur la structure de l’arc insulaire des Petites Antilles, entreSte-Lucie et Anguilla. Marine Geology 53, 131–166.
Bouysse, P. & Martin, P. 1979 Caractères morphostructuraux et évolution géodynamique de l’arc insu-laire des Petites Antilles (Campagne ARCANTE 1). Bulletin du BRGM section IV (3/4), 185–210.
Bouysse, P. & Westercamp, D. 1990 Subduction of Atlantic aseismic ridges and Late Cenozoic evolutionof the Lesser Antilles island arc. Tectonophysics 175, 349–380.
Bouysse, P., Westercamp, D. & Andreieff, P. 1990 The Lesser Antilles Island arc. Proc. Ocean DrillProgram Sci Results 110, 29–44.
45
References
Briden, J.C., Rex, D.C., Faller, A.M. & Tomblin, J.F. 1979 K-Ar geochronology and paleomagnetismof volcanic rocks in the Lesser Antilles island arc. Phil. Transac. Roy. Soc. Lon. 291 (1383), 485–528.
Bronk Ramsey, C. 2009 Bayesian analysis of radiocarbon dates. Radiocarbon 51, 337–360.
Brunet, M., Le Friant, A., Boudon, G., Lafuerza, S., Talling, P., Hornbach, M., Ishizuka,O., Lebas, E., Guyard, H. & Party, IODP Expedition 340 Science 2016 Composition, geometry,and emplacement dynamics of a large volcanic island landslide offshore martinique: From volcano flank-collapse to seafloor sediment failure. Geochem. Geophys. Geosyst. 17, 699–724.
Brunet, M., Moretti, L., Le Friant, A., Mangeney, A., Fernández Nieto, E.D. & Bouchut, F.2017 Numerical simulation of the 30-45 ka debris avalanche flow of Montagne Pelée volcano, Martinique:From volcano flank collapse to submarine emplacement. Nat. Hazards 87, 1189–1222.
Carazzo, G., Girault, F., Aubry, T., Bouquerel, H. & Kaminski, E. 2014 Laboratory experimentsof forced plumes in a density-stratified crossflow and implications for volcanic plumes. Geophys. Res. Lett.41, 8759–8766.
Carazzo, G., Kaminski, E. & Tait, S. 2008 On the rise of turbulent plumes: Quantitative effects of vari-able entrainment for submarine hydrothermal vents, terrestrial and extra terrestrial explosive volcanism.J. Geophys. Res. Solid Earth 113, 1–19.
Carazzo, G., Tait, S. & Kaminski, E. 2019 Marginally stable recent Plinian eruptions of Mt. Peléevolcano (Lesser Antilles): The P2 AD 280 eruption. Bull. Volcanol. 81, 1–17.
Carazzo, G., Tait, S., Kaminski, E. & Gardner, J. E. 2012 The recent Plinian explosive activity ofMt. Pelée volcano (Lesser Antilles): The P1 AD 1300 eruption. Bull. Volcanol. 74, 2187–2203.
Carazzo, G., Tait, S., Michaud-Dubuy, A., Fries, A. & Kaminski, E. 2020 Transition from stablecolumn to partial collapse during the 79 cal CE P3 Plinian eruption of Mt Pelée volcano (Lesser Antilles).J. Volcanol. Geotherm. Res. In press. https://doi.org/10.1016/j.jvolgeores.2019.106764.
Carey, Steven & Sigurdsson, Haraldur 1982 Influence of particle aggregation on deposition of distaltephra from the May 18, 1980, eruption of Mount St. Helens volcano. J. Geophys. Res. 87, 7061–7072.
Carey, Steven & Sigurdsson, Haraldur 1986 The 1982 eruptions of El Chichon volcano, Mexico (2):Observations and numerical modelling of tephra-fall distribution. Bull. Volcanol. 48, 127–141.
Carey, S. & Sparks, R.S.J. 1986 Quantitative models of the fallout and dispersal of tephra from volcaniceruption columns. Bull. Volcanol. 48, 109–125.
Costa, A., Suzuki, Y. J., Cerminara, M., Devenish, B. J., Esposti Ongaro, T., Herzog, M.,Van Eaton, A. R., Denby, L. C., Bursik, M., de’ Michieli Vitturi, M., Engwell, S., Neri, A.,Barsotti, S., Folch, A., Macedonio, G., Girault, F., Carazzo, G., Tait, S., Kaminski, E.,Mastin, L. G., Woodhouse, M. J., Phillips, J. C., Hogg, A. J., Degruyter, W. & Bonadonna,C. 2016 Results of the eruptive column model inter-comparison study. J. Volcanol. Geotherm. Res. 326,2–25.
Daggit, M.L., Mather, T.A., Pyle, D.M. & Page, S. 2014 AshCalc-a new tool for the comparison ofthe exponential, power-law and Weibull models of tephra deposition. J. Appl. Volcanol. 3:7.
Fisher, R.V., Smith, A.L. & Roobol, M.J. 1980 Destruction of St. Pierre, Martinique by ash cloudsurges, May 8 and 20, 1902. Geology 8, 472–476.
Germa, A. 2008 Evolution volcano-tectonique de l’île de la Martinique (arc insulaire des Petites Antilles):nouvelles contraintes géochronologiques et géomorphologiques. PhD thesis, Université Paris XI Orsay.
Germa, A., Lahitte, P. & Quidelleur, X. 2015 Construction and destruction of Mont Pelée volcano:Volumes and rates constrained from a geomorphological model of evolution. J. Geophys. Res. Earth Surf.120, 1206–1226.
Germa, A., Quidelleur, X., Labanieh, S., Chauvel, C. & Lahitte, P. 2011a The volcanic evolutionof Martinique island: Insights from K-Ar dating into the Lesser Antilles arc migration since the Oligocene.J. Volcanol. Geotherm. Res. 208, 122–135.
46
References
Germa, A., Quidelleur, X., Labanieh, S., Lahitte, P. & Chauvel, C. 2010 The eruptive historyof Morne Jacob volcano (Martinique Island, French West Indies): Geochronology, geomorphology andgeochemistry of the earliest volcanism in the recent Lesser Antilles arc. J. Volcanol. Geotherm. Res. 198,297–310.
Germa, A., Quidelleur, X., Lahitte, P., Labanieh, S. & Chauvel, C. 2011b The K-Ar Cassignol-Gillot technique applied to western Martinique lavas: A record of Lesser Antilles arc activity from 2 Mato Mount Pelée volcanism. Quat. Geochronol. 6, 341–355.
Girault, F., Carazzo, G., Tait, S., Ferrucci, F. & Kaminski, E. 2014 The effect of total grain-sizedistribution on the dynamics of turbulent volcanic plumes. Earth Planet. Sci. Lett. 394, 124–134.
Girault, F., Carazzo, G., Tait, S. & Kaminski, E. 2016 Combined effects of total grain-size distribu-tion and crosswind on the rise of eruptive volcanic columns. J. Volcanol. Geotherm. Res. 326, 103–113.
Grunevald, H. 1965 Géologie de la Martinique. Mémoires pour servir à l’explication de la carte géologiquedétaillée de la France. Paris.
Hartmann, W.K. 1969 Terrestrial, lunar and interplanetary rock fragmentation. Icarus 10, 201–213.
Jarrard, R.D. 1986 Relations among subduction parameters. Rev. Geophys. 24, 217–284.
Kaminski, E. & Jaupart, C. 1998 The size distribution of pyroclasts and the fragmentation sequence inexplosive volcanic eruptions. J. Geophys. Res. 103, 29759–29779.
Komorowski, J. C., Legendre, Y., Caron, B. & Boudon, G. 2008 Reconstruction and analysis of sub-plinian tephra dispersal during the 1530 A.D. Soufriere (Guadeloupe) eruption: Implications for scenariodefinition and hazards assessment. J. Volcanol. Geotherm. Res. 178, 491–515.
Kueppers, U., Perugini, D. & Dingwell, D. B. 2006 "Explosive energy" during volcanic eruptionsfrom fractal analysis of pyroclasts. Earth Planet. Sci. Lett. 248 (3-4), 800–807.
Labanieh, S. 2009 Géochimie de l’île de la Martinique aux Petites Antilles. PhD thesis, Université JosephFourier, Grenoble (France).
Lacroix, A. 1904 La Montagne Pelée et ses éruptions. Masson, Paris.
Lajoie, J. & Boudon, G. 1989 The Peléan deposits in the Fort Cemetery of St. Pierre, Martinique: Amodel for the accumulation of turbulent nuées ardentes. J. Volcanol. Geotherm. Res. 38, 113–130.
Lajoie, J., Boudon, G. & Bourdier, J-L. 1989 Depositional mechanics of the 1902 pyroclastic nuée-ardente deposits of Mt. Pelée, Martinique. J. Volcanol. Geotherm. Res. 38, 131–142.
Le Friant, A., Boudon, G., Deplus, C. & Villemant, B. 2003 Large-scale flank collapse events duringthe activity of Montagne Pelée, Martinique, Lesser Antilles. J. Geophys. Res. 108 (B1), 1–15.
Le Friant, A., Ishizuka, O., Boudon, G., Palmer, M. R., Talling, P. J., Villemant, B., Adachi,T., Aljahdali, M., Breitkreuz, C., Brunet, M., Caron, B., Coussens, M., Deplus, C., Endo,D., Feuillet, N., Fraas, A. J., Fujinawa, A., Hart, M. B., Hatfield, R. G., Hornbach,M., Jutzeler, M., Kataoka, K. S., Komorowski, J.-C., Lebas, E., Lafuerza, S., Maeno, F.,Manga, M., Martínez-Colón, M., McCanta, M., Morgan, S., Saito, T., Slagle, A., Sparks,S., Stinton, A., Stroncik, N., Subramanyam, K. S. V., Tamura, Y., Trofimovs, J., Voight, B.,Wall-Palmer, D., Wang, F. & Watt, S. F. L. 2015 Submarine record of volcanic island constructionand collapse in the Lesser Antilles arc: First scientific drilling of submarine volcanic island landslides byIODP Expedition 340. Geochem. Geophys. Geosyst. 16 (2), 420–442.
Lindsay, J.M., Robertson, R.E.A., Shepherd, J.B. & Ali, S. 2005 Volcanic Hazard Atlas of the LesserAntilles. Seismic Research Unit, The University of the West Indies, Trinidad and Tobago, W.I.
Macdonald, R., Hawkesworth, C.J. & Heath, E. 2000 The Lesser Antilles volcanic chain: a study inarc magmatism. Earth Sci. Rev. 49, 1–76.
Michaud-Dubuy, A., Carazzo, G., Kaminski, E. & Girault, F. 2018 A revisit of the role of gasentrapment on the stability conditions of explosive volcanic columns. J. Volcanol. Geotherm. Res. 357,349–361.
47
References
Michaud-Dubuy, A., Carazzo, G., Tait, S., Le Hir, G., Fluteau, F. & Kaminski, E. 2019 Impactof wind direction variability on hazard assessment in Martinique (Lesser Antilles): the example of the13.5 ka cal BP Bellefontaine Plinian eruption of Mount Pelée volcano. J. Volcanol. Geotherm. Res. 381,193–208.
Météo France 2019 Le climat en martinique. Tech. Rep.. Météo France, avail-able at http://www.meteofrance.gp/documents/3714888/5579049/climat972_2pages.pdf/
1bb26ab1-630b-4fd4-9757-9adb5da948a6.
Nagle, F., Stipp, J.J. & Fisher, D.E. 1976 K–Ar geochronology of the Limestone Caribbees andMartinique, Lesser Antilles, West Indies. Earth Planet. Sci. Lett 29, 401–412.
Newhall, Christopher G. & Self, Stephen 1982 The volcanic explosivity index (VEI) an estimate ofexplosive magnitude for historical volcanism. J. Geophys. Res. 87 (C2), 1231–1238.
Perret, F.A. 1937 The Eruption of Mt. Pelée 1929-1932 . Carnegie Institution of Washington.
Pyle, D.M. 1989 The thickness, volume and grainsize of tephra fall deposits. Bull. Volcanol. 51 (1), 1–15.
Pyle, D.M. 2000 Sizes of volcanic eruptions. In Encyclopedia of Volcanoes (ed. H.E. Sigurdsson,B. Houghton, H. Reimer, Stiw J. & S. McNutt), pp. 263–269. Academic Press, San Diego.
Reimer, P. 2013 Selection and treatment of data for radiocarbon calibration: an update to the internationalcalibration (IntCal) criteria. Radiocarbon 55, 1923–1945.
Roobol, M.J. & Smith, A.L. 1976 Mount Pelée, Martinique: A pattern of alternating eruptive styles.Geology 4, 521–524.
Roobol, M.J. & Smith, A.L. 1980 Pumice Eruptions of the Lesser Antilles. Bull. Volcanol. 43 (2),277–286.
Roobol, M.J. & Smith, A.L. 2004 Volcanology of Saba and St. Eustatius, Northern Lesser Antilles.Koninklijke Nederlandse Akademie Van Wetenschappen.
Rose, W.I. & Durant, A.J. 2009 El Chichon volcano, April 4, 1982: volcanic cloud history and fine ashfallout. Nat. Hazards 51 (363).
Samper, A., Quidelleur, X., Boudon, G., Le Friant, A. & Komorowski, J.C. 2008 Radiometricdating of three large volume flank collapses in the Lesser Antilles arc. J. Volcanol. Geotherm. Res. 176 (4),485–492.
Smith, A.L. & Roobol, M.J. 1990 Mount Pelée, Martinique: A study of an Active Island Arc Volcano.Geol. Soc. Am. Memoir 175.
Traineau, H. 1982 Contribution à l’étude géologique de la Montagne Pelée (Martinique): Evolution del’activité éruptive au cours de la période récente. PhD thesis, Université Paris XI.
Traineau, H., Westercamp, D., Bardintzeff, J. M. & Miskovsky, J. C. 1989 The recent pumiceeruptions of Mt. Pelée volcano, Martinique. Part I: Depositional sequences, description of pumiceousdeposits. J. Volcanol. Geotherm. Res. 38, 17–33.
Traineau, H., Westercamp, D. & Coulon, C. 1983 Mélanges magmatiques à la Montagne Pelée(Martinique). Origine des éruptions de type Saint-Vincent. Bull. Volcanol. 46 (3), 243–269.
Turcotte, D.L. 1986 Fractals and fragmentation. J. Geophys. Res. 91, 1921–1926.
Villemant, B. & Boudon, G. 1999 H20 and halogen (F, Cl, Br) behaviour during shallow magmadegassing processes. Earth Planet. Sci. Lett. 168, 271–286.
Vincent, P.M., Bourdier, J.L. & Boudon, G. 1989 The primitive volcano of Mount Pelée: Its con-struction and partial destruction by flank collapse. J. Volcanol. Geotherm. Res. 38, 1–15.
Wadge, G. 1984 Comparison of volcanic production rates and subduction rates in the Lesser Antilles andCentral America. Geology 12, 555–558.
48
References
Wadge, G. 1986 The dykes and structural setting of the volcanic front in the Lesser Antilles island arc.Bull. Volcanol. 48, 349–372.
Ward, G.K. & Wilson, S.R. 1978 Procedures for comparing and combining radiocarbon age determina-tions: A critique. Archaeometry 20, 19–31.
Westercamp, D. 1972 Contribution à l’étude du volcanisme en Martinique. PhD thesis, Université deParis-Sud.
Westercamp, D. & Andreieff, P. 1983 Saint Barthélémy et ses îlets, Antilles françaises: stratigraphieet évolution magmato-structurale. Bulletin de la Société Géologique de France XXV (6), 873–883.
Westercamp, D., Andreieff, P., Bouysse, P., Cottez, S. & Battistini, R. 1989 Notice explicative,Carte géol. France (1/50 000), feuille MARTINIQUE . Orléans : Bureau de recherches géologiques etminières, 246 pp. Carte géologique par Westercamp D., Pelletier B., Thibaut P.M., and Traineau, H.
Westercamp, D., Pelletier, B., Thibaut, P.M. & Traineau, H. 1990 Carte géol. France (1/50 000),feuille MARTINIQUE . Orléans : Bureau de recherches géologiques et minières, notice explicative parWestercamp D., Andreieff P., Bouysse P., Cottez S., Battistini R. (1989), 246 pp.
Westercamp, D. & Tazieff, H. 1980 Martinique, Guadeloupe, Saint-Martin, La Désirade. Masson, Paris,135 pp.
Westercamp, D. & Traineau, H. 1983 The past 5,000 years of volcanic activity at Mt. Pelée Martinique(F.W.I.): Implications for assessment of volcanic hazards. J. Volcanol. Geotherm. Res. 17, 159–185.
Woodhouse, M.J., Hogg, A.J. & Phillips, J.C. 2016 A global sensitivity analysis of the PlumeRisemodel of volcanic plumes. J. Volcanol. Geotherm. Res. 326, 54–76.
Woods, A. W. 1995 The dynamics of explosive volcanic eruptions. Rev. Geophys. 33, 495–530.
Wright, J.V., Smith, A.L., Roobol, M. J., Mattioli, G. S. & Fryxell, J.E. 2016 Distal ashhurricane (pyroclastic density current) deposits from a ca. 2000 yr B.P. Plinian-style eruption of MountPelée, Martinique: Distribution, grain-size characteristics, and implications for future hazard. Geol. Soc.Am. Bull. 128 (5/6), 777–791.
49

Chapter 2
Reconstruction of the newly
discovered eruptions
The results for the Bellefontaine eruption are published in Michaud-Dubuy A., Carazzo G.,Tait S., Le Hir G., Fluteau F., and Kaminski E. (2019) J. Volcanol. Geotherm. Res. 381,193-208. https://doi.org/10.1016/j.jvolgeores.2019.06.004
Table of contents1 Introduction . . . . . . . . . . . . . . . . . . . . . . . . . . . . . . . . . . 532 Field study . . . . . . . . . . . . . . . . . . . . . . . . . . . . . . . . . . . 53
2.1 Stratigraphy of the units . . . . . . . . . . . . . . . . . . . . . . . 532.1.1 The Bellefontaine sequence . . . . . . . . . . . . . . . . 532.1.2 The Balisier sequence . . . . . . . . . . . . . . . . . . . 542.1.3 The Carbet sequence . . . . . . . . . . . . . . . . . . . 562.1.4 The Etoile sequence . . . . . . . . . . . . . . . . . . . . 56
2.2 Spatial distributions of the deposits . . . . . . . . . . . . . . . . . 572.2.1 The Bellefontaine sequence . . . . . . . . . . . . . . . . 572.2.2 The Balisier sequence . . . . . . . . . . . . . . . . . . . 582.2.3 The Carbet sequence . . . . . . . . . . . . . . . . . . . 622.2.4 The Etoile sequence . . . . . . . . . . . . . . . . . . . . 64
2.3 Grain-size analyses . . . . . . . . . . . . . . . . . . . . . . . . . . 652.3.1 The Bellefontaine eruption . . . . . . . . . . . . . . . . 652.3.2 The Balisier eruption . . . . . . . . . . . . . . . . . . . 672.3.3 The Carbet eruption . . . . . . . . . . . . . . . . . . . 672.3.4 The Etoile eruption . . . . . . . . . . . . . . . . . . . . 68
3 Eruptive dynamics . . . . . . . . . . . . . . . . . . . . . . . . . . . . . . . 693.1 Erupted volumes . . . . . . . . . . . . . . . . . . . . . . . . . . . 703.2 Column heights and exit velocities . . . . . . . . . . . . . . . . . 733.3 Mass discharge rates and durations . . . . . . . . . . . . . . . . . 74
4 Discussion . . . . . . . . . . . . . . . . . . . . . . . . . . . . . . . . . . . 764.1 Summary of eruptive parameters . . . . . . . . . . . . . . . . . . 764.2 Possible scenario for hazard assessment . . . . . . . . . . . . . . . 77
5 Conclusion . . . . . . . . . . . . . . . . . . . . . . . . . . . . . . . . . . . 79
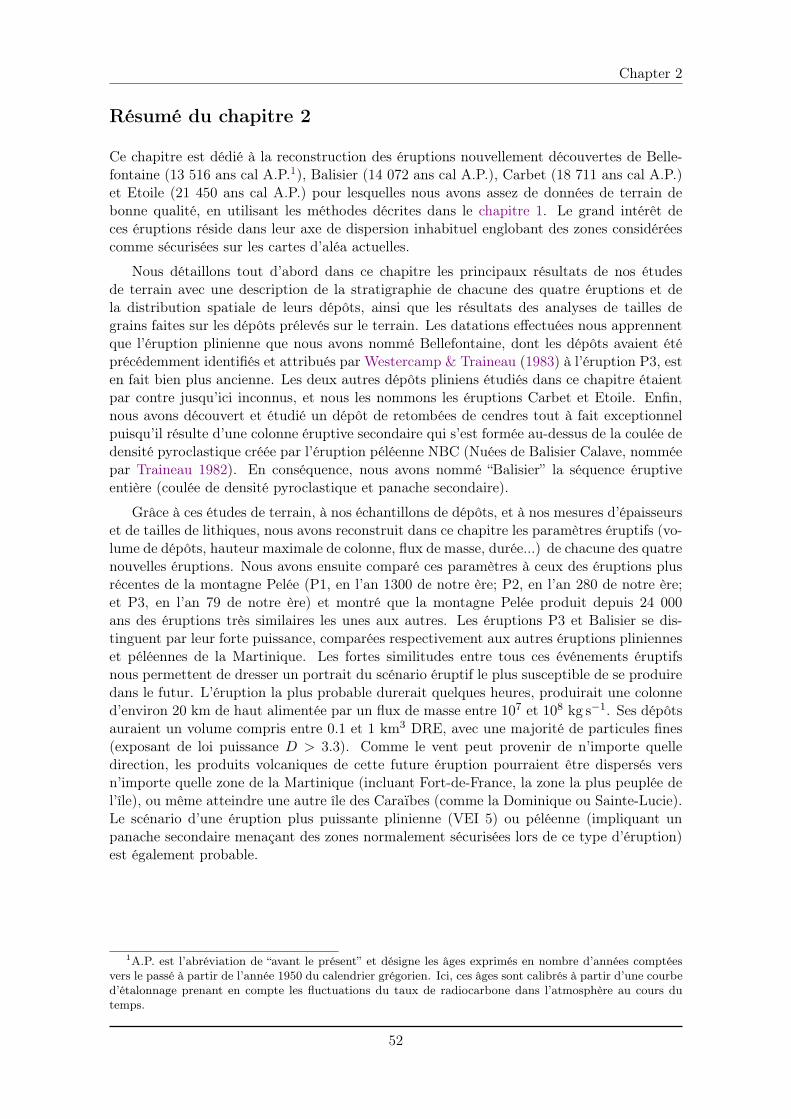
Chapter 2
Résumé du chapitre 2
Ce chapitre est dédié à la reconstruction des éruptions nouvellement découvertes de Belle-fontaine (13 516 ans cal A.P.1), Balisier (14 072 ans cal A.P.), Carbet (18 711 ans cal A.P.)et Etoile (21 450 ans cal A.P.) pour lesquelles nous avons assez de données de terrain debonne qualité, en utilisant les méthodes décrites dans le chapitre 1. Le grand intérêt deces éruptions réside dans leur axe de dispersion inhabituel englobant des zones considéréescomme sécurisées sur les cartes d’aléa actuelles.
Nous détaillons tout d’abord dans ce chapitre les principaux résultats de nos étudesde terrain avec une description de la stratigraphie de chacune des quatre éruptions et dela distribution spatiale de leurs dépôts, ainsi que les résultats des analyses de tailles degrains faites sur les dépôts prélevés sur le terrain. Les datations effectuées nous apprennentque l’éruption plinienne que nous avons nommé Bellefontaine, dont les dépôts avaient étéprécédemment identifiés et attribués par Westercamp & Traineau (1983) à l’éruption P3, esten fait bien plus ancienne. Les deux autres dépôts pliniens étudiés dans ce chapitre étaientpar contre jusqu’ici inconnus, et nous les nommons les éruptions Carbet et Etoile. Enfin,nous avons découvert et étudié un dépôt de retombées de cendres tout à fait exceptionnelpuisqu’il résulte d’une colonne éruptive secondaire qui s’est formée au-dessus de la coulée dedensité pyroclastique créée par l’éruption péléenne NBC (Nuées de Balisier Calave, nomméepar Traineau 1982). En conséquence, nous avons nommé “Balisier” la séquence éruptiveentière (coulée de densité pyroclastique et panache secondaire).
Grâce à ces études de terrain, à nos échantillons de dépôts, et à nos mesures d’épaisseurset de tailles de lithiques, nous avons reconstruit dans ce chapitre les paramètres éruptifs (vo-lume de dépôts, hauteur maximale de colonne, flux de masse, durée...) de chacune des quatrenouvelles éruptions. Nous avons ensuite comparé ces paramètres à ceux des éruptions plusrécentes de la montagne Pelée (P1, en l’an 1300 de notre ère; P2, en l’an 280 de notre ère;et P3, en l’an 79 de notre ère) et montré que la montagne Pelée produit depuis 24 000ans des éruptions très similaires les unes aux autres. Les éruptions P3 et Balisier se dis-tinguent par leur forte puissance, comparées respectivement aux autres éruptions plinienneset péléennes de la Martinique. Les fortes similitudes entre tous ces événements éruptifsnous permettent de dresser un portrait du scénario éruptif le plus susceptible de se produiredans le futur. L’éruption la plus probable durerait quelques heures, produirait une colonned’environ 20 km de haut alimentée par un flux de masse entre 10
7 et 108 kg s
�1. Ses dépôtsauraient un volume compris entre 0.1 et 1 km
3 DRE, avec une majorité de particules fines(exposant de loi puissance D > 3.3). Comme le vent peut provenir de n’importe quelledirection, les produits volcaniques de cette future éruption pourraient être dispersés versn’importe quelle zone de la Martinique (incluant Fort-de-France, la zone la plus peuplée del’île), ou même atteindre une autre île des Caraïbes (comme la Dominique ou Sainte-Lucie).Le scénario d’une éruption plus puissante plinienne (VEI 5) ou péléenne (impliquant unpanache secondaire menaçant des zones normalement sécurisées lors de ce type d’éruption)est également probable.
1A.P. est l’abréviation de “avant le présent” et désigne les âges exprimés en nombre d’années comptéesvers le passé à partir de l’année 1950 du calendrier grégorien. Ici, ces âges sont calibrés à partir d’une courbed’étalonnage prenant en compte les fluctuations du taux de radiocarbone dans l’atmosphère au cours dutemps.
52
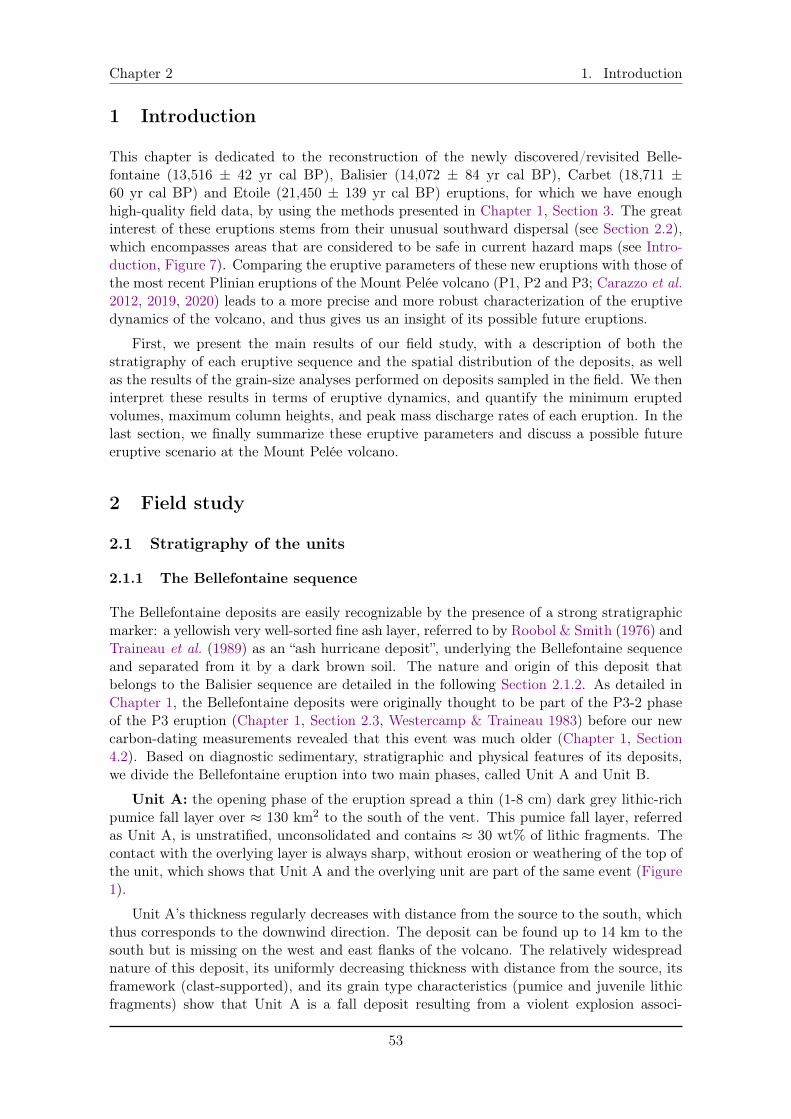
Chapter 2 1. Introduction
1 Introduction
This chapter is dedicated to the reconstruction of the newly discovered/revisited Belle-fontaine (13,516 ± 42 yr cal BP), Balisier (14,072 ± 84 yr cal BP), Carbet (18,711 ±60 yr cal BP) and Etoile (21,450 ± 139 yr cal BP) eruptions, for which we have enoughhigh-quality field data, by using the methods presented in Chapter 1, Section 3. The greatinterest of these eruptions stems from their unusual southward dispersal (see Section 2.2),which encompasses areas that are considered to be safe in current hazard maps (see Intro-duction, Figure 7). Comparing the eruptive parameters of these new eruptions with those ofthe most recent Plinian eruptions of the Mount Pelée volcano (P1, P2 and P3; Carazzo et al.
2012, 2019, 2020) leads to a more precise and more robust characterization of the eruptivedynamics of the volcano, and thus gives us an insight of its possible future eruptions.
First, we present the main results of our field study, with a description of both thestratigraphy of each eruptive sequence and the spatial distribution of the deposits, as wellas the results of the grain-size analyses performed on deposits sampled in the field. We theninterpret these results in terms of eruptive dynamics, and quantify the minimum eruptedvolumes, maximum column heights, and peak mass discharge rates of each eruption. In thelast section, we finally summarize these eruptive parameters and discuss a possible futureeruptive scenario at the Mount Pelée volcano.
2 Field study
2.1 Stratigraphy of the units
2.1.1 The Bellefontaine sequence
The Bellefontaine deposits are easily recognizable by the presence of a strong stratigraphicmarker: a yellowish very well-sorted fine ash layer, referred to by Roobol & Smith (1976) andTraineau et al. (1989) as an “ash hurricane deposit”, underlying the Bellefontaine sequenceand separated from it by a dark brown soil. The nature and origin of this deposit thatbelongs to the Balisier sequence are detailed in the following Section 2.1.2. As detailed inChapter 1, the Bellefontaine deposits were originally thought to be part of the P3-2 phaseof the P3 eruption (Chapter 1, Section 2.3, Westercamp & Traineau 1983) before our newcarbon-dating measurements revealed that this event was much older (Chapter 1, Section4.2). Based on diagnostic sedimentary, stratigraphic and physical features of its deposits,we divide the Bellefontaine eruption into two main phases, called Unit A and Unit B.
Unit A: the opening phase of the eruption spread a thin (1-8 cm) dark grey lithic-richpumice fall layer over ⇡ 130 km
2 to the south of the vent. This pumice fall layer, referredas Unit A, is unstratified, unconsolidated and contains ⇡ 30 wt% of lithic fragments. Thecontact with the overlying layer is always sharp, without erosion or weathering of the top ofthe unit, which shows that Unit A and the overlying unit are part of the same event (Figure1).
Unit A’s thickness regularly decreases with distance from the source to the south, whichthus corresponds to the downwind direction. The deposit can be found up to 14 km to thesouth but is missing on the west and east flanks of the volcano. The relatively widespreadnature of this deposit, its uniformly decreasing thickness with distance from the source, itsframework (clast-supported), and its grain type characteristics (pumice and juvenile lithicfragments) show that Unit A is a fall deposit resulting from a violent explosion associ-
53
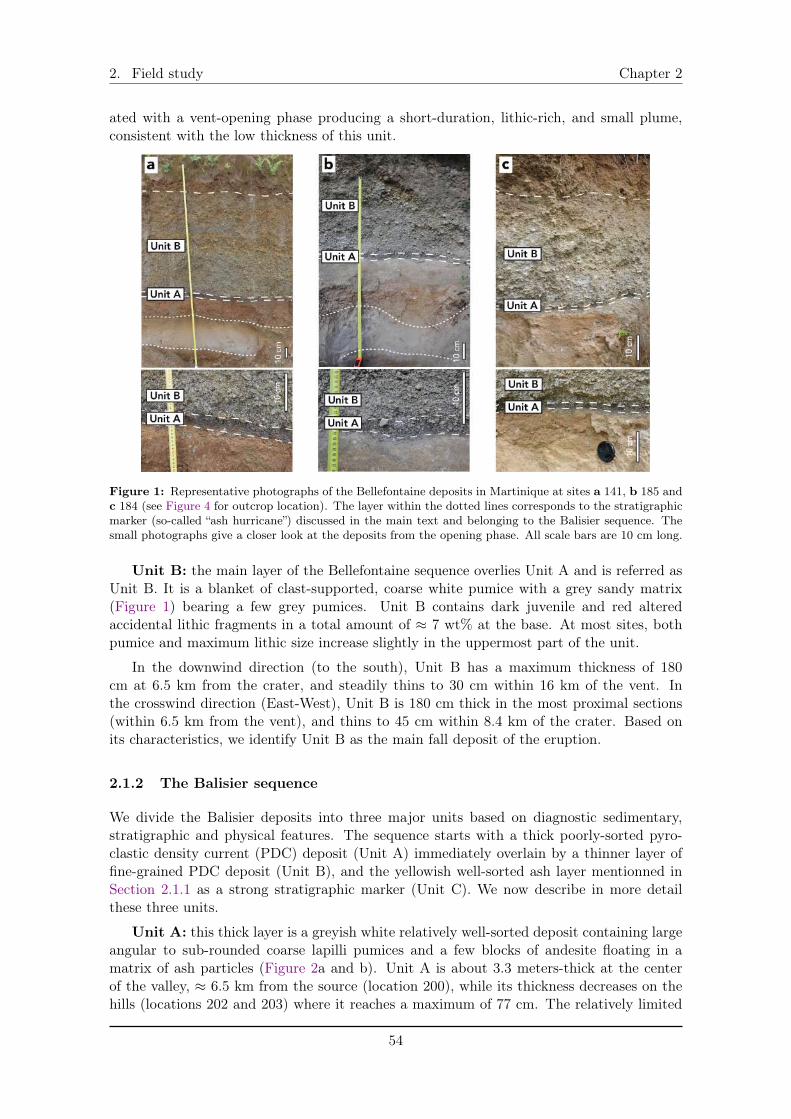
2. Field study Chapter 2
ated with a vent-opening phase producing a short-duration, lithic-rich, and small plume,consistent with the low thickness of this unit.
Figure 1: Representative photographs of the Bellefontaine deposits in Martinique at sites a 141, b 185 andc 184 (see Figure 4 for outcrop location). The layer within the dotted lines corresponds to the stratigraphicmarker (so-called “ash hurricane”) discussed in the main text and belonging to the Balisier sequence. Thesmall photographs give a closer look at the deposits from the opening phase. All scale bars are 10 cm long.
Unit B: the main layer of the Bellefontaine sequence overlies Unit A and is referred asUnit B. It is a blanket of clast-supported, coarse white pumice with a grey sandy matrix(Figure 1) bearing a few grey pumices. Unit B contains dark juvenile and red alteredaccidental lithic fragments in a total amount of ⇡ 7 wt% at the base. At most sites, bothpumice and maximum lithic size increase slightly in the uppermost part of the unit.
In the downwind direction (to the south), Unit B has a maximum thickness of 180cm at 6.5 km from the crater, and steadily thins to 30 cm within 16 km of the vent. Inthe crosswind direction (East-West), Unit B is 180 cm thick in the most proximal sections(within 6.5 km from the vent), and thins to 45 cm within 8.4 km of the crater. Based onits characteristics, we identify Unit B as the main fall deposit of the eruption.
2.1.2 The Balisier sequence
We divide the Balisier deposits into three major units based on diagnostic sedimentary,stratigraphic and physical features. The sequence starts with a thick poorly-sorted pyro-clastic density current (PDC) deposit (Unit A) immediately overlain by a thinner layer offine-grained PDC deposit (Unit B), and the yellowish well-sorted ash layer mentionned inSection 2.1.1 as a strong stratigraphic marker (Unit C). We now describe in more detailthese three units.
Unit A: this thick layer is a greyish white relatively well-sorted deposit containing largeangular to sub-rounded coarse lapilli pumices and a few blocks of andesite floating in amatrix of ash particles (Figure 2a and b). Unit A is about 3.3 meters-thick at the centerof the valley, ⇡ 6.5 km from the source (location 200), while its thickness decreases on thehills (locations 202 and 203) where it reaches a maximum of 77 cm. The relatively limited
54
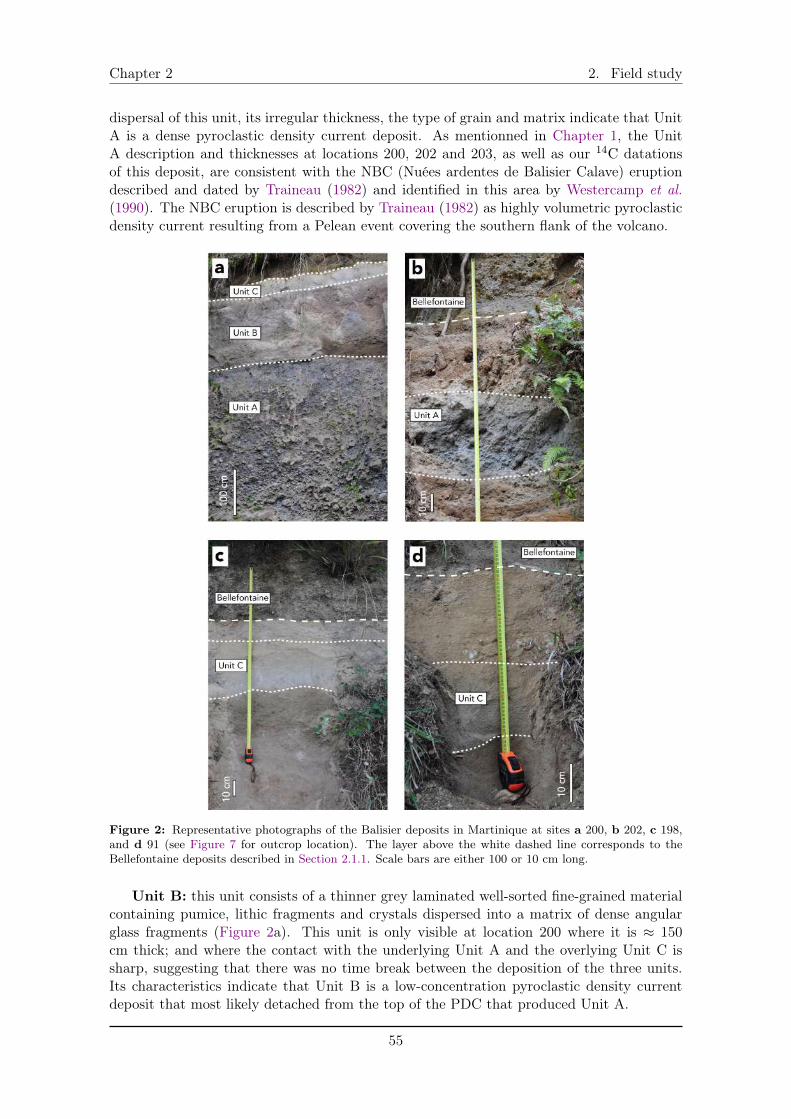
Chapter 2 2. Field study
dispersal of this unit, its irregular thickness, the type of grain and matrix indicate that UnitA is a dense pyroclastic density current deposit. As mentionned in Chapter 1, the UnitA description and thicknesses at locations 200, 202 and 203, as well as our 14
C datationsof this deposit, are consistent with the NBC (Nuées ardentes de Balisier Calave) eruptiondescribed and dated by Traineau (1982) and identified in this area by Westercamp et al.
(1990). The NBC eruption is described by Traineau (1982) as highly volumetric pyroclasticdensity current resulting from a Pelean event covering the southern flank of the volcano.
Figure 2: Representative photographs of the Balisier deposits in Martinique at sites a 200, b 202, c 198,and d 91 (see Figure 7 for outcrop location). The layer above the white dashed line corresponds to theBellefontaine deposits described in Section 2.1.1. Scale bars are either 100 or 10 cm long.
Unit B: this unit consists of a thinner grey laminated well-sorted fine-grained materialcontaining pumice, lithic fragments and crystals dispersed into a matrix of dense angularglass fragments (Figure 2a). This unit is only visible at location 200 where it is ⇡ 150cm thick; and where the contact with the underlying Unit A and the overlying Unit C issharp, suggesting that there was no time break between the deposition of the three units.Its characteristics indicate that Unit B is a low-concentration pyroclastic density currentdeposit that most likely detached from the top of the PDC that produced Unit A.
55
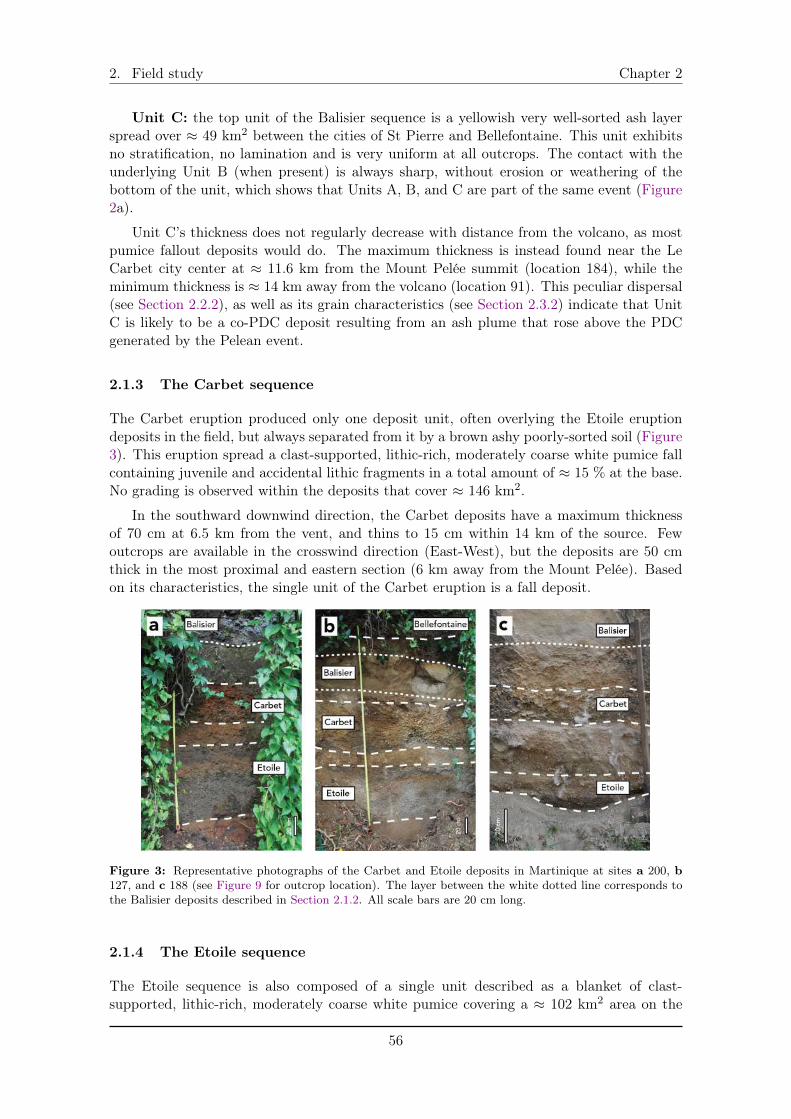
2. Field study Chapter 2
Unit C: the top unit of the Balisier sequence is a yellowish very well-sorted ash layerspread over ⇡ 49 km
2 between the cities of St Pierre and Bellefontaine. This unit exhibitsno stratification, no lamination and is very uniform at all outcrops. The contact with theunderlying Unit B (when present) is always sharp, without erosion or weathering of thebottom of the unit, which shows that Units A, B, and C are part of the same event (Figure2a).
Unit C’s thickness does not regularly decrease with distance from the volcano, as mostpumice fallout deposits would do. The maximum thickness is instead found near the LeCarbet city center at ⇡ 11.6 km from the Mount Pelée summit (location 184), while theminimum thickness is ⇡ 14 km away from the volcano (location 91). This peculiar dispersal(see Section 2.2.2), as well as its grain characteristics (see Section 2.3.2) indicate that UnitC is likely to be a co-PDC deposit resulting from an ash plume that rose above the PDCgenerated by the Pelean event.
2.1.3 The Carbet sequence
The Carbet eruption produced only one deposit unit, often overlying the Etoile eruptiondeposits in the field, but always separated from it by a brown ashy poorly-sorted soil (Figure3). This eruption spread a clast-supported, lithic-rich, moderately coarse white pumice fallcontaining juvenile and accidental lithic fragments in a total amount of ⇡ 15 % at the base.No grading is observed within the deposits that cover ⇡ 146 km
2.
In the southward downwind direction, the Carbet deposits have a maximum thicknessof 70 cm at 6.5 km from the vent, and thins to 15 cm within 14 km of the source. Fewoutcrops are available in the crosswind direction (East-West), but the deposits are 50 cmthick in the most proximal and eastern section (6 km away from the Mount Pelée). Basedon its characteristics, the single unit of the Carbet eruption is a fall deposit.
Figure 3: Representative photographs of the Carbet and Etoile deposits in Martinique at sites a 200, b
127, and c 188 (see Figure 9 for outcrop location). The layer between the white dotted line corresponds tothe Balisier deposits described in Section 2.1.2. All scale bars are 20 cm long.
2.1.4 The Etoile sequence
The Etoile sequence is also composed of a single unit described as a blanket of clast-supported, lithic-rich, moderately coarse white pumice covering a ⇡ 102 km
2 area on the
56
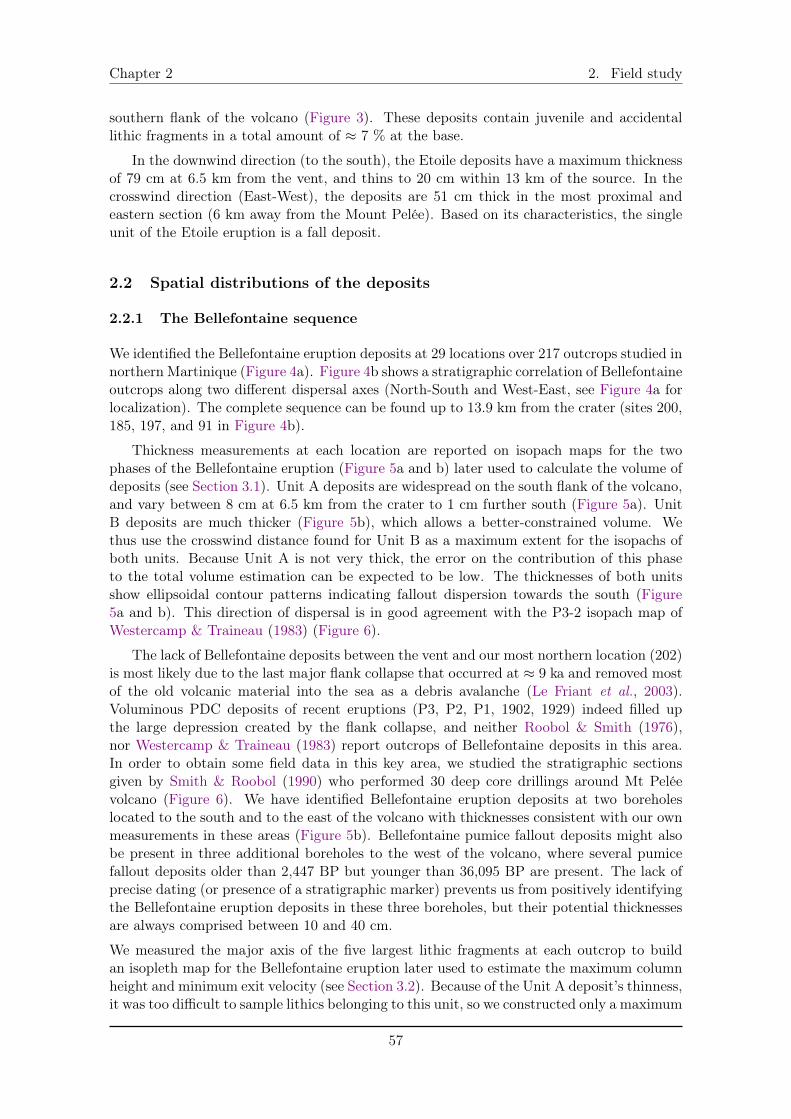
Chapter 2 2. Field study
southern flank of the volcano (Figure 3). These deposits contain juvenile and accidentallithic fragments in a total amount of ⇡ 7 % at the base.
In the downwind direction (to the south), the Etoile deposits have a maximum thicknessof 79 cm at 6.5 km from the vent, and thins to 20 cm within 13 km of the source. In thecrosswind direction (East-West), the deposits are 51 cm thick in the most proximal andeastern section (6 km away from the Mount Pelée). Based on its characteristics, the singleunit of the Etoile eruption is a fall deposit.
2.2 Spatial distributions of the deposits
2.2.1 The Bellefontaine sequence
We identified the Bellefontaine eruption deposits at 29 locations over 217 outcrops studied innorthern Martinique (Figure 4a). Figure 4b shows a stratigraphic correlation of Bellefontaineoutcrops along two different dispersal axes (North-South and West-East, see Figure 4a forlocalization). The complete sequence can be found up to 13.9 km from the crater (sites 200,185, 197, and 91 in Figure 4b).
Thickness measurements at each location are reported on isopach maps for the twophases of the Bellefontaine eruption (Figure 5a and b) later used to calculate the volume ofdeposits (see Section 3.1). Unit A deposits are widespread on the south flank of the volcano,and vary between 8 cm at 6.5 km from the crater to 1 cm further south (Figure 5a). UnitB deposits are much thicker (Figure 5b), which allows a better-constrained volume. Wethus use the crosswind distance found for Unit B as a maximum extent for the isopachs ofboth units. Because Unit A is not very thick, the error on the contribution of this phaseto the total volume estimation can be expected to be low. The thicknesses of both unitsshow ellipsoidal contour patterns indicating fallout dispersion towards the south (Figure5a and b). This direction of dispersal is in good agreement with the P3-2 isopach map ofWestercamp & Traineau (1983) (Figure 6).
The lack of Bellefontaine deposits between the vent and our most northern location (202)is most likely due to the last major flank collapse that occurred at ⇡ 9 ka and removed mostof the old volcanic material into the sea as a debris avalanche (Le Friant et al., 2003).Voluminous PDC deposits of recent eruptions (P3, P2, P1, 1902, 1929) indeed filled upthe large depression created by the flank collapse, and neither Roobol & Smith (1976),nor Westercamp & Traineau (1983) report outcrops of Bellefontaine deposits in this area.In order to obtain some field data in this key area, we studied the stratigraphic sectionsgiven by Smith & Roobol (1990) who performed 30 deep core drillings around Mt Peléevolcano (Figure 6). We have identified Bellefontaine eruption deposits at two boreholeslocated to the south and to the east of the volcano with thicknesses consistent with our ownmeasurements in these areas (Figure 5b). Bellefontaine pumice fallout deposits might alsobe present in three additional boreholes to the west of the volcano, where several pumicefallout deposits older than 2,447 BP but younger than 36,095 BP are present. The lack ofprecise dating (or presence of a stratigraphic marker) prevents us from positively identifyingthe Bellefontaine eruption deposits in these three boreholes, but their potential thicknessesare always comprised between 10 and 40 cm.
We measured the major axis of the five largest lithic fragments at each outcrop to buildan isopleth map for the Bellefontaine eruption later used to estimate the maximum columnheight and minimum exit velocity (see Section 3.2). Because of the Unit A deposit’s thinness,it was too difficult to sample lithics belonging to this unit, so we constructed only a maximum
57
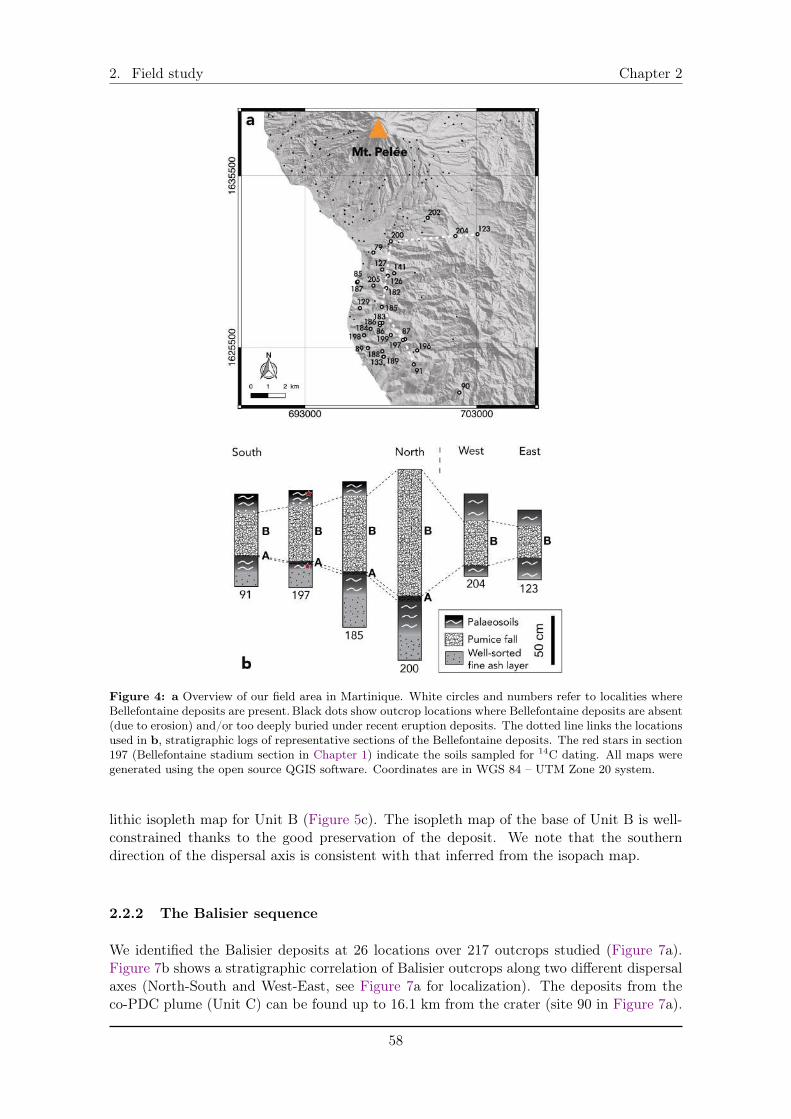
2. Field study Chapter 2
Figure 4: a Overview of our field area in Martinique. White circles and numbers refer to localities whereBellefontaine deposits are present. Black dots show outcrop locations where Bellefontaine deposits are absent(due to erosion) and/or too deeply buried under recent eruption deposits. The dotted line links the locationsused in b, stratigraphic logs of representative sections of the Bellefontaine deposits. The red stars in section197 (Bellefontaine stadium section in Chapter 1) indicate the soils sampled for 14C dating. All maps weregenerated using the open source QGIS software. Coordinates are in WGS 84 – UTM Zone 20 system.
lithic isopleth map for Unit B (Figure 5c). The isopleth map of the base of Unit B is well-constrained thanks to the good preservation of the deposit. We note that the southerndirection of the dispersal axis is consistent with that inferred from the isopach map.
2.2.2 The Balisier sequence
We identified the Balisier deposits at 26 locations over 217 outcrops studied (Figure 7a).Figure 7b shows a stratigraphic correlation of Balisier outcrops along two different dispersalaxes (North-South and West-East, see Figure 7a for localization). The deposits from theco-PDC plume (Unit C) can be found up to 16.1 km from the crater (site 90 in Figure 7a).
58
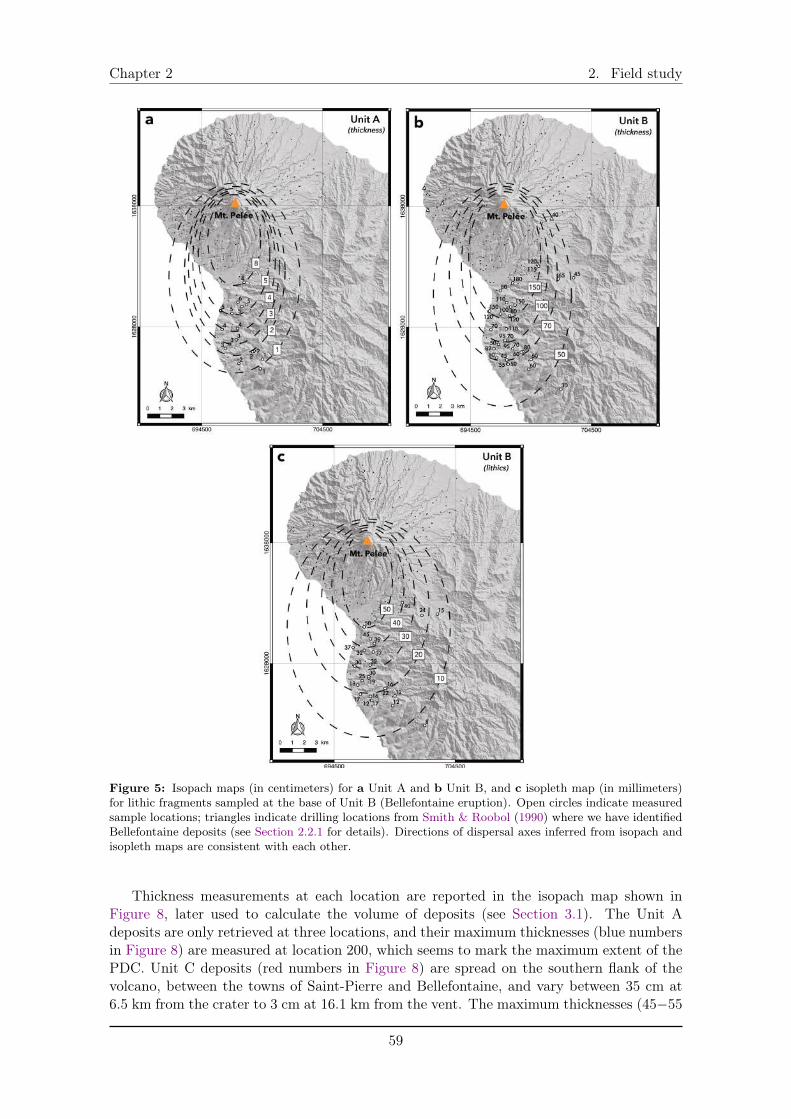
Chapter 2 2. Field study
Figure 5: Isopach maps (in centimeters) for a Unit A and b Unit B, and c isopleth map (in millimeters)for lithic fragments sampled at the base of Unit B (Bellefontaine eruption). Open circles indicate measuredsample locations; triangles indicate drilling locations from Smith & Roobol (1990) where we have identifiedBellefontaine deposits (see Section 2.2.1 for details). Directions of dispersal axes inferred from isopach andisopleth maps are consistent with each other.
Thickness measurements at each location are reported in the isopach map shown inFigure 8, later used to calculate the volume of deposits (see Section 3.1). The Unit Adeposits are only retrieved at three locations, and their maximum thicknesses (blue numbersin Figure 8) are measured at location 200, which seems to mark the maximum extent of thePDC. Unit C deposits (red numbers in Figure 8) are spread on the southern flank of thevolcano, between the towns of Saint-Pierre and Bellefontaine, and vary between 35 cm at6.5 km from the crater to 3 cm at 16.1 km from the vent. The maximum thicknesses (45�55
59
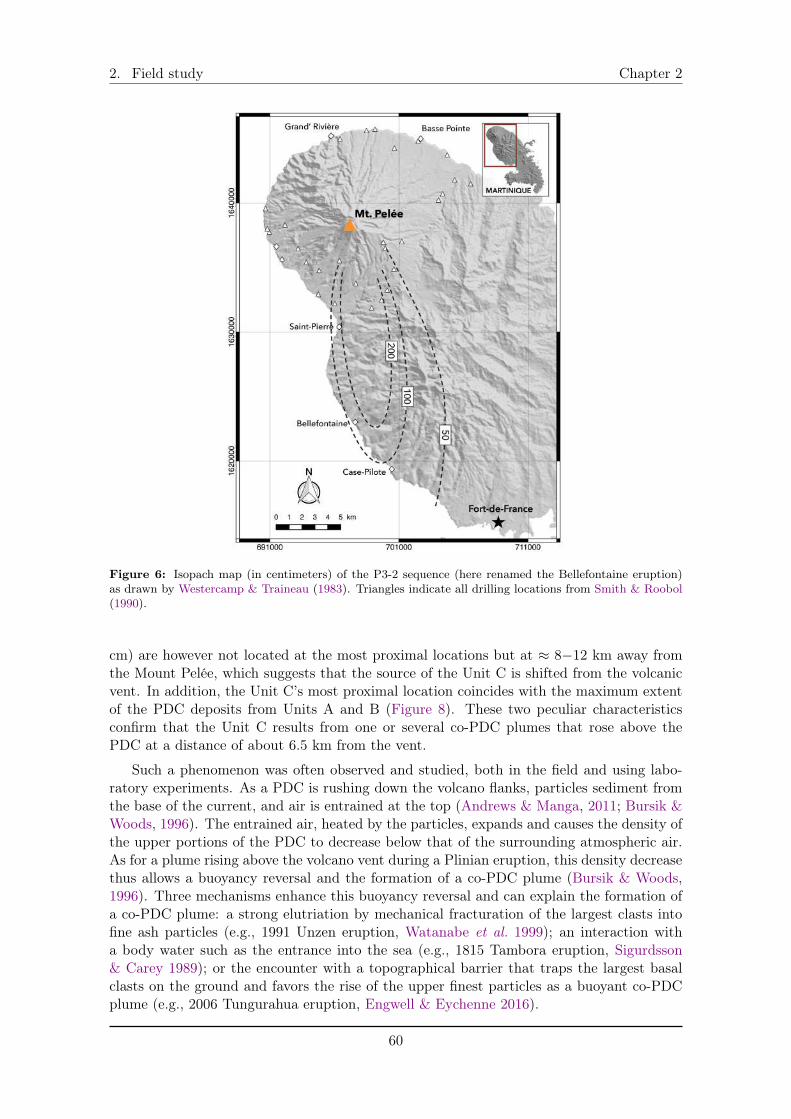
2. Field study Chapter 2
Figure 6: Isopach map (in centimeters) of the P3-2 sequence (here renamed the Bellefontaine eruption)as drawn by Westercamp & Traineau (1983). Triangles indicate all drilling locations from Smith & Roobol(1990).
cm) are however not located at the most proximal locations but at ⇡ 8�12 km away fromthe Mount Pelée, which suggests that the source of the Unit C is shifted from the volcanicvent. In addition, the Unit C’s most proximal location coincides with the maximum extentof the PDC deposits from Units A and B (Figure 8). These two peculiar characteristicsconfirm that the Unit C results from one or several co-PDC plumes that rose above thePDC at a distance of about 6.5 km from the vent.
Such a phenomenon was often observed and studied, both in the field and using labo-ratory experiments. As a PDC is rushing down the volcano flanks, particles sediment fromthe base of the current, and air is entrained at the top (Andrews & Manga, 2011; Bursik &Woods, 1996). The entrained air, heated by the particles, expands and causes the density ofthe upper portions of the PDC to decrease below that of the surrounding atmospheric air.As for a plume rising above the volcano vent during a Plinian eruption, this density decreasethus allows a buoyancy reversal and the formation of a co-PDC plume (Bursik & Woods,1996). Three mechanisms enhance this buoyancy reversal and can explain the formation ofa co-PDC plume: a strong elutriation by mechanical fracturation of the largest clasts intofine ash particles (e.g., 1991 Unzen eruption, Watanabe et al. 1999); an interaction witha body water such as the entrance into the sea (e.g., 1815 Tambora eruption, Sigurdsson& Carey 1989); or the encounter with a topographical barrier that traps the largest basalclasts on the ground and favors the rise of the upper finest particles as a buoyant co-PDCplume (e.g., 2006 Tungurahua eruption, Engwell & Eychenne 2016).
60
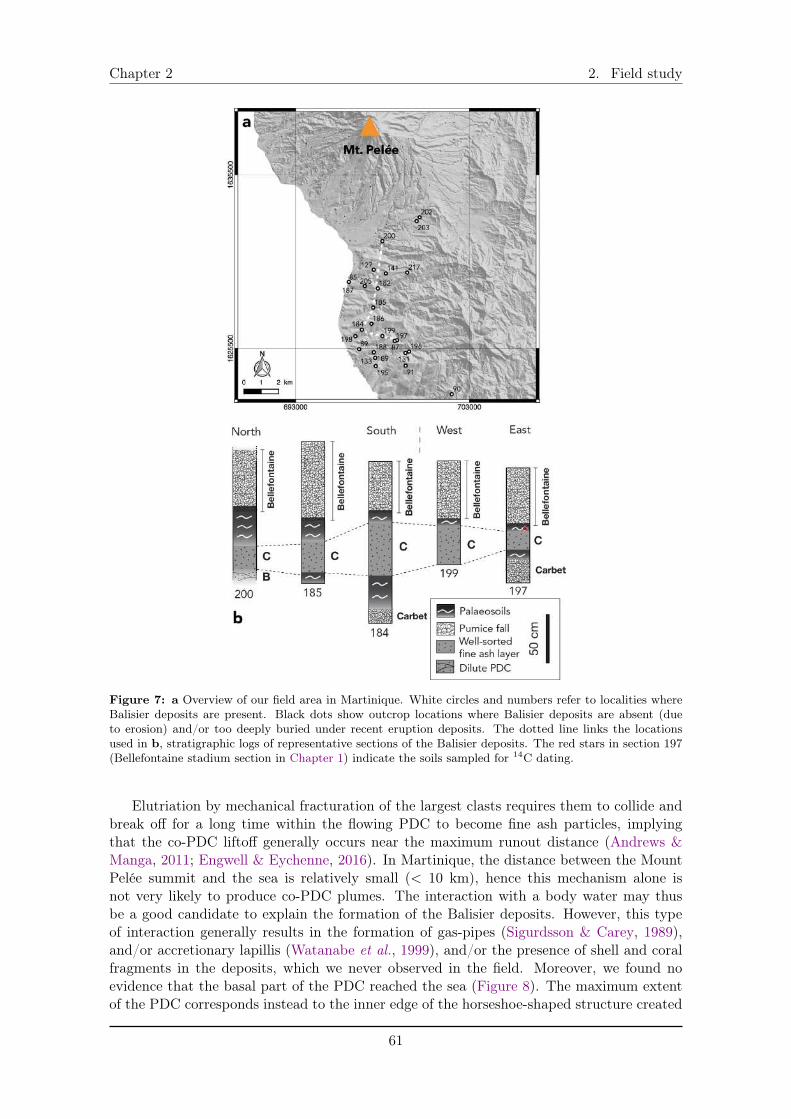
Chapter 2 2. Field study
Figure 7: a Overview of our field area in Martinique. White circles and numbers refer to localities whereBalisier deposits are present. Black dots show outcrop locations where Balisier deposits are absent (dueto erosion) and/or too deeply buried under recent eruption deposits. The dotted line links the locationsused in b, stratigraphic logs of representative sections of the Balisier deposits. The red stars in section 197(Bellefontaine stadium section in Chapter 1) indicate the soils sampled for 14C dating.
Elutriation by mechanical fracturation of the largest clasts requires them to collide andbreak off for a long time within the flowing PDC to become fine ash particles, implyingthat the co-PDC liftoff generally occurs near the maximum runout distance (Andrews &Manga, 2011; Engwell & Eychenne, 2016). In Martinique, the distance between the MountPelée summit and the sea is relatively small (< 10 km), hence this mechanism alone isnot very likely to produce co-PDC plumes. The interaction with a body water may thusbe a good candidate to explain the formation of the Balisier deposits. However, this typeof interaction generally results in the formation of gas-pipes (Sigurdsson & Carey, 1989),and/or accretionary lapillis (Watanabe et al., 1999), and/or the presence of shell and coralfragments in the deposits, which we never observed in the field. Moreover, we found noevidence that the basal part of the PDC reached the sea (Figure 8). The maximum extentof the PDC corresponds instead to the inner edge of the horseshoe-shaped structure created
61
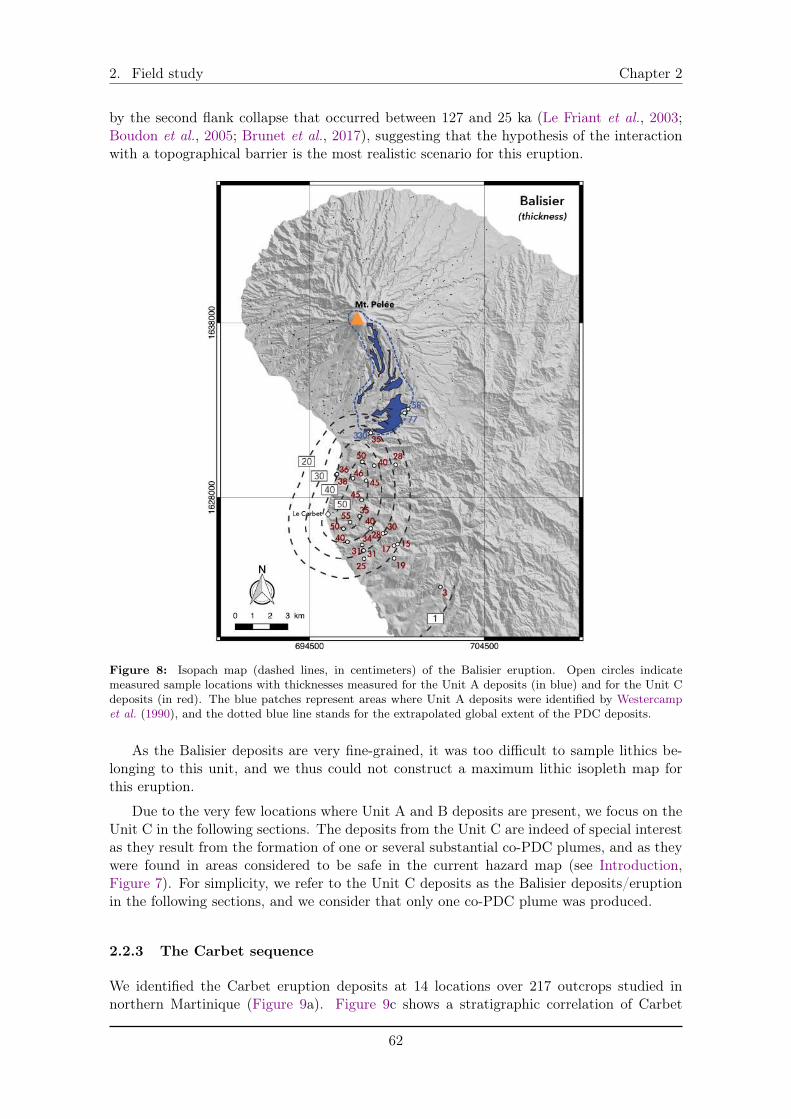
2. Field study Chapter 2
by the second flank collapse that occurred between 127 and 25 ka (Le Friant et al., 2003;Boudon et al., 2005; Brunet et al., 2017), suggesting that the hypothesis of the interactionwith a topographical barrier is the most realistic scenario for this eruption.
Figure 8: Isopach map (dashed lines, in centimeters) of the Balisier eruption. Open circles indicatemeasured sample locations with thicknesses measured for the Unit A deposits (in blue) and for the Unit Cdeposits (in red). The blue patches represent areas where Unit A deposits were identified by Westercampet al. (1990), and the dotted blue line stands for the extrapolated global extent of the PDC deposits.
As the Balisier deposits are very fine-grained, it was too difficult to sample lithics be-longing to this unit, and we thus could not construct a maximum lithic isopleth map forthis eruption.
Due to the very few locations where Unit A and B deposits are present, we focus on theUnit C in the following sections. The deposits from the Unit C are indeed of special interestas they result from the formation of one or several substantial co-PDC plumes, and as theywere found in areas considered to be safe in the current hazard map (see Introduction,Figure 7). For simplicity, we refer to the Unit C deposits as the Balisier deposits/eruptionin the following sections, and we consider that only one co-PDC plume was produced.
2.2.3 The Carbet sequence
We identified the Carbet eruption deposits at 14 locations over 217 outcrops studied innorthern Martinique (Figure 9a). Figure 9c shows a stratigraphic correlation of Carbet
62
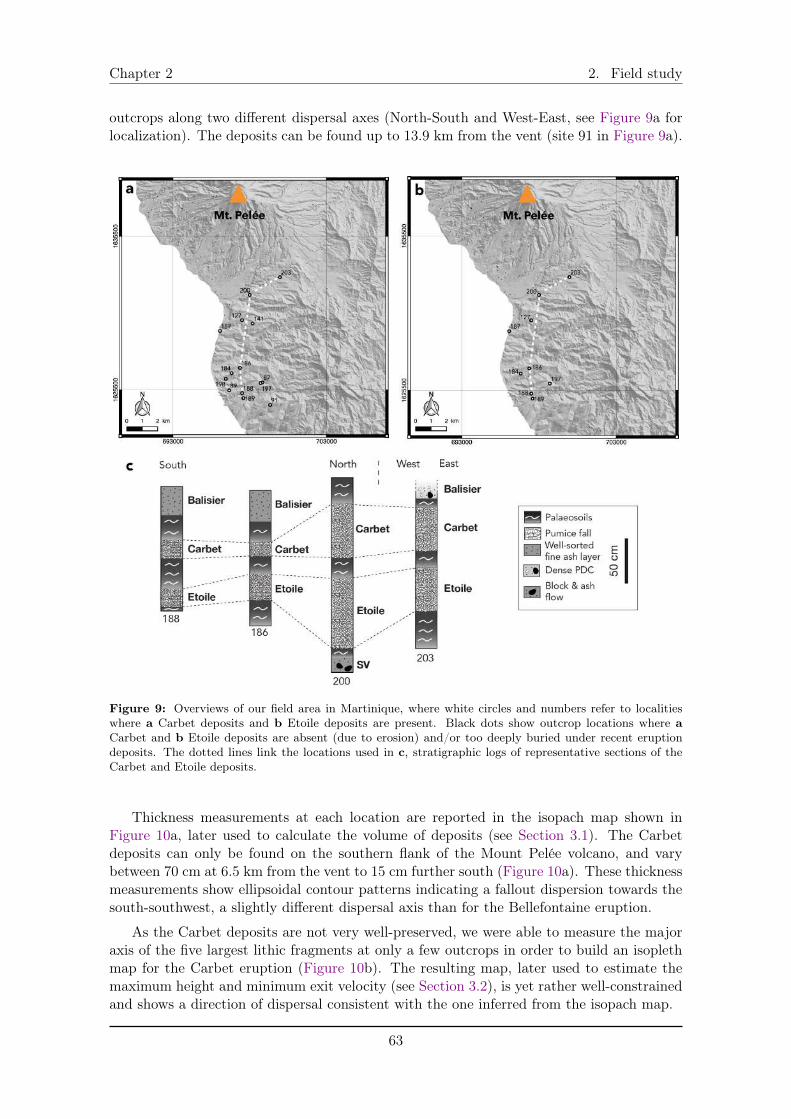
Chapter 2 2. Field study
outcrops along two different dispersal axes (North-South and West-East, see Figure 9a forlocalization). The deposits can be found up to 13.9 km from the vent (site 91 in Figure 9a).
Figure 9: Overviews of our field area in Martinique, where white circles and numbers refer to localitieswhere a Carbet deposits and b Etoile deposits are present. Black dots show outcrop locations where a
Carbet and b Etoile deposits are absent (due to erosion) and/or too deeply buried under recent eruptiondeposits. The dotted lines link the locations used in c, stratigraphic logs of representative sections of theCarbet and Etoile deposits.
Thickness measurements at each location are reported in the isopach map shown inFigure 10a, later used to calculate the volume of deposits (see Section 3.1). The Carbetdeposits can only be found on the southern flank of the Mount Pelée volcano, and varybetween 70 cm at 6.5 km from the vent to 15 cm further south (Figure 10a). These thicknessmeasurements show ellipsoidal contour patterns indicating a fallout dispersion towards thesouth-southwest, a slightly different dispersal axis than for the Bellefontaine eruption.
As the Carbet deposits are not very well-preserved, we were able to measure the majoraxis of the five largest lithic fragments at only a few outcrops in order to build an isoplethmap for the Carbet eruption (Figure 10b). The resulting map, later used to estimate themaximum height and minimum exit velocity (see Section 3.2), is yet rather well-constrainedand shows a direction of dispersal consistent with the one inferred from the isopach map.
63
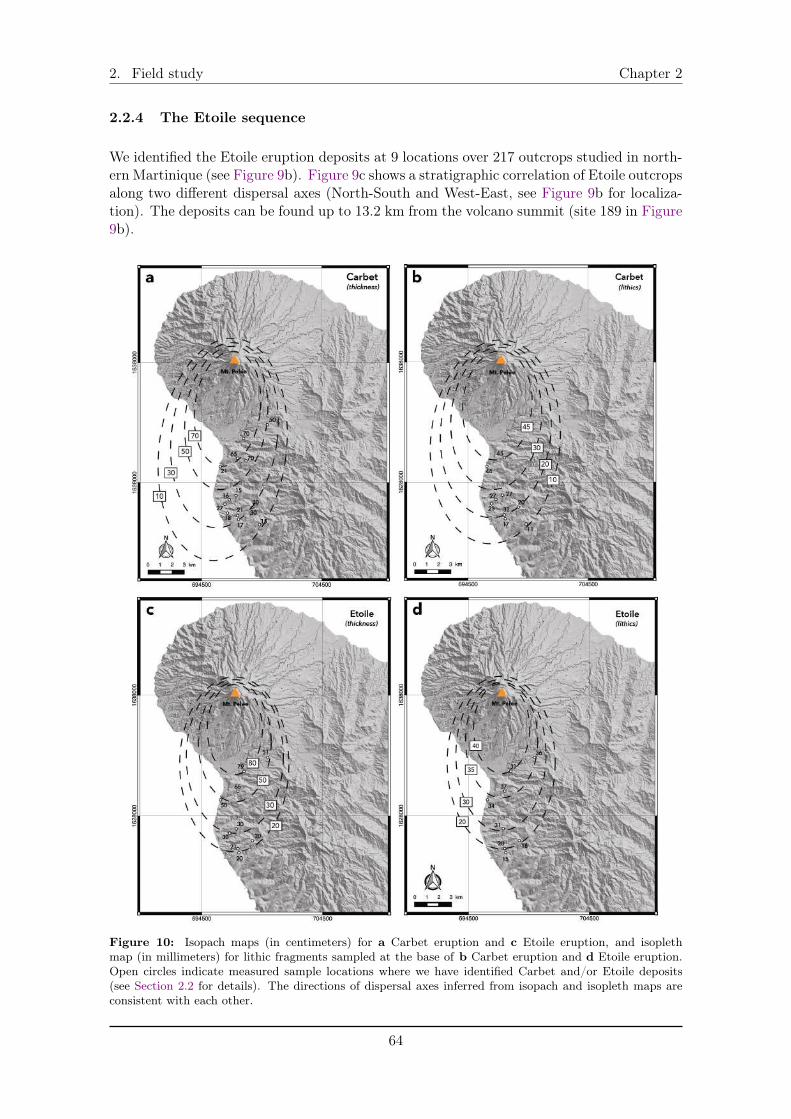
2. Field study Chapter 2
2.2.4 The Etoile sequence
We identified the Etoile eruption deposits at 9 locations over 217 outcrops studied in north-ern Martinique (see Figure 9b). Figure 9c shows a stratigraphic correlation of Etoile outcropsalong two different dispersal axes (North-South and West-East, see Figure 9b for localiza-tion). The deposits can be found up to 13.2 km from the volcano summit (site 189 in Figure9b).
Figure 10: Isopach maps (in centimeters) for a Carbet eruption and c Etoile eruption, and isoplethmap (in millimeters) for lithic fragments sampled at the base of b Carbet eruption and d Etoile eruption.Open circles indicate measured sample locations where we have identified Carbet and/or Etoile deposits(see Section 2.2 for details). The directions of dispersal axes inferred from isopach and isopleth maps areconsistent with each other.
64
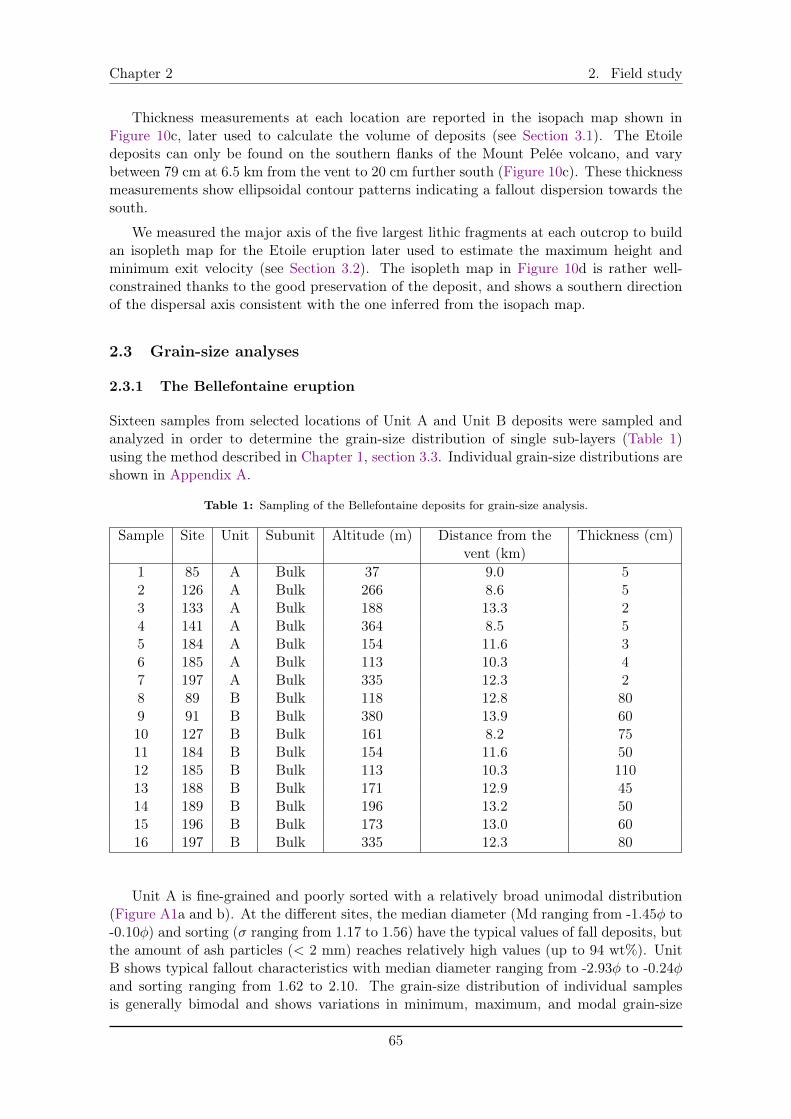
Chapter 2 2. Field study
Thickness measurements at each location are reported in the isopach map shown inFigure 10c, later used to calculate the volume of deposits (see Section 3.1). The Etoiledeposits can only be found on the southern flanks of the Mount Pelée volcano, and varybetween 79 cm at 6.5 km from the vent to 20 cm further south (Figure 10c). These thicknessmeasurements show ellipsoidal contour patterns indicating a fallout dispersion towards thesouth.
We measured the major axis of the five largest lithic fragments at each outcrop to buildan isopleth map for the Etoile eruption later used to estimate the maximum height andminimum exit velocity (see Section 3.2). The isopleth map in Figure 10d is rather well-constrained thanks to the good preservation of the deposit, and shows a southern directionof the dispersal axis consistent with the one inferred from the isopach map.
2.3 Grain-size analyses
2.3.1 The Bellefontaine eruption
Sixteen samples from selected locations of Unit A and Unit B deposits were sampled andanalyzed in order to determine the grain-size distribution of single sub-layers (Table 1)using the method described in Chapter 1, section 3.3. Individual grain-size distributions areshown in Appendix A.
Table 1: Sampling of the Bellefontaine deposits for grain-size analysis.
Sample Site Unit Subunit Altitude (m) Distance from the Thickness (cm)vent (km)
1 85 A Bulk 37 9.0 52 126 A Bulk 266 8.6 53 133 A Bulk 188 13.3 24 141 A Bulk 364 8.5 55 184 A Bulk 154 11.6 36 185 A Bulk 113 10.3 47 197 A Bulk 335 12.3 28 89 B Bulk 118 12.8 809 91 B Bulk 380 13.9 6010 127 B Bulk 161 8.2 7511 184 B Bulk 154 11.6 5012 185 B Bulk 113 10.3 11013 188 B Bulk 171 12.9 4514 189 B Bulk 196 13.2 5015 196 B Bulk 173 13.0 6016 197 B Bulk 335 12.3 80
Unit A is fine-grained and poorly sorted with a relatively broad unimodal distribution(Figure A1a and b). At the different sites, the median diameter (Md ranging from -1.45� to-0.10�) and sorting (� ranging from 1.17 to 1.56) have the typical values of fall deposits, butthe amount of ash particles (< 2 mm) reaches relatively high values (up to 94 wt%). UnitB shows typical fallout characteristics with median diameter ranging from -2.93� to -0.24�and sorting ranging from 1.62 to 2.10. The grain-size distribution of individual samplesis generally bimodal and shows variations in minimum, maximum, and modal grain-size
65
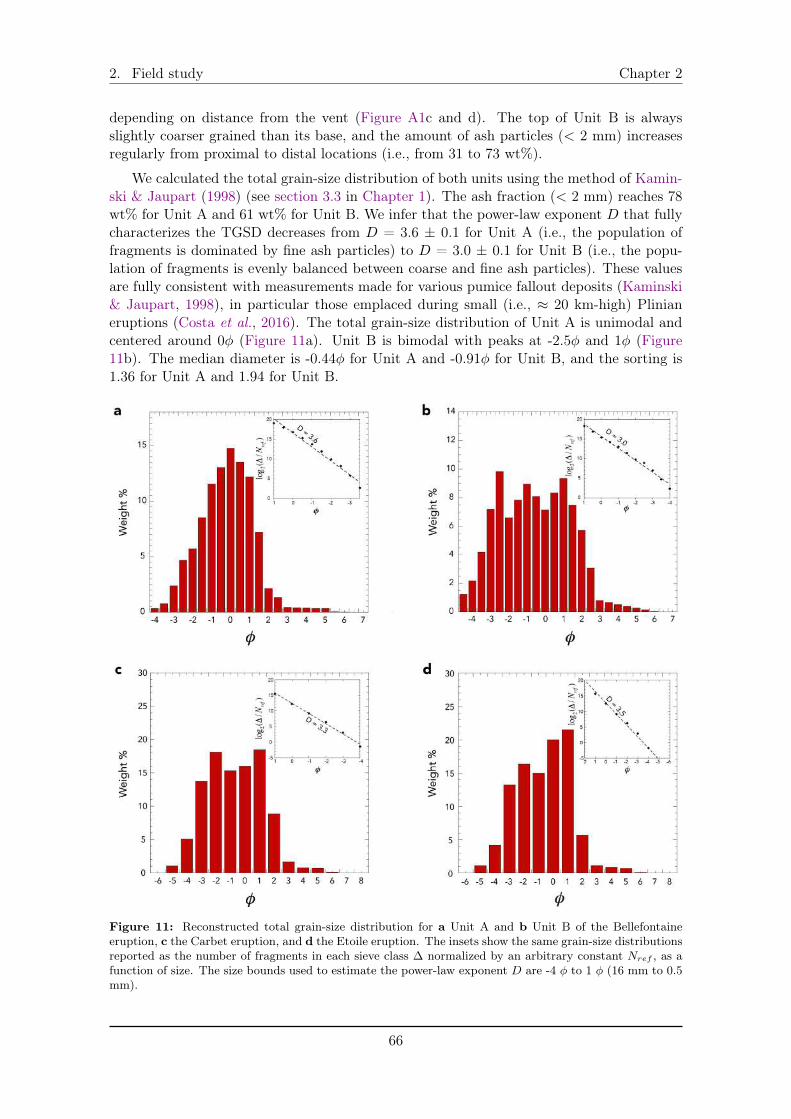
2. Field study Chapter 2
depending on distance from the vent (Figure A1c and d). The top of Unit B is alwaysslightly coarser grained than its base, and the amount of ash particles (< 2 mm) increasesregularly from proximal to distal locations (i.e., from 31 to 73 wt%).
We calculated the total grain-size distribution of both units using the method of Kamin-ski & Jaupart (1998) (see section 3.3 in Chapter 1). The ash fraction (< 2 mm) reaches 78wt% for Unit A and 61 wt% for Unit B. We infer that the power-law exponent D that fullycharacterizes the TGSD decreases from D = 3.6 ± 0.1 for Unit A (i.e., the population offragments is dominated by fine ash particles) to D = 3.0 ± 0.1 for Unit B (i.e., the popu-lation of fragments is evenly balanced between coarse and fine ash particles). These valuesare fully consistent with measurements made for various pumice fallout deposits (Kaminski& Jaupart, 1998), in particular those emplaced during small (i.e., ⇡ 20 km-high) Plinianeruptions (Costa et al., 2016). The total grain-size distribution of Unit A is unimodal andcentered around 0� (Figure 11a). Unit B is bimodal with peaks at -2.5� and 1� (Figure11b). The median diameter is -0.44� for Unit A and -0.91� for Unit B, and the sorting is1.36 for Unit A and 1.94 for Unit B.
Figure 11: Reconstructed total grain-size distribution for a Unit A and b Unit B of the Bellefontaineeruption, c the Carbet eruption, and d the Etoile eruption. The insets show the same grain-size distributionsreported as the number of fragments in each sieve class � normalized by an arbitrary constant N
ref
, as afunction of size. The size bounds used to estimate the power-law exponent D are -4 � to 1 � (16 mm to 0.5mm).
66
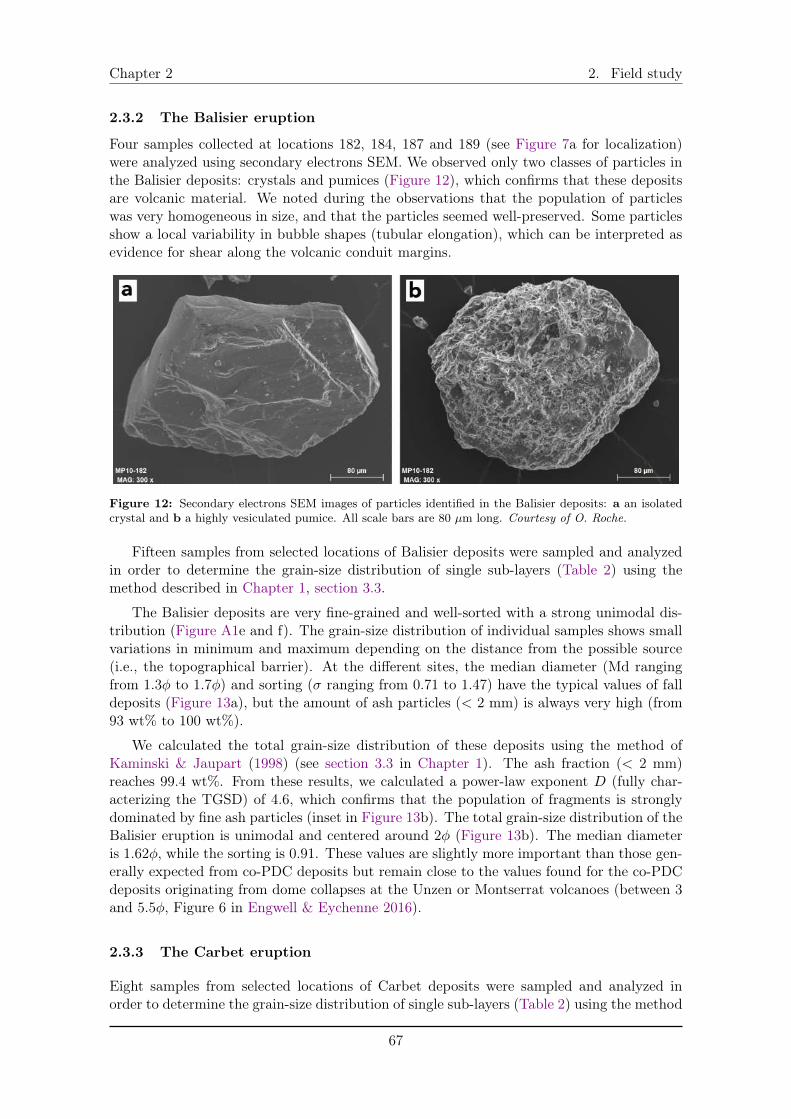
Chapter 2 2. Field study
2.3.2 The Balisier eruption
Four samples collected at locations 182, 184, 187 and 189 (see Figure 7a for localization)were analyzed using secondary electrons SEM. We observed only two classes of particles inthe Balisier deposits: crystals and pumices (Figure 12), which confirms that these depositsare volcanic material. We noted during the observations that the population of particleswas very homogeneous in size, and that the particles seemed well-preserved. Some particlesshow a local variability in bubble shapes (tubular elongation), which can be interpreted asevidence for shear along the volcanic conduit margins.
Figure 12: Secondary electrons SEM images of particles identified in the Balisier deposits: a an isolatedcrystal and b a highly vesiculated pumice. All scale bars are 80 µm long. Courtesy of O. Roche.
Fifteen samples from selected locations of Balisier deposits were sampled and analyzedin order to determine the grain-size distribution of single sub-layers (Table 2) using themethod described in Chapter 1, section 3.3.
The Balisier deposits are very fine-grained and well-sorted with a strong unimodal dis-tribution (Figure A1e and f). The grain-size distribution of individual samples shows smallvariations in minimum and maximum depending on the distance from the possible source(i.e., the topographical barrier). At the different sites, the median diameter (Md rangingfrom 1.3� to 1.7�) and sorting (� ranging from 0.71 to 1.47) have the typical values of falldeposits (Figure 13a), but the amount of ash particles (< 2 mm) is always very high (from93 wt% to 100 wt%).
We calculated the total grain-size distribution of these deposits using the method ofKaminski & Jaupart (1998) (see section 3.3 in Chapter 1). The ash fraction (< 2 mm)reaches 99.4 wt%. From these results, we calculated a power-law exponent D (fully char-acterizing the TGSD) of 4.6, which confirms that the population of fragments is stronglydominated by fine ash particles (inset in Figure 13b). The total grain-size distribution of theBalisier eruption is unimodal and centered around 2� (Figure 13b). The median diameteris 1.62�, while the sorting is 0.91. These values are slightly more important than those gen-erally expected from co-PDC deposits but remain close to the values found for the co-PDCdeposits originating from dome collapses at the Unzen or Montserrat volcanoes (between 3and 5.5�, Figure 6 in Engwell & Eychenne 2016).
2.3.3 The Carbet eruption
Eight samples from selected locations of Carbet deposits were sampled and analyzed inorder to determine the grain-size distribution of single sub-layers (Table 2) using the method
67
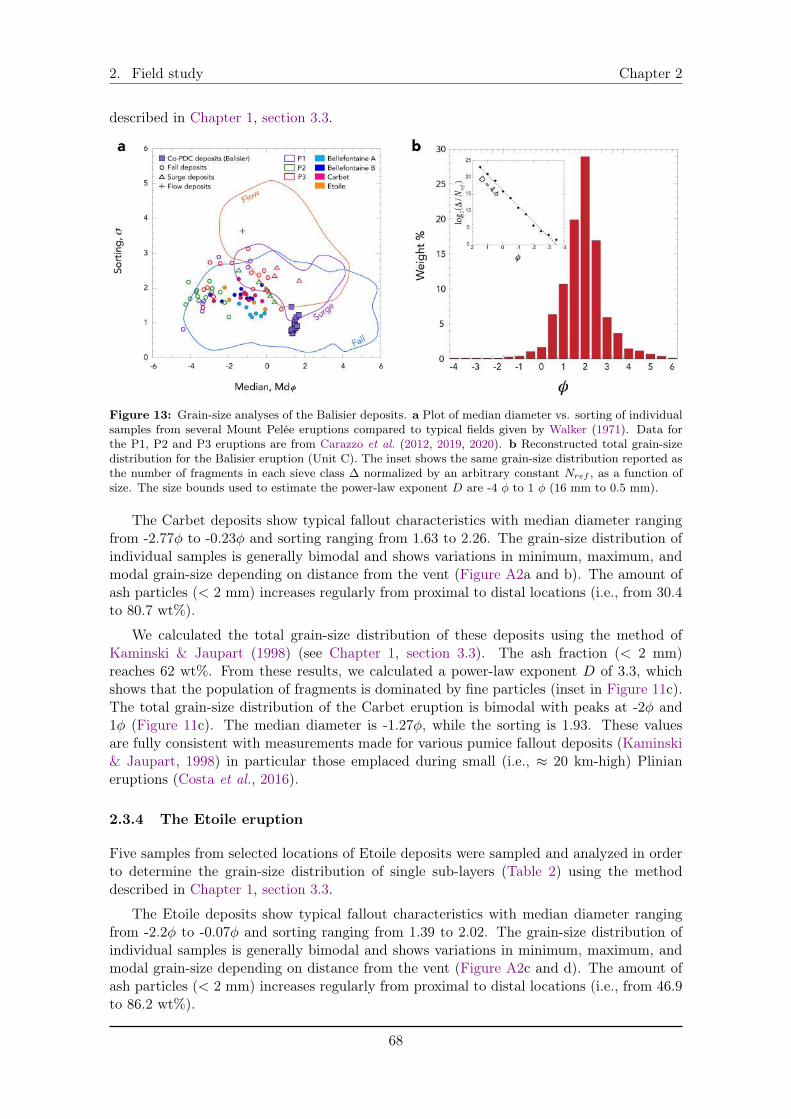
2. Field study Chapter 2
described in Chapter 1, section 3.3.
Figure 13: Grain-size analyses of the Balisier deposits. a Plot of median diameter vs. sorting of individualsamples from several Mount Pelée eruptions compared to typical fields given by Walker (1971). Data forthe P1, P2 and P3 eruptions are from Carazzo et al. (2012, 2019, 2020). b Reconstructed total grain-sizedistribution for the Balisier eruption (Unit C). The inset shows the same grain-size distribution reported asthe number of fragments in each sieve class � normalized by an arbitrary constant N
ref
, as a function ofsize. The size bounds used to estimate the power-law exponent D are -4 � to 1 � (16 mm to 0.5 mm).
The Carbet deposits show typical fallout characteristics with median diameter rangingfrom -2.77� to -0.23� and sorting ranging from 1.63 to 2.26. The grain-size distribution ofindividual samples is generally bimodal and shows variations in minimum, maximum, andmodal grain-size depending on distance from the vent (Figure A2a and b). The amount ofash particles (< 2 mm) increases regularly from proximal to distal locations (i.e., from 30.4to 80.7 wt%).
We calculated the total grain-size distribution of these deposits using the method ofKaminski & Jaupart (1998) (see Chapter 1, section 3.3). The ash fraction (< 2 mm)reaches 62 wt%. From these results, we calculated a power-law exponent D of 3.3, whichshows that the population of fragments is dominated by fine particles (inset in Figure 11c).The total grain-size distribution of the Carbet eruption is bimodal with peaks at -2� and1� (Figure 11c). The median diameter is -1.27�, while the sorting is 1.93. These valuesare fully consistent with measurements made for various pumice fallout deposits (Kaminski& Jaupart, 1998) in particular those emplaced during small (i.e., ⇡ 20 km-high) Plinianeruptions (Costa et al., 2016).
2.3.4 The Etoile eruption
Five samples from selected locations of Etoile deposits were sampled and analyzed in orderto determine the grain-size distribution of single sub-layers (Table 2) using the methoddescribed in Chapter 1, section 3.3.
The Etoile deposits show typical fallout characteristics with median diameter rangingfrom -2.2� to -0.07� and sorting ranging from 1.39 to 2.02. The grain-size distribution ofindividual samples is generally bimodal and shows variations in minimum, maximum, andmodal grain-size depending on distance from the vent (Figure A2c and d). The amount ofash particles (< 2 mm) increases regularly from proximal to distal locations (i.e., from 46.9to 86.2 wt%).
68
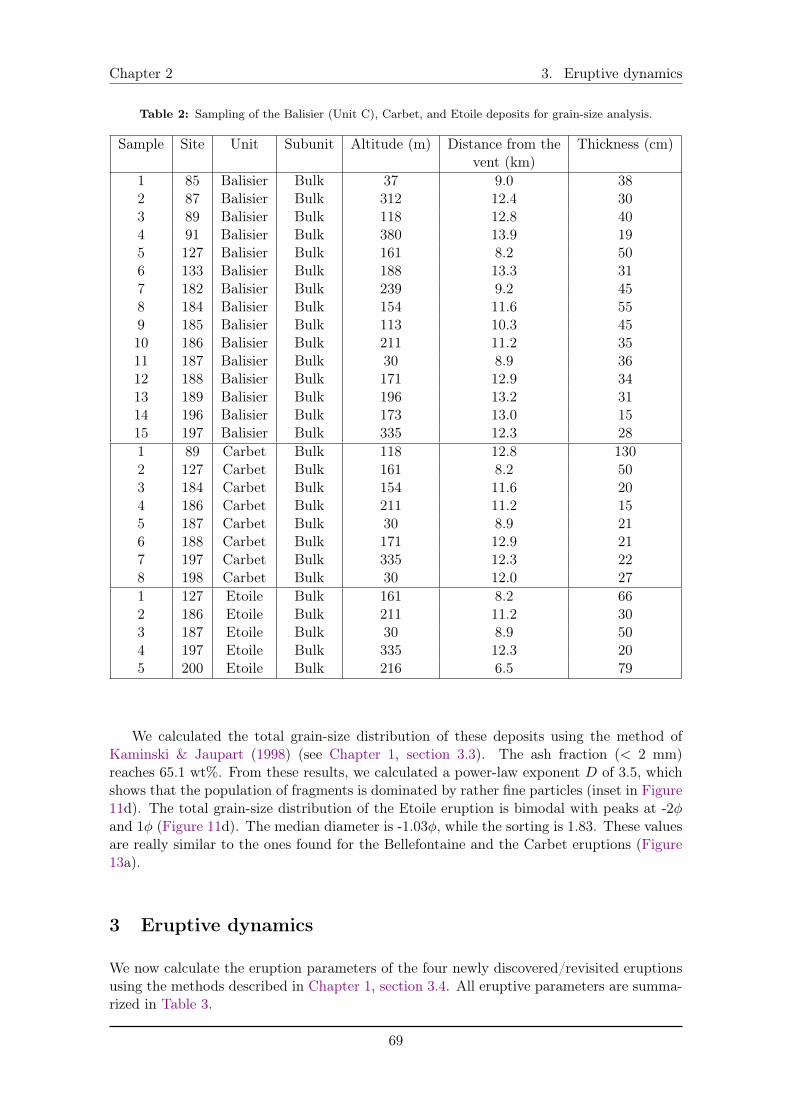
Chapter 2 3. Eruptive dynamics
Table 2: Sampling of the Balisier (Unit C), Carbet, and Etoile deposits for grain-size analysis.
Sample Site Unit Subunit Altitude (m) Distance from the Thickness (cm)vent (km)
1 85 Balisier Bulk 37 9.0 382 87 Balisier Bulk 312 12.4 303 89 Balisier Bulk 118 12.8 404 91 Balisier Bulk 380 13.9 195 127 Balisier Bulk 161 8.2 506 133 Balisier Bulk 188 13.3 317 182 Balisier Bulk 239 9.2 458 184 Balisier Bulk 154 11.6 559 185 Balisier Bulk 113 10.3 4510 186 Balisier Bulk 211 11.2 3511 187 Balisier Bulk 30 8.9 3612 188 Balisier Bulk 171 12.9 3413 189 Balisier Bulk 196 13.2 3114 196 Balisier Bulk 173 13.0 1515 197 Balisier Bulk 335 12.3 281 89 Carbet Bulk 118 12.8 1302 127 Carbet Bulk 161 8.2 503 184 Carbet Bulk 154 11.6 204 186 Carbet Bulk 211 11.2 155 187 Carbet Bulk 30 8.9 216 188 Carbet Bulk 171 12.9 217 197 Carbet Bulk 335 12.3 228 198 Carbet Bulk 30 12.0 271 127 Etoile Bulk 161 8.2 662 186 Etoile Bulk 211 11.2 303 187 Etoile Bulk 30 8.9 504 197 Etoile Bulk 335 12.3 205 200 Etoile Bulk 216 6.5 79
We calculated the total grain-size distribution of these deposits using the method ofKaminski & Jaupart (1998) (see Chapter 1, section 3.3). The ash fraction (< 2 mm)reaches 65.1 wt%. From these results, we calculated a power-law exponent D of 3.5, whichshows that the population of fragments is dominated by rather fine particles (inset in Figure11d). The total grain-size distribution of the Etoile eruption is bimodal with peaks at -2�and 1� (Figure 11d). The median diameter is -1.03�, while the sorting is 1.83. These valuesare really similar to the ones found for the Bellefontaine and the Carbet eruptions (Figure13a).
3 Eruptive dynamics
We now calculate the eruption parameters of the four newly discovered/revisited eruptionsusing the methods described in Chapter 1, section 3.4. All eruptive parameters are summa-rized in Table 3.
69
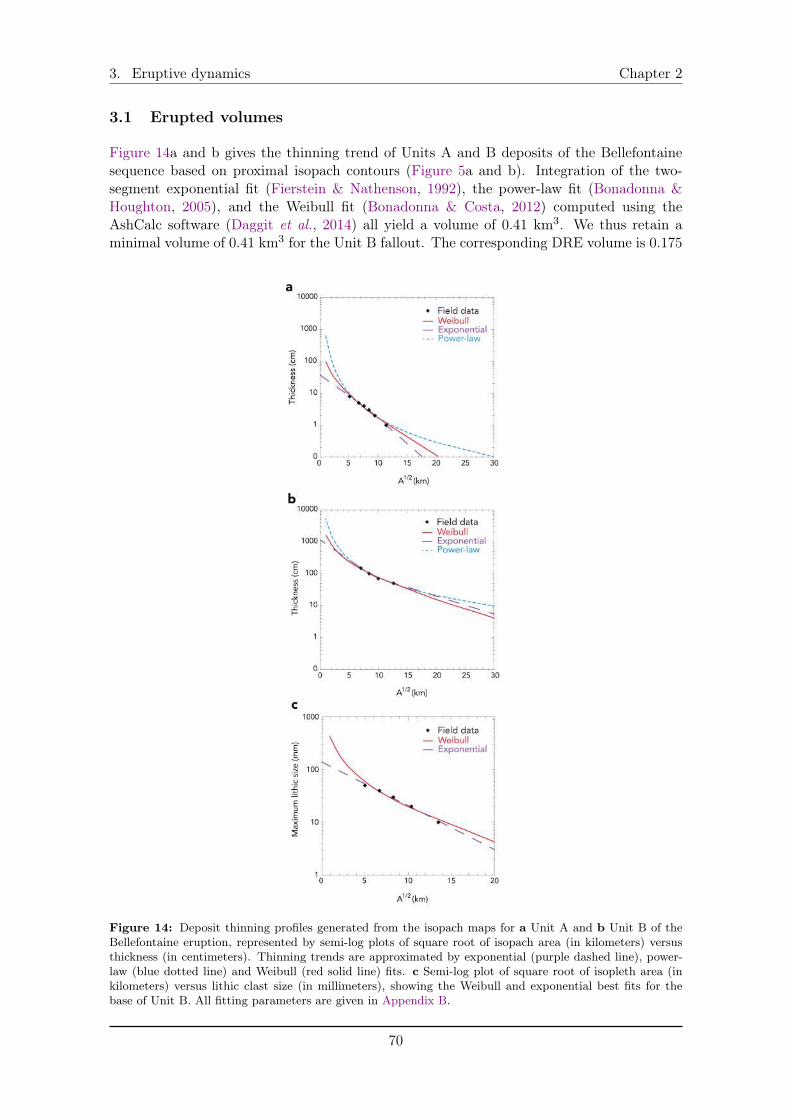
3. Eruptive dynamics Chapter 2
3.1 Erupted volumes
Figure 14a and b gives the thinning trend of Units A and B deposits of the Bellefontainesequence based on proximal isopach contours (Figure 5a and b). Integration of the two-segment exponential fit (Fierstein & Nathenson, 1992), the power-law fit (Bonadonna &Houghton, 2005), and the Weibull fit (Bonadonna & Costa, 2012) computed using theAshCalc software (Daggit et al., 2014) all yield a volume of 0.41 km
3. We thus retain aminimal volume of 0.41 km
3 for the Unit B fallout. The corresponding DRE volume is 0.175
Figure 14: Deposit thinning profiles generated from the isopach maps for a Unit A and b Unit B of theBellefontaine eruption, represented by semi-log plots of square root of isopach area (in kilometers) versusthickness (in centimeters). Thinning trends are approximated by exponential (purple dashed line), power-law (blue dotted line) and Weibull (red solid line) fits. c Semi-log plot of square root of isopleth area (inkilometers) versus lithic clast size (in millimeters), showing the Weibull and exponential best fits for thebase of Unit B. All fitting parameters are given in Appendix B.
70
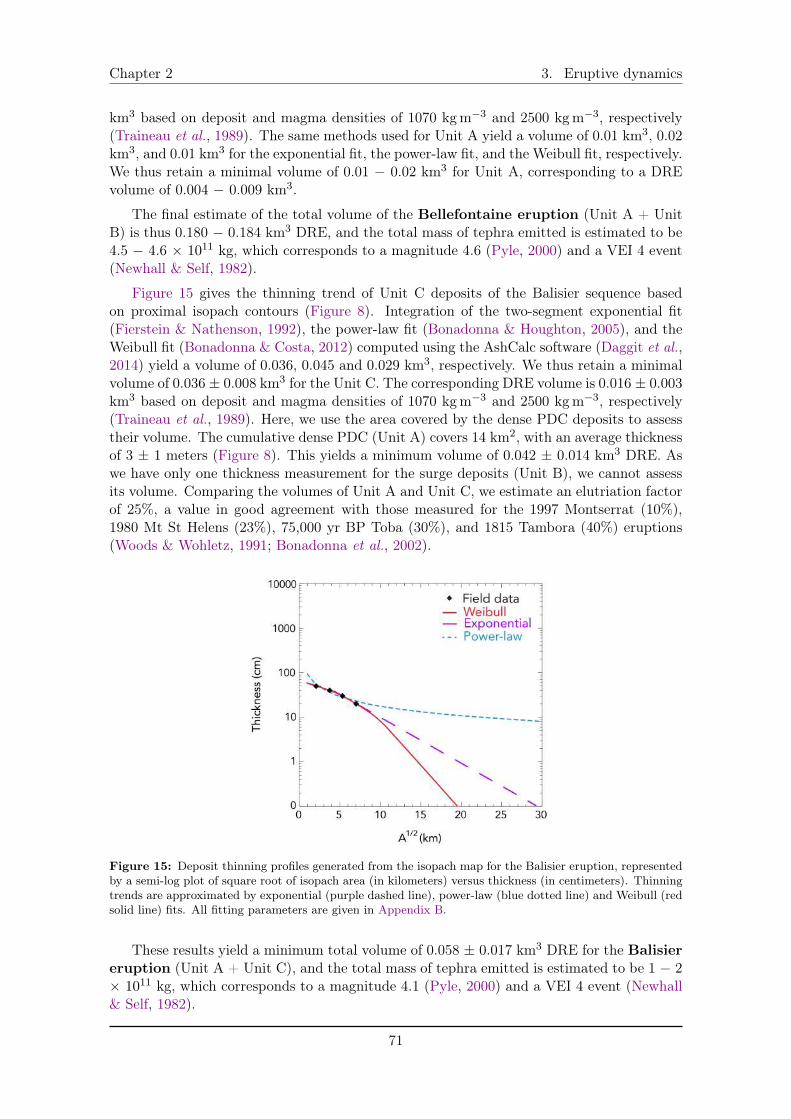
Chapter 2 3. Eruptive dynamics
km
3 based on deposit and magma densities of 1070 kgm
�3 and 2500 kgm
�3, respectively(Traineau et al., 1989). The same methods used for Unit A yield a volume of 0.01 km
3, 0.02km
3, and 0.01 km
3 for the exponential fit, the power-law fit, and the Weibull fit, respectively.We thus retain a minimal volume of 0.01 � 0.02 km
3 for Unit A, corresponding to a DREvolume of 0.004 � 0.009 km
3.
The final estimate of the total volume of the Bellefontaine eruption (Unit A + UnitB) is thus 0.180 � 0.184 km
3 DRE, and the total mass of tephra emitted is estimated to be4.5 � 4.6 ⇥ 10
11 kg, which corresponds to a magnitude 4.6 (Pyle, 2000) and a VEI 4 event(Newhall & Self, 1982).
Figure 15 gives the thinning trend of Unit C deposits of the Balisier sequence basedon proximal isopach contours (Figure 8). Integration of the two-segment exponential fit(Fierstein & Nathenson, 1992), the power-law fit (Bonadonna & Houghton, 2005), and theWeibull fit (Bonadonna & Costa, 2012) computed using the AshCalc software (Daggit et al.,2014) yield a volume of 0.036, 0.045 and 0.029 km
3, respectively. We thus retain a minimalvolume of 0.036 ± 0.008 km
3 for the Unit C. The corresponding DRE volume is 0.016 ± 0.003km
3 based on deposit and magma densities of 1070 kgm
�3 and 2500 kgm
�3, respectively(Traineau et al., 1989). Here, we use the area covered by the dense PDC deposits to assesstheir volume. The cumulative dense PDC (Unit A) covers 14 km
2, with an average thicknessof 3 ± 1 meters (Figure 8). This yields a minimum volume of 0.042 ± 0.014 km
3 DRE. Aswe have only one thickness measurement for the surge deposits (Unit B), we cannot assessits volume. Comparing the volumes of Unit A and Unit C, we estimate an elutriation factorof 25%, a value in good agreement with those measured for the 1997 Montserrat (10%),1980 Mt St Helens (23%), 75,000 yr BP Toba (30%), and 1815 Tambora (40%) eruptions(Woods & Wohletz, 1991; Bonadonna et al., 2002).
Figure 15: Deposit thinning profiles generated from the isopach map for the Balisier eruption, representedby a semi-log plot of square root of isopach area (in kilometers) versus thickness (in centimeters). Thinningtrends are approximated by exponential (purple dashed line), power-law (blue dotted line) and Weibull (redsolid line) fits. All fitting parameters are given in Appendix B.
These results yield a minimum total volume of 0.058 ± 0.017 km
3 DRE for the Balisiereruption (Unit A + Unit C), and the total mass of tephra emitted is estimated to be 1 � 2⇥ 10
11 kg, which corresponds to a magnitude 4.1 (Pyle, 2000) and a VEI 4 event (Newhall& Self, 1982).
71
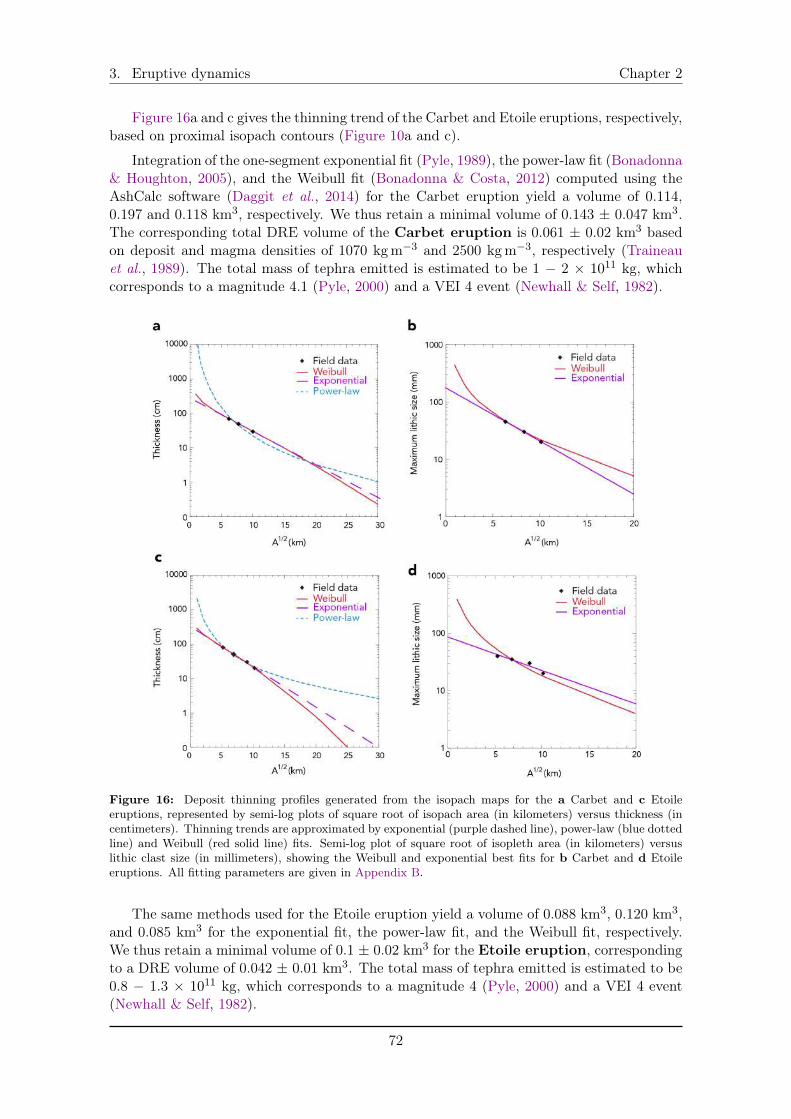
3. Eruptive dynamics Chapter 2
Figure 16a and c gives the thinning trend of the Carbet and Etoile eruptions, respectively,based on proximal isopach contours (Figure 10a and c).
Integration of the one-segment exponential fit (Pyle, 1989), the power-law fit (Bonadonna& Houghton, 2005), and the Weibull fit (Bonadonna & Costa, 2012) computed using theAshCalc software (Daggit et al., 2014) for the Carbet eruption yield a volume of 0.114,0.197 and 0.118 km
3, respectively. We thus retain a minimal volume of 0.143 ± 0.047 km
3.The corresponding total DRE volume of the Carbet eruption is 0.061 ± 0.02 km
3 basedon deposit and magma densities of 1070 kgm
�3 and 2500 kgm
�3, respectively (Traineauet al., 1989). The total mass of tephra emitted is estimated to be 1 � 2 ⇥ 10
11 kg, whichcorresponds to a magnitude 4.1 (Pyle, 2000) and a VEI 4 event (Newhall & Self, 1982).
Figure 16: Deposit thinning profiles generated from the isopach maps for the a Carbet and c Etoileeruptions, represented by semi-log plots of square root of isopach area (in kilometers) versus thickness (incentimeters). Thinning trends are approximated by exponential (purple dashed line), power-law (blue dottedline) and Weibull (red solid line) fits. Semi-log plot of square root of isopleth area (in kilometers) versuslithic clast size (in millimeters), showing the Weibull and exponential best fits for b Carbet and d Etoileeruptions. All fitting parameters are given in Appendix B.
The same methods used for the Etoile eruption yield a volume of 0.088 km
3, 0.120 km
3,and 0.085 km
3 for the exponential fit, the power-law fit, and the Weibull fit, respectively.We thus retain a minimal volume of 0.1 ± 0.02 km
3 for the Etoile eruption, correspondingto a DRE volume of 0.042 ± 0.01 km
3. The total mass of tephra emitted is estimated to be0.8 � 1.3 ⇥ 10
11 kg, which corresponds to a magnitude 4 (Pyle, 2000) and a VEI 4 event(Newhall & Self, 1982).
72
Chapter 2 3. Eruptive dynamics
3.2 Column heights and exit velocities
Bellefontaine eruption: we use the model of Carey & Sparks (1986) adapted to tropicalatmospheric conditions in Central America (Carey & Sigurdsson, 1986) to infer the max-imum height reached by the Bellefontaine eruptive column (see Chapter 1, section 3.4).Within this framework, our isopleth map (Figure 5c) yields a maximum height of 20.1 ± 0.4km for the plume that produced the base of Unit B. Figure 14c gives the decreasing trendof maximum lithic size as a function of the square root of isopleth contours for fragmentscollected at the base of Unit B. Following the approach of Bonadonna & Costa (2013), aWeibull fit gives a maximum height of 19.7 ± 0.1 km for the volcanic plume at the beginningof the Unit B, which is equivalent to the estimation made using the method of Carey &Sigurdsson (1986). We thus retain an average value of 20 ± 0.5 km for the maximum heightreached by the volcanic plume that produced Unit B.
We also use data of Figure 14c to estimate the minimum exit velocity of the volcanicplume at the vent (see Chapter 1, section 3.4). Extrapolating the exponential curve inFigure 14c down to A
1/2 = 0, we can calculate a maximum lithic size at the vent that, usingEquation (3) in Chapter 1, gives a minimum velocity required to carry up this fragment upin the vertical plume of 232 ± 10 ms
�1. Using the same method on a decreasing trend ofthe maximum lithic size as a function of half the crosswind range, we infer a minimum exitvelocity of 214 ± 10 ms
�1. We thus retain an average minimum exit velocity at the vent of223 ± 20 ms
�1 for the beginning of Unit B.
Balisier eruption: As we have no isopleth map for the Balisier eruption, we estimatethe maximum height of the co-PDC plume by using the PDC run-out and the mass dischargerate associated with it. Alternatively, we could estimate the maximum height using the massof deposits (as in Bonadonna et al. 2002) but this method would increase the error in ourestimation as we consider for simplicity that only one co-PDC produced the deposits foundin the field. Our results are detailed in the following subsection.
Carbet eruption: As for the Bellefontaine eruption, we infer a maximum columnheight of 18.7 ± 0.6 km from our isopleth map (Figure 10b) and using the model of Carey& Sigurdsson (1986). Figure 16b gives the decreasing trend of maximum lithic size asa function of the square root of isopleth contours for fragments collected at the base ofCarbet deposits. Following the approach of Bonadonna & Costa (2013), a Weibull fit givesa maximum height of 20.5 ± 0.1 km for the volcanic plume at the beginning of the eruption.We thus retain an average value of 19.6 ± 0.7 km for the maximum height reached by thevolcanic plume.
Extrapolating the exponential curve in Figure 16b down to A
1/2 = 0, we can calculatea maximum lithic size at the vent that, using Equation (3) in Chapter 1, gives a minimumvelocity required to carry up this fragment up in the vertical plume of 260 ± 10 ms
�1.Using the same method on a decreasing trend of the maximum lithic size as a function ofhalf the crosswind range, we infer a minimum exit velocity of 257 ± 10 ms
�1, which is veryclose to the first estimate. We thus retain an average minimum exit velocity at the vent of258 ± 20 ms
�1 for the beginning of the Carbet eruption.
Etoile eruption: We infer a maximum column height of 18.4 ± 0.3 km from our isoplethmap (Figure 10d) and using the model of Carey & Sigurdsson (1986). Figure 16d gives thedecreasing trend of maximum lithic size as a function of the square root of isopleth contoursfor fragments collected at the base of Etoile deposits. Following the approach of Bonadonna& Costa (2013), a Weibull fit gives a maximum height of 19.7 ± 0.1 km for the volcanicplume at the beginning of the eruption. We thus retain an average value of 19 ± 0.4 km for
73
3. Eruptive dynamics Chapter 2
the plume maximum height.
Extrapolating the exponential curve in Figure 16d down to A
1/2 = 0, we can calculatea maximum lithic size at the vent that, using Equation (3) in Chapter 1, gives a minimumvelocity required to carry up this fragment up in the vertical plume of 182 ± 10 ms
�1.Using the same method on a decreasing trend of the maximum lithic size as a function ofhalf the crosswind range, we infer a minimum exit velocity of 184 ± 10 ms
�1, which is veryclose to the first estimate. We thus retain an average minimum exit velocity at the vent of183 ± 20 ms
�1 for the beginning of the Etoile eruption.
3.3 Mass discharge rates and durations
Bellefontaine eruption: We calculate the mass discharge rate (MDR) feeding the plumeproduced by Bellefontaine eruption based on the maximum height and using empiricalscaling relationships from Carazzo et al. (2014) and Woodhouse et al. (2016), which explicitlyinclude the effect of wind (see Chapter 1, section 3.4). A first estimate is given by consideringa linear wind profile increasing from 0 ms
�1 at the ground to 20-30 ms
�1 at the tropopause.Within this framework, a maximum column height of 20 km, and tropical atmosphericconditions, yield a maximum MDR of (2 � 4.8) ⇥ 10
7kg s
�1 for the Carazzo et al. (2014)relationship and a maximum MDR of 5 ⇥ 10
7kg s
�1 for the Woodhouse et al. (2016) one. Athird estimate can be obtained by considering a more realistic and complex wind profile asin Girault et al. (2016) who calculated the maximum height reached by a volcanic columnas a function of the total grain-size distribution at the vent. Taking their complex windprofile, which is closer to the average wind profiles in the Lesser Antilles as it shows a windshear in speed and a reversal in direction (Dunion, 2011), we infer a maximum MDR of 6⇥ 10
7kg s
�1.
Based on these three estimates, we retain a peak MDR for the beginning of Unit Bof (5 ± 1) ⇥ 10
7kg s
�1, a value corresponding to an eruption intensity of 10.7 (Pyle,2000). Combined with the total mass of fallout deposits (Section 3.1), this MDR providesa minimum duration of about 2.5 ± 0.5 hours for the Bellefontaine eruption.
Balisier eruption: We calculate the MDR required to produce the Unit A PDC run-out of 7.1 km using the method of Bursik & Woods (1996), and found ⇡ 10
8kg s
�1. Takingan elutriation factor of 25% (Section 3.1) yields a source MDR for the Unit C of ⇡ 2.5 ⇥10
7kg s
�1. Such a MDR corresponds to a ⇡ 13 km-high co-PDC plume (Woods & Wohletz,1991). The uncertainties of these estimates are not straightforward to quantify, as all thecalculations mostly rely on the estimated MDR for Unit A (and as several co-PDC plumescould have been produced). Our preliminary estimate of the co-PDC plume height will betested using a tephra dispersion model in Chapter 5. Combining the total MDR of ⇡ 10
8
kg s
�1 for the Balisier eruption with the total mass of deposits calculated earlier (Section3.1), we obtain an intensity of 11 for this eruption and a minimum duration for the PDC of⇡ 25 minutes.
Carbet eruption: Using a maximum column height of 19.6 km, tropical atmosphericconditions, together with the same methods than for the Bellefontaine eruption, we obtaina maximum MDR of (2 � 2.7) ⇥ 10
7kg s
�1 for the Carazzo et al. (2014) relationship, 3.8⇥ 10
7kg s
�1 for the Woodhouse et al. (2016) one, and 1.2 ⇥ 10
7kg s
�1 with the complexwind profile of Girault et al. (2016). We thus retain a peak MDR of (3 ± 2) ⇥ 10
7kg s
�1 forthe Carbet eruption, a value corresponding to an eruption intensity of 10.5. Combined withthe total mass of fallout deposits (Section 3.1), this MDR provides a minimum duration of⇡ 85 minutes for the Carbet eruption.
74

Chapter 2 3. Eruptive dynamics
Table
3:
Sum
mar
yof
the
esti
mat
eder
upti
vepa
ram
eter
sfo
rth
eP
linia
nB
elle
font
aine
,Car
betan
dE
toile
erup
tion
s(t
his
stud
y),t
hePel
ean
Bal
isie
rer
upti
on(t
his
stud
y),
and
com
pari
son
wit
hth
ere
cent
Plin
ian
erup
tion
sP
1(C
araz
zoet
al.,
2012
),P
2(C
araz
zoet
al.,
2019
)an
dP
3(C
araz
zoet
al.,
2020
).*
Val
uegi
ven
for
the
co-P
DC
plum
e.
Para
met
ers
Bel
lefo
ntai
ne(1
3,51
6ca
lBP
)B
alis
ier
(14,
072
calB
P)
Car
bet
(18,
711
calB
P)
Eto
ile(2
1,45
0ca
lB
P)
P1
(650
BP
)P
2(1
,670
BP
)P
3(2
,010
BP
)
Vol
ume
(km
3
bulk
/DR
E)
0.42
/0.1
80.
13/0
.06
0.14
/0.0
60.
1/0.
040.
37/0
.16
1.8/
0.77
2.38
/1.0
2
Eru
pted
mas
s(k
g)4.
55⇥
10
11
1.5⇥
10
11
1.5⇥
10
11
1.05
⇥10
11
4⇥
10
11
1.7⇥
10
12
2.4⇥
10
12
VE
I4
44
44
45
Mag
nitu
de4.
64.
14.
14
4.6
5.2
5.4
Max
.he
ight
(km
)20
⇡13
*19
.619
2226
30
Exi
tve
loci
ty(m
s
�1)
214�
232
�25
7�26
018
2�18
415
0�16
518
0�20
021
0�22
0
Max
.P
DC
runo
ut(k
m)
�7.
1�
�4.
5�8
7�11
.57�
10.3
Max
.M
DR
(fal
l,kgs
�1)
5⇥
10
7⇡
10
8(P
DC
)3⇥
10
72.
6⇥
10
73.
6⇥
10
71.
1⇥
10
81.
4⇥
10
8
Dur
atio
n>
2h30
>25
min
(PD
C)
>1h
30>
1h>
5h>
7h>
11h
Max
.in
tens
ity10
.711
10.5
10.4
1111
.511
.4
TG
SD
D=
3.0�
3.6
D=
4.6
D=
3.3
D=
3.5
D=
3.2�
3.3
D=
3.4�
3.5
D=
3.3
Md=
-0.9
1�-0
.44�
Md=
1.62
�M
d=-1
.27�
Md=
-1.0
3�M
d=-3
.7�
Md=
-2.8�
-3.1�
Md=
-0.2�
�=
1.94
�1.
36�=
0.91
�=
1.93
�=
1.83
�=
2.32
�=
1.8�
2�=
2.3
Dis
pers
alax
isS
SSS
WS
SWN
NE
WSW
75
4. Discussion Chapter 2
Etoile eruption: Accounting for a maximum column height of 19 km, tropical atmo-spheric conditions, together with the same methods than for the Bellefontaine eruption, weobtain a maximum MDR of (2.3 � 3.1) ⇥ 10
7kg s
�1 for the Carazzo et al. (2014) rela-tionship, 4.1 ⇥ 10
7kg s
�1 for the Woodhouse et al. (2016) one, and 1 ⇥ 10
7kg s
�1 withthe complex wind profile of Girault et al. (2016). We thus retain a peak MDR of (2.6 ±1.5) ⇥ 10
7kg s
�1 for the Etoile eruption, a value corresponding to an eruption intensityof 10.4. This MDR provides a minimum duration of ⇡ 66 minutes for the Etoile eruptionwhen combined with the total mass of fallout deposits (Section 3.1).
4 Discussion
4.1 Summary of eruptive parameters
First and foremost, the Bellefontaine, Carbet and Etoile events contrast with the threemost recent Plinian eruptions at Mount Pelée volcano (P1, P2, and P3, see Table 3) bytheir unusual southward dispersal. But one can note some other differences between thesesix eruptions. The minimum eruption durations are estimated to be 2h30, 1h30 and 1h forthe Bellefontaine, Carbet and Etoile eruptions, respectively, compared to 11h for P3, 7hfor P2, and 5h for P1, making these older Plinian eruptions relatively short-duration eventsin Martinique. Grain-size analyses reveal that the eruptive products of the Bellefontaineeruption are coarser (D = 3.0 for main Unit B) than those of the Carbet (D = 3.3),Etoile (D = 3.5), P3 (D = 3.3), P2 (D = 3.4) and P1 eruptions (D = 3.2).Moreover, theBellefontaine, Carbet and Etoile eruptions seem to have produced rather stable columnsas no PDC deposits were identified (which would mean that no column collapse occurred),while the most recent Plinian eruption at Mount Pelée all experienced column collapsephases.
The minimum exit velocities inferred for the Bellefontaine (214�232 ms
�1) and P3(210�220 ms
�1) eruptions are similar to each other and larger than those of the Etoile(182�184 ms
�1), P1 (150�165 ms
�1), and P2 (180�200 ms
�1) events. The minimum exitvelocity estimated for the Carbet eruption is even higher (257�260 ms
�1), which couldmean that the Bellefontaine, Carbet and P3 eruptions would have exsolved gas contentshigher than those of the Etoile, P1 and P2 events. We do not have any estimate of exsolvedgas contents for the oldest Plinian eruptions, but Carazzo et al. (2020) indeed showed thatP3 has higher exsolved gas contents (2�2.9 wt%) than P1 (1.6�2.1 wt%) and P2 (1.7�2.1wt%).
Apart from these points, the eruptive parameters retrieved from field data for the Belle-fontaine, Carbet, and Etoile eruptions are close to those estimated for the P1, and P2eruptions (Table 3). All five eruptions are VEI 4 events during which the Plinian columnreached a similar maximum height (i.e., 19�21 km for the Bellefontaine event, 19.6 km forthe Carbet event, and 19 km for the Etoile eruption, compared to 22�26 km for P2, and19�22 km for P1). Their mass discharge rates are also very similar to each other (⇡ 10
7
kg s
�1). The P3 eruption steps out from the usual pattern, as this is the only VEI 5 eventrecorded at Mount Pelée volcano, with a maximum column height reaching 30 km and aMDR larger than 1.4 ⇥ 10
8kg s
�1.
The Balisier eruption is a rather unique Pelean event in the eruptive history of MountPelée, which first produced a PDC of similar runout distance (7.1 km) than those of P1(4.5�8 km), P2 (7�11.5 km) and P3 (7�10.3 km). As this PDC encountered a topograph-ical barrier (i.e., the inner edge of the structure created by the flank collapse that occurred
76
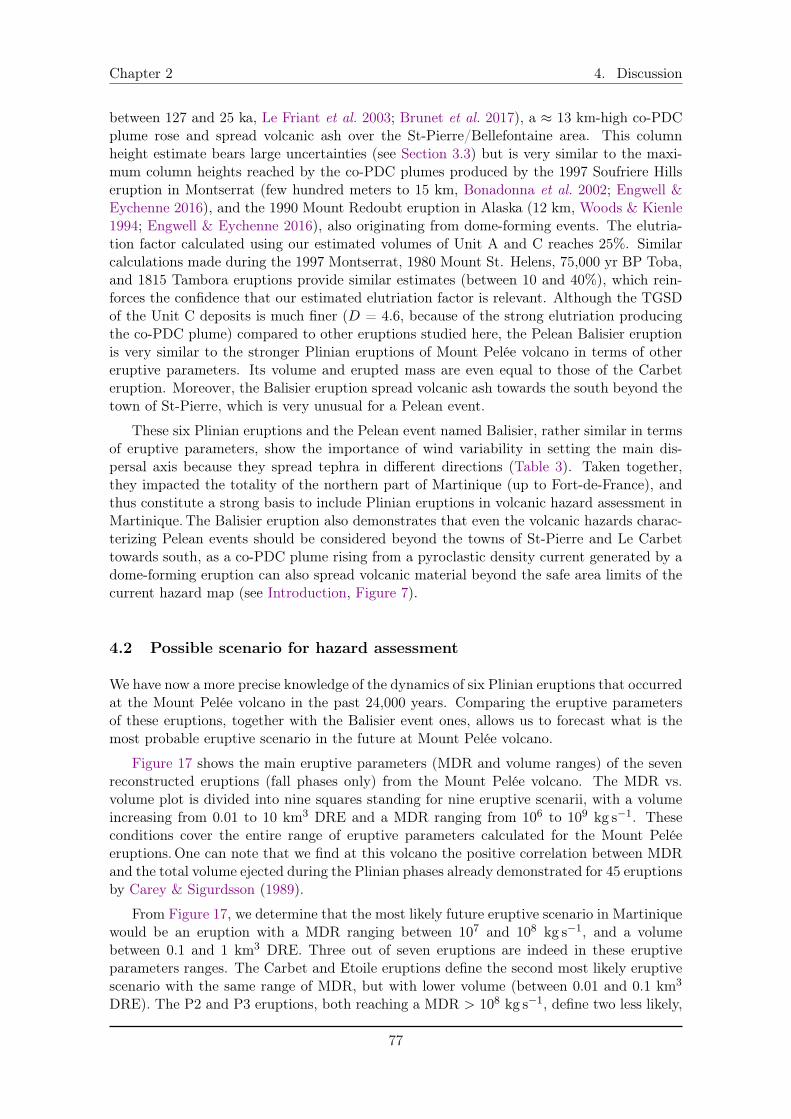
Chapter 2 4. Discussion
between 127 and 25 ka, Le Friant et al. 2003; Brunet et al. 2017), a ⇡ 13 km-high co-PDCplume rose and spread volcanic ash over the St-Pierre/Bellefontaine area. This columnheight estimate bears large uncertainties (see Section 3.3) but is very similar to the maxi-mum column heights reached by the co-PDC plumes produced by the 1997 Soufriere Hillseruption in Montserrat (few hundred meters to 15 km, Bonadonna et al. 2002; Engwell &Eychenne 2016), and the 1990 Mount Redoubt eruption in Alaska (12 km, Woods & Kienle1994; Engwell & Eychenne 2016), also originating from dome-forming events. The elutria-tion factor calculated using our estimated volumes of Unit A and C reaches 25%. Similarcalculations made during the 1997 Montserrat, 1980 Mount St. Helens, 75,000 yr BP Toba,and 1815 Tambora eruptions provide similar estimates (between 10 and 40%), which rein-forces the confidence that our estimated elutriation factor is relevant. Although the TGSDof the Unit C deposits is much finer (D = 4.6, because of the strong elutriation producingthe co-PDC plume) compared to other eruptions studied here, the Pelean Balisier eruptionis very similar to the stronger Plinian eruptions of Mount Pelée volcano in terms of othereruptive parameters. Its volume and erupted mass are even equal to those of the Carbeteruption. Moreover, the Balisier eruption spread volcanic ash towards the south beyond thetown of St-Pierre, which is very unusual for a Pelean event.
These six Plinian eruptions and the Pelean event named Balisier, rather similar in termsof eruptive parameters, show the importance of wind variability in setting the main dis-persal axis because they spread tephra in different directions (Table 3). Taken together,they impacted the totality of the northern part of Martinique (up to Fort-de-France), andthus constitute a strong basis to include Plinian eruptions in volcanic hazard assessment inMartinique. The Balisier eruption also demonstrates that even the volcanic hazards charac-terizing Pelean events should be considered beyond the towns of St-Pierre and Le Carbettowards south, as a co-PDC plume rising from a pyroclastic density current generated by adome-forming eruption can also spread volcanic material beyond the safe area limits of thecurrent hazard map (see Introduction, Figure 7).
4.2 Possible scenario for hazard assessment
We have now a more precise knowledge of the dynamics of six Plinian eruptions that occurredat the Mount Pelée volcano in the past 24,000 years. Comparing the eruptive parametersof these eruptions, together with the Balisier event ones, allows us to forecast what is themost probable eruptive scenario in the future at Mount Pelée volcano.
Figure 17 shows the main eruptive parameters (MDR and volume ranges) of the sevenreconstructed eruptions (fall phases only) from the Mount Pelée volcano. The MDR vs.volume plot is divided into nine squares standing for nine eruptive scenarii, with a volumeincreasing from 0.01 to 10 km
3 DRE and a MDR ranging from 10
6 to 10
9kg s
�1. Theseconditions cover the entire range of eruptive parameters calculated for the Mount Peléeeruptions.One can note that we find at this volcano the positive correlation between MDRand the total volume ejected during the Plinian phases already demonstrated for 45 eruptionsby Carey & Sigurdsson (1989).
From Figure 17, we determine that the most likely future eruptive scenario in Martiniquewould be an eruption with a MDR ranging between 10
7 and 10
8kg s
�1, and a volumebetween 0.1 and 1 km
3 DRE. Three out of seven eruptions are indeed in these eruptiveparameters ranges. The Carbet and Etoile eruptions define the second most likely eruptivescenario with the same range of MDR, but with lower volume (between 0.01 and 0.1 km
3
DRE). The P2 and P3 eruptions, both reaching a MDR > 10
8kg s
�1, define two less likely,
77
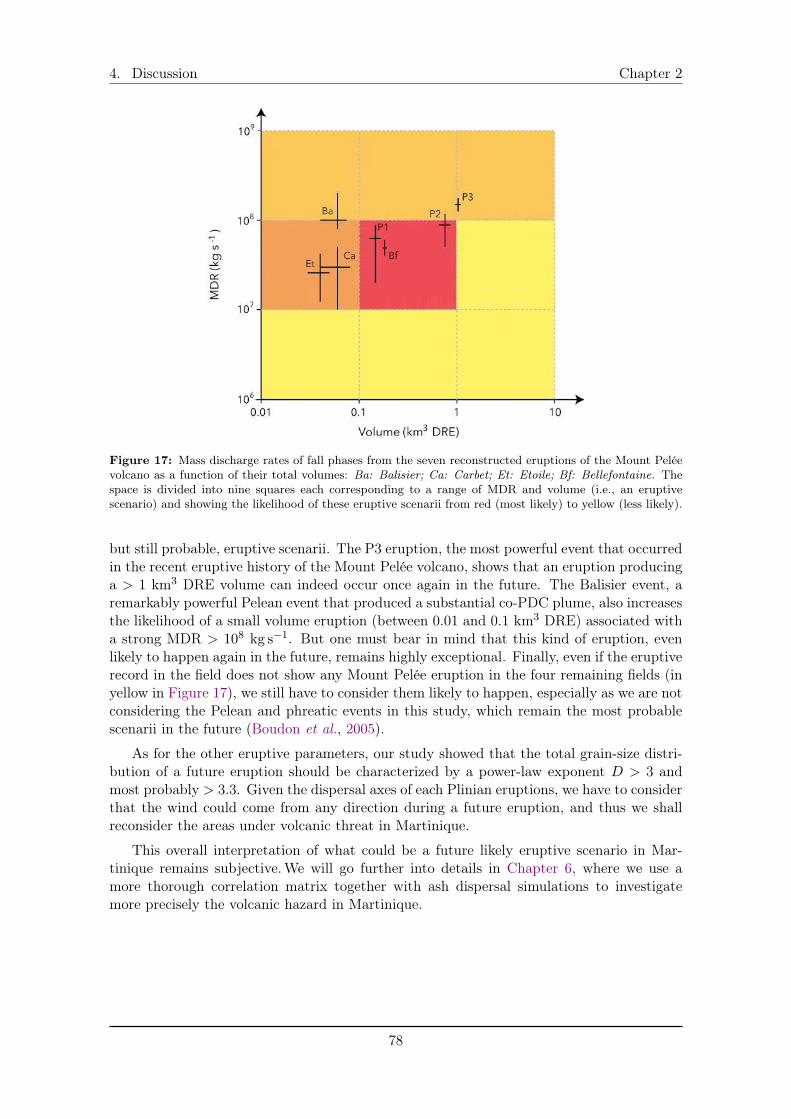
4. Discussion Chapter 2
Figure 17: Mass discharge rates of fall phases from the seven reconstructed eruptions of the Mount Peléevolcano as a function of their total volumes: Ba: Balisier; Ca: Carbet; Et: Etoile; Bf: Bellefontaine. Thespace is divided into nine squares each corresponding to a range of MDR and volume (i.e., an eruptivescenario) and showing the likelihood of these eruptive scenarii from red (most likely) to yellow (less likely).
but still probable, eruptive scenarii. The P3 eruption, the most powerful event that occurredin the recent eruptive history of the Mount Pelée volcano, shows that an eruption producinga > 1 km
3 DRE volume can indeed occur once again in the future. The Balisier event, aremarkably powerful Pelean event that produced a substantial co-PDC plume, also increasesthe likelihood of a small volume eruption (between 0.01 and 0.1 km
3 DRE) associated witha strong MDR > 10
8kg s
�1. But one must bear in mind that this kind of eruption, evenlikely to happen again in the future, remains highly exceptional. Finally, even if the eruptiverecord in the field does not show any Mount Pelée eruption in the four remaining fields (inyellow in Figure 17), we still have to consider them likely to happen, especially as we are notconsidering the Pelean and phreatic events in this study, which remain the most probablescenarii in the future (Boudon et al., 2005).
As for the other eruptive parameters, our study showed that the total grain-size distri-bution of a future eruption should be characterized by a power-law exponent D > 3 andmost probably > 3.3. Given the dispersal axes of each Plinian eruptions, we have to considerthat the wind could come from any direction during a future eruption, and thus we shallreconsider the areas under volcanic threat in Martinique.
This overall interpretation of what could be a future likely eruptive scenario in Mar-tinique remains subjective. We will go further into details in Chapter 6, where we use amore thorough correlation matrix together with ash dispersal simulations to investigatemore precisely the volcanic hazard in Martinique.
78
Chapter 2 5. Conclusion
5 Conclusion
In this first part of the manuscript, we detailed how we discovered/revisited four new erup-tions in Martinique thanks to two new field campaigns. We dated each of these new events,and reconstructed the eruptive history of the Mount Pelée volcano for the last 24 ka (Chap-ter 1). One of the three Plinian eruptions newly discovered was originally thought to bepart of the P3 eruption. We demonstrated in Chapter 1, that it is in fact a much olderevent, and we named it the Bellefontaine eruption. The two other Plinian deposits foundin the field were completely unknown and we named them the Carbet and Etoile eruptions.Apart from these, we also discovered and studied an exceptional fall deposit resulting froma co-PDC plume that rose above the pyroclastic flow formed by a Pelean eruption originallyidentified and named NBC by Traineau (1982). We decided to name the entire eruptivesequence (dense PDC, dilute PDC and co-PDC deposits) the Balisier eruption.
Thanks to our field studies, our deposit samples, and our thickness and lithic size mea-surements, we reconstructed in this chapter the eruptive parameters of each of these newfour eruptions. We then compared these parameters to those of the most recent Plinianeruptions in Martinique: the P1 (Carazzo et al., 2012), P2 (Carazzo et al., 2019), and P3(Carazzo et al., 2020) events. We showed that the Mount Pelée volcano produced rathersimilar eruptions in its recent past (less than 24,000 years). The P3 and Balisier eruptionsremarkably step out of this pattern as they are respectively powerful Plinian and Peleanevents, when compared to the other recent eruptions in Martinique. Thanks to the similar-ities between these eruptions, we drew an accurate picture of the Plinian eruptive scenariomost likely to happen in the future. This most probable eruption would produce a ⇡ 20 km-high column and reach a peak MDR between 10
7 and 10
8kg s
�1. Its deposits would have avolume comprised between 0.1 and 1 km
3 DRE, with a dominant population of rather fineparticles (D > 3.3). As the wind could come from any direction, the volcanic products ofthis future eruption could spread to any area in Martinique (including the most populatedarea at Fort-de-France), or even reach another Caribbean island (such as Dominica or StLucia). The scenario of a more powerful Plinian (VEI 5 type) or Pelean (involving a co-PDCplume threatening areas not usually endangered by a dome-forming eruption) event remainsprobable.
Before investigating further the Plinian volcanic hazard in Martinique (Part 3) by sim-ulating the ash dispersal of two eruptions of the Mount Pelée volcano (Chapter 5) and byconstructing a new hazard map (Chapter 6), we detail in the following Part 2 our studieson the impact of grain-size distribution (Chapter 3) and wind (Chapter 4) on the dynamicsof Plinian eruptions. These two parameters indeed varied in the past eruptive history of theMount Pelée volcano.
79
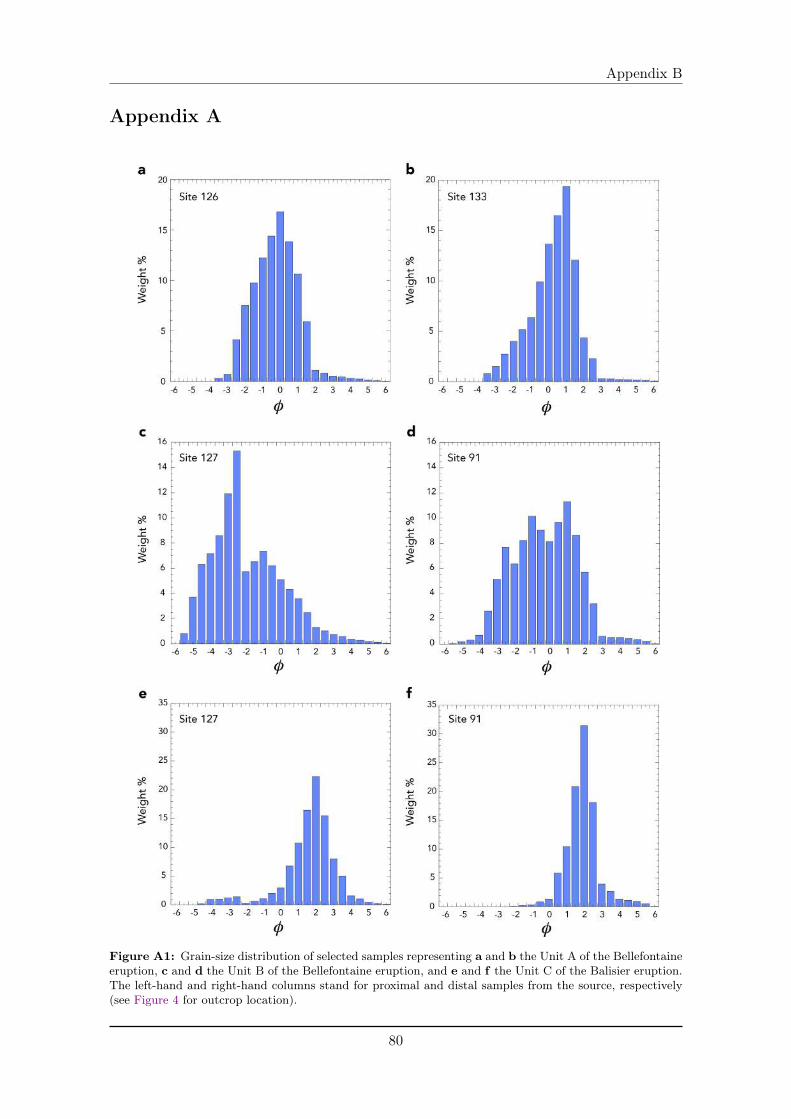
Appendix B
Appendix A
Figure A1: Grain-size distribution of selected samples representing a and b the Unit A of the Bellefontaineeruption, c and d the Unit B of the Bellefontaine eruption, and e and f the Unit C of the Balisier eruption.The left-hand and right-hand columns stand for proximal and distal samples from the source, respectively(see Figure 4 for outcrop location).
80
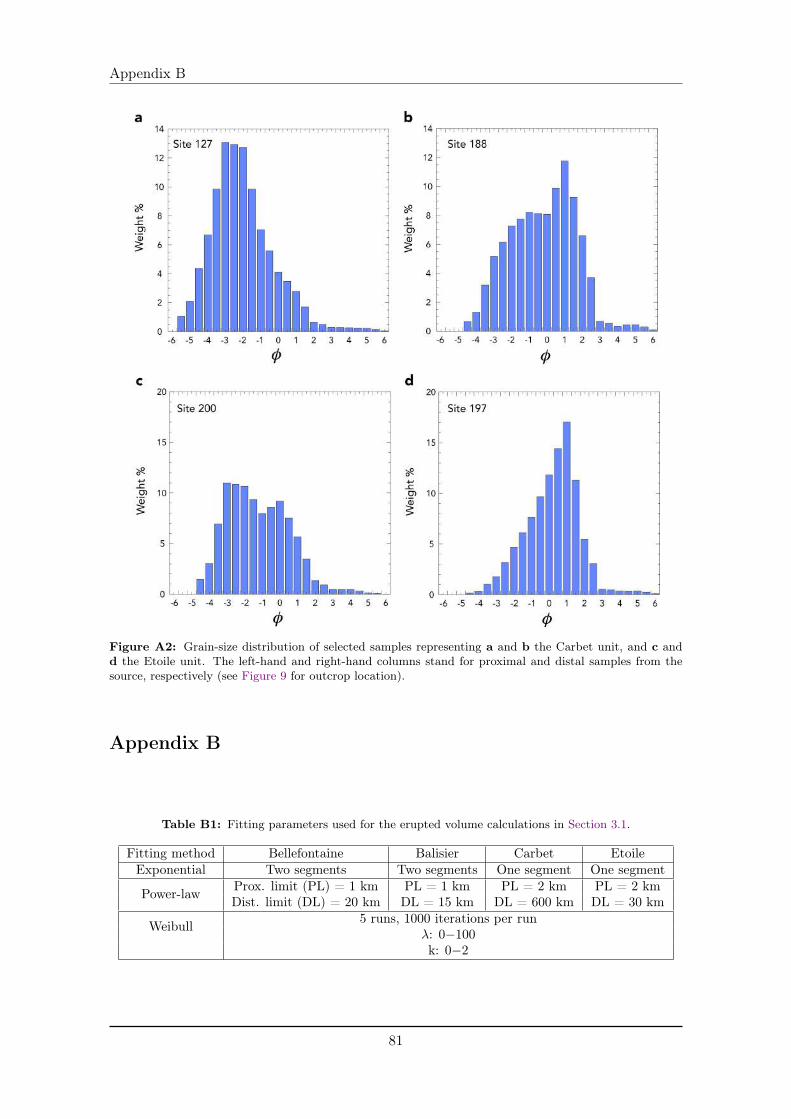
Appendix B
Figure A2: Grain-size distribution of selected samples representing a and b the Carbet unit, and c andd the Etoile unit. The left-hand and right-hand columns stand for proximal and distal samples from thesource, respectively (see Figure 9 for outcrop location).
Appendix B
Table B1: Fitting parameters used for the erupted volume calculations in Section 3.1.
Fitting method Bellefontaine Balisier Carbet EtoileExponential Two segments Two segments One segment One segment
Power-law Prox. limit (PL) = 1 km PL = 1 km PL = 2 km PL = 2 kmDist. limit (DL) = 20 km DL = 15 km DL = 600 km DL = 30 km
Weibull 5 runs, 1000 iterations per run�: 0�100k: 0�2
81
References
ReferencesAndrews, B.J. & Manga, M. 2011 Effects of topography on pyroclastic density current runout and
formation of coignimbrites. Geology 39 (12), 1099–1102.
Bonadonna, C. & Costa, A. 2012 Estimating the volume of tephra deposits: A new simple strategy.Geology 40, 415–418.
Bonadonna, C. & Costa, A. 2013 Plume height, volume, and classification of explosive volcanic eruptionsbased on the Weibull function. Bull. Volcanol. 75, 1–19.
Bonadonna, C., Ernst, G.G.J. & Sparks, R.S.J. 1998 Thickness variations and volume estimatesof tephra fall deposits: The importance of particle Reynolds number. J. Volcanol. Geotherm. Res. 81,173–187.
Bonadonna, C. & Houghton, B.F. 2005 Total grain-size distribution and volume of tephra-fall deposits.Bull. Volcanol. 67, 441–456.
Bonadonna, C., Mayberry, G.C., Calder, E.S., Sparks, R.S.J., Choux, C., Jackson, P., Leje-une, A.M., Loughlin, S.C., Norton, G.E., Rose, W.I., Ryan, G. & Young, S.R. 2002 Tephrafallout in the eruption of Soufriere Hills Volcano, Montserrat. In The Eruption of Soufriere Hills Vol-cano, Montserrat from 1995 to 1999 (ed. T.H. Druitt & B.P. Kokelaar), pp. 483–516. Geological Society,London, Memoirs.
Boudon, G., Le Friant, A., Villemant, B. & Viode, J.P. 2005 Martinique. In Volcanic Hazard Atlasof the Lesser Antilles (ed. J.M. Lindsay, R.E.A. Robertson, J.B. Sheperd & S. Ali), pp. 127–146. SeismicResearch Unit, The University of the West Indies, Trinidad and Tobago, W.I.
Brunet, M., Moretti, L., Le Friant, A., Mangeney, A., Fernández Nieto, E.D. & Bouchut, F.2017 Numerical simulation of the 30-45 ka debris avalanche flow of Montagne Pelée volcano, Martinique:from volcano flank collapse to submarine emplacement. Nat. Hazards 87, 1189–1222.
Bursik, M.I. & Woods, A.W. 1996 The dynamics and thermodynamics of large ash flows. Bull. Volcanol.58, 175–193.
Carazzo, G., Girault, F., Aubry, T., Bouquerel, H. & Kaminski, E. 2014 Laboratory experimentsof forced plumes in a density-stratified crossflow and implications for volcanic plumes. Geophys. Res. Lett.41, 8759–8766.
Carazzo, G., Tait, S. & Kaminski, E. 2019 Marginally stable recent Plinian eruptions of Mt. Peléevolcano (Lesser Antilles): The P2 AD 280 eruption. Bull. Volcanol. 81, 1–17.
Carazzo, G., Tait, S., Kaminski, E. & Gardner, J. E. 2012 The recent Plinian explosive activity ofMt. Pelée volcano (Lesser Antilles): The P1 AD 1300 eruption. Bull. Volcanol. 74, 2187–2203.
Carazzo, G., Tait, S., Michaud-Dubuy, A., Fries, A. & Kaminski, E. 2020 Transition from stablecolumn to partial collapse during the 79 cal CE P3 Plinian eruption of Mt Pelée volcano (Lesser Antilles).J. Volcanol. Geotherm. Res. In press. https://doi.org/10.1016/j.jvolgeores.2019.106764.
Carey, Steven & Sigurdsson, Haraldur 1986 The 1982 eruptions of El Chichon volcano, Mexico (2):Observations and numerical modelling of tephra-fall distribution. Bull. Volcanol. 48, 127–141.
Carey, S. & Sigurdsson, H. 1989 The intensity of Plinian eruptions. Bull. Volcanol. 51, 28–40.
Carey, S. & Sparks, R.S.J. 1986 Quantitative models of the fallout and dispersal of tephra from volcaniceruption columns. Bull. Volcanol. 48, 109–125.
Costa, A., Pioli, L. & Bonadonna, C. 2016 Assessing tephra total grain-size distribution: Insights fromfield data analysis. Earth Planet. Sci. Lett. 443, 90–107.
Daggit, M.L., Mather, T.A., Pyle, D.M. & Page, S. 2014 AshCalc-a new tool for the comparison ofthe exponential, power-law and Weibull models of tephra deposition. J. Appl. Volcanol. 3:7.
Dunion, J.P. 2011 Rewriting the climatology of the tropical North Atlantic and Caribbean Sea atmosphere.J. Clim. 24, 893–908.
82
References
Engwell, S. & Eychenne, J. 2016 Contribution of Fine Ash to the Atmosphere From Plumes AssociatedWith Pyroclastic Density Currents. In Volcanic Ash: Hazard Observation. Elsevier.
Fierstein, J. & Nathenson, M. 1992 Another look at the calculation of fallout tephra volumes. Bull.Volc. 54, 156–167.
Girault, F., Carazzo, G., Tait, S. & Kaminski, E. 2016 Combined effects of total grain-size distribu-tion and crosswind on the rise of eruptive volcanic columns. J. Volcanol. Geotherm. Res. 326, 103–113.
Kaminski, E. & Jaupart, C. 1998 The size distribution of pyroclasts and the fragmentation sequence inexplosive volcanic eruptions. J. Geophys. Res. 103, 29759–29779.
Le Friant, A., Boudon, G., Deplus, C. & Villemant, B. 2003 Large-scale flank collapse events duringthe activity of Montagne Pelée, Martinique, Lesser Antilles. J. Geophys. Res. 108 (B1), 1–15.
Michaud-Dubuy, A., Carazzo, G., Tait, S., Le Hir, G., Fluteau, F. & Kaminski, E. 2019 Impactof wind direction variability on hazard assessment in Martinique (Lesser Antilles): The example of the13.5 ka cal BP Bellefontaine Plinian eruption of Mount Pelée volcano. J. Volcanol. Geotherm. Res. 381,193–208.
Newhall, Christopher G. & Self, Stephen 1982 The volcanic explosivity index (VEI) an estimate ofexplosive magnitude for historical volcanism. J. Geophys. Res. 87 (C2), 1231–1238.
Pyle, D.M. 1989 The thickness, volume and grainsize of tephra fall deposits. Bull. Volcanol. 51 (1), 1–15.
Pyle, D.M. 2000 Sizes of volcanic eruptions. In Encyclopedia of Volcanoes (ed. H.E. Sigurdsson,B. Houghton, H. Reimer, Stiw J. & S. McNutt), pp. 263–269. Academic Press, San Diego.
Roobol, M.J. & Smith, A.L. 1976 Mount Pelée, Martinique: A pattern of alternating eruptive styles.Geology 4, 521–524.
Sigurdsson, H. & Carey, S. 1989 Plinian and co-ignimbrite tephra fall from the 1815 eruption of Tamboravolcano. Bull. Volcanol. 51, 243–270.
Smith, A.L. & Roobol, M.J. 1990 Mount Pelée, Martinique: A study of an Active Island Arc Volcano.Geol. Soc. Am. Memoir 175.
Traineau, H. 1982 Contribution à l’étude géologique de la Montagne Pelée (Martinique) : Evolution del’activité éruptive au cours de la période récente. PhD thesis, Université Paris XI.
Traineau, H., Westercamp, D., Bardintzeff, J. M. & Miskovsky, J. C. 1989 The recent pumiceeruptions of Mt. Pelée volcano, Martinique. Part I: Depositional sequences, description of pumiceousdeposits. J. Volcanol. Geotherm. Res. 38, 17–33.
Walker, G.P.L. 1971 Grain-size characteristics of pyroclastic deposits. J. Geology 79, 696–714.
Watanabe, K., Ono, K., Sakaguchi, K., Takada, A. & Hoshizumi, H. 1999 Co-ignimbrite ash-falldeposits of the 1991 eruptions of Fugen-dale, Unzen Volcano, Japan. J. Volcanol. Geotherm. Res. 89,95–112.
Westercamp, D., Pelletier, B., Thibaut, P.M. & Traineau, H. 1990 Carte géol. France (1/50 000),feuille MARTINIQUE . Orléans : Bureau de recherches géologiques et minières, notice explicative parWestercamp D., Andreieff P., Bouysse P., Cottez S., Battistini R. (1989), 246 pp.
Westercamp, D. & Traineau, H. 1983 The past 5,000 years of volcanic activity at Mt. Pelée Martinique(F.W.I.): Implications for assessment of volcanic hazards. J. Volcanol. Geotherm. Res. 17, 159–185.
Woodhouse, M.J., Hogg, A.J. & Phillips, J.C. 2016 A global sensitivity analysis of the PlumeRisemodel of volcanic plumes. J. Volcanol. Geotherm. Res. 326, 54–76.
Woods, A. W. & Kienle, J. 1994 The dynamics and thermodynamics of volcanic clouds: Theory andobservations from the April 15 and April 21, 1990 eruptions of Redoubt volcano, Alaska. J. Volcanol.Geotherm. Res. 62 (1-4), 273–299.
Woods, A. W. & Wohletz, K. 1991 Dimensions and dynamics of co-ignimbrite eruption columns. Nature350, 225–227.
83

Part 2
Physical model of explosive volcanic
plumes

Chapter 3
A revisit of the role of gas entrapment
on the stability conditions of
explosive volcanic columns
Michaud-Dubuy A., Carazzo G., Kaminski E., and Girault, F. (2018) J. Volcanol. Geotherm.
Res. 357, 349-361. https://doi.org/10.1016/j.jvolgeores.2018.05.005
Table of contents1 Introduction . . . . . . . . . . . . . . . . . . . . . . . . . . . . . . . . . . 902 Physical model of explosive volcanic columns . . . . . . . . . . . . . . . . 92
2.1 Conservation equations and constitutive laws . . . . . . . . . . . 922.2 Particle sedimentation . . . . . . . . . . . . . . . . . . . . . . . . 932.3 Grain-size distribution and amount of gas at the vent . . . . . . . 942.4 Exit velocity at the base of the eruptive column . . . . . . . . . . 96
3 Results . . . . . . . . . . . . . . . . . . . . . . . . . . . . . . . . . . . . . 963.1 Prediction of column collapse . . . . . . . . . . . . . . . . . . . . 963.2 Predictions for the dynamics of collapsing fountains . . . . . . . . 98
4 Comparison with natural cases . . . . . . . . . . . . . . . . . . . . . . . . 1024.1 The ⇡186 CE Taupo eruption . . . . . . . . . . . . . . . . . . . . 1024.2 The 79 CE Vesuvius eruption . . . . . . . . . . . . . . . . . . . . 104
5 Discussion . . . . . . . . . . . . . . . . . . . . . . . . . . . . . . . . . . . 1065.1 The effect of crater shape on exit velocity . . . . . . . . . . . . . 1065.2 Effect of wind on column collapse . . . . . . . . . . . . . . . . . . 106
6 Conclusions . . . . . . . . . . . . . . . . . . . . . . . . . . . . . . . . . . . 107Notation . . . . . . . . . . . . . . . . . . . . . . . . . . . . . . . . . . . . . . . 108Appendix A . . . . . . . . . . . . . . . . . . . . . . . . . . . . . . . . . . . . . . 110Appendix B . . . . . . . . . . . . . . . . . . . . . . . . . . . . . . . . . . . . . . 110
Chapter 3
Résumé du chapitre 3
Ce chapitre est dédié à l’amélioration d’un modèle physique de panache volcanique afinde mieux cerner le comportement de ces écoulements. Les éruptions volcaniques explosivesproduisent des jets turbulents à hautes vitesses qui peuvent former soit une colonne pliniennestable (par flottabilité positive) ou une fontaine en effondrement produisant des coulées dedensité pyroclastiques. Déterminer les conditions à la source menant à ces deux régimesextrêmes est un enjeu majeur de la volcanologie physique. Classiquement, la limite entre lesdeux régimes est définie par un flux de masse critique avant effondrement pour une quantitédonnée de gaz libre dans le mélange éruptif (gaz libre + pyroclastes) à l’évent. Des étudesprécédentes ont montré qu’une concordance entre théorie et données de terrain peut êtreatteinte dans deux cas différents: (i) par la prise en compte de l’effet de piégeage de gazdans les fragments grossiers de ponces, qui abaisse la quantité de gaz effective, en fonctionde la distribution totale de tailles de grains des fragments pyroclastiques, ou (ii) par la priseen compte de la réduction d’entraînement turbulent à la base de la colonne volcanique dueà sa flottabilité négative.
Dans ce chapitre, nous cherchons à combiner ces deux effets en utilisant un modèle 1D decolonne volcanique incluant la sédimentation pour suivre l’évolution de la distribution totalede tailles de grains. Dans les éruptions pliniennes puissantes (> 10
7kg s
�1), la perte de par-ticules par sédimentation diminue la charge en particules durant l’ascension du panache, cequi favorise la formation d’une colonne stable. Dans ce cas, nous obtenons qu’une distribu-tion totale de tailles de grains grossière favorise la formation de panaches stables, un résultatcontre-intuitif et contredisant les prédictions de modèles considérant le piégeage de gaz dansles fragments pyroclastiques grossiers. Pour interpréter cette conclusion, nous reconsidéronsl’effet de piégeage de gaz et montrons qu’en général, il a un rôle dominant sur l’effondrementde colonne comparé à la sédimentation, et empêche la formation de colonnes stables. Ceteffet radical est réduit si la porosité ouverte est incorporée dans le modèle, par exemple enconsidérant que certaines bulles contenues dans un fragment volcanique sont connectées àl’extérieur. Les caractéristiques des coulées de densité pyroclastiques produites par effon-drement de colonne sont ensuite prédites en fonction de la distribution totale de tailles degrains et du flux de masse à la source.
Enfin, nous testons le modèle théorique en utilisant deux éruptions historiques biendocumentées: les éruptions du Taupo (s’étant produite autour de l’an 186 de notre ère) etdu Vésuve (en 79 de notre ère). Les prédictions de notre modèle sont cohérentes avec lesdonnées de l’éruption du Taupo, mais pas avec celles du Vésuve. Pour ce dernier cas, noussuggérons que les caractéristiques de la distribution totale de tailles de grains impliquentde prendre en compte le déséquilibre thermique entre le gaz et les pyroclastes au sein dupanache.
88
Chapter 3
Abstract
Explosive volcanic eruptions produce high-velocity turbulent jets that can form either a sta-ble buoyant Plinian column or a collapsing fountain producing pyroclastic density currents(PDC). Determining the source conditions leading to these extreme regimes is a major goalin physical volcanology. Classically, the regime boundary is defined as the critical eruptivemass discharge rate (MDR) before collapse for a given amount of free gas in the eruptivemixture (free gas + pyroclasts) at the vent. Previous studies have shown that an agreementbetween theory and field data can be achieved in two different frameworks: (i) by accountingfor the effect of gas entrapment in large pumice fragments, which lowers the effective gascontent, depending on the total grain-size distribution (TGSD) of pyroclastic fragments, or(ii) by accounting for the reduction of turbulent entrainment at the base of the volcaniccolumn due to its negative buoyancy.
Here, we aim at combining these two using a 1D model of volcanic column that includessedimentation to follow the evolution of the TGSD. In powerful (� 10
7kg s
�1) Plinian erup-tions, the loss of particles by sedimentation acts as to decrease the load of particles duringthe plume rise, which favors the formation of a stable column. In this case, we obtain thatcoarse TGSD promote the formation of stable plumes, a result at odds with the predic-tions of models considering gas entrapment in large pyroclastic fragments. To interpret thisconclusion, we reconsider the effect of gas entrapment and show that in general, it has adominant role on column collapse compared to particle sedimentation, and hinders the for-mation of buoyant columns. This drastic effect is reduced when incorporating open porosity,e.g. by considering that some bubbles inside a fragment are connected to the exterior. Thecharacteristics of the PDC produced by column collapse are then predicted as a function ofthe TGSD and MDR at the source.
We further test the model using two well-documented historical events, the ⇡186 CETaupo and 79 CE Vesuvius eruptions. Our model predictions are consistent with the Taupoeruption record, but not with the Vesuvius one. In this latter case, we suggest that thecharacteristics of the TGSD imply to take into account the thermal disequilibrium betweengas and pyroclasts.
89
1. Introduction Chapter 3
1 Introduction
Explosive volcanic eruptions stand as one of the most powerful and dangerous naturalphenomena on Earth. During these extreme events, the magma ascending from depthis fragmented in the conduit and expelled at the vent as a dense turbulent mixture of hotgas and pyroclasts. The mass discharge rate of these high-velocity turbulent jets usuallyranges between 10
6 and 10
9kg s
�1 (Carey & Sigurdsson, 1989). Depending on its massdischarge rate, a volcanic jet can follow remarkably different dynamical evolutions duringits rise in the atmosphere. In the buoyant regime (also called “Plinian” regime), the volcanicmixture forms a vertical column that rises up to tens of kilometers before spreading outlaterally to form an horizontal umbrella cloud (Sparks, 1986). In the fountain regime (or“collapse” regime), the turbulent jet collapses to the ground and produces pyroclastic densitycurrents (PDC) rushing down the volcano flanks. When eruption conditions are close tothose of column collapse, the regime is transitional: an unstable buoyant column still risesto high altitudes but occasionally generates PDC. The two eruptive regimes, which canoccur one after another and even alternate during the same eruption, mainly determinethe associated hazards. Whereas a rain of ash and pumices produced during the Plinianregime may cause infrastructure damages (e.g., Wilson et al. 2014), major perturbations ofair traffic (e.g., Miller & Casadevall 2000; Schmidt et al. 2014) and breathing difficulties(e.g., Horwell & Baxter 2006; Horwell 2007; Horwell et al. 2013), PDC most commonly leadto massive human and material losses (e.g., Spence et al. 2004; Wilson et al. 2014). Theprediction of column behavior is therefore fundamental to assess the impact of explosivevolcanic eruptions. The understanding and prediction of the source (and environmental)conditions leading to either a buoyant plume or a collapsing fountain remains a major goalin physical volcanology.
The dual behavior described above rises from the evolution of the volcanic column bulkdensity during its ascent in the atmosphere. At the vent, the hot mixture of gas andpyroclasts has a bulk density greater than the ambient air, and its initial momentum drivesthe plume ascent. Thereafter, owing to turbulent mixing, cold atmospheric air is entrainedinto the flow and heated by the hot pyroclasts, leading to a rapid expansion of the gasand an associated decrease of the bulk density of the jet (Sparks & Wilson 1976; Woods1988, 1995). In the meantime, the jet momentum decreases with altitude due to its negativebuoyancy. A stable Plinian column forms when the bulk density of the volcanic mixturebecomes lower than that of the atmospheric air before complete exhaustion of its initialmomentum. Then, the volcanic plume rises by natural convection until it reaches a neutralbuoyancy level and spreads out laterally. In the fountain regime, the jet consumes its initialmomentum before becoming buoyant and thus collapses to the ground producing PDC.
Since the 1970’s, various methods have been used to study the stability of volcaniccolumns produced by explosive eruptions (or equivalently the conditions leading to PDCproduction). A first generation of theoretical models was developed based on a simplified1D approach (Wilson, 1976; Sparks, 1986; Woods, 1988) stemming from the widely used“top-hat” formalism of Morton et al. (1956). These models rely on the “dusty-gas” hy-pothesis where particles are considered small enough to remain in thermal and mechanicalequilibrium with the gas. In that case, the volcanic mixture can be represented as a sin-gle “equivalent” gaseous phase. This convenient formalism has been used to quantitativelystudy the relationship between the maximum height of the plume and the source mass dis-charge rate (Settle, 1978; Wilson et al., 1980; Carey & Sigurdsson, 1989) and to determinethe conditions leading to column collapse.
90
Chapter 3 1. Introduction
Wilson et al. (1980) showed that the mass fraction of free gas in the eruptive mixtureat the vent (gas + pyroclastic fragments) and mass discharge rate (MDR) strongly controlthe transition between the stable Plinian plume and the collapsing fountain regimes, aconclusion later confirmed by laboratory experiments (Woods & Caulfield, 1992). Othereffects have been considered in order to determine quantitatively this regime boundary.Woods & Bursik (1991) demonstrated that particle sedimentation has a minor effect on thecolumn dynamics, but thermal disequilibrium significantly changes the column behavior andcan induce a column collapse. Woods & Bower (1995) and Koyaguchi et al. (2010) calculatedthe conditions for which jet decompression in a crater can yield subsonic velocities andcolumn collapse. Degruyter & Bonadonna (2013) showed that high velocity atmosphericwinds can significantly increase the amount of air engulfed in the volcanic column hencemaking it more stable.
More sophisticated 2D axisymetric and 3D models, based on the time-dependent solutionof the Navier-Stokes and energy conservation equations, have been developed to describethe fluid dynamics of the eruptive mixture and the surrounding atmosphere (Valentine &Wohletz, 1989; Neri & Dobran, 1994; Suzuki et al., 2005; Esposti Ongaro et al., 2008).These models improved our understanding of the dynamics of explosive volcanic columnsby exploring ranges of parameters that are beyond the limitations imposed by 1D models.However, a recent intercomparison exercise revealed that the results of 2D and 3D modelsdiverge in some of their predictions depending on the assumptions made to solve the gov-erning equations (Costa et al., 2016b). On the other hand, 1D models predictions showsimilarities with those of 3D models, suggesting that 1D models can be used to adequatelydescribe the general behavior of volcanic columns.
Among the different studies on the stability of volcanic plumes, two - Kaminski & Jau-part (2001) and Carazzo et al. (2008a) - have compared the model predictions of collapsewith field constraints in a systematic way, and have shown that previous models tendedto significantly favor the buoyant regime in comparison to the natural cases. Kaminski &Jaupart (1998, 2001) demonstrated that gas entrapment in large pumice during the frag-mentation process significantly reduces the effective amount of free gas available at the baseof the column and promote column collapse. Carazzo et al. (2008a) studied the effects ofreduced turbulent entrainment due to negative buoyancy at the base of the column andshowed that it also promotes column collapse. Gas entrapment and reduced entrainmentact in the same direction and, when taken independently, yield model predictions consistentwith field data. However, these two phenomena have not been considered together yet,and it can be argued that their combined effect could be to favor too much the collapseregime compared to the natural cases, hence reducing their performances in determiningaccurately the conditions of collapse. Here we propose to combine the two effects, whichrequires to take into account the evolution of the total grain size distribution (TGSD) dueto sedimentation (Girault et al., 2014).
Our paper is organized as follows. In Section 2, we describe our physical 1D model ofexplosive volcanic columns. In Section 3, we analyze the results of the model taking intoaccount variable entrainment as a function of buoyancy, sedimentation, gas entrapment, andopen porosity, and we investigate the control of these parameters and phenomena on theconditions leading to column collapse. We further quantify the fountain height and charac-terize the PDC produced in the collapse regime. In Section 4, we compare our theoreticalpredictions with field data from two well-known historical eruptions (⇡186 CE Taupo and 79CE Vesuvius). In Section 5, we discuss additional effects that may influence the transitionbetween stable and collapsing eruptive columns, and we conclude in Section 6.
91
2. Physical model of explosive volcanic columns Chapter 3
2 Physical model of explosive volcanic columns
2.1 Conservation equations and constitutive laws
Our model relies on a 1D steady-state “top-hat” formalism for a conical jet in which allthe dynamical variables are considered constant inside the jet and zero outside (Mortonet al., 1956). The horizontal rate of entrainment of the surrounding fluid is assumed to beproportional to the local vertical ascension rate of the plume, through a constant entrainmentcoefficient ↵e. Our work is based on the improved version of the Woods (1988) model, thatexplicitely considers the conservation of energy and its effect on the evolution of the bulkdensity of the flow. As in Woods (1988), we consider thermal and mechanical equilibriumbetween the volcanic gas and the particles. For a particle-laden volcanic jet and a calmstratified atmosphere, the three macroscopic conservation equations of mass, momentumand energy flow rates in steady-state are written as (Woods, 1988; Woods & Bursik, 1991;Bursik, 2001; Costa et al., 2006; Girault et al., 2014):
d
dz(⇢UR2
) = 2⇢aUeR+
N�
X
�=1
dQ�
dz, (1)
d
dz(⇢U2R2
) = g(⇢a � ⇢)R2+ U
N�
X
�=1
dQ�
dz, (2)
d
dz(⇢UR2cpT ) = 2⇢aUeRcaTa � ⇢agUR2
+ cpT
N�
X
�=1
dQ�
dz, (3)
where R(z) is the column radius, U(z) is the vertical velocity, g is the acceleration of gravity,⇢, cp and T are the density, the specific heat and the temperature at constant pressure ofthe bulk mixture, respectively, ⇢a, ca and Ta are those of the atmosphere (all variables aredefined in the Notation section). Q� = x�⇢UR2, where x� is the mass proportion of �-sizedparticles in the GSD, is the discharge rate of �-sized particles (kg s�1) distributed within 20classes of grain sizes ranging from dmin = 10� (1 µm) to dmax = �9� (0.5 m) with one �intervals. Magma temperature is taken as the average of andesitic magma (T0 = 1200 K).As illustrated in Figure 1, Ue is the entrainment rate at the edge of the plume, defined asUe = ↵eU (Morton et al., 1956), which is here function of the column buoyancy relative tothe ambient air, and is expressed as (Kaminski et al., 2005):
↵e =
C
2
+
✓
1� 1
A
◆
Ri, (4)
where Ri = g(⇢a � ⇢)R/⇢aU2 is the Richardson number in the plume, and A and C aredimensionless parameters depending on the flow structure. C is taken as a constant (⇡0.135) whereas A evolves as a function of the downstream distance from the source andbuoyancy (see Appendix A).
To follow the evolution of the density in the plume as a function of entrainment andtemperature variations with height, we use the same constitutive equations as in Woods(1988):
92
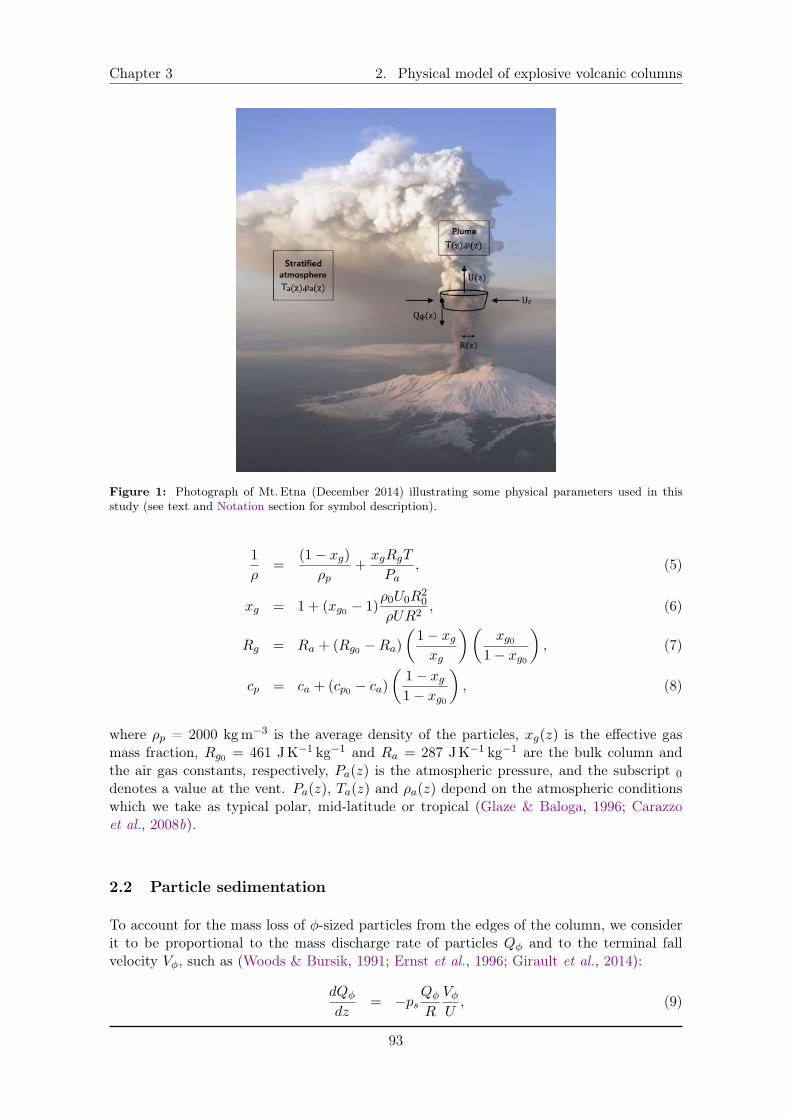
Chapter 3 2. Physical model of explosive volcanic columns
Figure 1: Photograph of Mt. Etna (December 2014) illustrating some physical parameters used in thisstudy (see text and Notation section for symbol description).
1
⇢=
(1� xg)
⇢p+
xgRgT
Pa, (5)
xg = 1 + (xg0 � 1)
⇢0U0R20
⇢UR2, (6)
Rg = Ra + (Rg0 �Ra)
✓
1� xgxg
◆✓
xg01� xg0
◆
, (7)
cp = ca + (cp0 � ca)
✓
1� xg1� xg0
◆
, (8)
where ⇢p = 2000 kgm
�3 is the average density of the particles, xg(z) is the effective gasmass fraction, Rg0 = 461 JK
�1kg
�1 and Ra = 287 JK
�1kg
�1 are the bulk column andthe air gas constants, respectively, Pa(z) is the atmospheric pressure, and the subscript 0
denotes a value at the vent. Pa(z), Ta(z) and ⇢a(z) depend on the atmospheric conditionswhich we take as typical polar, mid-latitude or tropical (Glaze & Baloga, 1996; Carazzoet al., 2008b).
2.2 Particle sedimentation
To account for the mass loss of �-sized particles from the edges of the column, we considerit to be proportional to the mass discharge rate of particles Q� and to the terminal fallvelocity V�, such as (Woods & Bursik, 1991; Ernst et al., 1996; Girault et al., 2014):
dQ�
dz= �ps
Q�
R
V�
U, (9)
93
2. Physical model of explosive volcanic columns Chapter 3
where ps is a probability of sedimentation experimentally determined and taken equal to0.27 ± 0.01 (Ernst et al., 1996; Girault et al., 2014, 2016). For a given particle size, thefallout velocity V� is calculated using the formulae of Bonadonna et al. (1998):
V� =
8
>
>
>
>
>
>
<
>
>
>
>
>
>
:
q
3.1d�
g(⇢p
�⇢)⇢a
for Re� � 500,
d�⇣
4g2(⇢p
�⇢)2
225µ⇢a
⌘1/3for 0.4 Re� 500,
d2�
g(⇢p
�⇢)
18µ for Re� 0.4,
(10)
where d� is the particle diameter of a �-sized particle, µ(z) is the dynamic viscosity of air(Sutherland, 1893), and Re� = ⇢d�V�/µ is the particle Reynolds number.
2.3 Grain-size distribution and amount of gas at the vent
In explosive eruptions, GSD of pyroclasts results from a fragmentation sequence in theconduit before the eruption. The rapid decompression of magma during its ascent causes a“primary” fragmentation (Alibidirov & Dingwell, 1996), which disintegrates bubbly magmainto fragments, then followed by a “secondary” fragmentation of larger fragments into finerash (Kaminski & Jaupart, 1998). During this sequence, magmatic gas separates into twophases: an entrapped one contained in bubbles within the clasts, and a continuous onecarrying fragments and ashes. This latter phase corresponds to the effective amount of“free” gas that has to be considered for the modeling of the turbulent flow. Within thisframework, clast size plays a key role in setting the amount of gas released at fragmentation:large fragments (pumices) retain a larger amount of gas than small fragments (ashes) do.Field data (Kaminski & Jaupart, 1998) and fragmentation experiments (e.g., Kueppers et al.
2006) have shown that volcanic rocks fragment according to a power-law distribution:
N(R�r) = �r�D, (11)
where N(R�r) is the number of fragments of size R larger than or equal to r, � is anormalization constant and D is the power-law exponent.
The two main parameters that control the stability of a volcanic plume are the massdischarge rate and the momentum flow rate at the vent, or, equivalently, the mass dischargerate and exit velocity (Wilson et al., 1978; Woods, 1988; Sparks et al., 1997). Becausethe exit velocity is mainly controlled by the amount of gas in the volcanic mixture, xg0,(e.g., Wilson et al. 1980; Koyaguchi et al. 2010; see Appendix B) the transition between thePlinian and Fountain regimes is often given as a threshold mass discharge rate for a givengas mass fraction. Here, we calculate xg0 as the total fraction of exsolved gas minus theamount of exsolved gas trapped in large particles, using the model of Kaminski & Jaupart(1998, 2001).
If bubbles inside a fragment are not connected to the exterior, the fraction of gas releasedby each fragment is given by V
out
Vgas
=
3br for particle with a radius r larger than 3b, and
Vout
Vgas
= 1 for particles smaller than 3b, where b is the mean bubble radius in the magma.These relationships can then be used to calculate the total gas released at fragmentation(Figure 2a) provided that the TGSD - hence D - is known, as well as the smallest andlargest particle sizes rmin and rmax, and the mean bubble size. As discussed by Kaminski &
94
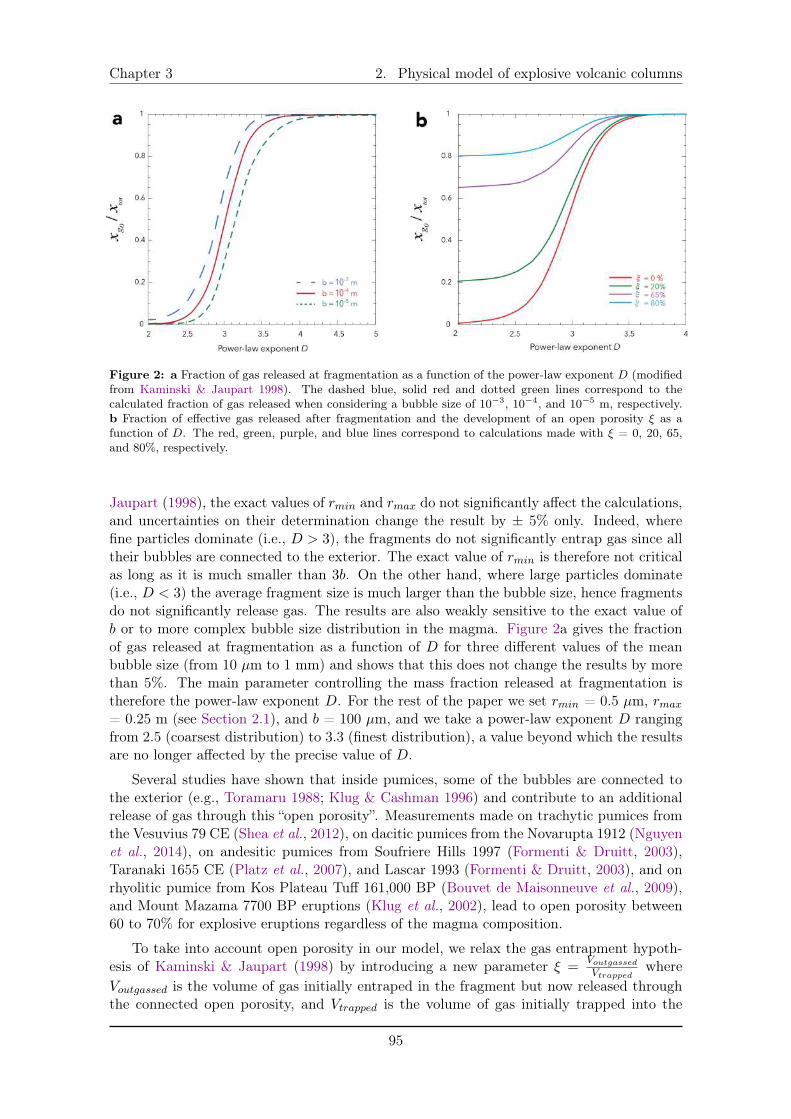
Chapter 3 2. Physical model of explosive volcanic columns
Figure 2: a Fraction of gas released at fragmentation as a function of the power-law exponent D (modifiedfrom Kaminski & Jaupart 1998). The dashed blue, solid red and dotted green lines correspond to thecalculated fraction of gas released when considering a bubble size of 10�3, 10�4, and 10�5 m, respectively.b Fraction of effective gas released after fragmentation and the development of an open porosity ⇠ as afunction of D. The red, green, purple, and blue lines correspond to calculations made with ⇠ = 0, 20, 65,and 80%, respectively.
Jaupart (1998), the exact values of rmin and rmax do not significantly affect the calculations,and uncertainties on their determination change the result by ± 5% only. Indeed, wherefine particles dominate (i.e., D > 3), the fragments do not significantly entrap gas since alltheir bubbles are connected to the exterior. The exact value of rmin is therefore not criticalas long as it is much smaller than 3b. On the other hand, where large particles dominate(i.e., D < 3) the average fragment size is much larger than the bubble size, hence fragmentsdo not significantly release gas. The results are also weakly sensitive to the exact value ofb or to more complex bubble size distribution in the magma. Figure 2a gives the fractionof gas released at fragmentation as a function of D for three different values of the meanbubble size (from 10 µm to 1 mm) and shows that this does not change the results by morethan 5%. The main parameter controlling the mass fraction released at fragmentation istherefore the power-law exponent D. For the rest of the paper we set rmin = 0.5 µm, rmax
= 0.25 m (see Section 2.1), and b = 100 µm, and we take a power-law exponent D rangingfrom 2.5 (coarsest distribution) to 3.3 (finest distribution), a value beyond which the resultsare no longer affected by the precise value of D.
Several studies have shown that inside pumices, some of the bubbles are connected tothe exterior (e.g., Toramaru 1988; Klug & Cashman 1996) and contribute to an additionalrelease of gas through this “open porosity”. Measurements made on trachytic pumices fromthe Vesuvius 79 CE (Shea et al., 2012), on dacitic pumices from the Novarupta 1912 (Nguyenet al., 2014), on andesitic pumices from Soufriere Hills 1997 (Formenti & Druitt, 2003),Taranaki 1655 CE (Platz et al., 2007), and Lascar 1993 (Formenti & Druitt, 2003), and onrhyolitic pumice from Kos Plateau Tuff 161,000 BP (Bouvet de Maisonneuve et al., 2009),and Mount Mazama 7700 BP eruptions (Klug et al., 2002), lead to open porosity between60 to 70% for explosive eruptions regardless of the magma composition.
To take into account open porosity in our model, we relax the gas entrapment hypoth-esis of Kaminski & Jaupart (1998) by introducing a new parameter ⇠ =
Voutgassed
Vtrapped
whereVoutgassed is the volume of gas initially entraped in the fragment but now released throughthe connected open porosity, and Vtrapped is the volume of gas initially trapped into the
95
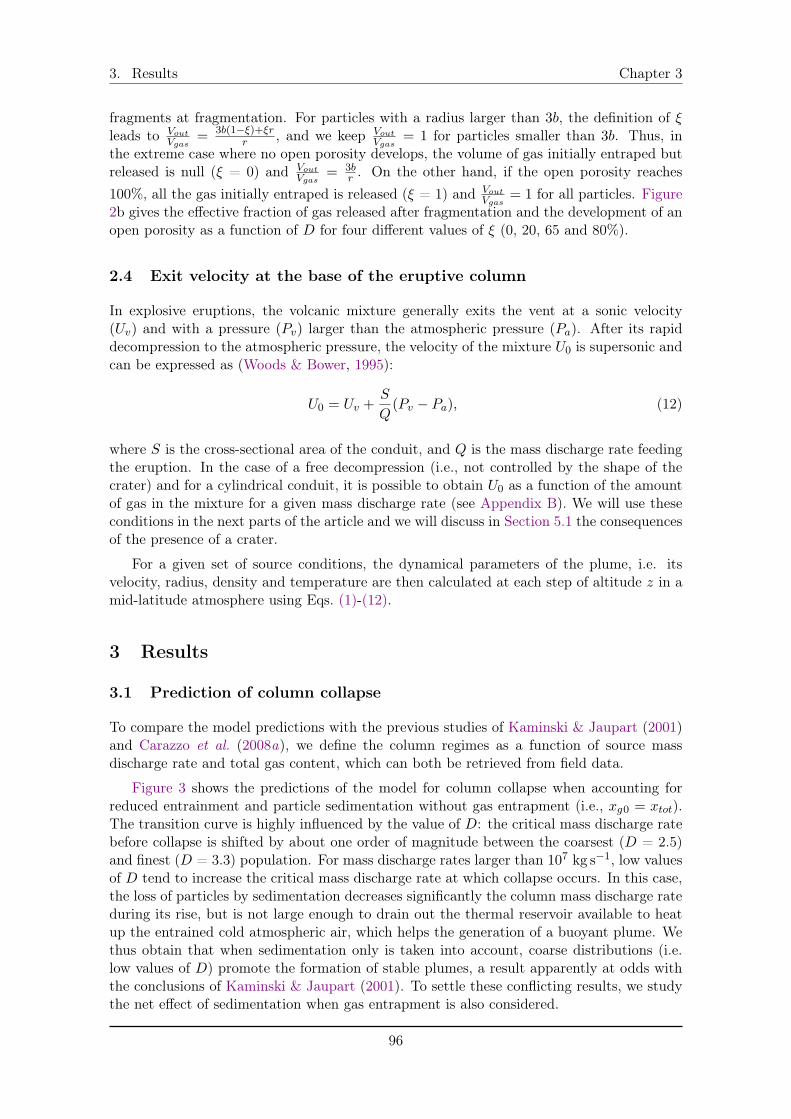
3. Results Chapter 3
fragments at fragmentation. For particles with a radius larger than 3b, the definition of ⇠leads to V
out
Vgas
=
3b(1�⇠)+⇠rr , and we keep V
out
Vgas
= 1 for particles smaller than 3b. Thus, inthe extreme case where no open porosity develops, the volume of gas initially entraped butreleased is null (⇠ = 0) and V
out
Vgas
=
3br . On the other hand, if the open porosity reaches
100%, all the gas initially entraped is released (⇠ = 1) and Vout
Vgas
= 1 for all particles. Figure2b gives the effective fraction of gas released after fragmentation and the development of anopen porosity as a function of D for four different values of ⇠ (0, 20, 65 and 80%).
2.4 Exit velocity at the base of the eruptive column
In explosive eruptions, the volcanic mixture generally exits the vent at a sonic velocity(Uv) and with a pressure (Pv) larger than the atmospheric pressure (Pa). After its rapiddecompression to the atmospheric pressure, the velocity of the mixture U0 is supersonic andcan be expressed as (Woods & Bower, 1995):
U0 = Uv +S
Q(Pv � Pa), (12)
where S is the cross-sectional area of the conduit, and Q is the mass discharge rate feedingthe eruption. In the case of a free decompression (i.e., not controlled by the shape of thecrater) and for a cylindrical conduit, it is possible to obtain U0 as a function of the amountof gas in the mixture for a given mass discharge rate (see Appendix B). We will use theseconditions in the next parts of the article and we will discuss in Section 5.1 the consequencesof the presence of a crater.
For a given set of source conditions, the dynamical parameters of the plume, i.e. itsvelocity, radius, density and temperature are then calculated at each step of altitude z in amid-latitude atmosphere using Eqs. (1)-(12).
3 Results
3.1 Prediction of column collapse
To compare the model predictions with the previous studies of Kaminski & Jaupart (2001)and Carazzo et al. (2008a), we define the column regimes as a function of source massdischarge rate and total gas content, which can both be retrieved from field data.
Figure 3 shows the predictions of the model for column collapse when accounting forreduced entrainment and particle sedimentation without gas entrapment (i.e., xg0 = xtot).The transition curve is highly influenced by the value of D: the critical mass discharge ratebefore collapse is shifted by about one order of magnitude between the coarsest (D = 2.5)and finest (D = 3.3) population. For mass discharge rates larger than 10
7kg s
�1, low valuesof D tend to increase the critical mass discharge rate at which collapse occurs. In this case,the loss of particles by sedimentation decreases significantly the column mass discharge rateduring its rise, but is not large enough to drain out the thermal reservoir available to heatup the entrained cold atmospheric air, which helps the generation of a buoyant plume. Wethus obtain that when sedimentation only is taken into account, coarse distributions (i.e.low values of D) promote the formation of stable plumes, a result apparently at odds withthe conclusions of Kaminski & Jaupart (2001). To settle these conflicting results, we studythe net effect of sedimentation when gas entrapment is also considered.
96
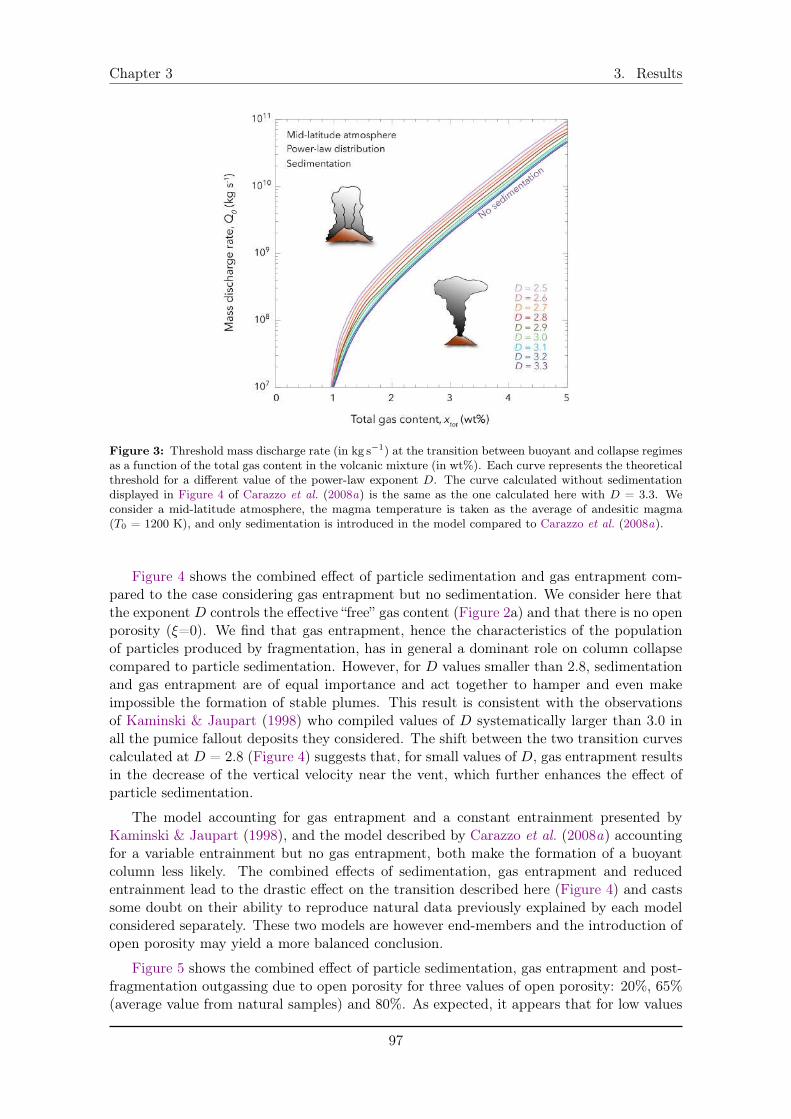
Chapter 3 3. Results
Figure 3: Threshold mass discharge rate (in kg s�1) at the transition between buoyant and collapse regimesas a function of the total gas content in the volcanic mixture (in wt%). Each curve represents the theoreticalthreshold for a different value of the power-law exponent D. The curve calculated without sedimentationdisplayed in Figure 4 of Carazzo et al. (2008a) is the same as the one calculated here with D = 3.3. Weconsider a mid-latitude atmosphere, the magma temperature is taken as the average of andesitic magma(T0 = 1200 K), and only sedimentation is introduced in the model compared to Carazzo et al. (2008a).
Figure 4 shows the combined effect of particle sedimentation and gas entrapment com-pared to the case considering gas entrapment but no sedimentation. We consider here thatthe exponent D controls the effective “free” gas content (Figure 2a) and that there is no openporosity (⇠=0). We find that gas entrapment, hence the characteristics of the populationof particles produced by fragmentation, has in general a dominant role on column collapsecompared to particle sedimentation. However, for D values smaller than 2.8, sedimentationand gas entrapment are of equal importance and act together to hamper and even makeimpossible the formation of stable plumes. This result is consistent with the observationsof Kaminski & Jaupart (1998) who compiled values of D systematically larger than 3.0 inall the pumice fallout deposits they considered. The shift between the two transition curvescalculated at D = 2.8 (Figure 4) suggests that, for small values of D, gas entrapment resultsin the decrease of the vertical velocity near the vent, which further enhances the effect ofparticle sedimentation.
The model accounting for gas entrapment and a constant entrainment presented byKaminski & Jaupart (1998), and the model described by Carazzo et al. (2008a) accountingfor a variable entrainment but no gas entrapment, both make the formation of a buoyantcolumn less likely. The combined effects of sedimentation, gas entrapment and reducedentrainment lead to the drastic effect on the transition described here (Figure 4) and castssome doubt on their ability to reproduce natural data previously explained by each modelconsidered separately. These two models are however end-members and the introduction ofopen porosity may yield a more balanced conclusion.
Figure 5 shows the combined effect of particle sedimentation, gas entrapment and post-fragmentation outgassing due to open porosity for three values of open porosity: 20%, 65%(average value from natural samples) and 80%. As expected, it appears that for low values
97
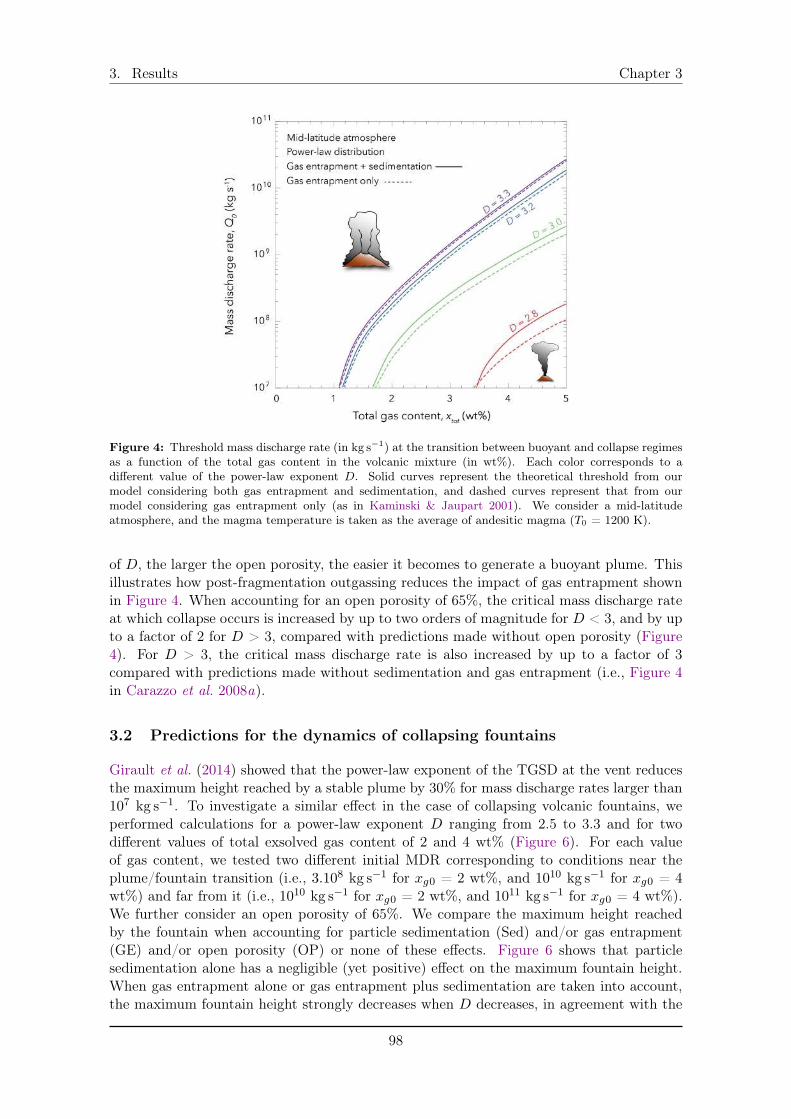
3. Results Chapter 3
Figure 4: Threshold mass discharge rate (in kg s�1) at the transition between buoyant and collapse regimesas a function of the total gas content in the volcanic mixture (in wt%). Each color corresponds to adifferent value of the power-law exponent D. Solid curves represent the theoretical threshold from ourmodel considering both gas entrapment and sedimentation, and dashed curves represent that from ourmodel considering gas entrapment only (as in Kaminski & Jaupart 2001). We consider a mid-latitudeatmosphere, and the magma temperature is taken as the average of andesitic magma (T0 = 1200 K).
of D, the larger the open porosity, the easier it becomes to generate a buoyant plume. Thisillustrates how post-fragmentation outgassing reduces the impact of gas entrapment shownin Figure 4. When accounting for an open porosity of 65%, the critical mass discharge rateat which collapse occurs is increased by up to two orders of magnitude for D < 3, and by upto a factor of 2 for D > 3, compared with predictions made without open porosity (Figure4). For D > 3, the critical mass discharge rate is also increased by up to a factor of 3compared with predictions made without sedimentation and gas entrapment (i.e., Figure 4in Carazzo et al. 2008a).
3.2 Predictions for the dynamics of collapsing fountains
Girault et al. (2014) showed that the power-law exponent of the TGSD at the vent reducesthe maximum height reached by a stable plume by 30% for mass discharge rates larger than10
7kg s
�1. To investigate a similar effect in the case of collapsing volcanic fountains, weperformed calculations for a power-law exponent D ranging from 2.5 to 3.3 and for twodifferent values of total exsolved gas content of 2 and 4 wt% (Figure 6). For each valueof gas content, we tested two different initial MDR corresponding to conditions near theplume/fountain transition (i.e., 3.108 kg s
�1 for xg0 = 2 wt%, and 10
10kg s
�1 for xg0 = 4wt%) and far from it (i.e., 1010 kg s
�1 for xg0 = 2 wt%, and 10
11kg s
�1 for xg0 = 4 wt%).We further consider an open porosity of 65%. We compare the maximum height reachedby the fountain when accounting for particle sedimentation (Sed) and/or gas entrapment(GE) and/or open porosity (OP) or none of these effects. Figure 6 shows that particlesedimentation alone has a negligible (yet positive) effect on the maximum fountain height.When gas entrapment alone or gas entrapment plus sedimentation are taken into account,the maximum fountain height strongly decreases when D decreases, in agreement with the
98
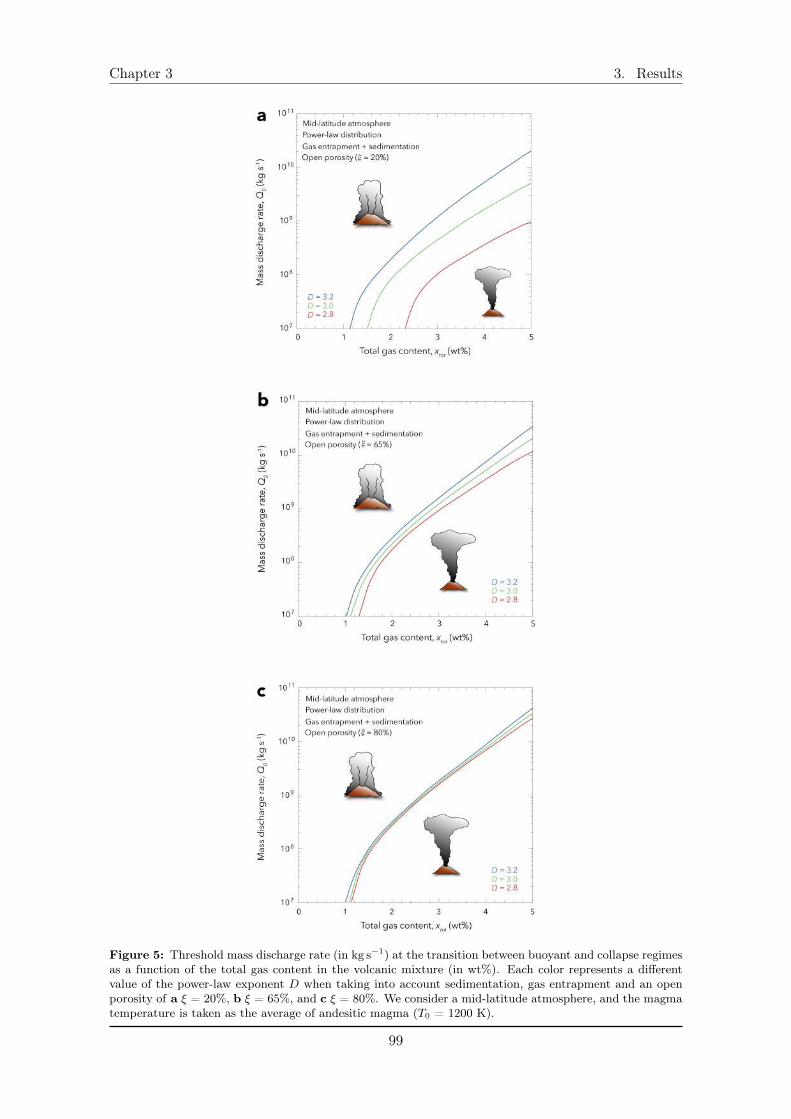
Chapter 3 3. Results
Figure 5: Threshold mass discharge rate (in kg s�1) at the transition between buoyant and collapse regimesas a function of the total gas content in the volcanic mixture (in wt%). Each color represents a differentvalue of the power-law exponent D when taking into account sedimentation, gas entrapment and an openporosity of a ⇠ = 20%, b ⇠ = 65%, and c ⇠ = 80%. We consider a mid-latitude atmosphere, and the magmatemperature is taken as the average of andesitic magma (T0 = 1200 K).
99
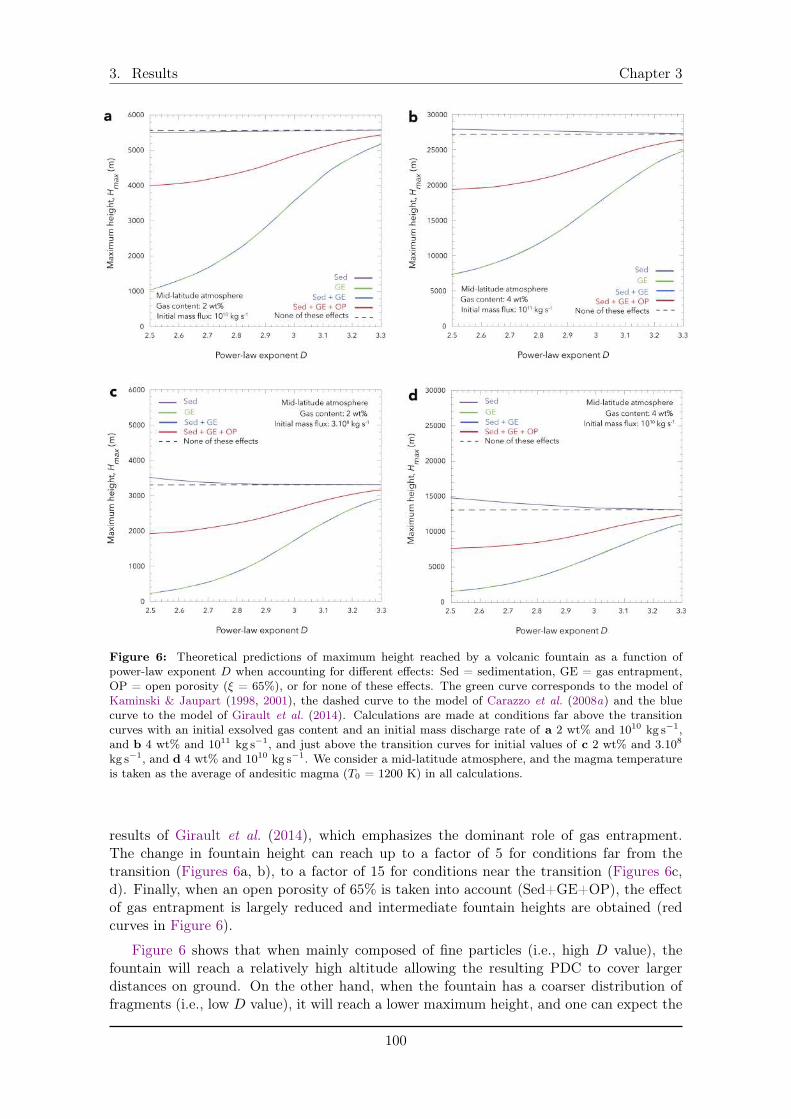
3. Results Chapter 3
Figure 6: Theoretical predictions of maximum height reached by a volcanic fountain as a function ofpower-law exponent D when accounting for different effects: Sed = sedimentation, GE = gas entrapment,OP = open porosity (⇠ = 65%), or for none of these effects. The green curve corresponds to the model ofKaminski & Jaupart (1998, 2001), the dashed curve to the model of Carazzo et al. (2008a) and the bluecurve to the model of Girault et al. (2014). Calculations are made at conditions far above the transitioncurves with an initial exsolved gas content and an initial mass discharge rate of a 2 wt% and 1010 kg s�1,and b 4 wt% and 1011 kg s�1, and just above the transition curves for initial values of c 2 wt% and 3.108
kg s�1, and d 4 wt% and 1010 kg s�1. We consider a mid-latitude atmosphere, and the magma temperatureis taken as the average of andesitic magma (T0 = 1200 K) in all calculations.
results of Girault et al. (2014), which emphasizes the dominant role of gas entrapment.The change in fountain height can reach up to a factor of 5 for conditions far from thetransition (Figures 6a, b), to a factor of 15 for conditions near the transition (Figures 6c,d). Finally, when an open porosity of 65% is taken into account (Sed+GE+OP), the effectof gas entrapment is largely reduced and intermediate fountain heights are obtained (redcurves in Figure 6).
Figure 6 shows that when mainly composed of fine particles (i.e., high D value), thefountain will reach a relatively high altitude allowing the resulting PDC to cover largerdistances on ground. On the other hand, when the fountain has a coarser distribution offragments (i.e., low D value), it will reach a lower maximum height, and one can expect the
100
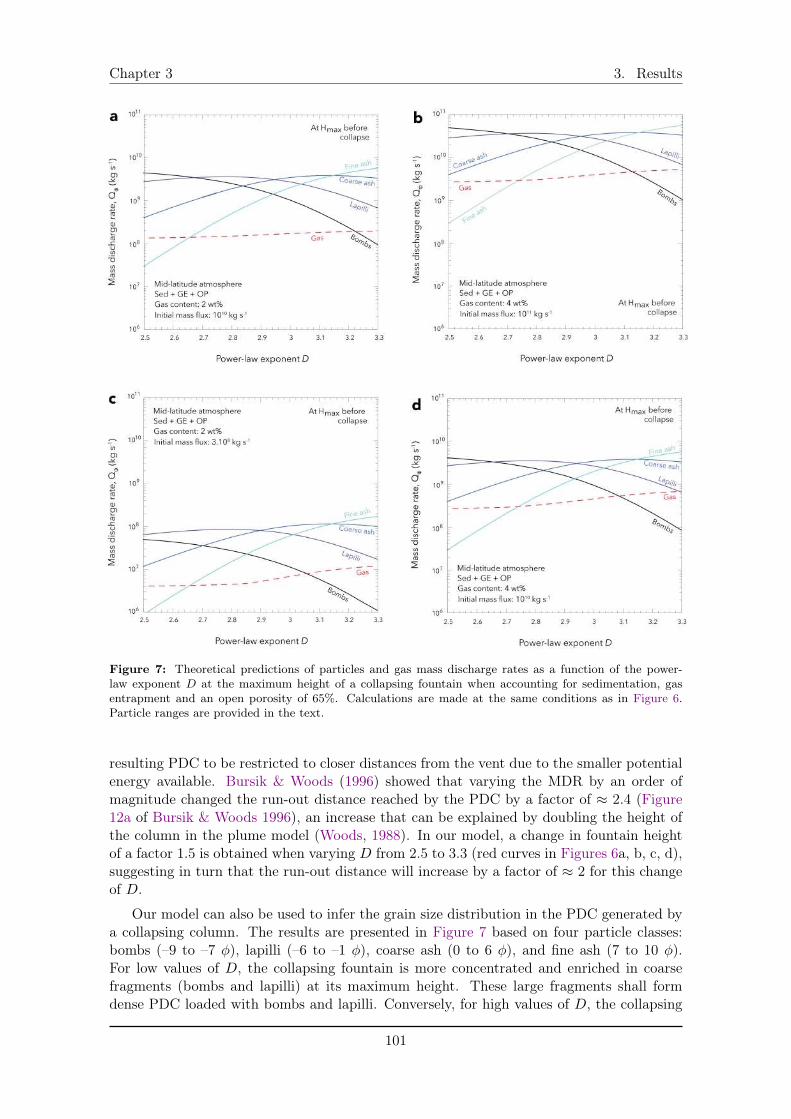
Chapter 3 3. Results
Figure 7: Theoretical predictions of particles and gas mass discharge rates as a function of the power-law exponent D at the maximum height of a collapsing fountain when accounting for sedimentation, gasentrapment and an open porosity of 65%. Calculations are made at the same conditions as in Figure 6.Particle ranges are provided in the text.
resulting PDC to be restricted to closer distances from the vent due to the smaller potentialenergy available. Bursik & Woods (1996) showed that varying the MDR by an order ofmagnitude changed the run-out distance reached by the PDC by a factor of ⇡ 2.4 (Figure12a of Bursik & Woods 1996), an increase that can be explained by doubling the height ofthe column in the plume model (Woods, 1988). In our model, a change in fountain heightof a factor 1.5 is obtained when varying D from 2.5 to 3.3 (red curves in Figures 6a, b, c, d),suggesting in turn that the run-out distance will increase by a factor of ⇡ 2 for this changeof D.
Our model can also be used to infer the grain size distribution in the PDC generated bya collapsing column. The results are presented in Figure 7 based on four particle classes:bombs (–9 to –7 �), lapilli (–6 to –1 �), coarse ash (0 to 6 �), and fine ash (7 to 10 �).For low values of D, the collapsing fountain is more concentrated and enriched in coarsefragments (bombs and lapilli) at its maximum height. These large fragments shall formdense PDC loaded with bombs and lapilli. Conversely, for high values of D, the collapsing
101
4. Comparison with natural cases Chapter 3
fountain is mainly made of fine ash particles at its maximum height, which will producedilute PDC mostly made of coarse and fine ash particles. Varying the initial gas content andthe MDR feeding the fountain does not affect these conclusions (Figure 7), suggesting thatD has a major control on the population of particles in the PDC produced during columncollapse.
4 Comparison with natural cases
We now compare our model predictions with historical eruptions providing well-constrainedvalues of gas contents, MDR and power-law exponent D. There are however only a fewexamples of such well-documented events, and here we choose two famous historical ones:the ⇡186 CE Taupo and the 79 CE Vesuvius eruptions. All the available geological dataare summarized in Table 1.
4.1 The ⇡186 CE Taupo eruption
The Taupo eruptive episode consists of a series of Plinian and phreato-Plinian eruptions(Walker, 1980; Froggatt, 1981; Talbot et al., 1994; Wilson, 1985, 1993; Wilson & Walker,1985; Houghton et al., 2014). The stratigraphic sequence starts with a phreato-Plinian ashlayer (Y1) overlain by a Plinian fallout (Y2 or Hatepe), and two phreato-Plinian ash layers(Y3 and Y4 or Rotongaio). The main sequence corresponds to a Plinian fallout deposit (Y5or Taupo Plinian pumice) interbedded with intraplinian ignimbrites (Y6 or early ignimbriteflow units) and covered by PDC deposits (Y7 or Taupo ignimbrite). Here, we focus on theY2, Y5-6 and Y7 phases as they represent the transition between Plinian, transitional, andcollapse regimes, respectively. During these phases, the MDR increases from 1.8⇥10
8kg s
�1
during Y2 (Carey & Sigurdsson, 1989) to 2⇥ 10
9kg s
�1 during Y5/6 (Carey & Sigurdsson,1989; Houghton et al., 2014; Carazzo et al., 2015), and to 1.4 ⇥ 10
10kg s
�1 during Y7(Carey & Sigurdsson, 1989; Bursik & Woods, 1996). These values have been debated in theliterature. Here we retain average values for Y2, Y5/6 and Y7, and we use the minimumand maximum MDR proposed in the literature to estimate an error bar in Figure 8 (seeTable 1).
Dunbar & Kyle (1993) estimated the dissolved water content to 4.3 ± 0.5 wt% for theY2 and Y5-6 phases and to 3.6 ± 0.5 wt% for the last collapsing phase Y7. We correctthese values for the presence of crystals and lithic fragments, which do not contain volatiles(Kaminski & Jaupart, 2001). Considering a proportion of crystals and lithics contents of20% (Dunbar et al., 1989) and assuming complete degassing, we deduce a total gas massfraction in the mixture of 3.44 ± 0.4 wt% for both the Y2 and Y5-6 phases and 2.88 ±0.4 wt% for the Y7 phase. The power-law exponent D is taken to be 3.2, as calculated byKaminski & Jaupart (1998), the magma temperature is set to 1133 K, as measured by Shane(1998), and the exit velocity is set to 306 ± 10 ms
�1, as determined from the isopleth mapsof the transitional phase Y5-6 (Walker, 1980). We note that using the power-law exponentD = 3.2 and an open porosity of 60-70% gives x
g0
xtot
⇡ 0.94 (Figure 2b) hence a small neteffect of gas entrapment. Together with the total gas mass fraction of 3.44 wt%, this valuegives a calculated exit velocity of 275 ± 5 ms
�1 for the Y5-6 phase (Appendix B), which isconsistent with the exit velocity constrained from the distribution of lithic fragments.
Figure 8 compares the eruptive parameters inferred for the Taupo eruption (i.e., massdischarge rate and total gas content) and the transition between the stable plumes and thecollapsing fountains predicted when considering particle sedimentation, gas entrapment and
102
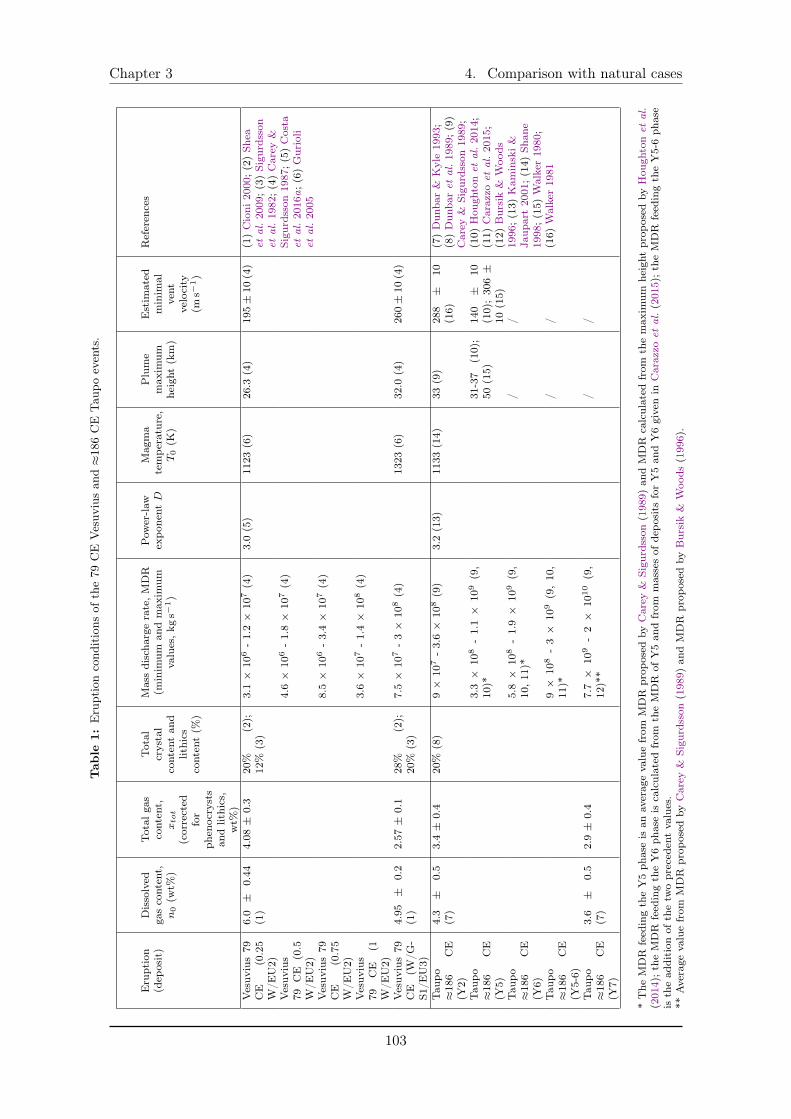
Chapter 3 4. Comparison with natural casesTable
1:
Eru
ptio
nco
ndit
ions
ofth
e79
CE
Ves
uviu
san
d⇡
186
CE
Taup
oev
ents
.
Eru
ptio
n(d
epos
it)
Dis
solv
edga
sco
nten
t,n0
(wt%
)
Tot
alga
sco
nten
t,xtot
(cor
rect
edfo
rph
enoc
ryst
san
dlit
hics
,w
t%)
Tot
alcr
ysta
lco
nten
tan
dlit
hics
cont
ent
(%)
Mas
sdi
scha
rge
rate
,M
DR
(min
imum
and
max
imum
valu
es,kgs�
1)
Pow
er-law
expo
nent
DM
agm
ate
mpe
ratu
re,
T0
(K)
Plu
me
max
imum
heig
ht(k
m)
Est
imat
edm
inim
alve
ntve
loci
ty(m
s�1)
Ref
eren
ces
Ves
uviu
s79
CE
(0.2
5W
/EU
2)
6.0
±0.
44(1
)4.
08±
0.3
20%
(2);
12%
(3)
3.1⇥
106
-1.
2⇥
107
(4)
3.0
(5)
1123
(6)
26.3
(4)
195±
10(4
)(1
)C
ioni
2000
;(2
)Sh
eaet
al.20
09;(3
)Si
gurd
sson
etal
.19
82;(4
)C
arey
&Si
gurd
sson
1987
;(5
)C
osta
etal
.20
16a;
(6)
Gur
ioli
etal
.20
05
Ves
uviu
s79
CE
(0.5
W/E
U2)
4.6⇥
106
-1.
8⇥
107
(4)
Ves
uviu
s79
CE
(0.7
5W
/EU
2)
8.5⇥
106
-3.
4⇥
107
(4)
Ves
uviu
s79
CE
(1W
/EU
2)
3.6⇥
107
-1.
4⇥
108
(4)
Ves
uviu
s79
CE
(W/G
-S1
/EU
3)
4.95
±0.
2(1
)2.
57±
0.1
28%
(2);
20%
(3)
7.5⇥
107
-3⇥
108
(4)
1323
(6)
32.0
(4)
260±
10(4
)
Tau
po⇡
186
CE
(Y2)
4.3
±0.
5(7
)3.
4±
0.4
20%
(8)
9⇥
107
-3.
6⇥
108
(9)
3.2
(13)
1133
(14)
33(9
)28
8±
10(1
6)(7
)D
unba
r&
Kyl
e19
93;
(8)
Dun
bar
etal
.19
89;(9
)C
arey
&Si
gurd
sson
1989
;(1
0)H
ough
ton
etal
.20
14;
(11)
Car
azzo
etal
.20
15;
(12)
Bur
sik
&W
oods
1996
;(1
3)K
amin
ski&
Jaup
art
2001
;(1
4)Sh
ane
1998
;(1
5)W
alke
r19
80;
(16)
Wal
ker
1981
Tau
po⇡
186
CE
(Y5)
3.3
⇥108
-1.
1⇥
109
(9,
10)*
31-3
7(1
0);
50(1
5)14
0±
10(1
0);
306±
10(1
5)Tau
po⇡
186
CE
(Y6)
5.8
⇥108
-1.
9⇥
109
(9,
10,11
)*/
/
Tau
po⇡
186
CE
(Y5-
6)
9⇥
108
-3⇥
109
(9,
10,
11)*
//
Tau
po⇡
186
CE
(Y7)
3.6
±0.
5(7
)2.
9±
0.4
7.7
⇥109
-2
⇥1010
(9,
12)*
*/
/
*T
heM
DR
feed
ing
the
Y5
phas
eis
anav
erag
eva
lue
from
MD
Rpr
opos
edby
Car
ey&
Sigu
rdss
on(1
989)
and
MD
Rca
lcul
ated
from
the
max
imum
heig
htpr
opos
edby
Hou
ghto
net
al.
(201
4);th
eM
DR
feed
ing
the
Y6
phas
eis
calc
ulat
edfr
omth
eM
DR
ofY
5an
dfr
omm
asse
sof
depo
sits
for
Y5
and
Y6
give
nin
Car
azzo
etal
.(2
015)
;th
eM
DR
feed
ing
the
Y5-
6ph
ase
isth
ead
dition
ofth
etw
opr
eced
ent
valu
es.
**Ave
rage
valu
efr
omM
DR
prop
osed
byC
arey
&Si
gurd
sson
(198
9)an
dM
DR
prop
osed
byB
ursi
k&
Woo
ds(1
996)
.
103
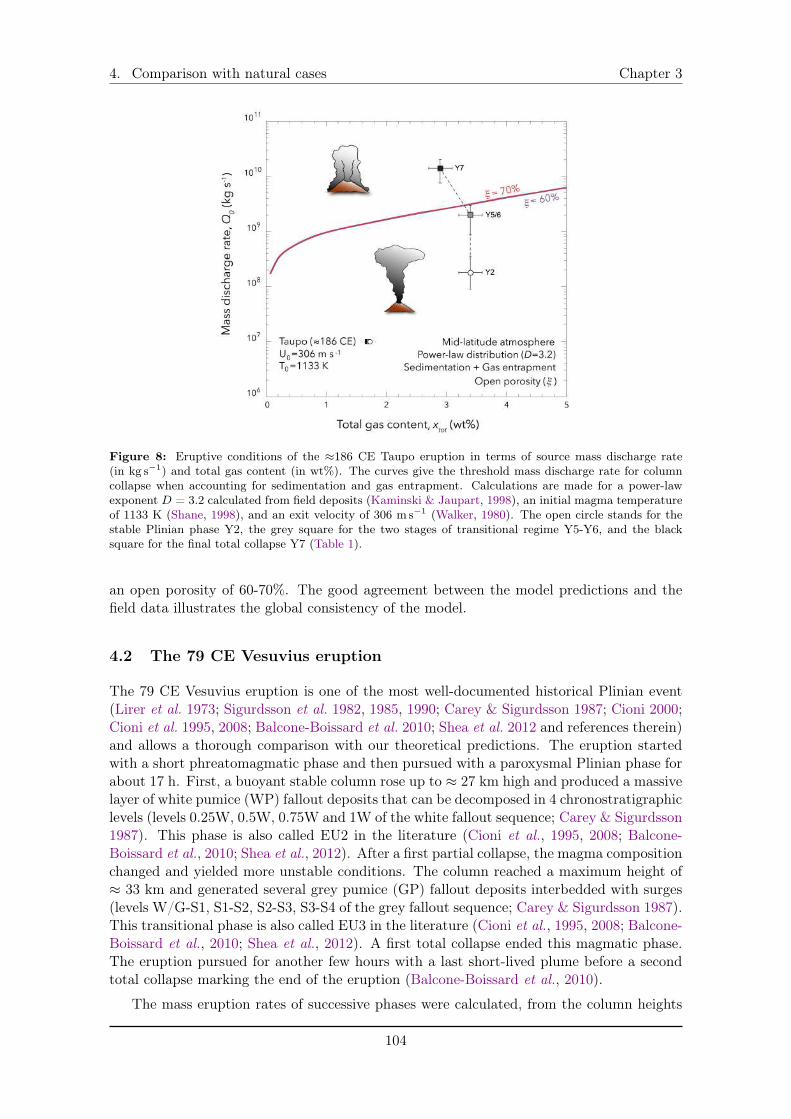
4. Comparison with natural cases Chapter 3
Figure 8: Eruptive conditions of the ⇡186 CE Taupo eruption in terms of source mass discharge rate(in kg s�1) and total gas content (in wt%). The curves give the threshold mass discharge rate for columncollapse when accounting for sedimentation and gas entrapment. Calculations are made for a power-lawexponent D = 3.2 calculated from field deposits (Kaminski & Jaupart, 1998), an initial magma temperatureof 1133 K (Shane, 1998), and an exit velocity of 306 ms�1 (Walker, 1980). The open circle stands for thestable Plinian phase Y2, the grey square for the two stages of transitional regime Y5-Y6, and the blacksquare for the final total collapse Y7 (Table 1).
an open porosity of 60-70%. The good agreement between the model predictions and thefield data illustrates the global consistency of the model.
4.2 The 79 CE Vesuvius eruption
The 79 CE Vesuvius eruption is one of the most well-documented historical Plinian event(Lirer et al. 1973; Sigurdsson et al. 1982, 1985, 1990; Carey & Sigurdsson 1987; Cioni 2000;Cioni et al. 1995, 2008; Balcone-Boissard et al. 2010; Shea et al. 2012 and references therein)and allows a thorough comparison with our theoretical predictions. The eruption startedwith a short phreatomagmatic phase and then pursued with a paroxysmal Plinian phase forabout 17 h. First, a buoyant stable column rose up to ⇡ 27 km high and produced a massivelayer of white pumice (WP) fallout deposits that can be decomposed in 4 chronostratigraphiclevels (levels 0.25W, 0.5W, 0.75W and 1W of the white fallout sequence; Carey & Sigurdsson1987). This phase is also called EU2 in the literature (Cioni et al., 1995, 2008; Balcone-Boissard et al., 2010; Shea et al., 2012). After a first partial collapse, the magma compositionchanged and yielded more unstable conditions. The column reached a maximum height of⇡ 33 km and generated several grey pumice (GP) fallout deposits interbedded with surges(levels W/G-S1, S1-S2, S2-S3, S3-S4 of the grey fallout sequence; Carey & Sigurdsson 1987).This transitional phase is also called EU3 in the literature (Cioni et al., 1995, 2008; Balcone-Boissard et al., 2010; Shea et al., 2012). A first total collapse ended this magmatic phase.The eruption pursued for another few hours with a last short-lived plume before a secondtotal collapse marking the end of the eruption (Balcone-Boissard et al., 2010).
The mass eruption rates of successive phases were calculated, from the column heights
104
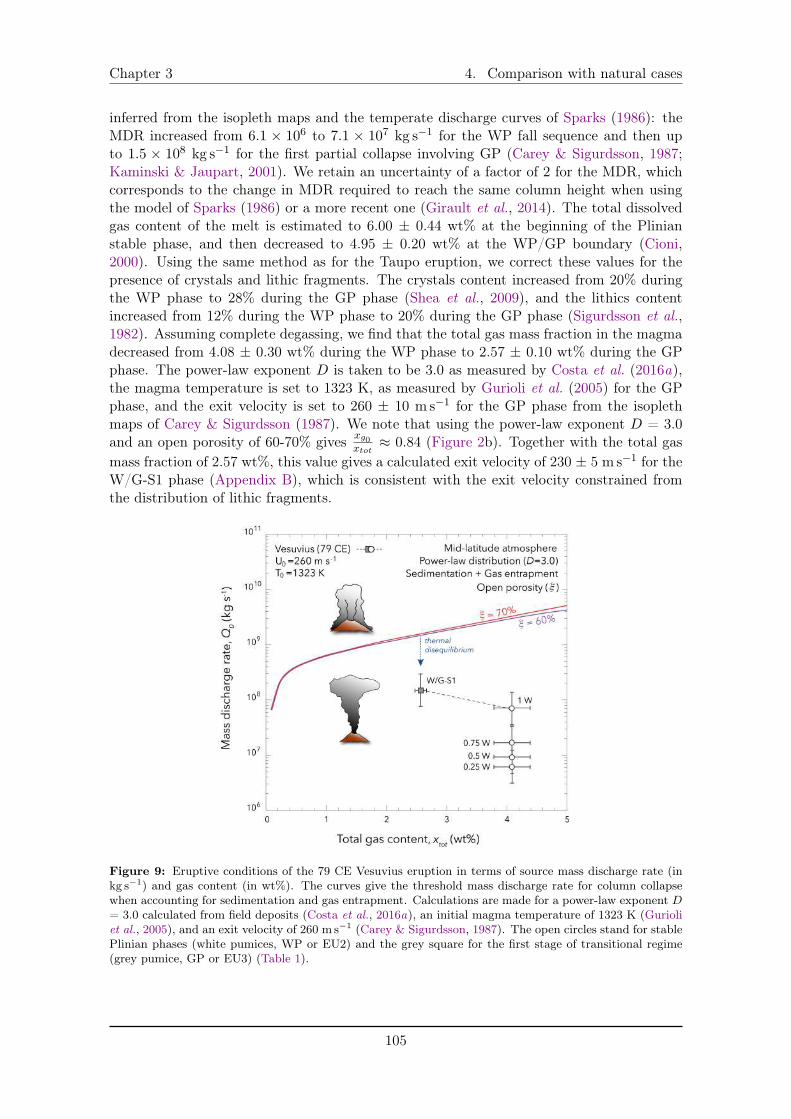
Chapter 3 4. Comparison with natural cases
inferred from the isopleth maps and the temperate discharge curves of Sparks (1986): theMDR increased from 6.1 ⇥ 10
6 to 7.1 ⇥ 10
7kg s
�1 for the WP fall sequence and then upto 1.5 ⇥ 10
8kg s
�1 for the first partial collapse involving GP (Carey & Sigurdsson, 1987;Kaminski & Jaupart, 2001). We retain an uncertainty of a factor of 2 for the MDR, whichcorresponds to the change in MDR required to reach the same column height when usingthe model of Sparks (1986) or a more recent one (Girault et al., 2014). The total dissolvedgas content of the melt is estimated to 6.00 ± 0.44 wt% at the beginning of the Plinianstable phase, and then decreased to 4.95 ± 0.20 wt% at the WP/GP boundary (Cioni,2000). Using the same method as for the Taupo eruption, we correct these values for thepresence of crystals and lithic fragments. The crystals content increased from 20% duringthe WP phase to 28% during the GP phase (Shea et al., 2009), and the lithics contentincreased from 12% during the WP phase to 20% during the GP phase (Sigurdsson et al.,1982). Assuming complete degassing, we find that the total gas mass fraction in the magmadecreased from 4.08 ± 0.30 wt% during the WP phase to 2.57 ± 0.10 wt% during the GPphase. The power-law exponent D is taken to be 3.0 as measured by Costa et al. (2016a),the magma temperature is set to 1323 K, as measured by Gurioli et al. (2005) for the GPphase, and the exit velocity is set to 260 ± 10 ms
�1 for the GP phase from the isoplethmaps of Carey & Sigurdsson (1987). We note that using the power-law exponent D = 3.0and an open porosity of 60-70% gives x
g0xtot
⇡ 0.84 (Figure 2b). Together with the total gasmass fraction of 2.57 wt%, this value gives a calculated exit velocity of 230 ± 5 ms
�1 for theW/G-S1 phase (Appendix B), which is consistent with the exit velocity constrained fromthe distribution of lithic fragments.
Figure 9: Eruptive conditions of the 79 CE Vesuvius eruption in terms of source mass discharge rate (inkg s�1) and gas content (in wt%). The curves give the threshold mass discharge rate for column collapsewhen accounting for sedimentation and gas entrapment. Calculations are made for a power-law exponent D= 3.0 calculated from field deposits (Costa et al., 2016a), an initial magma temperature of 1323 K (Gurioliet al., 2005), and an exit velocity of 260 ms�1 (Carey & Sigurdsson, 1987). The open circles stand for stablePlinian phases (white pumices, WP or EU2) and the grey square for the first stage of transitional regime(grey pumice, GP or EU3) (Table 1).
105
5. Discussion Chapter 3
Figure 9 compares the eruptive parameters inferred for the Vesuvius eruption (i.e., massdischarge rate and total gas content) and the transition between the stable plumes and thecollapsing fountains predicted when considering particle sedimentation, gas entrapment andan open porosity of 60-70%. The model fails to reproduce the conditions of the transitionbetween the Plinian stable regime of the WP fallout sequence and the collapse regime atthe beginning of the GP fallout sequence. As all the model parameters are set by thefield constraints, they cannot be tuned to improve the model predictions. However, wenote that field deposits from this eruption are characterized by a power-law exponent D= 3.0, a D value that defines the transition between a population dominated by coarserfragments (i.e., D < 3) and a population dominated by ash (i.e., D > 3). We suggest thatthe hypothesis of thermal equilibrium has to be reconsidered for D = 3.0. For D > 3, theash particles dominating the population are small enough to remain in thermal equilibrium(Woods & Bursik, 1991). For D < 3, coarse pumices rapidly settle to the ground leavingfine and coarse ash particles in thermal equilibrium in the column. For D = 3.0, thereis no dominant population: the average size of the fragments is intermediate between fineash and lapilli fragments, and is too large to ensure perfect thermal equilibrium. In thatcase column collapse is favored and the critical mass discharge rate before collapse can bereduced by up to an order of magnitude (Figure 5 of Woods & Bursik 1991), which wouldshift the theoretical predictions towards a better agreement with field data from the 79 CEVesuvius eruption.
5 Discussion
5.1 The effect of crater shape on exit velocity
Gas entrapment – more or less modulated by the open porosity - reduces the amount of gasin the mixture and, in turn, the vertical velocity at the base of the plume. The presenceof a crater with a specific shape can similarly reduce the velocity at the base of the plume(Woods & Bower, 1995; Koyaguchi et al., 2010), and it is always possible to define a cratershape that will perfectly mimic the effect of gas entrapment. As field data provide onlyconstraints on the exit velocity, it is not possible to decide which model should be chosen.Overall, both decompression in a crater and gas entrapment can occur during an eruptionand act together to set the conditions for collapse. In the case of the Taupo eruption, theglobal consistency between our model predictions with gas entrapment and open porosityand field data can be taken as a strong argument in favor of this framework. Adding acrater constraining decompression in the case of Taupo will actually decrease the agreementbetween model predictions and the data. In the case of Vesuvius, our model does not predictcorrectly the transition, but the predictions would not be changed if a crater is added asthe exit velocity will remain constrained by the lithics.
5.2 Effect of wind on column collapse
The presence of wind can affect the plume dynamics and stability (Bursik, 2001; Degruyter& Bonadonna, 2013; Woodhouse et al., 2013; Suzuki & Koyaguchi, 2013, 2015; Mastin, 2014;Girault et al., 2016). Thereotical and numerical studies show that for high MDR and/orlow wind velocity, the volcanic column forms a strong plume not affected by the windfield (Bonadonna & Phillips, 2003). For low MDR and/or high wind velocity, the volcanicplume trajectory is strongly controlled by the wind strength and direction, and the volcanic
106
Chapter 3 6. Conclusions
column forms a weak bended plume (Bursik, 2001). The critical MDR before collapse isalso strongly increased by a crosswind relative to no wind conditions, thus promoting theformation of a stable plume (Degruyter & Bonadonna, 2013; Girault et al., 2016). Giraultet al. (2016) showed that this effect is more pronounced for small MDR when D < 3 than forlarge MDR when D > 3, and that it strongly depends on the shape of the wind profile. Theincorporation of crosswind in our model would thus requires to exactly know the shape ofthe wind profile, a parameter that is unknown for historical eruptions, and to parameterizethe turbulent entrainment coefficient due to wind (commonly named �). The latter iscurrently unconstrained from laboratory experiments (Costa et al., 2016b), and its relationwith the turbulent entrainment coefficient ↵ still remains unclear (Aubry et al., 2017b,a).We therefore consider that a systematic study of this effect remains outside the scope of thepresent study.
We however check the validity of our no wind model when applied to the two historicaleruptions considered here, using the method of Carazzo et al. (2014) to estimate the impactof wind on the plume dynamics. According to the isopleths maps determined from fielddata, the maximum wind velocity reached about 28 ms
�1 during the WP phase of the 79CE Vesuvius eruption, 31 ms
�1 during the GP phase (Carey & Sigurdsson, 1987), and 27ms
�1 during the ⇡186 CE Taupo eruption (Carey & Sparks, 1986). Together with the sourceconditions given in Table 1, we calculate the ratio of the dimensionless wind velocity to thedimensionless plume velocity W ⇤/U⇤ which is used as a proxy to infer the plume regime(Carazzo et al., 2014). The 79 CE Vesuvius column is found to be a slightly distorted plumeat the beginning of the eruption (W ⇤/U⇤ ⇡ 0.2) and a strong plume before the columncollapses (W ⇤/U⇤ ⇡ 0.1). The ⇡186 CE Taupo column is found to be a strong plumeduring the entire eruption (W ⇤/U⇤ ⇡ 0.06). For these two historical eruptions, atmosphericwinds did not affect significantly the plume dynamics, and can thus be neglected wheninvestigating the mechanisms leading to column collapse.
6 Conclusions
We have tested the combined effects of gas entrapment and reduced entrainment usinga 1D turbulent plume model accounting for particle sedimentation. Compared with thepredictions of previous studies accounting for gas entrapment or reduced entrainment only,this model favors too much column collapse compared with natural cases. We thus takeinto account open porosity, i.e. the fraction of bubbles preserved inside a fragment afterfragmentation but connected to the exterior, which helps to generate stable plumes. Wethen predict various grain-size distributions in PDC depending on the TGSD (hence Dvalue) at the volcanic vent. Low D values tend to promote the formation of relativelysmall fountains producing concentrated PDC with large particles, and reaching relativelylow run-out distances. High D values tend to promote the formation of higher fountainsproducing dilute PDC containing mostly fine particles and covering larger distances. Finally,we compare the model predictions to the two well-known eruptions of Taupo (⇡186 CE) andVesuvius (79 CE). We find a good agreement between theoretical predictions and field datafor the Taupo eruption. For the Vesuvius eruption characterized by a power-law exponentD = 3.0, we suggest that thermal disequilibrium could explain the discrepancy between ourpredictions and field data.
107
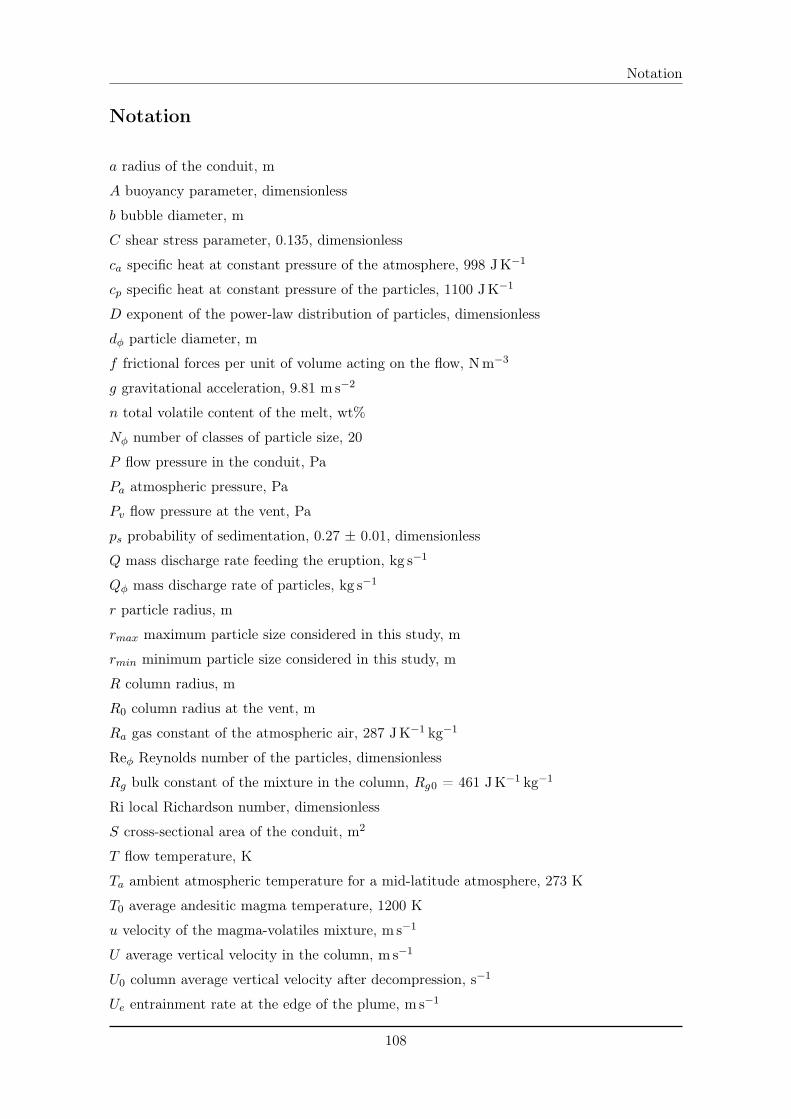
Notation
Notation
a radius of the conduit, m
A buoyancy parameter, dimensionless
b bubble diameter, m
C shear stress parameter, 0.135, dimensionless
ca specific heat at constant pressure of the atmosphere, 998 JK
�1
cp specific heat at constant pressure of the particles, 1100 JK
�1
D exponent of the power-law distribution of particles, dimensionless
d� particle diameter, m
f frictional forces per unit of volume acting on the flow, Nm
�3
g gravitational acceleration, 9.81 ms
�2
n total volatile content of the melt, wt%
N� number of classes of particle size, 20
P flow pressure in the conduit, Pa
Pa atmospheric pressure, Pa
Pv flow pressure at the vent, Pa
ps probability of sedimentation, 0.27 ± 0.01, dimensionless
Q mass discharge rate feeding the eruption, kg s�1
Q� mass discharge rate of particles, kg s�1
r particle radius, m
rmax maximum particle size considered in this study, m
rmin minimum particle size considered in this study, m
R column radius, m
R0 column radius at the vent, m
Ra gas constant of the atmospheric air, 287 JK
�1kg
�1
Re� Reynolds number of the particles, dimensionless
Rg bulk constant of the mixture in the column, Rg0 = 461 JK
�1kg
�1
Ri local Richardson number, dimensionless
S cross-sectional area of the conduit, m2
T flow temperature, K
Ta ambient atmospheric temperature for a mid-latitude atmosphere, 273 K
T0 average andesitic magma temperature, 1200 K
u velocity of the magma-volatiles mixture, ms
�1
U average vertical velocity in the column, ms
�1
U0 column average vertical velocity after decompression, s�1
Ue entrainment rate at the edge of the plume, ms
�1
108
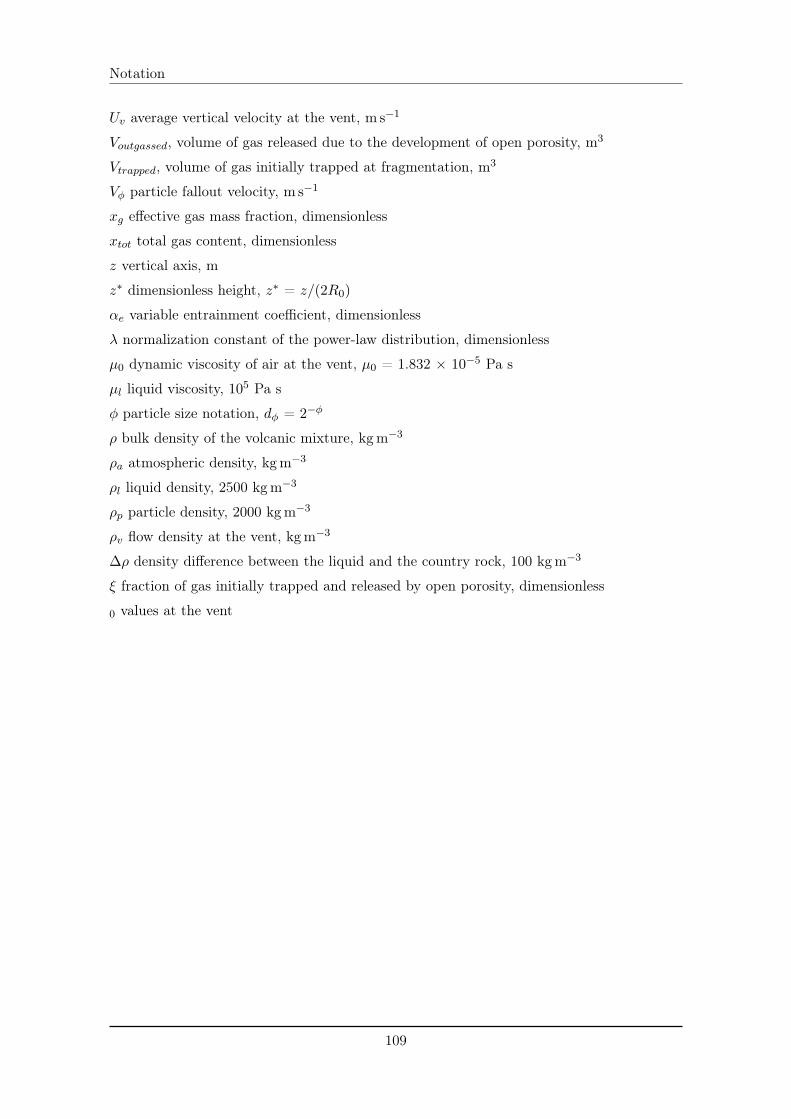
Notation
Uv average vertical velocity at the vent, ms
�1
Voutgassed, volume of gas released due to the development of open porosity, m3
Vtrapped, volume of gas initially trapped at fragmentation, m3
V� particle fallout velocity, ms
�1
xg effective gas mass fraction, dimensionless
xtot total gas content, dimensionless
z vertical axis, m
z⇤ dimensionless height, z⇤ = z/(2R0)
↵e variable entrainment coefficient, dimensionless
� normalization constant of the power-law distribution, dimensionless
µ0 dynamic viscosity of air at the vent, µ0 = 1.832 ⇥ 10
�5 Pa s
µl liquid viscosity, 105 Pa s
� particle size notation, d� = 2
��
⇢ bulk density of the volcanic mixture, kgm�3
⇢a atmospheric density, kgm�3
⇢l liquid density, 2500 kgm
�3
⇢p particle density, 2000 kgm
�3
⇢v flow density at the vent, kgm�3
�⇢ density difference between the liquid and the country rock, 100 kgm
�3
⇠ fraction of gas initially trapped and released by open porosity, dimensionless
0 values at the vent
109
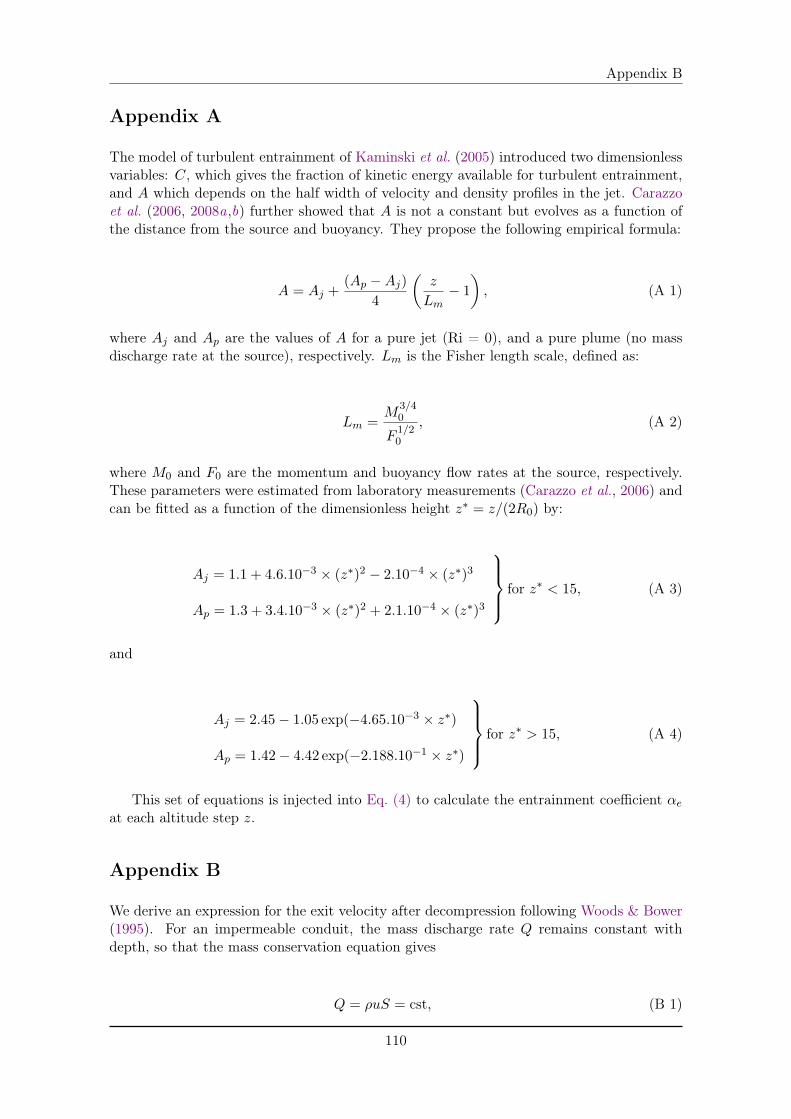
Appendix B
Appendix A
The model of turbulent entrainment of Kaminski et al. (2005) introduced two dimensionlessvariables: C, which gives the fraction of kinetic energy available for turbulent entrainment,and A which depends on the half width of velocity and density profiles in the jet. Carazzoet al. (2006, 2008a,b) further showed that A is not a constant but evolves as a function ofthe distance from the source and buoyancy. They propose the following empirical formula:
A = Aj +(Ap �Aj)
4
✓
z
Lm� 1
◆
, (A 1)
where Aj and Ap are the values of A for a pure jet (Ri = 0), and a pure plume (no massdischarge rate at the source), respectively. Lm is the Fisher length scale, defined as:
Lm =
M3/40
F 1/20
, (A 2)
where M0 and F0 are the momentum and buoyancy flow rates at the source, respectively.These parameters were estimated from laboratory measurements (Carazzo et al., 2006) andcan be fitted as a function of the dimensionless height z⇤ = z/(2R0) by:
Aj = 1.1 + 4.6.10�3 ⇥ (z⇤)2 � 2.10�4 ⇥ (z⇤)3
Ap = 1.3 + 3.4.10�3 ⇥ (z⇤)2 + 2.1.10�4 ⇥ (z⇤)3
9
>
>
=
>
>
;
for z⇤ < 15, (A 3)
and
Aj = 2.45� 1.05 exp(�4.65.10�3 ⇥ z⇤)
Ap = 1.42� 4.42 exp(�2.188.10�1 ⇥ z⇤)
9
>
>
=
>
>
;
for z⇤ > 15, (A 4)
This set of equations is injected into Eq. (4) to calculate the entrainment coefficient ↵e
at each altitude step z.
Appendix B
We derive an expression for the exit velocity after decompression following Woods & Bower(1995). For an impermeable conduit, the mass discharge rate Q remains constant withdepth, so that the mass conservation equation gives
Q = ⇢uS = cst, (B 1)
110
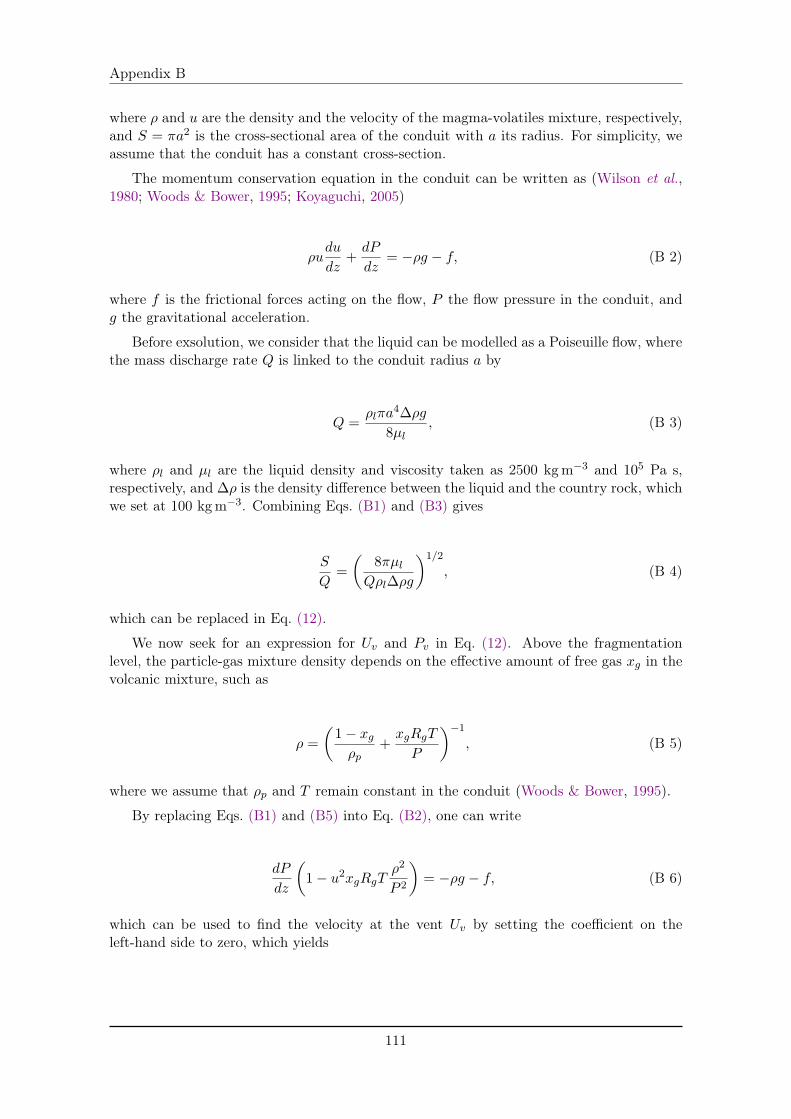
Appendix B
where ⇢ and u are the density and the velocity of the magma-volatiles mixture, respectively,and S = ⇡a2 is the cross-sectional area of the conduit with a its radius. For simplicity, weassume that the conduit has a constant cross-section.
The momentum conservation equation in the conduit can be written as (Wilson et al.,1980; Woods & Bower, 1995; Koyaguchi, 2005)
⇢udu
dz+
dP
dz= �⇢g � f, (B 2)
where f is the frictional forces acting on the flow, P the flow pressure in the conduit, andg the gravitational acceleration.
Before exsolution, we consider that the liquid can be modelled as a Poiseuille flow, wherethe mass discharge rate Q is linked to the conduit radius a by
Q =
⇢l⇡a4�⇢g
8µl, (B 3)
where ⇢l and µl are the liquid density and viscosity taken as 2500 kgm
�3 and 10
5 Pa s,respectively, and �⇢ is the density difference between the liquid and the country rock, whichwe set at 100 kgm
�3. Combining Eqs. (B1) and (B3) gives
S
Q=
✓
8⇡µl
Q⇢l�⇢g
◆1/2
, (B 4)
which can be replaced in Eq. (12).
We now seek for an expression for Uv and Pv in Eq. (12). Above the fragmentationlevel, the particle-gas mixture density depends on the effective amount of free gas xg in thevolcanic mixture, such as
⇢ =
✓
1� xg⇢p
+
xgRgT
P
◆�1
, (B 5)
where we assume that ⇢p and T remain constant in the conduit (Woods & Bower, 1995).
By replacing Eqs. (B1) and (B5) into Eq. (B2), one can write
dP
dz
✓
1� u2xgRgT⇢2
P 2
◆
= �⇢g � f, (B 6)
which can be used to find the velocity at the vent Uv by setting the coefficient on theleft-hand side to zero, which yields
111
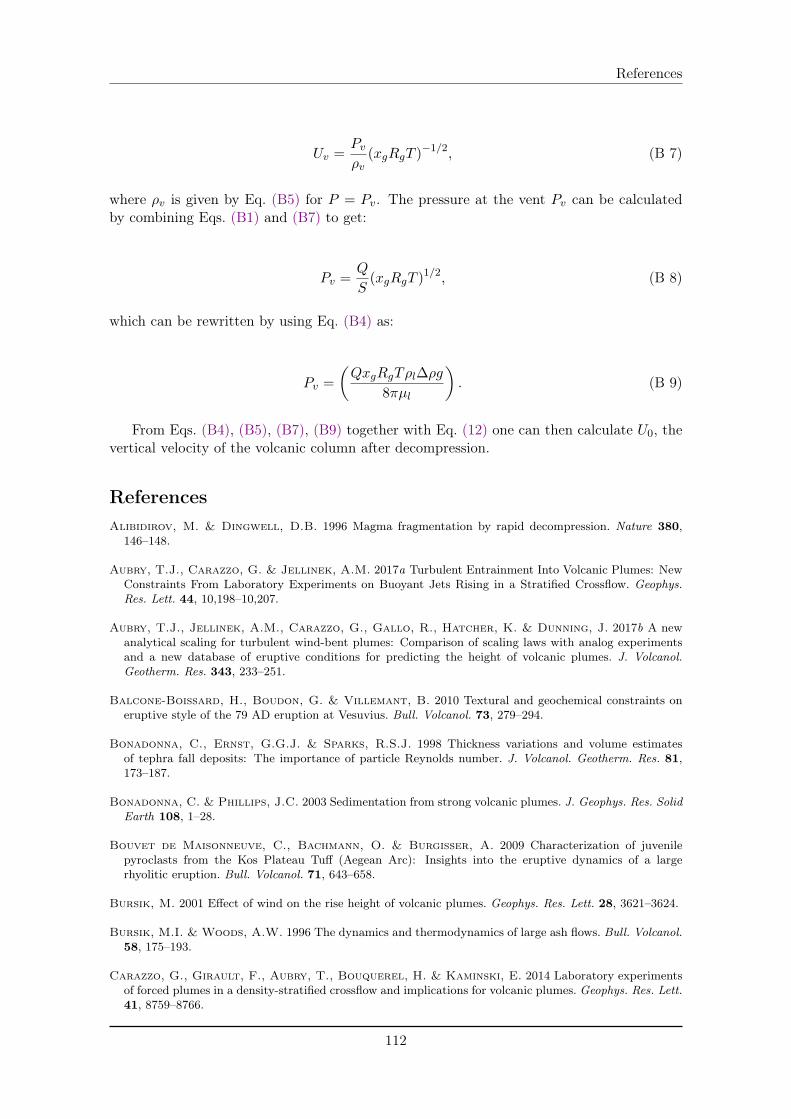
References
Uv =
Pv
⇢v(xgRgT )
�1/2, (B 7)
where ⇢v is given by Eq. (B5) for P = Pv. The pressure at the vent Pv can be calculatedby combining Eqs. (B1) and (B7) to get:
Pv =
Q
S(xgRgT )
1/2, (B 8)
which can be rewritten by using Eq. (B4) as:
Pv =
✓
QxgRgT⇢l�⇢g
8⇡µl
◆
. (B 9)
From Eqs. (B4), (B5), (B7), (B9) together with Eq. (12) one can then calculate U0, thevertical velocity of the volcanic column after decompression.
ReferencesAlibidirov, M. & Dingwell, D.B. 1996 Magma fragmentation by rapid decompression. Nature 380,
146–148.
Aubry, T.J., Carazzo, G. & Jellinek, A.M. 2017a Turbulent Entrainment Into Volcanic Plumes: NewConstraints From Laboratory Experiments on Buoyant Jets Rising in a Stratified Crossflow. Geophys.Res. Lett. 44, 10,198–10,207.
Aubry, T.J., Jellinek, A.M., Carazzo, G., Gallo, R., Hatcher, K. & Dunning, J. 2017b A newanalytical scaling for turbulent wind-bent plumes: Comparison of scaling laws with analog experimentsand a new database of eruptive conditions for predicting the height of volcanic plumes. J. Volcanol.Geotherm. Res. 343, 233–251.
Balcone-Boissard, H., Boudon, G. & Villemant, B. 2010 Textural and geochemical constraints oneruptive style of the 79 AD eruption at Vesuvius. Bull. Volcanol. 73, 279–294.
Bonadonna, C., Ernst, G.G.J. & Sparks, R.S.J. 1998 Thickness variations and volume estimatesof tephra fall deposits: The importance of particle Reynolds number. J. Volcanol. Geotherm. Res. 81,173–187.
Bonadonna, C. & Phillips, J.C. 2003 Sedimentation from strong volcanic plumes. J. Geophys. Res. SolidEarth 108, 1–28.
Bouvet de Maisonneuve, C., Bachmann, O. & Burgisser, A. 2009 Characterization of juvenilepyroclasts from the Kos Plateau Tuff (Aegean Arc): Insights into the eruptive dynamics of a largerhyolitic eruption. Bull. Volcanol. 71, 643–658.
Bursik, M. 2001 Effect of wind on the rise height of volcanic plumes. Geophys. Res. Lett. 28, 3621–3624.
Bursik, M.I. & Woods, A.W. 1996 The dynamics and thermodynamics of large ash flows. Bull. Volcanol.58, 175–193.
Carazzo, G., Girault, F., Aubry, T., Bouquerel, H. & Kaminski, E. 2014 Laboratory experimentsof forced plumes in a density-stratified crossflow and implications for volcanic plumes. Geophys. Res. Lett.41, 8759–8766.
112
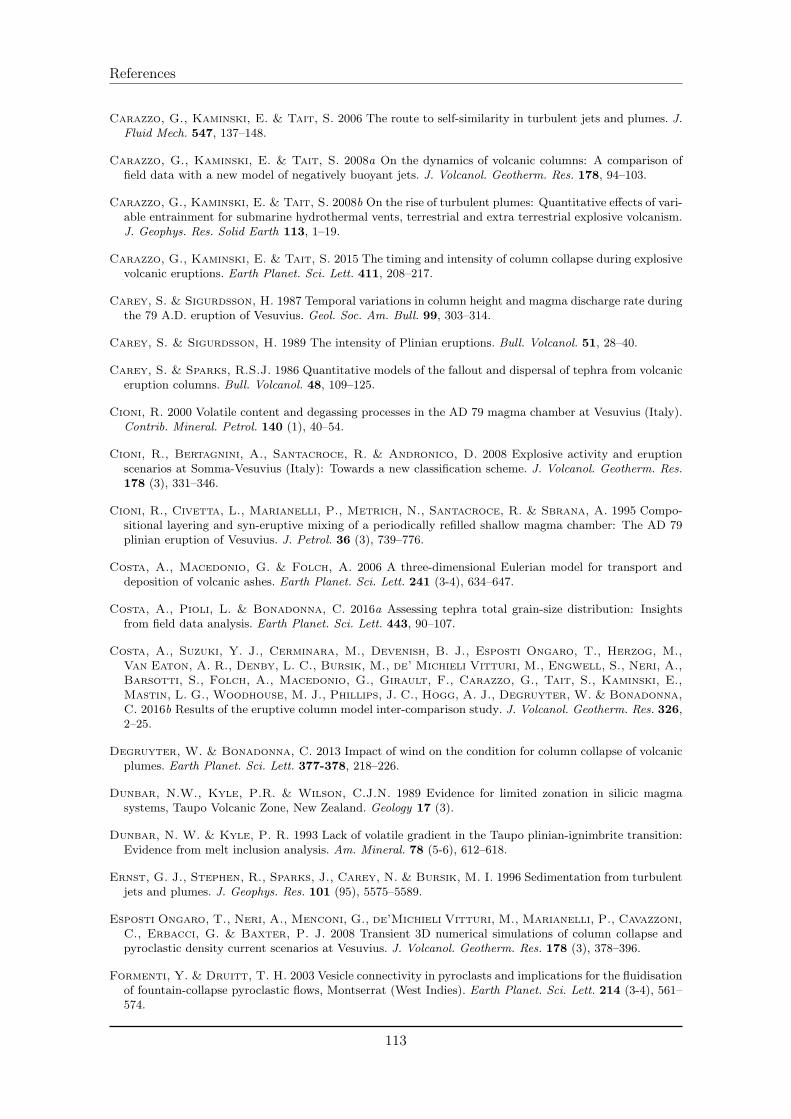
References
Carazzo, G., Kaminski, E. & Tait, S. 2006 The route to self-similarity in turbulent jets and plumes. J.Fluid Mech. 547, 137–148.
Carazzo, G., Kaminski, E. & Tait, S. 2008a On the dynamics of volcanic columns: A comparison offield data with a new model of negatively buoyant jets. J. Volcanol. Geotherm. Res. 178, 94–103.
Carazzo, G., Kaminski, E. & Tait, S. 2008b On the rise of turbulent plumes: Quantitative effects of vari-able entrainment for submarine hydrothermal vents, terrestrial and extra terrestrial explosive volcanism.J. Geophys. Res. Solid Earth 113, 1–19.
Carazzo, G., Kaminski, E. & Tait, S. 2015 The timing and intensity of column collapse during explosivevolcanic eruptions. Earth Planet. Sci. Lett. 411, 208–217.
Carey, S. & Sigurdsson, H. 1987 Temporal variations in column height and magma discharge rate duringthe 79 A.D. eruption of Vesuvius. Geol. Soc. Am. Bull. 99, 303–314.
Carey, S. & Sigurdsson, H. 1989 The intensity of Plinian eruptions. Bull. Volcanol. 51, 28–40.
Carey, S. & Sparks, R.S.J. 1986 Quantitative models of the fallout and dispersal of tephra from volcaniceruption columns. Bull. Volcanol. 48, 109–125.
Cioni, R. 2000 Volatile content and degassing processes in the AD 79 magma chamber at Vesuvius (Italy).Contrib. Mineral. Petrol. 140 (1), 40–54.
Cioni, R., Bertagnini, A., Santacroce, R. & Andronico, D. 2008 Explosive activity and eruptionscenarios at Somma-Vesuvius (Italy): Towards a new classification scheme. J. Volcanol. Geotherm. Res.178 (3), 331–346.
Cioni, R., Civetta, L., Marianelli, P., Metrich, N., Santacroce, R. & Sbrana, A. 1995 Compo-sitional layering and syn-eruptive mixing of a periodically refilled shallow magma chamber: The AD 79plinian eruption of Vesuvius. J. Petrol. 36 (3), 739–776.
Costa, A., Macedonio, G. & Folch, A. 2006 A three-dimensional Eulerian model for transport anddeposition of volcanic ashes. Earth Planet. Sci. Lett. 241 (3-4), 634–647.
Costa, A., Pioli, L. & Bonadonna, C. 2016a Assessing tephra total grain-size distribution: Insightsfrom field data analysis. Earth Planet. Sci. Lett. 443, 90–107.
Costa, A., Suzuki, Y. J., Cerminara, M., Devenish, B. J., Esposti Ongaro, T., Herzog, M.,Van Eaton, A. R., Denby, L. C., Bursik, M., de’ Michieli Vitturi, M., Engwell, S., Neri, A.,Barsotti, S., Folch, A., Macedonio, G., Girault, F., Carazzo, G., Tait, S., Kaminski, E.,Mastin, L. G., Woodhouse, M. J., Phillips, J. C., Hogg, A. J., Degruyter, W. & Bonadonna,C. 2016b Results of the eruptive column model inter-comparison study. J. Volcanol. Geotherm. Res. 326,2–25.
Degruyter, W. & Bonadonna, C. 2013 Impact of wind on the condition for column collapse of volcanicplumes. Earth Planet. Sci. Lett. 377-378, 218–226.
Dunbar, N.W., Kyle, P.R. & Wilson, C.J.N. 1989 Evidence for limited zonation in silicic magmasystems, Taupo Volcanic Zone, New Zealand. Geology 17 (3).
Dunbar, N. W. & Kyle, P. R. 1993 Lack of volatile gradient in the Taupo plinian-ignimbrite transition:Evidence from melt inclusion analysis. Am. Mineral. 78 (5-6), 612–618.
Ernst, G. J., Stephen, R., Sparks, J., Carey, N. & Bursik, M. I. 1996 Sedimentation from turbulentjets and plumes. J. Geophys. Res. 101 (95), 5575–5589.
Esposti Ongaro, T., Neri, A., Menconi, G., de’Michieli Vitturi, M., Marianelli, P., Cavazzoni,C., Erbacci, G. & Baxter, P. J. 2008 Transient 3D numerical simulations of column collapse andpyroclastic density current scenarios at Vesuvius. J. Volcanol. Geotherm. Res. 178 (3), 378–396.
Formenti, Y. & Druitt, T. H. 2003 Vesicle connectivity in pyroclasts and implications for the fluidisationof fountain-collapse pyroclastic flows, Montserrat (West Indies). Earth Planet. Sci. Lett. 214 (3-4), 561–574.
113
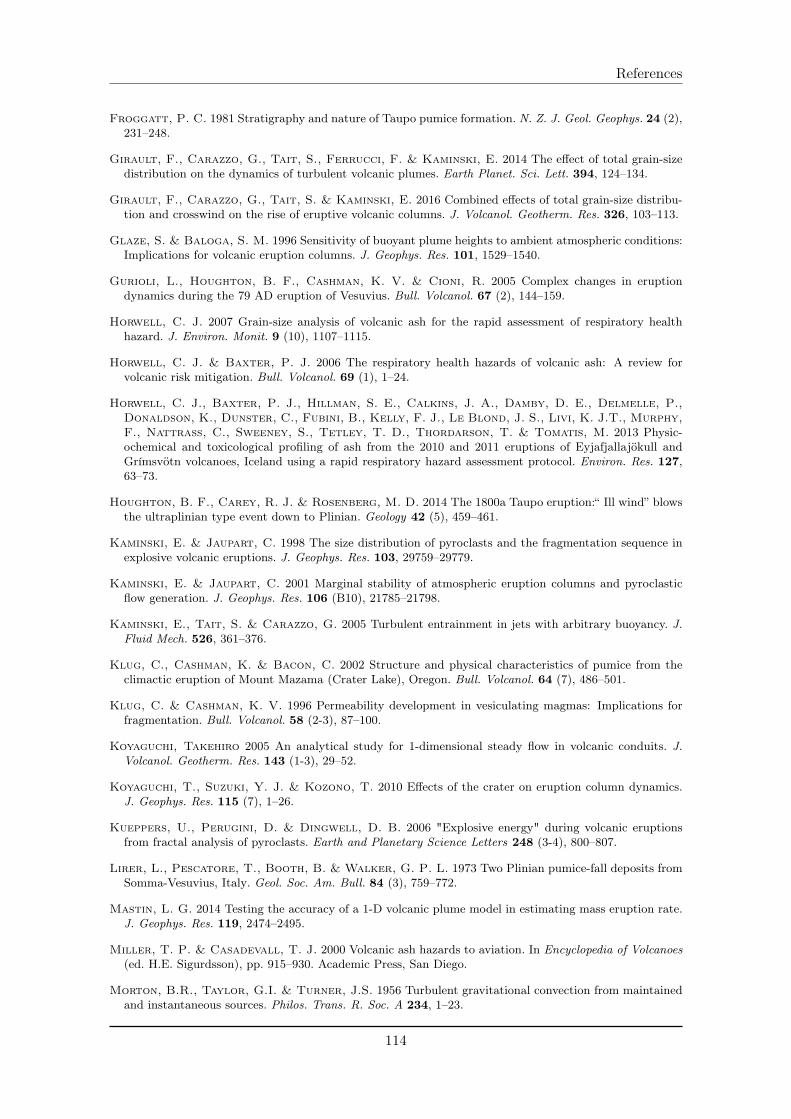
References
Froggatt, P. C. 1981 Stratigraphy and nature of Taupo pumice formation. N. Z. J. Geol. Geophys. 24 (2),231–248.
Girault, F., Carazzo, G., Tait, S., Ferrucci, F. & Kaminski, E. 2014 The effect of total grain-sizedistribution on the dynamics of turbulent volcanic plumes. Earth Planet. Sci. Lett. 394, 124–134.
Girault, F., Carazzo, G., Tait, S. & Kaminski, E. 2016 Combined effects of total grain-size distribu-tion and crosswind on the rise of eruptive volcanic columns. J. Volcanol. Geotherm. Res. 326, 103–113.
Glaze, S. & Baloga, S. M. 1996 Sensitivity of buoyant plume heights to ambient atmospheric conditions:Implications for volcanic eruption columns. J. Geophys. Res. 101, 1529–1540.
Gurioli, L., Houghton, B. F., Cashman, K. V. & Cioni, R. 2005 Complex changes in eruptiondynamics during the 79 AD eruption of Vesuvius. Bull. Volcanol. 67 (2), 144–159.
Horwell, C. J. 2007 Grain-size analysis of volcanic ash for the rapid assessment of respiratory healthhazard. J. Environ. Monit. 9 (10), 1107–1115.
Horwell, C. J. & Baxter, P. J. 2006 The respiratory health hazards of volcanic ash: A review forvolcanic risk mitigation. Bull. Volcanol. 69 (1), 1–24.
Horwell, C. J., Baxter, P. J., Hillman, S. E., Calkins, J. A., Damby, D. E., Delmelle, P.,Donaldson, K., Dunster, C., Fubini, B., Kelly, F. J., Le Blond, J. S., Livi, K. J.T., Murphy,F., Nattrass, C., Sweeney, S., Tetley, T. D., Thordarson, T. & Tomatis, M. 2013 Physic-ochemical and toxicological profiling of ash from the 2010 and 2011 eruptions of Eyjafjallajökull andGrímsvötn volcanoes, Iceland using a rapid respiratory hazard assessment protocol. Environ. Res. 127,63–73.
Houghton, B. F., Carey, R. J. & Rosenberg, M. D. 2014 The 1800a Taupo eruption:“ Ill wind” blowsthe ultraplinian type event down to Plinian. Geology 42 (5), 459–461.
Kaminski, E. & Jaupart, C. 1998 The size distribution of pyroclasts and the fragmentation sequence inexplosive volcanic eruptions. J. Geophys. Res. 103, 29759–29779.
Kaminski, E. & Jaupart, C. 2001 Marginal stability of atmospheric eruption columns and pyroclasticflow generation. J. Geophys. Res. 106 (B10), 21785–21798.
Kaminski, E., Tait, S. & Carazzo, G. 2005 Turbulent entrainment in jets with arbitrary buoyancy. J.Fluid Mech. 526, 361–376.
Klug, C., Cashman, K. & Bacon, C. 2002 Structure and physical characteristics of pumice from theclimactic eruption of Mount Mazama (Crater Lake), Oregon. Bull. Volcanol. 64 (7), 486–501.
Klug, C. & Cashman, K. V. 1996 Permeability development in vesiculating magmas: Implications forfragmentation. Bull. Volcanol. 58 (2-3), 87–100.
Koyaguchi, Takehiro 2005 An analytical study for 1-dimensional steady flow in volcanic conduits. J.Volcanol. Geotherm. Res. 143 (1-3), 29–52.
Koyaguchi, T., Suzuki, Y. J. & Kozono, T. 2010 Effects of the crater on eruption column dynamics.J. Geophys. Res. 115 (7), 1–26.
Kueppers, U., Perugini, D. & Dingwell, D. B. 2006 "Explosive energy" during volcanic eruptionsfrom fractal analysis of pyroclasts. Earth and Planetary Science Letters 248 (3-4), 800–807.
Lirer, L., Pescatore, T., Booth, B. & Walker, G. P. L. 1973 Two Plinian pumice-fall deposits fromSomma-Vesuvius, Italy. Geol. Soc. Am. Bull. 84 (3), 759–772.
Mastin, L. G. 2014 Testing the accuracy of a 1-D volcanic plume model in estimating mass eruption rate.J. Geophys. Res. 119, 2474–2495.
Miller, T. P. & Casadevall, T. J. 2000 Volcanic ash hazards to aviation. In Encyclopedia of Volcanoes(ed. H.E. Sigurdsson), pp. 915–930. Academic Press, San Diego.
Morton, B.R., Taylor, G.I. & Turner, J.S. 1956 Turbulent gravitational convection from maintainedand instantaneous sources. Philos. Trans. R. Soc. A 234, 1–23.
114
References
Neri, A. & Dobran, F. 1994 Influence of eruption parameters on the thermofluid dynamics of collapsingvolcanic columns. J. Geophys. Res. 99 (B6), 11833–11857.
Nguyen, C. T., Gonnermann, H. M. & Houghton, B. F. 2014 Explosive to effusive transition duringthe largest volcanic eruption of the 20th century (Novarupta 1912, Alaska). Geology 42 (8), 703–706.
Platz, T., Cronin, S. J., Cashman, K. V., Stewart, R. B. & Smith, I. E. M. 2007 Transitionfrom effusive to explosive phases in andesite eruptions - A case-study from the AD1655 eruption of Mt.Taranaki, New Zealand. J. Volcanol. Geotherm. Res. 161 (1-2), 15–34.
Schmidt, A., Witham, C. S., Theys, N., Richards, N. A. D., Thordarson, T., Redington, A. L.,Johnson, B. T., Hayward, C. L. & Carslaw, K. S. 2014 Assessing hazards to aviation from sulfurdioxide emitted by explosive Icelandic eruptions. J. Geophys. Res. 119, 14180–14196.
Settle, M. 1978 Volcanic eruption clouds and the thermal power output of explosive eruptions. J. Volcanol.Geotherm. Res. 3 (3-4), 309–324.
Shane, P. 1998 Correlation of rhyolitic pyroclastic eruptive units from the Taupo volcanic zone by Fe-Tioxide compositional data. Bull. Volcanol. 60 (3), 224–238.
Shea, T., Gurioli, L. & Houghton, B. F. 2012 Transitions between fall phases and pyroclastic densitycurrents during the AD 79 eruption at Vesuvius: Building a transient conduit model from the texturaland volatile record. Bull. Volcanol. 74 (10), 2363–2381.
Shea, T., Larsen, J. F., Gurioli, L., Hammer, J. E., Houghton, B. F. & Cioni, R. 2009 Leucitecrystals: Surviving witnesses of magmatic processes preceding the 79AD eruption at Vesuvius, Italy.Earth Planet. Sci. Lett. 281 (1-2), 88–98.
Sigurdsson, H., Carey, S., Cornell, W. & Pescatore, T. 1985 The eruption of Vesuvius in AD 79.Natl. Geogr. Res. 1, 332–387.
Sigurdsson, H., Cashdollar, S. & Sparks, R. S. J. 1982 The eruption of Vesuvius in AD 79: Recon-struction from historical and volcanological evidence. Am. J. Archaeol. 86, 39–51.
Sigurdsson, H., Cornell, W. & Carey, S. 1990 Influence of magma withdrawal on compositionalgradients during the AD 79 Vesuvius eruption. Nature 345, 519–521.
Sparks, R. S. J. 1986 The dimensions and dynamics of volcanic eruption columns. Bull. Volcanol. 48,3–15.
Sparks, R. S. J., Bursik, M., Carey, S., Gilbert, J. S., Glaze, L. S., Sigurdsson, H. & Woods,A. W. 1997 Volcanic Plumes. John Wiley, New York.
Sparks, R. S. J. & Wilson, L. 1976 A model for the formation of ignimbrite by gravitational columncollapse. J. Geol. Soc. Lond. 132, 441–451.
Spence, R. J. S., Baxter, P. J. & Zuccaro, G. 2004 Building vulnerability and human casualtyestimation for a pyroclastic flow: A model and its application to Vesuvius. J. Volcanol. Geotherm. Res.133 (1-4), 321–343.
Sutherland, W. 1893 The viscosity of gases and molecular forces. Philos. Mag. 39 (5), 507–531.
Suzuki, Y. & Koyaguchi, T. 2015 Effects of wind on entrainment in volcanic plumes. J. Geophys. Res.B. 120, 6122–6140.
Suzuki, Y. J. & Koyaguchi, T. 2013 3D numerical simulation of volcanic eruption clouds during the 2011Shinmoe-dake eruptions. Earth Planets Space 65, 581–589.
Suzuki, Y. J., Koyaguchi, T., Ogawa, M. & Hachisu, I. 2005 A numerical study of turbulent mixingin eruption clouds using a three-dimensional fluid dynamics model. J. Geophys. Res. 110, B08201.
Talbot, J. P., Self, S. & Wilson, C. J. N. 1994 Dilute gravity current and rain-flushed ash depositsin the 1.8 ka Hatepe Plinian deposit, Taupo, New Zealand. Bull. Volcanol. 56, 538–551.
Toramaru, A. 1988 Formation of propagation pattern in two-phase flow systems with application tovolcanic eruptions. Geophys. J. 95, 613–623.
115
References
Valentine, G. A. & Wohletz, K. H. 1989 Numerical Models of Plinian Eruption Columns and Pyro-clastic Flows. J. Geophys. Res. 94 (B2), 1867–1887.
Walker, G. P. L. 1980 The Taupo pumice: Product of the most powerful known (ultraplinian) eruption?J. Volcanol. Geotherm. Res. 8, 69–94.
Walker, G. P. L. 1981 Plinian eruptions and their products. Bull. Volcanol. 44-2, 223–240.
Wilson, C. J. N. 1985 The Taupo eruption, New Zealand II. The Taupo Ignimbrite. Philos. Trans. R.Soc. Lond. 314 (1529), 199–310.
Wilson, C. J. N. 1993 Stratigraphy, chronology, styles and dynamics of late quaternary eruptions fromTaupo volcano, New Zealand. Philos. Trans. R. Soc. Lond. 343, 205–306.
Wilson, C. J. N. & Walker, G. P. L. 1985 The Taupo eruption, New Zealand. I general aspects. Philos.Trans. R. Soc. Lond. 314, 199–228.
Wilson, G., Wilson, T. W., Deligne, N. I. & Cole, J. W. 2014 Volcanic hazard impacts to criticalinfrastructure: A review. J. Volcanol. Geotherm. Res. 286, 148–182.
Wilson, L. 1976 Explosive Volcanic Eruptions: III. Plinian Eruption Columns. J. R. Astron. Soc. 45,543–556.
Wilson, L., Sparks, R. S. J., Huang, T. C. & Watkins, N. D. 1978 The Control of Volcanic ColumnHeights by Eruption Energetics and Dynamics. J. Geophys. Res. 83 (B4), 1829–1836.
Wilson, L., Sparks, R. S. J. & Walker, G. P. L. 1980 Explosive volcanic eruptions - IV. The controlof magma properties and conduit geometry on eruption column behaviour. Geophys. J. R. Astron. Soc.63, 117–148.
Woodhouse, M. J., Hogg, A. J., Phillips, J. C. & Sparks, R. S. J. 2013 Interaction between volcanicplumes and wind during the 2010 Eyjafjallajökull eruption, Iceland. J. Geophys. Res. Solid Earth 118,92–109.
Woods, A.W. 1988 The fluid dynamics and thermodynamics of eruption columns. Bull. Volcanol. 50,169–193.
Woods, A. W. 1995 The dynamics of explosive volcanic eruptions. Rev. Geophys. 33, 495–530.
Woods, A. W. & Bower, S. M. 1995 The decompression of volcanic jets in a crater during explosiveeruptions. Earth Planet. Sci. Lett. 131, 189–205.
Woods, A. W. & Bursik, M. I 1991 Particle fallout, thermal disequilibrium and volcanic plumes. Bull.Volcanol. 53, 559–570.
Woods, A. W. & Caulfield, C. P. 1992 A laboratory study of explosive volcanic eruptions. J. Geophys.Res. 97 (B5), 6699–6712.
116
Chapter 4
Wind entrainment in reversing
buoyant jets: laboratory constraints
and implications for volcanic plumes
Michaud-Dubuy A., Carazzo G., and Kaminski E. Submitted.
Table of contents1 Introduction . . . . . . . . . . . . . . . . . . . . . . . . . . . . . . . . . . 1192 Laboratory experiments . . . . . . . . . . . . . . . . . . . . . . . . . . . . 121
2.1 Experimental set up . . . . . . . . . . . . . . . . . . . . . . . . . 1212.2 Scaling analysis . . . . . . . . . . . . . . . . . . . . . . . . . . . . 122
3 A model for the laboratory experiments . . . . . . . . . . . . . . . . . . . 1233.1 Conservation equations . . . . . . . . . . . . . . . . . . . . . . . . 1233.2 No wind case . . . . . . . . . . . . . . . . . . . . . . . . . . . . . 1253.3 Negatively buoyant jets in a windy environment . . . . . . . . . . 126
4 Results . . . . . . . . . . . . . . . . . . . . . . . . . . . . . . . . . . . . . 1274.1 Qualitative observations . . . . . . . . . . . . . . . . . . . . . . . 1274.2 The plume/fountain transition . . . . . . . . . . . . . . . . . . . 1284.3 Trajectory of negatively buoyant jets . . . . . . . . . . . . . . . . 129
5 Volcanological implications . . . . . . . . . . . . . . . . . . . . . . . . . . 1305.1 Collapsing regimes of historical eruptions . . . . . . . . . . . . . 1305.2 New regime diagram for column collapse in case of wind . . . . . 131
6 Conclusion . . . . . . . . . . . . . . . . . . . . . . . . . . . . . . . . . . . 132Appendix A . . . . . . . . . . . . . . . . . . . . . . . . . . . . . . . . . . . . . . 133
Chapter 4
Résumé du chapitre 4
Le modèle présenté dans le chapitre précédent permet d’expliquer la transition entre lesrégimes stable et d’effondrement de plusieurs éruptions historiques. Nous montrons dansce chapitre qu’il ne peut pourtant pas expliquer le déroulement des éruptions historiquesdu Tambora (Indonésie) en 1815, du Nevado del Ruiz (Colombie) en 1985 et du Pinatubo(Philippines) en 1991. Ces éruptions sont particulièrement célèbres à cause de leurs puis-sances, de leurs conséquences climatiques ressenties dans de nombreuses régions du globe,et de leurs bilans humains particulièrement lourds. L’étude des dépôts de ces éruptionsa révélé qu’elles se sont toutes produites sous des vents puissants allant jusqu’à 30 ms
�1.Or, le vent peut avoir un fort effet sur la dynamique d’une colonne volcanique, en aug-mentant l’efficacité du mélange entre celle-ci et l’atmosphère. Notre modèle PPM présentéen chapitre 3 ne prenant pas en compte l’effet du vent, cela pourrait expliquer le manquede cohérence entre les prédictions du modèle et les conditions éruptives du Tambora, duNevado del Ruiz et du Pinatubo.
Afin d’incorporer l’effet du vent dans le modèle, il est tout d’abord nécessaire de quanti-fier son impact sur le mélange turbulent entre colonne volcanique et atmosphère. Ce dernierest généralement pris en compte dans les modèles 1D par un coefficient d’entrainement �dont la valeur est actuellement mal contrainte et varie entre 0.1 et 1 dans la littérature. Dansce chapitre, nous réalisons des expériences en laboratoire inédites permettant de simuler desjets turbulents se formant dans un environnement soumis au vent, et reproduisant l’inversionde flottabilité caractérisant les colonnes volcaniques naturelles. En comparant nos observa-tions avec les prédictions théoriques d’un modèle 1D, nous montrons qu’une valeur de � =0.5 permet d’expliquer nos résultats obtenus en laboratoire. Une autre série d’expériencesreproduisant des fontaines en effondrement dont les trajectoires sont ensuite comparées à destrajectoires théoriques calculées par un modèle 1D confirme que cette valeur peut égalementêtre utilisée pour des jets à flottabilité négative ou positive.
En incorporant cette valeur universelle de � dans notre modèle 1D complet PPM, noussommes capables d’expliquer le déroulement des éruptions historiques du Pinatubo, duNevado del Ruiz et du Tambora. Nous montrons donc que le vent fort soufflant durant ceséruptions a retardé voire empêché l’effondrement de la colonne éruptive, épargnant ainsiles populations vivant au pied de ces volcans. Nos résultats permettent également de créerune nouvelle loi de transition basée sur le flux de masse de l’éruption et le rapport vitessede vent / flux de masse. Ce rapport peut être déterminé par des mesures de la vitessedu vent et de la hauteur maximale atteinte par la colonne éruptive pour les éruptionsobservées, ou par la distribution des fragments lithiques sur le terrain pour des éruptionsplus anciennes. Ainsi, la forme des isoplètes déterminées sur le terrain pourrait être uncritère déterminant pour l’étude de la dynamique des éruptions passées. Cette étude montredonc l’importance primordiale du vent à chaque étape d’une éruption, de la dynamique dupanache à la dispersion des produits volcaniques dans l’atmosphère (et donc sur l’évaluationde l’aléa).
118
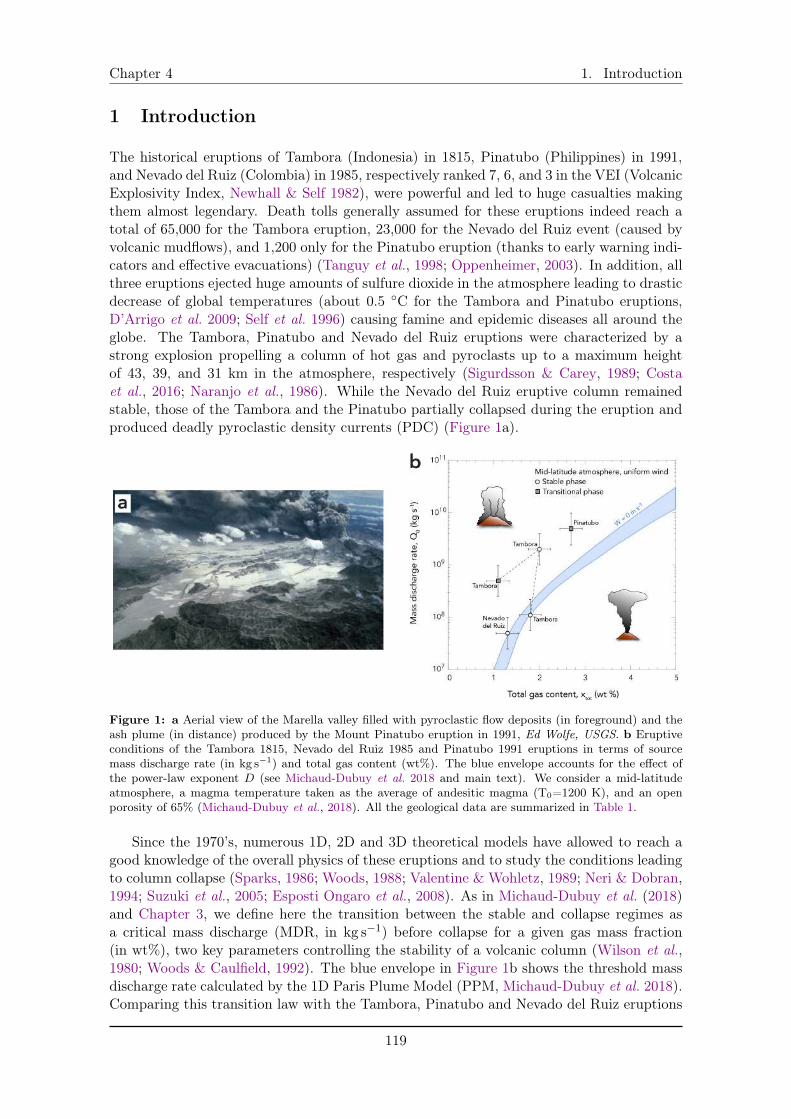
Chapter 4 1. Introduction
1 Introduction
The historical eruptions of Tambora (Indonesia) in 1815, Pinatubo (Philippines) in 1991,and Nevado del Ruiz (Colombia) in 1985, respectively ranked 7, 6, and 3 in the VEI (VolcanicExplosivity Index, Newhall & Self 1982), were powerful and led to huge casualties makingthem almost legendary. Death tolls generally assumed for these eruptions indeed reach atotal of 65,000 for the Tambora eruption, 23,000 for the Nevado del Ruiz event (caused byvolcanic mudflows), and 1,200 only for the Pinatubo eruption (thanks to early warning indi-cators and effective evacuations) (Tanguy et al., 1998; Oppenheimer, 2003). In addition, allthree eruptions ejected huge amounts of sulfure dioxide in the atmosphere leading to drasticdecrease of global temperatures (about 0.5 �C for the Tambora and Pinatubo eruptions,D’Arrigo et al. 2009; Self et al. 1996) causing famine and epidemic diseases all around theglobe. The Tambora, Pinatubo and Nevado del Ruiz eruptions were characterized by astrong explosion propelling a column of hot gas and pyroclasts up to a maximum heightof 43, 39, and 31 km in the atmosphere, respectively (Sigurdsson & Carey, 1989; Costaet al., 2016; Naranjo et al., 1986). While the Nevado del Ruiz eruptive column remainedstable, those of the Tambora and the Pinatubo partially collapsed during the eruption andproduced deadly pyroclastic density currents (PDC) (Figure 1a).
Figure 1: a Aerial view of the Marella valley filled with pyroclastic flow deposits (in foreground) and theash plume (in distance) produced by the Mount Pinatubo eruption in 1991, Ed Wolfe, USGS. b Eruptiveconditions of the Tambora 1815, Nevado del Ruiz 1985 and Pinatubo 1991 eruptions in terms of sourcemass discharge rate (in kg s�1) and total gas content (wt%). The blue envelope accounts for the effect ofthe power-law exponent D (see Michaud-Dubuy et al. 2018 and main text). We consider a mid-latitudeatmosphere, a magma temperature taken as the average of andesitic magma (T0=1200 K), and an openporosity of 65% (Michaud-Dubuy et al., 2018). All the geological data are summarized in Table 1.
Since the 1970’s, numerous 1D, 2D and 3D theoretical models have allowed to reach agood knowledge of the overall physics of these eruptions and to study the conditions leadingto column collapse (Sparks, 1986; Woods, 1988; Valentine & Wohletz, 1989; Neri & Dobran,1994; Suzuki et al., 2005; Esposti Ongaro et al., 2008). As in Michaud-Dubuy et al. (2018)and Chapter 3, we define here the transition between the stable and collapse regimes asa critical mass discharge (MDR, in kg s
�1) before collapse for a given gas mass fraction(in wt%), two key parameters controlling the stability of a volcanic column (Wilson et al.,1980; Woods & Caulfield, 1992). The blue envelope in Figure 1b shows the threshold massdischarge rate calculated by the 1D Paris Plume Model (PPM, Michaud-Dubuy et al. 2018).Comparing this transition law with the Tambora, Pinatubo and Nevado del Ruiz eruptions
119
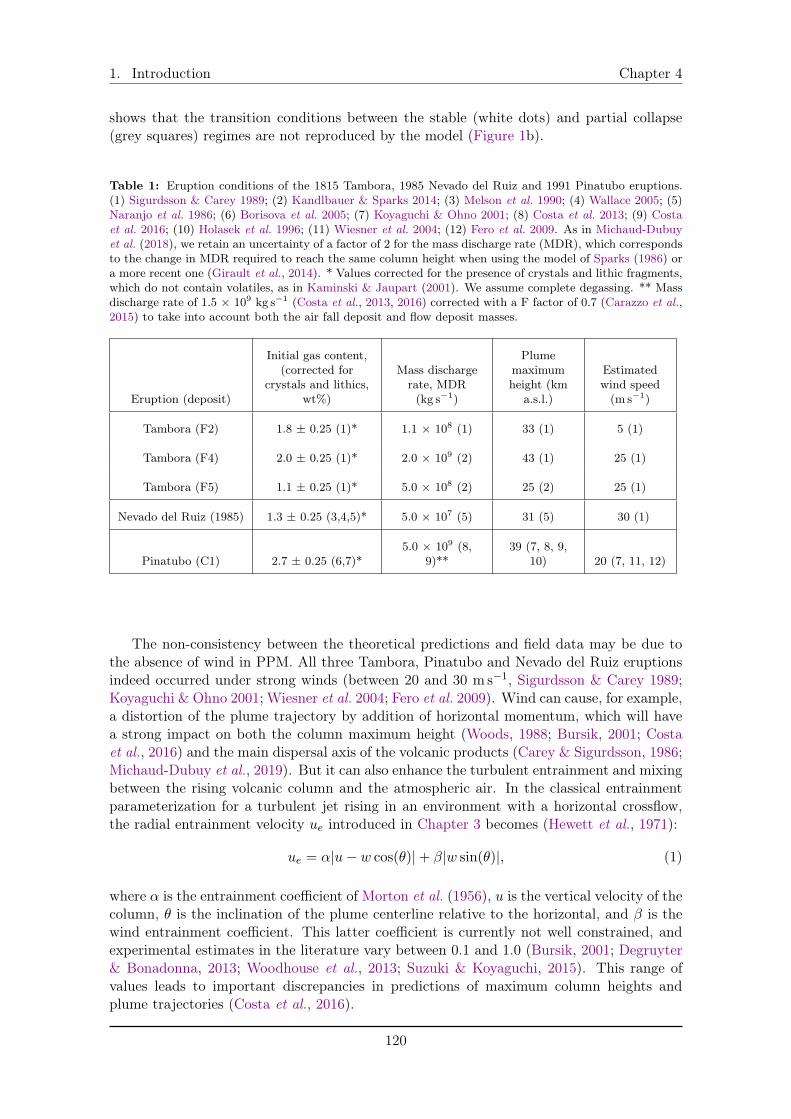
1. Introduction Chapter 4
shows that the transition conditions between the stable (white dots) and partial collapse(grey squares) regimes are not reproduced by the model (Figure 1b).
Table 1: Eruption conditions of the 1815 Tambora, 1985 Nevado del Ruiz and 1991 Pinatubo eruptions.(1) Sigurdsson & Carey 1989; (2) Kandlbauer & Sparks 2014; (3) Melson et al. 1990; (4) Wallace 2005; (5)Naranjo et al. 1986; (6) Borisova et al. 2005; (7) Koyaguchi & Ohno 2001; (8) Costa et al. 2013; (9) Costaet al. 2016; (10) Holasek et al. 1996; (11) Wiesner et al. 2004; (12) Fero et al. 2009. As in Michaud-Dubuyet al. (2018), we retain an uncertainty of a factor of 2 for the mass discharge rate (MDR), which correspondsto the change in MDR required to reach the same column height when using the model of Sparks (1986) ora more recent one (Girault et al., 2014). * Values corrected for the presence of crystals and lithic fragments,which do not contain volatiles, as in Kaminski & Jaupart (2001). We assume complete degassing. ** Massdischarge rate of 1.5 ⇥ 109 kg s�1 (Costa et al., 2013, 2016) corrected with a F factor of 0.7 (Carazzo et al.,2015) to take into account both the air fall deposit and flow deposit masses.
Eruption (deposit)
Initial gas content,(corrected for
crystals and lithics,wt%)
Mass dischargerate, MDR(kg s�1)
Plumemaximumheight (km
a.s.l.)
Estimatedwind speed
(ms�1)
Tambora (F2) 1.8 ± 0.25 (1)* 1.1 ⇥ 108 (1) 33 (1) 5 (1)
Tambora (F4) 2.0 ± 0.25 (1)* 2.0 ⇥ 109 (2) 43 (1) 25 (1)
Tambora (F5) 1.1 ± 0.25 (1)* 5.0 ⇥ 108 (2) 25 (2) 25 (1)
Nevado del Ruiz (1985) 1.3 ± 0.25 (3,4,5)* 5.0 ⇥ 107 (5) 31 (5) 30 (1)
Pinatubo (C1) 2.7 ± 0.25 (6,7)*5.0 ⇥ 109 (8,
9)**39 (7, 8, 9,
10) 20 (7, 11, 12)
The non-consistency between the theoretical predictions and field data may be due tothe absence of wind in PPM. All three Tambora, Pinatubo and Nevado del Ruiz eruptionsindeed occurred under strong winds (between 20 and 30 ms
�1, Sigurdsson & Carey 1989;Koyaguchi & Ohno 2001; Wiesner et al. 2004; Fero et al. 2009). Wind can cause, for example,a distortion of the plume trajectory by addition of horizontal momentum, which will havea strong impact on both the column maximum height (Woods, 1988; Bursik, 2001; Costaet al., 2016) and the main dispersal axis of the volcanic products (Carey & Sigurdsson, 1986;Michaud-Dubuy et al., 2019). But it can also enhance the turbulent entrainment and mixingbetween the rising volcanic column and the atmospheric air. In the classical entrainmentparameterization for a turbulent jet rising in an environment with a horizontal crossflow,the radial entrainment velocity ue introduced in Chapter 3 becomes (Hewett et al., 1971):
ue = ↵|u� w cos(✓)|+ �|w sin(✓)|, (1)
where ↵ is the entrainment coefficient of Morton et al. (1956), u is the vertical velocity of thecolumn, ✓ is the inclination of the plume centerline relative to the horizontal, and � is thewind entrainment coefficient. This latter coefficient is currently not well constrained, andexperimental estimates in the literature vary between 0.1 and 1.0 (Bursik, 2001; Degruyter& Bonadonna, 2013; Woodhouse et al., 2013; Suzuki & Koyaguchi, 2015). This range ofvalues leads to important discrepancies in predictions of maximum column heights andplume trajectories (Costa et al., 2016).
120
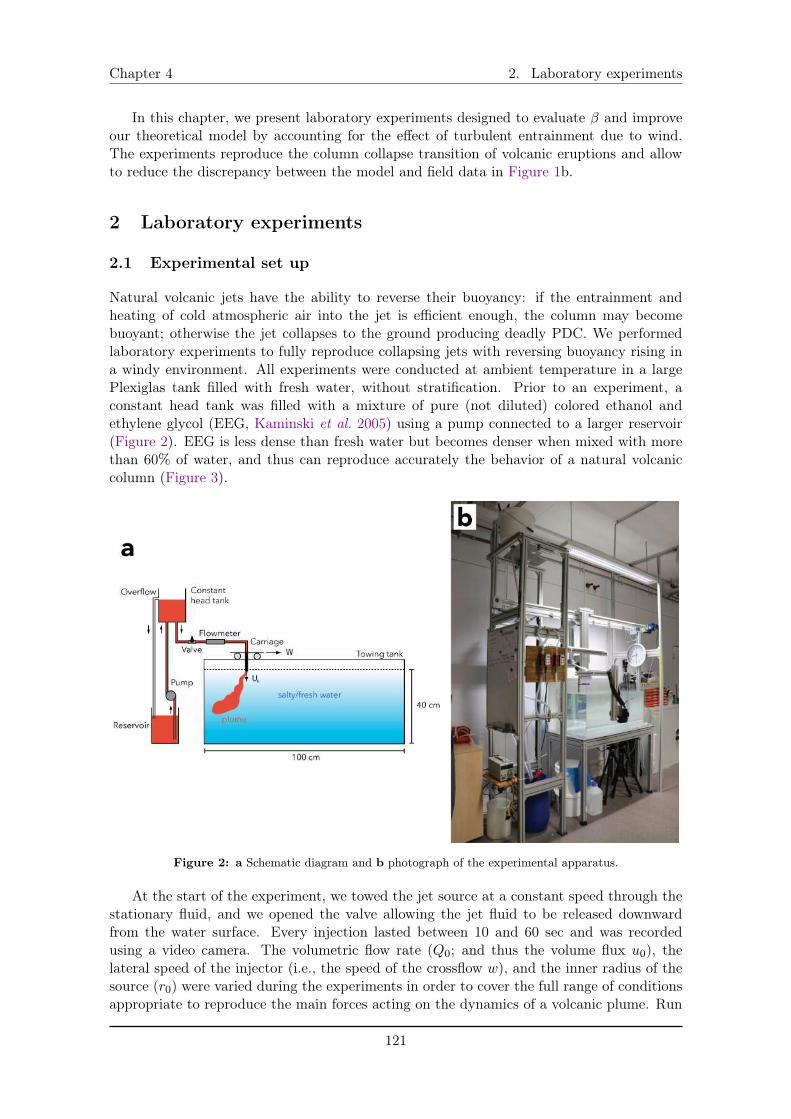
Chapter 4 2. Laboratory experiments
In this chapter, we present laboratory experiments designed to evaluate � and improveour theoretical model by accounting for the effect of turbulent entrainment due to wind.The experiments reproduce the column collapse transition of volcanic eruptions and allowto reduce the discrepancy between the model and field data in Figure 1b.
2 Laboratory experiments
2.1 Experimental set up
Natural volcanic jets have the ability to reverse their buoyancy: if the entrainment andheating of cold atmospheric air into the jet is efficient enough, the column may becomebuoyant; otherwise the jet collapses to the ground producing deadly PDC. We performedlaboratory experiments to fully reproduce collapsing jets with reversing buoyancy rising ina windy environment. All experiments were conducted at ambient temperature in a largePlexiglas tank filled with fresh water, without stratification. Prior to an experiment, aconstant head tank was filled with a mixture of pure (not diluted) colored ethanol andethylene glycol (EEG, Kaminski et al. 2005) using a pump connected to a larger reservoir(Figure 2). EEG is less dense than fresh water but becomes denser when mixed with morethan 60% of water, and thus can reproduce accurately the behavior of a natural volcaniccolumn (Figure 3).
Figure 2: a Schematic diagram and b photograph of the experimental apparatus.
At the start of the experiment, we towed the jet source at a constant speed through thestationary fluid, and we opened the valve allowing the jet fluid to be released downwardfrom the water surface. Every injection lasted between 10 and 60 sec and was recordedusing a video camera. The volumetric flow rate (Q0; and thus the volume flux u0), thelateral speed of the injector (i.e., the speed of the crossflow w), and the inner radius of thesource (r0) were varied during the experiments in order to cover the full range of conditionsappropriate to reproduce the main forces acting on the dynamics of a volcanic plume. Run
121
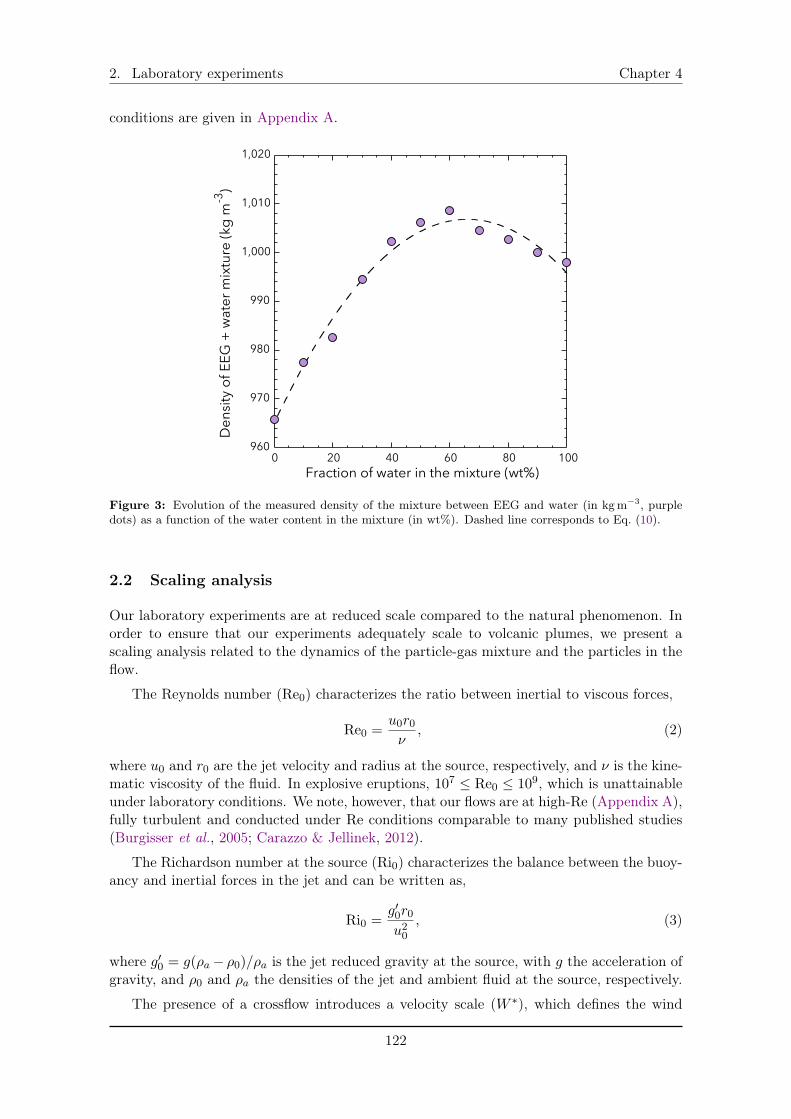
2. Laboratory experiments Chapter 4
conditions are given in Appendix A.
960
970
980
990
1,000
1,010
1,020
0 20 40 60 80 100
Dens
ity o
f EEG
+ w
ater
mixt
ure
(kg
m -3 )
Fraction of water in the mixture (wt%)
Figure 3: Evolution of the measured density of the mixture between EEG and water (in kgm�3, purpledots) as a function of the water content in the mixture (in wt%). Dashed line corresponds to Eq. (10).
2.2 Scaling analysis
Our laboratory experiments are at reduced scale compared to the natural phenomenon. Inorder to ensure that our experiments adequately scale to volcanic plumes, we present ascaling analysis related to the dynamics of the particle-gas mixture and the particles in theflow.
The Reynolds number (Re0) characterizes the ratio between inertial to viscous forces,
Re0 =u0r0⌫
, (2)
where u0 and r0 are the jet velocity and radius at the source, respectively, and ⌫ is the kine-matic viscosity of the fluid. In explosive eruptions, 107 Re0 10
9, which is unattainableunder laboratory conditions. We note, however, that our flows are at high-Re (Appendix A),fully turbulent and conducted under Re conditions comparable to many published studies(Burgisser et al., 2005; Carazzo & Jellinek, 2012).
The Richardson number at the source (Ri0) characterizes the balance between the buoy-ancy and inertial forces in the jet and can be written as,
Ri0 =g00r0u20
, (3)
where g00 = g(⇢a � ⇢0)/⇢a is the jet reduced gravity at the source, with g the acceleration ofgravity, and ⇢0 and ⇢a the densities of the jet and ambient fluid at the source, respectively.
The presence of a crossflow introduces a velocity scale (W ⇤), which defines the wind
122
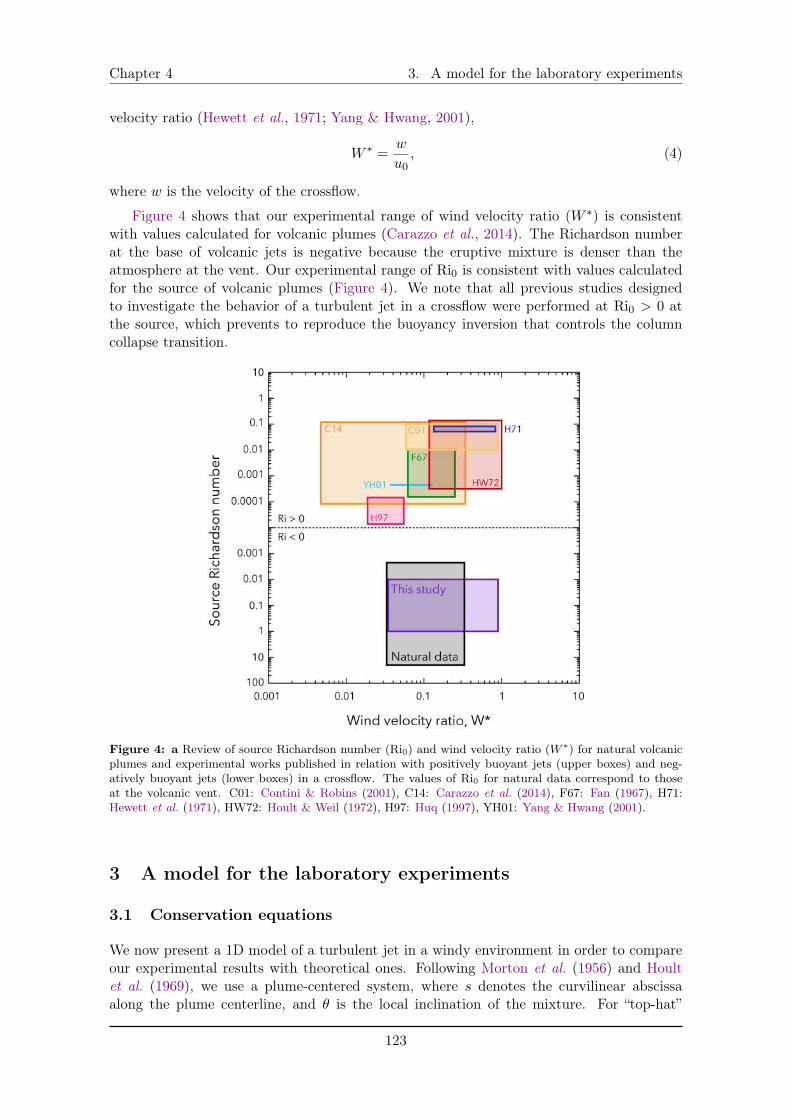
Chapter 4 3. A model for the laboratory experiments
velocity ratio (Hewett et al., 1971; Yang & Hwang, 2001),
W ⇤=
w
u0, (4)
where w is the velocity of the crossflow.
Figure 4 shows that our experimental range of wind velocity ratio (W ⇤) is consistentwith values calculated for volcanic plumes (Carazzo et al., 2014). The Richardson numberat the base of volcanic jets is negative because the eruptive mixture is denser than theatmosphere at the vent. Our experimental range of Ri0 is consistent with values calculatedfor the source of volcanic plumes (Figure 4). We note that all previous studies designedto investigate the behavior of a turbulent jet in a crossflow were performed at Ri0 > 0 atthe source, which prevents to reproduce the buoyancy inversion that controls the columncollapse transition.
Figure 4: a Review of source Richardson number (Ri0) and wind velocity ratio (W ⇤) for natural volcanicplumes and experimental works published in relation with positively buoyant jets (upper boxes) and neg-atively buoyant jets (lower boxes) in a crossflow. The values of Ri0 for natural data correspond to thoseat the volcanic vent. C01: Contini & Robins (2001), C14: Carazzo et al. (2014), F67: Fan (1967), H71:Hewett et al. (1971), HW72: Hoult & Weil (1972), H97: Huq (1997), YH01: Yang & Hwang (2001).
3 A model for the laboratory experiments
3.1 Conservation equations
We now present a 1D model of a turbulent jet in a windy environment in order to compareour experimental results with theoretical ones. Following Morton et al. (1956) and Houltet al. (1969), we use a plume-centered system, where s denotes the curvilinear abscissaalong the plume centerline, and ✓ is the local inclination of the mixture. For “top-hat”
123
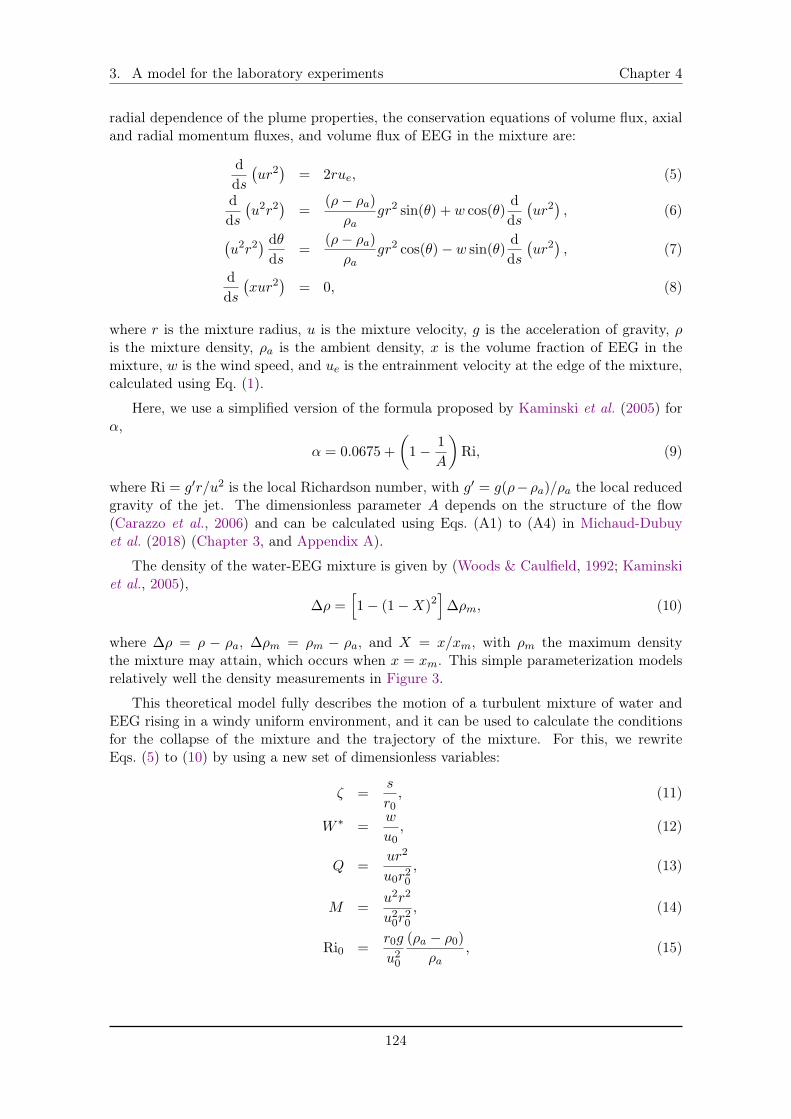
3. A model for the laboratory experiments Chapter 4
radial dependence of the plume properties, the conservation equations of volume flux, axialand radial momentum fluxes, and volume flux of EEG in the mixture are:
d
ds
�
ur2�
= 2rue, (5)
d
ds
�
u2r2�
=
(⇢� ⇢a)
⇢agr2 sin(✓) + w cos(✓)
d
ds
�
ur2�
, (6)
�
u2r2�
d✓
ds=
(⇢� ⇢a)
⇢agr2 cos(✓)� w sin(✓)
d
ds
�
ur2�
, (7)
d
ds
�
xur2�
= 0, (8)
where r is the mixture radius, u is the mixture velocity, g is the acceleration of gravity, ⇢is the mixture density, ⇢a is the ambient density, x is the volume fraction of EEG in themixture, w is the wind speed, and ue is the entrainment velocity at the edge of the mixture,calculated using Eq. (1).
Here, we use a simplified version of the formula proposed by Kaminski et al. (2005) for↵,
↵ = 0.0675 +
✓
1� 1
A
◆
Ri, (9)
where Ri = g0r/u2 is the local Richardson number, with g0 = g(⇢�⇢a)/⇢a the local reducedgravity of the jet. The dimensionless parameter A depends on the structure of the flow(Carazzo et al., 2006) and can be calculated using Eqs. (A1) to (A4) in Michaud-Dubuyet al. (2018) (Chapter 3, and Appendix A).
The density of the water-EEG mixture is given by (Woods & Caulfield, 1992; Kaminskiet al., 2005),
�⇢ =
h
1� (1�X)
2i
�⇢m, (10)
where �⇢ = ⇢ � ⇢a, �⇢m = ⇢m � ⇢a, and X = x/xm, with ⇢m the maximum densitythe mixture may attain, which occurs when x = xm. This simple parameterization modelsrelatively well the density measurements in Figure 3.
This theoretical model fully describes the motion of a turbulent mixture of water andEEG rising in a windy uniform environment, and it can be used to calculate the conditionsfor the collapse of the mixture and the trajectory of the mixture. For this, we rewriteEqs. (5) to (10) by using a new set of dimensionless variables:
⇣ =
s
r0, (11)
W ⇤=
w
u0, (12)
Q =
ur2
u0r20, (13)
M =
u2r2
u20r20
, (14)
Ri0 =
r0g
u20
(⇢a � ⇢0)
⇢a, (15)
124
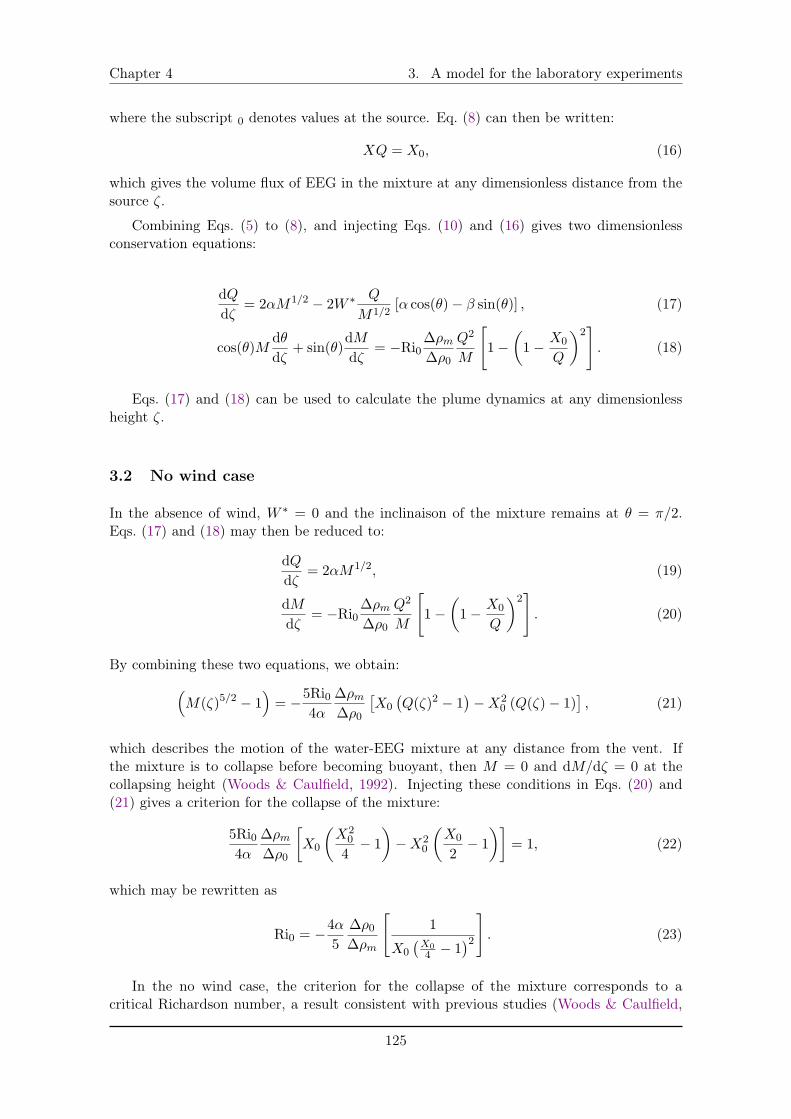
Chapter 4 3. A model for the laboratory experiments
where the subscript 0 denotes values at the source. Eq. (8) can then be written:
XQ = X0, (16)
which gives the volume flux of EEG in the mixture at any dimensionless distance from thesource ⇣.
Combining Eqs. (5) to (8), and injecting Eqs. (10) and (16) gives two dimensionlessconservation equations:
dQ
d⇣= 2↵M1/2 � 2W ⇤ Q
M1/2[↵ cos(✓)� � sin(✓)] , (17)
cos(✓)Md✓
d⇣+ sin(✓)
dM
d⇣= �Ri0
�⇢m�⇢0
Q2
M
"
1�✓
1� X0
Q
◆2#
. (18)
Eqs. (17) and (18) can be used to calculate the plume dynamics at any dimensionlessheight ⇣.
3.2 No wind case
In the absence of wind, W ⇤= 0 and the inclinaison of the mixture remains at ✓ = ⇡/2.
Eqs. (17) and (18) may then be reduced to:
dQ
d⇣= 2↵M1/2, (19)
dM
d⇣= �Ri0
�⇢m�⇢0
Q2
M
"
1�✓
1� X0
Q
◆2#
. (20)
By combining these two equations, we obtain:⇣
M(⇣)5/2 � 1
⌘
= �5Ri0
4↵
�⇢m�⇢0
⇥
X0�
Q(⇣)2 � 1
�
�X20 (Q(⇣)� 1)
⇤
, (21)
which describes the motion of the water-EEG mixture at any distance from the vent. Ifthe mixture is to collapse before becoming buoyant, then M = 0 and dM/d⇣ = 0 at thecollapsing height (Woods & Caulfield, 1992). Injecting these conditions in Eqs. (20) and(21) gives a criterion for the collapse of the mixture:
5Ri0
4↵
�⇢m�⇢0
X0
✓
X20
4
� 1
◆
�X20
✓
X0
2
� 1
◆�
= 1, (22)
which may be rewritten as
Ri0 = �4↵
5
�⇢0�⇢m
"
1
X0�
X04 � 1
�2
#
. (23)
In the no wind case, the criterion for the collapse of the mixture corresponds to acritical Richardson number, a result consistent with previous studies (Woods & Caulfield,
125
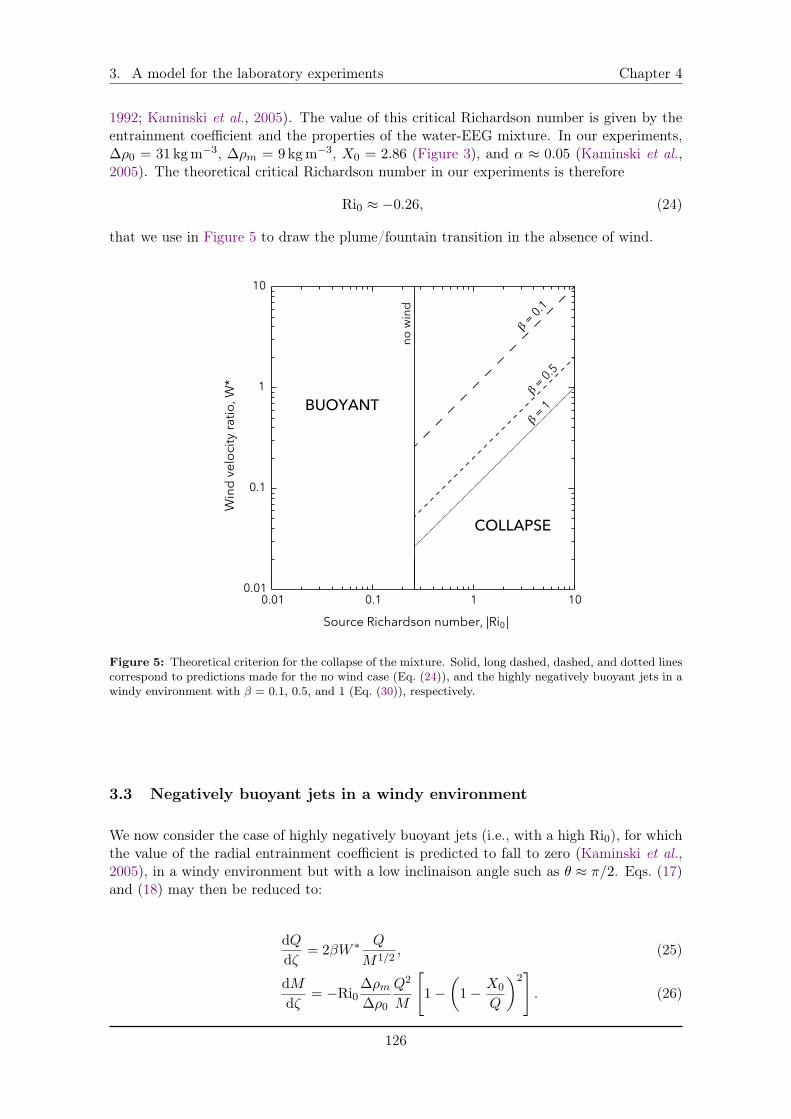
3. A model for the laboratory experiments Chapter 4
1992; Kaminski et al., 2005). The value of this critical Richardson number is given by theentrainment coefficient and the properties of the water-EEG mixture. In our experiments,�⇢0 = 31 kgm
�3, �⇢m = 9kgm
�3, X0 = 2.86 (Figure 3), and ↵ ⇡ 0.05 (Kaminski et al.,2005). The theoretical critical Richardson number in our experiments is therefore
Ri0 ⇡ �0.26, (24)
that we use in Figure 5 to draw the plume/fountain transition in the absence of wind.
0.01
0.1
1
10
0.01 0.1 1 10
Win
d ve
locit
y rat
io, W
*
Source Richardson number, |Ri |0
β = 0.1
no w
ind
COLLAPSE
BUOYANTβ =
0.5
β = 1
Figure 5: Theoretical criterion for the collapse of the mixture. Solid, long dashed, dashed, and dotted linescorrespond to predictions made for the no wind case (Eq. (24)), and the highly negatively buoyant jets in awindy environment with � = 0.1, 0.5, and 1 (Eq. (30)), respectively.
3.3 Negatively buoyant jets in a windy environment
We now consider the case of highly negatively buoyant jets (i.e., with a high Ri0), for whichthe value of the radial entrainment coefficient is predicted to fall to zero (Kaminski et al.,2005), in a windy environment but with a low inclinaison angle such as ✓ ⇡ ⇡/2. Eqs. (17)and (18) may then be reduced to:
dQ
d⇣= 2�W ⇤ Q
M1/2, (25)
dM
d⇣= �Ri0
�⇢m�⇢0
Q2
M
"
1�✓
1� X0
Q
◆2#
. (26)
126
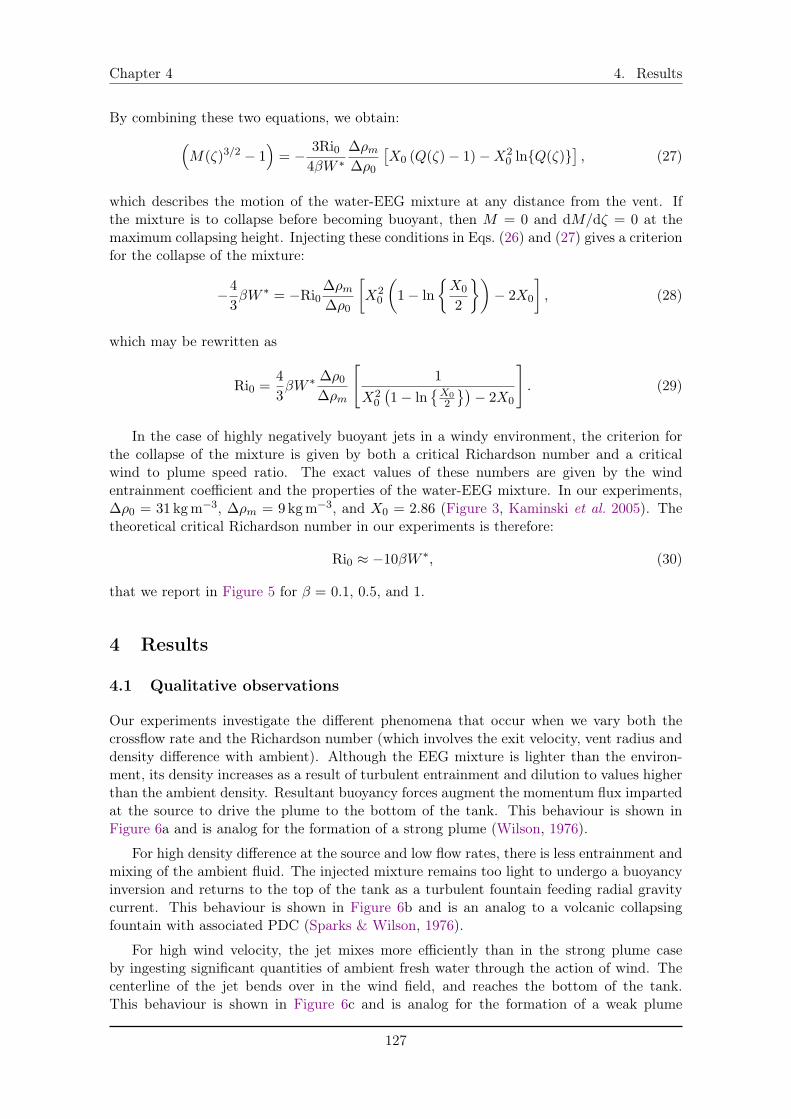
Chapter 4 4. Results
By combining these two equations, we obtain:⇣
M(⇣)3/2 � 1
⌘
= � 3Ri0
4�W ⇤�⇢m�⇢0
⇥
X0 (Q(⇣)� 1)�X20 ln{Q(⇣)}
⇤
, (27)
which describes the motion of the water-EEG mixture at any distance from the vent. Ifthe mixture is to collapse before becoming buoyant, then M = 0 and dM/d⇣ = 0 at themaximum collapsing height. Injecting these conditions in Eqs. (26) and (27) gives a criterionfor the collapse of the mixture:
�4
3
�W ⇤= �Ri0
�⇢m�⇢0
X20
✓
1� ln
⇢
X0
2
�◆
� 2X0
�
, (28)
which may be rewritten as
Ri0 =4
3
�W ⇤ �⇢0�⇢m
"
1
X20
�
1� ln
�
X02
�
� 2X0
#
. (29)
In the case of highly negatively buoyant jets in a windy environment, the criterion forthe collapse of the mixture is given by both a critical Richardson number and a criticalwind to plume speed ratio. The exact values of these numbers are given by the windentrainment coefficient and the properties of the water-EEG mixture. In our experiments,�⇢0 = 31 kgm
�3, �⇢m = 9kgm
�3, and X0 = 2.86 (Figure 3, Kaminski et al. 2005). Thetheoretical critical Richardson number in our experiments is therefore:
Ri0 ⇡ �10�W ⇤, (30)
that we report in Figure 5 for � = 0.1, 0.5, and 1.
4 Results
4.1 Qualitative observations
Our experiments investigate the different phenomena that occur when we vary both thecrossflow rate and the Richardson number (which involves the exit velocity, vent radius anddensity difference with ambient). Although the EEG mixture is lighter than the environ-ment, its density increases as a result of turbulent entrainment and dilution to values higherthan the ambient density. Resultant buoyancy forces augment the momentum flux impartedat the source to drive the plume to the bottom of the tank. This behaviour is shown inFigure 6a and is analog for the formation of a strong plume (Wilson, 1976).
For high density difference at the source and low flow rates, there is less entrainment andmixing of the ambient fluid. The injected mixture remains too light to undergo a buoyancyinversion and returns to the top of the tank as a turbulent fountain feeding radial gravitycurrent. This behaviour is shown in Figure 6b and is an analog to a volcanic collapsingfountain with associated PDC (Sparks & Wilson, 1976).
For high wind velocity, the jet mixes more efficiently than in the strong plume caseby ingesting significant quantities of ambient fresh water through the action of wind. Thecenterline of the jet bends over in the wind field, and reaches the bottom of the tank.This behaviour is shown in Figure 6c and is analog for the formation of a weak plume
127
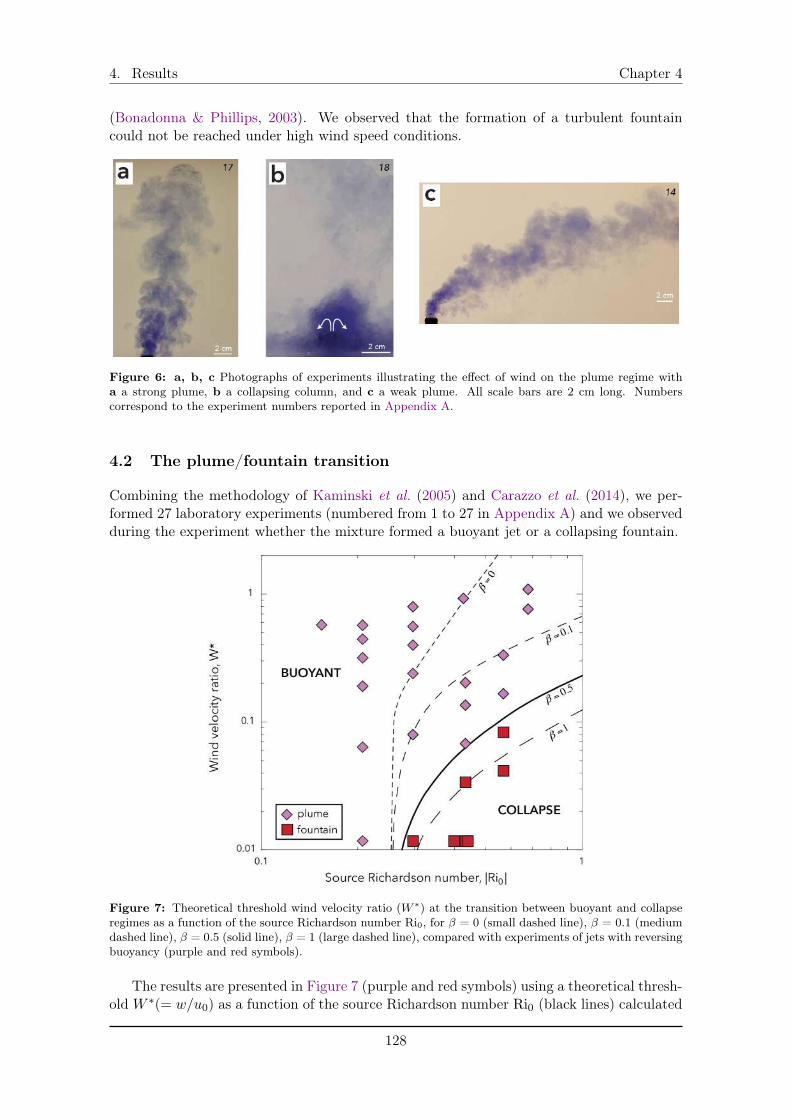
4. Results Chapter 4
(Bonadonna & Phillips, 2003). We observed that the formation of a turbulent fountaincould not be reached under high wind speed conditions.
Figure 6: a, b, c Photographs of experiments illustrating the effect of wind on the plume regime witha a strong plume, b a collapsing column, and c a weak plume. All scale bars are 2 cm long. Numberscorrespond to the experiment numbers reported in Appendix A.
4.2 The plume/fountain transition
Combining the methodology of Kaminski et al. (2005) and Carazzo et al. (2014), we per-formed 27 laboratory experiments (numbered from 1 to 27 in Appendix A) and we observedduring the experiment whether the mixture formed a buoyant jet or a collapsing fountain.
Figure 7: Theoretical threshold wind velocity ratio (W ⇤) at the transition between buoyant and collapseregimes as a function of the source Richardson number Ri0, for � = 0 (small dashed line), � = 0.1 (mediumdashed line), � = 0.5 (solid line), � = 1 (large dashed line), compared with experiments of jets with reversingbuoyancy (purple and red symbols).
The results are presented in Figure 7 (purple and red symbols) using a theoretical thresh-old W ⇤(= w/u0) as a function of the source Richardson number Ri0 (black lines) calculated
128
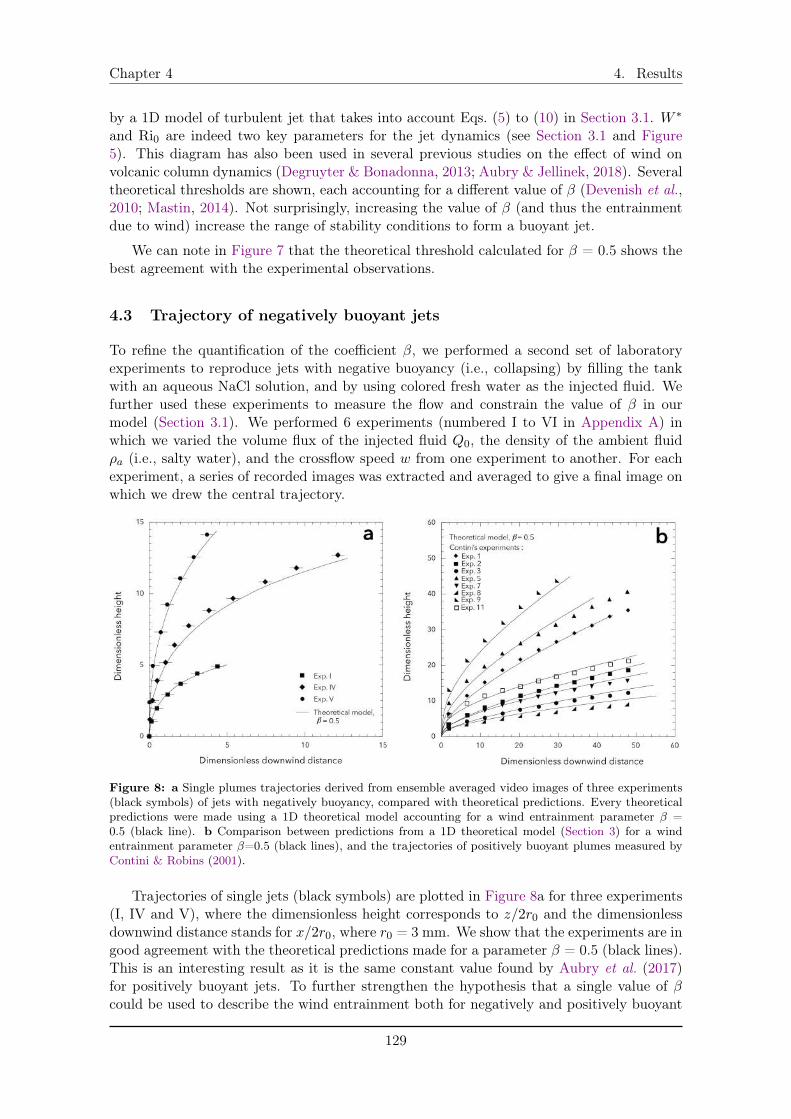
Chapter 4 4. Results
by a 1D model of turbulent jet that takes into account Eqs. (5) to (10) in Section 3.1. W ⇤
and Ri0 are indeed two key parameters for the jet dynamics (see Section 3.1 and Figure5). This diagram has also been used in several previous studies on the effect of wind onvolcanic column dynamics (Degruyter & Bonadonna, 2013; Aubry & Jellinek, 2018). Severaltheoretical thresholds are shown, each accounting for a different value of � (Devenish et al.,2010; Mastin, 2014). Not surprisingly, increasing the value of � (and thus the entrainmentdue to wind) increase the range of stability conditions to form a buoyant jet.
We can note in Figure 7 that the theoretical threshold calculated for � = 0.5 shows thebest agreement with the experimental observations.
4.3 Trajectory of negatively buoyant jets
To refine the quantification of the coefficient �, we performed a second set of laboratoryexperiments to reproduce jets with negative buoyancy (i.e., collapsing) by filling the tankwith an aqueous NaCl solution, and by using colored fresh water as the injected fluid. Wefurther used these experiments to measure the flow and constrain the value of � in ourmodel (Section 3.1). We performed 6 experiments (numbered I to VI in Appendix A) inwhich we varied the volume flux of the injected fluid Q0, the density of the ambient fluid⇢a (i.e., salty water), and the crossflow speed w from one experiment to another. For eachexperiment, a series of recorded images was extracted and averaged to give a final image onwhich we drew the central trajectory.
Figure 8: a Single plumes trajectories derived from ensemble averaged video images of three experiments(black symbols) of jets with negatively buoyancy, compared with theoretical predictions. Every theoreticalpredictions were made using a 1D theoretical model accounting for a wind entrainment parameter � =0.5 (black line). b Comparison between predictions from a 1D theoretical model (Section 3) for a windentrainment parameter �=0.5 (black lines), and the trajectories of positively buoyant plumes measured byContini & Robins (2001).
Trajectories of single jets (black symbols) are plotted in Figure 8a for three experiments(I, IV and V), where the dimensionless height corresponds to z/2r0 and the dimensionlessdownwind distance stands for x/2r0, where r0 = 3 mm. We show that the experiments are ingood agreement with the theoretical predictions made for a parameter � = 0.5 (black lines).This is an interesting result as it is the same constant value found by Aubry et al. (2017)for positively buoyant jets. To further strengthen the hypothesis that a single value of �could be used to describe the wind entrainment both for negatively and positively buoyant
129
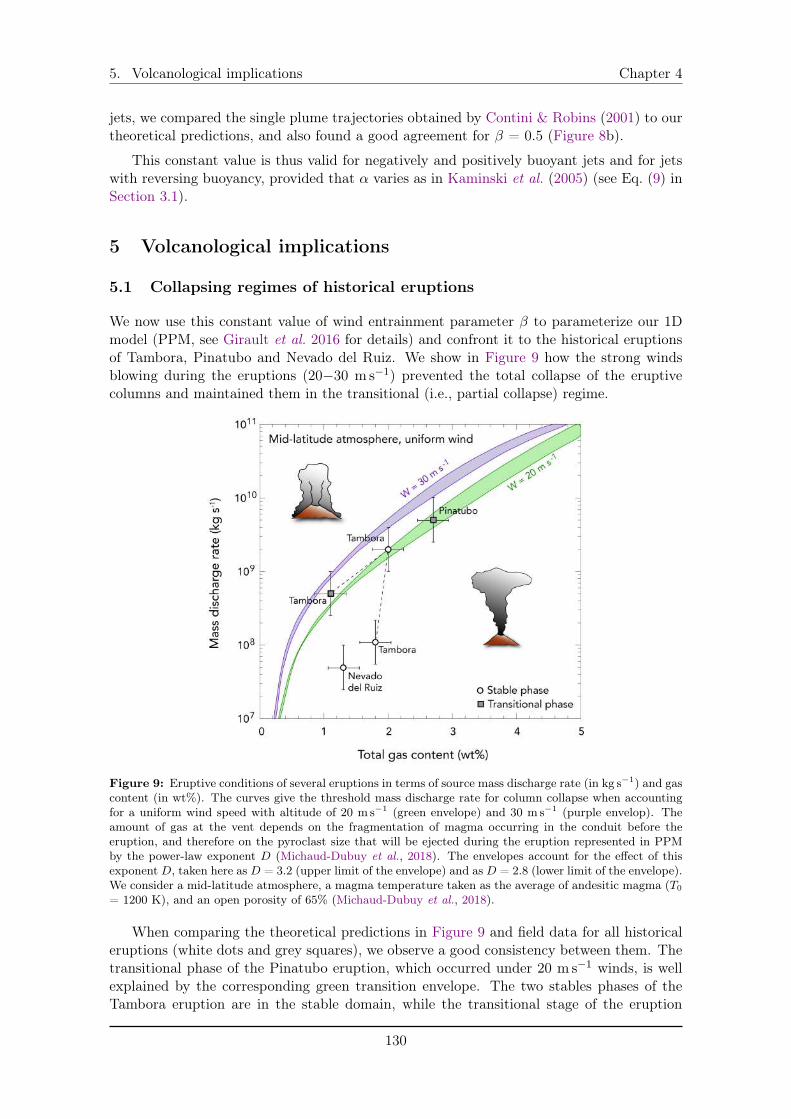
5. Volcanological implications Chapter 4
jets, we compared the single plume trajectories obtained by Contini & Robins (2001) to ourtheoretical predictions, and also found a good agreement for � = 0.5 (Figure 8b).
This constant value is thus valid for negatively and positively buoyant jets and for jetswith reversing buoyancy, provided that ↵ varies as in Kaminski et al. (2005) (see Eq. (9) inSection 3.1).
5 Volcanological implications
5.1 Collapsing regimes of historical eruptions
We now use this constant value of wind entrainment parameter � to parameterize our 1Dmodel (PPM, see Girault et al. 2016 for details) and confront it to the historical eruptionsof Tambora, Pinatubo and Nevado del Ruiz. We show in Figure 9 how the strong windsblowing during the eruptions (20�30 ms
�1) prevented the total collapse of the eruptivecolumns and maintained them in the transitional (i.e., partial collapse) regime.
Figure 9: Eruptive conditions of several eruptions in terms of source mass discharge rate (in kg s�1) and gascontent (in wt%). The curves give the threshold mass discharge rate for column collapse when accountingfor a uniform wind speed with altitude of 20 ms�1 (green envelope) and 30 ms�1 (purple envelop). Theamount of gas at the vent depends on the fragmentation of magma occurring in the conduit before theeruption, and therefore on the pyroclast size that will be ejected during the eruption represented in PPMby the power-law exponent D (Michaud-Dubuy et al., 2018). The envelopes account for the effect of thisexponent D, taken here as D = 3.2 (upper limit of the envelope) and as D = 2.8 (lower limit of the envelope).We consider a mid-latitude atmosphere, a magma temperature taken as the average of andesitic magma (T0
= 1200 K), and an open porosity of 65% (Michaud-Dubuy et al., 2018).
When comparing the theoretical predictions in Figure 9 and field data for all historicaleruptions (white dots and grey squares), we observe a good consistency between them. Thetransitional phase of the Pinatubo eruption, which occurred under 20 ms
�1 winds, is wellexplained by the corresponding green transition envelope. The two stables phases of theTambora eruption are in the stable domain, while the transitional stage of the eruption
130
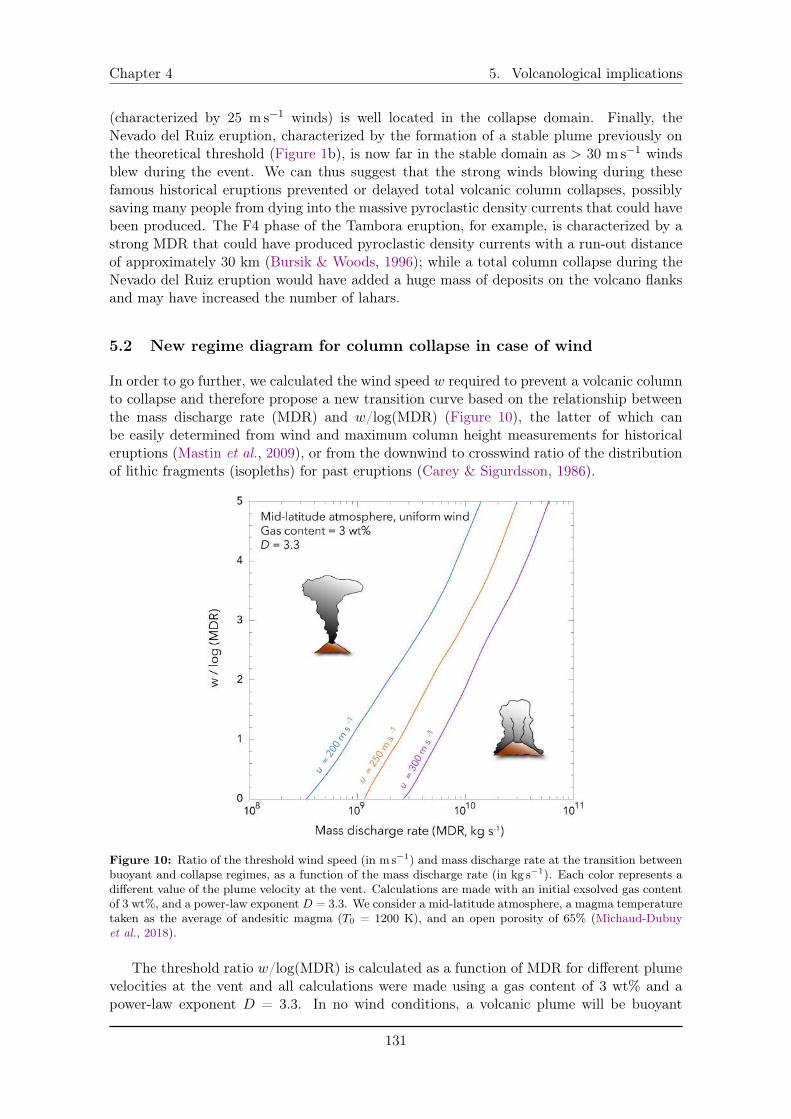
Chapter 4 5. Volcanological implications
(characterized by 25 ms
�1 winds) is well located in the collapse domain. Finally, theNevado del Ruiz eruption, characterized by the formation of a stable plume previously onthe theoretical threshold (Figure 1b), is now far in the stable domain as > 30 ms
�1 windsblew during the event. We can thus suggest that the strong winds blowing during thesefamous historical eruptions prevented or delayed total volcanic column collapses, possiblysaving many people from dying into the massive pyroclastic density currents that could havebeen produced. The F4 phase of the Tambora eruption, for example, is characterized by astrong MDR that could have produced pyroclastic density currents with a run-out distanceof approximately 30 km (Bursik & Woods, 1996); while a total column collapse during theNevado del Ruiz eruption would have added a huge mass of deposits on the volcano flanksand may have increased the number of lahars.
5.2 New regime diagram for column collapse in case of wind
In order to go further, we calculated the wind speed w required to prevent a volcanic columnto collapse and therefore propose a new transition curve based on the relationship betweenthe mass discharge rate (MDR) and w/log(MDR) (Figure 10), the latter of which canbe easily determined from wind and maximum column height measurements for historicaleruptions (Mastin et al., 2009), or from the downwind to crosswind ratio of the distributionof lithic fragments (isopleths) for past eruptions (Carey & Sigurdsson, 1986).
Figure 10: Ratio of the threshold wind speed (in ms�1) and mass discharge rate at the transition betweenbuoyant and collapse regimes, as a function of the mass discharge rate (in kg s�1). Each color represents adifferent value of the plume velocity at the vent. Calculations are made with an initial exsolved gas contentof 3 wt%, and a power-law exponent D = 3.3. We consider a mid-latitude atmosphere, a magma temperaturetaken as the average of andesitic magma (T0 = 1200 K), and an open porosity of 65% (Michaud-Dubuyet al., 2018).
The threshold ratio w/log(MDR) is calculated as a function of MDR for different plumevelocities at the vent and all calculations were made using a gas content of 3 wt% and apower-law exponent D = 3.3. In no wind conditions, a volcanic plume will be buoyant
131
6. Conclusion Chapter 4
regardless of its initial velocity as long as the MDR is smaller than 3 ⇥10
8kg s
�1, thusdefining a minimal mass discharge rate below which there is no column collapse. If windblows during the eruption, the threshold ratio w/log(MDR) steadily increases with theMDR. Our new transition diagram involves physical parameters (w and MDR) that are mucheasier to estimate from field data than the dimensionless numbers (e.g., Richardson numberor overpressure ratio) involved in previous regime diagrams (Degruyter & Bonadonna, 2013;Valentine & Wohletz, 1989). This simplified diagram may thus help to compare easily theresults from physical models and field studies on the collapse of explosive plumes.
Our results show that isopleth shapes determined in the field could be a dominant crite-rion for investigating the column behavior of past eruptions. Fine and elongated isoplethswould mean that w/log(MDR) was high and that the Plinian column could have beenrather stable; while wide and shortened isopleths would correspond to low w/log(MDR)and possibly to a more unstable column. This conclusion has strong implications for thereconstruction of past eruptive histories of active volcanoes, and thus on the prevision offuture events.
6 Conclusion
We presented new laboratory experiments simulating turbulent jets with a reversing buoy-ancy rising in a windy environment. The results on plume/fountain transition and jettrajectory show that the entrainment coefficient due to wind is � = 0.5, provided that ↵varies as in Kaminski et al. (2005). Using this constant value in our 1D model of volcanicplume (PPM) allows to reconcile field data and theoretical predictions for the 1815 Tamb-ora, 1985 Nevado del Ruiz, and 1991 Pinatubo eruptions. Strong winds can indeed favorvolcanic plume stability, and prevent the formation of deadly PDC on the volcano flanks.This study opens a new perspective on the strong importance of wind at every stage ofan eruption, from the inner column dynamics to the dispersion of volcanic products in theatmosphere, and thus on the volcanic hazard assessment.
We thus demonstrated, in the second part of this PhD thesis manuscript, the importanceof both the total grain-size distribution and the wind on volcanic column collapse. In thelast part, we will focus on the effect of wind on tephra dispersion and perform 2D simulationsfor two of the newly discovered/revisited eruptions of Mount Pelée volcano in Martinique.The results will then be integrated to produce new hazard maps.
132
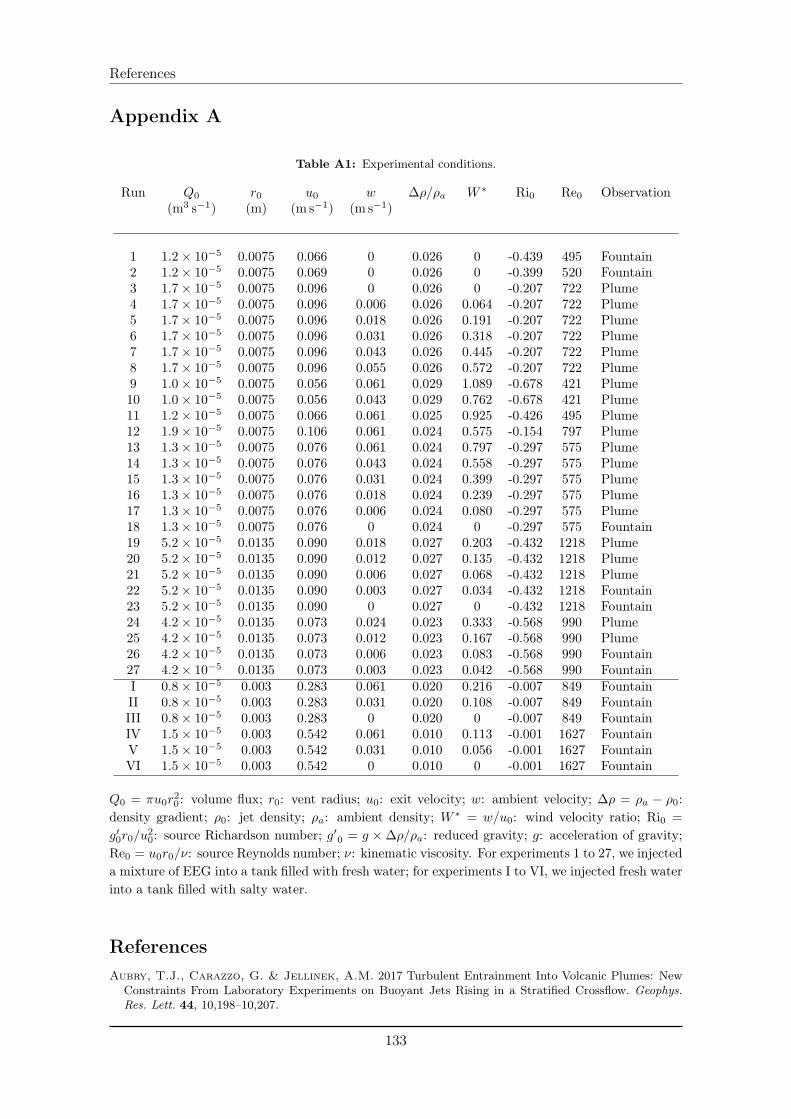
References
Appendix A
Table A1: Experimental conditions.
Run Q0 r0 u0 w �⇢/⇢a W ⇤Ri0 Re0 Observation
(m3s
�1) (m) (ms
�1) (ms
�1)
1 1.2⇥ 10
�5 0.0075 0.066 0 0.026 0 -0.439 495 Fountain2 1.2⇥ 10
�5 0.0075 0.069 0 0.026 0 -0.399 520 Fountain3 1.7⇥ 10
�5 0.0075 0.096 0 0.026 0 -0.207 722 Plume4 1.7⇥ 10
�5 0.0075 0.096 0.006 0.026 0.064 -0.207 722 Plume5 1.7⇥ 10
�5 0.0075 0.096 0.018 0.026 0.191 -0.207 722 Plume6 1.7⇥ 10
�5 0.0075 0.096 0.031 0.026 0.318 -0.207 722 Plume7 1.7⇥ 10
�5 0.0075 0.096 0.043 0.026 0.445 -0.207 722 Plume8 1.7⇥ 10
�5 0.0075 0.096 0.055 0.026 0.572 -0.207 722 Plume9 1.0⇥ 10
�5 0.0075 0.056 0.061 0.029 1.089 -0.678 421 Plume10 1.0⇥ 10
�5 0.0075 0.056 0.043 0.029 0.762 -0.678 421 Plume11 1.2⇥ 10
�5 0.0075 0.066 0.061 0.025 0.925 -0.426 495 Plume12 1.9⇥ 10
�5 0.0075 0.106 0.061 0.024 0.575 -0.154 797 Plume13 1.3⇥ 10
�5 0.0075 0.076 0.061 0.024 0.797 -0.297 575 Plume14 1.3⇥ 10
�5 0.0075 0.076 0.043 0.024 0.558 -0.297 575 Plume15 1.3⇥ 10
�5 0.0075 0.076 0.031 0.024 0.399 -0.297 575 Plume16 1.3⇥ 10
�5 0.0075 0.076 0.018 0.024 0.239 -0.297 575 Plume17 1.3⇥ 10
�5 0.0075 0.076 0.006 0.024 0.080 -0.297 575 Plume18 1.3⇥ 10
�5 0.0075 0.076 0 0.024 0 -0.297 575 Fountain19 5.2⇥ 10
�5 0.0135 0.090 0.018 0.027 0.203 -0.432 1218 Plume20 5.2⇥ 10
�5 0.0135 0.090 0.012 0.027 0.135 -0.432 1218 Plume21 5.2⇥ 10
�5 0.0135 0.090 0.006 0.027 0.068 -0.432 1218 Plume22 5.2⇥ 10
�5 0.0135 0.090 0.003 0.027 0.034 -0.432 1218 Fountain23 5.2⇥ 10
�5 0.0135 0.090 0 0.027 0 -0.432 1218 Fountain24 4.2⇥ 10
�5 0.0135 0.073 0.024 0.023 0.333 -0.568 990 Plume25 4.2⇥ 10
�5 0.0135 0.073 0.012 0.023 0.167 -0.568 990 Plume26 4.2⇥ 10
�5 0.0135 0.073 0.006 0.023 0.083 -0.568 990 Fountain27 4.2⇥ 10
�5 0.0135 0.073 0.003 0.023 0.042 -0.568 990 FountainI 0.8⇥ 10
�5 0.003 0.283 0.061 0.020 0.216 -0.007 849 FountainII 0.8⇥ 10
�5 0.003 0.283 0.031 0.020 0.108 -0.007 849 FountainIII 0.8⇥ 10
�5 0.003 0.283 0 0.020 0 -0.007 849 FountainIV 1.5⇥ 10
�5 0.003 0.542 0.061 0.010 0.113 -0.001 1627 FountainV 1.5⇥ 10
�5 0.003 0.542 0.031 0.010 0.056 -0.001 1627 FountainVI 1.5⇥ 10
�5 0.003 0.542 0 0.010 0 -0.001 1627 Fountain
Q0 = ⇡u0r20: volume flux; r0: vent radius; u0: exit velocity; w: ambient velocity; �⇢ = ⇢a � ⇢0:density gradient; ⇢0: jet density; ⇢a: ambient density; W ⇤
= w/u0: wind velocity ratio; Ri0 =
g00r0/u20: source Richardson number; g00 = g ⇥�⇢/⇢a: reduced gravity; g: acceleration of gravity;
Re0 = u0r0/⌫: source Reynolds number; ⌫: kinematic viscosity. For experiments 1 to 27, we injecteda mixture of EEG into a tank filled with fresh water; for experiments I to VI, we injected fresh waterinto a tank filled with salty water.
ReferencesAubry, T.J., Carazzo, G. & Jellinek, A.M. 2017 Turbulent Entrainment Into Volcanic Plumes: New
Constraints From Laboratory Experiments on Buoyant Jets Rising in a Stratified Crossflow. Geophys.Res. Lett. 44, 10,198–10,207.
133
References
Aubry, T.J. & Jellinek, A.M. 2018 New insights on entrainment and condensation in volcanic plumes:Constraints from independent observations of explosive eruptions and implications for assessing theirimpacts. Earth Plan. Sci. Lett. 490, 132–142.
Bonadonna, C. & Phillips, J.C. 2003 Sedimentation from strong volcanic plumes. J. Geophys. Res. SolidEarth 108, 1–28.
Borisova, A.Y., Pichavant, M., Beny, J.-M., Rouer, O. & Pronost, J. 2005 Constraints on dacitemagma degassing and regime of the June 15, 1991, climactic eruption of Mount Pinatubo (Philippines):New data on melt and crystal inclusions in quartz. J. Volcanol. Geotherm. Res. 145, 35–67.
Burgisser, A., Bergantz, G. W. & Breidenthal, R. E. 2005 Addressing complexity in laboratoryexperiments: The scaling of dilute multiphase flows in magmatic systems. J. Volcanol. Geotherm. Res.141, 245–265.
Bursik, M. 2001 Effect of wind on the rise height of volcanic plumes. Geophys. Res. Lett. 28, 3621–3624.
Bursik, M.I. & Woods, A.W. 1996 The dynamics and thermodynamics of large ash flows. Bull. Volcanol.58, 175–193.
Carazzo, G., Girault, F., Aubry, T., Bouquerel, H. & Kaminski, E. 2014 Laboratory experimentsof forced plumes in a density-stratified crossflow and implications for volcanic plumes. Geophys. Res. Lett.41, 8759–8766.
Carazzo, G. & Jellinek, A. M. 2012 A new view of the dynamics, stability and longevity of volcanicclouds. Earth Planet. Sci. Lett. 325-326, 39–51.
Carazzo, G., Kaminski, E. & Tait, S. 2006 The route to self-similarity in turbulent jets and plumes. J.Fluid Mech. 547, 137–148.
Carazzo, G., Kaminski, E. & Tait, S. 2015 The timing and intensity of column collapse during explosivevolcanic eruptions. Earth Planet. Sci. Lett. 411, 208–217.
Carey, Steven & Sigurdsson, Haraldur 1986 The 1982 eruptions of El Chichon volcano, Mexico (2):Observations and numerical modelling of tephra-fall distribution. Bull. Volcanol. 48, 127–141.
Contini, D. & Robins, A. 2001 Water tank measurements of buoyant plume rise and structure in neutralcrossflows. Atmospheric Environment 35, 6105–6115.
Costa, A., Folch, A. & Macedonio, G. 2013 Density-driven transport in the umbrella region of volcanicclouds: implications for tephra dispersion models. Geophys. Res. Lett. 40, 4823–4827.
Costa, A., Suzuki, Y. J., Cerminara, M., Devenish, B. J., Esposti Ongaro, T., Herzog, M.,Van Eaton, A. R., Denby, L. C., Bursik, M., de’ Michieli Vitturi, M., Engwell, S., Neri, A.,Barsotti, S., Folch, A., Macedonio, G., Girault, F., Carazzo, G., Tait, S., Kaminski, E.,Mastin, L. G., Woodhouse, M. J., Phillips, J. C., Hogg, A. J., Degruyter, W. & Bonadonna,C. 2016 Results of the eruptive column model inter-comparison study. J. Volcanol. Geotherm. Res. 326,2–25.
D’Arrigo, R., Wilson, R. & Tudhope, A. 2009 The impact of volcanic forcing on tropical temperaturesduring the past four centuries. Nat. Geosci. 2.
Degruyter, W. & Bonadonna, C. 2013 Impact of wind on the condition for column collapse of volcanicplumes. Earth Planet. Sci. Lett. 377-378, 218–226.
Devenish, B.J., Rooney, G.G., Webster, H.N. & Thomson, D.J. 2010 The entrainment rate forbuoyant plumes in a crossflow. Boundary-Layer Meteorol. 134, 411–439.
Esposti Ongaro, T., Neri, A., Menconi, G., de’Michieli Vitturi, M., Marianelli, P., Cavazzoni,C., Erbacci, G. & Baxter, P. J. 2008 Transient 3D numerical simulations of column collapse andpyroclastic density current scenarios at Vesuvius. J. Volcanol. Geotherm. Res. 178 (3), 378–396.
Fan, L.-N. 1967 Turbulent buoyant jets into stratified or flowing ambient fluids. Tech. Rep. KH-R-15. W.M.Keck Laboratory of Hydrology and Water Resources, California Institute of Technology, Pasadena, CA,USA.
134
References
Fero, J., Carey, S.N. & Merrill, J.T. 2009 Simulating the dispersal of tephra from the 1991 Pinatuboeruption: Implications for the formation of widespread ash layers. J. Volcanol. Geotherm. Res. 186,120–131.
Girault, F., Carazzo, G., Tait, S., Ferrucci, F. & Kaminski, E. 2014 The effect of total grain-sizedistribution on the dynamics of turbulent volcanic plumes. Earth Planet. Sci. Lett. 394, 124–134.
Hewett, T.A., Fay, J.A. & Hoult, D.P. 1971 Laboratory experiments of smokestack plumes in a stableatmosphere. Atmos. Environ. 5, 459–461.
Holasek, R.E., Self, S. & Woods, A.W. 1996 Satellite observations and interpretation of the 1991Mount Pinatubo eruption plumes. J. Geophys. Res. 101, 27,635–27,655.
Hoult, D. P., Fay, J. A. & Forney, L. J. 1969 A theory of plume rise compared with field observations.J. Air Pollut. Contr. Assoc. 19, 585–590.
Hoult, D. P. & Weil, J. C. 1972 Turbulent plume in a laminar cross flow. Atmos. Environ. 6, 513–531.
Huq, P. 1997 Observations of jets in density stratified crossflows. Atmos. Environ. 31, 2011–2022.
Kaminski, E. & Jaupart, C. 2001 Marginal stability of atmospheric eruption columns and pyroclasticflow generation. J. Geophys. Res. 106 (B10), 21785–21798.
Kaminski, E., Tait, S. & Carazzo, G. 2005 Turbulent entrainment in jets with arbitrary buoyancy. J.Fluid Mech. 526, 361–376.
Kandlbauer, J. & Sparks, R.S.J. 2014 New estimates of the 1815 Tambora eruption volume. J. Volcanol.Geotherm. Res. 286, 93–100.
Koyaguchi, T. & Ohno, M. 2001 Reconstruction of eruption column dynamics on the basis of grain sizeof tephra fall deposits. 2. Application to the Pinatubo 1991 eruption. J. Geophys. Res. 106, 6513–6533.
Mastin, L. G. 2014 Testing the accuracy of a 1-D volcanic plume model in estimating mass eruption rate.J. Geophys. Res. 119, 2474–2495.
Mastin, L. G., Guffanti, M., Servranckx, R., Webley, P., Barsotti, S., Dean, K., Durant, A.,Ewert, J.W., Neri, A., Rose, W.I., Schneider, D., Siebert, L., Stunder, B., Swanson, G.,Tupper, A., Volentik, A. & Waythomas, C. F. 2009 A multidisciplinary effort to assign realisticsource parameters to models of volcanic ash-cloud transport and dispersion during eruptions. J. Volcanol.Geotherm. Res. 186, 10–21.
Melson, W.G., Allan, J.F., Jerez, D.R., Nelen, J., Calvache, M.L., Williams, S.N., Fournelle,J. & Perfit, M. 1990 Water contents, temperatures and diversity of the magmas of the catastrophiceruption of Nevado del Ruiz, Colombia, November 13, 1985. J. Volcanol. Geotherm. Res. 41, 91–126.
Michaud-Dubuy, A., Carazzo, G., Kaminski, E. & Girault, F. 2018 A revisit of the role of gasentrapment on the stability conditions of explosive volcanic columns. J. Volcanol. Geotherm. Res. 357,349–361.
Michaud-Dubuy, A., Carazzo, G., Tait, S., Le Hir, G., Fluteau, F. & Kaminski, E. 2019 Impactof wind direction variability on hazard assessment in Martinique (Lesser Antilles): The example of the13.5 ka cal BP Bellefontaine Plinian eruption of Mount Pelée volcano. J. Volcanol. Geotherm. Res. 381,193–208.
Morton, B.R., Taylor, G.I. & Turner, J.S. 1956 Turbulent gravitational convection from maintainedand instantaneous sources. Philos. Trans. R. Soc. A 234, 1–23.
Naranjo, J.L., Sigurdsson, H., Carey, S.N. & Fritz, W. 1986 Eruption of the Nevado del Ruizvolcano, Colombia, on 13 November 1985: Tephra fall and lahars. Science 233, 961–963.
Neri, A. & Dobran, F. 1994 Influence of eruption parameters on the thermofluid dynamics of collapsingvolcanic columns. J. Geophys. Res. 99 (B6), 11833–11857.
Newhall, Christopher G. & Self, Stephen 1982 The volcanic explosivity index (VEI) an estimate ofexplosive magnitude for historical volcanism. J. Geophys. Res. 87 (C2), 1231–1238.
135
References
Oppenheimer, C. 2003 Climatic, environmental and human consequences of the largest known historiceruption: Tambora volcano (Indonesia) 1815. Prog. Phys. Geogr. 27 (2), 230–259.
Self, S., Zhao, J.-X., Holasek, R.E., Torres, R.C. & King, A.J. 1996 The atmospheric impactof the 1991 Mount Pinatubo eruption. In Fire and Mud: Eruptions and Lahars of Mount Pinatubo,Philippines (ed. C.G. Newhall & R.S. Punongbayan), pp. 1089–1115. Philippine Institute of Volcanologyand Seismology, Queen City and University of Washington Press, Seattle.
Sigurdsson, H. & Carey, S. 1989 Plinian and co-ignimbrite tephra fall from the 1815 eruption of Tamboravolcano. Bull. Volcanol. 51, 243–270.
Sparks, R. S. J. 1986 The dimensions and dynamics of volcanic eruption columns. Bull. Volcanol. 48,3–15.
Sparks, R. S. J. & Wilson, L. 1976 A model for the formation of ignimbrite by gravitational columncollapse. J. Geol. Soc. Lond. 132, 441–451.
Suzuki, Y. & Koyaguchi, T. 2015 Effects of wind on entrainment in volcanic plumes. J. Geophys. Res.B. 120, 6122–6140.
Suzuki, Y. J., Koyaguchi, T., Ogawa, M. & Hachisu, I. 2005 A numerical study of turbulent mixingin eruption clouds using a three-dimensional fluid dynamics model. J. Geophys. Res. 110, B08201.
Tanguy, J.C., Ribière, Ch., Scarth, A. & Tjetjep, W.S. 1998 Victims from volcanic eruptions: Arevised database. Bull. Volcanol. 60, 137–144.
Valentine, G. A. & Wohletz, K. H. 1989 Numerical Models of Plinian Eruption Columns and Pyro-clastic Flows. J. Geophys. Res. 94 (B2), 1867–1887.
Wallace, P.J. 2005 Volatiles in subduction zone magmas: concentrations and fluxes based on melt inclu-sion and volcanic gas data. J. Volcanol. Geotherm. Res. 140, 217–240.
Wiesner, M.G., Wetzel, A., Catane, S.G., Listanco, E.L. & Mirabueno, H.T. 2004 Grain size,area thickness distribution and controls on sedimentation of the 1991 Mount Pinatubo tephra layer inthe South China Sea. Bull. Volcanol. 66, 226–242.
Wilson, L. 1976 Explosive Volcanic Eruptions: III. Plinian Eruption Columns. J. R. Astron. Soc. 45,543–556.
Wilson, L., Sparks, R. S. J. & Walker, G. P. L. 1980 Explosive volcanic eruptions - IV. The controlof magma properties and conduit geometry on eruption column behaviour. Geophys. J. R. Astron. Soc.63, 117–148.
Woodhouse, M. J., Hogg, A. J., Phillips, J. C. & Sparks, R. S. J. 2013 Interaction between volcanicplumes and wind during the 2010 Eyjafjallajökull eruption, Iceland. J. Geophys. Res. Solid Earth 118,92–109.
Woods, A.W. 1988 The fluid dynamics and thermodynamics of eruption columns. Bull. Volcanol. 50,169–193.
Woods, A. W. & Caulfield, C. P. 1992 A laboratory study of explosive volcanic eruptions. J. Geophys.Res. 97 (B5), 6699–6712.
Yang, W.-C. & Hwang, R. R. 2001 Vertical buoyant jets in a linearly stratified ambient cross-stream.Environ. Fluid Mech. 1, 235–256.
136
Part 3
Volcanic hazard assessment in
Martinique

Chapter 5
Modeling volcanic tephra dispersion
in Martinique
The results for the Bellefontaine eruption are published in Michaud-Dubuy A., Carazzo G.,Tait S., Le Hir G., Fluteau F., and Kaminski E. (2019) J. Volcanol. Geotherm. Res. 381,193-208. https://doi.org/10.1016/j.jvolgeores.2019.06.004
Table of contents1 Introduction . . . . . . . . . . . . . . . . . . . . . . . . . . . . . . . . . . 1412 The HAZMAP model . . . . . . . . . . . . . . . . . . . . . . . . . . . . . 142
2.1 Constitutive equations . . . . . . . . . . . . . . . . . . . . . . . . 1422.2 Input parameters . . . . . . . . . . . . . . . . . . . . . . . . . . . 143
2.2.1 Volcanological parameters . . . . . . . . . . . . . . . . 1432.2.2 Wind profiles from ERA Interim and ERA 5 . . . . . . 143
3 Predictions using mean seasonal wind profiles . . . . . . . . . . . . . . . 1453.1 The Bellefontaine eruption (13,516 yr cal BP) . . . . . . . . . . . 1453.2 The Balisier eruption (14,072 yr cal BP) . . . . . . . . . . . . . . 146
4 Dispersal modeling of eruption products . . . . . . . . . . . . . . . . . . . 1464.1 Northerly winds in Martinique (1979–2017) . . . . . . . . . . . . 1474.2 Can hurricanes explain the Bellefontaine pattern of deposition? . 1514.3 Dispersion of the Balisier deposits . . . . . . . . . . . . . . . . . . 155
5 Impact of wind on volcanic hazard assessment . . . . . . . . . . . . . . . 1576 Conclusion . . . . . . . . . . . . . . . . . . . . . . . . . . . . . . . . . . . 159

Chapter 5
Résumé du chapitre 5
Nous avons étudié dans le chapitre précédent l’effet du vent sur la stabilité des colonnesvolcaniques. Dans ce chapitre, nous étudions en détail l’importance du vent en Martiniquepour la dispersion des cendres volcaniques durant une éruption et donc sur la distributiondes dépôts sur le terrain. Dans la majorité des études, des profils de vents moyennés sontutilisés pour simuler la dispersion des produits volcaniques et quantifier les risques associés.Ici, nous présentons une réinterprétation des deux éruptions peu comprises de la montagnePelée, Bellefontaine et Balisier, permettant de démontrer que l’utilisation exclusive desprofils de vent moyennés peut mener à une mauvaise représentation du risque volcanique.
Ces deux éruptions, tout comme celles de Carbet et d’Etoile, sont caractérisées par unedistribution des dépôts dont l’axe principal est orienté en direction du sud de l’île, et doncde Fort-de-France (chef-lieu de la Martinique), vers des zones considérées comme sécuriséesdans les cartes actuelles et comportant des infrastructures décisionnelles majeures pour lagestion de crise (telle que la préfecture). Cette direction est surprenante car elle n’est pascohérente avec les directions moyennes de vents d’est (jusqu’à environ 6 km d’altitude) etd’ouest (de 7 km à la tropopause) caractérisant les Petites Antilles, alors même que cesvents permettent d’expliquer les dispersions des éruptions plus récentes P1 et P2 (Carazzoet al., 2012, 2019). Des études précédentes ont suggéré que cet axe de dispersion inhabituelpourrait être dû à des conditions météorologiques très particulières éventuellement liées à uncyclone passant proche de la Martinique au moment de l’éruption de Bellefontaine (Roobol& Smith, 1976; Westercamp & Traineau, 1983; Traineau et al., 1989). Ces conditions parti-culières seraient donc similaires pour les éruptions d’Etoile, du Carbet, et de Balisier dontle panache secondaire issu de la rencontre d’une coulée de densité pyroclastique avec unebarrière topographique a également dispersé des dépôts en direction du sud de l’île.
Grâce à des simulations 2D faites en utilisant le modèle de dispersion de cendres vol-caniques HAZMAP (Macedonio et al., 2005), nous cherchons à tester ces hypothèses. Nosrésultats montrent que les profils de vents moyennés sur une saison ne peuvent pas ex-pliquer les dispersions au sud des dépôts de ces éruptions de Bellefontaine et Balisier (etdonc également de celles de Carbet et d’Etoile). Pour comprendre l’origine de ces axes dedispersion inhabituels, nous utilisons quarante ans de données de vent sur la Martiniqueissues des réanalyses de climat global par l’ECMWF (European Centre for Medium-RangeWeather Forecasts). Grâce à ces bases de données nommées ERA-Interim (Dee et al., 2011)et ERA-5 (Hersbach et al., 2019), nous démontrons que l’éruption de Bellefontaine ne s’estpas nécessairement produite sous des conditions météorologiques extrêmes associées au pas-sage d’un cyclone, mais plutôt dans des contextes atmosphériques plus particuliers durantlesquels le trajet du “jet-stream” tropical est modifié. Cette situation produit des vents defaibles vitesses venant du nord dans la haute troposphère jusque sur l’île de la Martinique.Nos résultats ont également montré que notre estimation de hauteur maximale du panachesecondaire de Balisier (i.e. 13 km) est cohérente avec nos simulations. Pour finir, nous avonscalculé que la probabilité d’occurrence mensuelle de tels vents peut atteindre presque 5%aux mois de mai et novembre marquant la transition entre les saisons humide et sèche.
Ces résultats démontrent que l’utilisation de profils saisonniers moyens ne fournissantque des informations sur les cas les plus probables peut entrainer de fortes sous-estimationsdans l’évaluation de l’aléa volcanique. Il apparaît donc nécessaire de considérer la variabilitéjournalière des vents, à la fois pour ce qui est de la vitesse et de l’orientation, dans la prévisiondes catastrophes volcaniques.
140
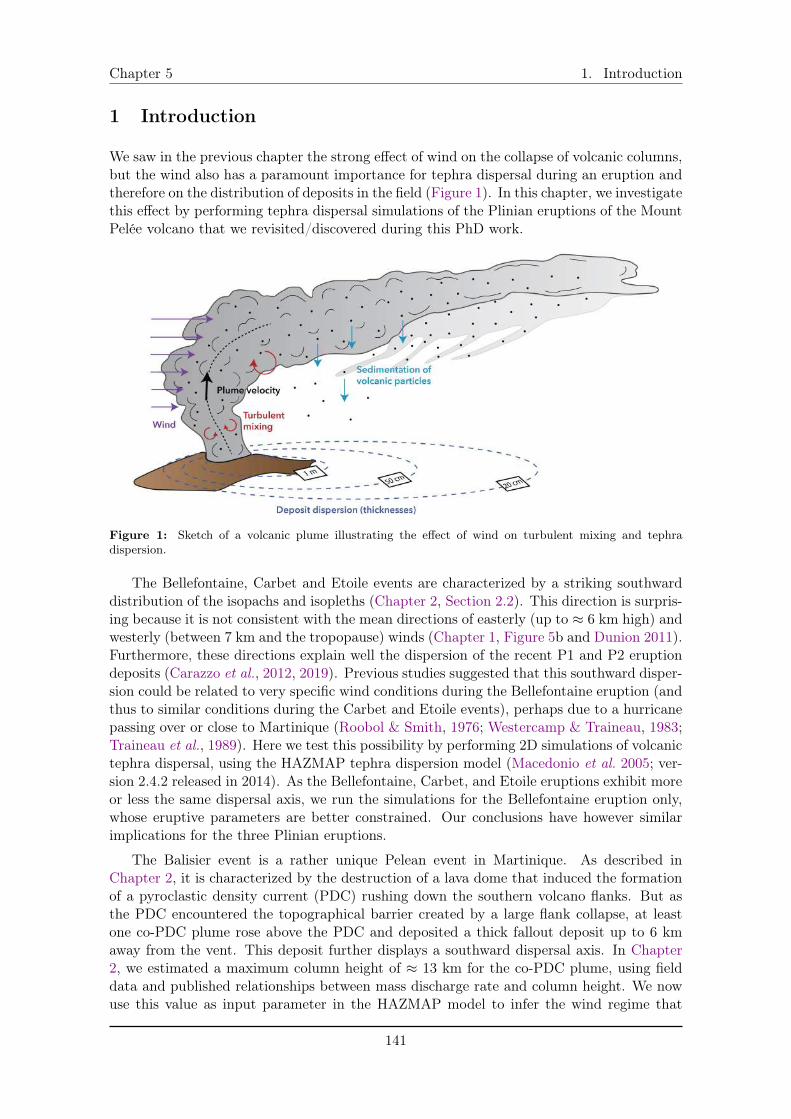
Chapter 5 1. Introduction
1 Introduction
We saw in the previous chapter the strong effect of wind on the collapse of volcanic columns,but the wind also has a paramount importance for tephra dispersal during an eruption andtherefore on the distribution of deposits in the field (Figure 1). In this chapter, we investigatethis effect by performing tephra dispersal simulations of the Plinian eruptions of the MountPelée volcano that we revisited/discovered during this PhD work.
Figure 1: Sketch of a volcanic plume illustrating the effect of wind on turbulent mixing and tephradispersion.
The Bellefontaine, Carbet and Etoile events are characterized by a striking southwarddistribution of the isopachs and isopleths (Chapter 2, Section 2.2). This direction is surpris-ing because it is not consistent with the mean directions of easterly (up to ⇡ 6 km high) andwesterly (between 7 km and the tropopause) winds (Chapter 1, Figure 5b and Dunion 2011).Furthermore, these directions explain well the dispersion of the recent P1 and P2 eruptiondeposits (Carazzo et al., 2012, 2019). Previous studies suggested that this southward disper-sion could be related to very specific wind conditions during the Bellefontaine eruption (andthus to similar conditions during the Carbet and Etoile events), perhaps due to a hurricanepassing over or close to Martinique (Roobol & Smith, 1976; Westercamp & Traineau, 1983;Traineau et al., 1989). Here we test this possibility by performing 2D simulations of volcanictephra dispersal, using the HAZMAP tephra dispersion model (Macedonio et al. 2005; ver-sion 2.4.2 released in 2014). As the Bellefontaine, Carbet, and Etoile eruptions exhibit moreor less the same dispersal axis, we run the simulations for the Bellefontaine eruption only,whose eruptive parameters are better constrained. Our conclusions have however similarimplications for the three Plinian eruptions.
The Balisier event is a rather unique Pelean event in Martinique. As described inChapter 2, it is characterized by the destruction of a lava dome that induced the formationof a pyroclastic density current (PDC) rushing down the southern volcano flanks. But asthe PDC encountered the topographical barrier created by a large flank collapse, at leastone co-PDC plume rose above the PDC and deposited a thick fallout deposit up to 6 kmaway from the vent. This deposit further displays a southward dispersal axis. In Chapter2, we estimated a maximum column height of ⇡ 13 km for the co-PDC plume, using fielddata and published relationships between mass discharge rate and column height. We nowuse this value as input parameter in the HAZMAP model to infer the wind regime that
141
2. The HAZMAP model Chapter 5
occurred during the eruption.
First, we describe the HAZMAP model, its constitutive equations and the inputs pa-rameters needed to run tephra dispersal simulations. We then determine the likely windconditions that prevailed during the Bellefontaine and Balisier eruptions using the globalatmospheric reanalyses ERA-Interim (Dee et al., 2011) and ERA5 (Hersbach et al., 2019),together with the HAZMAP software. We conclude the chapter by a discussion of theconsequences of this study on volcanic hazard assessment in Martinique.
2 The HAZMAP model
HAZMAP is a semi-analytical model that solves the advection-diffusion-sedimentation equa-tion for fine particles in the umbrella cloud. This model is commonly used for volcanic hazardassessment to predict Plinian deposit characteristics as a function of eruptive source param-eters and wind datasets (e.g., Macedonio et al. 2008, 2016; Costa et al. 2009; Bonasia et al.
2011, 2012). This model does not take into account particle aggregation, a phenomenonthat we did not observed in the field.
2.1 Constitutive equations
The HAZMAP model describes the dispersion and sedimentation of volcanic tephra in twodimensions from vertically distributed point sources. The dispersion of particles is governedmainly by wind transport and turbulent diffusion, whereas the fallout is controlled by theparticle free fall velocity set by the balance of gravity and air drag. The model assumesthat the horizontal wind components and horizontal turbulent diffusion are uniform andconstant with time, whereas the vertical wind component and vertical turbulent diffusionare negligible with respect to the horizontal ones (Armienti et al., 1988; Macedonio et al.,2005; Pfeiffer et al., 2005; Costa et al., 2006; Folch et al., 2009; Macedonio & Costa, 2014).
In this first-order approach, the motion of particles is described by the mass conservationequations as follows:
@C�
@t+Wx
@C�
@x+Wy
@C�
@y�
@V�C�
@z= Kx
@2C�
@x2+Ky
@2C�
@y2+ S (1)
where C� denotes the concentration of particle class �, t is time, x, y, z are the spatialcoordinates, Wx and Wy are the horizontal components of the wind velocity vector, Kx
and Ky are the horizontal atmospheric eddy diffusion coefficients assumed equal (i.e., Kx =
Ky = K), V� is the terminal settling velocity for particle class �, and S is a source function.
The source term in Eq. (1) is described using an empirical formula modified from Suzuki(1983):
S (x, y, z, t) = S0
n
1� z
Hexp [A (z/H � 1)]
o�⇥ � (t� t0) � (x� xv) � (y � yv) (2)
where xv and yv are the coordinates of the vent, S0�
1� zH exp [A (z/H � 1)]
� is the verticalmass distribution function describing the eruption column, S0 is a normalisation factor, His the maximum plume height, A and � are two dimensionless parameters, and � is theDirac’s function. Eq. (2) considers a filiform and instantaneous release of particles witha maximum concentration centered at H(A � 1)/A and a mass concentration vertically
142
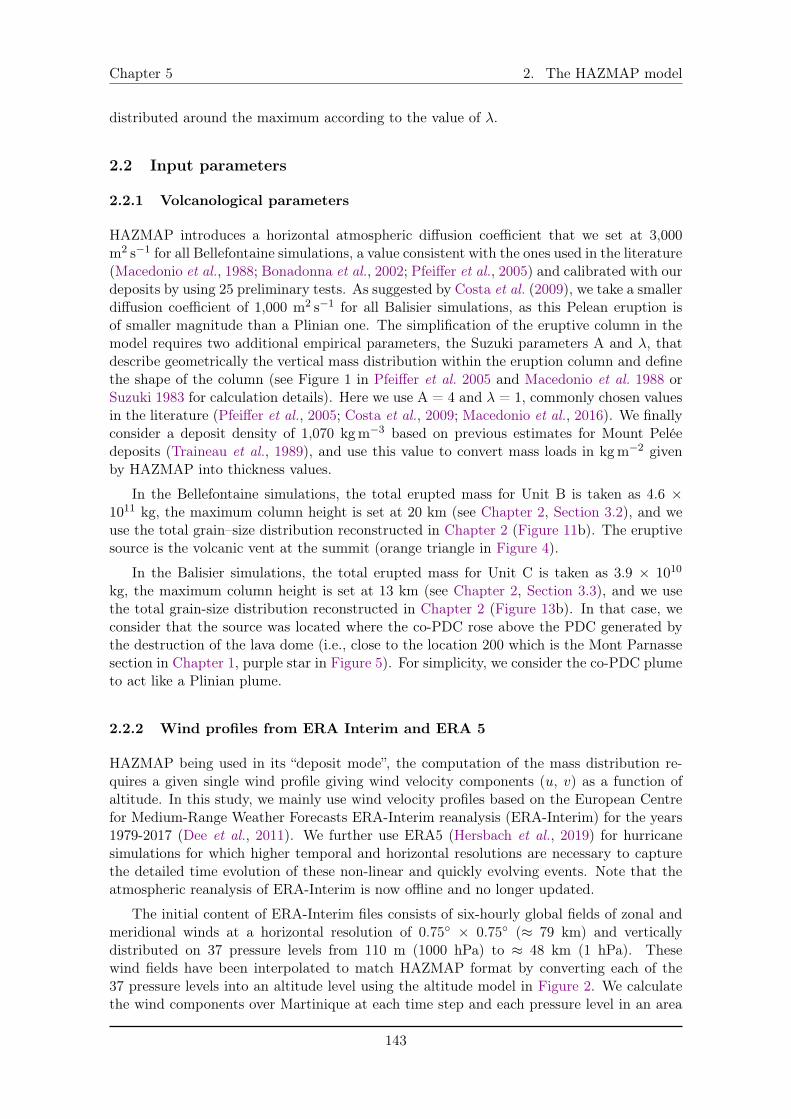
Chapter 5 2. The HAZMAP model
distributed around the maximum according to the value of �.
2.2 Input parameters
2.2.1 Volcanological parameters
HAZMAP introduces a horizontal atmospheric diffusion coefficient that we set at 3,000m
2s
�1 for all Bellefontaine simulations, a value consistent with the ones used in the literature(Macedonio et al., 1988; Bonadonna et al., 2002; Pfeiffer et al., 2005) and calibrated with ourdeposits by using 25 preliminary tests. As suggested by Costa et al. (2009), we take a smallerdiffusion coefficient of 1,000 m
2s
�1 for all Balisier simulations, as this Pelean eruption isof smaller magnitude than a Plinian one. The simplification of the eruptive column in themodel requires two additional empirical parameters, the Suzuki parameters A and �, thatdescribe geometrically the vertical mass distribution within the eruption column and definethe shape of the column (see Figure 1 in Pfeiffer et al. 2005 and Macedonio et al. 1988 orSuzuki 1983 for calculation details). Here we use A = 4 and � = 1, commonly chosen valuesin the literature (Pfeiffer et al., 2005; Costa et al., 2009; Macedonio et al., 2016). We finallyconsider a deposit density of 1,070 kgm
�3 based on previous estimates for Mount Peléedeposits (Traineau et al., 1989), and use this value to convert mass loads in kgm
�2 givenby HAZMAP into thickness values.
In the Bellefontaine simulations, the total erupted mass for Unit B is taken as 4.6 ⇥10
11 kg, the maximum column height is set at 20 km (see Chapter 2, Section 3.2), and weuse the total grain–size distribution reconstructed in Chapter 2 (Figure 11b). The eruptivesource is the volcanic vent at the summit (orange triangle in Figure 4).
In the Balisier simulations, the total erupted mass for Unit C is taken as 3.9 ⇥ 10
10
kg, the maximum column height is set at 13 km (see Chapter 2, Section 3.3), and we usethe total grain-size distribution reconstructed in Chapter 2 (Figure 13b). In that case, weconsider that the source was located where the co-PDC rose above the PDC generated bythe destruction of the lava dome (i.e., close to the location 200 which is the Mont Parnassesection in Chapter 1, purple star in Figure 5). For simplicity, we consider the co-PDC plumeto act like a Plinian plume.
2.2.2 Wind profiles from ERA Interim and ERA 5
HAZMAP being used in its “deposit mode”, the computation of the mass distribution re-quires a given single wind profile giving wind velocity components (u, v) as a function ofaltitude. In this study, we mainly use wind velocity profiles based on the European Centrefor Medium-Range Weather Forecasts ERA-Interim reanalysis (ERA-Interim) for the years1979-2017 (Dee et al., 2011). We further use ERA5 (Hersbach et al., 2019) for hurricanesimulations for which higher temporal and horizontal resolutions are necessary to capturethe detailed time evolution of these non-linear and quickly evolving events. Note that theatmospheric reanalysis of ERA-Interim is now offline and no longer updated.
The initial content of ERA-Interim files consists of six-hourly global fields of zonal andmeridional winds at a horizontal resolution of 0.75� ⇥ 0.75� (⇡ 79 km) and verticallydistributed on 37 pressure levels from 110 m (1000 hPa) to ⇡ 48 km (1 hPa). Thesewind fields have been interpolated to match HAZMAP format by converting each of the37 pressure levels into an altitude level using the altitude model in Figure 2. We calculatethe wind components over Martinique at each time step and each pressure level in an area
143
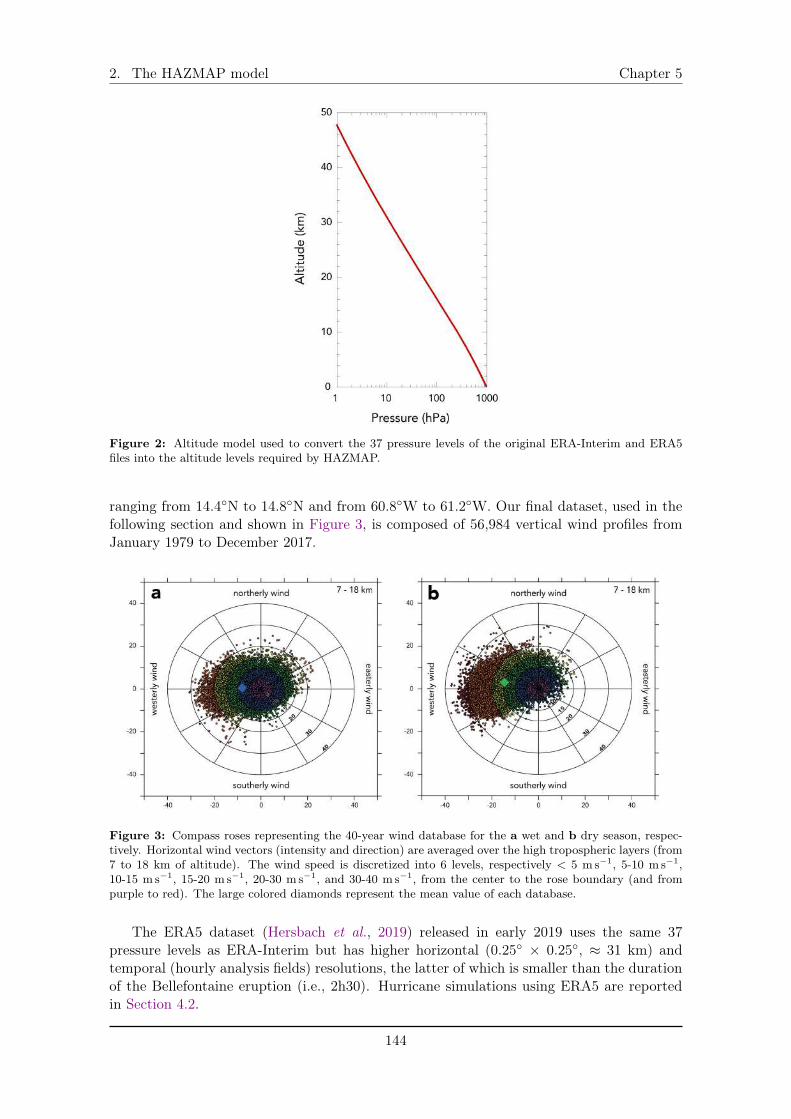
2. The HAZMAP model Chapter 5
Figure 2: Altitude model used to convert the 37 pressure levels of the original ERA-Interim and ERA5files into the altitude levels required by HAZMAP.
ranging from 14.4�N to 14.8�N and from 60.8�W to 61.2�W. Our final dataset, used in thefollowing section and shown in Figure 3, is composed of 56,984 vertical wind profiles fromJanuary 1979 to December 2017.
Figure 3: Compass roses representing the 40-year wind database for the a wet and b dry season, respec-tively. Horizontal wind vectors (intensity and direction) are averaged over the high tropospheric layers (from7 to 18 km of altitude). The wind speed is discretized into 6 levels, respectively < 5 ms�1, 5-10 ms�1,10-15 ms�1, 15-20 ms�1, 20-30 ms�1, and 30-40 ms�1, from the center to the rose boundary (and frompurple to red). The large colored diamonds represent the mean value of each database.
The ERA5 dataset (Hersbach et al., 2019) released in early 2019 uses the same 37pressure levels as ERA-Interim but has higher horizontal (0.25� ⇥ 0.25�, ⇡ 31 km) andtemporal (hourly analysis fields) resolutions, the latter of which is smaller than the durationof the Bellefontaine eruption (i.e., 2h30). Hurricane simulations using ERA5 are reportedin Section 4.2.
144
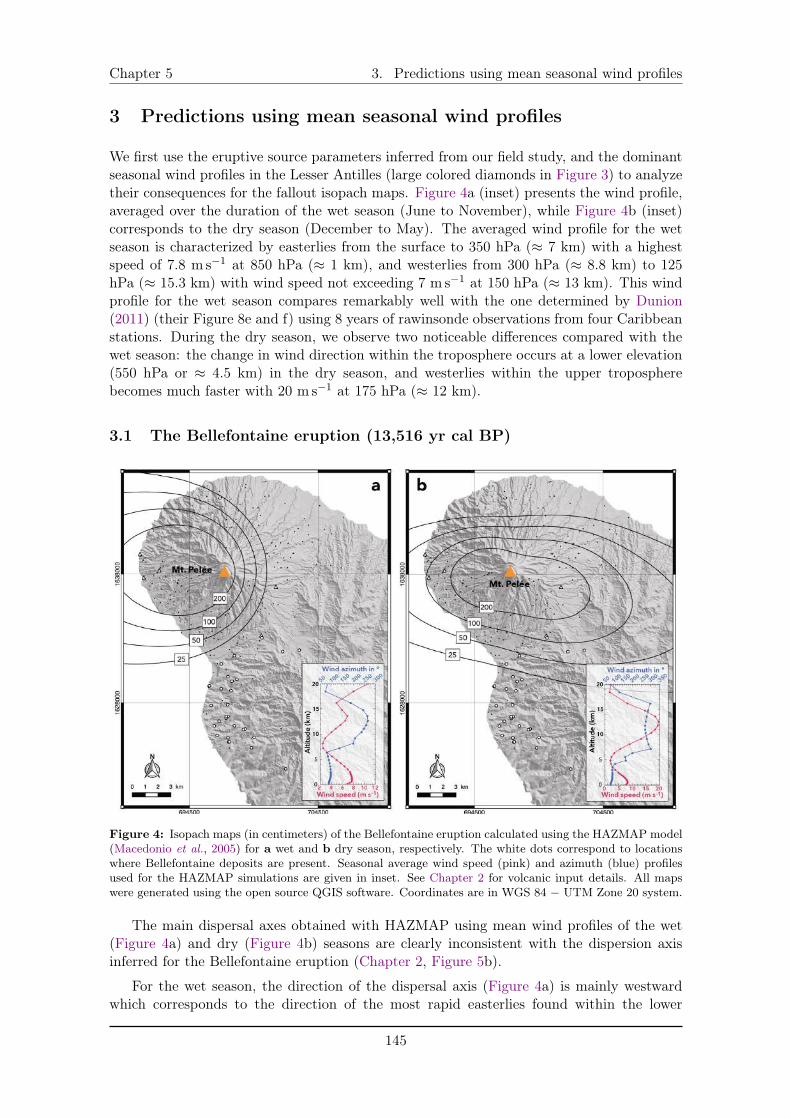
Chapter 5 3. Predictions using mean seasonal wind profiles
3 Predictions using mean seasonal wind profiles
We first use the eruptive source parameters inferred from our field study, and the dominantseasonal wind profiles in the Lesser Antilles (large colored diamonds in Figure 3) to analyzetheir consequences for the fallout isopach maps. Figure 4a (inset) presents the wind profile,averaged over the duration of the wet season (June to November), while Figure 4b (inset)corresponds to the dry season (December to May). The averaged wind profile for the wetseason is characterized by easterlies from the surface to 350 hPa (⇡ 7 km) with a highestspeed of 7.8 ms
�1 at 850 hPa (⇡ 1 km), and westerlies from 300 hPa (⇡ 8.8 km) to 125hPa (⇡ 15.3 km) with wind speed not exceeding 7 ms
�1 at 150 hPa (⇡ 13 km). This windprofile for the wet season compares remarkably well with the one determined by Dunion(2011) (their Figure 8e and f) using 8 years of rawinsonde observations from four Caribbeanstations. During the dry season, we observe two noticeable differences compared with thewet season: the change in wind direction within the troposphere occurs at a lower elevation(550 hPa or ⇡ 4.5 km) in the dry season, and westerlies within the upper tropospherebecomes much faster with 20 ms
�1 at 175 hPa (⇡ 12 km).
3.1 The Bellefontaine eruption (13,516 yr cal BP)
Figure 4: Isopach maps (in centimeters) of the Bellefontaine eruption calculated using the HAZMAP model(Macedonio et al., 2005) for a wet and b dry season, respectively. The white dots correspond to locationswhere Bellefontaine deposits are present. Seasonal average wind speed (pink) and azimuth (blue) profilesused for the HAZMAP simulations are given in inset. See Chapter 2 for volcanic input details. All mapswere generated using the open source QGIS software. Coordinates are in WGS 84 � UTM Zone 20 system.
The main dispersal axes obtained with HAZMAP using mean wind profiles of the wet(Figure 4a) and dry (Figure 4b) seasons are clearly inconsistent with the dispersion axisinferred for the Bellefontaine eruption (Chapter 2, Figure 5b).
For the wet season, the direction of the dispersal axis (Figure 4a) is mainly westwardwhich corresponds to the direction of the most rapid easterlies found within the lower
145
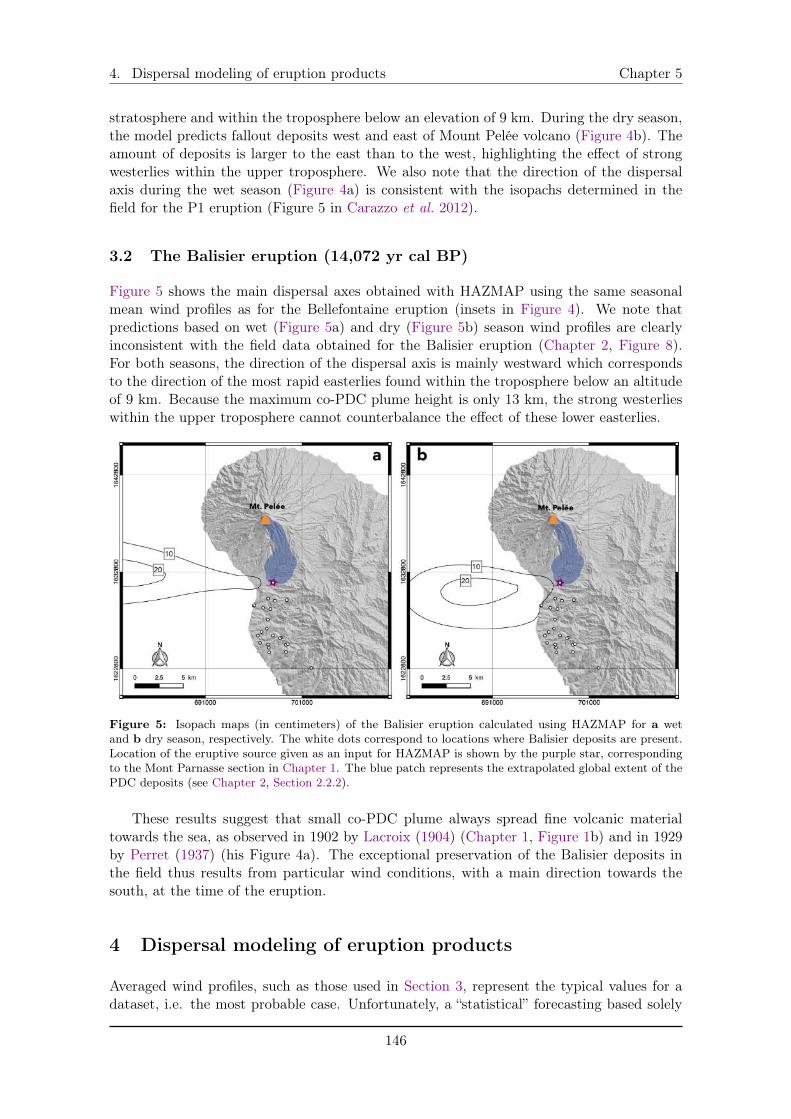
4. Dispersal modeling of eruption products Chapter 5
stratosphere and within the troposphere below an elevation of 9 km. During the dry season,the model predicts fallout deposits west and east of Mount Pelée volcano (Figure 4b). Theamount of deposits is larger to the east than to the west, highlighting the effect of strongwesterlies within the upper troposphere. We also note that the direction of the dispersalaxis during the wet season (Figure 4a) is consistent with the isopachs determined in thefield for the P1 eruption (Figure 5 in Carazzo et al. 2012).
3.2 The Balisier eruption (14,072 yr cal BP)
Figure 5 shows the main dispersal axes obtained with HAZMAP using the same seasonalmean wind profiles as for the Bellefontaine eruption (insets in Figure 4). We note thatpredictions based on wet (Figure 5a) and dry (Figure 5b) season wind profiles are clearlyinconsistent with the field data obtained for the Balisier eruption (Chapter 2, Figure 8).For both seasons, the direction of the dispersal axis is mainly westward which correspondsto the direction of the most rapid easterlies found within the troposphere below an altitudeof 9 km. Because the maximum co-PDC plume height is only 13 km, the strong westerlieswithin the upper troposphere cannot counterbalance the effect of these lower easterlies.
Figure 5: Isopach maps (in centimeters) of the Balisier eruption calculated using HAZMAP for a wetand b dry season, respectively. The white dots correspond to locations where Balisier deposits are present.Location of the eruptive source given as an input for HAZMAP is shown by the purple star, correspondingto the Mont Parnasse section in Chapter 1. The blue patch represents the extrapolated global extent of thePDC deposits (see Chapter 2, Section 2.2.2).
These results suggest that small co-PDC plume always spread fine volcanic materialtowards the sea, as observed in 1902 by Lacroix (1904) (Chapter 1, Figure 1b) and in 1929by Perret (1937) (his Figure 4a). The exceptional preservation of the Balisier deposits inthe field thus results from particular wind conditions, with a main direction towards thesouth, at the time of the eruption.
4 Dispersal modeling of eruption products
Averaged wind profiles, such as those used in Section 3, represent the typical values for adataset, i.e. the most probable case. Unfortunately, a “statistical” forecasting based solely
146
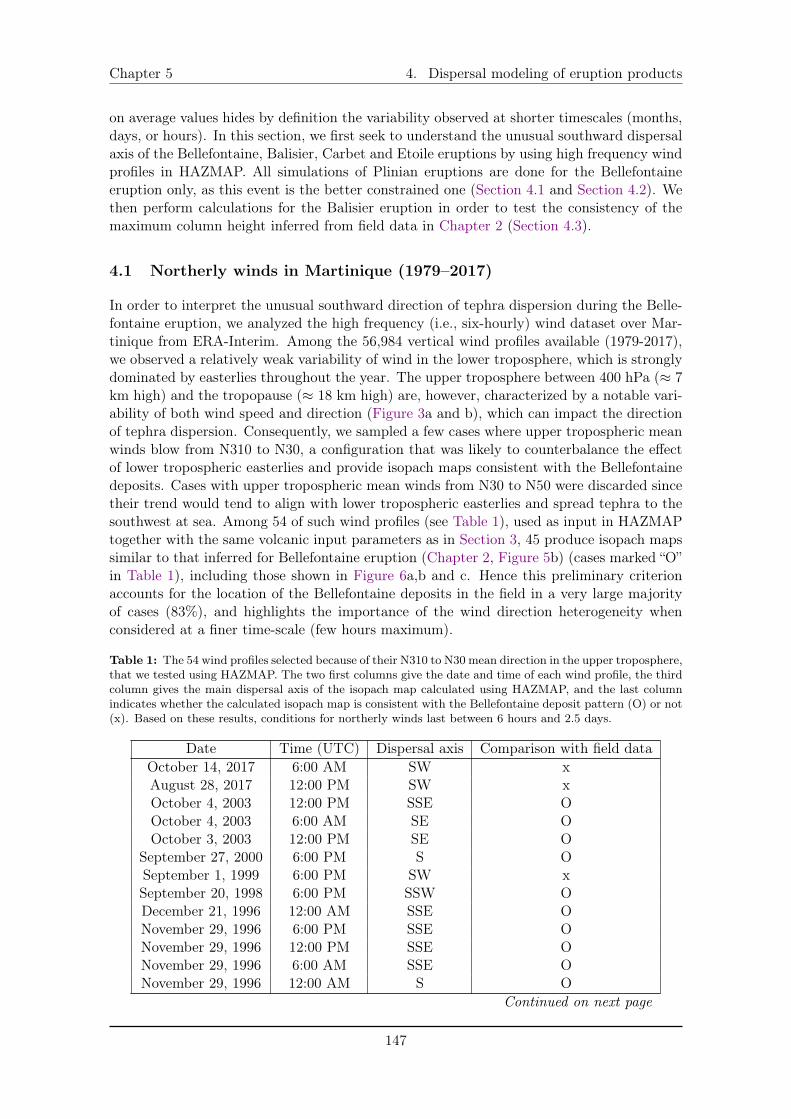
Chapter 5 4. Dispersal modeling of eruption products
on average values hides by definition the variability observed at shorter timescales (months,days, or hours). In this section, we first seek to understand the unusual southward dispersalaxis of the Bellefontaine, Balisier, Carbet and Etoile eruptions by using high frequency windprofiles in HAZMAP. All simulations of Plinian eruptions are done for the Bellefontaineeruption only, as this event is the better constrained one (Section 4.1 and Section 4.2). Wethen perform calculations for the Balisier eruption in order to test the consistency of themaximum column height inferred from field data in Chapter 2 (Section 4.3).
4.1 Northerly winds in Martinique (1979–2017)
In order to interpret the unusual southward direction of tephra dispersion during the Belle-fontaine eruption, we analyzed the high frequency (i.e., six-hourly) wind dataset over Mar-tinique from ERA-Interim. Among the 56,984 vertical wind profiles available (1979-2017),we observed a relatively weak variability of wind in the lower troposphere, which is stronglydominated by easterlies throughout the year. The upper troposphere between 400 hPa (⇡ 7km high) and the tropopause (⇡ 18 km high) are, however, characterized by a notable vari-ability of both wind speed and direction (Figure 3a and b), which can impact the directionof tephra dispersion. Consequently, we sampled a few cases where upper tropospheric meanwinds blow from N310 to N30, a configuration that was likely to counterbalance the effectof lower tropospheric easterlies and provide isopach maps consistent with the Bellefontainedeposits. Cases with upper tropospheric mean winds from N30 to N50 were discarded sincetheir trend would tend to align with lower tropospheric easterlies and spread tephra to thesouthwest at sea. Among 54 of such wind profiles (see Table 1), used as input in HAZMAPtogether with the same volcanic input parameters as in Section 3, 45 produce isopach mapssimilar to that inferred for Bellefontaine eruption (Chapter 2, Figure 5b) (cases marked “O”in Table 1), including those shown in Figure 6a,b and c. Hence this preliminary criterionaccounts for the location of the Bellefontaine deposits in the field in a very large majorityof cases (83%), and highlights the importance of the wind direction heterogeneity whenconsidered at a finer time-scale (few hours maximum).
Table 1: The 54 wind profiles selected because of their N310 to N30 mean direction in the upper troposphere,that we tested using HAZMAP. The two first columns give the date and time of each wind profile, the thirdcolumn gives the main dispersal axis of the isopach map calculated using HAZMAP, and the last columnindicates whether the calculated isopach map is consistent with the Bellefontaine deposit pattern (O) or not(x). Based on these results, conditions for northerly winds last between 6 hours and 2.5 days.
Date Time (UTC) Dispersal axis Comparison with field dataOctober 14, 2017 6:00 AM SW xAugust 28, 2017 12:00 PM SW xOctober 4, 2003 12:00 PM SSE OOctober 4, 2003 6:00 AM SE OOctober 3, 2003 12:00 PM SE O
September 27, 2000 6:00 PM S OSeptember 1, 1999 6:00 PM SW xSeptember 20, 1998 6:00 PM SSW ODecember 21, 1996 12:00 AM SSE ONovember 29, 1996 6:00 PM SSE ONovember 29, 1996 12:00 PM SSE ONovember 29, 1996 6:00 AM SSE ONovember 29, 1996 12:00 AM S O
Continued on next page
147
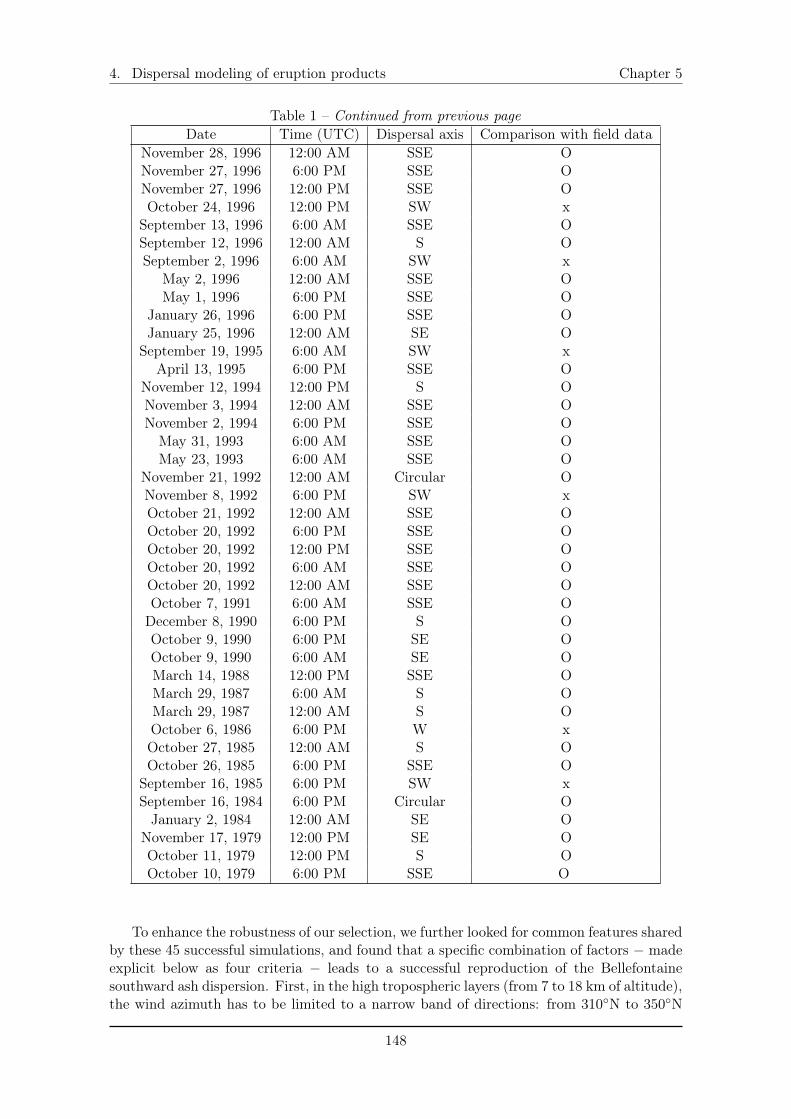
4. Dispersal modeling of eruption products Chapter 5
Table 1 – Continued from previous page
Date Time (UTC) Dispersal axis Comparison with field dataNovember 28, 1996 12:00 AM SSE ONovember 27, 1996 6:00 PM SSE ONovember 27, 1996 12:00 PM SSE OOctober 24, 1996 12:00 PM SW x
September 13, 1996 6:00 AM SSE OSeptember 12, 1996 12:00 AM S OSeptember 2, 1996 6:00 AM SW x
May 2, 1996 12:00 AM SSE OMay 1, 1996 6:00 PM SSE O
January 26, 1996 6:00 PM SSE OJanuary 25, 1996 12:00 AM SE O
September 19, 1995 6:00 AM SW xApril 13, 1995 6:00 PM SSE O
November 12, 1994 12:00 PM S ONovember 3, 1994 12:00 AM SSE ONovember 2, 1994 6:00 PM SSE O
May 31, 1993 6:00 AM SSE OMay 23, 1993 6:00 AM SSE O
November 21, 1992 12:00 AM Circular ONovember 8, 1992 6:00 PM SW xOctober 21, 1992 12:00 AM SSE OOctober 20, 1992 6:00 PM SSE OOctober 20, 1992 12:00 PM SSE OOctober 20, 1992 6:00 AM SSE OOctober 20, 1992 12:00 AM SSE OOctober 7, 1991 6:00 AM SSE O
December 8, 1990 6:00 PM S OOctober 9, 1990 6:00 PM SE OOctober 9, 1990 6:00 AM SE OMarch 14, 1988 12:00 PM SSE OMarch 29, 1987 6:00 AM S OMarch 29, 1987 12:00 AM S OOctober 6, 1986 6:00 PM W xOctober 27, 1985 12:00 AM S OOctober 26, 1985 6:00 PM SSE O
September 16, 1985 6:00 PM SW xSeptember 16, 1984 6:00 PM Circular O
January 2, 1984 12:00 AM SE ONovember 17, 1979 12:00 PM SE OOctober 11, 1979 12:00 PM S OOctober 10, 1979 6:00 PM SSE O
To enhance the robustness of our selection, we further looked for common features sharedby these 45 successful simulations, and found that a specific combination of factors � madeexplicit below as four criteria � leads to a successful reproduction of the Bellefontainesouthward ash dispersion. First, in the high tropospheric layers (from 7 to 18 km of altitude),the wind azimuth has to be limited to a narrow band of directions: from 310�N to 350�N
148
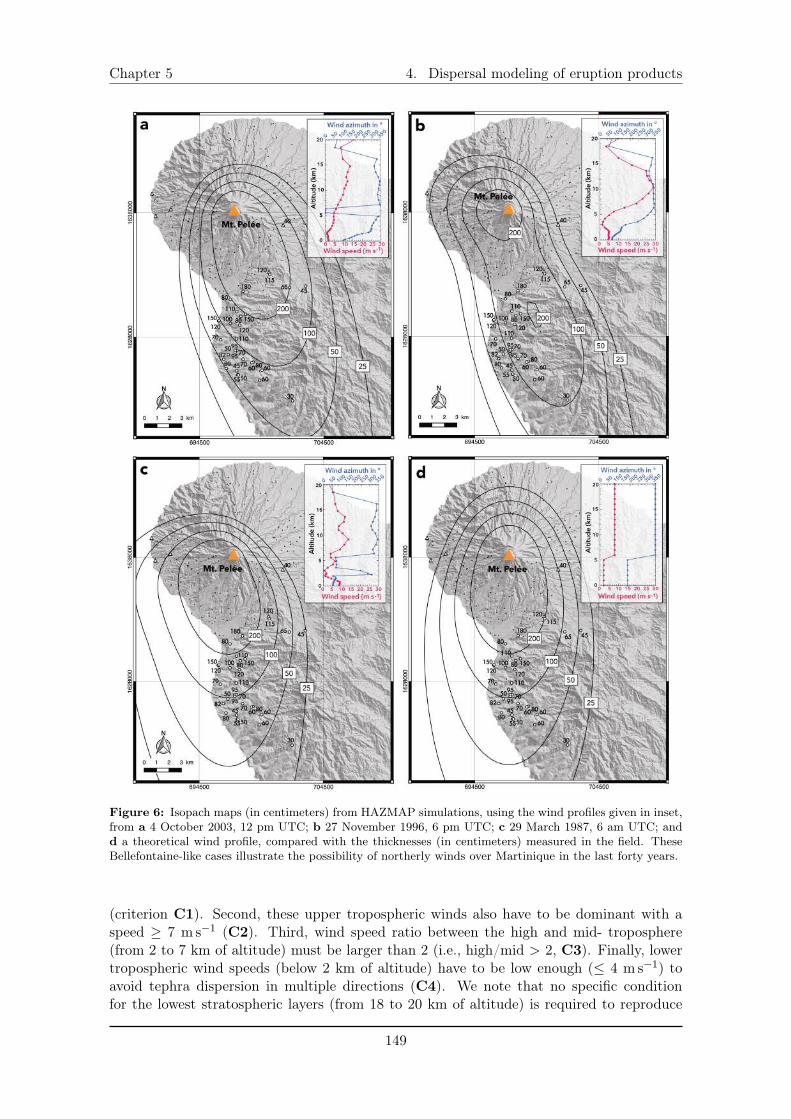
Chapter 5 4. Dispersal modeling of eruption products
Figure 6: Isopach maps (in centimeters) from HAZMAP simulations, using the wind profiles given in inset,from a 4 October 2003, 12 pm UTC; b 27 November 1996, 6 pm UTC; c 29 March 1987, 6 am UTC; andd a theoretical wind profile, compared with the thicknesses (in centimeters) measured in the field. TheseBellefontaine-like cases illustrate the possibility of northerly winds over Martinique in the last forty years.
(criterion C1). Second, these upper tropospheric winds also have to be dominant with aspeed � 7 ms
�1 (C2). Third, wind speed ratio between the high and mid- troposphere(from 2 to 7 km of altitude) must be larger than 2 (i.e., high/mid > 2, C3). Finally, lowertropospheric wind speeds (below 2 km of altitude) have to be low enough ( 4 ms
�1) toavoid tephra dispersion in multiple directions (C4). We note that no specific conditionfor the lowest stratospheric layers (from 18 to 20 km of altitude) is required to reproduce
149
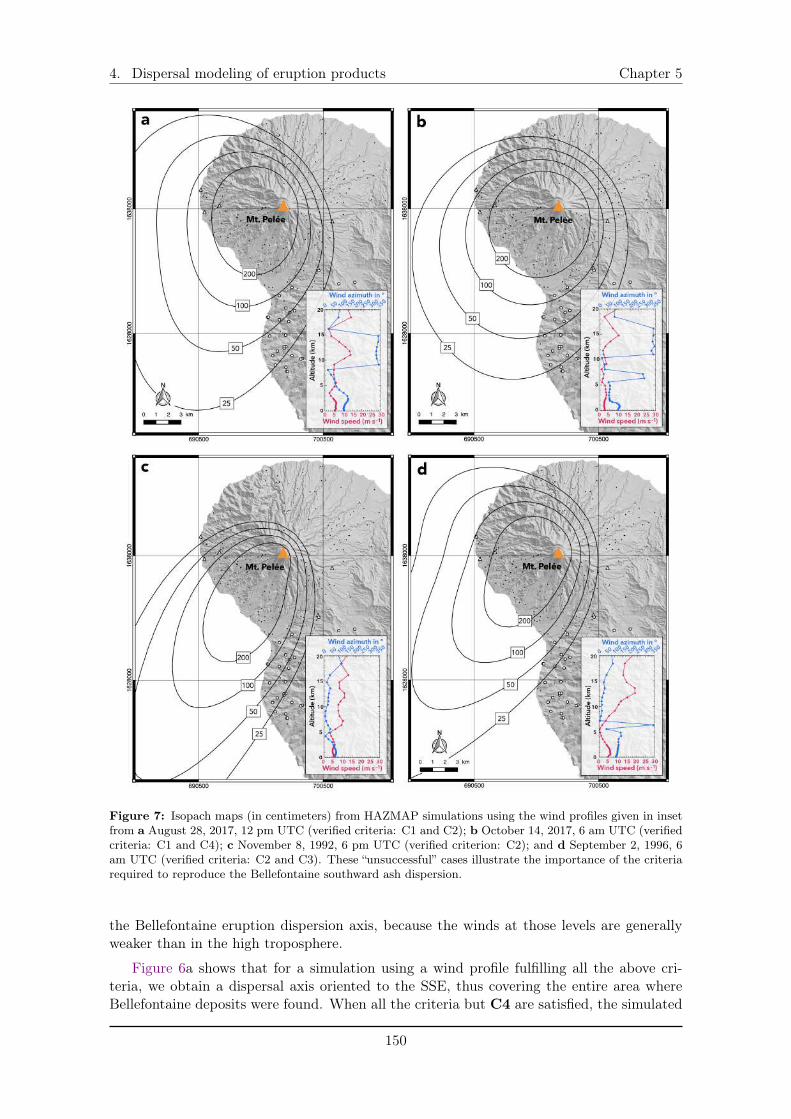
4. Dispersal modeling of eruption products Chapter 5
Figure 7: Isopach maps (in centimeters) from HAZMAP simulations using the wind profiles given in insetfrom a August 28, 2017, 12 pm UTC (verified criteria: C1 and C2); b October 14, 2017, 6 am UTC (verifiedcriteria: C1 and C4); c November 8, 1992, 6 pm UTC (verified criterion: C2); and d September 2, 1996, 6am UTC (verified criteria: C2 and C3). These “unsuccessful” cases illustrate the importance of the criteriarequired to reproduce the Bellefontaine southward ash dispersion.
the Bellefontaine eruption dispersion axis, because the winds at those levels are generallyweaker than in the high troposphere.
Figure 6a shows that for a simulation using a wind profile fulfilling all the above cri-teria, we obtain a dispersal axis oriented to the SSE, thus covering the entire area whereBellefontaine deposits were found. When all the criteria but C4 are satisfied, the simulated
150
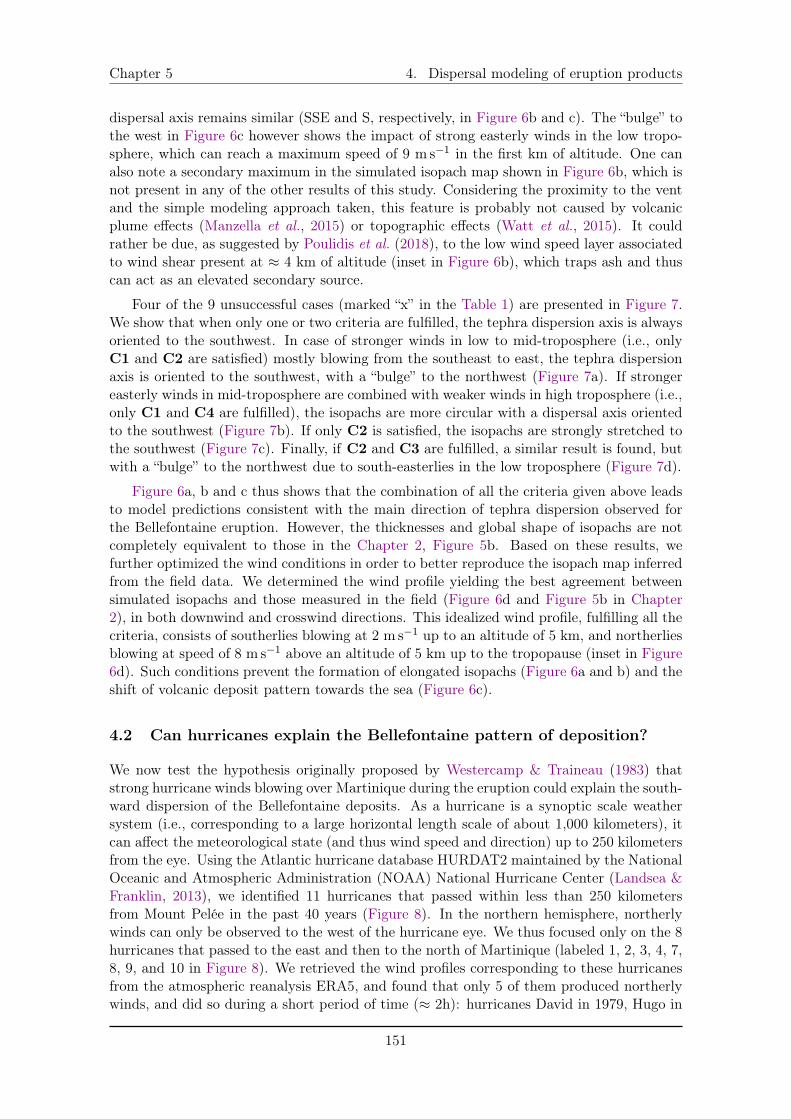
Chapter 5 4. Dispersal modeling of eruption products
dispersal axis remains similar (SSE and S, respectively, in Figure 6b and c). The “bulge” tothe west in Figure 6c however shows the impact of strong easterly winds in the low tropo-sphere, which can reach a maximum speed of 9 ms
�1 in the first km of altitude. One canalso note a secondary maximum in the simulated isopach map shown in Figure 6b, which isnot present in any of the other results of this study. Considering the proximity to the ventand the simple modeling approach taken, this feature is probably not caused by volcanicplume effects (Manzella et al., 2015) or topographic effects (Watt et al., 2015). It couldrather be due, as suggested by Poulidis et al. (2018), to the low wind speed layer associatedto wind shear present at ⇡ 4 km of altitude (inset in Figure 6b), which traps ash and thuscan act as an elevated secondary source.
Four of the 9 unsuccessful cases (marked “x” in the Table 1) are presented in Figure 7.We show that when only one or two criteria are fulfilled, the tephra dispersion axis is alwaysoriented to the southwest. In case of stronger winds in low to mid-troposphere (i.e., onlyC1 and C2 are satisfied) mostly blowing from the southeast to east, the tephra dispersionaxis is oriented to the southwest, with a “bulge” to the northwest (Figure 7a). If strongereasterly winds in mid-troposphere are combined with weaker winds in high troposphere (i.e.,only C1 and C4 are fulfilled), the isopachs are more circular with a dispersal axis orientedto the southwest (Figure 7b). If only C2 is satisfied, the isopachs are strongly stretched tothe southwest (Figure 7c). Finally, if C2 and C3 are fulfilled, a similar result is found, butwith a “bulge” to the northwest due to south-easterlies in the low troposphere (Figure 7d).
Figure 6a, b and c thus shows that the combination of all the criteria given above leadsto model predictions consistent with the main direction of tephra dispersion observed forthe Bellefontaine eruption. However, the thicknesses and global shape of isopachs are notcompletely equivalent to those in the Chapter 2, Figure 5b. Based on these results, wefurther optimized the wind conditions in order to better reproduce the isopach map inferredfrom the field data. We determined the wind profile yielding the best agreement betweensimulated isopachs and those measured in the field (Figure 6d and Figure 5b in Chapter2), in both downwind and crosswind directions. This idealized wind profile, fulfilling all thecriteria, consists of southerlies blowing at 2 ms
�1 up to an altitude of 5 km, and northerliesblowing at speed of 8 ms
�1 above an altitude of 5 km up to the tropopause (inset in Figure6d). Such conditions prevent the formation of elongated isopachs (Figure 6a and b) and theshift of volcanic deposit pattern towards the sea (Figure 6c).
4.2 Can hurricanes explain the Bellefontaine pattern of deposition?
We now test the hypothesis originally proposed by Westercamp & Traineau (1983) thatstrong hurricane winds blowing over Martinique during the eruption could explain the south-ward dispersion of the Bellefontaine deposits. As a hurricane is a synoptic scale weathersystem (i.e., corresponding to a large horizontal length scale of about 1,000 kilometers), itcan affect the meteorological state (and thus wind speed and direction) up to 250 kilometersfrom the eye. Using the Atlantic hurricane database HURDAT2 maintained by the NationalOceanic and Atmospheric Administration (NOAA) National Hurricane Center (Landsea &Franklin, 2013), we identified 11 hurricanes that passed within less than 250 kilometersfrom Mount Pelée in the past 40 years (Figure 8). In the northern hemisphere, northerlywinds can only be observed to the west of the hurricane eye. We thus focused only on the 8hurricanes that passed to the east and then to the north of Martinique (labeled 1, 2, 3, 4, 7,8, 9, and 10 in Figure 8). We retrieved the wind profiles corresponding to these hurricanesfrom the atmospheric reanalysis ERA5, and found that only 5 of them produced northerlywinds, and did so during a short period of time (⇡ 2h): hurricanes David in 1979, Hugo in
151
4. Dispersal modeling of eruption products Chapter 5
Figure 8: Tracks of the North Atlantic hurricanes that passed within 250 km of Mount Pelée during theperiod 1979-2017: 1 Gonzalo in 2014, 2 Debby in 2000, 3 Georges in 1998, 4 Hugo in 1989, 5 Dean in 2007,6 Allen in 1980, 7 Maria in 2017, 8 David in 1979, 9 Marilyn in 1995, 10 José in 1999, and 11 Tomas in2010. The colored dots show for each hurricane track the distance to Mount Pelée in kilometers, given bythe colored scale on the right. The red tracks refer to the hurricanes used for the simulations in Figure 10.
1989, Marilyn in 1995, Georges in 1998, and Maria in 2017. These 5 events all belong tothe cluster 3 defined by Kossin et al. (2010), in which hurricanes originate from the east-ern part of the central Atlantic Ocean (defined as Cape Verde hurricanes). Because of itshigh temporal and spatial resolution, hurricane tracks and wind speed profiles are bettercaptured by ERA5 than by ERA-Interim dataset. Using this approach implies to neglectgusts associated with hurricanes (which can reach speeds up to 80 ms
�1; Murakami 2014).This type of event is, however, generally too brief (about one minute long) to significantlyinfluence tephra dispersion and to be preserved in the deposits.
Using the HAZMAP model, we then performed 2 simulations for each hurricane, eachconsidering two different (and consecutive in time) wind profiles from ERA5 dataset (Fig-ure 9). These wind profiles differ from those described in Section 4.1, and illustrate thechanges of air mass circulation as the hurricane is passing by. In particular, hurricaneMaria exhibits a decreasing speed with height, a characteristic generally observed during ahurricane (Franklin et al., 2000). Comparing these wind profiles with our criteria definedin the previous section, reveals that whereas C1, C3, and C4 are not fulfilled, the windspeed is however > 7 ms
�1 in the high troposphere (C2). Wind directions are rather ho-mogeneous along the entire tropospheric column with an azimuth between N315 and N35,with strongest winds up to 22 ms
�1 in the low to mid-troposphere. These conditions arelikely to promote a southward dispersion of the volcanic products. As each wind profilepresents the state of the atmosphere for one hour (temporal resolution of ERA5) and as theBellefontaine eruption lasted for approximately 2 hours, each simulation was made usingas HAZMAP input half of the total erupted volume of the Bellefontaine eruption (i.e., 2.3⇥ 10
11 kg). The lack of pronounced grading in the deposits (the grain sizes are broadlyhomogeneous throughout the deposit thickness) is consistent with the hypothesis of a sta-
152
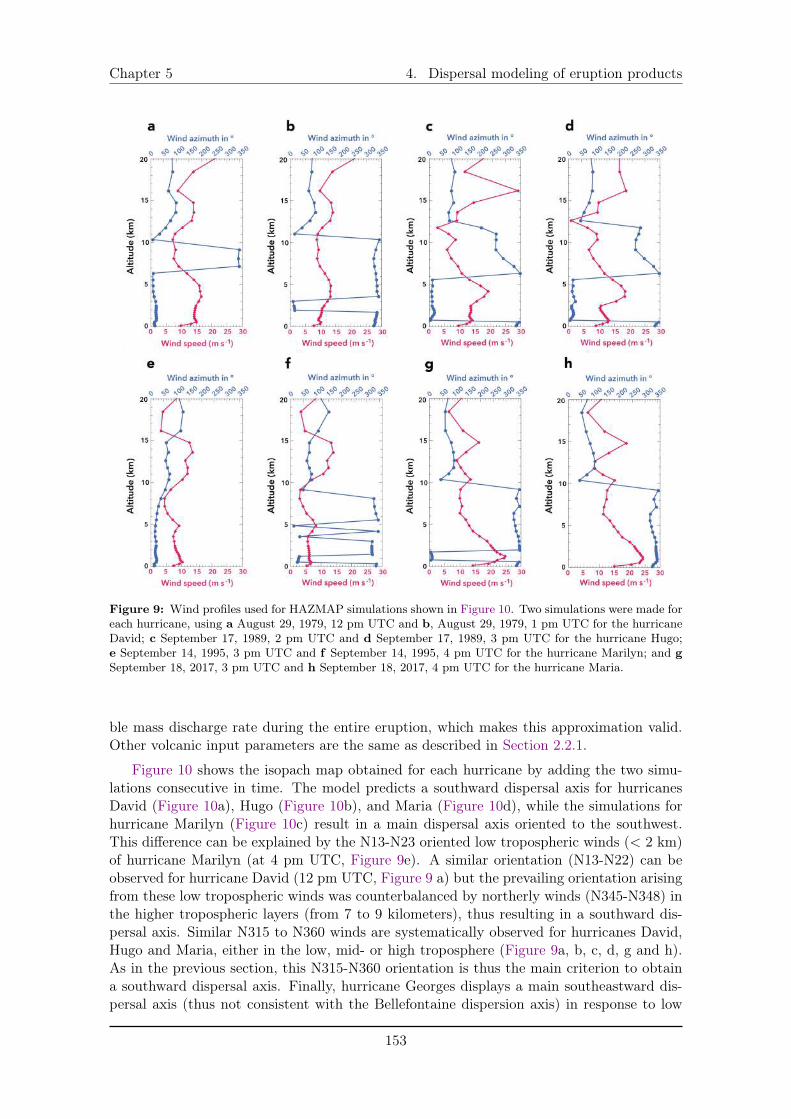
Chapter 5 4. Dispersal modeling of eruption products
Figure 9: Wind profiles used for HAZMAP simulations shown in Figure 10. Two simulations were made foreach hurricane, using a August 29, 1979, 12 pm UTC and b, August 29, 1979, 1 pm UTC for the hurricaneDavid; c September 17, 1989, 2 pm UTC and d September 17, 1989, 3 pm UTC for the hurricane Hugo;e September 14, 1995, 3 pm UTC and f September 14, 1995, 4 pm UTC for the hurricane Marilyn; and g
September 18, 2017, 3 pm UTC and h September 18, 2017, 4 pm UTC for the hurricane Maria.
ble mass discharge rate during the entire eruption, which makes this approximation valid.Other volcanic input parameters are the same as described in Section 2.2.1.
Figure 10 shows the isopach map obtained for each hurricane by adding the two simu-lations consecutive in time. The model predicts a southward dispersal axis for hurricanesDavid (Figure 10a), Hugo (Figure 10b), and Maria (Figure 10d), while the simulations forhurricane Marilyn (Figure 10c) result in a main dispersal axis oriented to the southwest.This difference can be explained by the N13-N23 oriented low tropospheric winds (< 2 km)of hurricane Marilyn (at 4 pm UTC, Figure 9e). A similar orientation (N13-N22) can beobserved for hurricane David (12 pm UTC, Figure 9 a) but the prevailing orientation arisingfrom these low tropospheric winds was counterbalanced by northerly winds (N345-N348) inthe higher tropospheric layers (from 7 to 9 kilometers), thus resulting in a southward dis-persal axis. Similar N315 to N360 winds are systematically observed for hurricanes David,Hugo and Maria, either in the low, mid- or high troposphere (Figure 9a, b, c, d, g and h).As in the previous section, this N315-N360 orientation is thus the main criterion to obtaina southward dispersal axis. Finally, hurricane Georges displays a main southeastward dis-persal axis (thus not consistent with the Bellefontaine dispersion axis) in response to low
153
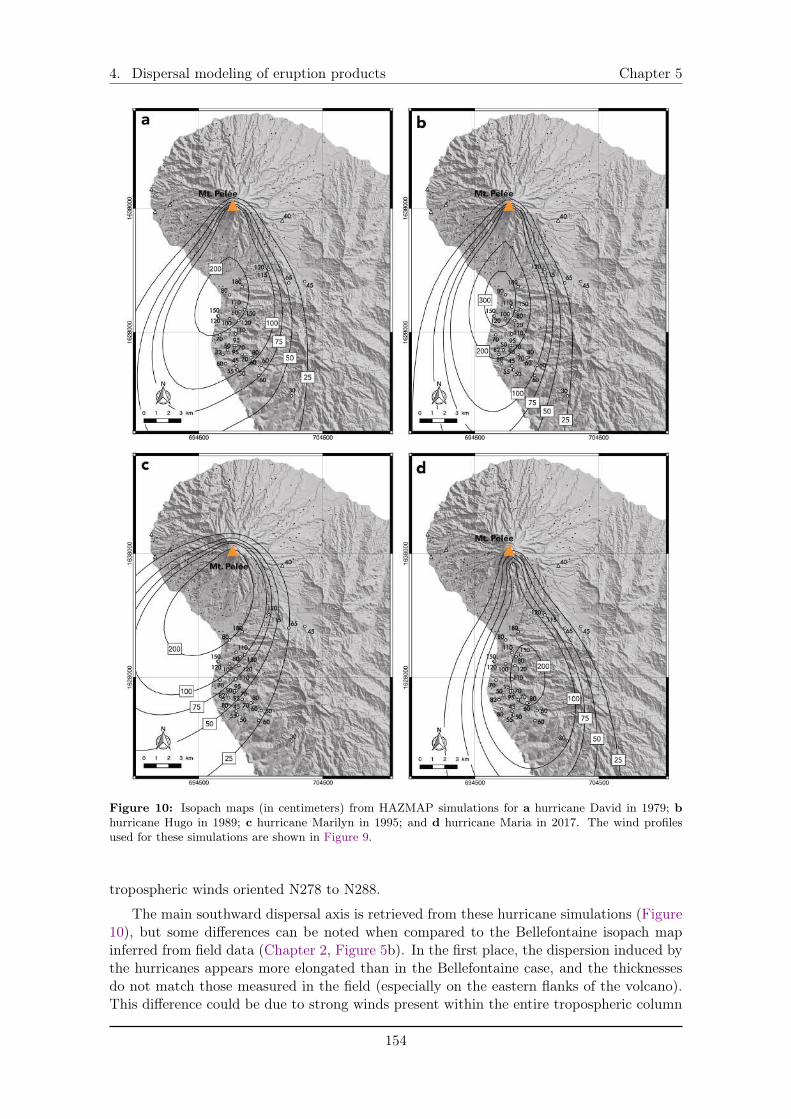
4. Dispersal modeling of eruption products Chapter 5
Figure 10: Isopach maps (in centimeters) from HAZMAP simulations for a hurricane David in 1979; b
hurricane Hugo in 1989; c hurricane Marilyn in 1995; and d hurricane Maria in 2017. The wind profilesused for these simulations are shown in Figure 9.
tropospheric winds oriented N278 to N288.
The main southward dispersal axis is retrieved from these hurricane simulations (Figure10), but some differences can be noted when compared to the Bellefontaine isopach mapinferred from field data (Chapter 2, Figure 5b). In the first place, the dispersion induced bythe hurricanes appears more elongated than in the Bellefontaine case, and the thicknessesdo not match those measured in the field (especially on the eastern flanks of the volcano).This difference could be due to strong winds present within the entire tropospheric column
154
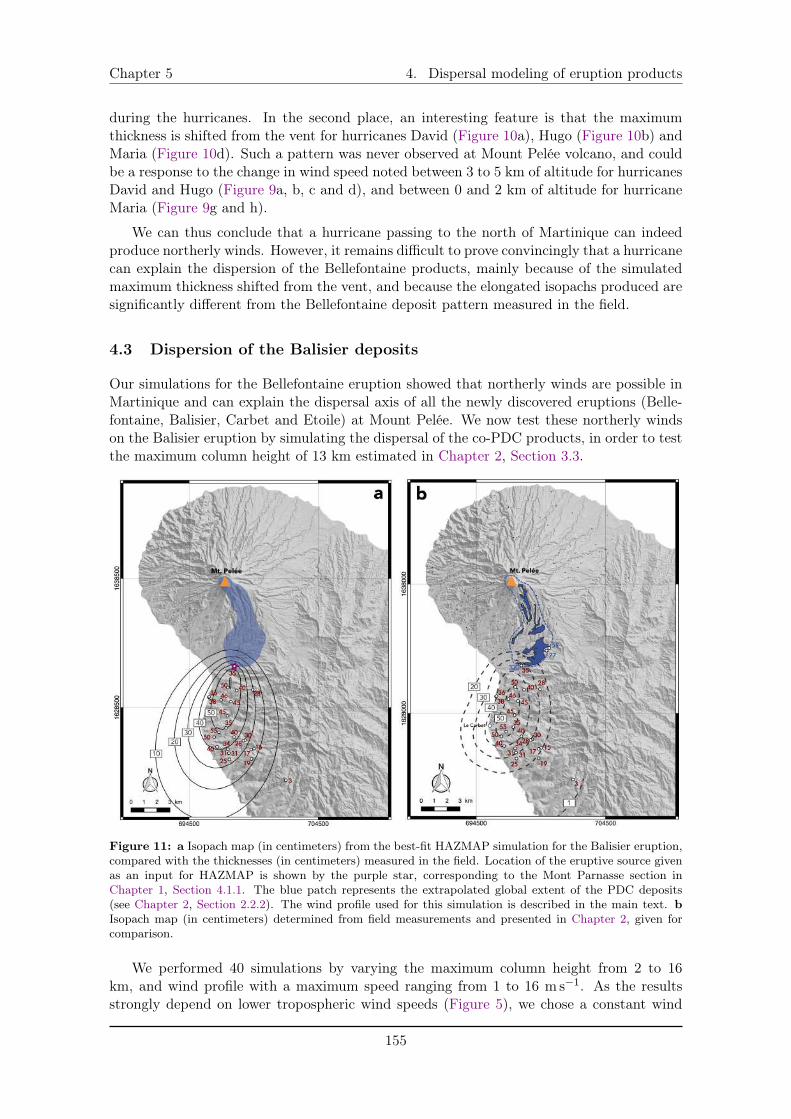
Chapter 5 4. Dispersal modeling of eruption products
during the hurricanes. In the second place, an interesting feature is that the maximumthickness is shifted from the vent for hurricanes David (Figure 10a), Hugo (Figure 10b) andMaria (Figure 10d). Such a pattern was never observed at Mount Pelée volcano, and couldbe a response to the change in wind speed noted between 3 to 5 km of altitude for hurricanesDavid and Hugo (Figure 9a, b, c and d), and between 0 and 2 km of altitude for hurricaneMaria (Figure 9g and h).
We can thus conclude that a hurricane passing to the north of Martinique can indeedproduce northerly winds. However, it remains difficult to prove convincingly that a hurricanecan explain the dispersion of the Bellefontaine products, mainly because of the simulatedmaximum thickness shifted from the vent, and because the elongated isopachs produced aresignificantly different from the Bellefontaine deposit pattern measured in the field.
4.3 Dispersion of the Balisier deposits
Our simulations for the Bellefontaine eruption showed that northerly winds are possible inMartinique and can explain the dispersal axis of all the newly discovered eruptions (Belle-fontaine, Balisier, Carbet and Etoile) at Mount Pelée. We now test these northerly windson the Balisier eruption by simulating the dispersal of the co-PDC products, in order to testthe maximum column height of 13 km estimated in Chapter 2, Section 3.3.
Figure 11: a Isopach map (in centimeters) from the best-fit HAZMAP simulation for the Balisier eruption,compared with the thicknesses (in centimeters) measured in the field. Location of the eruptive source givenas an input for HAZMAP is shown by the purple star, corresponding to the Mont Parnasse section inChapter 1, Section 4.1.1. The blue patch represents the extrapolated global extent of the PDC deposits(see Chapter 2, Section 2.2.2). The wind profile used for this simulation is described in the main text. b
Isopach map (in centimeters) determined from field measurements and presented in Chapter 2, given forcomparison.
We performed 40 simulations by varying the maximum column height from 2 to 16km, and wind profile with a maximum speed ranging from 1 to 16 ms
�1. As the resultsstrongly depend on lower tropospheric wind speeds (Figure 5), we chose a constant wind
155
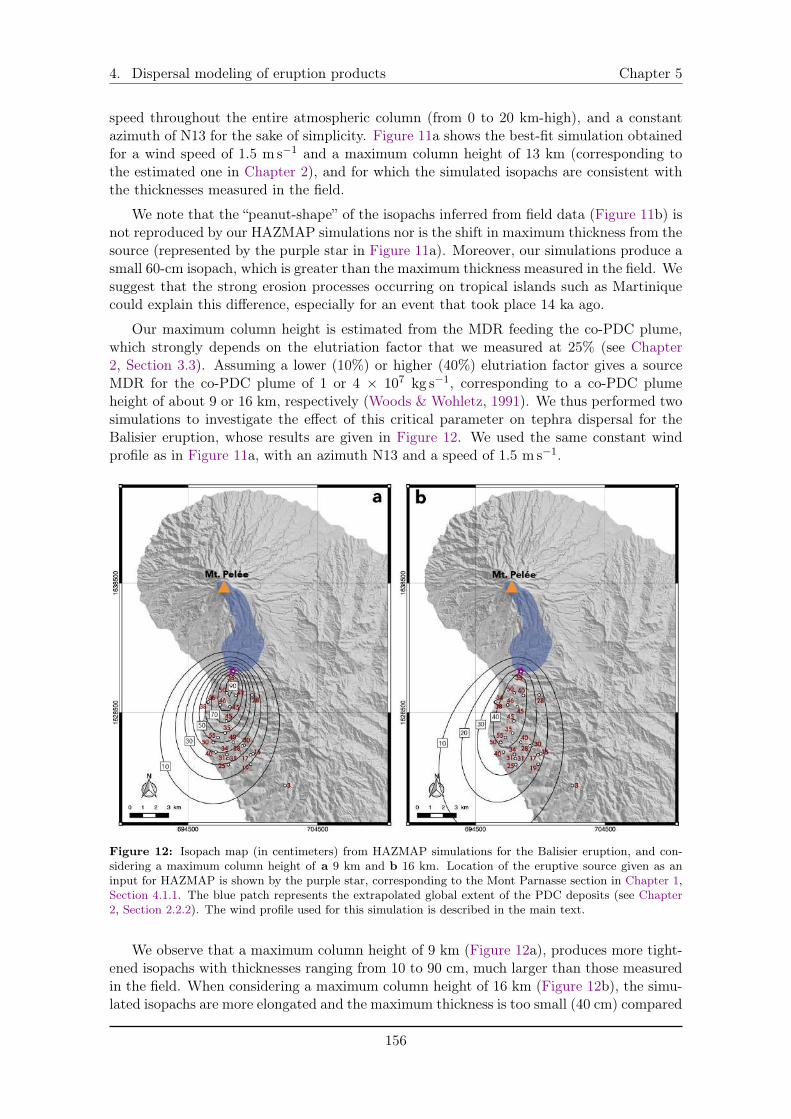
4. Dispersal modeling of eruption products Chapter 5
speed throughout the entire atmospheric column (from 0 to 20 km-high), and a constantazimuth of N13 for the sake of simplicity. Figure 11a shows the best-fit simulation obtainedfor a wind speed of 1.5 ms
�1 and a maximum column height of 13 km (corresponding tothe estimated one in Chapter 2), and for which the simulated isopachs are consistent withthe thicknesses measured in the field.
We note that the “peanut-shape” of the isopachs inferred from field data (Figure 11b) isnot reproduced by our HAZMAP simulations nor is the shift in maximum thickness from thesource (represented by the purple star in Figure 11a). Moreover, our simulations produce asmall 60-cm isopach, which is greater than the maximum thickness measured in the field. Wesuggest that the strong erosion processes occurring on tropical islands such as Martiniquecould explain this difference, especially for an event that took place 14 ka ago.
Our maximum column height is estimated from the MDR feeding the co-PDC plume,which strongly depends on the elutriation factor that we measured at 25% (see Chapter2, Section 3.3). Assuming a lower (10%) or higher (40%) elutriation factor gives a sourceMDR for the co-PDC plume of 1 or 4 ⇥ 10
7kg s
�1, corresponding to a co-PDC plumeheight of about 9 or 16 km, respectively (Woods & Wohletz, 1991). We thus performed twosimulations to investigate the effect of this critical parameter on tephra dispersal for theBalisier eruption, whose results are given in Figure 12. We used the same constant windprofile as in Figure 11a, with an azimuth N13 and a speed of 1.5 ms
�1.
Figure 12: Isopach map (in centimeters) from HAZMAP simulations for the Balisier eruption, and con-sidering a maximum column height of a 9 km and b 16 km. Location of the eruptive source given as aninput for HAZMAP is shown by the purple star, corresponding to the Mont Parnasse section in Chapter 1,Section 4.1.1. The blue patch represents the extrapolated global extent of the PDC deposits (see Chapter2, Section 2.2.2). The wind profile used for this simulation is described in the main text.
We observe that a maximum column height of 9 km (Figure 12a), produces more tight-ened isopachs with thicknesses ranging from 10 to 90 cm, much larger than those measuredin the field. When considering a maximum column height of 16 km (Figure 12b), the simu-lated isopachs are more elongated and the maximum thickness is too small (40 cm) compared
156
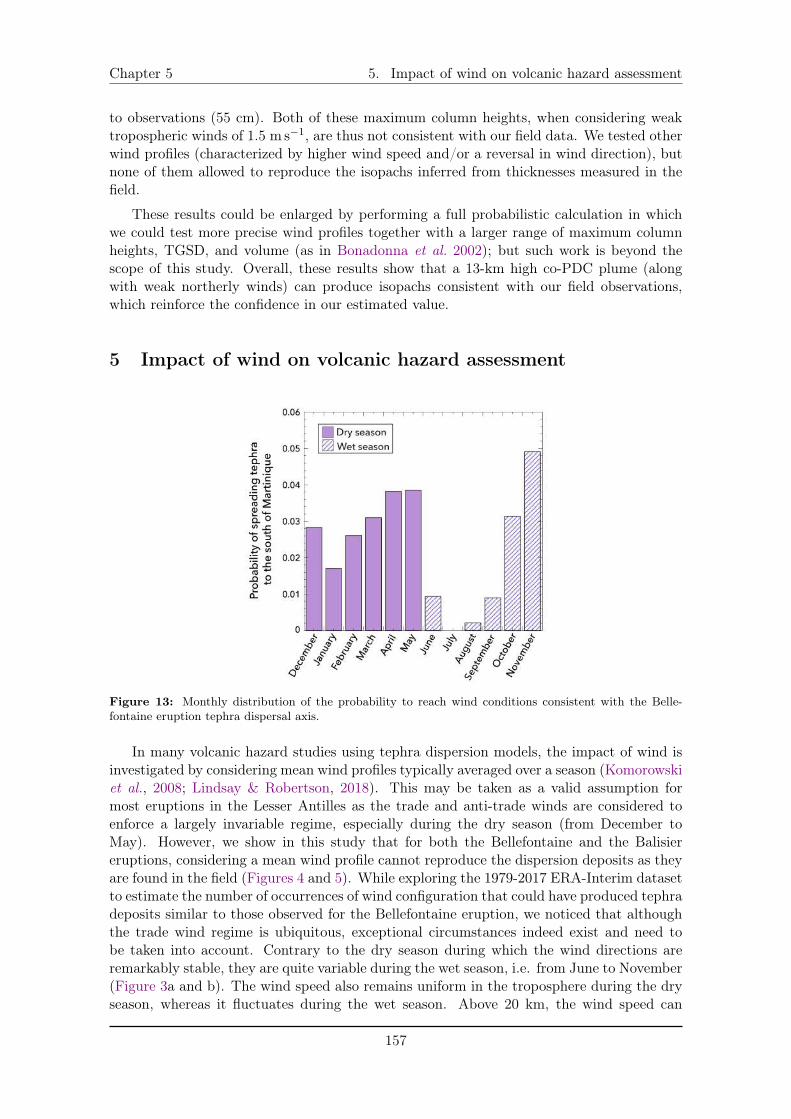
Chapter 5 5. Impact of wind on volcanic hazard assessment
to observations (55 cm). Both of these maximum column heights, when considering weaktropospheric winds of 1.5 ms
�1, are thus not consistent with our field data. We tested otherwind profiles (characterized by higher wind speed and/or a reversal in wind direction), butnone of them allowed to reproduce the isopachs inferred from thicknesses measured in thefield.
These results could be enlarged by performing a full probabilistic calculation in whichwe could test more precise wind profiles together with a larger range of maximum columnheights, TGSD, and volume (as in Bonadonna et al. 2002); but such work is beyond thescope of this study. Overall, these results show that a 13-km high co-PDC plume (alongwith weak northerly winds) can produce isopachs consistent with our field observations,which reinforce the confidence in our estimated value.
5 Impact of wind on volcanic hazard assessment
Figure 13: Monthly distribution of the probability to reach wind conditions consistent with the Belle-fontaine eruption tephra dispersal axis.
In many volcanic hazard studies using tephra dispersion models, the impact of wind isinvestigated by considering mean wind profiles typically averaged over a season (Komorowskiet al., 2008; Lindsay & Robertson, 2018). This may be taken as a valid assumption formost eruptions in the Lesser Antilles as the trade and anti-trade winds are considered toenforce a largely invariable regime, especially during the dry season (from December toMay). However, we show in this study that for both the Bellefontaine and the Balisiereruptions, considering a mean wind profile cannot reproduce the dispersion deposits as theyare found in the field (Figures 4 and 5). While exploring the 1979-2017 ERA-Interim datasetto estimate the number of occurrences of wind configuration that could have produced tephradeposits similar to those observed for the Bellefontaine eruption, we noticed that althoughthe trade wind regime is ubiquitous, exceptional circumstances indeed exist and need tobe taken into account. Contrary to the dry season during which the wind directions areremarkably stable, they are quite variable during the wet season, i.e. from June to November(Figure 3a and b). The wind speed also remains uniform in the troposphere during the dryseason, whereas it fluctuates during the wet season. Above 20 km, the wind speed can
157
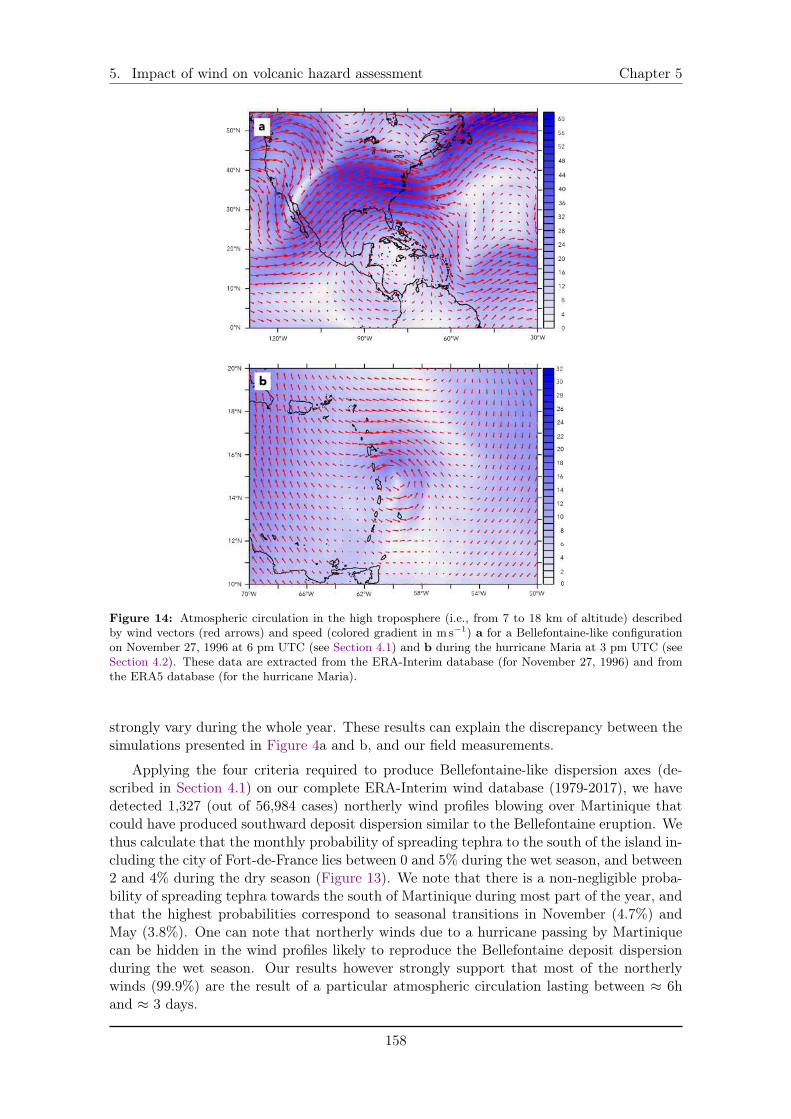
5. Impact of wind on volcanic hazard assessment Chapter 5
Figure 14: Atmospheric circulation in the high troposphere (i.e., from 7 to 18 km of altitude) describedby wind vectors (red arrows) and speed (colored gradient in ms�1) a for a Bellefontaine-like configurationon November 27, 1996 at 6 pm UTC (see Section 4.1) and b during the hurricane Maria at 3 pm UTC (seeSection 4.2). These data are extracted from the ERA-Interim database (for November 27, 1996) and fromthe ERA5 database (for the hurricane Maria).
strongly vary during the whole year. These results can explain the discrepancy between thesimulations presented in Figure 4a and b, and our field measurements.
Applying the four criteria required to produce Bellefontaine-like dispersion axes (de-scribed in Section 4.1) on our complete ERA-Interim wind database (1979-2017), we havedetected 1,327 (out of 56,984 cases) northerly wind profiles blowing over Martinique thatcould have produced southward deposit dispersion similar to the Bellefontaine eruption. Wethus calculate that the monthly probability of spreading tephra to the south of the island in-cluding the city of Fort-de-France lies between 0 and 5% during the wet season, and between2 and 4% during the dry season (Figure 13). We note that there is a non-negligible proba-bility of spreading tephra towards the south of Martinique during most part of the year, andthat the highest probabilities correspond to seasonal transitions in November (4.7%) andMay (3.8%). One can note that northerly winds due to a hurricane passing by Martiniquecan be hidden in the wind profiles likely to reproduce the Bellefontaine deposit dispersionduring the wet season. Our results however strongly support that most of the northerlywinds (99.9%) are the result of a particular atmospheric circulation lasting between ⇡ 6hand ⇡ 3 days.
158
References
The atmospheric pattern linked to Bellefontaine-like events (Section 4.1) is indeed aresult of a peculiar situation wherein the path of the subtropical jet-stream is spitted intotwo branches: a northern branch flowing from the West to the East (standard behavior),and a southern branch meandering toward the South before flowing to the East (Figure 14a).Reasons leading to this change are beyond the scope of this study, but the common featureseems to be a drifting to the North (> 30�N latitude) of the high/low-pressure zone at thesurface/tropopause in the central Atlantic Ocean. In contrast, a hurricane is a transient andlocal system (Figure 14b), and thus, the chance of it passing close enough to Martinique,along an appropriate path, during an eruption is less probable than northerly winds such asthose presented in Section 4.1. This probability should nonetheless be taken into accountinto a future multi-hazard assessment in Martinique.
These results highlight the scarcity of the cases in Martinique yielding Bellefontaine-likesouthward tephra dispersion. The Bellefontaine, Carbet and Etoile events are, however, theproof that such a scenario (impacting half of the island) remains possible for future eruptionsin Martinique as well as other Caribbean volcanoes (e.g., Brazier et al. 1982; Poret et al.
2017; Poulidis et al. 2018). Such wind conditions are of crucial importance for hazardassessment as our HAZMAP calculations show that a Bellefontaine-like eruption wouldspread over 2 cm of ash on the city of Fort-de-France, a situation not currently representedon the hazard map (Stieltjes & Mirgon 1998, see Introduction, Figure 7). Moreover, Fort-de-France and its surrounding area are densely populated (more than 123,000 inhabitants),which increase their vulnerability – and therefore the volcanic risk – to a future eruption.We thus conclude that models must include the daily variability of wind profiles instead ofusing season-averaged ones to depict volcanic hazard and risk in Martinique (and in othersimilar settings) more accurately.
6 Conclusion
In this chapter, we investigated the unusual southward dispersion of all the newly discoverederuptions in Martinique: the Bellefontaine, Balisier, Carbet and Etoile events, by using the2D HAZMAP model. Simulations of tephra dispersion using the HAZMAP model suggestthat the Bellefontaine eruption (and thus the Balisier, Carbet and Etoile events) probablydid not occur during a hurricane, but rather under weak northerlies in upper troposphere(7-18 km) occasionally measured over Martinique, and could have spread volcanic tephra asfar as the city of Fort-de-France. We also demonstrated that the distribution of the co-PDCdeposits from the Balisier eruption can be explained by a 13-km high plume rising underweak northerly winds, which is consistent with our estimated value based on an elutriationfactor of 25%.
These findings identify a major caveat when using mean seasonal wind profiles, whichprovide information about the most probable case only, to assess hazard-prone areas with ahigh degree of confidence. To improve volcanic disaster forecasting, especially in regions likesmall tropical islands, the daily variability of winds in terms of speed and direction must betaken into account. In the following chapter, we refine the volcanic hazard assessment fortephra fallout in Martinique by accounting for a more detailed wind variability.
ReferencesArmienti, P., Macedonio, G. & Pareschi, M.T. 1988 A numerical model for simulation of tephra
transport and deposition: Application to May 18, 1980, Mount St. Helens eruption. J. Geophys. Res.
159
References
93 (B6), 6463–6476.
Bonadonna, C., Mayberry, G.C., Calder, E.S., Sparks, R.S.J., Choux, C., Jackson, P., Leje-une, A.M., Loughlin, S.C., Norton, G.E., Rose, W.I., Ryan, G. & Young, S.R. 2002 Tephrafallout in the eruption of Soufriere Hills Volcano, Montserrat. In The Eruption of Soufriere Hills Vol-cano, Montserrat from 1995 to 1999 (ed. T.H. Druitt & B.P. Kokelaar), pp. 483–516. Geological Society,London, Memoirs.
Bonasia, R., Capra, L., Costa, A., Macedonio, G. & Saucedo, R. 2011 Tephra fallout hazardassessment for a Plinian eruption scenario at Volcán de Colima (Mexico). J. Volcanol. Geotherm. Res.203, 12–22.
Bonasia, R., Costa, A., Folch, A., Macedonio, G. & Capra, L. 2012 Numerical simulation oftephra transport and deposition of the 1982 El Chichón eruption and implications for hazard assessment.J. Volcanol. Geotherm. Res. 231-232, 39–49.
Brazier, S., David, A.N., Sigurdsson, H. & Sparks, R.S.J. 1982 Fall-out and deposition of volcanicash during the 1979 explosive eruption of the Soufriere of St. Vincent. J. Volcanol. Geotherm. Res. 14,335–359.
Carazzo, G., Tait, S. & Kaminski, E. 2019 Marginally stable recent Plinian eruptions of Mt. Peléevolcano (Lesser Antilles): The P2 AD 280 eruption. Bull. Volcanol. 81, 1–17.
Carazzo, G., Tait, S., Kaminski, E. & Gardner, J. E. 2012 The recent Plinian explosive activity ofMt. Pelée volcano (Lesser Antilles): The P1 AD 1300 eruption. Bull. Volcanol. 74, 2187–2203.
Costa, A., Dell’Erba, F., Vito, M. A., Isaia, R., Macedonio, G., Orsi, G. & Pfeiffer, T. 2009Tephra fallout hazard assessment at the Campi Flegrei caldera (Italy). Bull. Volcanol. 71, 259–273.
Costa, A., Macedonio, G. & Folch, A. 2006 A three-dimensional Eulerian model for transport anddeposition of volcanic ashes. Earth Planet. Sci. Lett. 241 (3-4), 634–647.
Dee, D. P., Uppala, S. M., Simmons, A. J., Berrisford, P., Poli, P., Kobayashi, S., Andrae,U., Balmaseda, M. A., Balsamo, G., Bauer, P., Bechtold, P., Beljaars, A. C.M., van deBerg, L., Bidlot, J., Bormann, N., Delsol, C., Dragani, R., Fuentes, M., Geer, A. J.,Haimberger, L., Healy, S. B., Hersbach, H., Hólm, E. V., Isaksen, L., Kållberg, P., Köhler,M., Matricardi, M., Mcnally, A. P., Monge-Sanz, B. M., Morcrette, J. J., Park, B. K.,Peubey, C., de Rosnay, P., Tavolato, C., Thépaut, J. N. & Vitart, F. 2011 The ERA-Interimreanalysis: Configuration and performance of the data assimilation system. Q. J. R. Meteorol. Soc. 137,553–597.
Dunion, J.P. 2011 Rewriting the climatology of the tropical North Atlantic and Caribbean Sea atmosphere.J. Clim. 24, 893–908.
Folch, A., Costa, A. & Macedonio, G. 2009 FALL3D: A computational model for transport anddeposition of volcanic ash. Comput. Geosci. 35, 1334–1342.
Franklin, J.L., Black, M.L. & Valde, K. 2000 Eyewall wind profiles in hurricanes determined by GPSdropwindsondes. Preprints 24th Conf. on Hurricanes and Tropical Meteorology, Amer. Meteor. Soc., FortLauderdale, FL pp. 446–447.
Hersbach, H., Bell, B., Berrisford, P., Horányi, A., Muñoz Sabater, J., Nicolas, J., Radu,R., Schepers, D., Simmons, A., Soci, C. & Dee, D. 2019 Global reanalysis: goodbye ERA-Interim,hello ERA5. ECMWF Newslett. 159, 17–24.
Komorowski, J. C., Legendre, Y., Caron, B. & Boudon, G. 2008 Reconstruction and analysis of sub-plinian tephra dispersal during the 1530 A.D. Soufriere (Guadeloupe) eruption: Implications for scenariodefinition and hazards assessment. J. Volcanol. Geotherm. Res. 178, 491–515.
Kossin, J.P., Camargo, S.J. & Sitkowski, M. 2010 Climate modulation of North Atlantic hurricanetracks. J. Climate 23, 3057–3076.
Lacroix, A. 1904 La Montagne Pelée et ses éruptions. Masson, Paris.
160
References
Landsea, C.W. & Franklin, J.L. 2013 Atlantic hurricane database uncertainty and presentation of anew database format. Mon. Weather Rev. 141, 3576–3592.
Lindsay, J.M. & Robertson, R.E.A. 2018 Integrating Volcanic Hazard Data in a Systematic Approachto Develop Volcanic Hazard Maps in the Lesser Antilles. Frontiers in Earth Science 6 (42), 1–17.
Macedonio, G. & Costa, A. 2014 HAZMAP-2.4.2: User Manual . Istituto Nazionale di Geofisica eVulcanologia (INGV).
Macedonio, G., Costa, A. & Folch, A. 2008 Ash fallout scenarios at Vesuvius: Numerical simulationsand implications for hazard assessment. J. Volcanol. Geotherm. Res. 178 (3), 366–377.
Macedonio, G., Costa, A. & Longo, A. 2005 A computer model for volcanic ash fallout and assessmentof subsequent hazard. Comput. Geosci. 31, 837–845.
Macedonio, Giovanni, Costa, Antonio, Scollo, Simona & Neri, Augusto 2016 Effects of eruptionsource parameter variation and meteorological dataset on tephra fallout hazard assessment: Examplefrom Vesuvius (Italy). J. Appl. Volcanol. 5 (1).
Macedonio, G., Pareschi, M.T. & Santacroce, R. 1988 A Numerical Simulation of the Plinian FallPhase of 79 A.D. Eruption of Vesuvius. J. Geophys. Res. 93 (B12), 14817–14827.
Manzella, I., Bonadonna, C., Phillips, J.C. & Monnard, H. 2015 The role of gravitational instabil-ities in deposition of volcanic ash. Geology 43, 211–214.
Michaud-Dubuy, A., Carazzo, G., Tait, S., Le Hir, G., Fluteau, F. & Kaminski, E. 2019 Impactof wind direction variability on hazard assessment in Martinique (Lesser Antilles): The example of the13.5 ka cal BP Bellefontaine Plinian eruption of Mount Pelée volcano. J. Volcanol. Geotherm. Res. 381,193–208.
Murakami, H. 2014 Tropical cyclones in reanalysis data sets. Geophys. Res. Lett. 41, 2133–2141.
Perret, F.A. 1937 The Eruption of Mt. Pelée 1929-1932 . Carnegie Institution of Washington.
Pfeiffer, T., Costa, A. & Macedonio, G. 2005 A model for the numerical simulation of tephra falldeposits. J. Volcanol. Geotherm. Res. 140 (4), 273–294.
Poret, M., Costa, A., Folch, A. & Martí, A. 2017 Modelling tephra dispersal and ash aggregation:The 26th April 1979 eruption, La Soufrière St. Vincent. J. Volcanol. Geotherm. Res. 347, 207–220.
Poulidis, A.P., Phillips, J.C., Renfrew, I.A., Barclay, J., Hogg, A., Jenkins, S.F., Robertson,R. & Pyle, D.M. 2018 Meteorological controls on local and regional volcanic ash dispersal. Scientif.Rep. 8 (6873).
Roobol, M.J. & Smith, A.L. 1976 Mount Pelée, Martinique: A pattern of alternating eruptive styles.Geology 4, 521–524.
Stieltjes, L. & Mirgon, C. 1998 Approche méthodologique de la vulnérabilité aux phénomènes vol-caniques : Test d’application sur les réseaux de la Martinique. In Unpublished Internal Report No. R40098 .Bureau de Recherches Géologiques et Minières, Marseille.
Suzuki, T. 1983 A Theoretical Model for Dispersion of Tephra. In Arc Volcanism: Physics and Tectonics,pp. 95–113. Terra Scientific Publishing Company (TERRAPUB), Tokyo.
Traineau, H., Westercamp, D., Bardintzeff, J. M. & Miskovsky, J. C. 1989 The recent pumiceeruptions of Mt. Pelée volcano, Martinique. Part I: Depositional sequences, description of pumiceousdeposits. J. Volcanol. Geotherm. Res. 38, 17–33.
Watt, S.F.L., Gilbert, J.S., Folch, A., Phillips, J.C. & Cai, X.M. 2015 An example of enhancedtephra deposition driven by topographically induced atmospheric turbulence. Bull. Volcanol. 77 (35).
Westercamp, D. & Traineau, H. 1983 The past 5,000 years of volcanic activity at Mt. Pelée Martinique(F.W.I.): Implications for assessment of volcanic hazards. J. Volcanol. Geotherm. Res. 17, 159–185.
Woods, A. W. & Wohletz, K. 1991 Dimensions and dynamics of co-ignimbrite eruption columns. Nature350, 225–227.
161

Chapter 6
Refined hazard maps for tephra
fallout in Martinique
Table of contents1 Introduction . . . . . . . . . . . . . . . . . . . . . . . . . . . . . . . . . . 1652 Current volcanic hazard assessment in Martinique . . . . . . . . . . . . . 1653 Input parameters for HAZMAP . . . . . . . . . . . . . . . . . . . . . . . 166
3.1 Volcanological parameters: matrix of correlation . . . . . . . . . 1673.2 Wind profiles from ERA Interim . . . . . . . . . . . . . . . . . . 168
4 Results . . . . . . . . . . . . . . . . . . . . . . . . . . . . . . . . . . . . . 1714.1 Classical approach using mean seasonal wind profiles . . . . . . . 171
4.1.1 Hazard maps for wet and dry seasons . . . . . . . . . . 1714.1.2 Aggregated hazard map . . . . . . . . . . . . . . . . . 173
4.2 Refined method accounting for wind variability . . . . . . . . . . 1744.2.1 Monthly hazard maps . . . . . . . . . . . . . . . . . . . 1744.2.2 New hazard map for tephra fallout in Martinique . . . 181
5 Discussion . . . . . . . . . . . . . . . . . . . . . . . . . . . . . . . . . . . 1835.1 Comparison with previous hazard map for tephra fallout . . . . . 1835.2 Other volcanic hazards in Martinique . . . . . . . . . . . . . . . . 184
6 Conclusion . . . . . . . . . . . . . . . . . . . . . . . . . . . . . . . . . . . 185
Chapter 6
Résumé du chapitre 6
Nous avons vu dans les chapitres précédents que l’histoire éruptive de la montagne Peléeest bien plus riche que nous ne le pensions auparavant, et que la dynamique d’une éruptionexplosive dépend fortement des paramètres éruptifs dont la distribution totale des tailles degrains, mais aussi des vents au moment de l’événement éruptif. La carte d’aléa volcaniquepour les retombées de cendres en Martinique construite par Stieltjes & Mirgon (1998) etutilisée actuellement dans le plan ORSEC de gestion de crise s’appuie sur une histoireéruptive limitée à 5 000 ans. De plus, celle-ci ne prend pas en compte l’effet du vent surla dispersion des cendres, mais seulement l’extension maximale des dépôts retrouvés sur leterrain en ignorant les processus d’érosion qui auront fait disparaître les dépôts les plus finset les plus distaux. Dans ce chapitre, dédié à une première réévaluation de l’aléa volcaniqueen Martinique, nous utilisons le modèle 2D HAZMAP de dispersion des produits volcaniquespour construire une nouvelle carte d’aléa pour les retombées de cendres en Martinique enconsidérant les éruptions pliniennes passées de la montagne Pelée depuis 24 000 ans, ainsique la variabilité des vents.
Nous proposons une méthode basée sur la considération de 16 scénarii éruptifs, cohérentsavec les éruptions passées de la montagne Pelée. Chaque scénario considère une masse dedépôts et un flux de masse, et possède une probabilité d’occurrence en fonction de l’histoireéruptive de la montagne Pelée déterminée en Chapitre 1. Grâce à la base de données devents ERA-Interim (présentée dans le chapitre précédent), nous considérons la variabilitédes vents saisonnière puis mensuelle.
Notre première série de résultats, considérant chacun de ces 16 scénarii avec deux pro-fils de vents moyens saisonniers (approche classique pour l’estimation de l’aléa volcanique),montrent que ces profils lissent la variabilité des vents ce qui a un impact sur la caractéri-sation de l’aléa volcanique, confirmant donc les conclusions du Chapitre 5. Notre secondesérie de résultats, basée sur les mêmes 16 scénarii éruptifs mais considérant cette fois lavariabilité mensuelle des vents, montre des changements importants dans la carte d’aléaobtenue. Ces changements concernent principalement la partie sud de l’île de la Martiniquequi était jusqu’à présent considérée comme sécurisée mais qui pourrait être menacée par desvents venant du NNO dans la haute troposphère, principalement durant la saison sèche (dedécembre à mai).
La carte d’aléa volcanique pour les retombées pliniennes obtenue à la fin de cette étude,et combinant les cartes mensuelles d’aléa, est basée sur des épaisseurs de dépôts ou sur descharges de dépôts (en kgm
�2). Afin de faciliter sa lecture pour les autorités compétentesen gestion de crise, nous la combinons avec des seuils critiques d’épaisseurs de dépôts déter-minés dans la littérature, et obtenons une carte affichant seulement 4 niveaux de couleurs,chacun associé à un degré d’endommagement potentiel des bâtis ou des réseaux de commu-nication. Cette étude n’est qu’une première étape dans la réévaluation de l’aléa volcanique àla Martinique mais permet de proposer une nouvelle carte d’aléa intégrant tous les aléas vol-caniques connus en Martinique. Dans le futur, il sera nécessaire de considérer la variabilitéjournalière des vents afin de produire des cartes probabilistes.
164
Chapter 6 1. Introduction
1 Introduction
We saw in previous chapters that the contribution of Plinian eruptions to the past eruptivehistory of Mount Pelée volcano is much richer than previously thought (Chapters 1 and 2),and that the eruption dynamics strongly depends on total grain-size distribution (TGSD,Chapter 3) and winds blowing during the eruption (Chapters 4 and 5). This chapter isdedicated to the production of a refined volcanic hazard assessment in Martinique using the2D HAZMAP model described in the previous chapter. Considering past Plinian eruptionsat Mount Pelée volcano as well as wind variability over Martinique allows us to build a newhazard map for tephra fallout that can be compared to the actual one. This work paves theway for an improved integrated volcanic hazard map in Martinique.
First, we present previous studies on volcanic hazard assessment in Martinique and dis-cuss the caveats of their results. Then, we describe the method used to identify referencevolcanic scenarii based on past Plinian eruptions at Mount Pelée volcano, later used to pro-vide input parameters for the HAZMAP model. A first set of results is obtained by usingthe classical approach for volcanic hazard assessment related to tephra fallout (i.e., usingmean seasonal wind profiles), then we present the improved predictions obtained when usinga refined method accounting for the monthly variability of winds. Finally, we compare thenewly obtained hazard map for tephra fallout with the one used in the current evacuationplan (ORSEC, Organisation de la réponse de la sécurité civile) by using relationships be-tween deposit thickness, tephra mass load and their impact on infrastructures. We alsoinvestigate what future steps must be taken to move forward towards a new integratedvolcanic hazard map, which would be of essential necessity in case of a future eruption atMount Pelée volcano.
2 Current volcanic hazard assessment in Martinique
Mount Pelée is one of the most active volcanoes in the Lesser Antilles arc with more than34 magmatic events in the last 24,000 years (Chapter 1), including the deadliest eruptionof the XX
e century in 1902 (see Introduction). Our field study revealed that all eruptivemagmatic events (Pelean and Plinian) occurring at Mount Pelée volcano could result intotephra dispersal towards the south of Martinique, where most of the population lives. Today,about 400,000 people live in Martinique and are thus more or less threatened by volcanichazards, making crucial the improvement of volcanic hazard assessment (and consequentlyrisk assessment).
During the last few decades, various approaches have been proposed to improve themanagement of volcanic crisis. Traditionally, volcanic hazard assessment for tephra falloutwas based on volcano monitoring and geological records (Baker, 1985; Houghton et al., 1987;Stieltjes & Mirgon, 1998; Newhall & Hoblitt, 2002; Orsi et al., 2004; Macías et al., 2008).This method may be sufficient for volcanic environments where only a few informationare available on the past eruptive history of the volcano, but it can often hide crucialinformations about the weakest (and more frequent) events as their deposits are rapidlyeroded or buried beneath those of more voluminous eruptions.
Since the 1990’s, GIS (Geographic Information System) tools and numerical simulationsallow to quantify volcanic hazard with a much better precision. Numerical modeling, to-gether with field studies, indeed allows to explore much wider range of possible scenarii(Bonadonna et al., 2002). Previous studies focused on either one eruptive scenario (usually
165
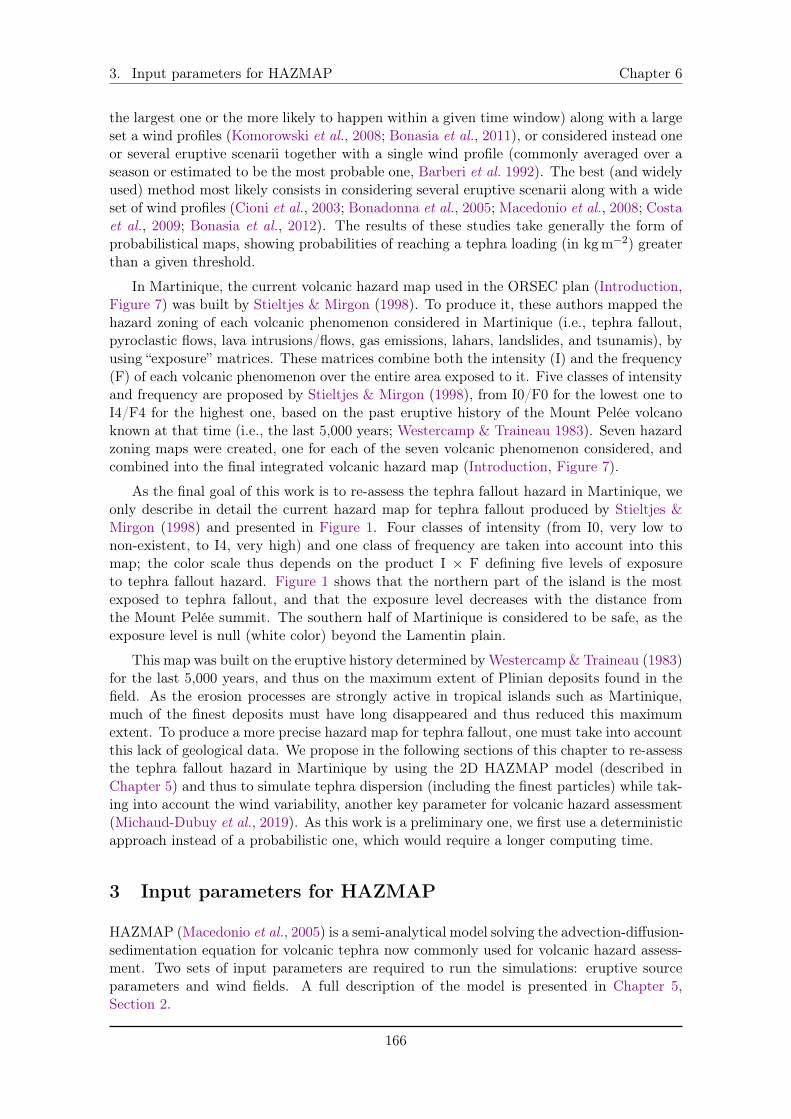
3. Input parameters for HAZMAP Chapter 6
the largest one or the more likely to happen within a given time window) along with a largeset a wind profiles (Komorowski et al., 2008; Bonasia et al., 2011), or considered instead oneor several eruptive scenarii together with a single wind profile (commonly averaged over aseason or estimated to be the most probable one, Barberi et al. 1992). The best (and widelyused) method most likely consists in considering several eruptive scenarii along with a wideset of wind profiles (Cioni et al., 2003; Bonadonna et al., 2005; Macedonio et al., 2008; Costaet al., 2009; Bonasia et al., 2012). The results of these studies take generally the form ofprobabilistical maps, showing probabilities of reaching a tephra loading (in kgm
�2) greaterthan a given threshold.
In Martinique, the current volcanic hazard map used in the ORSEC plan (Introduction,Figure 7) was built by Stieltjes & Mirgon (1998). To produce it, these authors mapped thehazard zoning of each volcanic phenomenon considered in Martinique (i.e., tephra fallout,pyroclastic flows, lava intrusions/flows, gas emissions, lahars, landslides, and tsunamis), byusing “exposure” matrices. These matrices combine both the intensity (I) and the frequency(F) of each volcanic phenomenon over the entire area exposed to it. Five classes of intensityand frequency are proposed by Stieltjes & Mirgon (1998), from I0/F0 for the lowest one toI4/F4 for the highest one, based on the past eruptive history of the Mount Pelée volcanoknown at that time (i.e., the last 5,000 years; Westercamp & Traineau 1983). Seven hazardzoning maps were created, one for each of the seven volcanic phenomenon considered, andcombined into the final integrated volcanic hazard map (Introduction, Figure 7).
As the final goal of this work is to re-assess the tephra fallout hazard in Martinique, weonly describe in detail the current hazard map for tephra fallout produced by Stieltjes &Mirgon (1998) and presented in Figure 1. Four classes of intensity (from I0, very low tonon-existent, to I4, very high) and one class of frequency are taken into account into thismap; the color scale thus depends on the product I ⇥ F defining five levels of exposureto tephra fallout hazard. Figure 1 shows that the northern part of the island is the mostexposed to tephra fallout, and that the exposure level decreases with the distance fromthe Mount Pelée summit. The southern half of Martinique is considered to be safe, as theexposure level is null (white color) beyond the Lamentin plain.
This map was built on the eruptive history determined by Westercamp & Traineau (1983)for the last 5,000 years, and thus on the maximum extent of Plinian deposits found in thefield. As the erosion processes are strongly active in tropical islands such as Martinique,much of the finest deposits must have long disappeared and thus reduced this maximumextent. To produce a more precise hazard map for tephra fallout, one must take into accountthis lack of geological data. We propose in the following sections of this chapter to re-assessthe tephra fallout hazard in Martinique by using the 2D HAZMAP model (described inChapter 5) and thus to simulate tephra dispersion (including the finest particles) while tak-ing into account the wind variability, another key parameter for volcanic hazard assessment(Michaud-Dubuy et al., 2019). As this work is a preliminary one, we first use a deterministicapproach instead of a probabilistic one, which would require a longer computing time.
3 Input parameters for HAZMAP
HAZMAP (Macedonio et al., 2005) is a semi-analytical model solving the advection-diffusion-sedimentation equation for volcanic tephra now commonly used for volcanic hazard assess-ment. Two sets of input parameters are required to run the simulations: eruptive sourceparameters and wind fields. A full description of the model is presented in Chapter 5,Section 2.
166
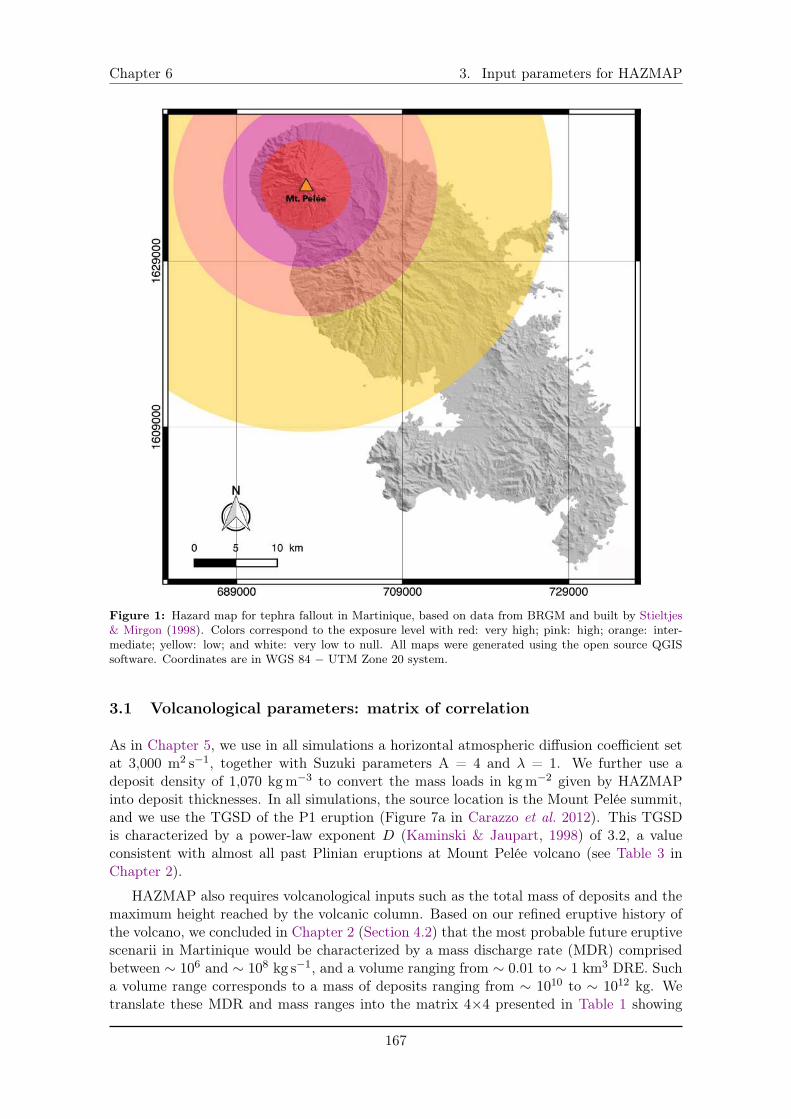
Chapter 6 3. Input parameters for HAZMAP
Figure 1: Hazard map for tephra fallout in Martinique, based on data from BRGM and built by Stieltjes& Mirgon (1998). Colors correspond to the exposure level with red: very high; pink: high; orange: inter-mediate; yellow: low; and white: very low to null. All maps were generated using the open source QGISsoftware. Coordinates are in WGS 84 � UTM Zone 20 system.
3.1 Volcanological parameters: matrix of correlation
As in Chapter 5, we use in all simulations a horizontal atmospheric diffusion coefficient setat 3,000 m
2s
�1, together with Suzuki parameters A = 4 and � = 1. We further use adeposit density of 1,070 kgm
�3 to convert the mass loads in kgm
�2 given by HAZMAPinto deposit thicknesses. In all simulations, the source location is the Mount Pelée summit,and we use the TGSD of the P1 eruption (Figure 7a in Carazzo et al. 2012). This TGSDis characterized by a power-law exponent D (Kaminski & Jaupart, 1998) of 3.2, a valueconsistent with almost all past Plinian eruptions at Mount Pelée volcano (see Table 3 inChapter 2).
HAZMAP also requires volcanological inputs such as the total mass of deposits and themaximum height reached by the volcanic column. Based on our refined eruptive history ofthe volcano, we concluded in Chapter 2 (Section 4.2) that the most probable future eruptivescenarii in Martinique would be characterized by a mass discharge rate (MDR) comprisedbetween ⇠ 10
6 and ⇠ 10
8kg s
�1, and a volume ranging from ⇠ 0.01 to ⇠ 1 km
3 DRE. Sucha volume range corresponds to a mass of deposits ranging from ⇠ 10
10 to ⇠ 10
12 kg. Wetranslate these MDR and mass ranges into the matrix 4⇥4 presented in Table 1 showing
167
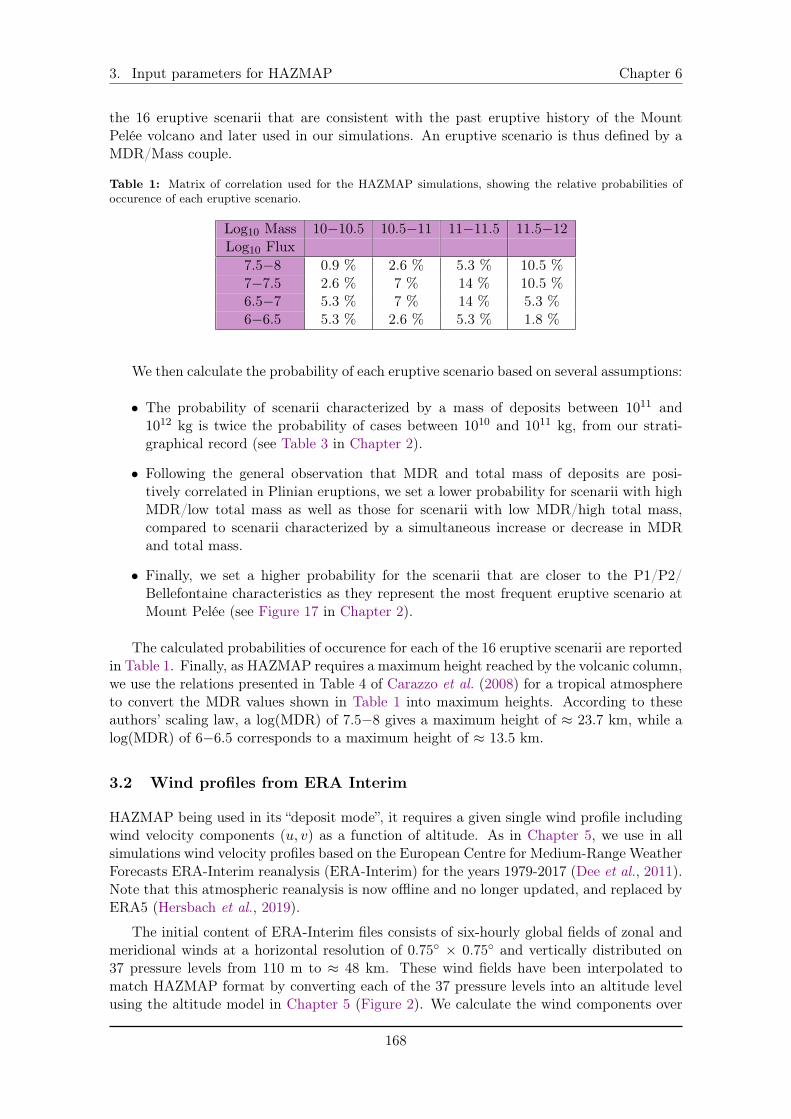
3. Input parameters for HAZMAP Chapter 6
the 16 eruptive scenarii that are consistent with the past eruptive history of the MountPelée volcano and later used in our simulations. An eruptive scenario is thus defined by aMDR/Mass couple.
Table 1: Matrix of correlation used for the HAZMAP simulations, showing the relative probabilities ofoccurence of each eruptive scenario.
Log10 Mass 10�10.5 10.5�11 11�11.5 11.5�12Log10 Flux
7.5�8 0.9 % 2.6 % 5.3 % 10.5 %
7�7.5 2.6 % 7 % 14 % 10.5 %
6.5�7 5.3 % 7 % 14 % 5.3 %
6�6.5 5.3 % 2.6 % 5.3 % 1.8 %
We then calculate the probability of each eruptive scenario based on several assumptions:
• The probability of scenarii characterized by a mass of deposits between 10
11 and10
12 kg is twice the probability of cases between 10
10 and 10
11 kg, from our strati-graphical record (see Table 3 in Chapter 2).
• Following the general observation that MDR and total mass of deposits are posi-tively correlated in Plinian eruptions, we set a lower probability for scenarii with highMDR/low total mass as well as those for scenarii with low MDR/high total mass,compared to scenarii characterized by a simultaneous increase or decrease in MDRand total mass.
• Finally, we set a higher probability for the scenarii that are closer to the P1/P2/Bellefontaine characteristics as they represent the most frequent eruptive scenario atMount Pelée (see Figure 17 in Chapter 2).
The calculated probabilities of occurence for each of the 16 eruptive scenarii are reportedin Table 1. Finally, as HAZMAP requires a maximum height reached by the volcanic column,we use the relations presented in Table 4 of Carazzo et al. (2008) for a tropical atmosphereto convert the MDR values shown in Table 1 into maximum heights. According to theseauthors’ scaling law, a log(MDR) of 7.5�8 gives a maximum height of ⇡ 23.7 km, while alog(MDR) of 6�6.5 corresponds to a maximum height of ⇡ 13.5 km.
3.2 Wind profiles from ERA Interim
HAZMAP being used in its “deposit mode”, it requires a given single wind profile includingwind velocity components (u, v) as a function of altitude. As in Chapter 5, we use in allsimulations wind velocity profiles based on the European Centre for Medium-Range WeatherForecasts ERA-Interim reanalysis (ERA-Interim) for the years 1979-2017 (Dee et al., 2011).Note that this atmospheric reanalysis is now offline and no longer updated, and replaced byERA5 (Hersbach et al., 2019).
The initial content of ERA-Interim files consists of six-hourly global fields of zonal andmeridional winds at a horizontal resolution of 0.75� ⇥ 0.75� and vertically distributed on37 pressure levels from 110 m to ⇡ 48 km. These wind fields have been interpolated tomatch HAZMAP format by converting each of the 37 pressure levels into an altitude levelusing the altitude model in Chapter 5 (Figure 2). We calculate the wind components over
168
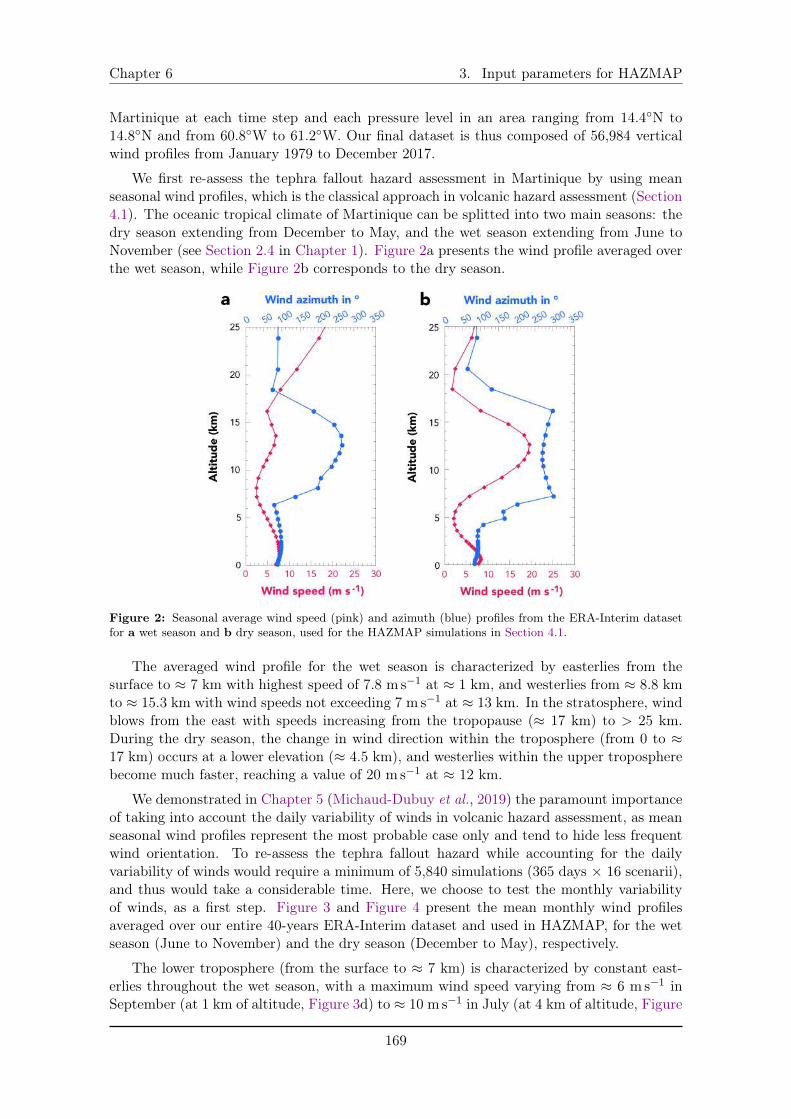
Chapter 6 3. Input parameters for HAZMAP
Martinique at each time step and each pressure level in an area ranging from 14.4�N to14.8�N and from 60.8�W to 61.2�W. Our final dataset is thus composed of 56,984 verticalwind profiles from January 1979 to December 2017.
We first re-assess the tephra fallout hazard assessment in Martinique by using meanseasonal wind profiles, which is the classical approach in volcanic hazard assessment (Section4.1). The oceanic tropical climate of Martinique can be splitted into two main seasons: thedry season extending from December to May, and the wet season extending from June toNovember (see Section 2.4 in Chapter 1). Figure 2a presents the wind profile averaged overthe wet season, while Figure 2b corresponds to the dry season.
Figure 2: Seasonal average wind speed (pink) and azimuth (blue) profiles from the ERA-Interim datasetfor a wet season and b dry season, used for the HAZMAP simulations in Section 4.1.
The averaged wind profile for the wet season is characterized by easterlies from thesurface to ⇡ 7 km with highest speed of 7.8 ms
�1 at ⇡ 1 km, and westerlies from ⇡ 8.8 kmto ⇡ 15.3 km with wind speeds not exceeding 7 ms
�1 at ⇡ 13 km. In the stratosphere, windblows from the east with speeds increasing from the tropopause (⇡ 17 km) to > 25 km.During the dry season, the change in wind direction within the troposphere (from 0 to ⇡17 km) occurs at a lower elevation (⇡ 4.5 km), and westerlies within the upper tropospherebecome much faster, reaching a value of 20 ms
�1 at ⇡ 12 km.
We demonstrated in Chapter 5 (Michaud-Dubuy et al., 2019) the paramount importanceof taking into account the daily variability of winds in volcanic hazard assessment, as meanseasonal wind profiles represent the most probable case only and tend to hide less frequentwind orientation. To re-assess the tephra fallout hazard while accounting for the dailyvariability of winds would require a minimum of 5,840 simulations (365 days ⇥ 16 scenarii),and thus would take a considerable time. Here, we choose to test the monthly variabilityof winds, as a first step. Figure 3 and Figure 4 present the mean monthly wind profilesaveraged over our entire 40-years ERA-Interim dataset and used in HAZMAP, for the wetseason (June to November) and the dry season (December to May), respectively.
The lower troposphere (from the surface to ⇡ 7 km) is characterized by constant east-erlies throughout the wet season, with a maximum wind speed varying from ⇡ 6 ms
�1 inSeptember (at 1 km of altitude, Figure 3d) to ⇡ 10 ms
�1 in July (at 4 km of altitude, Figure
169
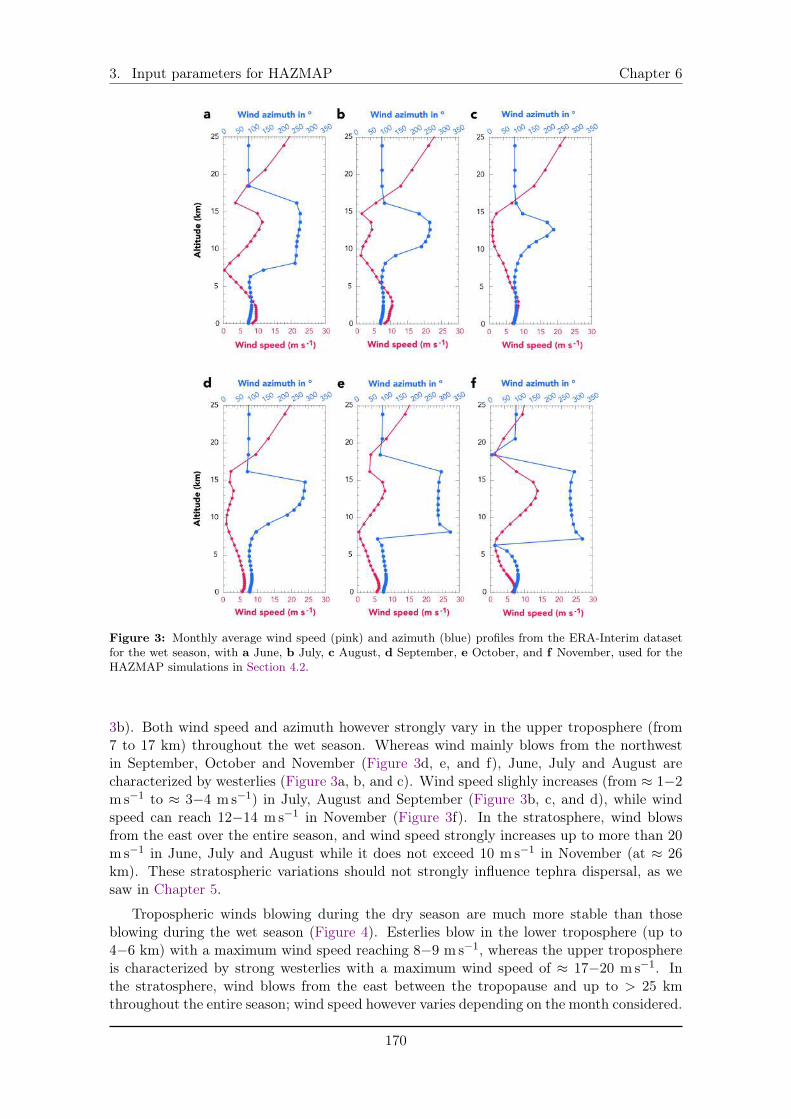
3. Input parameters for HAZMAP Chapter 6
Figure 3: Monthly average wind speed (pink) and azimuth (blue) profiles from the ERA-Interim datasetfor the wet season, with a June, b July, c August, d September, e October, and f November, used for theHAZMAP simulations in Section 4.2.
3b). Both wind speed and azimuth however strongly vary in the upper troposphere (from7 to 17 km) throughout the wet season. Whereas wind mainly blows from the northwestin September, October and November (Figure 3d, e, and f), June, July and August arecharacterized by westerlies (Figure 3a, b, and c). Wind speed slighly increases (from ⇡ 1�2ms
�1 to ⇡ 3�4 ms
�1) in July, August and September (Figure 3b, c, and d), while windspeed can reach 12�14 ms
�1 in November (Figure 3f). In the stratosphere, wind blowsfrom the east over the entire season, and wind speed strongly increases up to more than 20ms
�1 in June, July and August while it does not exceed 10 ms
�1 in November (at ⇡ 26km). These stratospheric variations should not strongly influence tephra dispersal, as wesaw in Chapter 5.
Tropospheric winds blowing during the dry season are much more stable than thoseblowing during the wet season (Figure 4). Esterlies blow in the lower troposphere (up to4�6 km) with a maximum wind speed reaching 8�9 ms
�1, whereas the upper troposphereis characterized by strong westerlies with a maximum wind speed of ⇡ 17�20 ms
�1. Inthe stratosphere, wind blows from the east between the tropopause and up to > 25 kmthroughout the entire season; wind speed however varies depending on the month considered.
170
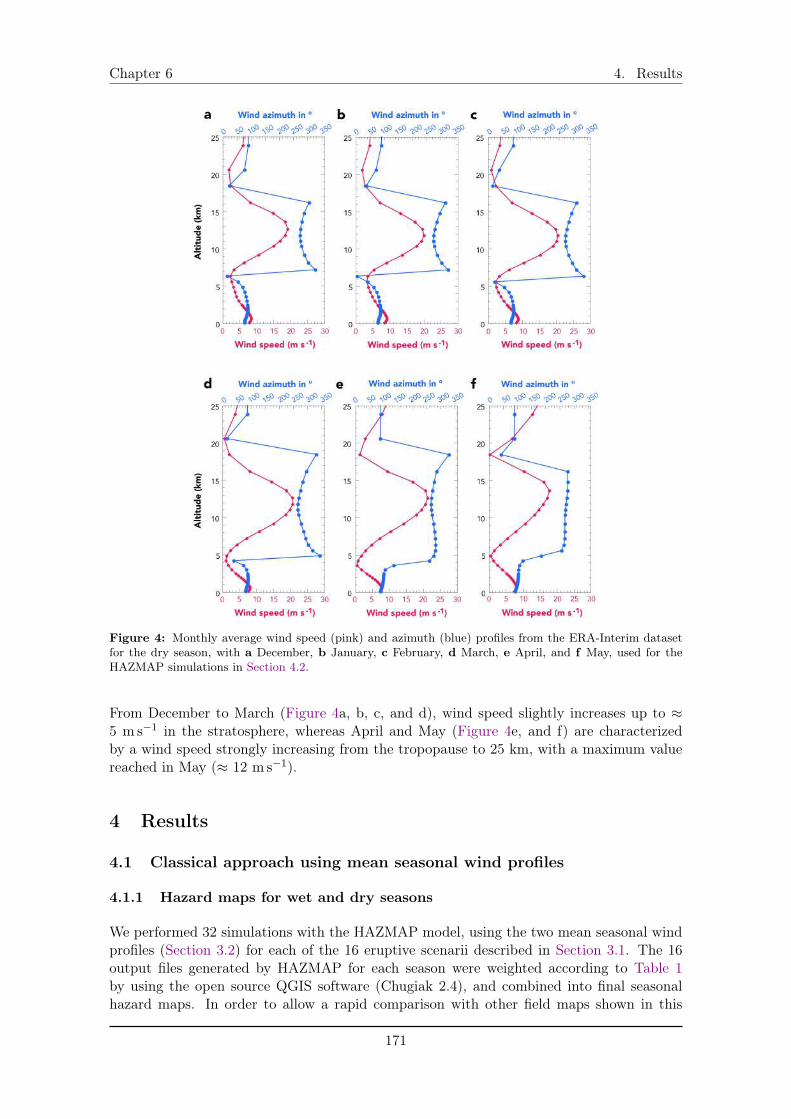
Chapter 6 4. Results
Figure 4: Monthly average wind speed (pink) and azimuth (blue) profiles from the ERA-Interim datasetfor the dry season, with a December, b January, c February, d March, e April, and f May, used for theHAZMAP simulations in Section 4.2.
From December to March (Figure 4a, b, c, and d), wind speed slightly increases up to ⇡5 ms
�1 in the stratosphere, whereas April and May (Figure 4e, and f) are characterizedby a wind speed strongly increasing from the tropopause to 25 km, with a maximum valuereached in May (⇡ 12 ms
�1).
4 Results
4.1 Classical approach using mean seasonal wind profiles
4.1.1 Hazard maps for wet and dry seasons
We performed 32 simulations with the HAZMAP model, using the two mean seasonal windprofiles (Section 3.2) for each of the 16 eruptive scenarii described in Section 3.1. The 16output files generated by HAZMAP for each season were weighted according to Table 1by using the open source QGIS software (Chugiak 2.4), and combined into final seasonalhazard maps. In order to allow a rapid comparison with other field maps shown in this
171
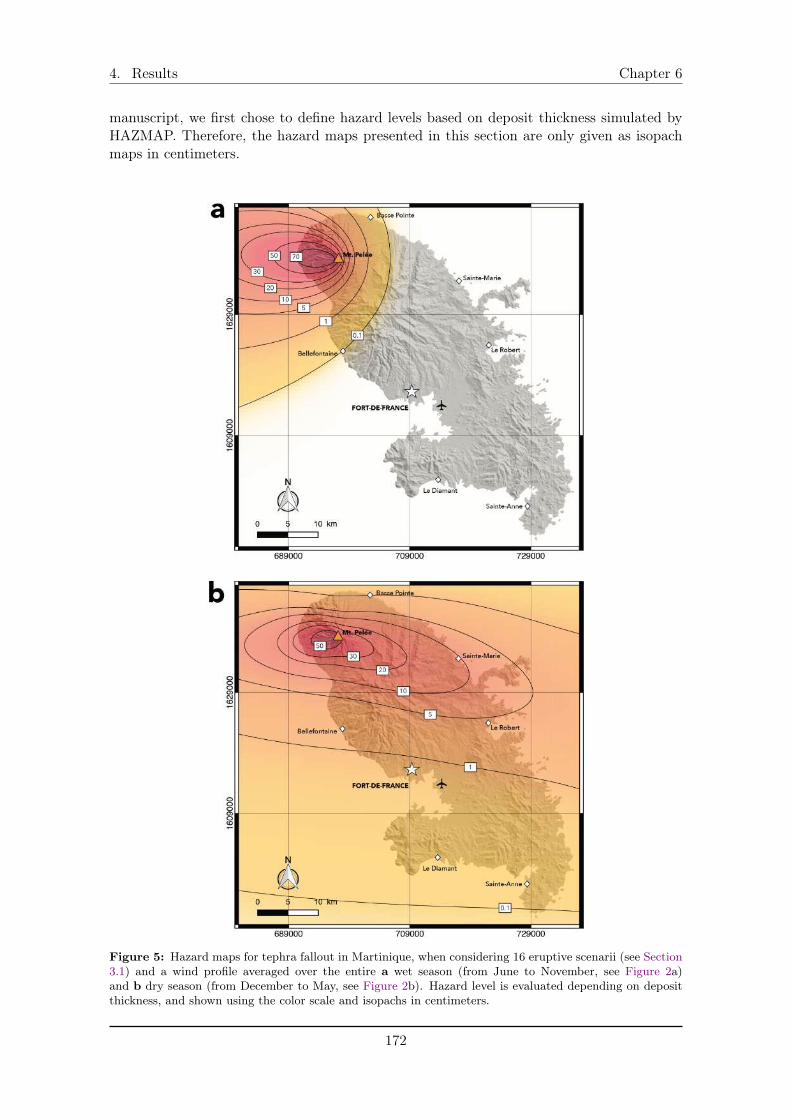
4. Results Chapter 6
manuscript, we first chose to define hazard levels based on deposit thickness simulated byHAZMAP. Therefore, the hazard maps presented in this section are only given as isopachmaps in centimeters.
Figure 5: Hazard maps for tephra fallout in Martinique, when considering 16 eruptive scenarii (see Section3.1) and a wind profile averaged over the entire a wet season (from June to November, see Figure 2a)and b dry season (from December to May, see Figure 2b). Hazard level is evaluated depending on depositthickness, and shown using the color scale and isopachs in centimeters.
172
Chapter 6 4. Results
Figure 5a shows the hazard map for tephra fallout when considering a wind profileaveraged over the entire wet season. In this case, only the northern part of the island isthreatened by tephra fallout, especially on the western flanks of the volcano with more than50�70 centimeters of deposit simulated over Le Prêcheur. Basse-Pointe and Bellefontaineare the farthest cities impacted by tephra fallout, with a thickness ranging from 1 cm to 1mm. This result highlights the importance of the lower tropospheric easterlies that cannotbe counterbalanced by the weak westerlies in the upper troposphere, and thus stronglycontrol the tephra dispersal towards the west throughout the entire wet season (Figure 2a).
Figure 5b shows the hazard map for tephra fallout when considering a wind profile av-eraged over the entire dry season. In this case, the entire island is threatened by tephrafallout resulting from a Plinian eruption. Up to 50 cm of deposits are simulated over thewestern flank of Mount Pelée volcano, which remains the most threatened coast of Mar-tinique. In contrast to the wet season, the dry season winds allow tephra dispersal towardsthe Atlantic coast with 10 cm simulated over Sainte-Marie and 5 cm over Le Robert. Thesouth of Martinique is also affected with ⇡ 1 cm over Fort-de-France and the internationalairport (plane symbol in all figures), and even 1 mm of tephra simulated to the south ofSainte-Anne. Such a wide dispersal of volcanic products can be explained by the strong op-position between dominant lower tropospheric easterlies and strong (> 15 ms
�1) westerliesin the upper troposphere (Figure 2b).
4.1.2 Aggregated hazard map
We now combine Figure 5a and b into a single aggregated map for the whole year, presentedin Figure 6. We can see that contrary to the hazard map for tephra fallout presented inFigure 1, the entire island of Martinique is threatened in this case, mainly because ofthe influence of the dry season winds (Figure 5b). A thickness of 50 cm is simulated byHAZMAP over Le Prêcheur (western flank of Mount Pelée volcano), while Saint-Pierre andSainte-Marie are on the 5-cm isopach on each side of the island. Around 5 mm of tephra issimulated over Fort-de-France and the international airport, and less than 1 mm is forecastedsouth of the island.
We can compare these simulated thicknesses with some damage thresholds given in theliterature in order to better illustrate the implication of this first aggregated hazard map. Inthe northern part of the island where the hazard level is highest, a thickness of 50 cm in LePrêcheur would mean only a partial survival of vegetation (Bonadonna, 2006), severe roofcollapses (Komorowski et al. 2008, their Table 4), severe contamination of water supply, roadclosures, and the need of extensive repair on electrical supply (Wilson et al. 2014, their Table11). In Saint-Pierre and Sainte-Marie, where 5 cm-thick deposits are simulated, electricaland water supply networks would be damaged, as well as roads meaning dangerous drivingconditions. Wilson et al. (2014) also indicates in their Table 11 that 5 mm of tephra overan airport corresponds to a reduced visibility and a possible abrasion of runway, leading tothe airport closure. Finally, even if the south of Martinique would receive less than 1 mmof tephra, Horwell & Baxter (2006) indicate that masks should be worn as long as a 100µgm�3 threshold of PM10 in the air is exceeded.
173
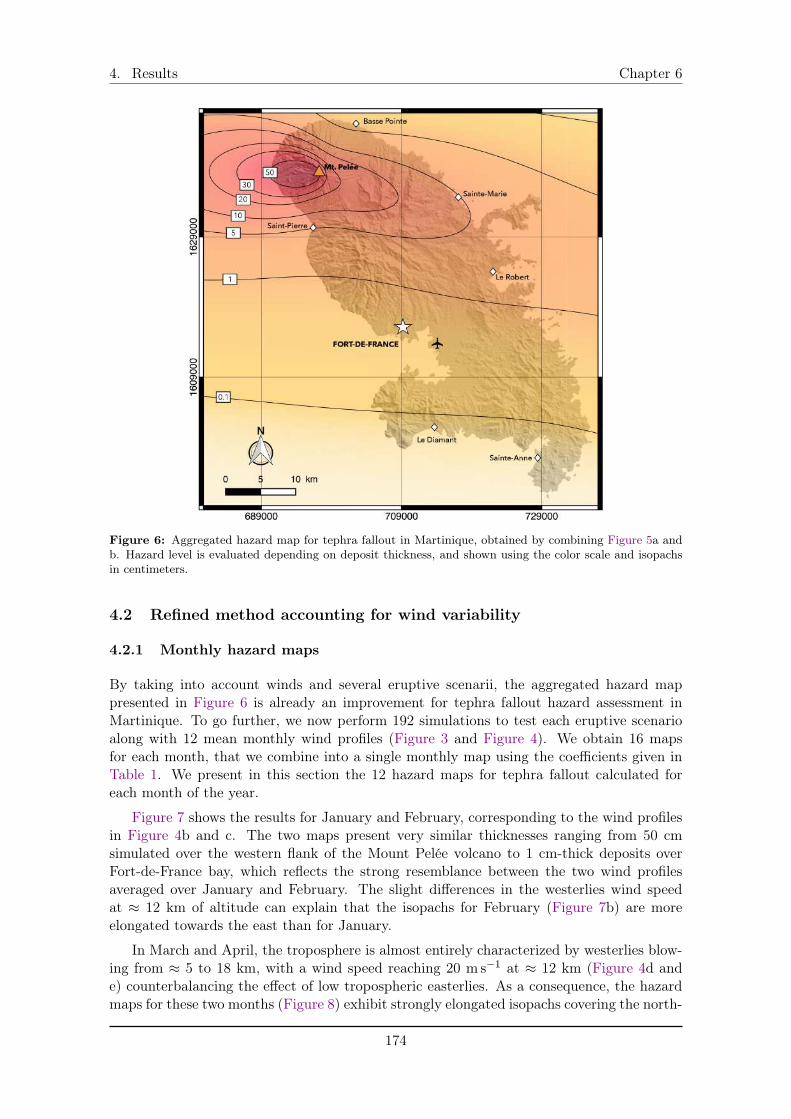
4. Results Chapter 6
Figure 6: Aggregated hazard map for tephra fallout in Martinique, obtained by combining Figure 5a andb. Hazard level is evaluated depending on deposit thickness, and shown using the color scale and isopachsin centimeters.
4.2 Refined method accounting for wind variability
4.2.1 Monthly hazard maps
By taking into account winds and several eruptive scenarii, the aggregated hazard mappresented in Figure 6 is already an improvement for tephra fallout hazard assessment inMartinique. To go further, we now perform 192 simulations to test each eruptive scenarioalong with 12 mean monthly wind profiles (Figure 3 and Figure 4). We obtain 16 mapsfor each month, that we combine into a single monthly map using the coefficients given inTable 1. We present in this section the 12 hazard maps for tephra fallout calculated foreach month of the year.
Figure 7 shows the results for January and February, corresponding to the wind profilesin Figure 4b and c. The two maps present very similar thicknesses ranging from 50 cmsimulated over the western flank of the Mount Pelée volcano to 1 cm-thick deposits overFort-de-France bay, which reflects the strong resemblance between the two wind profilesaveraged over January and February. The slight differences in the westerlies wind speedat ⇡ 12 km of altitude can explain that the isopachs for February (Figure 7b) are moreelongated towards the east than for January.
In March and April, the troposphere is almost entirely characterized by westerlies blow-ing from ⇡ 5 to 18 km, with a wind speed reaching 20 ms
�1 at ⇡ 12 km (Figure 4d ande) counterbalancing the effect of low tropospheric easterlies. As a consequence, the hazardmaps for these two months (Figure 8) exhibit strongly elongated isopachs covering the north-
174
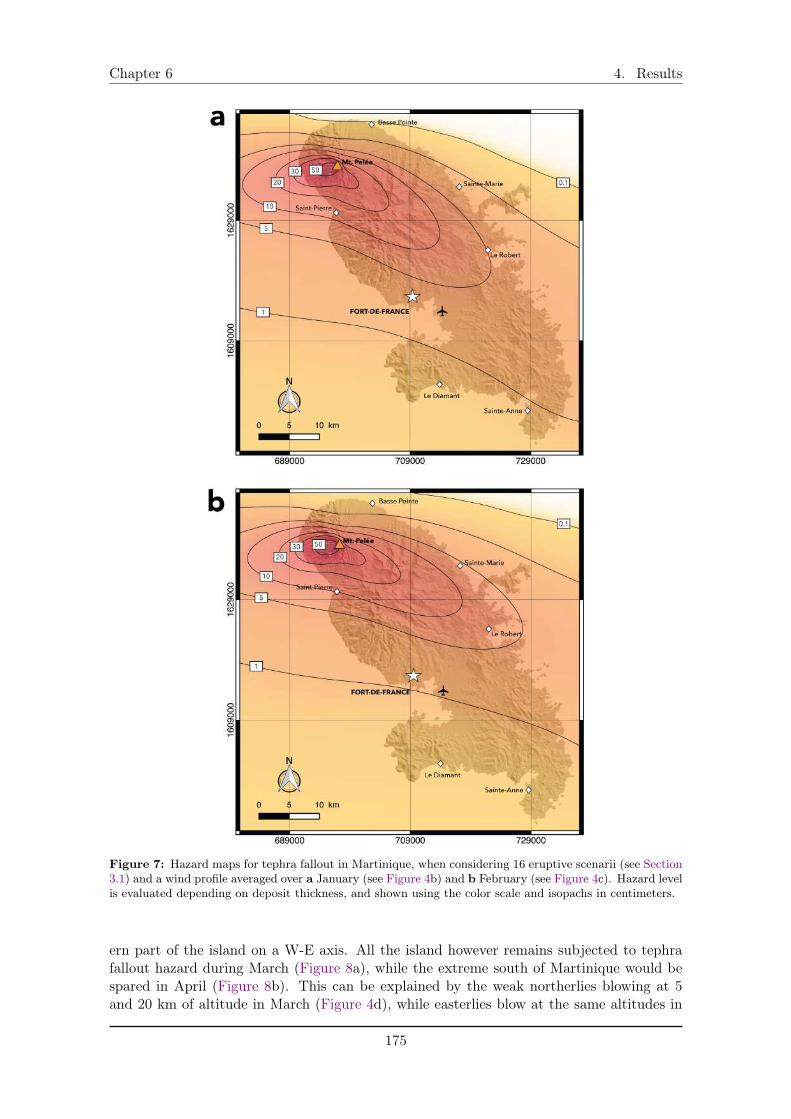
Chapter 6 4. Results
Figure 7: Hazard maps for tephra fallout in Martinique, when considering 16 eruptive scenarii (see Section3.1) and a wind profile averaged over a January (see Figure 4b) and b February (see Figure 4c). Hazard levelis evaluated depending on deposit thickness, and shown using the color scale and isopachs in centimeters.
ern part of the island on a W-E axis. All the island however remains subjected to tephrafallout hazard during March (Figure 8a), while the extreme south of Martinique would bespared in April (Figure 8b). This can be explained by the weak northerlies blowing at 5and 20 km of altitude in March (Figure 4d), while easterlies blow at the same altitudes in
175
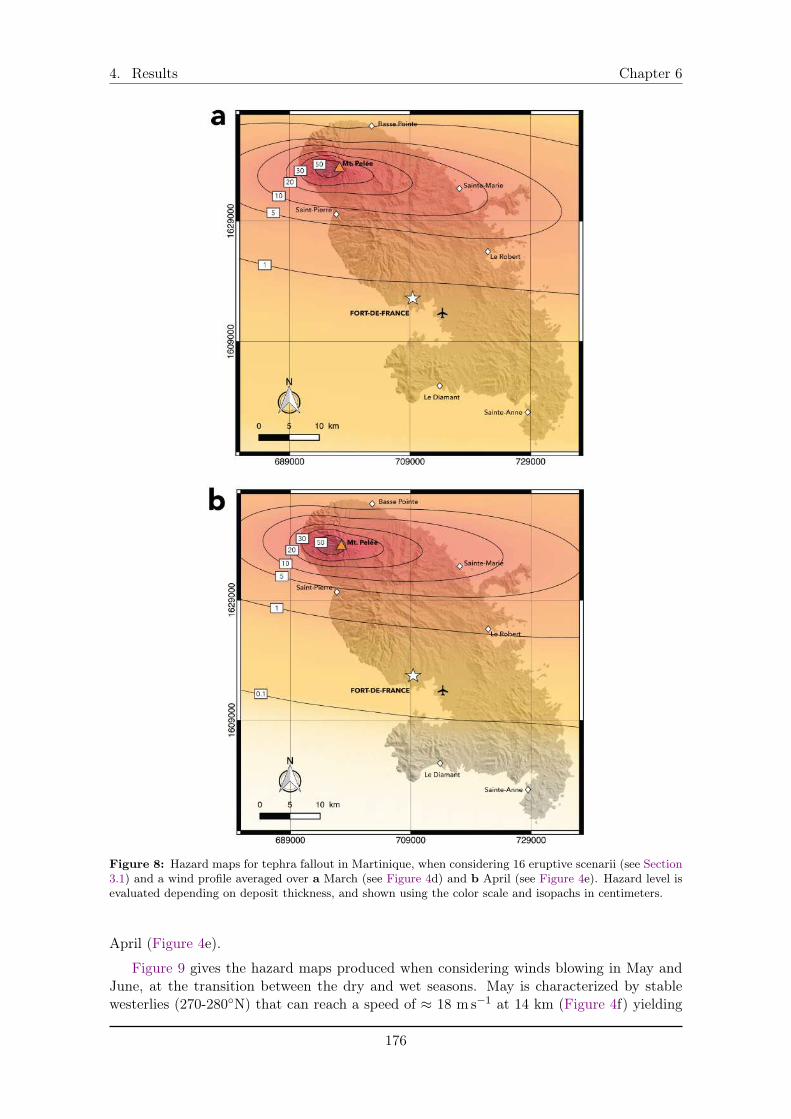
4. Results Chapter 6
Figure 8: Hazard maps for tephra fallout in Martinique, when considering 16 eruptive scenarii (see Section3.1) and a wind profile averaged over a March (see Figure 4d) and b April (see Figure 4e). Hazard level isevaluated depending on deposit thickness, and shown using the color scale and isopachs in centimeters.
April (Figure 4e).
Figure 9 gives the hazard maps produced when considering winds blowing in May andJune, at the transition between the dry and wet seasons. May is characterized by stablewesterlies (270-280�N) that can reach a speed of ⇡ 18 ms
�1 at 14 km (Figure 4f) yielding
176
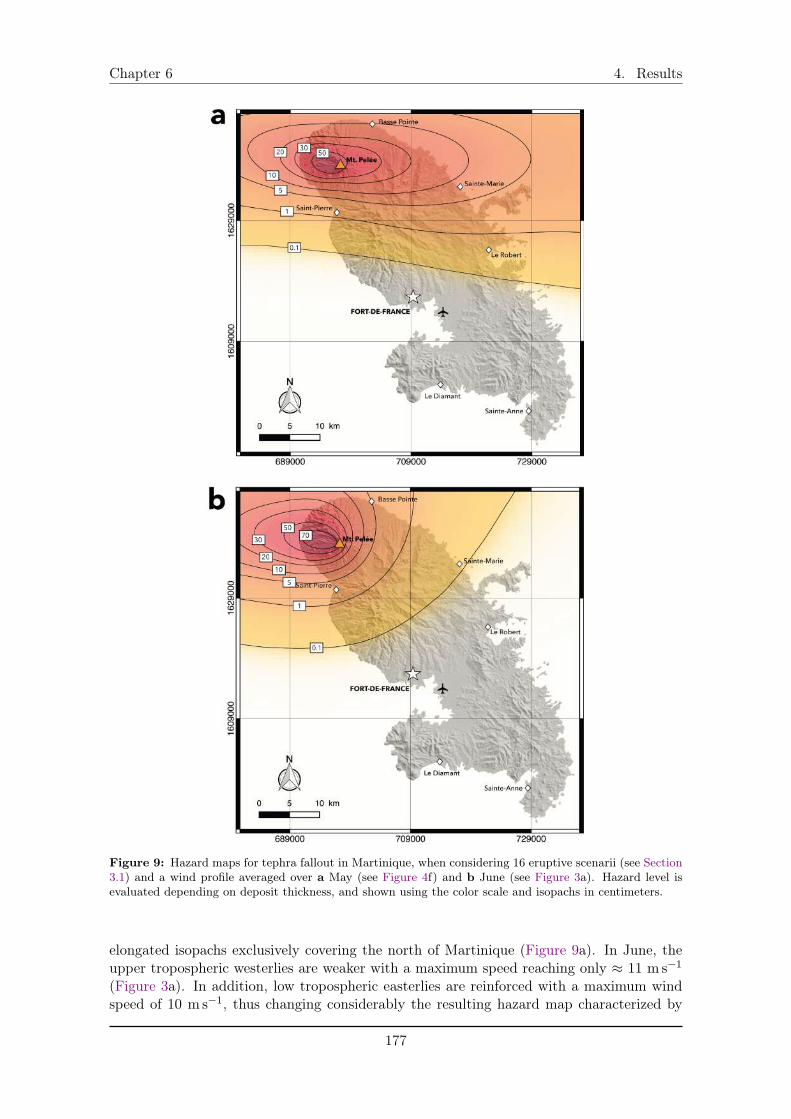
Chapter 6 4. Results
Figure 9: Hazard maps for tephra fallout in Martinique, when considering 16 eruptive scenarii (see Section3.1) and a wind profile averaged over a May (see Figure 4f) and b June (see Figure 3a). Hazard level isevaluated depending on deposit thickness, and shown using the color scale and isopachs in centimeters.
elongated isopachs exclusively covering the north of Martinique (Figure 9a). In June, theupper tropospheric westerlies are weaker with a maximum speed reaching only ⇡ 11 ms
�1
(Figure 3a). In addition, low tropospheric easterlies are reinforced with a maximum windspeed of 10 ms
�1, thus changing considerably the resulting hazard map characterized by
177
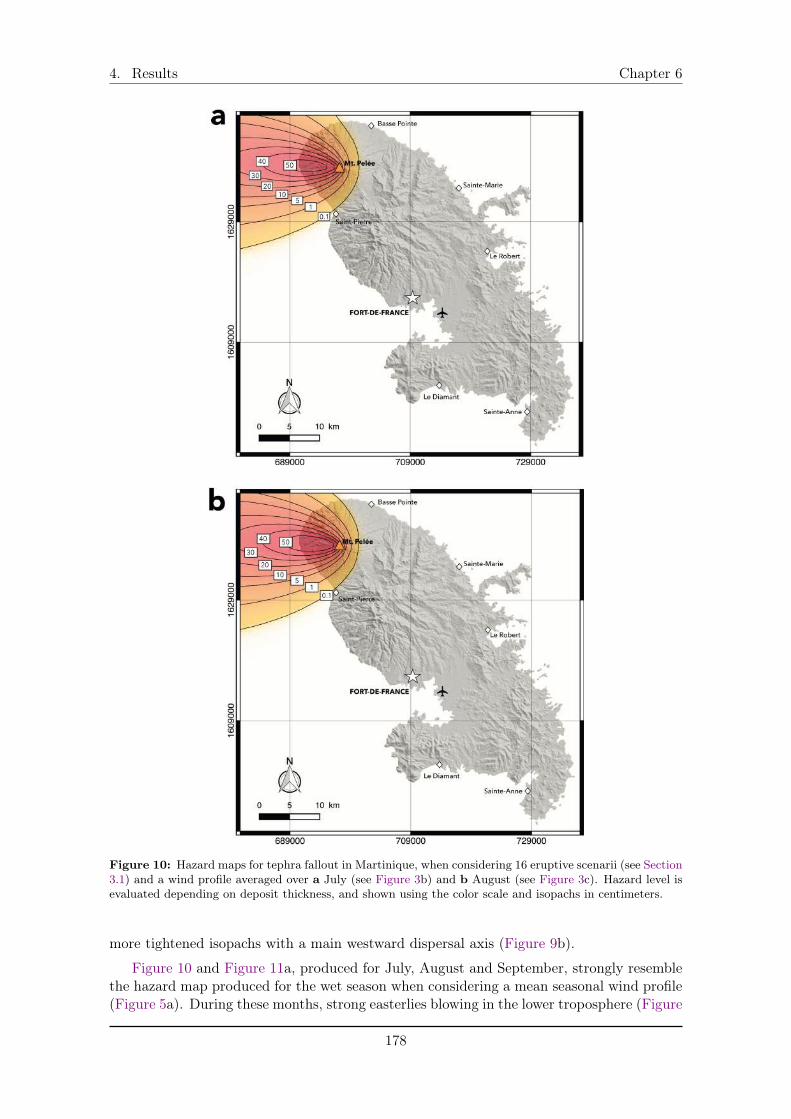
4. Results Chapter 6
Figure 10: Hazard maps for tephra fallout in Martinique, when considering 16 eruptive scenarii (see Section3.1) and a wind profile averaged over a July (see Figure 3b) and b August (see Figure 3c). Hazard level isevaluated depending on deposit thickness, and shown using the color scale and isopachs in centimeters.
more tightened isopachs with a main westward dispersal axis (Figure 9b).
Figure 10 and Figure 11a, produced for July, August and September, strongly resemblethe hazard map produced for the wet season when considering a mean seasonal wind profile(Figure 5a). During these months, strong easterlies blowing in the lower troposphere (Figure
178
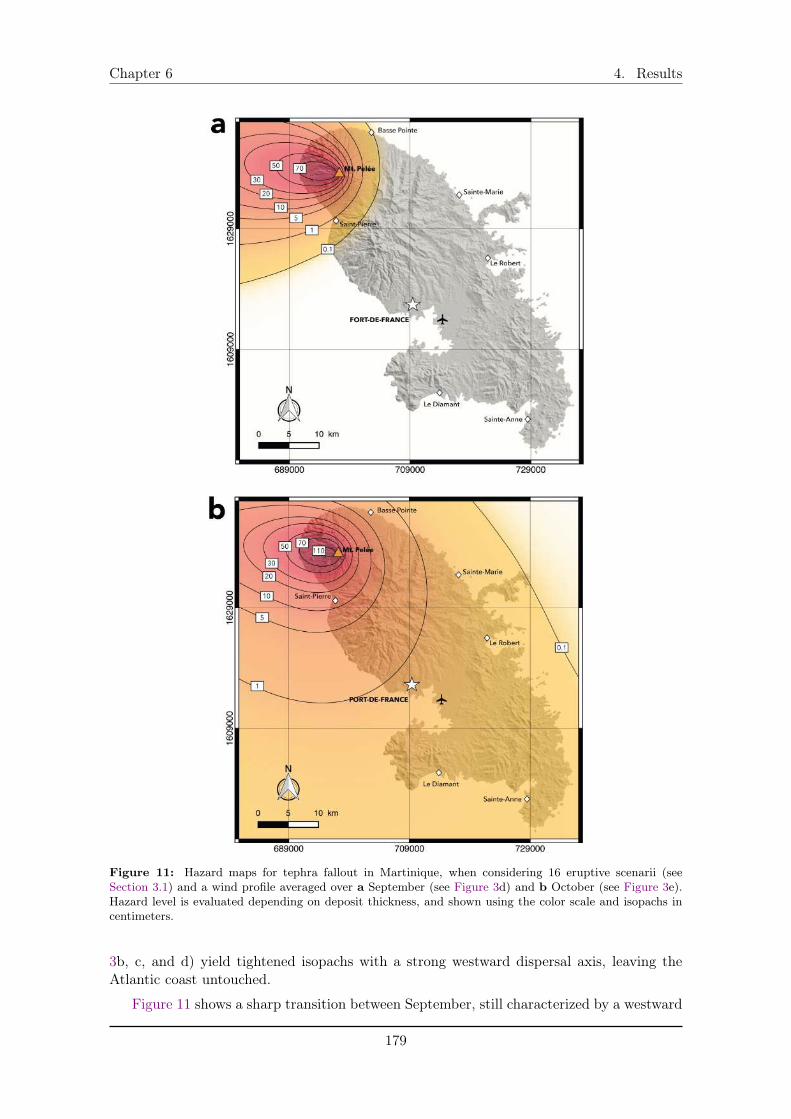
Chapter 6 4. Results
Figure 11: Hazard maps for tephra fallout in Martinique, when considering 16 eruptive scenarii (seeSection 3.1) and a wind profile averaged over a September (see Figure 3d) and b October (see Figure 3e).Hazard level is evaluated depending on deposit thickness, and shown using the color scale and isopachs incentimeters.
3b, c, and d) yield tightened isopachs with a strong westward dispersal axis, leaving theAtlantic coast untouched.
Figure 11 shows a sharp transition between September, still characterized by a westward
179
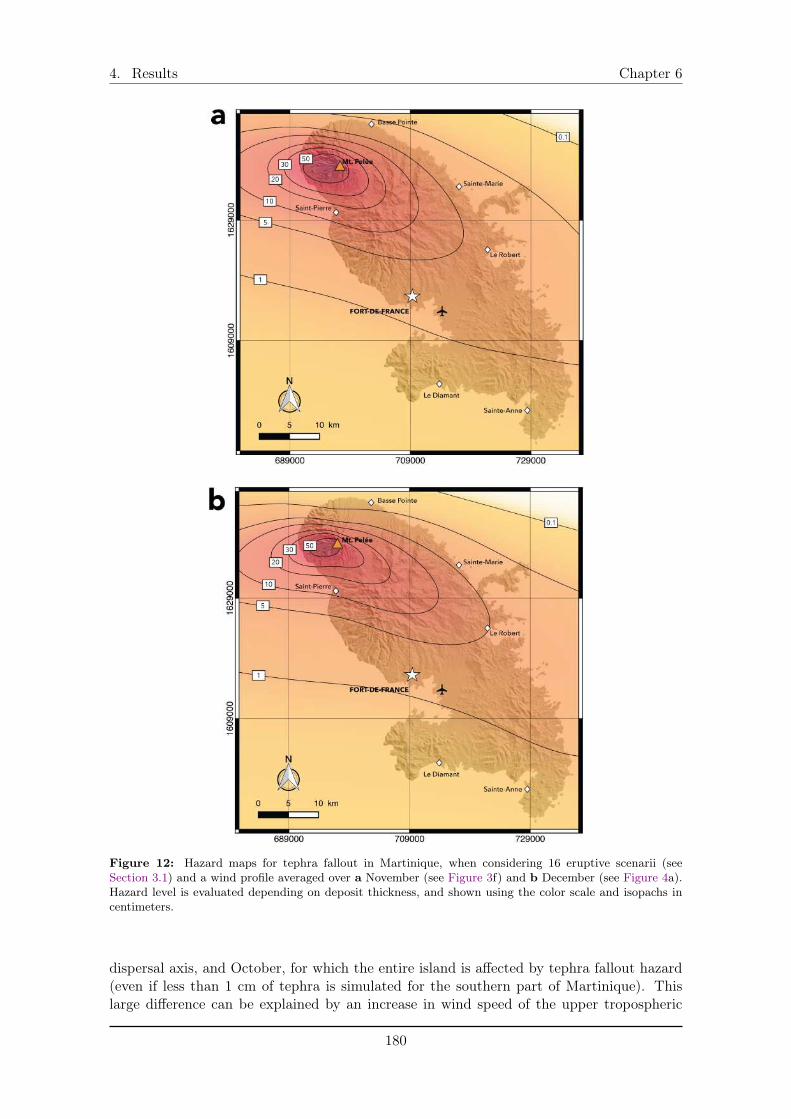
4. Results Chapter 6
Figure 12: Hazard maps for tephra fallout in Martinique, when considering 16 eruptive scenarii (seeSection 3.1) and a wind profile averaged over a November (see Figure 3f) and b December (see Figure 4a).Hazard level is evaluated depending on deposit thickness, and shown using the color scale and isopachs incentimeters.
dispersal axis, and October, for which the entire island is affected by tephra fallout hazard(even if less than 1 cm of tephra is simulated for the southern part of Martinique). Thislarge difference can be explained by an increase in wind speed of the upper tropospheric
180
Chapter 6 4. Results
westerlies in October, compared to September (Figure 3d and e).
In November and December, marking the transition between the wet and dry season,the upper tropospheric wind speed still increases from 8 ms
�1 in October, to 14 ms
�1 inNovember and up to 18 ms
�1 in December (Figure 3e and f; Figure 4a), increasing thetephra fallout hazard in Martinique (Figure 12). In December (Figure 12b), we obtainalmost the exact same map as in January (Figure 7a).
These results show that while hazard maps obtained for the dry season months (fromDecember to May) are really similar to each other, those obtained for the wet season months(from June to November) exhibit a strong variation of simulated thicknesses � and thus oftephra fallout hazard � in accordance with wind variability observed during these months(Figure 3). This variability is completely hidden in the hazard map for the wet season shownin Figure 5a, and thus in our first aggregated map (Figure 6).
4.2.2 New hazard map for tephra fallout in Martinique
We now combine these twelve monthly hazard maps into a new hazard map for tephrafallout in Martinique shown in Figure 13, either using isopachs in centimeters (Figure 13a),or iso-mass loads in kgm
�2 as done for most hazard maps in the literature (Figure 13b).
Our results show that HAZMAP underestimates tephra fallout hazard when accountingsolely for seasonal winds (Figure 6) compared to the monthly variability maps (Figure 13).Our new hazard map indeed simulates more than 1 mm of tephra over Sainte-Anne, whereasthe level of exposure if null in the previous map (Stieltjes & Mirgon, 1998). The internationalairport is also more subjected to tephra fallout with ⇡ 6.5 mm of tephra (7 kgm
�2) predictednear Fort-de-France. Up to the north, similar thicknesses to those obtained with seasonalwinds are calculated, with ⇡ 50 cm-thick deposits over Le Prêcheur and between 5 and 10cm over Saint-Pierre.
Comparing Figure 13b with damage thresholds by tephra fallout in the literature, we findthat the western flanks of the Mount Pelée volcano (north of Saint-Pierre and Le Prêcheur)would be sujected to heavy damages on buildings. Indeed, beyond 200 kgm
�2, there is a50% probability of weak roof collapse (made of timber); beyond 300 kgm
�2, even rooftopsmade of massonry would have a 50-50 chance to collapse (Komorowski et al., 2008). Allvillages built north and east of Saint-Pierre on the southwestern flanks of the volcano arebeyond the 100 kgm
�2 limit and are thus subjected to severe road, buildings and networkdamages (Wilson et al., 2014). According to Komorowski et al. (2008), the 15 kgm
�2 isolinerepresents the limit beyond which there is damage to cultivated croplands. Figure 13b showsthat half of the island is beyond this boundary, but the actual consequences of harvest losseswould be felt by the entire island as the northeastern atlantic coast, characterized by a moretemperate and rainy climate (Chapter 1, Figure 4a), is a favorable environment for farming.Finally, the southern half of Martinique has a tephra fallout hazard comprised between 15kgm
�2 in Fort-de-France and 1 kgm
�2 on the south of Sainte-Anne peninsula. This rangeof mass loads corresponds to the Level 1 described by Wilson et al. (2014) for which cleaningis required to avoid permanent damage on all networks (electrical, water supply, wastewater,communications, roads, etc). In addition, the airport should be closed as soon as a thicknessof 1 mm (⇡ 1 kgm
�2) is reached. These results indicate that the entire island would beimpacted by a future Plinian eruption at Mount Pelée volcano.
181
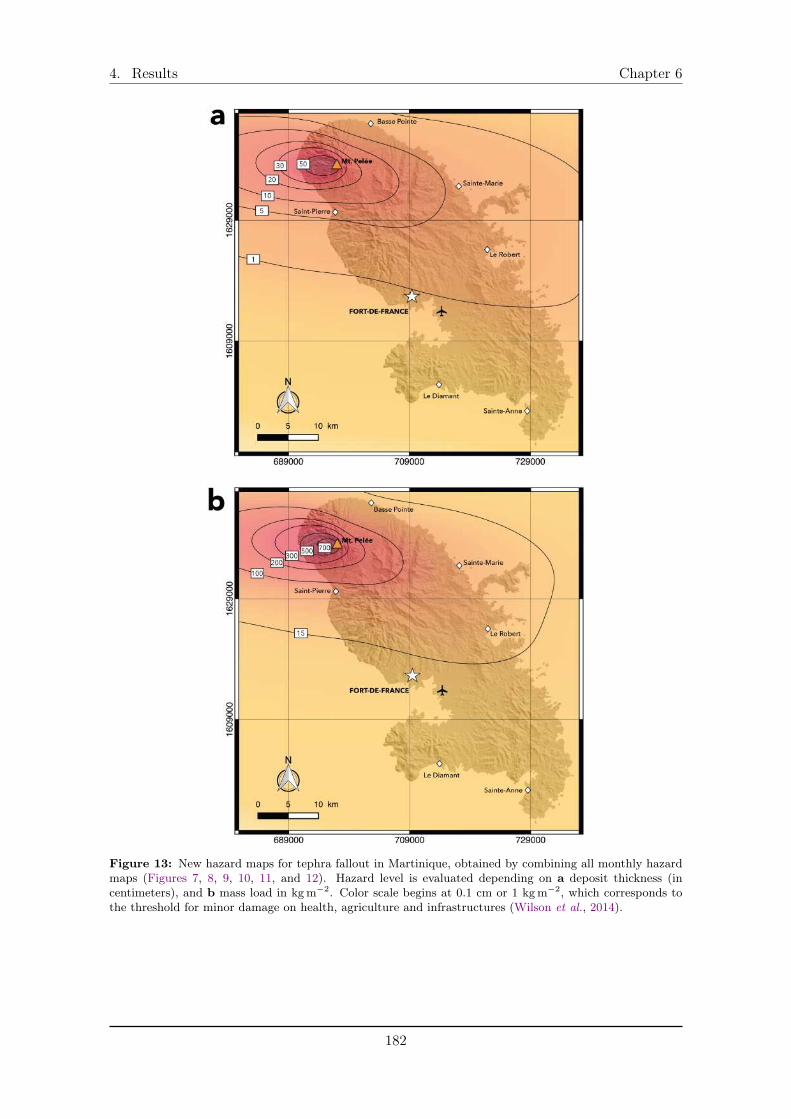
4. Results Chapter 6
Figure 13: New hazard maps for tephra fallout in Martinique, obtained by combining all monthly hazardmaps (Figures 7, 8, 9, 10, 11, and 12). Hazard level is evaluated depending on a deposit thickness (incentimeters), and b mass load in kgm�2. Color scale begins at 0.1 cm or 1 kgm�2, which corresponds tothe threshold for minor damage on health, agriculture and infrastructures (Wilson et al., 2014).
182
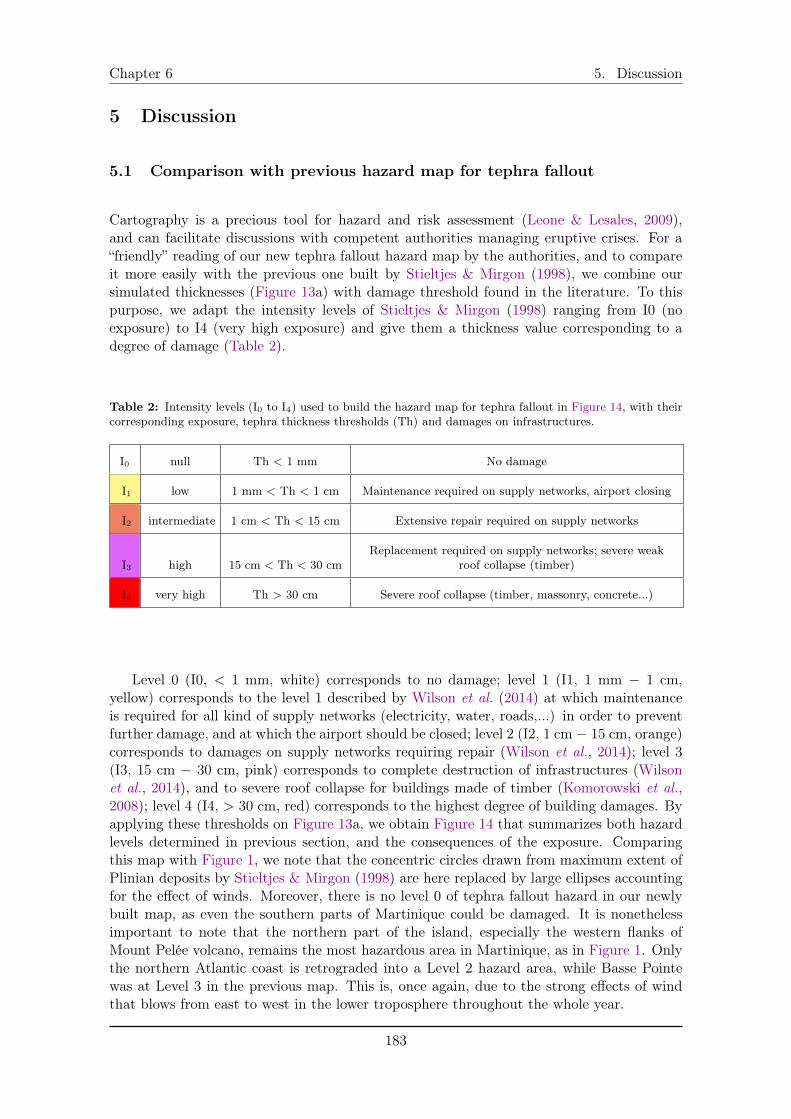
Chapter 6 5. Discussion
5 Discussion
5.1 Comparison with previous hazard map for tephra fallout
Cartography is a precious tool for hazard and risk assessment (Leone & Lesales, 2009),and can facilitate discussions with competent authorities managing eruptive crises. For a“friendly” reading of our new tephra fallout hazard map by the authorities, and to compareit more easily with the previous one built by Stieltjes & Mirgon (1998), we combine oursimulated thicknesses (Figure 13a) with damage threshold found in the literature. To thispurpose, we adapt the intensity levels of Stieltjes & Mirgon (1998) ranging from I0 (noexposure) to I4 (very high exposure) and give them a thickness value corresponding to adegree of damage (Table 2).
Table 2: Intensity levels (I0 to I4) used to build the hazard map for tephra fallout in Figure 14, with theircorresponding exposure, tephra thickness thresholds (Th) and damages on infrastructures.
I0 null Th < 1 mm No damage
I1 low 1 mm < Th < 1 cm Maintenance required on supply networks, airport closing
I2 intermediate 1 cm < Th < 15 cm Extensive repair required on supply networks
I3 high 15 cm < Th < 30 cmReplacement required on supply networks; severe weak
roof collapse (timber)
I4 very high Th > 30 cm Severe roof collapse (timber, massonry, concrete...)
Level 0 (I0, < 1 mm, white) corresponds to no damage; level 1 (I1, 1 mm � 1 cm,yellow) corresponds to the level 1 described by Wilson et al. (2014) at which maintenanceis required for all kind of supply networks (electricity, water, roads,...) in order to preventfurther damage, and at which the airport should be closed; level 2 (I2, 1 cm � 15 cm, orange)corresponds to damages on supply networks requiring repair (Wilson et al., 2014); level 3(I3, 15 cm � 30 cm, pink) corresponds to complete destruction of infrastructures (Wilsonet al., 2014), and to severe roof collapse for buildings made of timber (Komorowski et al.,2008); level 4 (I4, > 30 cm, red) corresponds to the highest degree of building damages. Byapplying these thresholds on Figure 13a, we obtain Figure 14 that summarizes both hazardlevels determined in previous section, and the consequences of the exposure. Comparingthis map with Figure 1, we note that the concentric circles drawn from maximum extent ofPlinian deposits by Stieltjes & Mirgon (1998) are here replaced by large ellipses accountingfor the effect of winds. Moreover, there is no level 0 of tephra fallout hazard in our newlybuilt map, as even the southern parts of Martinique could be damaged. It is nonethelessimportant to note that the northern part of the island, especially the western flanks ofMount Pelée volcano, remains the most hazardous area in Martinique, as in Figure 1. Onlythe northern Atlantic coast is retrograded into a Level 2 hazard area, while Basse Pointewas at Level 3 in the previous map. This is, once again, due to the strong effects of windthat blows from east to west in the lower troposphere throughout the whole year.
183
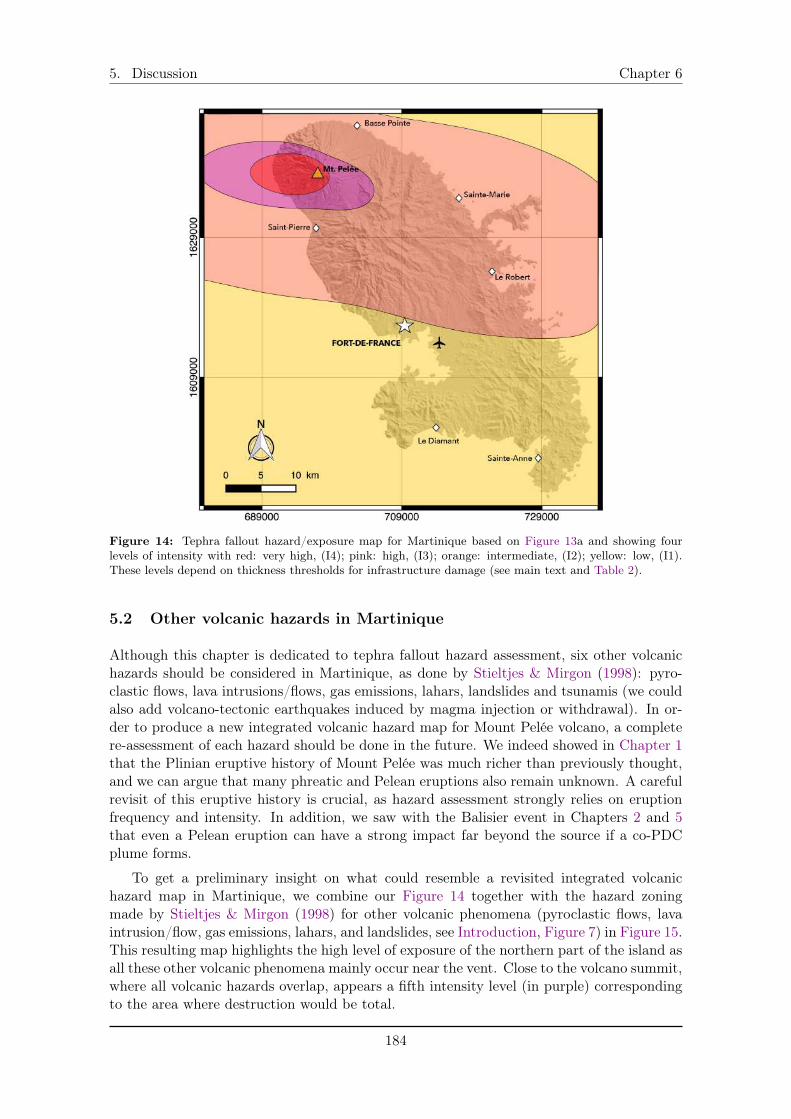
5. Discussion Chapter 6
Figure 14: Tephra fallout hazard/exposure map for Martinique based on Figure 13a and showing fourlevels of intensity with red: very high, (I4); pink: high, (I3); orange: intermediate, (I2); yellow: low, (I1).These levels depend on thickness thresholds for infrastructure damage (see main text and Table 2).
5.2 Other volcanic hazards in Martinique
Although this chapter is dedicated to tephra fallout hazard assessment, six other volcanichazards should be considered in Martinique, as done by Stieltjes & Mirgon (1998): pyro-clastic flows, lava intrusions/flows, gas emissions, lahars, landslides and tsunamis (we couldalso add volcano-tectonic earthquakes induced by magma injection or withdrawal). In or-der to produce a new integrated volcanic hazard map for Mount Pelée volcano, a completere-assessment of each hazard should be done in the future. We indeed showed in Chapter 1that the Plinian eruptive history of Mount Pelée was much richer than previously thought,and we can argue that many phreatic and Pelean eruptions also remain unknown. A carefulrevisit of this eruptive history is crucial, as hazard assessment strongly relies on eruptionfrequency and intensity. In addition, we saw with the Balisier event in Chapters 2 and 5that even a Pelean eruption can have a strong impact far beyond the source if a co-PDCplume forms.
To get a preliminary insight on what could resemble a revisited integrated volcanichazard map in Martinique, we combine our Figure 14 together with the hazard zoningmade by Stieltjes & Mirgon (1998) for other volcanic phenomena (pyroclastic flows, lavaintrusion/flow, gas emissions, lahars, and landslides, see Introduction, Figure 7) in Figure 15.This resulting map highlights the high level of exposure of the northern part of the island asall these other volcanic phenomena mainly occur near the vent. Close to the volcano summit,where all volcanic hazards overlap, appears a fifth intensity level (in purple) correspondingto the area where destruction would be total.
184
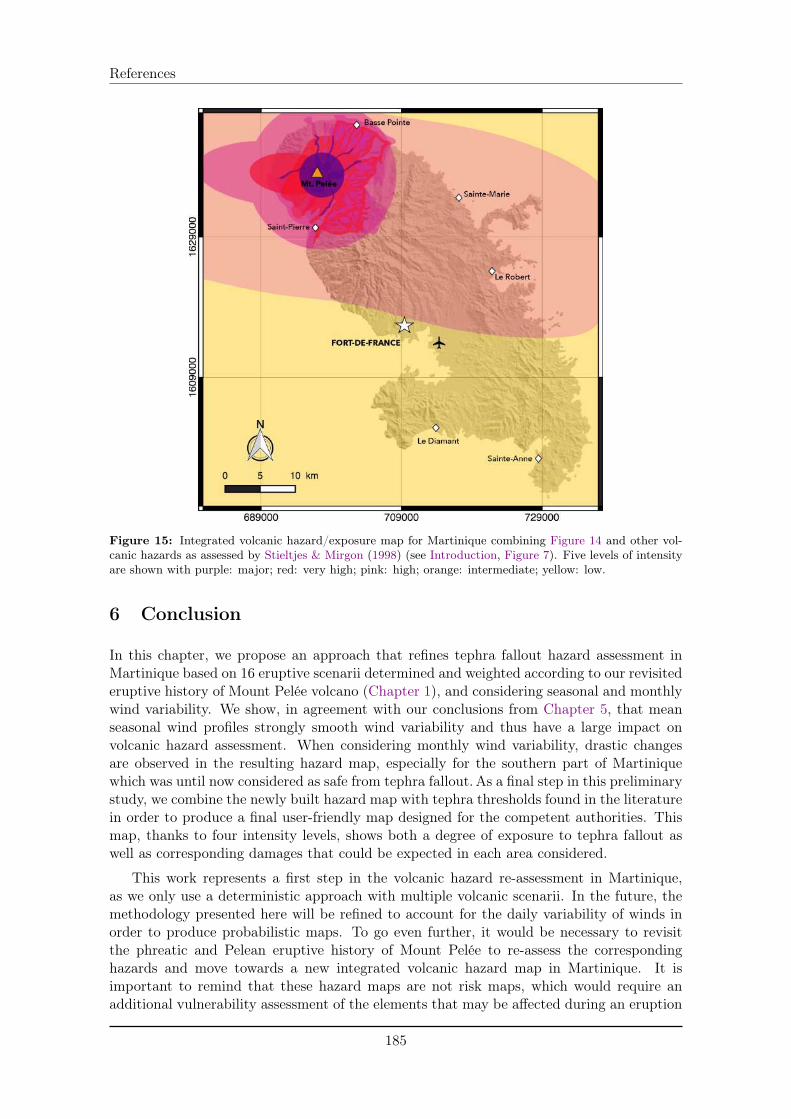
References
Figure 15: Integrated volcanic hazard/exposure map for Martinique combining Figure 14 and other vol-canic hazards as assessed by Stieltjes & Mirgon (1998) (see Introduction, Figure 7). Five levels of intensityare shown with purple: major; red: very high; pink: high; orange: intermediate; yellow: low.
6 Conclusion
In this chapter, we propose an approach that refines tephra fallout hazard assessment inMartinique based on 16 eruptive scenarii determined and weighted according to our revisitederuptive history of Mount Pelée volcano (Chapter 1), and considering seasonal and monthlywind variability. We show, in agreement with our conclusions from Chapter 5, that meanseasonal wind profiles strongly smooth wind variability and thus have a large impact onvolcanic hazard assessment. When considering monthly wind variability, drastic changesare observed in the resulting hazard map, especially for the southern part of Martiniquewhich was until now considered as safe from tephra fallout. As a final step in this preliminarystudy, we combine the newly built hazard map with tephra thresholds found in the literaturein order to produce a final user-friendly map designed for the competent authorities. Thismap, thanks to four intensity levels, shows both a degree of exposure to tephra fallout aswell as corresponding damages that could be expected in each area considered.
This work represents a first step in the volcanic hazard re-assessment in Martinique,as we only use a deterministic approach with multiple volcanic scenarii. In the future, themethodology presented here will be refined to account for the daily variability of winds inorder to produce probabilistic maps. To go even further, it would be necessary to revisitthe phreatic and Pelean eruptive history of Mount Pelée to re-assess the correspondinghazards and move towards a new integrated volcanic hazard map in Martinique. It isimportant to remind that these hazard maps are not risk maps, which would require anadditional vulnerability assessment of the elements that may be affected during an eruption
185
References
(population, buildings, networks...).
ReferencesBaker, P.E. 1985 Volcanic hazards on St Kitts and Montserrat, West Indies. J. Geol. Soc. London 142,
279–295.
Barberi, F., Ghigliotti, M., Macedonio, G., Orellana, H., Pareschi, M.T. & Rosi, M. 1992Volcanic hazard assessment of Guagua Pichincha (Ecuador) based on past behaviour and numericalmodels. J. Volcanol. Geotherm. Res. 49, 53–68.
Bonadonna, C. 2006 Probabilistic modelling of tephra dispersion. In Statistics in Volcanology (ed. H.M.Mader, S.G. Coles, C.B. Connor & L.J. Connor), pp. 243–259. Geological Society, London.
Bonadonna, C., Connor, C.B., Houghton, B.F., Connor, L., Byrne, M., Laing, A. & Hincks,T.K. 2005 Probabilistic modeling of tephra dispersal: Hazard assessment of a multiphase rhyolitic erup-tion at Tarawera, New Zealand. J. Geophys. Res. 110 (B03203).
Bonadonna, C., Mayberry, G.C., Calder, E.S., Sparks, R.S.J., Choux, C., Jackson, P., Leje-une, A.M., Loughlin, S.C., Norton, G.E., Rose, W.I., Ryan, G. & Young, S.R. 2002 Tephrafallout in the eruption of Soufriere Hills Volcano, Montserrat. In The Eruption of Soufriere Hills Vol-cano, Montserrat from 1995 to 1999 (ed. T.H. Druitt & B.P. Kokelaar), pp. 483–516. Geological Society,London, Memoirs.
Bonasia, R., Capra, L., Costa, A., Macedonio, G. & Saucedo, R. 2011 Tephra fallout hazardassessment for a Plinian eruption scenario at Volcán de Colima (Mexico). J. Volcanol. Geotherm. Res.203, 12–22.
Bonasia, R., Costa, A., Folch, A., Macedonio, G. & Capra, L. 2012 Numerical simulation oftephra transport and deposition of the 1982 El Chichón eruption and implications for hazard assessment.J. Volcanol. Geotherm. Res. 231-232, 39–49.
Carazzo, G., Kaminski, E. & Tait, S. 2008 On the rise of turbulent plumes: Quantitative effects of vari-able entrainment for submarine hydrothermal vents, terrestrial and extra terrestrial explosive volcanism.J. Geophys. Res. Solid Earth 113, 1–19.
Carazzo, G., Tait, S., Kaminski, E. & Gardner, J. E. 2012 The recent Plinian explosive activity ofMt. Pelée volcano (Lesser Antilles): The P1 AD 1300 eruption. Bull. Volcanol. 74, 2187–2203.
Cioni, R., Longo, A., Macedonio, G., Santacroce, R., Sbrana, A., Sulpizio, R. & Andronico,D. 2003 Assessing pyroclastic fall hazard through field data and numerical simulations: Example fromVesuvius. J. Geophys. Res 108 (B22063).
Costa, A., Dell’Erba, F., Vito, M. A., Isaia, R., Macedonio, G., Orsi, G. & Pfeiffer, T. 2009Tephra fallout hazard assessment at the Campi Flegrei caldera (Italy). Bull. Volcanol. 71, 259–273.
Dee, D. P., Uppala, S. M., Simmons, A. J., Berrisford, P., Poli, P., Kobayashi, S., Andrae,U., Balmaseda, M. A., Balsamo, G., Bauer, P., Bechtold, P., Beljaars, A. C.M., van deBerg, L., Bidlot, J., Bormann, N., Delsol, C., Dragani, R., Fuentes, M., Geer, A. J.,Haimberger, L., Healy, S. B., Hersbach, H., Hólm, E. V., Isaksen, L., Kållberg, P., Köhler,M., Matricardi, M., Mcnally, A. P., Monge-Sanz, B. M., Morcrette, J. J., Park, B. K.,Peubey, C., de Rosnay, P., Tavolato, C., Thépaut, J. N. & Vitart, F. 2011 The ERA-Interimreanalysis: Configuration and performance of the data assimilation system. Q. J. R. Meteorol. Soc. 137,553–597.
Hersbach, H., Bell, B., Berrisford, P., Horányi, A., Muñoz Sabater, J., Nicolas, J., Radu,R., Schepers, D., Simmons, A., Soci, C. & Dee, D. 2019 Global reanalysis: goodbye ERA-Interim,hello ERA5. ECMWF Newslett. 159, 17–24.
Horwell, C. J. & Baxter, P. J. 2006 The respiratory health hazards of volcanic ash: A review forvolcanic risk mitigation. Bull. Volcanol. 69 (1), 1–24.
Houghton, B. F., Latter, J.H. & Hackett, W.R. 1987 Volcanic hazard assessment for Ruapehucomposite volcano, Taupo Volcanic Zone, New Zealand. Bull. Volcanol. 49, 737–751.
186
References
Kaminski, E. & Jaupart, C. 1998 The size distribution of pyroclasts and the fragmentation sequence inexplosive volcanic eruptions. J. Geophys. Res. 103, 29759–29779.
Komorowski, J. C., Legendre, Y., Caron, B. & Boudon, G. 2008 Reconstruction and analysis of sub-plinian tephra dispersal during the 1530 A.D. Soufriere (Guadeloupe) eruption: Implications for scenariodefinition and hazards assessment. J. Volcanol. Geotherm. Res. 178, 491–515.
Leone, F. & Lesales, T. 2009 The interest of cartography for a better perception and management ofvolcanic risk: From scientific to social representations, the case of Mt. Pelée volcano, Martinique (LesserAntilles). J. Volcanol. Geotherm. Res. 186, 186–194.
Macedonio, G., Costa, A. & Folch, A. 2008 Ash fallout scenarios at Vesuvius: Numerical simulationsand implications for hazard assessment. J. Volcanol. Geotherm. Res. 178 (3), 366–377.
Macedonio, G., Costa, A. & Longo, A. 2005 A computer model for volcanic ash fallout and assessmentof subsequent hazard. Comput. Geosci. 31, 837–845.
Macías, J., Capra, L., Arce, J., Espíndola, J., García-Palomo, A. & Sheridan, M. 2008 Hazardmap of El Chichón volcano, Chiapas, Mexico: Constraints posed by eruptive history and computersimulations. J. Volcanol. Geotherm. Res. 175, 444–458.
Michaud-Dubuy, A., Carazzo, G., Tait, S., Le Hir, G., Fluteau, F. & Kaminski, E. 2019 Impactof wind direction variability on hazard assessment in Martinique (Lesser Antilles): The example of the13.5 ka cal BP Bellefontaine Plinian eruption of Mount Pelée volcano. J. Volcanol. Geotherm. Res. 381,193–208.
Newhall, C. G. & Hoblitt, R.P. 2002 Constructing event trees for volcanic crises. Bull. Volcanol. 64,3–20.
Orsi, G., Di Vito, M.A. & Isaia, R. 2004 Volcanic hazard assessment at the restless Campi Flegreicaldera. Bull. Volcanol. 66, 514–530.
Stieltjes, L. & Mirgon, C. 1998 Approche méthodologique de la vulnérabilité aux phénomènes vol-caniques : Test d’application sur les réseaux de la Martinique. In Unpublished Internal Report No. R40098 .Bureau de Recherches Géologiques et Minières, Marseille.
Westercamp, D. & Traineau, H. 1983 The past 5,000 years of volcanic activity at Mt. Pelée Martinique(F.W.I.): Implications for assessment of volcanic hazards. J. Volcanol. Geotherm. Res. 17, 159–185.
Wilson, G., Wilson, T. W., Deligne, N. I. & Cole, J. W. 2014 Volcanic hazard impacts to criticalinfrastructure: A review. J. Volcanol. Geotherm. Res. 286, 148–182.
187


Conclusion générale et perspectives
Conclusion générale
Une nouvelle histoire éruptive pour la montagne Pelée
Les résultats de la première partie de ce manuscrit, entièrement consacrée aux deuxétudes de terrain effectuées en Martinique durant cette thèse, ont permis d’aboutir à unenouvelle chronologie des éruptions de la montagne Pelée sur les vingt-quatre derniers mil-liers d’années. En effet, nos travaux de reconnaissance et de corrélation de dépôts éruptifspliniens, nos mesures et prélèvements de dépôts sur le terrain, ainsi que leurs datations ontpermis l’identification de six nouvelles éruptions dont les âges sont calibrés de -12 000 à -24000 ans (cal AP). Parmi ces éruptions, les dépôts des éruptions pliniennes que nous avonsnommées P10 (11 334 cal AP) et Bellefontaine (13 516 cal AP) ainsi que ceux des érup-tions péléennes nommées NMC (13 132 cal AP) et Balisier (14 072 cal AP) avaient déjà étépartiellement identifiés par les précédents auteurs ayant travaillé dans cette région (Roobol& Smith, 1976; Westercamp & Traineau, 1983; Traineau, 1982; Boudon et al., 2005), maisaucune étude poussée ne leur avait été consacrées. Les éruptions pliniennes que nous avonsnommées Carbet (18 711 cal AP) et Etoile (21 450 cal AP) étaient par contre totalementinconnues jusqu’à ce jour.
L’histoire éruptive reconstruite à partir de ces nouvelles données permet de conclure quela montagne Pelée a produit un minimum de 34 éruptions magmatiques (dont 21 éruptionspéléennes et 13 éruptions pliniennes) dans les derniers 24 000 ans, et qu’une éruption pli-nienne se produit environ tous les 1 800 ans à la Martinique. Il semble important derappeler que ce ne sont que des estimations minimales car d’anciennes éruptions péléennesou pliniennes de plus petite ampleur peuvent encore nous être inconnues. De plus, cettehistoire éruptive ne prend pas en compte les très nombreuses éruptions phréatiques s’étantproduites dans le passé, comme en 1792 et 1851. Ces incertitudes mettent en lumièrel’importance primordiale d’étudier plus précisément dans le futur ces éruptions péléennes etphréatiques, de plus petite ampleur mais représentant également un grand risque pour lespopulations environnantes de par leur fréquence plus élévée (Boudon et al., 2005).
Nous avons ici comparé notre nouvelle histoire éruptive avec des données de tephro-chronologie issues d’un forage en mer au nord de la Martinique (Boudon et al., 2013),et avons pu constater que trois des quatre éruptions pliniennes identifiées sur le terrain(Bellefontaine, Carbet et Etoile) correspondent à des événements datés dans la carottede forage. L’acquisition d’autres données de forage, à plusieurs endroits autour de la côtenord de l’île, pourraient confirmer ou infirmer notre chronologie éruptive, voire permettrel’identification de nouveaux événements volcaniques dont les dépôts auraient été érodés àterre mais préservés en mer.
Scenarii éruptifs à la montagne Pelée
Par rapport aux carottes en mer potentiellement plus complètes, le grand avantage desétudes à terre est de pouvoir interpréter les dépôts volcaniques en termes de paramètreséruptifs, c’est-à-dire de quantifier le volume, la hauteur maximale de colonne, le flux demasse, la durée, etc., de chaque éruption. Grâce à des modèles physiques de colonnes vol-caniques, nous avons pu reconstruire les paramètres éruptifs de quatre des six éruptionsnouvelles/revisitées (Bellefontaine, Balisier, Carbet et Etoile) et les comparer à ceux quan-tifiés par Carazzo et al. (2012, 2019, 2020) pour les éruptions pliniennes plus récentes dela montagne Pelée, P1 (650 AP), P2 (1 670 AP) et P3 (2 010 AP). Il est ressorti de cettecomparaison que la montagne Pelée semble produire des éruptions pliniennes très semblablesles unes par rapport aux autres depuis 24 000 ans, puisqu’elles sont toutes caractérisées parun flux de masse compris entre 10
7 et 108 kg s
�1, et un volume entre 0.04 et 1 km
3 DRE (cequi correspond à des VEI 4�5). Leurs hauteurs maximales de colonnes (entre 19 et 30 km),ainsi que leurs durées (de 1 à 11h) sont également comparables, ainsi que leurs distributions
190
Conclusion générale
totales de tailles de grains avec un exposant D compris entre 3.0 et 3.5 suggérant une bonneefficacité de fragmentation du magma avant éruption (voir la note en bas de page 193 pourla signification de D). Ces fortes similitudes ont permis de distinguer des scenarii potentielsde futures éruptions pliniennes à la montagne Pelée dont le plus probable est une éruptionproduisant une colonne d’environ 20 km de haut, caractérisée par un flux de masse entre10
7 et 10
8kg s
�1 et des dépôts assez finement fragmentés (D > 3.3).
Deux éruptions se distinguent malgré tout de ce schéma : l’éruption plinienne P3 etl’éruption péléenne Balisier. La première semble être l’éruption plinienne la plus puissanteenregistrée dans la dernière étape d’activité de la montagne Pelée puisqu’elle est caractériséepar un volume supérieur à 1 km
3 (ce qui en fait une des seules éruptions pliniennes VEI 5connues dans les Petites Antilles), un flux de masse supérieur à 10
8kg s
�1 et une hauteur decolonne atteignant 30 km. L’éruption péléenne Balisier est tout aussi remarquable. La couléede densité pyroclastique résultant de la destruction d’un dôme de lave a été stoppée par labarrière topographique créée par un effondrement de flanc antérieur (à l’est de Saint-Pierredans les hauteurs). Cette interaction entre relief et coulée de densité pyroclastique a généréun panache secondaire (“co-PDC plume”) qui aurait atteint 13 km de hauteur et répandu descendres très fines (D = 4.6) de Saint-Pierre à Bellefontaine, zone en général hors d’atteintedes éruptions péléennes historiques. Les analyses de tailles de grains et la comparaison avecd’autres éruptions ayant produit des panaches secondaires (i.e., éruptions du Tungurahua en2006, Engwell & Eychenne 2016; de Soufriere Hills à Montserrat en 1997, Bonadonna et al.
2002; du Mount Redoubt en 1990, Woods & Kienle 1994) nous ont permis d’étayer notrehypothèse d’un panache secondaire pour expliquer ces dépôts, mais d’autres études pluspoussées restent à faire pour totalement éclaircir les mécanismes de formation de ce dépôt.Des analyses de cendres par microscopie électronique à balayage en électrons rétrodiffusés,par exemple, pourraient permettre d’identifier des fragments lithiques provenant de la couléede densité pyroclastique originelle et donc de renforcer l’hypothèse d’un panache secondaire.
Aperçu des processus magmatiques mis en oeuvre
La teneur en gaz dans le magma et le flux de masse maximum durant une éruption sontles paramètres clés de la stabilité d’une colonne volcanique (Wilson et al., 1978; Woods,1988; Sparks et al., 1997). Les teneurs en gaz permettent ainsi très souvent de comprendrel’évolution de la dynamique d’une éruption plinienne, car de cette teneur en gaz dépendnotamment la vitesse d’éjection des produits volcaniques à l’évent. Pour un flux de massedonné, la colonne volcanique sera d’autant plus stable que la teneur en gaz, et donc lavitesse, seront élévées. Pour une teneur en gaz donnée, une augmentation du flux de massefavorisera l’effondrement de colonne et la production de coulées de densité pyroclastiques.Aucune estimation de teneur de gaz dissous dans le magma n’a été réalisée durant cette thèse,nous n’avons donc aucune indication sur les vieilles éruptions étudiées ici. Cependant, lesestimations de vitesses à l’évent faites pour les éruptions anciennes (Bellefontaine, Carbet etEtoile) combinées aux estimations de teneur en gaz exsolvé faites sur les éruptions pliniennesrécentes (P1, 1.6�2.1 wt%; P2, 1.7�2.1 wt% et P3, 2�2.9 wt%; Carazzo et al. 2012, 2019,2020) nous indiquent que les éruptions Bellefontaine et Carbet pourraient avoir des teneursélévées de gaz similaires à celle de P3, tandis que Etoile aurait plutôt une teneur en gazproche de celles de P1 et P2. Toutes ces valeurs restant globalement proches les unes desautres, et considérant la régularité des éruptions pliniennes de la montagne Pelée (volumessimilaires, fréquence régulière...), la chambre magmatique alimentant les éruptions de lamontagne Pelée semble avoir des caractéristiques stables dans le temps.
Cette hypothèse a déjà été formulée par des résultats expérimentaux d’équilibre dephase dans les produits récents du volcan issus des éruptions péléennes de 1902 et 1929, et
191
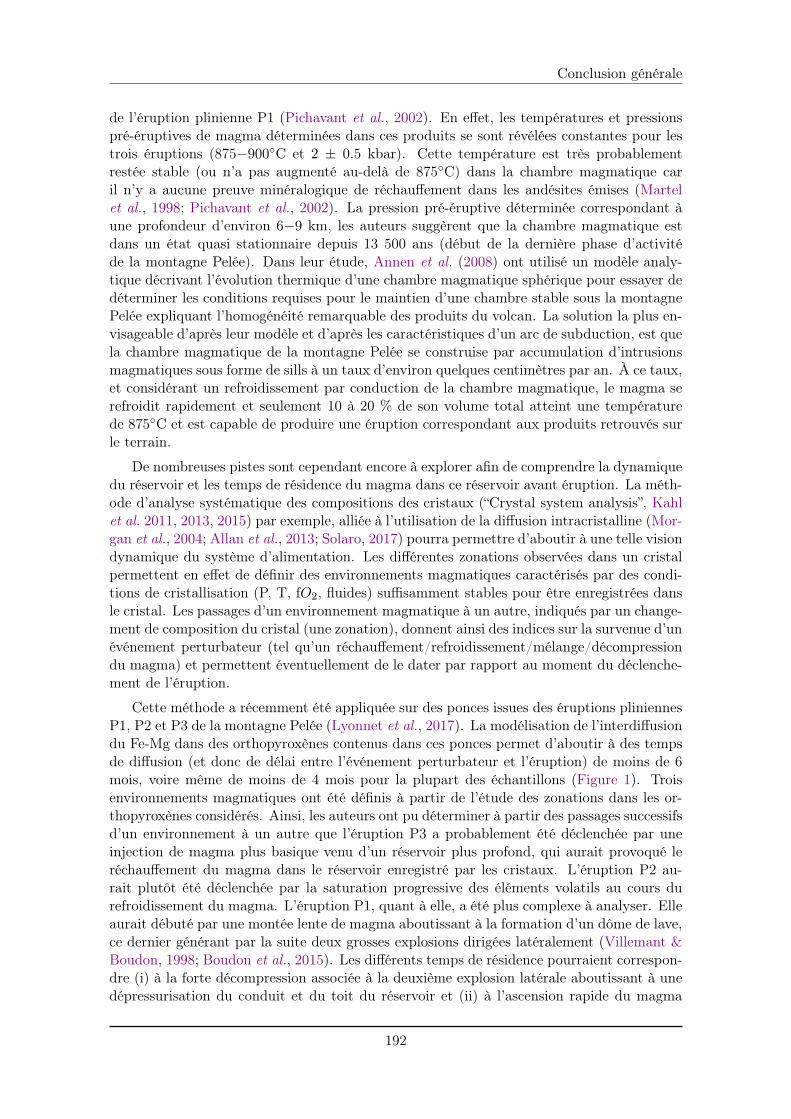
Conclusion générale
de l’éruption plinienne P1 (Pichavant et al., 2002). En effet, les températures et pressionspré-éruptives de magma déterminées dans ces produits se sont révélées constantes pour lestrois éruptions (875�900�C et 2 ± 0.5 kbar). Cette température est très probablementrestée stable (ou n’a pas augmenté au-delà de 875�C) dans la chambre magmatique caril n’y a aucune preuve minéralogique de réchauffement dans les andésites émises (Martelet al., 1998; Pichavant et al., 2002). La pression pré-éruptive déterminée correspondant àune profondeur d’environ 6�9 km, les auteurs suggèrent que la chambre magmatique estdans un état quasi stationnaire depuis 13 500 ans (début de la dernière phase d’activitéde la montagne Pelée). Dans leur étude, Annen et al. (2008) ont utilisé un modèle analy-tique décrivant l’évolution thermique d’une chambre magmatique sphérique pour essayer dedéterminer les conditions requises pour le maintien d’une chambre stable sous la montagnePelée expliquant l’homogénéité remarquable des produits du volcan. La solution la plus en-visageable d’après leur modèle et d’après les caractéristiques d’un arc de subduction, est quela chambre magmatique de la montagne Pelée se construise par accumulation d’intrusionsmagmatiques sous forme de sills à un taux d’environ quelques centimètres par an. À ce taux,et considérant un refroidissement par conduction de la chambre magmatique, le magma serefroidit rapidement et seulement 10 à 20 % de son volume total atteint une températurede 875�C et est capable de produire une éruption correspondant aux produits retrouvés surle terrain.
De nombreuses pistes sont cependant encore à explorer afin de comprendre la dynamiquedu réservoir et les temps de résidence du magma dans ce réservoir avant éruption. La méth-ode d’analyse systématique des compositions des cristaux (“Crystal system analysis”, Kahlet al. 2011, 2013, 2015) par exemple, alliée à l’utilisation de la diffusion intracristalline (Mor-gan et al., 2004; Allan et al., 2013; Solaro, 2017) pourra permettre d’aboutir à une telle visiondynamique du système d’alimentation. Les différentes zonations observées dans un cristalpermettent en effet de définir des environnements magmatiques caractérisés par des condi-tions de cristallisation (P, T, fO2, fluides) suffisamment stables pour être enregistrées dansle cristal. Les passages d’un environnement magmatique à un autre, indiqués par un change-ment de composition du cristal (une zonation), donnent ainsi des indices sur la survenue d’unévénement perturbateur (tel qu’un réchauffement/refroidissement/mélange/décompressiondu magma) et permettent éventuellement de le dater par rapport au moment du déclenche-ment de l’éruption.
Cette méthode a récemment été appliquée sur des ponces issues des éruptions pliniennesP1, P2 et P3 de la montagne Pelée (Lyonnet et al., 2017). La modélisation de l’interdiffusiondu Fe-Mg dans des orthopyroxènes contenus dans ces ponces permet d’aboutir à des tempsde diffusion (et donc de délai entre l’événement perturbateur et l’éruption) de moins de 6mois, voire même de moins de 4 mois pour la plupart des échantillons (Figure 1). Troisenvironnements magmatiques ont été définis à partir de l’étude des zonations dans les or-thopyroxènes considérés. Ainsi, les auteurs ont pu déterminer à partir des passages successifsd’un environnement à un autre que l’éruption P3 a probablement été déclenchée par uneinjection de magma plus basique venu d’un réservoir plus profond, qui aurait provoqué leréchauffement du magma dans le réservoir enregistré par les cristaux. L’éruption P2 au-rait plutôt été déclenchée par la saturation progressive des éléments volatils au cours durefroidissement du magma. L’éruption P1, quant à elle, a été plus complexe à analyser. Elleaurait débuté par une montée lente de magma aboutissant à la formation d’un dôme de lave,ce dernier générant par la suite deux grosses explosions dirigées latéralement (Villemant &Boudon, 1998; Boudon et al., 2015). Les différents temps de résidence pourraient correspon-dre (i) à la forte décompression associée à la deuxième explosion latérale aboutissant à unedépressurisation du conduit et du toit du réservoir et (ii) à l’ascension rapide du magma
192
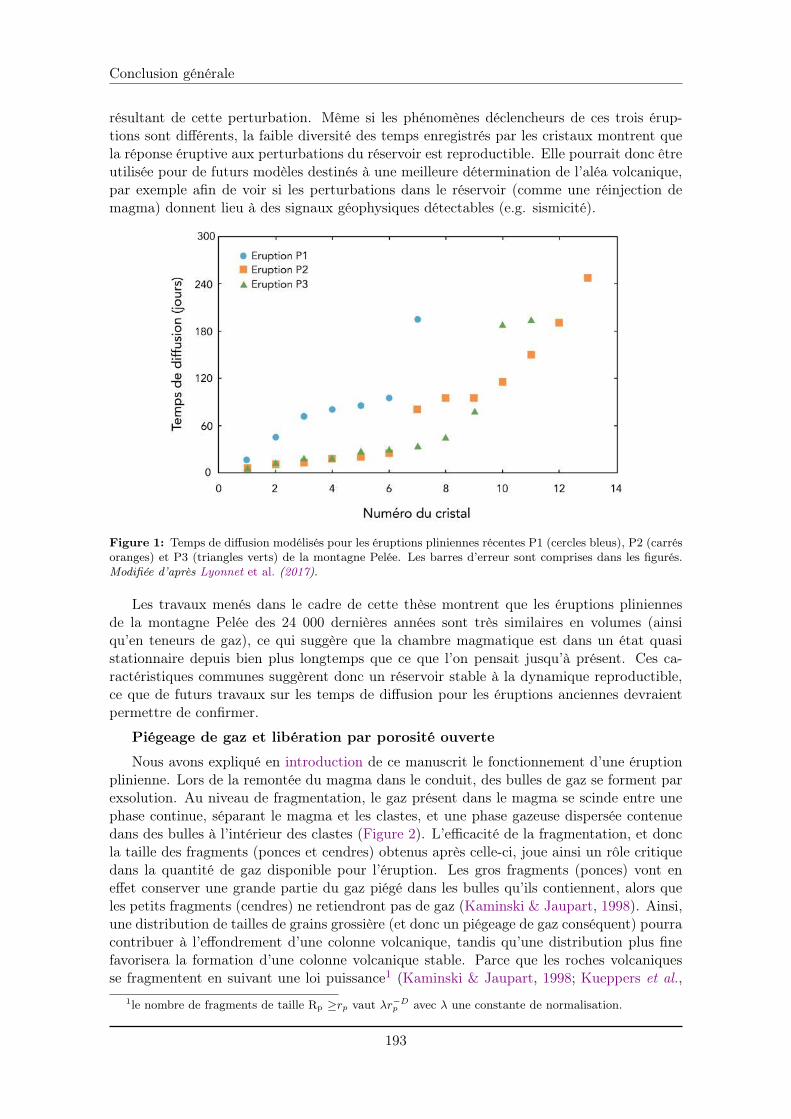
Conclusion générale
résultant de cette perturbation. Même si les phénomènes déclencheurs de ces trois érup-tions sont différents, la faible diversité des temps enregistrés par les cristaux montrent quela réponse éruptive aux perturbations du réservoir est reproductible. Elle pourrait donc êtreutilisée pour de futurs modèles destinés à une meilleure détermination de l’aléa volcanique,par exemple afin de voir si les perturbations dans le réservoir (comme une réinjection demagma) donnent lieu à des signaux géophysiques détectables (e.g. sismicité).
Figure 1: Temps de diffusion modélisés pour les éruptions pliniennes récentes P1 (cercles bleus), P2 (carrésoranges) et P3 (triangles verts) de la montagne Pelée. Les barres d’erreur sont comprises dans les figurés.Modifiée d’après Lyonnet et al. (2017).
Les travaux menés dans le cadre de cette thèse montrent que les éruptions pliniennesde la montagne Pelée des 24 000 dernières années sont très similaires en volumes (ainsiqu’en teneurs de gaz), ce qui suggère que la chambre magmatique est dans un état quasistationnaire depuis bien plus longtemps que ce que l’on pensait jusqu’à présent. Ces ca-ractéristiques communes suggèrent donc un réservoir stable à la dynamique reproductible,ce que de futurs travaux sur les temps de diffusion pour les éruptions anciennes devraientpermettre de confirmer.
Piégeage de gaz et libération par porosité ouverte
Nous avons expliqué en introduction de ce manuscrit le fonctionnement d’une éruptionplinienne. Lors de la remontée du magma dans le conduit, des bulles de gaz se forment parexsolution. Au niveau de fragmentation, le gaz présent dans le magma se scinde entre unephase continue, séparant le magma et les clastes, et une phase gazeuse dispersée contenuedans des bulles à l’intérieur des clastes (Figure 2). L’efficacité de la fragmentation, et doncla taille des fragments (ponces et cendres) obtenus après celle-ci, joue ainsi un rôle critiquedans la quantité de gaz disponible pour l’éruption. Les gros fragments (ponces) vont eneffet conserver une grande partie du gaz piégé dans les bulles qu’ils contiennent, alors queles petits fragments (cendres) ne retiendront pas de gaz (Kaminski & Jaupart, 1998). Ainsi,une distribution de tailles de grains grossière (et donc un piégeage de gaz conséquent) pourracontribuer à l’effondrement d’une colonne volcanique, tandis qu’une distribution plus finefavorisera la formation d’une colonne volcanique stable. Parce que les roches volcaniquesse fragmentent en suivant une loi puissance1 (Kaminski & Jaupart, 1998; Kueppers et al.,
1le nombre de fragments de taille Rp �rp
vaut �r�D
p
avec � une constante de normalisation.
193
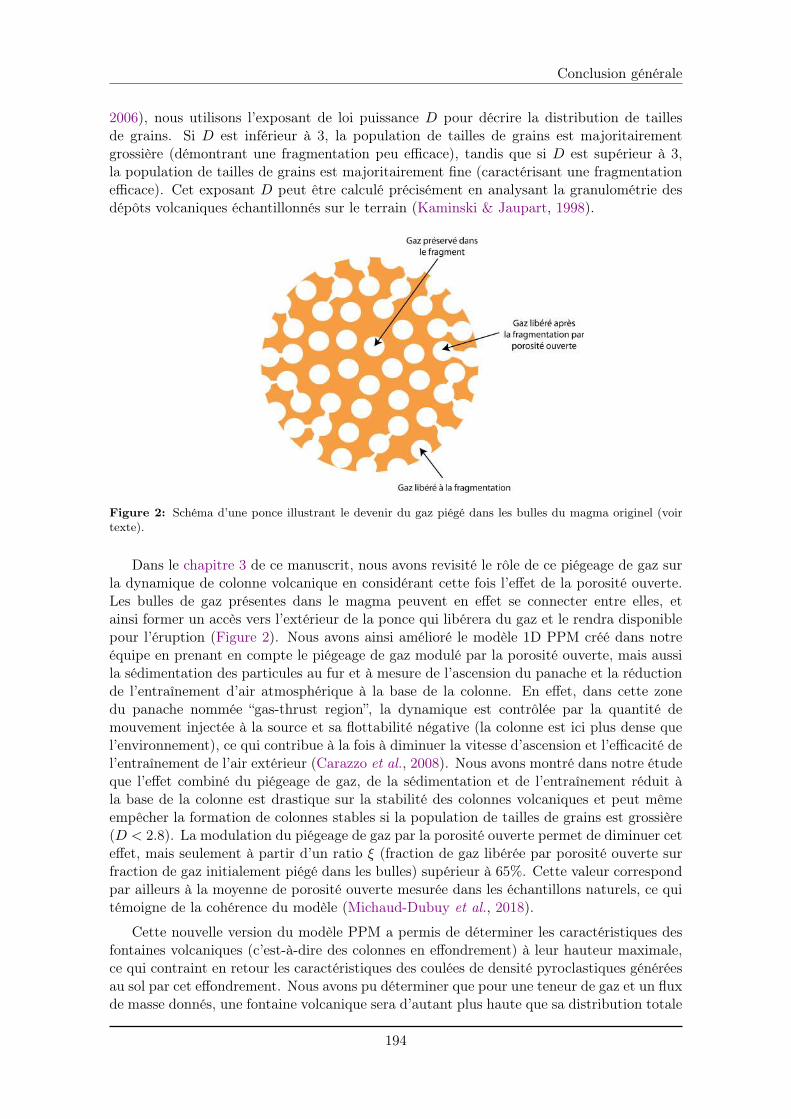
Conclusion générale
2006), nous utilisons l’exposant de loi puissance D pour décrire la distribution de taillesde grains. Si D est inférieur à 3, la population de tailles de grains est majoritairementgrossière (démontrant une fragmentation peu efficace), tandis que si D est supérieur à 3,la population de tailles de grains est majoritairement fine (caractérisant une fragmentationefficace). Cet exposant D peut être calculé précisément en analysant la granulométrie desdépôts volcaniques échantillonnés sur le terrain (Kaminski & Jaupart, 1998).
Figure 2: Schéma d’une ponce illustrant le devenir du gaz piégé dans les bulles du magma originel (voirtexte).
Dans le chapitre 3 de ce manuscrit, nous avons revisité le rôle de ce piégeage de gaz surla dynamique de colonne volcanique en considérant cette fois l’effet de la porosité ouverte.Les bulles de gaz présentes dans le magma peuvent en effet se connecter entre elles, etainsi former un accès vers l’extérieur de la ponce qui libérera du gaz et le rendra disponiblepour l’éruption (Figure 2). Nous avons ainsi amélioré le modèle 1D PPM créé dans notreéquipe en prenant en compte le piégeage de gaz modulé par la porosité ouverte, mais aussila sédimentation des particules au fur et à mesure de l’ascension du panache et la réductionde l’entraînement d’air atmosphérique à la base de la colonne. En effet, dans cette zonedu panache nommée “gas-thrust region”, la dynamique est contrôlée par la quantité demouvement injectée à la source et sa flottabilité négative (la colonne est ici plus dense quel’environnement), ce qui contribue à la fois à diminuer la vitesse d’ascension et l’efficacité del’entraînement de l’air extérieur (Carazzo et al., 2008). Nous avons montré dans notre étudeque l’effet combiné du piégeage de gaz, de la sédimentation et de l’entraînement réduit àla base de la colonne est drastique sur la stabilité des colonnes volcaniques et peut mêmeempêcher la formation de colonnes stables si la population de tailles de grains est grossière(D < 2.8). La modulation du piégeage de gaz par la porosité ouverte permet de diminuer ceteffet, mais seulement à partir d’un ratio ⇠ (fraction de gaz libérée par porosité ouverte surfraction de gaz initialement piégé dans les bulles) supérieur à 65%. Cette valeur correspondpar ailleurs à la moyenne de porosité ouverte mesurée dans les échantillons naturels, ce quitémoigne de la cohérence du modèle (Michaud-Dubuy et al., 2018).
Cette nouvelle version du modèle PPM a permis de déterminer les caractéristiques desfontaines volcaniques (c’est-à-dire des colonnes en effondrement) à leur hauteur maximale,ce qui contraint en retour les caractéristiques des coulées de densité pyroclastiques généréesau sol par cet effondrement. Nous avons pu déterminer que pour une teneur de gaz et un fluxde masse donnés, une fontaine volcanique sera d’autant plus haute que sa distribution totale
194
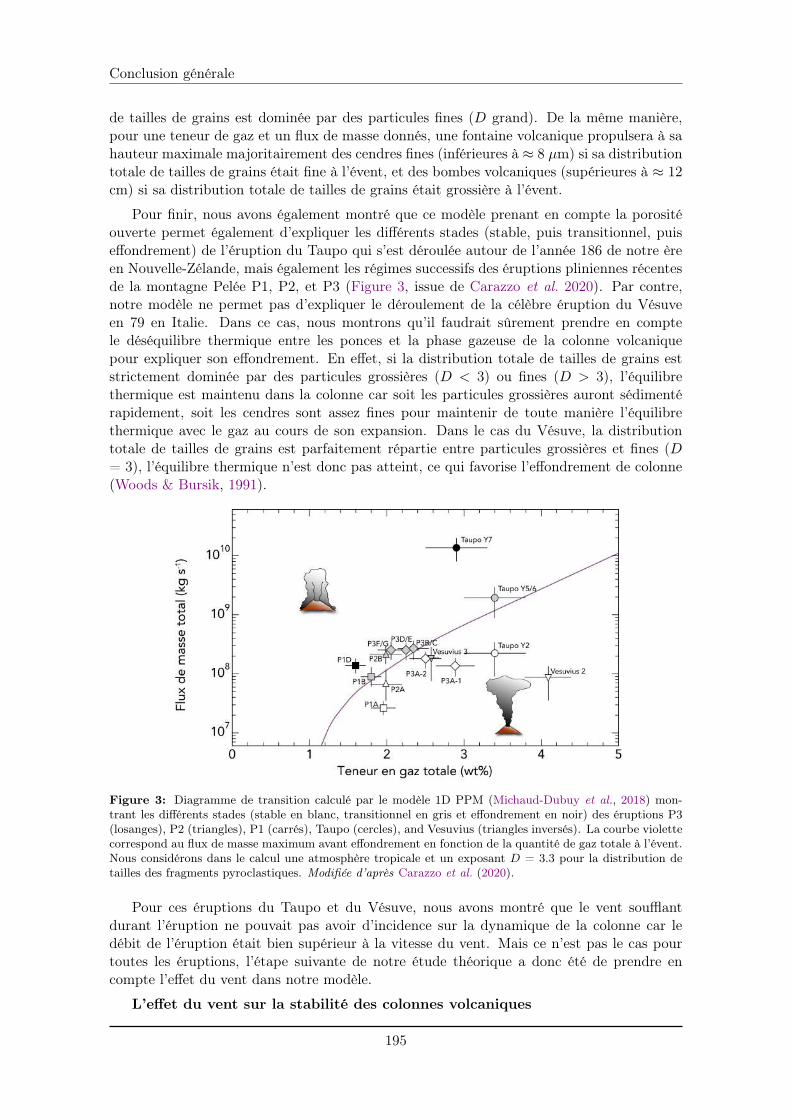
Conclusion générale
de tailles de grains est dominée par des particules fines (D grand). De la même manière,pour une teneur de gaz et un flux de masse donnés, une fontaine volcanique propulsera à sahauteur maximale majoritairement des cendres fines (inférieures à ⇡ 8 µm) si sa distributiontotale de tailles de grains était fine à l’évent, et des bombes volcaniques (supérieures à ⇡ 12cm) si sa distribution totale de tailles de grains était grossière à l’évent.
Pour finir, nous avons également montré que ce modèle prenant en compte la porositéouverte permet également d’expliquer les différents stades (stable, puis transitionnel, puiseffondrement) de l’éruption du Taupo qui s’est déroulée autour de l’année 186 de notre èreen Nouvelle-Zélande, mais également les régimes successifs des éruptions pliniennes récentesde la montagne Pelée P1, P2, et P3 (Figure 3, issue de Carazzo et al. 2020). Par contre,notre modèle ne permet pas d’expliquer le déroulement de la célèbre éruption du Vésuveen 79 en Italie. Dans ce cas, nous montrons qu’il faudrait sûrement prendre en comptele déséquilibre thermique entre les ponces et la phase gazeuse de la colonne volcaniquepour expliquer son effondrement. En effet, si la distribution totale de tailles de grains eststrictement dominée par des particules grossières (D < 3) ou fines (D > 3), l’équilibrethermique est maintenu dans la colonne car soit les particules grossières auront sédimentérapidement, soit les cendres sont assez fines pour maintenir de toute manière l’équilibrethermique avec le gaz au cours de son expansion. Dans le cas du Vésuve, la distributiontotale de tailles de grains est parfaitement répartie entre particules grossières et fines (D= 3), l’équilibre thermique n’est donc pas atteint, ce qui favorise l’effondrement de colonne(Woods & Bursik, 1991).
Figure 3: Diagramme de transition calculé par le modèle 1D PPM (Michaud-Dubuy et al., 2018) mon-trant les différents stades (stable en blanc, transitionnel en gris et effondrement en noir) des éruptions P3(losanges), P2 (triangles), P1 (carrés), Taupo (cercles), and Vesuvius (triangles inversés). La courbe violettecorrespond au flux de masse maximum avant effondrement en fonction de la quantité de gaz totale à l’évent.Nous considérons dans le calcul une atmosphère tropicale et un exposant D = 3.3 pour la distribution detailles des fragments pyroclastiques. Modifiée d’après Carazzo et al. (2020).
Pour ces éruptions du Taupo et du Vésuve, nous avons montré que le vent soufflantdurant l’éruption ne pouvait pas avoir d’incidence sur la dynamique de la colonne car ledébit de l’éruption était bien supérieur à la vitesse du vent. Mais ce n’est pas le cas pourtoutes les éruptions, l’étape suivante de notre étude théorique a donc été de prendre encompte l’effet du vent dans notre modèle.
L’effet du vent sur la stabilité des colonnes volcaniques
195
Conclusion générale
Nous avons montré au début du chapitre 4 que le modèle PPM prenant en compteles effets de la sédimentation, du piégeage de gaz modulé par la porosité ouverte, et del’entraînement réduit à la base de la colonne ne peut pas expliquer le déroulement deséruptions historiques puissantes et bien connues du Tambora (Indonésie) en 1815, du Nevadodel Ruiz (Colombie) en 1985 et du Pinatubo (Philippines) en 1991. Or, ces éruptions sesont toutes les trois produites sous un vent fort d’après les estimations tirées des études deterrain.
Le principal effet du vent sur la colonne volcanique est d’augmenter l’efficacité dumélange entre celle-ci et l’atmosphère, ce qui modifie les bilans dans les équations de conser-vation de la masse et de l’énergie dans la colonne. La vitesse d’entraînement dans un environ-nement sans vent ne dépend que d’un coefficient d’entraînement ↵ et de la vitesse d’ascensionde la colonne (Morton et al., 1956). En cas de vent, cette vitesse d’entraînement va égale-ment dépendre d’un second coefficient d’entraînement lié au vent et nommé � (Hewett et al.,1971). Ce coefficient est très mal contraint et sa valeur varie largement dans la littérature(entre 0.1 et 1). Afin de le quantifier, nous avons développé en laboratoire des expériencespermettant de simuler des colonnes volcaniques. Pour cela, nous utilisons un montage secomposant de deux réservoirs remplis d’un mélange d’éthanol et d’éthylène glycol (EEG) etde colorant, reliés à un injecteur représentant le volcan qui déverse ce mélange coloré dansune grande cuve remplie d’eau douce représentant l’atmosphère. Afin de simuler l’effet duvent, l’injecteur est déplacé le long d’un rail à une vitesse constante plus ou moins grande.Le mélange d’EEG a été choisi pour ses propriétés permettant de reproduire l’inversion deflottabilité de la colonne volcanique se produisant naturellement au cours du mélange avecle milieu ambiant. Le dimensionnement de ces expériences est réalisé de telle sorte que lesnombres sans dimension caractérisant le système expérimental reproduisent convenablementl’équilibre des forces d’une véritable éruption volcanique.
Nous avons fait varier d’une expérience à l’autre les paramètres clés de la dynamique deces jets expérimentaux : le rayon de la source, la densité du mélange EEG injecté et son débitd’injection, et la vitesse à laquelle se déplace le robinet le long du rail. À chaque expérience,nous avons observé si le jet obtenu était stable ou bien s’il s’effondrait. Ces résultats dejet à flottabilité réversible, comparés à des prédictions théoriques faites grâce à un modèlesimplifié de jet turbulent, nous ont permis de déterminer que le coefficient d’entraînement dûau vent � devait être proche de 0.5 pour expliquer nos observations. Nous avons égalementmené une autre série d’expériences simulant des jets à flottabilité négative (en injectant del’eau douce dans une cuve remplie d’eau salée plus dense). Les trajectoires des fontainesobtenues lors de ces expériences sont également reproduites numériquement si nous prenonsen compte un coefficient � = 0.5 dans le modèle. Nous aboutissons à la même conclusionpour les trajectoires de panaches stables obtenus lors des expériences de Contini & Robins(2001). Nous démontrons donc qu’une valeur fixe de � = 0.5 peut être utilisée pour touttype de jet (à flottabilité réversible, négative, ou positive) à condition de considérer uncoefficient ↵ variable comme dans Kaminski et al. (2005).
Ces résultats novateurs issus d’expériences analogiques en laboratoire nous ont doncpermis de prendre en compte l’effet du vent dans le modèle 1D PPM. En considérant unvent uniforme sur toute l’atmosphère, cette dernière version de PPM reproduit les différentsrégimes de stabilité ou d’effondrement partiel des éruptions historiques du Tambora, duNevado del Ruiz et du Pinatubo. Jusqu’ici, nous avons représenté la transition entre lesrégimes stable et d’effondrement par un flux de masse maximal avant effondrement enfonction de la teneur en gaz à l’évent (comme en Figure 3). Mais les résultats du chapitre4 nous ont amenés à proposer une nouvelle loi de transition basée sur des mesures plusfacilement quantifiables après une éruption. En effet, nous avons calculé grâce à PPM la
196
Conclusion générale
vitesse de vent w nécessaire pour empêcher une colonne volcanique de s’effondrer et tracéune courbe de transition basée sur la relation entre le flux de masse de l’éruption (MDR) et lerapport w/log(MDR). Ce rapport peut être facilement mesuré à partir de mesures de vitessedu vent et de hauteur maximale de colonne pour des éruptions contemporaines observées,ou à partir du rapport grand axe / petit axe des isoplèthes tracées à partir de la distributiondes fragments lithiques sur le terrain pour des éruptions plus anciennes. En cas de vent, lerapport w/log(MDR) maximal avant effondrement augmente avec le flux de masse. Ainsi,les isoplèthes construites à partir des données de terrain pourraient être un indice fort dela stabilité des colonnes volcaniques des éruptions passées: des isoplèthes fines et allongéessignifiraient un rapport w/log(MDR) élévé et donc probablement une colonne plutôt stable,alors que des isoplèthes plus circulaires correspondraient à un rapport w/log(MDR) plusfaible et donc une colonne plus instable.
Ainsi, le travail théorique détaillé dans la partie 2 du manuscrit a révélé que le piégeagede gaz, modulé par la porosité ouverte, ainsi que le vent ont tous les deux un impact fortsur la dynamique de l’effondrement ce qui permet d’expliquer le déroulement de plusieurséruptions historiques telles que celles du Taupo ou du Tambora. Le déséquilibre thermiqueentre le gaz et les particules au sein du panache ainsi que d’autres effets, tels que la formeet la taille du cratère du volcan (Koyaguchi et al., 2010), n’ont pas été étudiés ici et ontégalement une incidence sur la stabilité des colonnes. Des travaux futurs visant à intégrerces effets au modèle PPM permettraient d’atteindre une version de plus en plus robustecapable d’expliquer des éruptions historiques particulières telle que celle du Vésuve en 79.
La montagne Pelée et la dispersion des cendres par le vent
Le vent, en plus d’influencer la dynamique de la colonne, a également un impact sur ladispersion des produits volcaniques dans l’atmosphère (Carey & Sigurdsson, 1986) et doncsur l’aléa volcanique associé (Michaud-Dubuy et al., 2019). La partie 3 de ce manuscritest consacrée à des simulations numériques de dispersion de cendres en utilisant le modèle2D HAZMAP (Macedonio et al., 2005) et des profils de vents moyennés sur 6h ou 1h tirésrespectivement des bases de données ERA-Interim (Dee et al., 2011) et ERA-5 (Hersbachet al., 2019) afin (i) de comprendre la dispersion au sud inhabituelle des éruptions de lamontagne Pelée (re)découvertes dans cette étude (celles de Bellefontaine, Balisier, Carbetet Etoile) et (ii) de ré-évaluer l’aléa volcanique “retombées de cendres” associé aux éruptionspliniennes pour la Martinique.
Les résultats du chapitre 5 montrent que la dispersion des cendres vers le sud des érup-tions pliniennes de Bellefontaine, Carbet et Etoile est très probablement le résultat d’unecirculation atmosphérique spécifique pouvant durer entre 6h et 3 jours et identifiée plusieursfois au cours des 40 dernières années dans la base de données de vents ERA-Interim. Dansces cas-là, le parcours du jet-stream (courant d’air rapide et étroit) sub-tropical est scindéen deux branches : au lieu d’être caractérisé seulement par des vents allant de l’ouest versl’est, un deuxième courant provoque la formation de vents allant du nord vers le sud surles îles des Petites Antilles. Ces vents du nord, quand ils se produisent en même tempsqu’une éruption plinienne, peuvent alors disperser les cendres vers le sud de l’île. Nousavons calculé que la probabilité d’observer des vents venant du nord en Martinique (en sebasant sur les données des 40 dernières années) varie selon les mois entre 0% en juillet et⇡ 5% en novembre. Ces probabilités semblent faibles mais les éruptions étudiées dans cettethèse démontrent que cette situation est possible, et qu’elle pourrait menacer les zones lesplus peuplées de Martinique principalement localisées dans le sud de l’île. Une telle disper-sion de cendres vers le sud, bien que considérée inhabituelle, a été également observée lorsde l’éruption de la Soufrière de Saint-Vincent en 1979 par exemple (Poulidis et al., 2018).
197
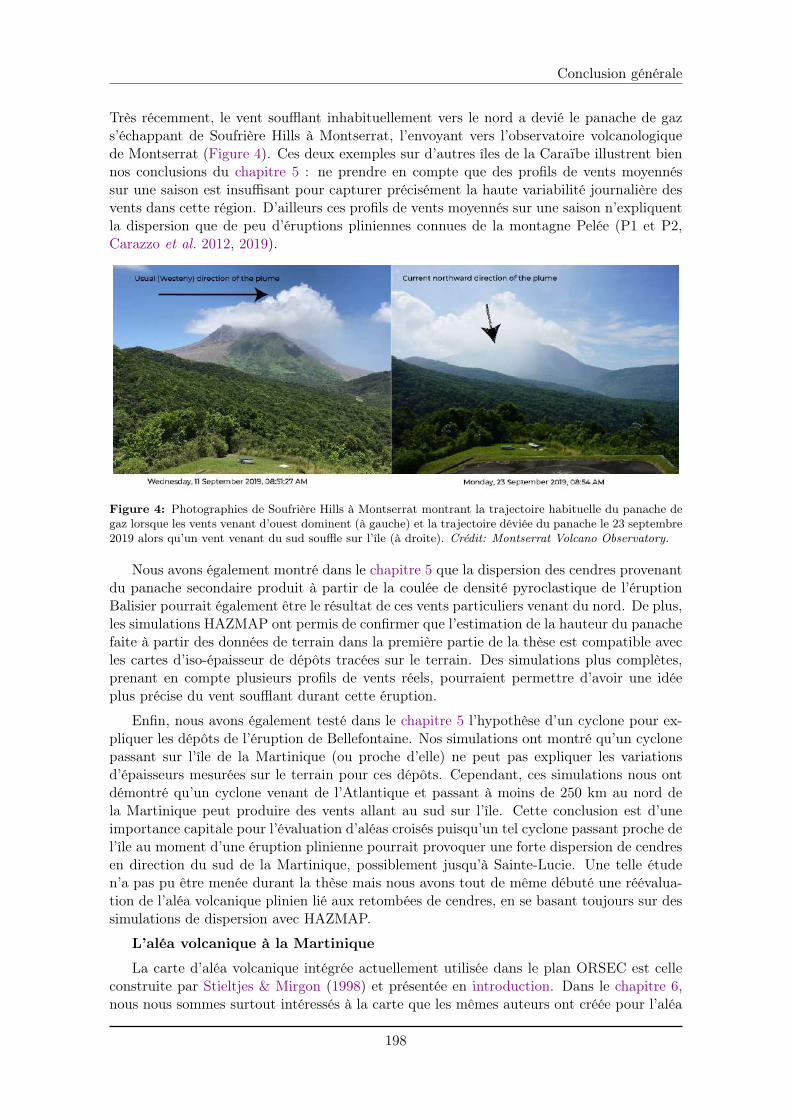
Conclusion générale
Très récemment, le vent soufflant inhabituellement vers le nord a devié le panache de gazs’échappant de Soufrière Hills à Montserrat, l’envoyant vers l’observatoire volcanologiquede Montserrat (Figure 4). Ces deux exemples sur d’autres îles de la Caraïbe illustrent biennos conclusions du chapitre 5 : ne prendre en compte que des profils de vents moyennéssur une saison est insuffisant pour capturer précisément la haute variabilité journalière desvents dans cette région. D’ailleurs ces profils de vents moyennés sur une saison n’expliquentla dispersion que de peu d’éruptions pliniennes connues de la montagne Pelée (P1 et P2,Carazzo et al. 2012, 2019).
Figure 4: Photographies de Soufrière Hills à Montserrat montrant la trajectoire habituelle du panache degaz lorsque les vents venant d’ouest dominent (à gauche) et la trajectoire déviée du panache le 23 septembre2019 alors qu’un vent venant du sud souffle sur l’île (à droite). Crédit: Montserrat Volcano Observatory.
Nous avons également montré dans le chapitre 5 que la dispersion des cendres provenantdu panache secondaire produit à partir de la coulée de densité pyroclastique de l’éruptionBalisier pourrait également être le résultat de ces vents particuliers venant du nord. De plus,les simulations HAZMAP ont permis de confirmer que l’estimation de la hauteur du panachefaite à partir des données de terrain dans la première partie de la thèse est compatible avecles cartes d’iso-épaisseur de dépôts tracées sur le terrain. Des simulations plus complètes,prenant en compte plusieurs profils de vents réels, pourraient permettre d’avoir une idéeplus précise du vent soufflant durant cette éruption.
Enfin, nous avons également testé dans le chapitre 5 l’hypothèse d’un cyclone pour ex-pliquer les dépôts de l’éruption de Bellefontaine. Nos simulations ont montré qu’un cyclonepassant sur l’île de la Martinique (ou proche d’elle) ne peut pas expliquer les variationsd’épaisseurs mesurées sur le terrain pour ces dépôts. Cependant, ces simulations nous ontdémontré qu’un cyclone venant de l’Atlantique et passant à moins de 250 km au nord dela Martinique peut produire des vents allant au sud sur l’île. Cette conclusion est d’uneimportance capitale pour l’évaluation d’aléas croisés puisqu’un tel cyclone passant proche del’île au moment d’une éruption plinienne pourrait provoquer une forte dispersion de cendresen direction du sud de la Martinique, possiblement jusqu’à Sainte-Lucie. Une telle étuden’a pas pu être menée durant la thèse mais nous avons tout de même débuté une réévalua-tion de l’aléa volcanique plinien lié aux retombées de cendres, en se basant toujours sur dessimulations de dispersion avec HAZMAP.
L’aléa volcanique à la Martinique
La carte d’aléa volcanique intégrée actuellement utilisée dans le plan ORSEC est celleconstruite par Stieltjes & Mirgon (1998) et présentée en introduction. Dans le chapitre 6,nous nous sommes surtout intéressés à la carte que les mêmes auteurs ont créée pour l’aléa
198
Conclusion générale
“retombées de cendres” (chapitre 6, Figure 1). Cette carte n’étant basée que sur les éruptionspliniennes récentes de la montagne Pelée et ne prenant pas en compte l’effet du vent, il étaitintéressant de voir quels changements seraient visibles en considérant les scénarii éruptifsexposés dans le chapitre 2 (basés sur notre nouvelle histoire éruptive) et en considérantplusieurs profils de vents issus de la base de données ERA-Interim.
Nos résultats (en accord avec ceux du chapitre 5) montrent que les profils moyennés surune saison cachent la variabilité des vents. Durant cette première étape, nous avons con-struit une carte d’aléa pour chacune des deux saisons caractéristiques aux Antilles (saisonsèche et saison humide), que nous avons combinées ensuite en une carte d’aléa volcaniqueplinien. Dans ce cas, nous avons obtenu que presque toute la Martinique était concernée parun aléa “retombées de cendres”, sauf l’extrême sud de l’île. Par la suite, nous avons considérédes profils de vents moyennés sur un mois et construit douze nouvelles cartes d’aléa que nousavons de nouveau combinées en une carte intégrée d’aléa volcanique plinien. Nous avonsconstaté que dans ce cas, contrairement à la première carte construite en utilisant les profilssaisonniers, même le sud de la Martinique est concerné par l’aléa “retombées de cendres”.Le “lissage” des vents saisonniers provoqué par la moyenne effectuée sur plusieurs mois adonc pour conséquence une sous-estimation de l’aléa volcanique, et ce principalement dansdes zones considérées comme sécurisées dans le plan ORSEC actuel et où la conscience desdangers liés au volcan est souvent moindre par rapport aux régions du nord de l’île. Finale-ment, afin de rendre cette carte intégrée issue des simulations mois par mois plus facilementutilisable par les autorités compétentes en gestion de crise, nous l’avons interprétée grâce àdes seuils de masses de cendres au-delà desquels des dégradations (de bâtiments par exem-ple) sont à prévoir, pour aboutir à une carte finale. Cette dernière montre, grâce à quatreniveaux d’intensité, le degré d’exposition à l’aléa “retombées de cendres” de chaque zone etdonc les dommages associés auxquels on peut s’attendre dans ces zones.
Le chapitre 6 consiste essentiellement en un travail préparatoire vers une nouvelle carted’aléa volcanique complète considérant plusieurs aléas (retombées de cendres, coulées dedensité pyroclastiques, etc.). Avant cela, il faudra revoir notre méthodologie pour la carted’aléa “retombées de cendres” en considérant des profils de vents journaliers et/ou en con-sidérant d’autres scénarii éruptifs (ici nous en avons utilisé 16) afin de produire des cartesprobabilistes plus aisées à interpréter. Par la suite, une réévaluation de l’histoire érup-tive péléenne et phréatique est nécessaire à la Martinique, même si les faibles volumesde ces éruptions complexifient ce type d’études. Nous pourrions par exemple utiliser desdépôts mieux conservés d’éruptions phréatiques sur d’autres îles (telles que celles des Ca-naries) afin d’en savoir plus sur la dynamique de ces éruptions, de les modéliser et donc desimuler des éruptions phréatiques à la Martinique. Ces futurs développements de la carted’aléa et de cartes de risques réactualisées seront effectués en accord et en concertation avecl’Observatoire Volcanologique et Sismologique de la Martinique, le BRGM et la Préfecturede la Martinique. Il serait d’ailleurs intéressant d’utiliser les résultats de cette thèse pourapporter dès aujourd’hui de nouveaux moyens de prédiction aux observatoires, en intégrantpar exemple un outil de simulation de dispersion de cendres dans le WebObs des observa-toires français. Ce dispositif, couplé à des données météorologiques, permettrait de simulerune éruption (en se basant sur une scénario précis) et d’obtenir une carte de dispersion entemps réel.
En conclusion, ce travail s’inscrit dans un effort collectif de mieux caractériser l’histoireéruptive des volcans actifs des îles des Petites Antilles (comme à la Guadeloupe: Boudonet al. 2008; Komorowski et al. 2008; Legendre 2012; ou à la Dominique: Boudon et al. 2017)et de mieux connaître la dynamique des éruptions puissantes des volcans de ces zones desubduction, dans le but de pouvoir évaluer le plus précisément possible l’aléa et le risque
199
Bibliographie
volcanique dans ces milieux insulaires où les populations sont déjà vulnérables face aux aléassismique et cyclonique.
BibliographieAllan, A.S.R., Morgan, D.J., Wilson, C.J.N. & Millet, M-A. 2013 From mush to eruption in
centuries: Assembly of the super-sized oruanui magma body. Contrib. Mineral. Petrol. 166, 143–164.
Annen, C., Pichavant, M., Bachmann, O. & Burgisser, A. 2008 Conditions for the growth of along-lived shallow crustal magma chamber below Mount Pelée volcano (Martinique, Lesser Antilles Arc).J. Geophys. Res. 113 (B07209).
Bonadonna, C., Mayberry, G.C., Calder, E.S., Sparks, R.S.J., Choux, C., Jackson, P., Leje-une, A.M., Loughlin, S.C., Norton, G.E., Rose, W.I., Ryan, G. & Young, S.R. 2002 Tephrafallout in the eruption of Soufriere Hills Volcano, Montserrat. In The Eruption of Soufriere Hills Vol-cano, Montserrat from 1995 to 1999 (ed. T.H. Druitt & B.P. Kokelaar), pp. 483–516. Geological Society,London, Memoirs.
Boudon, G., Balcone-Boissard, H., Solaro, C. & Martel, C. 2017 Revised chronostratigraphy ofrecurrent ignimbritic eruptions in Dominica (Lesser Antilles arc): Implications on the behavior of themagma plumbing system. J. Volcanol. Geotherm. Res. 343, 135–154.
Boudon, G., Balcone-Boissard, H., Villemant, B. & Morgan, D. 2015 What factors control super-ficial lava dome explosivity? Sci. Rep. 5 (14551).
Boudon, G., Komorowski, J.C., Villemant, B. & Semet, M.P. 2008 A new scenario for the lastmagmatic eruption of La Soufrière of Guadeloupe (Lesser Antilles) in 1530 A.D. Evidence from stratigra-phy radiocarbon dating and magmatic evolution of erupted products. J. Volcanol. Geotherm. Res. 178,474–490.
Boudon, G., Le Friant, A., Villemant, B. & Viode, J.P. 2005 Martinique. In Volcanic Hazard Atlasof the Lesser Antilles (ed. J.M. Lindsay, R.E.A. Robertson, J.B. Sheperd & S. Ali), pp. 127–146. SeismicResearch Unit, The University of the West Indies, Trinidad and Tobago, W.I.
Boudon, G., Villemant, B., Le Friant, A., Paterne, M. & Cortijo, E. 2013 Role of large flank-collapse events on magma evolution of volcanoes: Insights from the Lesser Antilles Arc. J. Volcanol.Geotherm. Res. 263, 224–237.
Carazzo, G., Kaminski, E. & Tait, S. 2008 On the dynamics of volcanic columns: A comparison of fielddata with a new model of negatively buoyant jets. J. Volcanol. Geotherm. Res. 178, 94–103.
Carazzo, G., Tait, S. & Kaminski, E. 2019 Marginally stable recent Plinian eruptions of Mt. Peléevolcano (Lesser Antilles): The P2 AD 280 eruption. Bull. Volcanol. 81, 1–17.
Carazzo, G., Tait, S., Kaminski, E. & Gardner, J. E. 2012 The recent Plinian explosive activity ofMt. Pelée volcano (Lesser Antilles): The P1 AD 1300 eruption. Bull. Volcanol. 74, 2187–2203.
Carazzo, G., Tait, S., Michaud-Dubuy, A., Fries, A. & Kaminski, E. 2020 Transition from stablecolumn to partial collapse during the 79 cal CE P3 Plinian eruption of Mt Pelée volcano (Lesser Antilles).J. Volcanol. Geotherm. Res. In press. https://doi.org/10.1016/j.jvolgeores.2019.106764.
Carey, Steven & Sigurdsson, Haraldur 1986 The 1982 eruptions of El Chichon volcano, Mexico (2):Observations and numerical modelling of tephra-fall distribution. Bull. Volcanol. 48, 127–141.
Contini, D. & Robins, A. 2001 Water tank measurements of buoyant plume rise and structure in neutralcrossflows. Atmospheric Environment 35, 6105–6115.
Dee, D. P., Uppala, S. M., Simmons, A. J., Berrisford, P., Poli, P., Kobayashi, S., Andrae,U., Balmaseda, M. A., Balsamo, G., Bauer, P., Bechtold, P., Beljaars, A. C.M., van deBerg, L., Bidlot, J., Bormann, N., Delsol, C., Dragani, R., Fuentes, M., Geer, A. J.,Haimberger, L., Healy, S. B., Hersbach, H., Hólm, E. V., Isaksen, L., Kållberg, P., Köhler,M., Matricardi, M., Mcnally, A. P., Monge-Sanz, B. M., Morcrette, J. J., Park, B. K.,Peubey, C., de Rosnay, P., Tavolato, C., Thépaut, J. N. & Vitart, F. 2011 The ERA-Interimreanalysis: Configuration and performance of the data assimilation system. Q. J. R. Meteorol. Soc. 137,553–597.
200
Bibliographie
Engwell, S. & Eychenne, J. 2016 Contribution of Fine Ash to the Atmosphere From Plumes AssociatedWith Pyroclastic Density Currents. In Volcanic Ash: Hazard Observation. Elsevier.
Hersbach, H., Bell, B., Berrisford, P., Horányi, A., Muñoz Sabater, J., Nicolas, J., Radu,R., Schepers, D., Simmons, A., Soci, C. & Dee, D. 2019 Global reanalysis: goodbye ERA-Interim,hello ERA5. ECMWF Newslett. 159, 17–24.
Hewett, T.A., Fay, J.A. & Hoult, D.P. 1971 Laboratory experiments of smokestack plumes in a stableatmosphere. Atmos. Environ. 5, 459–461.
Kahl, M., Chakraborty, S., Costa, F. & Pompilio, M. 2011 Dynamic plumbing system beneathvolcanoes revealed by kinetic modeling, and the connection to monitoring data: An example from Mt.Etna. Earth Planet. Sci. Lett. 308, 11–22.
Kahl, M., Chakraborty, S., Costa, F., Pompilio, M., Liuzzo, M. & Viccaro, M. 2013 Composi-tionally zoned crystals and real-time degassing data reveal changes in magma transfer dynamics duringthe 2006 summit eruptive episodes of Mt. Etna. Bull. Volc. 692, 1—14.
Kahl, M., Chakraborty, S., Pompilio, M. & Costa, F. 2015 Constraints on the Nature and Evolutionof the Magma Plumbing System of Mt. Etna Volcano (1991-2008) from a Combined Thermodynamic andKinetic Modeling of the Compositional Record of Minerals. J. Petrol. 56 (10), 2025–2068.
Kaminski, E. & Jaupart, C. 1998 The size distribution of pyroclasts and the fragmentation sequence inexplosive volcanic eruptions. J. Geophys. Res. 103, 29759–29779.
Kaminski, E., Tait, S. & Carazzo, G. 2005 Turbulent entrainment in jets with arbitrary buoyancy. J.Fluid Mech. 526, 361–376.
Komorowski, J. C., Legendre, Y., Caron, B. & Boudon, G. 2008 Reconstruction and analysis of sub-plinian tephra dispersal during the 1530 A.D. Soufriere (Guadeloupe) eruption: Implications for scenariodefinition and hazards assessment. J. Volcanol. Geotherm. Res. 178, 491–515.
Koyaguchi, T., Suzuki, Y. J. & Kozono, T. 2010 Effects of the crater on eruption column dynamics.J. Geophys. Res. 115 (7), 1–26.
Kueppers, U., Perugini, D. & Dingwell, D. B. 2006 "Explosive energy" during volcanic eruptionsfrom fractal analysis of pyroclasts. Earth Planet. Sci. Lett. 248 (3-4), 800–807.
Legendre, Y. 2012 Reconstruction fine de l’histoire éruptive et scenarii éruptifs à la Soufrière de Guade-loupe : vers un modèle intégré de fonctionnement du volcan. PhD thesis, Université de Paris 7.
Lyonnet, E., Boudon, G. & Balcone-Boissard, H. 2017 Dynamique des réservoirs magmatiques àl’origine des dernières éruptions pliniennes de la Montagne Pelée, Martinique. Master’s thesis, Institut dePhysique du Globe de Paris.
Macedonio, G., Costa, A. & Longo, A. 2005 A computer model for volcanic ash fallout and assessmentof subsequent hazard. Comput. Geosci. 31, 837–845.
Martel, C., Pichavant, M., Bourdier, J.L., Traineau, H., Holtz, F. & Scaillet, B. 1998 Magmastorage conditions and control of eruption regime in silicic volcanoes: Experimental evidence from Mt.Pelée. Earth Planet. Sci. Lett. 156 (1-2), 89–99.
Michaud-Dubuy, A., Carazzo, G., Kaminski, E. & Girault, F. 2018 A revisit of the role of gasentrapment on the stability conditions of explosive volcanic columns. J. Volcanol. Geotherm. Res. 357,349–361.
Michaud-Dubuy, A., Carazzo, G., Tait, S., Le Hir, G., Fluteau, F. & Kaminski, E. 2019 Impactof wind direction variability on hazard assessment in Martinique (Lesser Antilles): The example of the13.5 ka cal BP Bellefontaine Plinian eruption of Mount Pelée volcano. J. Volcanol. Geotherm. Res. 381,193–208.
Morgan, D.J., Blake, S., Rogers, N.W., De Vivo, B., Rolandi, G., Macdonald, R. &Hawkesworth, C.J. 2004 Time scales of crystal residence and magma chamber volume from modellingof diffusion profiles in phenocrysts: Vesuvius 1944. Earth Planet. Sci. Lett. 222, 933–946.
201
Bibliographie
Morton, B.R., Taylor, G.I. & Turner, J.S. 1956 Turbulent gravitational convection from maintainedand instantaneous sources. Philos. Trans. R. Soc. A 234, 1–23.
Pichavant, M., Martel, C., Bourdier, J. & Scaillet, B. 2002 Physical conditions, structure, anddynamics of a zoned magma chamber: Mount Pelée (Martinique, Lesser Antilles arc). J. Geophys. Res.107 (B52093).
Poulidis, A.P., Phillips, J.C., Renfrew, I.A., Barclay, J., Hogg, A., Jenkins, S.F., Robertson,R. & Pyle, D.M. 2018 Meteorological controls on local and regional volcanic ash dispersal. Scientif.Rep. 8 (6873).
Roobol, M.J. & Smith, A.L. 1976 Mount Pelée, Martinique: A pattern of alternating eruptive styles.Geology 4, 521–524.
Solaro, C. 2017 Storage conditions and dynamics of magma reservoirs feeding the major pumiceous erup-tions of Dominica (Lesser Antilles arc). PhD thesis, Université Paris Diderot.
Sparks, R. S. J., Bursik, M., Carey, S., Gilbert, J. S., Glaze, L. S., Sigurdsson, H. & Woods,A. W. 1997 Volcanic Plumes. John Wiley, New York.
Stieltjes, L. & Mirgon, C. 1998 Approche méthodologique de la vulnérabilité aux phénomènes vol-caniques : Test d’application sur les réseaux de la Martinique. In Unpublished Internal Report No. R40098 .Bureau de Recherches Géologiques et Minières, Marseille.
Traineau, H. 1982 Contribution à l’étude géologique de la Montagne Pelée (Martinique) : Evolution del’activité éruptive au cours de la période récente. PhD thesis, Université Paris XI.
Villemant, B. & Boudon, G. 1998 Transition from dome-forming to plinian eruptive styles controlledby H20 and Cl degassing. Letters to Nature 392, 65–69.
Westercamp, D. & Traineau, H. 1983 The past 5,000 years of volcanic activity at Mt. Pelée Martinique(F.W.I.): Implications for assessment of volcanic hazards. J. Volcanol. Geotherm. Res. 17, 159–185.
Wilson, L., Sparks, R. S. J., Huang, T. C. & Watkins, N. D. 1978 The Control of Volcanic ColumnHeights by Eruption Energetics and Dynamics. J. Geophys. Res. 83 (B4), 1829–1836.
Woods, A.W. 1988 The fluid dynamics and thermodynamics of eruption columns. Bull. Volcanol. 50,169–193.
Woods, A. W. & Bursik, M. I. 1991 Particle fallout, thermal disequilibrium and volcanic plumes. Bull.Volcanol. 53, 559–570.
Woods, A. W. & Kienle, J. 1994 The dynamics and thermodynamics of volcanic clouds: Theory andobservations from the April 15 and April 21, 1990 eruptions of Redoubt volcano, Alaska. J. Volcanol.Geotherm. Res. 62 (1-4), 273–299.
202


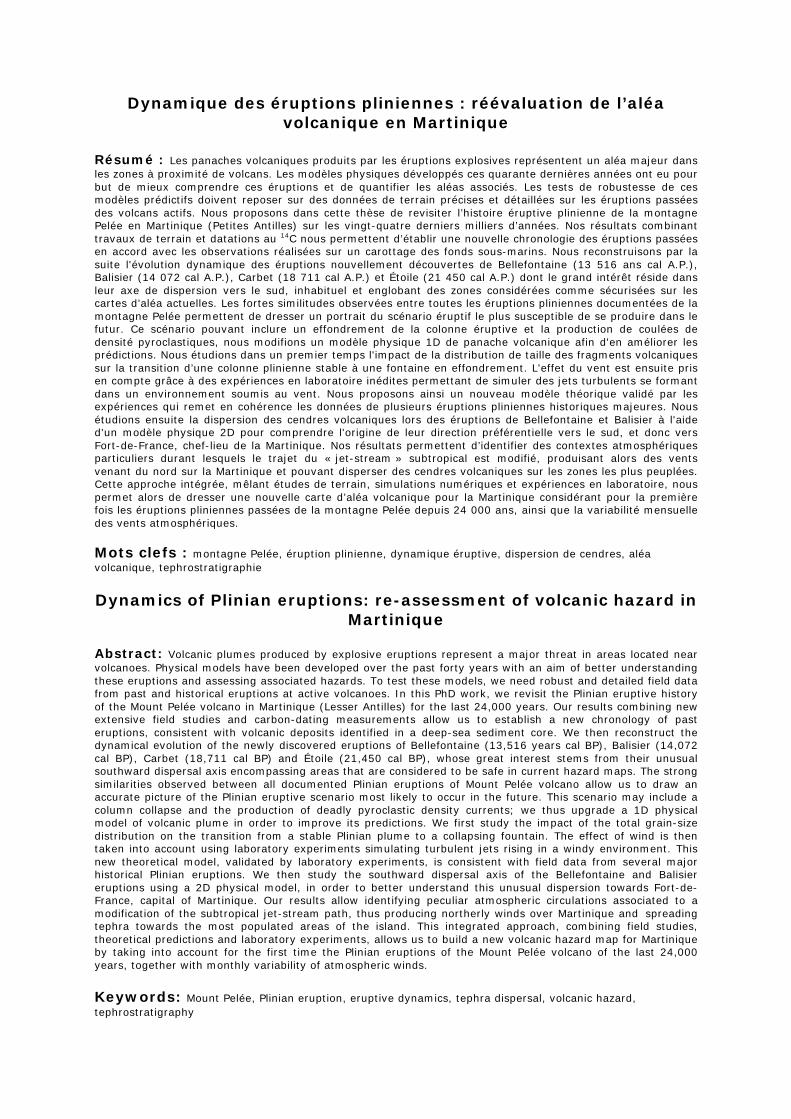
Dynamique des éruptions pliniennes : réévaluation de l’aléa volcanique en Martinique
Résumé : Les panaches volcaniques produits par les éruptions explosives représentent un aléa majeur dans les zones à proximité de volcans. Les modèles physiques développés ces quarante dernières années ont eu pour but de mieux comprendre ces éruptions et de quantifier les aléas associés. Les tests de robustesse de ces modèles prédictifs doivent reposer sur des données de terrain précises et détaillées sur les éruptions passées des volcans actifs. Nous proposons dans cette thèse de revisiter l’histoire éruptive plinienne de la montagne Pelée en Martinique (Petites Antilles) sur les vingt-quatre derniers milliers d’années. Nos résultats combinant travaux de terrain et datations au 14C nous permettent d’établir une nouvelle chronologie des éruptions passées en accord avec les observations réalisées sur un carottage des fonds sous-marins. Nous reconstruisons par la suite l'évolution dynamique des éruptions nouvellement découvertes de Bellefontaine (13 516 ans cal A.P.), Balisier (14 072 cal A.P.), Carbet (18 711 cal A.P.) et Étoile (21 450 cal A.P.) dont le grand intérêt réside dans leur axe de dispersion vers le sud, inhabituel et englobant des zones considérées comme sécurisées sur les cartes d’aléa actuelles. Les fortes similitudes observées entre toutes les éruptions pliniennes documentées de la montagne Pelée permettent de dresser un portrait du scénario éruptif le plus susceptible de se produire dans le futur. Ce scénario pouvant inclure un effondrement de la colonne éruptive et la production de coulées de densité pyroclastiques, nous modifions un modèle physique 1D de panache volcanique afin d'en améliorer les prédictions. Nous étudions dans un premier temps l'impact de la distribution de taille des fragments volcaniques sur la transition d’une colonne plinienne stable à une fontaine en effondrement. L'effet du vent est ensuite pris en compte grâce à des expériences en laboratoire inédites permettant de simuler des jets turbulents se formant dans un environnement soumis au vent. Nous proposons ainsi un nouveau modèle théorique validé par les expériences qui remet en cohérence les données de plusieurs éruptions pliniennes historiques majeures. Nous étudions ensuite la dispersion des cendres volcaniques lors des éruptions de Bellefontaine et Balisier à l'aide d'un modèle physique 2D pour comprendre l'origine de leur direction préférentielle vers le sud, et donc vers Fort-de-France, chef-lieu de la Martinique. Nos résultats permettent d’identifier des contextes atmosphériques particuliers durant lesquels le trajet du « jet-stream » subtropical est modifié, produisant alors des vents venant du nord sur la Martinique et pouvant disperser des cendres volcaniques sur les zones les plus peuplées. Cette approche intégrée, mêlant études de terrain, simulations numériques et expériences en laboratoire, nous permet alors de dresser une nouvelle carte d’aléa volcanique pour la Martinique considérant pour la première fois les éruptions pliniennes passées de la montagne Pelée depuis 24 000 ans, ainsi que la variabilité mensuelle des vents atmosphériques. Mots clefs : montagne Pelée, éruption plinienne, dynamique éruptive, dispersion de cendres, aléa volcanique, tephrostratigraphie Dynamics of Plinian eruptions: re-assessment of volcanic hazard in
Martinique Abstract: Volcanic plumes produced by explosive eruptions represent a major threat in areas located near volcanoes. Physical models have been developed over the past forty years with an aim of better understanding these eruptions and assessing associated hazards. To test these models, we need robust and detailed field data from past and historical eruptions at active volcanoes. In this PhD work, we revisit the Plinian eruptive history of the Mount Pelée volcano in Martinique (Lesser Antilles) for the last 24,000 years. Our results combining new extensive field studies and carbon-dating measurements allow us to establish a new chronology of past eruptions, consistent with volcanic deposits identified in a deep-sea sediment core. We then reconstruct the dynamical evolution of the newly discovered eruptions of Bellefontaine (13,516 years cal BP), Balisier (14,072 cal BP), Carbet (18,711 cal BP) and Étoile (21,450 cal BP), whose great interest stems from their unusual southward dispersal axis encompassing areas that are considered to be safe in current hazard maps. The strong similarities observed between all documented Plinian eruptions of Mount Pelée volcano allow us to draw an accurate picture of the Plinian eruptive scenario most likely to occur in the future. This scenario may include a column collapse and the production of deadly pyroclastic density currents; we thus upgrade a 1D physical model of volcanic plume in order to improve its predictions. We first study the impact of the total grain-size distribution on the transition from a stable Plinian plume to a collapsing fountain. The effect of wind is then taken into account using laboratory experiments simulating turbulent jets rising in a windy environment. This new theoretical model, validated by laboratory experiments, is consistent with field data from several major historical Plinian eruptions. We then study the southward dispersal axis of the Bellefontaine and Balisier eruptions using a 2D physical model, in order to better understand this unusual dispersion towards Fort-de-France, capital of Martinique. Our results allow identifying peculiar atmospheric circulations associated to a modification of the subtropical jet-stream path, thus producing northerly winds over Martinique and spreading tephra towards the most populated areas of the island. This integrated approach, combining field studies, theoretical predictions and laboratory experiments, allows us to build a new volcanic hazard map for Martinique by taking into account for the first time the Plinian eruptions of the Mount Pelée volcano of the last 24,000 years, together with monthly variability of atmospheric winds. Keywords: Mount Pelée, Plinian eruption, eruptive dynamics, tephra dispersal, volcanic hazard, tephrostratigraphy
Related Documents