IAEA International Atomic Energy Agency Red Book – Uranium: Resources, Production and Demand July 2010, Ghana RAF3007, Workshop on Uranium Data Collection & Reporting

Welcome message from author
This document is posted to help you gain knowledge. Please leave a comment to let me know what you think about it! Share it to your friends and learn new things together.
Transcript
IAEAInternational Atomic Energy Agency
Red Book – Uranium: Resources, Production and Demand
July 2010, Ghana
RAF3007, Workshop on Uranium Data Collection & Reporting
IAEA
Introduction
• Historical developments• Uranium supply (resources, production)• Uranium demand• Country reports
IAEA
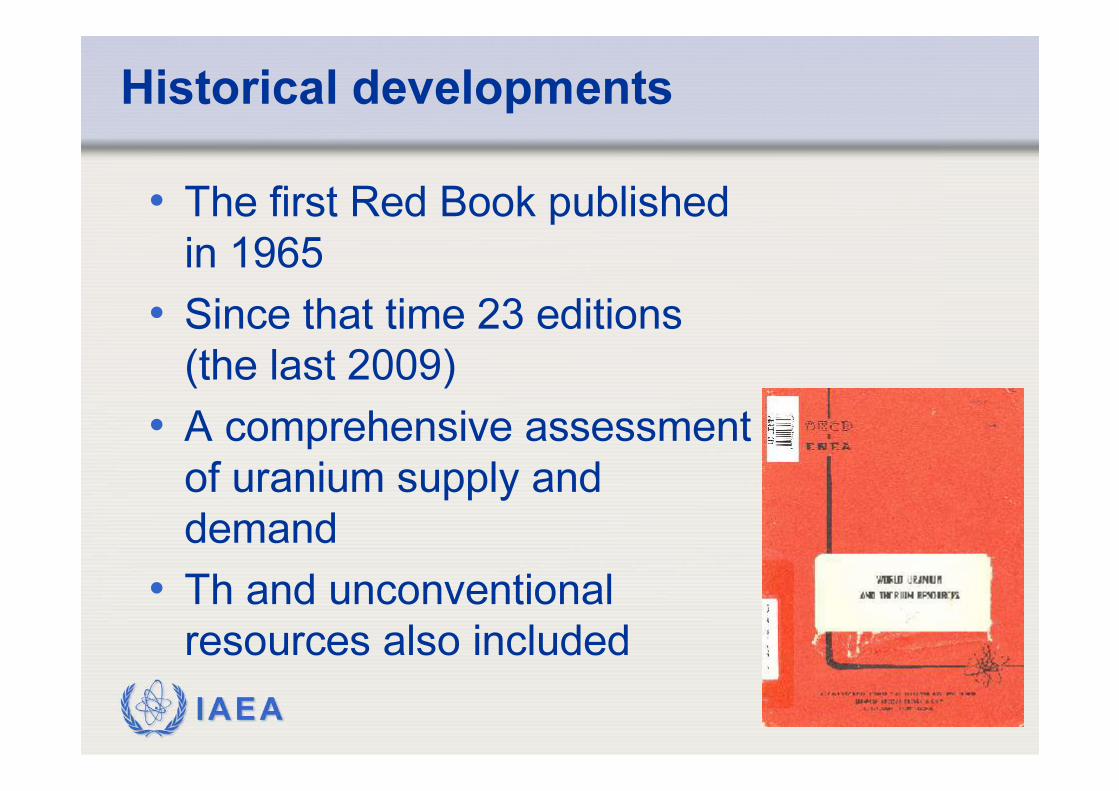
Historical developments• The first Red Book published in 1965
• Since that time 23 editions (the last 2009)
• A comprehensive assessment of uranium supply and demand
• Th and unconventional resources also included
IAEA
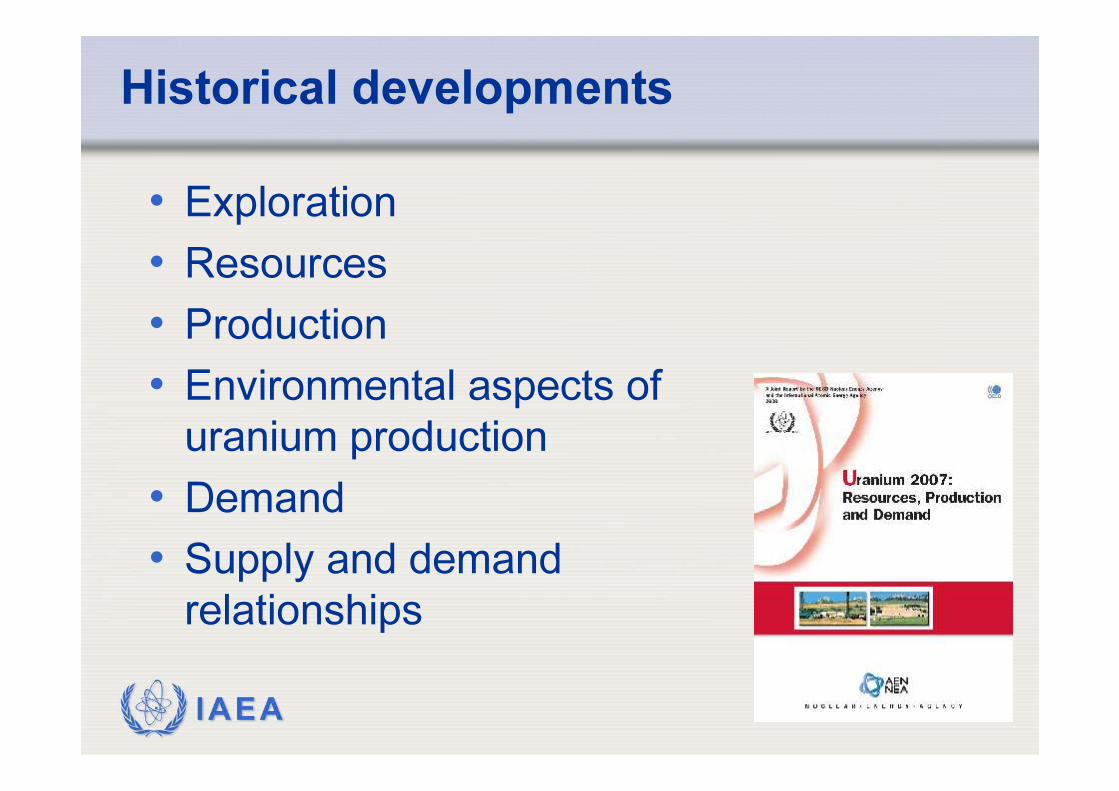
Historical developments• Exploration• Resources• Production• Environmental aspects of uranium production
• Demand• Supply and demand relationships
IAEA
Historical developments• Associated publications:• The Red Book Retrospective
• Environmenal Issues in Uranium Production
• Remediation Activities in Uranium Production
IAEA
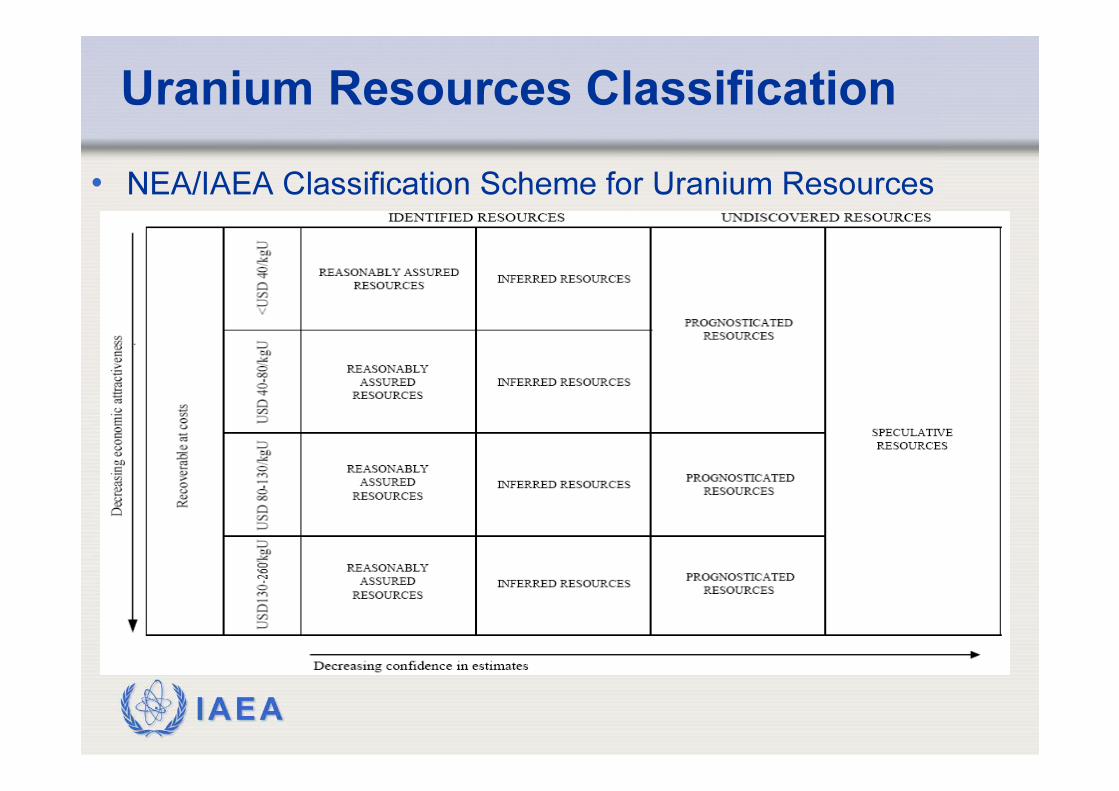
Uranium Resources Classification• NEA/IAEA Classification Scheme for Uranium Resources
IAEA
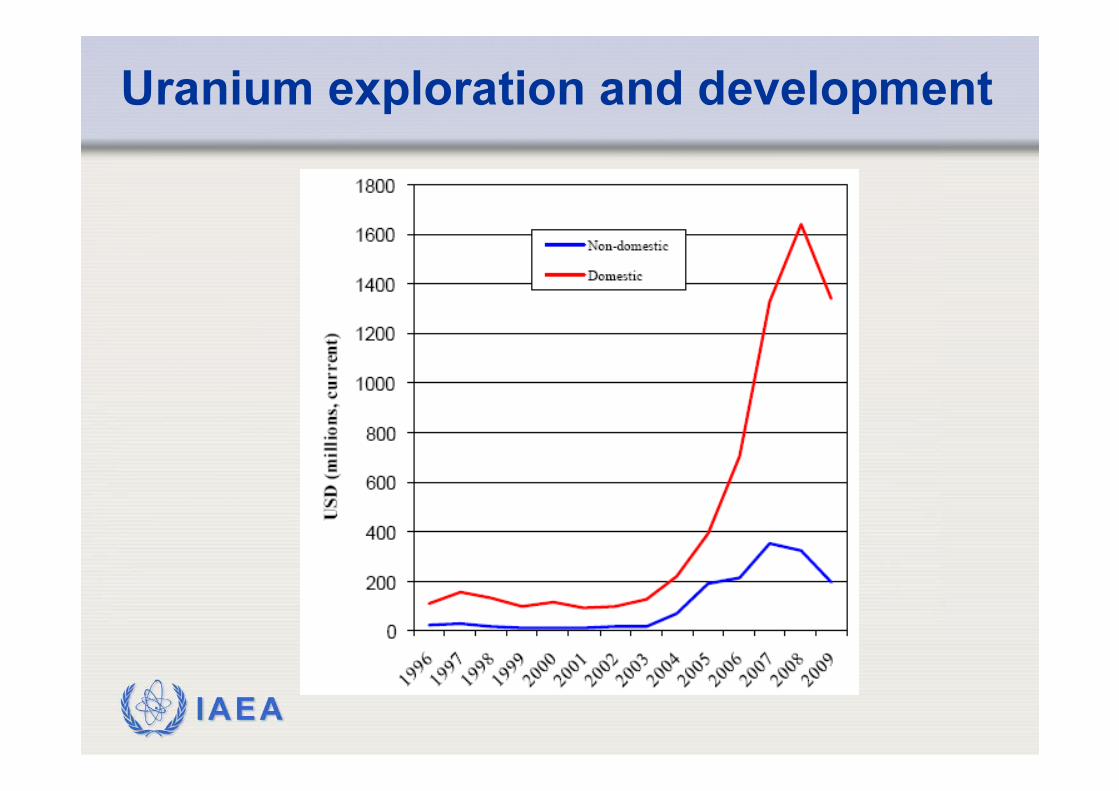
Uranium exploration and development
IAEA
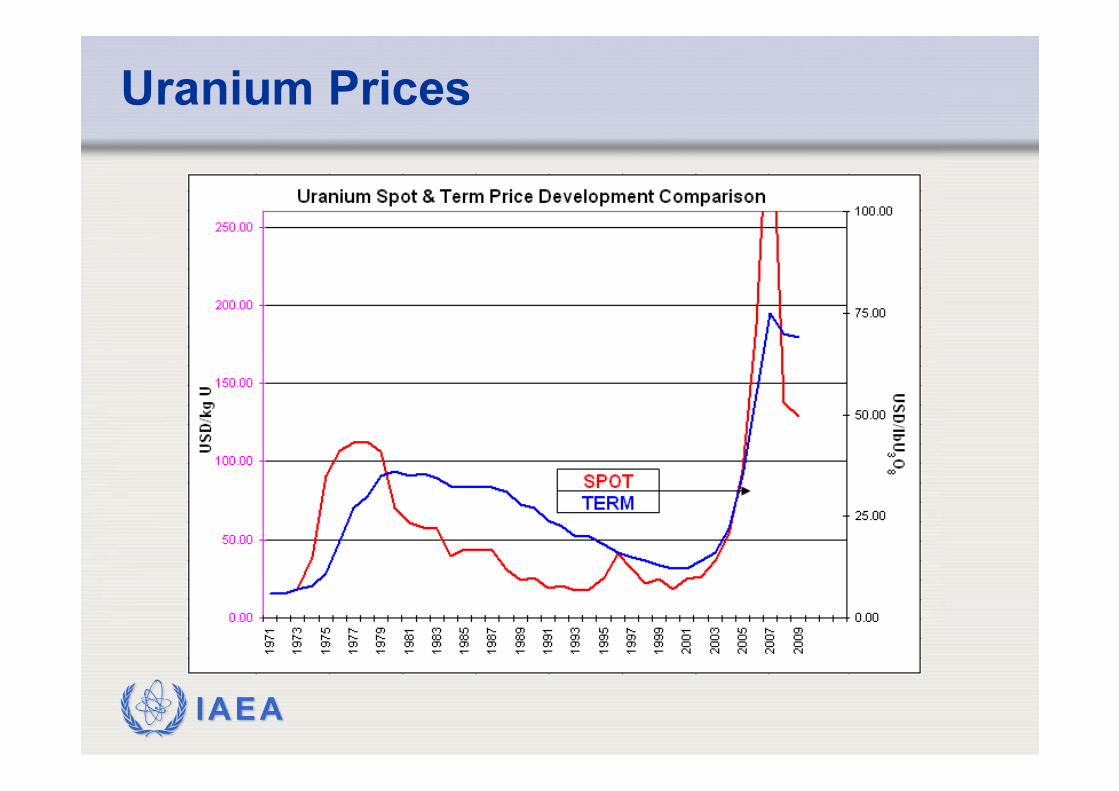
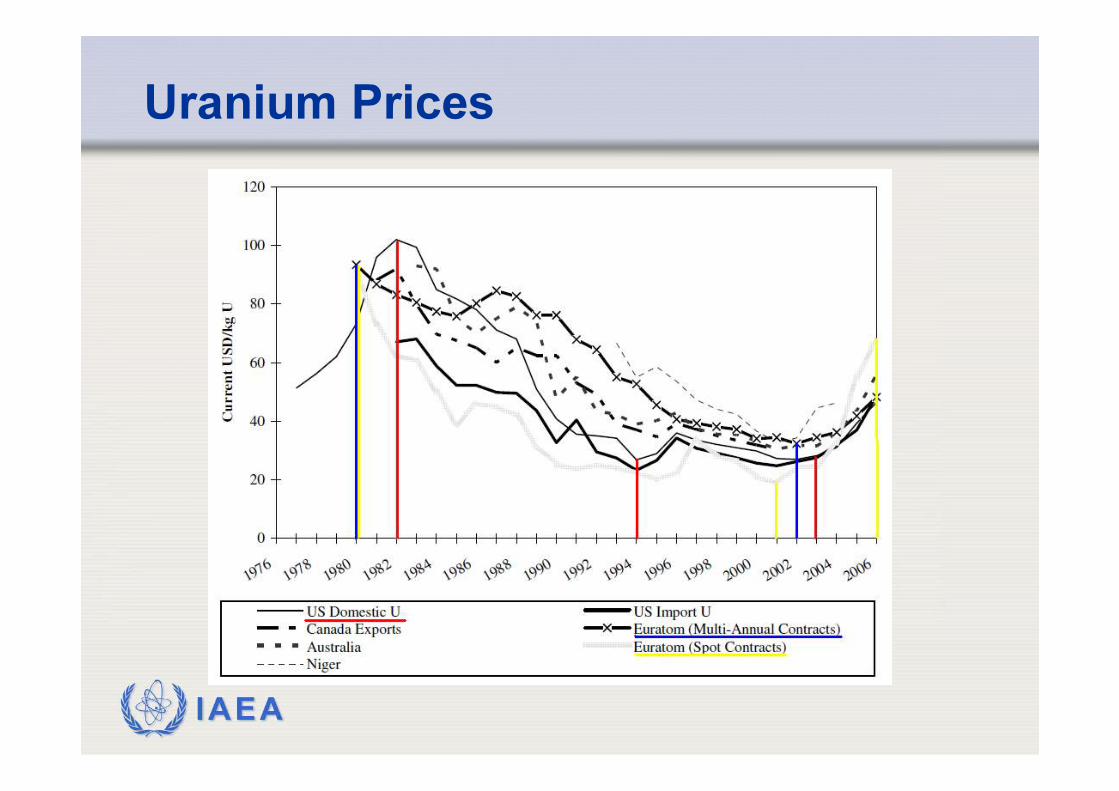
Uranium Prices
IAEA
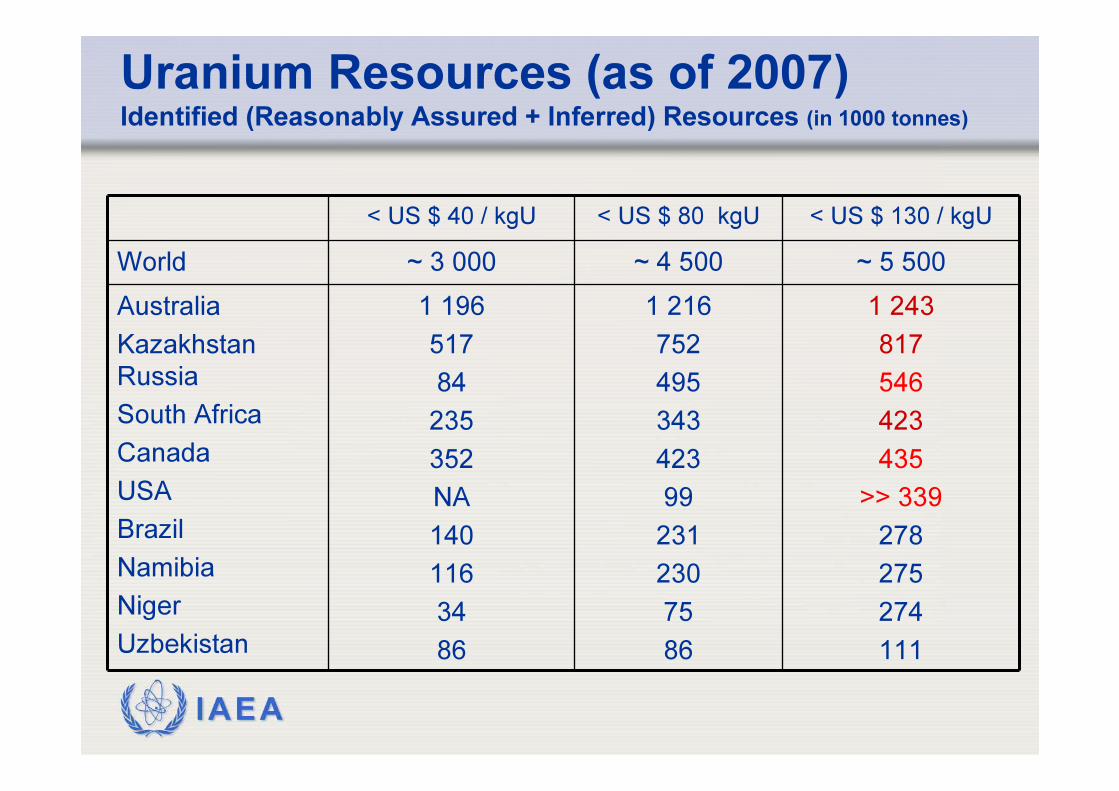
Uranium Resources (as of 2007)Identified (Reasonably Assured + Inferred) Resources (in 1000 tonnes)
< US $ 40 / kgU < US $ 80 kgU < US $ 130 / kgUWorld ~ 3 000 ~ 4 500 ~ 5 500AustraliaKazakhstan RussiaSouth AfricaCanadaUSABrazilNamibiaNigerUzbekistan
1 19651784235352NA1401163486
1 216752495343423992312307586
1 243817546423435
>> 339278275274111
IAEA
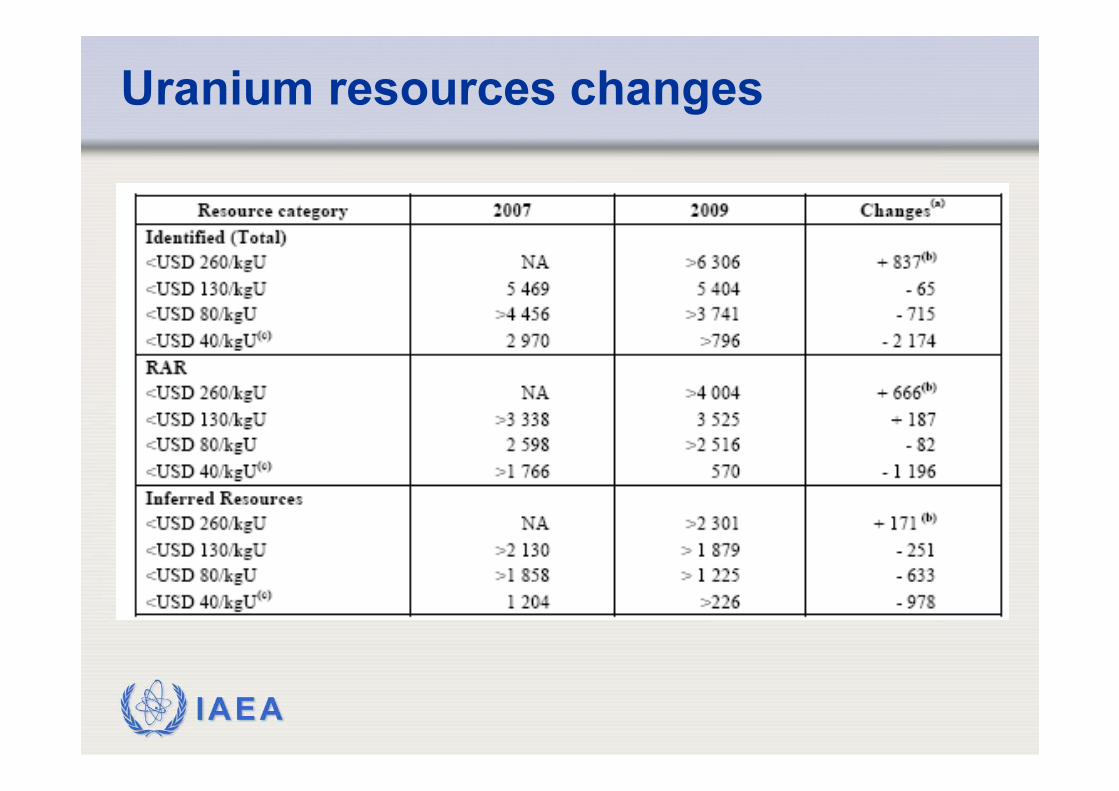
Uranium resources changes
IAEA
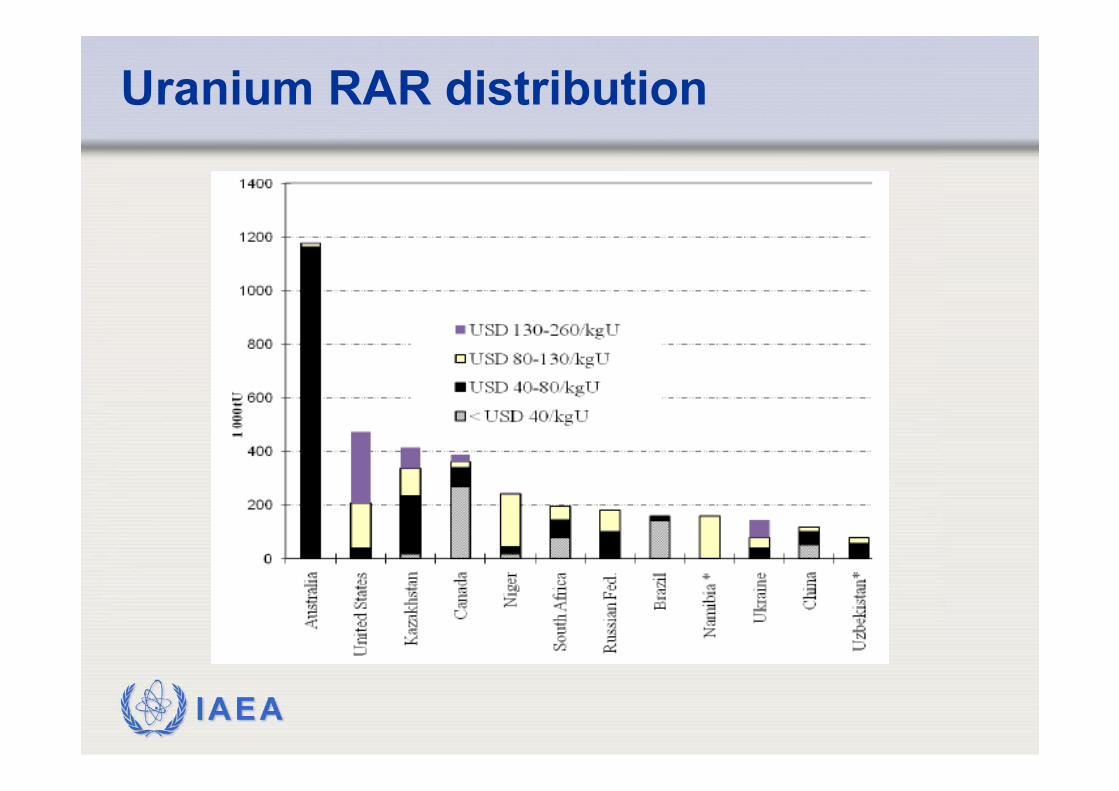
Uranium RAR distribution
IAEA
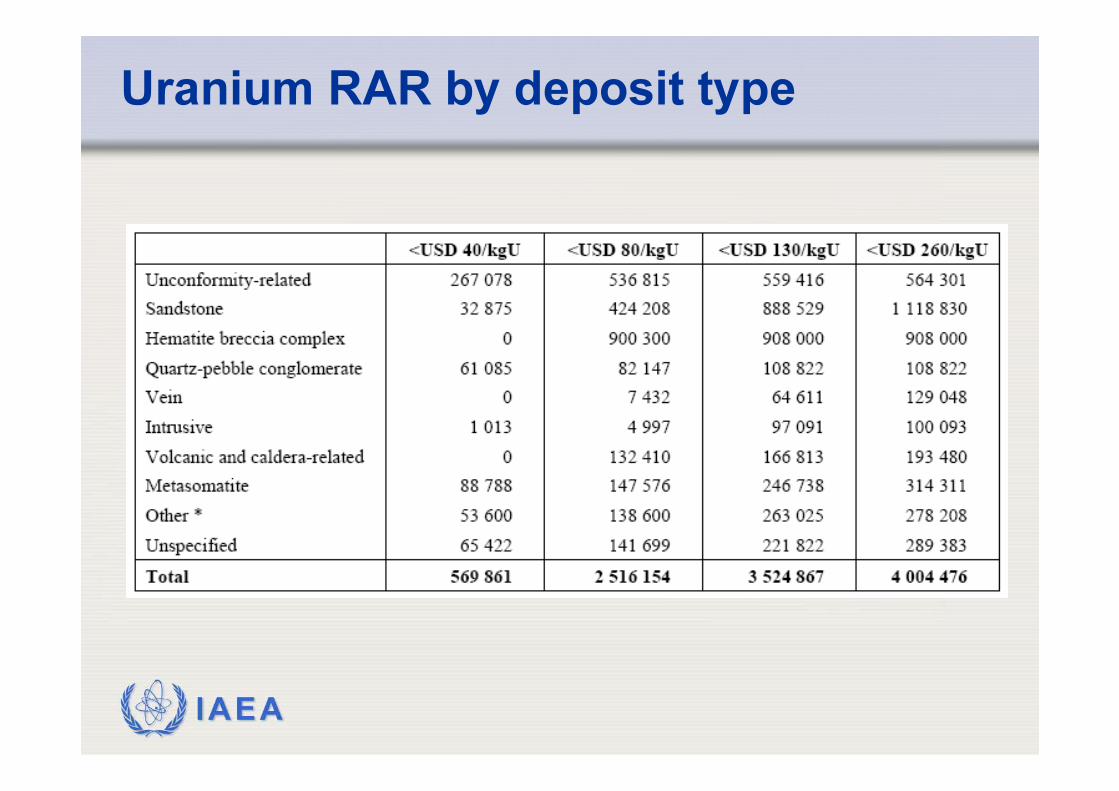
Uranium RAR by deposit type
IAEA
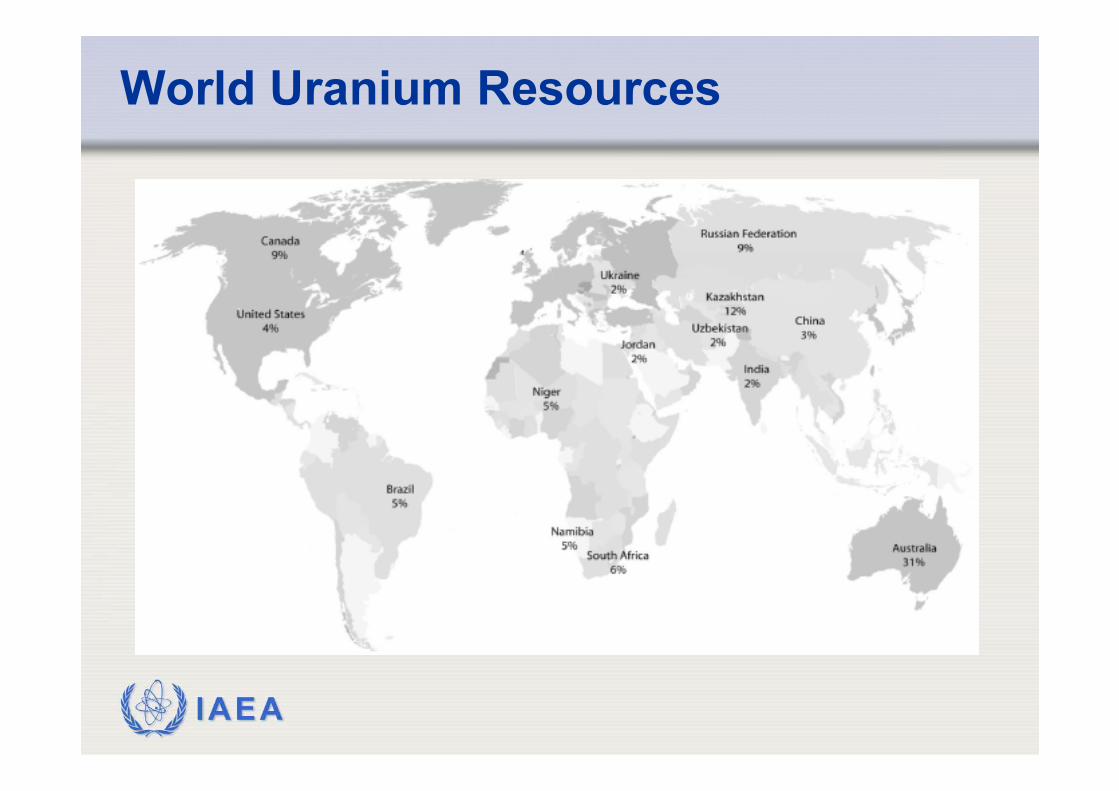
World Uranium Resources
IAEA
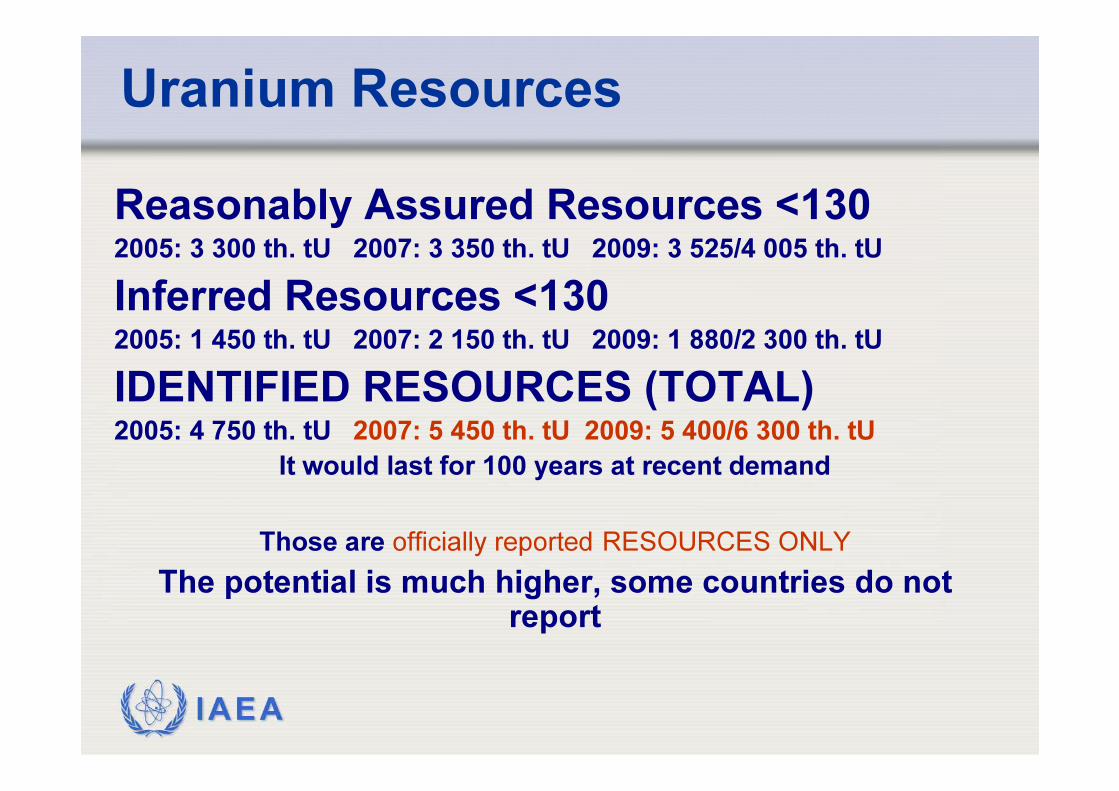
Reasonably Assured Resources <1302005: 3 300 th. tU 2007: 3 350 th. tU 2009: 3 525/4 005 th. tUInferred Resources <1302005: 1 450 th. tU 2007: 2 150 th. tU 2009: 1 880/2 300 th. tUIDENTIFIED RESOURCES (TOTAL)2005: 4 750 th. tU 2007: 5 450 th. tU 2009: 5 400/6 300 th. tU
It would last for 100 years at recent demand
Those are officially reported RESOURCES ONLYThe potential is much higher, some countries do not
report
Uranium Resources
IAEA
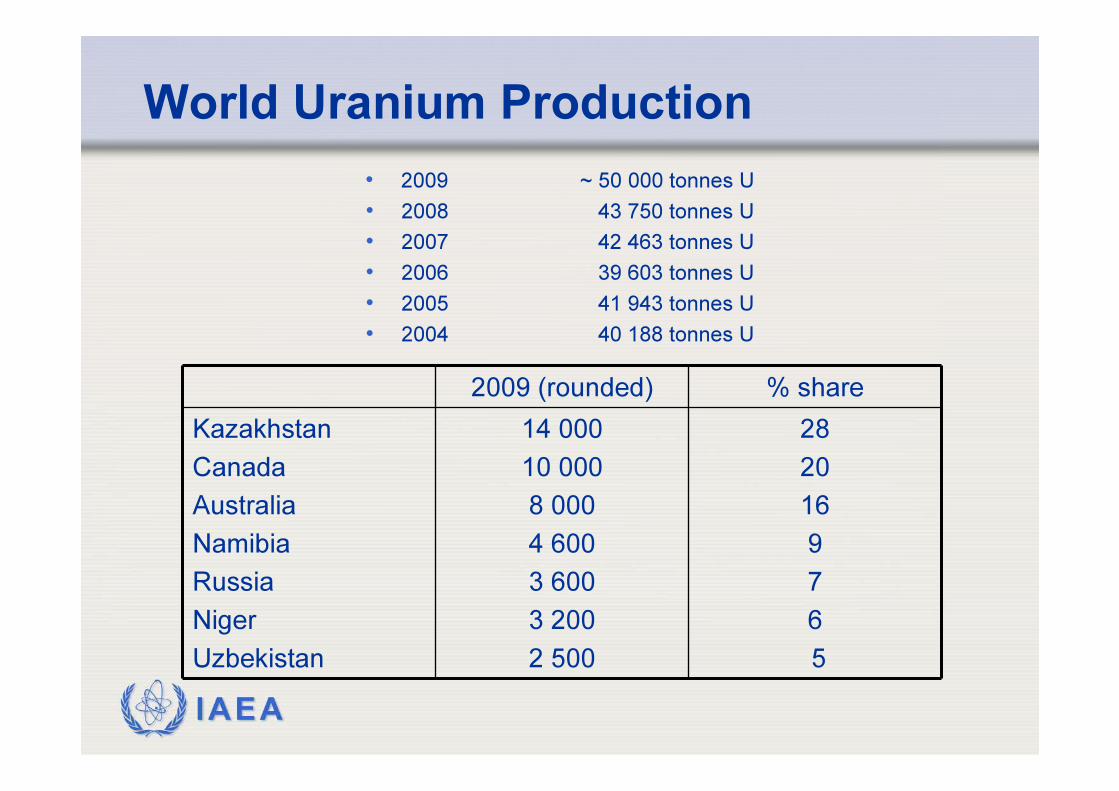
World Uranium Production• 2009 ~ 50 000 tonnes U• 2008 43 750 tonnes U• 2007 42 463 tonnes U• 2006 39 603 tonnes U• 2005 41 943 tonnes U• 2004 40 188 tonnes U
2009 (rounded) % shareKazakhstanCanadaAustraliaNamibiaRussiaNigerUzbekistan
14 00010 0008 0004 6003 6003 2002 500
2820169765
IAEA
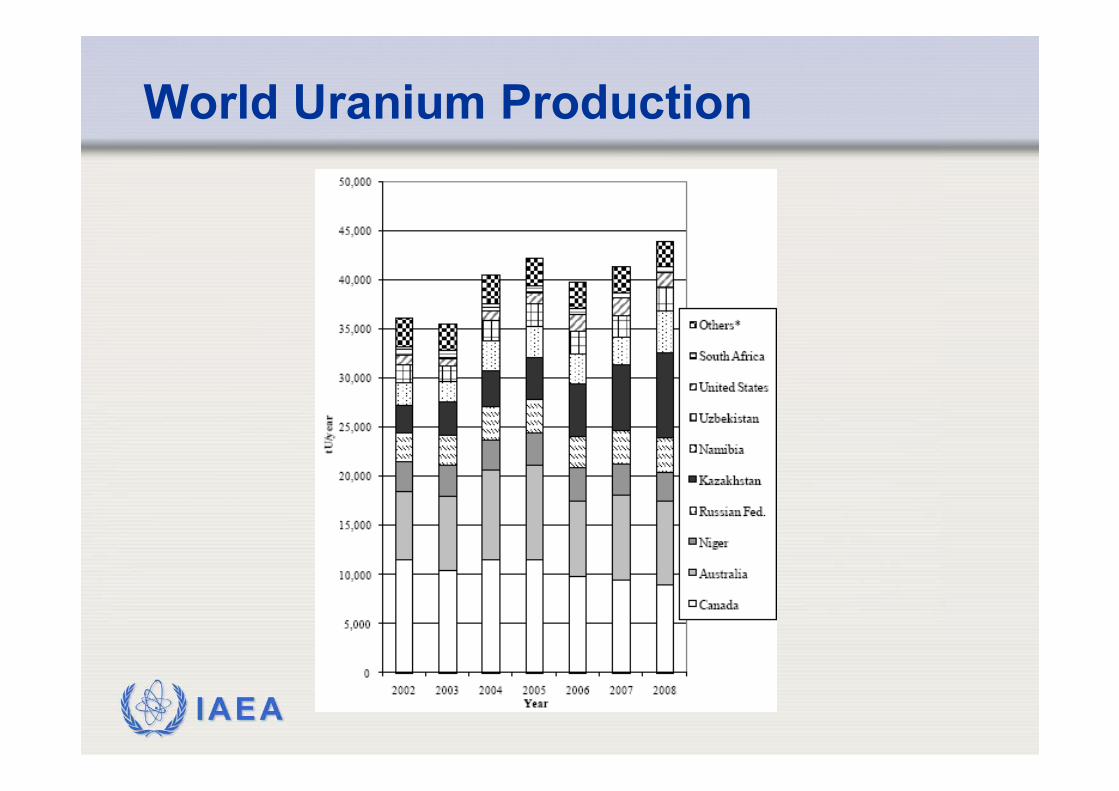
World Uranium Production
IAEA
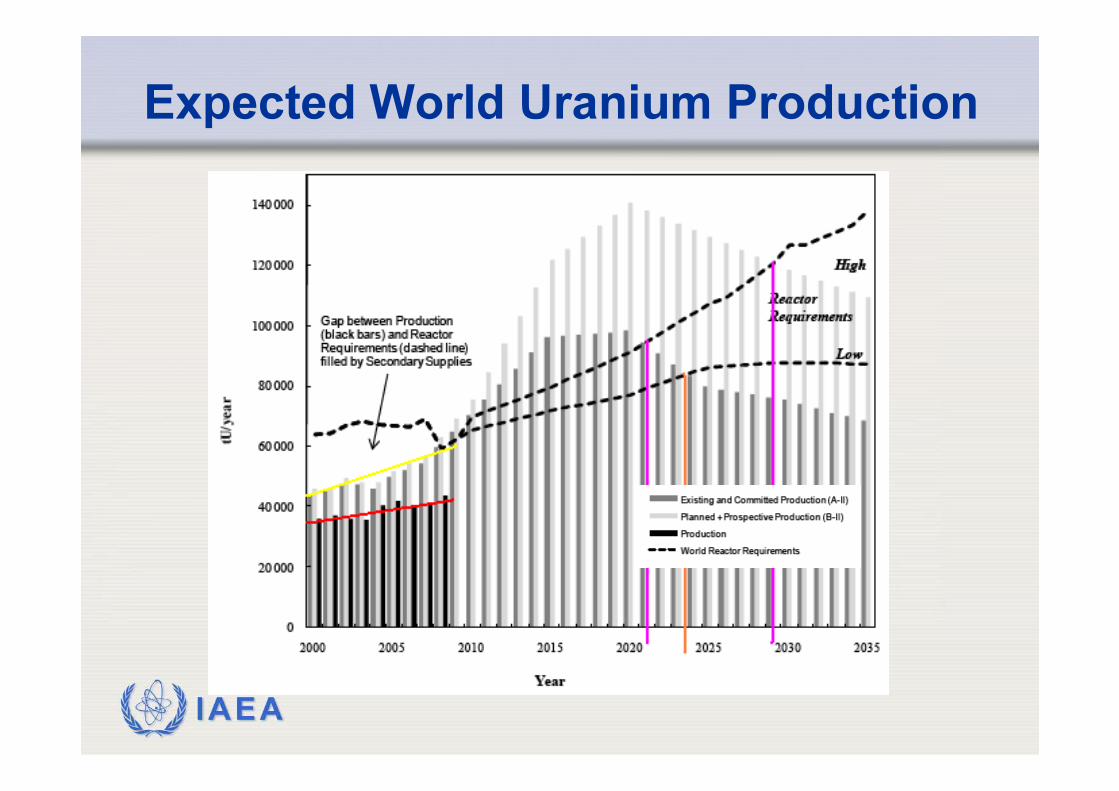
Expected World Uranium Production
IAEA
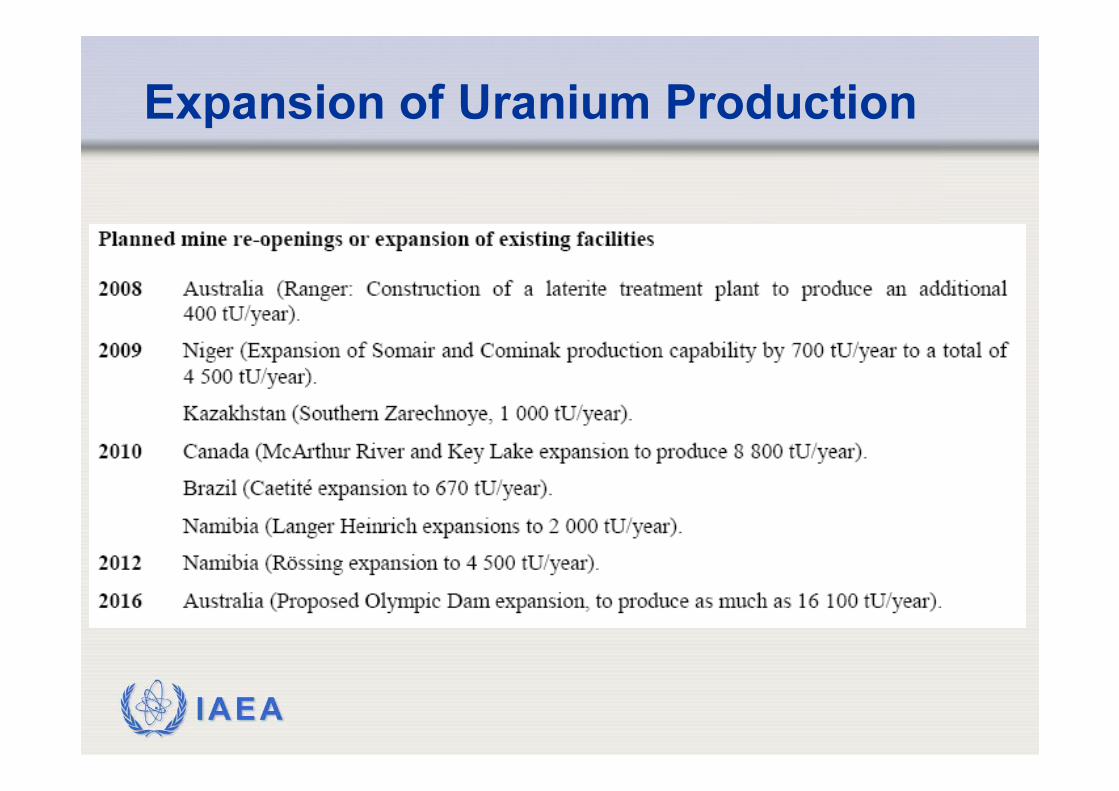
Expansion of Uranium Production
IAEA
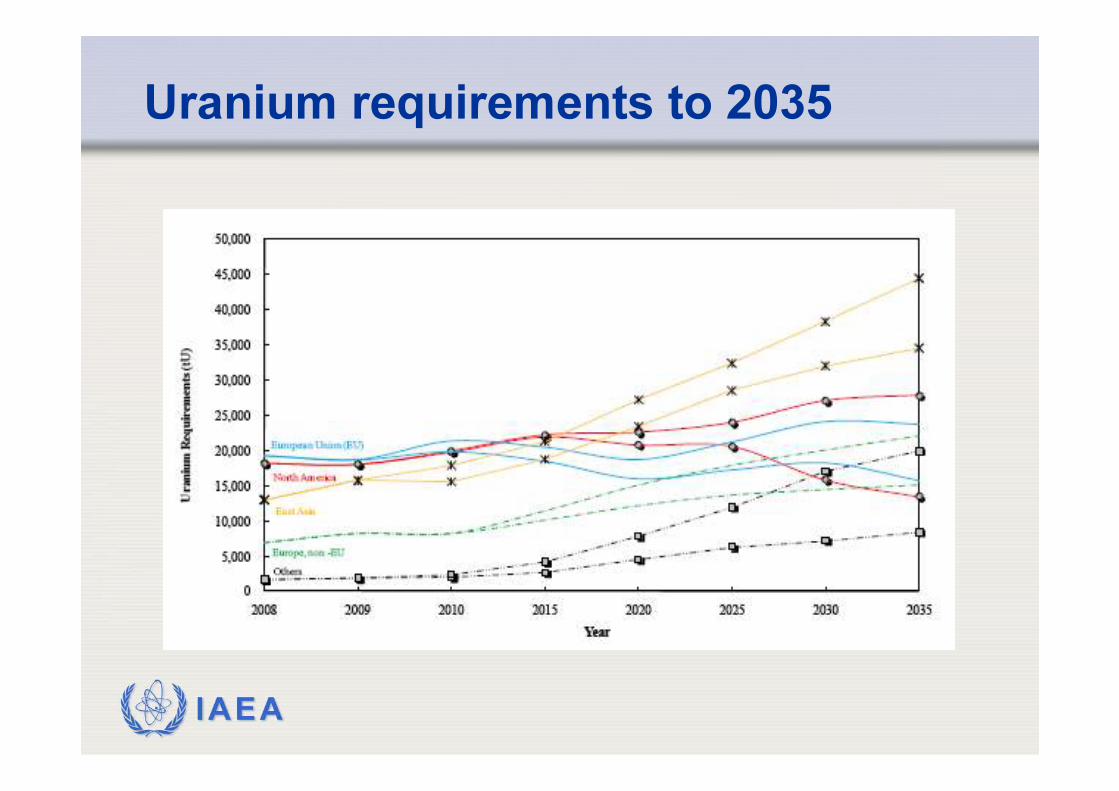
Uranium requirements to 2035
IAEA
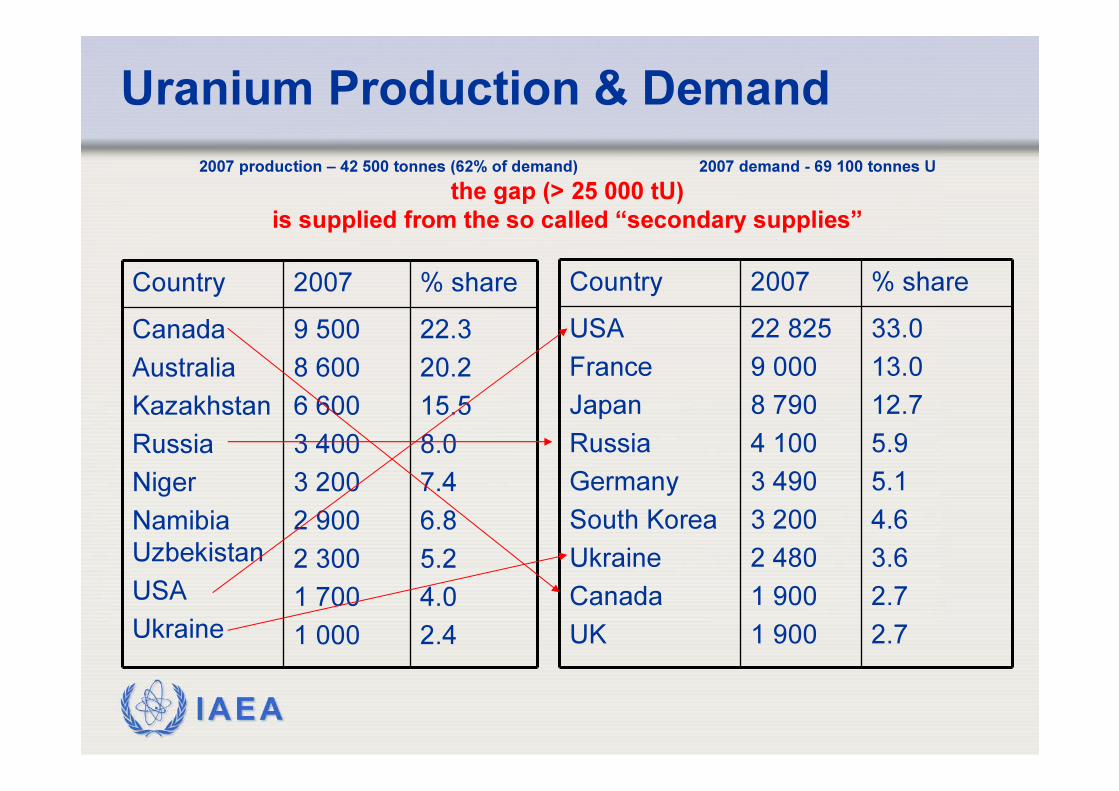
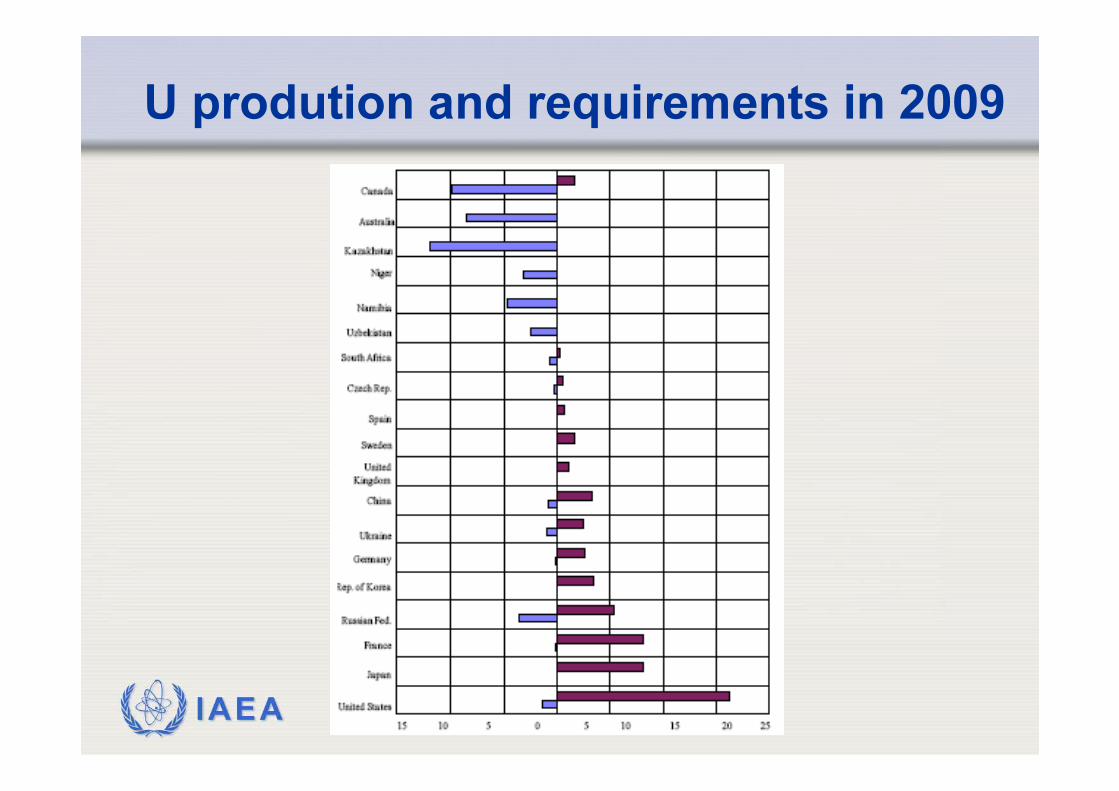
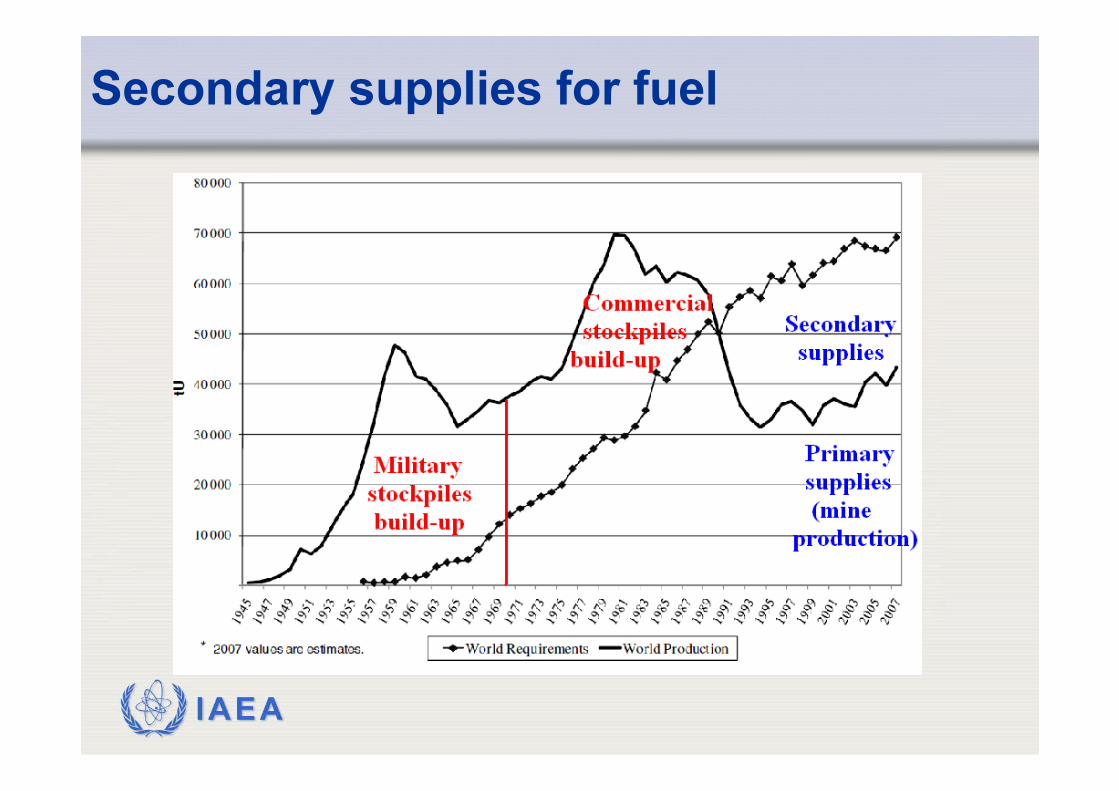
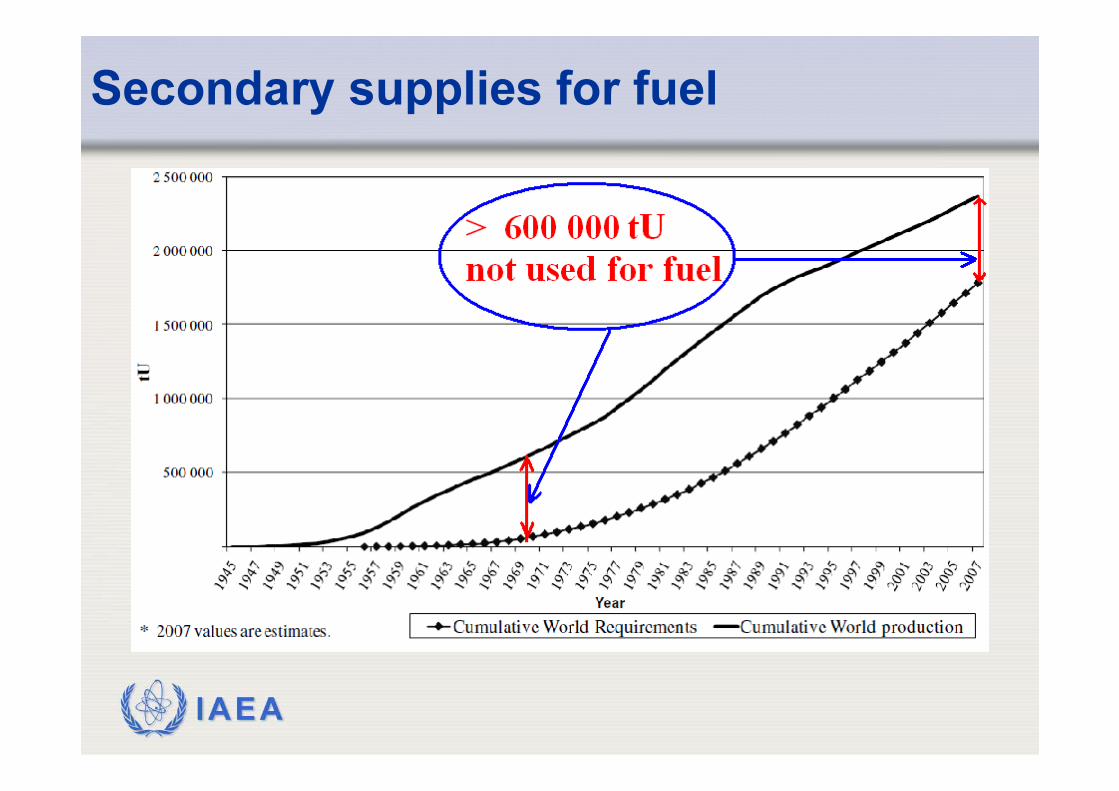
Uranium Production & Demand2007 production – 42 500 tonnes (62% of demand) 2007 demand - 69 100 tonnes U
the gap (> 25 000 tU)is supplied from the so called “secondary supplies”
Country 2007 % shareUSAFranceJapanRussiaGermanySouth KoreaUkraineCanadaUK
22 8259 0008 7904 1003 4903 2002 4801 9001 900
33.013.012.75.95.14.63.62.72.7
Country 2007 % shareCanadaAustraliaKazakhstanRussiaNigerNamibia UzbekistanUSAUkraine
9 5008 6006 6003 4003 2002 9002 3001 7001 000
22.320.215.58.07.46.85.24.02.4
IAEA
U prodution and requirements in 2009
IAEA
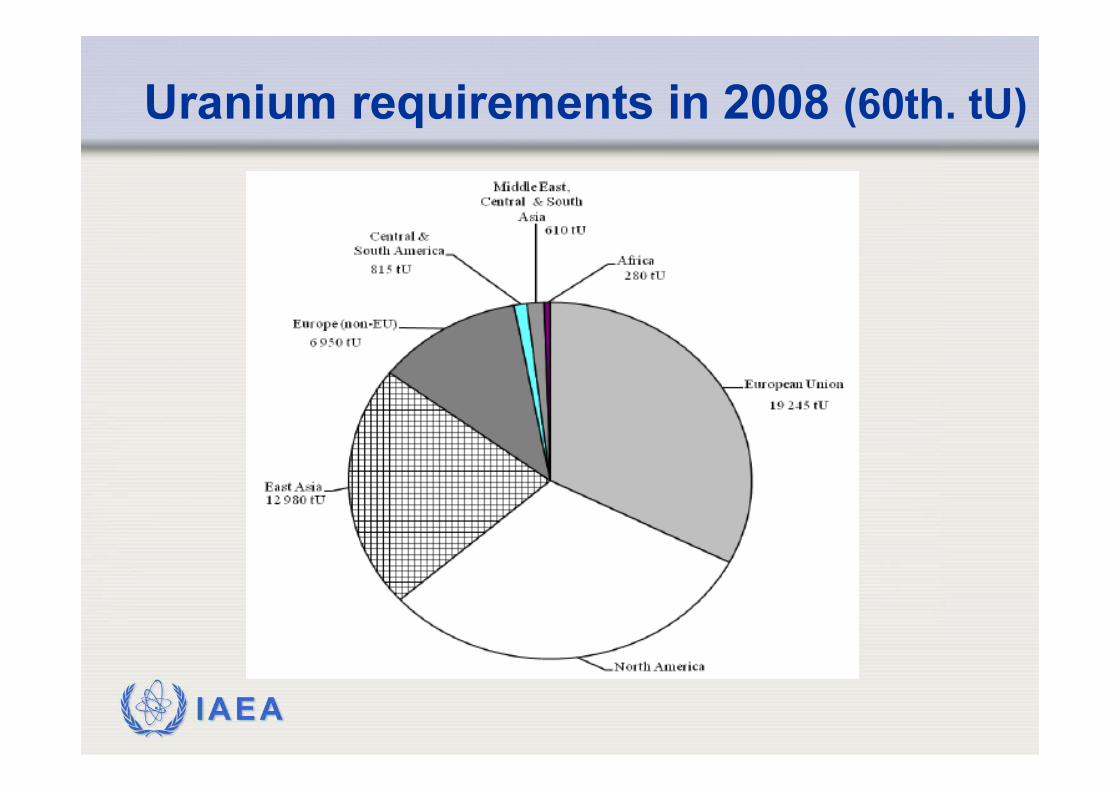
Uranium requirements in 2008 (60th. tU)
IAEA
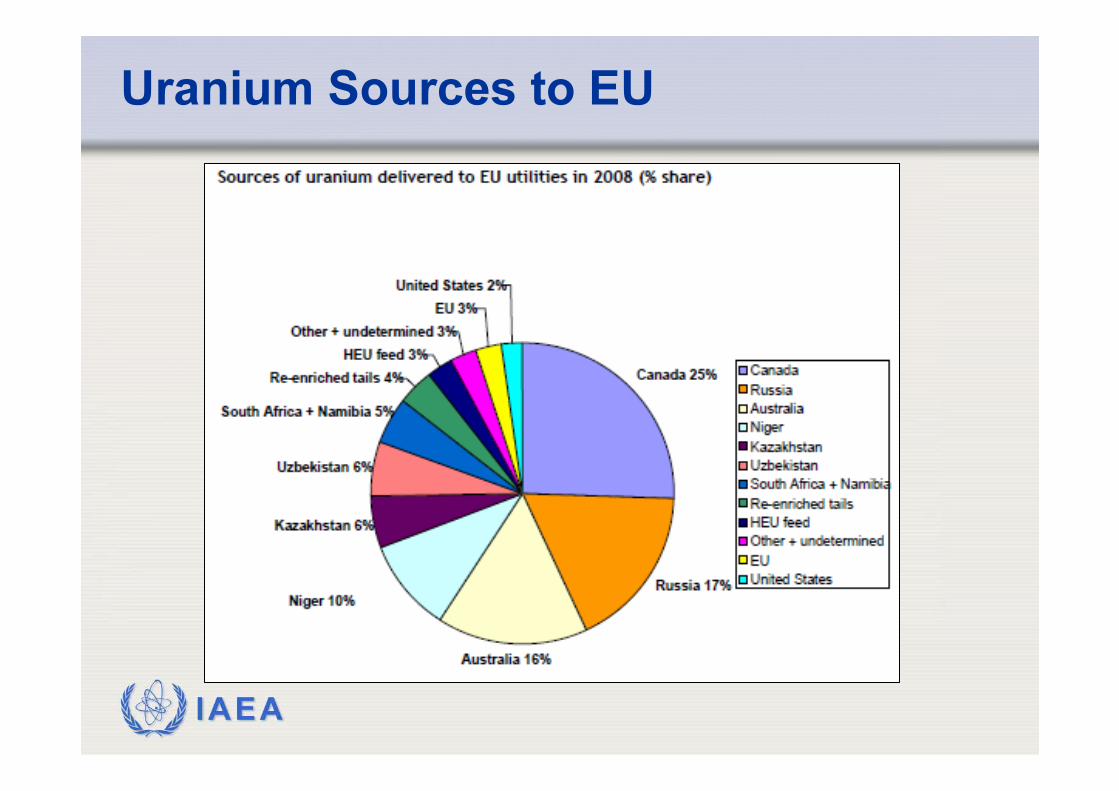
Uranium Sources to EU
IAEA
Secondary supplies for fuel
IAEA
Secondary supplies for fuel
IAEA
Uranium Prices
IAEA
THANK YOU FOR YOUR ATTENTION
Jan Slezak, Uranium Resource Specialist+43 1 2600 22757, [email protected] Fuel Cycle & Materials SectionDivision of Nuclear Fuel Cycle and Waste Technology Department of Nuclear EnergyInternational Atomic Energy Agency (VIC)Wagramer Strasse 5P.O. Box 100A-1400 Vienna, Austria
Related Documents