Bull Earthquake Eng (2011) 9:157–179 DOI 10.1007/s10518-010-9239-x ORIGINAL RESEARCH PAPER Recorded ground motion and site effects evaluation for the April 6, 2009 L’Aquila earthquake M. Maugeri · A. L. Simonelli · A. Ferraro · S. Grasso · A. Penna Received: 6 September 2010 / Accepted: 16 December 2010 © Springer Science+Business Media B.V. 2011 Abstract On April 6, 2009 a M L = 5.8 earthquake hit the city of L’Aquila on the Apen- nine chain in central Italy. Notwithstanding the moderate-size event the L’Aquila city and several small villages along the Aterno river valley suffered severe damage, because of the unusual strong motions, mainly due to proximity to the fault (estimated hypocentral depth of about 10 km). In this paper the main features of the recorded motion are discussed. Four accelerometric stations were located within the surface projection of the fault and recorded peak values ranging from 0.4 to 0.6 g. The recorded motions were characterised by short dura- tions and high peak accelerations both in the horizontal and vertical directions. The strong portions of vertical and horizontal motions occurred almost simultaneously due to the short travel paths of P and S waves from the fault to the ground surface near the fault area. Hence site response analyses were performed for the sites where recording stations were located. The geotechnical subsoil model was derived by boreholes, in situ dynamic tests (D-H and SDMT) and by laboratory tests (RCT). One-dimensional numerical analyses were carried out employing the well known computer code EERA. The numerical model was calibrated, in the linear equivalent range, by comparing numerical results with the horizontal acceleration recorded components. Keywords L’Aquila earthquake · Seismic action · Site response analysis · Soil non linearity · Seismic code 1 Introduction On April 6, 2009, at 03:32 local time, a strong earthquake hit the city of L’Aquila on the Apennine chain in central Italy. The sequence started in December 2008 as a series of small M. Maugeri (B ) · A. Ferraro · S. Grasso Department of Civil and Environmental Engineering, University of Catania, Catania, Italy e-mail: [email protected] A. L. Simonelli · A. Penna Department of Engineering, University of Sannio, Benevento, Italy 123

Welcome message from author
This document is posted to help you gain knowledge. Please leave a comment to let me know what you think about it! Share it to your friends and learn new things together.
Transcript

Bull Earthquake Eng (2011) 9:157–179DOI 10.1007/s10518-010-9239-x
ORIGINAL RESEARCH PAPER
Recorded ground motion and site effects evaluationfor the April 6, 2009 L’Aquila earthquake
M. Maugeri · A. L. Simonelli · A. Ferraro · S. Grasso ·A. Penna
Received: 6 September 2010 / Accepted: 16 December 2010© Springer Science+Business Media B.V. 2011
Abstract On April 6, 2009 a ML = 5.8 earthquake hit the city of L’Aquila on the Apen-nine chain in central Italy. Notwithstanding the moderate-size event the L’Aquila city andseveral small villages along the Aterno river valley suffered severe damage, because of theunusual strong motions, mainly due to proximity to the fault (estimated hypocentral depthof about 10 km). In this paper the main features of the recorded motion are discussed. Fouraccelerometric stations were located within the surface projection of the fault and recordedpeak values ranging from 0.4 to 0.6 g. The recorded motions were characterised by short dura-tions and high peak accelerations both in the horizontal and vertical directions. The strongportions of vertical and horizontal motions occurred almost simultaneously due to the shorttravel paths of P and S waves from the fault to the ground surface near the fault area. Hencesite response analyses were performed for the sites where recording stations were located.The geotechnical subsoil model was derived by boreholes, in situ dynamic tests (D-H andSDMT) and by laboratory tests (RCT). One-dimensional numerical analyses were carried outemploying the well known computer code EERA. The numerical model was calibrated, inthe linear equivalent range, by comparing numerical results with the horizontal accelerationrecorded components.
Keywords L’Aquila earthquake · Seismic action · Site response analysis ·Soil non linearity · Seismic code
1 Introduction
On April 6, 2009, at 03:32 local time, a strong earthquake hit the city of L’Aquila on theApennine chain in central Italy. The sequence started in December 2008 as a series of small
M. Maugeri (B) · A. Ferraro · S. GrassoDepartment of Civil and Environmental Engineering, University of Catania, Catania, Italye-mail: [email protected]
A. L. Simonelli · A. PennaDepartment of Engineering, University of Sannio, Benevento, Italy
123

158 Bull Earthquake Eng (2011) 9:157–179
Fig. 1 Location of shocks with an intensity I > 5 and of the three main shocks with magnitudes Mw rangingfrom 5.4 to 6.3
Fig. 2 Damage occurred at the village of Onna, with an MCS Intensity I = X
earthquakes and reached its climax in April 2009. Three events above ML = 5 took placeon April 6, 7 and 9 which devastated the city and its vicinity (Fig. 1). The epicentre (latitude42.3476, longitude 13.3800) of the main shock was located at few Kilometers W-SW from thecity of L’Aquila. Maximum MCS intensity was: I = X at Onna (Fig. 2) and I = IX at L’Aquila(73,000 inhabitants).
The city of L’Aquila and several small villages along the Aterno river valley sufferedsevere damage. 308 deaths, 1600 injured, 40,000 homeless occurred. The damages wereabout 30 billions C=, plus that intangible to monuments. Most of the deaths took place in
123

Bull Earthquake Eng (2011) 9:157–179 159
Fig. 3 The fracture of the road pavement at Onna village (42◦19’27”N 13◦28’40”E)
vulnerable masonry houses which were subjected to unusually strong motions—mainly dueto proximity to the fault. In the days following the earthquake, a large number of researchersvisited the area. Several reports on the main features of the recorded ground motions werecompiled by different teams, among which the group of Italian investigators (Simonelli et al.2009) under the supervision of the Italian Geotechnical Association (AGI) and the NationalNetwork of Earthquake Engineering Laboratories (ReLUIS) project. Detailed reports werealso produced by the Geo-Engineering for Extreme Events Reconnaissance (GEER) pro-ject (Stewart et al. 2009) on seismological and geotechnical aspects of the earthquake andby Aydan et al. (2009) on the damage occurred. The effects on the physical environmentare reported, with reference to fractures in Fig. 3, to large deformations in Fig. 4, to rockfalls in Figs. 5 and 6, to sink holes in Fig. 7 and to liquefaction in Fig. 8. A soil liquefactionphenomenon occurred at the village of Vittorito, as reported in detail by Monaco et al. (2010).
A comprehensive view of geotechnical phenomena and occurred damage is also reportedby Monaco et al. (2009). Here the authors discuss the ground recorded motion and the localsite response in a code oriented view (UNI 1998; D.M. 2008).
2 The April 6, 2009 L’Aquila earthquake recordings
According to Italian Institute of Geophysics and Volcanology (INGV), the main shock tookplace along a normal fault oriented NW–SE, with local magnitude ML = 5.8 and momentmagnitude MW = 6.3. The hypocentral depth was estimated at approximately 10 km fromthe ground surface. Four accelerometric stations (AQG, AQA, AQV, AQM) were locatedacross the Aterno valley (Fig. 9) and recorded peak values ranging from about 0.4–0.6 g; thestation AQK was located in the city and recorded a peak value of about 0.35 g. Peak groundvelocities were estimated at around 35 cm/s (see Table 1). The moderate-size event of April 6took place at shallow depth and produced severe ground shacking in the near-fault area, whichwas limited to approximately 250 km2. The city of L’Aquila was located within this zonewith catastrophic consequences. As shown in Figs. 10, 11 12, 13, the time history motions arecharacterised by short durations (less than 10 s) and high peak accelerations both in the hor-izontal and vertical directions. In some cases, peak vertical accelerations are higher than the
123

160 Bull Earthquake Eng (2011) 9:157–179
Fig. 4 Large deformations at theSinizzo Lake (42◦17’25.23”N–13◦34’34.73”E)
Fig. 5 Rock falls at the Sinizzo Lake (42◦17’25.23”N–13◦34’34.73”E)
horizontal ones, as in the case of AQK station (Fig. 13). Also, the strong portions of verticaland horizontal motions occurred almost simultaneously due to the short travel paths of P andS waves from the fault to the ground surface. This is evident because the severe horizontalmotion start only about 1s after the vertical one, with a predominant period of 0.4–0.7 s for Swaves, while for P waves the predominant period is in the range 0.1–0.2 s. These features aresimilar to fundamental frequencies of vibration of one-to-eight-story buildings in L’Aquila
123

Bull Earthquake Eng (2011) 9:157–179 161
Fig. 6 Block detached from a rock cliff above the Stiffe Caves (after Stewart et al. 2009)
Fig. 7 Sink hole in L’Aquila (after Aydan et al. 2009)
Fig. 8 Liquefaction occurred at Vittorito (latitude 42.128, longitude 13.817)
123

162 Bull Earthquake Eng (2011) 9:157–179
Fig. 9 General view of the Aterno valley and bordering mountains showing the location of the strong-motionstations belonging to the DPC array (AQG, AQA, AQV, AQM, AQF, AQP); in the rear the station AQK in thecity of L’Aquila (vertical scale exaggerated)
Table 1 Recorded groundmotion parameters in terms ofmaximum Peak GroundAcceleration (PGA) and PeakGround Velocity (PGV)
Station PGA (g) PGV (cm/s)
AQG_NS 0.51 35.9
AQG_EW 0.47 31.2
AQG_UP 0.24 10.4
AQA_NS 0.45 24.5
AQA_EW 0.40 32.0
AQA_UP 0.47 9.39
AQV_NS 0.54 40.4
AQV_EW 0.65 36.7
AQV_UP 0.52 12.5
AQK_NS 0.35 36.3
AQK_EW 0.33 30.3
AQK_UP 0.37 19.8
and can be particularly dangerous for the weak non-ductile systems, such as the many oldmasonry structures in the area (Çelebi et al. 2010). Detail of time histories of AQV recordsare reported in Fig. 14. The predominant period for both NS and EW horizontal componentsis about 0.5 s. Figure 15 shows the Fourier Spectra for all the four considered stations. Thepredominant frequency is between 1 and 2.5 Hz for the horizontal components. In particularfor the AQV horizontal components it is 2 Hz as can be easily derived by Fig. 14. A compari-son between the response spectra of AQV and AQG horizontal E–W and N–S components isreported in Fig. 16. From this figure it is possible to see that for AQV station resting on soilformation there are some peaks ranging from a period T = 0.15–0.5 s and for AQG stationresting on soft rock the predominant period is T = 0.25 s for E–W component and it is rangingfrom T = 0.2–0.5 s for N–S component.
In Table 1 are reported the recorded ground motion parameters in terms of maximum PeakGround Acceleration (PGA) and Peak Ground Velocity (PGV) for the three components of
123

Bull Earthquake Eng (2011) 9:157–179 163
Fig. 10 Time history of the accelerations recorded at AQV station (42.377N;13.344E)—epicentral distance4.8 km
each four stations considered. As regards the PGA, the recorded maximum value is 0.65 g forthe EW component of the AQV recording station, located on the alluvial soil, in the middleof the Aterno Valley. As regards the AQK station, located in stiff soil on the city of L’Aquila,the maximum recorded peak ground acceleration in the NS component, is 0.35 g. It must bestressed that L’Aquila is located in the vicinity of the normal fault, and because of that therecorded vertical acceleration (UP) of 0.37 g is slight bigger than the horizontal one in NScomponent. It is interesting to compare the recorded accelerations with those predicted by theItalian Code for buildings (NTC, 2008), at L’Aquila city (Fig. 17). According to this Code,the peak ground acceleration, which is the acceleration with less than 10% of probability ofoccurrence in 50 years, is ag = 0.250–0.275 g as can be read in the specific site by the Code,as shown in Fig. 17.
To compute the design seismic acceleration for buildings, according to the Italian Code,it has been detected the soil type of the recording stations. Following the indications of theTable 3.2.II of the Code (NTC, 2008), which defines five categories of subsoil to which cor-respond a different range of average shear wave velocity Vs30 in the upper 30 m of soil, thesoil type is B for AQK, AQG and AQV. In particular it has been calculated a Vs30 = 680 m/sfor AQG station while it has been obtained the value of Vs30 = 470 m/s for AQV station.
123

164 Bull Earthquake Eng (2011) 9:157–179
Fig. 11 Time history of the accelerations recorded at AQA station (42.376N;13.339E)—epicentral distance5.8 km
The stratigraphic amplification factor SS for soil type B varies in the range 1.00–1.20.In particular the computed value for both AQG and AQV stations is SS = 1.14. Hence themaximum value of design ground acceleration predicted by the Italian code for both AQGand AQV stations is a(g) = 0.31 g.
Comparing the design acceleration values predicted by the code with the recorded ones(see Table 1), it clearly appears that the latter AQG (N–S = 0.51 g, E–W = 0.47 g) and AQV(N–S = 0.54 g, E–W = 0.65 g) are quite higher, while in AQK (located in the city of L’Aquila),the 0.35 g recorded acceleration quite agrees with the predicted one (0.31 g).
3 Dynamic soil properties with particular reference to the AQG and AQV stations
The subsoil configurations at the AQG and AQV stations, where the highest accelerationswere recorded, are described by Di Capua et al. (2009). The city of L’Aquila is settledon cemented breccias having thickness of some tens of meters, overlying lacustrine sedi-ments which rest on limestone. The Aterno valley is partly filled with Pleistocene lacustrinedeposits formed by a complex sequence of pelitic and coarse-grained units overlying the
123

Bull Earthquake Eng (2011) 9:157–179 165
Fig. 12 Time history of the accelerations recorded at AQG station (42.373N;13.337E)—epicentral distance4.3 km
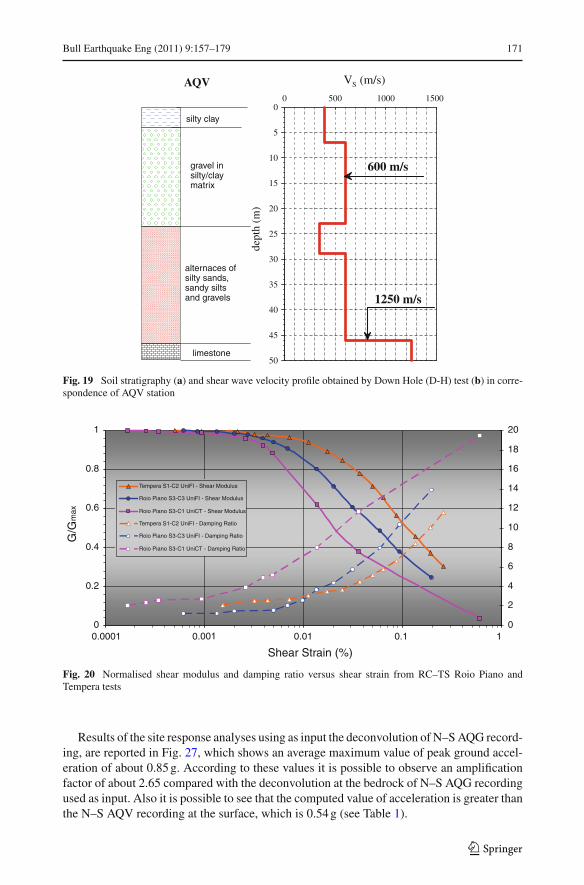
limestone bedrock. These deposits are topped by quaternary alluvial deposits. The stationAQG is located on calcareous rock, while AQV is located on the recent alluvial deposits ofthe Aterno river. Further, shear wave velocity profiles have been obtained in correspondenceof the stations AQG (Fig. 18) and AQV (Fig. 19) by performing respectively the down-hole(DH) (G. Lanso, 2010, Personal communication) and cross hole (CH) tests. It can be seenfrom Fig. 18 that the conventional bedrock (Vs = 800 m/s) is located at 25 m depth (AQGstation), while from Fig. 19, located in the center of the Valley, the conventional bedrock islocated at a depth of 46 m (AQV station).
To define the non linear dynamic soil properties for the soil response analyses, somedynamic laboratory tests were carried out on undisturbed samples. Among these, the resultson similar soils sampled at the Roio Piano and Tempera sites are considered for performingthe site response analysis. The specimens were isotropically consolidated to the estimatedin situ stress. At the end of the consolidation stage, dynamic torsional shear tests (RCT),cyclic loading torsional shear test (CLTST) and double specimen direct simple shear tests(DSDSS) were performed with increasing strain levels, in order to investigate the behaviourof the soils from small to medium strains. As common, the non-linear pre-failure behaviour
123

166 Bull Earthquake Eng (2011) 9:157–179
Fig. 13 Time history of the accelerations recorded at AQK station (42.345N;13.401E)—epicentral distance5.6 km
has been interpreted with the linear equivalent model, characterised by the variation of theshear modulus, G, and the damping ratio, D, with the shear strain level, γ .
Figure 20 shows the normalised shear modulus and damping ratio versus shear strainfrom RC–TS Tempera tests and Roio Piano tests on S3C1 and on S3C3 samples. The RoioPiano S3C1 sample has been tested at the Geotechnical Laboratory of the University ofCatania.
As a comparison for the soil response analyses the degradation G-γ and damping D-γcurves, proposed by Kokusho et al. in Kokusho and Esashi (1981), reported in Fig. 21, arealso used.
4 Deconvolution of AQG station down to the bedrock
The shear waves profile obtained by down hole test (Fig. 18) for AQG soft rock site havebeen used to make the deconvolution at the bedrock of the AQG recording. The unit weightof soil used in the numerical analysis was 25 kN/m3.
The deconvolution has been made by using 1-D frequency domain site response analysiscode EERA (Bardet et al. 2000). Analyses have been made considering the bedrock located
123

Bull Earthquake Eng (2011) 9:157–179 167
Fig. 14 Detail of time history of acceleration for AQV recording station (42.377N;13.344E)—(NS com-ponent: PGA = 550.12 cm/s2 at t = 8.88 s); (EW component: PGA = 662.61 cm/s2 at t = 8.64 s); (UpDwPGA = 507.79 cm/s2 at t = 7.16 s)
at the depth of 25 m, where a Vs value of about 1000 m/s has been measured by down holetest (Fig. 18). Results of the deconvolution of the AQG recordings are reported in Figs. 22,23 respectively for E–W (average 0.26 g) and N–S (average 0.32 g) components, using nor-malised shear modulus and damping ratio versus shear strain curves obtained by laboratorytests (for samples taken at Roio Piano and Tempera) and by the average proposed curves byKokusho et al. The results of these analyses show different values of G(γ ) and D(γ ) prop-erties, so that the effects of uncertainty on soil dynamic characterisation must be evaluatedand related to soil response analysis.
It is interesting to notice that the peak ground acceleration at the conventional bedrock,located at 25 m depth, obtained by the deconvolution of the N–S component of the AQGrecording using Roio Piano dynamic characterisation curves, reach values of about 0.31 g.The same value was obtained in AQG site as maximum value of acceleration using theacceleration of 0.275 g predicted by the Code (NTC, 2008) times the stratigraphic amplifi-cation factor SS = 1.14 for soil type B. Furthermore the Fourier spectra of the deconvolutedearthquake are reported in Figs. 24, 25.
123

168 Bull Earthquake Eng (2011) 9:157–179
Fig. 15 Fourier spectra for: a AQV station (42.377N;13.344E); b AQA station (42.376N;13.339E); c AQGstation (42.373N;13.337E); d AQK station (42.345N;13.401E)
123

Bull Earthquake Eng (2011) 9:157–179 169
0 1 2 30
0.5
1
1.5
2
ξ = 5%comp. NS
0 1 2 30
0.5
1
1.5
2
S a (
g)S a
(g)
ξ = 5%comp. EW
Period (s)
Period (s)
(a)
(b)
AQG (cat. A)AQV (cat. B)
AQG (cat. A)AQV (cat. B)
Fig. 16 Response spectra of AQV and AQG horizontal component: a E–W; b N–S
5 Site effects evaluation at AQV station
Seismic response analyses were carried at the AQV station, located on alluvial soil in themiddle of Aterno valley. The subsoil model was built according to the geotechnical data avail-able for AQV station subsoil conditions shown in Fig. 19. The unit weight was increasedwith depth and with soil type from 19 up to 22 kN/m3. The bedrock was located at a depthof 46 m, where the shear waves velocity becomes higher than 800 m/s. Instead of making adeconvolution of the AQV record at the conventional bedrock located at a depth of 46 m, asinput motion has been used the deconvoluted acceleration time history at the conventionalbedrock at the AQG station. This deconvolution made in a more homogeneous soil with Vsranging from 500 up to 1000 m/s without big contrast of shear waves velocity between soillayers, appears more reliable than a deconvolution at the AQV station where bigger contrastof shear waves velocity between soil layers are present ranging from 300 up to 1250 m/s.
Results of the site response analyses using as input the deconvolution of E–W AQG record-ing, show an average value of peak ground acceleration of about 0.67 g (see Fig. 26), which isin good agreement with the recorded maximum acceleration of 0.65 g (see Table 1). Accord-ing to these value it is possible to observe an amplification factor of about 2.58 comparedwith the input motion.
123

170 Bull Earthquake Eng (2011) 9:157–179
Fig. 17 Predicted Seismic Action by Italian Code (2008) at the bedrock: a(g) = 0.250–0.275 at L’Aquila
Fig. 18 Soil stratigraphy (a) and shear wave velocity profile obtained by Down Hole (D-H) test (b) in corre-spondence of AQG station (after (G. Lanso, 2010, Personal communication)
123
Bull Earthquake Eng (2011) 9:157–179 171
0 500 1000 1500
VS (m/s)
50
45
40
35
30
25
20
15
10
5
0
dept
h (m
)
silty clay
gravel in silty/clay matrix
alternaces ofsilty sands, sandy silts and gravels
limestone
1250 m/s
600 m/s
AQV
Fig. 19 Soil stratigraphy (a) and shear wave velocity profile obtained by Down Hole (D-H) test (b) in corre-spondence of AQV station
0
0.2
0.4
0.6
0.8
1
10.10.010.0010.0001
Shear Strain (%)
G/G
max
0
2
4
6
8
10
12
14
16
18
20
Tempera S1-C2 UniFI - Shear Modulus
Roio Piano S3-C3 UniFI - Shear Modulus
Roio Piano S3-C1 UniCT - Shear Modulus
Tempera S1-C2 UniFI - Damping Ratio
Roio Piano S3-C3 UniFI - Damping Ratio
Roio Piano S3-C1 UniCT - Damping Ratio
Fig. 20 Normalised shear modulus and damping ratio versus shear strain from RC–TS Roio Piano andTempera tests
Results of the site response analyses using as input the deconvolution of N–S AQG record-ing, are reported in Fig. 27, which shows an average maximum value of peak ground accel-eration of about 0.85 g. According to these values it is possible to observe an amplificationfactor of about 2.65 compared with the deconvolution at the bedrock of N–S AQG recordingused as input. Also it is possible to see that the computed value of acceleration is greater thanthe N–S AQV recording at the surface, which is 0.54 g (see Table 1).
123

172 Bull Earthquake Eng (2011) 9:157–179
0
0.2
0.4
0.6
0.8
1
10.10.010.0010.00010.00001
Shear Strain (%)
G/G
max
0
2
4
6
8
10
12
14
Kokusho et al. 1981 (upper curve) - Shear Modulus
Kokusho et al. 1981 (medium curve) - Shear Modulus
Kokusho et al. 1981 (lower curve) - Shear Modulus
Seed et al. 1984 - Shear Modulus
Kokusho et al. 1981 (upper curve) - Damping Ratio
Kokusho et al. 1981 (medium curve) - Damping Ratio
Kokusho et al. 1981 (lower curve) - Damping Ratio
Seed et al. 1984 - Damping Ratio
Fig. 21 Normalised shear modulus and damping ratio versus shear strain from Kokusho et al. (1981) andfrom Seed et al. (1984) proposed curves
-0.255-0.257
0,272
-0,4
-0,3
-0,2
-0,1
0
0,1
0,2
0,3
0,4
0 10 20 30 40 50 60
Acc
eler
atio
n (g
)
Time (sec)
Roio Piano S3 C3
Tempera S1 C2
Kokusho et al. 1981
Fig. 22 Time history deconvoluted of the AQG recordings for E–W component according to different deg-radation curves
0.316
0.310
-0,330
-0,4
-0,3
-0,2
-0,1
0
0,1
0,2
0,3
0,4
0 10 20 30 40 50 60
Acc
eler
atio
n (g
)
Time (sec)
Roio Piano S3 C3
Tempera S1 C2
Kokusho et al. 1981
Fig. 23 Time history deconvoluted of the AQG recordings for N–S component according to different degra-dation curves
123

Bull Earthquake Eng (2011) 9:157–179 173
0
0,01
0,02
0,03
0,04
0,05
0,06
0,07
0,08
0,09
0,1
0 2 4 6 8 10
Spe
ctra
l Acc
eler
atio
n (g
)
Frequency [Hz]
Roio Piano - S3 C3
Tempera - S1C2
Kokusho etal. 1981
Fig. 24 Fourier spectrum of the deconvoluted AQG recordings for E–W component according to differentdegradation curves
0
0,01
0,02
0,03
0,04
0,05
0,06
0,07
0,08
0,09
0,1
0 1 2 3 4 5 6 7 8 9 10
Spe
ctra
l Acc
eler
atio
n (g
)
Frequency [Hz]
Roio Piano -S3 C3
Tempera -S1 C2
Kokusho et al. 1981
Fig. 25 Fourier spectrum of the deconvoluted AQG recordings for N–S component according to differentdegradation curves
-0.704-0.710-0,618
-0,8
-0,6
-0,4
-0,2
0
0,2
0,4
0,6
0,8
0 10 20 30 40 50 60
Acc
eler
atio
n (g
)
Time (sec)
Roio Piano S3 C3
Tempera S1 C2
Kokusho et al. 1981
Fig. 26 Time history of the site response analysis at the AQV station, for the E–W component according tothe shear waves profiles of Fig. 19 and different degradation curves
123

174 Bull Earthquake Eng (2011) 9:157–179
0.8680.8720.809
-1
-0,8
-0,6
-0,4
-0,2
0
0,2
0,4
0,6
0,8
1
0 10 20 30 40 50 60
Acc
eler
atio
n (g
)
Time (sec)
Roio Piano S3 C3
Tempera S1 C2
Kokusho et al. 1981
Fig. 27 Time history of the site response analysis at the AQV station, for the N–S component according tothe shear waves profiles of Fig. 19 and different degradation curves
0
5
10
15
20
25
30
35
40
45
50
Dep
th (
m)
Shear wave velocity (m/s)
0
5
10
15
20
25
30
35
40
45
50
0 500 1000 0 500 1000
Dep
th (
m)
Shear wave velocity (m/s)(a) (b)
Fig. 28 Shear waves profile according to soil stratigraphy of Fig. 19 (a) and for weaker soil (b)
Further analyses have been made using different shear waves profiles, from that evaluatedby Cross Hole test and reported in Fig. 19. Generally some uncertainty on the evaluationof shear waves profiles arise from different types of tests such as D-H, C-H and SDMT(Maugeri and Grasso 2009) and on different care on performing it. According to soil stratig-raphy obtained by the boring, the shear wave profile was assumed as that reported in Fig. 28a.Furthermore, to explain so big amplification factors (2.58 for E–W component and 2.65 forN–S component), a weaker soil profile has been considered, as reported in Fig. 28b.
Results of the site response analyses using as input the deconvolution of E–W AQGrecording and the shear waves profile of Fig. 28a, show an average value of peak accelera-tion of about 0.66 g (see Fig. 29), which is in good agreement with the recorded maximumacceleration of 0.65 g (see Table 1). Comparing the computed value with the deconvolution
123

Bull Earthquake Eng (2011) 9:157–179 175
0.6810.6900,612
-0,8
-0,6
-0,4
-0,2
0
0,2
0,4
0,6
0,8
0 10 20 30 40 50 60
Acc
eler
atio
n (g
)
Time (sec)
Roio Piano S3 C3
Tempera S1 C2
Kokusho et al. 1981
Fig. 29 Time history of the site response analysis at the AQV station, for the E–W component according tothe shear waves profiles of Fig. 28a and different degradation curves
Table 2 Results of the site response analyses at the AQV station using as input the deconvolution at thebedrock of AQG recording station and the shear waves profiles of Fig. 28
Input motion Vs profile Average peakacceleration (g)
Recordedmaximumacceleration (g)
Amplificationfactor
Deconvolution of E–W AQG Figure 28a 0.66 0.65 2.54
Deconvolution of N–S AQG Figure 28a 0.92 0.54 2.88
Deconvolution of E–W AQG Figure 28b 0.63 0.65 2.42
Deconvolution of N–S AQG Figure 28b 0.60 0.54 1.88
0.9090.9950,865
-1
-0,5
0
0,5
1
1,5
0 10 20 30 40 50 60
Acc
eler
atio
n (g
)
Time (sec)
Roio Piano S3 C3
Tempera S1 C2
Kokusho et al. 1981
Fig. 30 Time history of the site response analysis at the AQV station, for the N–S component according tothe shear waves profiles of Fig. 28a and different degradation curves
at the bedrock of E–W AQG recording used as input, it is possible to observe an amplificationfactor of about 2.54 (Table 2).
It is possible also to observe that for the N–S response analysis, the average maximumvalue of peak acceleration is of about 0.92 g (see Fig. 30). Comparing the computed valuewith the deconvolution at the bedrock of N–S AQG recording used as input, it is possi-ble to observe an amplification factor of about 2.88. For the N–S component, the recordedacceleration is lower than the evaluated one, for soil profile reported in Fig. 28a (Table 2).
123

176 Bull Earthquake Eng (2011) 9:157–179
0.510
0.7160.673
-0,8
-0,6
-0,4
-0,2
0
0,2
0,4
0,6
0,8
0 10 20 30 40 50 60
Acc
eler
atio
n (g
)
Time (sec)
Roio Piano S3 C3
Tempera S1 C2
Kokusho et al. 1981
Fig. 31 Time history of the site response analysis at the AQV station, for the E–W component according tothe shear waves profiles of Fig. 28b and different degradation curves
0.518
-0.712
0.587
-0,8
-0,6
-0,4
-0,2
0
0,2
0,4
0,6
0,8
0 10 20 30 40 50 60
Acc
eler
atio
n (g
)
Time (sec)
Roio Piano S3 C3
Tempera S1 C2
Kokusho et al. 1981
Fig. 32 Time history of the site response analysis at the AQV station, for the N–S component according tothe shear waves profiles of Fig. 28b and different degradation curves
Results of the site response analyses using as input the deconvolution of E–W AQGrecording and the shear waves profile of Fig. 28b, show an average value of peak accelera-tion of about 0.63 g (see Fig. 31), which is in good agreement with the recorded maximumacceleration of 0.65 g (see Table 1). Comparing the computed value with the deconvolutionat the bedrock of E–W AQG recording used as input, it is possible to observe an amplificationfactor of about 2.42 (Table 2). It is possible also to observe that for the N–S response analysis,the average maximum value of peak acceleration is of about 0.60 g (see Fig. 32), which is insome agreement with the recorded maximum acceleration of 0.54 g (see Table 1). Comparingthe computed value with the deconvolution at the bedrock of N–S AQG recording used asinput, it is possible to observe an amplification factor of about 1.88 (Table 2).
6 Discussions
This paper focuses about the predicted acceleration at the bedrock given by the Italian Codefor buildings (NTC, 2008) at L’Aquila city in comparison with the recordings during themoderate April 6, 2009 earthquake (ML = 5.8). Very important is the evaluation of reliabil-ity of amplification factors given by the Italian Regulation (NTC, 2008) and by Eurocode 8(UNI 1998). To this aim, a simplified 1-D response analysis was made using the computer
123

Bull Earthquake Eng (2011) 9:157–179 177
code EERA (2000). Perhaps it should be better to make refined analysis using 2-D or 3-Dcodes, but the basin effects are not taken into account in the Italian Regulation and Eurocode.Furthermore the conventional bedrock across the Aterno Valley seems to be very shallowand practically flat on the middle of the Valley, where AQV Station is located.
The recorded and the computed values of maximum acceleration show an average ampli-fication factor of about Ss = 2.5, which is considerable higher for soil type B than theSs = 1.14 given by the Italian Code for buildings and than the Ss = 1.20, given by theEurocode.
Another aim of the paper is the analysis of the effects on soil response results due to theuncertainty in evaluating soil properties (Maugeri and Grasso 2009). Some uncertainties arisefrom the evaluation of shear waves profile by Cross-Hole, Down-Hole, SDMT, etc. Threedifferent soil profiles have been considered at AQV site (see Figs. 19, 28). The first profile isevaluated by Cross-Hole test (Fig. 19) which is not totally consistent with the boring profile.The second profile (Fig. 28a) is consistent with the boring profile. The third profile (Fig. 28b)regards a weaker soil according to a high value of amplification factor evaluated by responseanalysis.
Another source of uncertainty is the evaluation of the non-linear soil behaviour. Some-times it is possible to use literature curves, such as that of Kokusho (1981) reported in Fig. 21.But it must be recommended to evaluate soil non linearity by laboratory tests, such as: Reso-nant Column Test (RCT), Cyclic Loading Torsional Shear Test (CLTST), Double SpecimenDirect Simple Shear Tests (DSDSS), Cyclic Loading Triaxial Test (CLTx), etc. Three differ-ent curves for evaluating soil non linearity have been used for soil response analysis: one istaken from literature and two are experimental curves evaluated for the L’Aquila soil. Theresults obtained are summarized in the conclusion.
The Italian Regulation and the Eurocode 8 prescribe a topographic amplification factor ST
depending on the slope angle and depending on the location inside the slope (crest proximityor in the middle of the slope). The evaluation of the ST through the L’Aquila earthquakerecordings was not possible because the records of AQM, AQF and AQP stations are not sofar available, but considering that 0.65 g was recorded in AQV station located in the centraland flat part of the valley, the recordings in the AQM, AQF and AQV stations could be greaterthan the record in AQV by the amplification factor ST equal to 1.2–1.4.
It must be stressed that, while the horizontal acceleration at the bedrock was in some agree-ment with the predicted one by the Italian Regulation, the vertical component of accelerationwas much higher than that recommended by the Italian Code for the design of geotechnicalstructures (slope, earth retaining wall, etc.). In general it is recommended by Italian Code andEurocode 8, to consider a vertical acceleration equal to 50% of the horizontal one. Becauseof the occurrence of a normal fault in the proximity of L’Aquila City, the recorded verticalacceleration was much higher than that recommended by the Regulations and its value wasvery similar to horizontal acceleration in the AQK station, located in the city of L’Aquila,and on the AQV station, located in the middle of Aterno River Valley. This last aspect, whichis outside the scope of this paper, must be considered by the Code in the future for a bet-ter design of geotechnical structures and of buildings resting on the proximity of normalfaults.
Finally some other aspects such as directivity effects were not considered in the paper, aswell is not considered in the Italian Regulation and in the Eurocode. The only aspects con-sidered are that mentioned by the codes to evaluate the reliability of the codes to guidethe design engineers in the evaluation of seismic action for geotechnical and structuraldesign.
123

178 Bull Earthquake Eng (2011) 9:157–179
7 Conclusions
The acceleration predicted by the Italian Code for buildings (NTC, 2008) at L’Aquila city,with the probability of occurrence less than 10% in 50 years, is ag = 0.250–0.275 g at thebedrock.
During the April 6, 2009 earthquake (ML = 5.8), ground accelerations were recorded onsoft rock at the AQG station and in some locations on soil deposits. In order to evaluate theacceleration at the bedrock underlining soil deposits and/or soft rock, a deconvolution of thetime history of the recorded acceleration at AQG station has been made. The deconvolutionof the AQG station record at the bedrock located at a depth of 25 m gives the value of 0.26 gin the E–W direction and 0.32 g in the N–S direction (with an average value of 0.29 g), whichis in good agreement with the values predicted by the new Italian Regulation (0.250–0.275 g)on outcropping rock.
According to the new Italian Regulation, at L’Aquila city the soil amplification factor isSs = 1.14, for soil type B on the basis of the average shear waves velocity (Vs30). Usingthis site amplification value, the horizontal acceleration at the surface must be 0.295 ×1.14 = 0.34 g, which is in good agreement with the acceleration recorded at the AQK sta-tion located in the city centre of L’Aquila, while the recorded vertical acceleration is veryhigh.
The recorded horizontal acceleration at AQV station of 0.65 g in the E–W direction, wasconsiderably much higher than that predicted by the New Italian Regulation.
To explain the high value of the recorded acceleration in AQV station, a site responseanalysis has been performed, considering as input motion at the bedrock situated at 46 m, thedeconvoluted time history in AQG station. The soil response analysis has been made consid-ering the Vs soil profile obtained by a Cross Hole test and three soil non linear curves, onegiven by literature and two evaluated by Resonant Column Tests performed on undisturbedsamples taken on L’Aquila soil. The response analysis shows an average amplification factorequal to 2.58 in the E–W direction and 2.65 in the N–S direction, considerably higher thanthat predicted by the Italian Regulation.
To evaluate the possible uncertainties in the evaluation of shear waves profile, the effectsof three different shear waves profiles in the soil response analysis were considered. Amongthe shear waves profiles considered, the weaker one shows a soil response in a better agree-ment with the recorded one. In particular the soil response shows an acceleration of 0.63 g inthe E–W direction in a good agreement with the 0.65 g recorded in the AQV station, and anacceleration equal to 0.60 g in the N–S direction, which is in some agreement with the 0.54 grecorded in AQV station.
The uncertainty on soil response due to soil non linearity is about 8% in both the direc-tions, while the uncertainty due to the shear waves profile is about 2% in the E–W directionand about 18% in the N–S direction.
From the analysis can be argued that when the soil is almost homogeneous, the amplifi-cation factors given by the Italian Code for buildings and Eurocode 8 works almost properly,while when some different soil layers are present, particularly when an inversion of shearwaves velocity occurs, Vs30 could be not a representative parameter of soil response analysisand so a response analysis, on the basis of measured shear waves profile, is recommended.This site response analysis must be performed on the basis of careful evaluation of shearwaves profiles and soil non linearity.
123

Bull Earthquake Eng (2011) 9:157–179 179
References
Aydan O, Kumsar H, Toprak S, Barla G (2009) Characteristics of 2009 L’Aquila earthquake with an emphasison earthquake prediction and geotechnical damage. Personal Communication of the Draft
Bardet JP, Ichii K, Lin CH (2000) EERA: a computer program for equivalent-linear earthquake site responseanalyses of layered soil deposits, user manual. University of Southern California, 40 pp
Çelebi M, Bazzurro P, Chiaraluce L, Clemente P, Decanini L, DeSortis A, Ellsworth W, Gorini A, Kalkan E,Marcucci S, Milana G, Mollaioli F, Olivieri M, Paolucci R, Rinaldis D, Rovelli A, Sabetta F, StephensC (2010) Recorded Motions of the 6 April 2009 Mw 6.3 L’Aquila, Italy, Earthquake and Implicationsfor Building Structural Damage: Overview. Earthquake Spectra, Volume 26, No. 3, pp 651–684, August2010 © 2010, Earthquake Engineering Research Institute
Di Capua G, Lanzo G, Luzi L, Pacor F, Paolucci R, Peppoloni S, Scasserra G, Puglia R (2009) Caratteristichegeologiche e classificazione di sito delle stazioni accelerometriche della RAN ubicate a L’Aquila. ReportS4 Project (http://www.esse4.mi.ingv.it/), June 2009
D.M. (2008) Norme Tecniche per le Costruzioni (Italian Technical Regulation for Constructions). D.M.14.01.2008, published on Gazzetta Ufficiale, 4 Feb 2008
EERA (2000) http://www.gees.usc.edu/GEES/Software/EERA2000/Default.htmKokusho T, Esashi Y (1981) Cyclic triaxial tests on sands and coarse materials. X ICSMFE 1:673–676Maugeri M, Grasso S (2009) The role of soil properties in performance-based design. In: Proceedings of
the first international conference on performance-based design in earthquake geotechnical engineering.Tokyo 15–18 June 2009. (Theme Lecture)
Monaco P, Totani G, Barla G, Cavallaro A, Costanzo A, D’Onofrio A, Evangelista L, Foti S, Grasso S, LanzoG, Madiai C, Maraschini M, Marchetti S, Maugeri M, Pagliaroli A, Pallara O, Penna A, Saccenti A,Santucci de Magistris F, Scasserra G, Silvestri F, Simonelli AL, Simoni G, Tommasi P, Vannucchi G,Verrucci L (2009) Geotechnical aspects of 2009 L’Aquila earthquake. In: Proceedings of the earthquakegeotechnical engineering satellite conference, 2–3 October 2009 in Alexandria, Egypt
Monaco P, Santucci De Magistris F, Grasso S, Marchetti S, Maugeri M, Totani G (2010) Analysis of theliquefaction phenomena in the village of Vittorito (L’aquila). BEE Special Issue on L’Aquila Earthquake
Simonelli AL, Sica S, Moccia F, Penna A, Lucadamo C, Mitrione A, Mosca P, Moscato T, Rotella M, SpatolaMG, Zarra S (2009) Rapporto preliminare sugli effetti indotti sull’ambiente fisico dalla sequenza sismicadell’aquilano—Ver. 1.5, Working group AGI-ReLUIS, http://www.reluis.it
Stewart JP, Di Capua G, Kayen RE, Scott Kieffer D, Button E, Biscontin G, Scasserra G, Lanzo G, Tommasi P,Pagliaroli A, Silvestri F, d’Onofrio A, Simonelli AL, Puglia R, Mylonakis G, Athanasopoulos G, VlahakisV (eds) (2009) GEER Association Report No. GEER-016, (Version 1. May 6, 2009), Preliminary Reporton the Seismological and Geotechnical Aspects of the April 6 2009 L’Aquila Earthquake in Central Italy,http://www.geerassociation.org
UNI EN (1998) Eurocode 8: Design of structures for earthquake resistance. European Standard. Final draftprEN 1998
123
Related Documents


![Indian Ocean earthquake - tetney.lincs.sch.uk424710]Tsunami_in_the... · • On 26th December 2004, an earthquake of magnitude 9.1 on the Richter scale was recorded in the Indian](https://static.cupdf.com/doc/110x72/5f549f870e90c97ff95d84a8/indian-ocean-earthquake-424710tsunamiinthe-a-on-26th-december-2004.jpg)

