GUIDELINES AND STANDARDS Recommendations for Cardiac Chamber Quantification by Echocardiography in Adults: An Update from the American Society of Echocardiography and the European Association of Cardiovascular Imaging Roberto M. Lang, MD, FASE, FESC, Luigi P. Badano, MD, PhD, FESC, Victor Mor-Avi, PhD, FASE, Jonathan Afilalo, MD, MSc, Anderson Armstrong, MD, MSc, Laura Ernande, MD, PhD, Frank A. Flachskampf, MD, FESC, Elyse Foster, MD, FASE, Steven A. Goldstein, MD, Tatiana Kuznetsova, MD, PhD, Patrizio Lancellotti, MD, PhD, FESC, Denisa Muraru, MD, PhD, Michael H. Picard, MD, FASE, Ernst R. Rietzschel, MD, PhD, Lawrence Rudski, MD, FASE, Kirk T. Spencer, MD, FASE, Wendy Tsang, MD, and Jens-Uwe Voigt, MD, PhD, FESC, Chicago, Illinois; Padua, Italy; Montreal, Quebec and Toronto, Ontario, Canada; Baltimore, Maryland; Cr eteil, France; Uppsala, Sweden; San Francisco, California; Washington, District of Columbia; Leuven, Li ege, and Ghent, Belgium; Boston, Massachusetts The rapid technological developments of the past decade and the changes in echocardiographic practice brought about by these developments have resulted in the need for updated recommendations to the previ- ously published guidelines for cardiac chamber quantification, which was the goal of the joint writing group assembled by the American Society of Echocardiography and the European Association of Cardiovascular Imaging. This document provides updated normal values for all four cardiac chambers, including three- dimensional echocardiography and myocardial deformation, when possible, on the basis of considerably larger numbers of normal subjects, compiled from multiple databases. In addition, this document attempts to eliminate several minor discrepancies that existed between previously published guidelines. (J Am Soc Echocardiogr 2015;28:1-39.) Keywords: Adult echocardiography, Transthoracic echocardiography, Ventricular function, Normal values From the University of Chicago Medical Center, Chicago, Illinois (R.M.L., V.M.-A., K.T.S.); the University of Padua, Padua, Italy (L.P.B., D.M.); Jewish General Hospital, McGill University, Montreal, Quebec, Canada (J.A., L.R.); Johns Hopkins University, Baltimore, Maryland (A.A.); INSERM U955 and H^ opital Henri Mondor, Cr eteil, France (L.E.); Uppsala University, Uppsala, Sweden (F.A.F.); the University of California, San Francisco, San Francisco, California (E.F.); Medstar Washington Hospital Center, Washington, District of Columbia (S.A.G.); University Hospital Leuven, Leuven, Belgium (T.K., J.-U.V.); the University of Li ege Hospital, Li ege, Belgium (P.L.); Massachusetts General Hospital and Harvard Medical School, Boston, Massachusetts (M.H.P.); Ghent University Hospital, Ghent, Belgium (E.R.R.); and the University of Toronto, Toronto, Ontario, Canada (W.T.). The following authors reported no actual or potential conflicts of interest in relation to this document: Jonathan Afilalo, MD, MSc, Anderson Armstrong, MD, MSc, Laura Ernande, MD, PhD, Frank A. Flachskampf, MD, FESC, Steven A. Goldstein, MD, Tatiana Kuznetsova, MD, PhD, Patrizio Lancellotti, MD, PhD, FESC, Victor Mor-Avi, PhD, FASE, Michael H. Picard, MD, FASE, Ernst R. Rietzschel, MD, PhD, Kirk T. Spencer, MD, FASE, Wendy Tsang, MD, and Jens-Uwe Voigt, MD, PhD, FESC. The following authors reported relationships with one or more com- mercial interests: Luigi P. Badano, MD, PhD, FESC, received grants from GE Healthcare, Siemens, and Esaote and serves on the speakers’ bureau for GE Healthcare. Elyse Foster, MD, FASE, received grant support from Abbott Vascular Structural Heart. Roberto M. Lang, MD, FASE, FESC, received grants from and serves on the speakers’ bureau and advisory board for Philips Medical Systems. Denisa Muraru, MD, received research equipment from and served as a consultant for GE Healthcare. Lawrence Rudski, MD, FASE, holds stock in GE. Attention ASE Members: The ASE has gone green! Visit www.aseuniversity.org to earn free continuing medical education credit through an online activity related to this article. Certificates are available for immediate access upon successful completion of the activity. Nonmembers will need to join the ASE to access this great member benefit! Drs Lang and Badano co-chaired the Writing Group. Reprint requests: American Society of Echocardiography, 2100 Gateway Centre Boulevard, Suite 310, Morrisville, NC 27560 (E-mail: [email protected]). 0894-7317/$36.00 Copyright 2015 by the American Society of Echocardiography. http://dx.doi.org/10.1016/j.echo.2014.10.003 1

Welcome message from author
This document is posted to help you gain knowledge. Please leave a comment to let me know what you think about it! Share it to your friends and learn new things together.
Transcript
GUIDELINES AND STANDARDS
From the Univ
K.T.S.); the U
Hospital, Mc
Hopkins Univ
Mondor, Cr�et
University of
Washington
University Ho
Li�ege Hospit
Harvard Med
Hospital, Gh
Ontario, Cana
The following
to this docum
Laura Ernand
MD, Tatiana K
Mor-Avi, PhD
PhD, Kirk T. S
PhD, FESC. T
mercial intere
Healthcare, S
Recommendations for Cardiac ChamberQuantification by Echocardiography in Adults:
An Update from the American Societyof Echocardiography and the European Association
of Cardiovascular Imaging
Roberto M. Lang, MD, FASE, FESC, Luigi P. Badano, MD, PhD, FESC, Victor Mor-Avi, PhD, FASE,Jonathan Afilalo, MD, MSc, Anderson Armstrong, MD, MSc, Laura Ernande, MD, PhD,Frank A. Flachskampf, MD, FESC, Elyse Foster, MD, FASE, Steven A. Goldstein, MD,
Tatiana Kuznetsova, MD, PhD, Patrizio Lancellotti, MD, PhD, FESC, Denisa Muraru, MD, PhD,Michael H. Picard,MD, FASE, Ernst R. Rietzschel,MD, PhD, Lawrence Rudski,MD, FASE, Kirk T. Spencer,MD,FASE, Wendy Tsang, MD, and Jens-Uwe Voigt, MD, PhD, FESC, Chicago, Illinois; Padua, Italy; Montreal, Quebecand Toronto, Ontario, Canada; Baltimore, Maryland; Cr�eteil, France; Uppsala, Sweden; San Francisco, California;
Washington, District of Columbia; Leuven, Li�ege, and Ghent, Belgium; Boston, Massachusetts
The rapid technological developments of the past decade and the changes in echocardiographic practicebrought about by these developments have resulted in the need for updated recommendations to the previ-ously published guidelines for cardiac chamber quantification, which was the goal of the joint writing groupassembled by the American Society of Echocardiography and the European Association of CardiovascularImaging. This document provides updated normal values for all four cardiac chambers, including three-dimensional echocardiography and myocardial deformation, when possible, on the basis of considerablylarger numbers of normal subjects, compiled from multiple databases. In addition, this document attemptsto eliminate several minor discrepancies that existed between previously published guidelines. (J Am SocEchocardiogr 2015;28:1-39.)
Keywords: Adult echocardiography, Transthoracic echocardiography, Ventricular function, Normal values
ersity of Chicago Medical Center, Chicago, Illinois (R.M.L., V.M.-A.,
niversity of Padua, Padua, Italy (L.P.B., D.M.); Jewish General
Gill University, Montreal, Quebec, Canada (J.A., L.R.); Johns
ersity, Baltimore, Maryland (A.A.); INSERM U955 and Hopital Henri
eil, France (L.E.); Uppsala University, Uppsala, Sweden (F.A.F.); the
California, San Francisco, San Francisco, California (E.F.); Medstar
Hospital Center, Washington, District of Columbia (S.A.G.);
spital Leuven, Leuven, Belgium (T.K., J.-U.V.); the University of
al, Li�ege, Belgium (P.L.); Massachusetts General Hospital and
ical School, Boston, Massachusetts (M.H.P.); Ghent University
ent, Belgium (E.R.R.); and the University of Toronto, Toronto,
da (W.T.).
authors reported no actual or potential conflicts of interest in relation
ent: Jonathan Afilalo, MD, MSc, Anderson Armstrong, MD, MSc,
e, MD, PhD, Frank A. Flachskampf, MD, FESC, Steven A. Goldstein,
uznetsova, MD, PhD, Patrizio Lancellotti, MD, PhD, FESC, Victor
, FASE, Michael H. Picard, MD, FASE, Ernst R. Rietzschel, MD,
pencer, MD, FASE, Wendy Tsang, MD, and Jens-Uwe Voigt, MD,
he following authors reported relationships with one or more com-
sts: Luigi P. Badano, MD, PhD, FESC, received grants from GE
iemens, and Esaote and serves on the speakers’ bureau for GE
Healthcare. Elyse Foster, MD, FASE, received grant support from Abbott Vascular
Structural Heart. Roberto M. Lang, MD, FASE, FESC, received grants from and
serves on the speakers’ bureau and advisory board for Philips Medical Systems.
Denisa Muraru, MD, received research equipment from and served as a consultant
for GE Healthcare. Lawrence Rudski, MD, FASE, holds stock in GE.
Attention ASE Members:
The ASE has gone green! Visit www.aseuniversity.org to earn free continuing
medical education credit through an online activity related to this article.
Certificates are available for immediate access upon successful completion
of the activity. Nonmembers will need to join the ASE to access this great
member benefit!
Drs Lang and Badano co-chaired the Writing Group.
Reprint requests: American Society of Echocardiography, 2100 Gateway Centre
Boulevard, Suite 310, Morrisville, NC 27560 (E-mail: [email protected]).
0894-7317/$36.00
Copyright 2015 by the American Society of Echocardiography.
http://dx.doi.org/10.1016/j.echo.2014.10.003
1
Abbreviations
AP = Anteroposterior
ASE = American Society ofEchocardiography
BSA = Body surface area
CMR = Cardiac magneticresonance
DTI = Doppler tissue imaging
EACVI = European
Association of Cardiovascular
Imaging
EDV = End-diastolic volume
EF = Ejection fraction
ESV = End-systolic volume
FAC = Fractional area change
GLS = Global longitudinal
strain
I-I = Inner edge–to–inner edge
IVC = Inferior vena cava
LA = Left atrial
L-L = Leading edge–to–
leading edge
LV = Left ventricular
MDCT = Multidetector
computed tomography
PW = Pulsed-wave
RA = Right atrial
RIMP = Right ventricular index
of myocardial performance
RV = Right ventricular
RWT = Relative wall thickness
STE = Speckle-tracking
echocardiography
TAPSE = Tricuspid annular
plane systolic excursion
TAVI = Transcatheter aorticvalve implantation
TAVR = Transcatheter aortic
valve replacement
TEE = Transesophageal
echocardiography
3D = Three-dimensional
3DE = Three-dimensional
echocardiography
TTE = Transthoracic
echocardiography
2D = Two-dimensional
2DE = Two-dimensional
echocardiography
2 Lang et al Journal of the American Society of EchocardiographyJanuary 2015
TABLE OF CONTENTS
I. The Left Ventricle 31. Measurement of LV
Size 31.1. Linear Measure-
ments 31.2. Volumetric Measure-
ments 31.3. Normal Reference
Values for 2DE 61.4. Normal Reference
Values for 3DE 6Recommendation 6
2. LV Global Systolic Func-tion 6
2.1. Fractional Short-ening 6
2.2. EF 72.3. Global Longitudinal
Strain (GLS) 72.4. Normal Reference
Values 7Recommendations 10
3. LV Regional Func-tion 10
3.1. Segmentation of theLeft Ventricle 10
3.2. Visual Assess-ment 11
3.3. Regional Wall Motionduring Infarction andIschemia 11
3.4. Regional Abnormalitiesin the Absence of Cor-onary Artery Dis-ease 11
3.5. Quantification ofRegional Wall MotionUsing Doppler andSTE 11
Recommendations 124. LV Mass 13
Recommendations 16II. The Right Ventricle 16
5. General Recommenda-tions for RV Quantifica-tion 16
6. Essential Imaging Win-dows and Views 16
7. RV Measurements 177.1. Linear Measure-
ments 177.2. Volumetric Measure-
ments 17Recommendations 17
8. RV Systolic Func-tion 19
8.1. RIMP 198.2. TAPSE 198.3. RV 2D FAC 198.4. DTI-Derived Tricuspid
Lateral Annular SystolicVelocity 20
8.5. RV Strain and Strain Rate 20Recommendations 20
8.6. RV 3D EF 20Recommendation 20III. The Left and Right Atria 20
9. LA Measurements 249.1. General Considerations for LA Size 249.2. Linear Dimensions and Area Measurements 259.3. Volume Measurements 259.4. Normal Values of LA Measurements 25
Recommendations 2810. Right Atrial measurements 28
Recommendations 28IV. The Aortic Annulus and Aortic Root 28
11. The Aortic Annulus 2812. The Aortic Root 3013. Identification of Aortic Root Dilatation 32
Recommendations 32V. The Inferior Vena Cava 32
Notice and Disclaimer 33References 33Appendix 39.e1Methods 39.e1Echocardiographic Measurements 39.e1Statistical Analysis 39.e1
The quantification of cardiac chamber size and function is the corner-stone of cardiac imaging, with echocardiography being the mostcommonly used noninvasive modality because of its unique abilityto provide real-time images of the beating heart, combined with itsavailability and portability. Standardization of the methodologyused to quantify cardiac chambers is maintained by creating anddisseminating official recommendations, which when followed bypractitioners provides uniformity and facilitates communication.Recommendations for echocardiographic chamber quantificationwere last published in 2005 by the American Society ofEchocardiography (ASE) and the European Association ofEchocardiography (renamed the European Association ofCardiovascular Imaging [EACVI]).1,2
Since then, echocardiographic technology has continuedevolving, with two major developments being real-time three-dimensional (3D) echocardiography (3DE) and myocardial defor-mation imaging. The goal of this document is to provide an updateto the previously published guidelines, as well as recommendationsand reference values, while eliminating the minor discrepancies thatexisted between previous guidelines. The normal values in this up-date include 3DE and myocardial deformation, when possible.Importantly, compared with the previous guidelines, this update isbased on considerably larger numbers of normal subjects, compiledfrom multiple databases, to improve the reliability of the referencevalues.
Although most issues covered in this document reflect a broadconsensus among the members of the writing group, one importantissue the group debated was partition values for severity of abnormal-ities. Most often, in addition to describing a parameter as normal orabnormal (reference values), clinical echocardiographers qualify thedegree of abnormality with terms such as mildly, moderately, and
Journal of the American Society of EchocardiographyVolume 28 Number 1
Lang et al 3
severely abnormal, which reflect the degree to which measurementsdeviate from normal. In addition to providing normative data, itwould be beneficial to standardize cutoffs for severity of abnormalityfor all parameters across echocardiography laboratories, such that theterm moderately abnormal, for example, would have the same mean-ing universally. However, different approaches may be used for deter-mining cutoff values for the different degrees of abnormality, all ofwhich have significant limitations.
The first approach would be to empirically define cutoffs formild, moderate, and severe abnormalities on the basis of SDs aboveor below the reference limit derived from a group of healthy people.The advantage of this method is that these data readily exist formost echocardiographic parameters. However, this approach isfundamentally flawed. First, not all echocardiographic parametersare normally distributed (or Gaussian), even in a normal population.Second, even if a particular parameter is normally distributed innormal subjects, most echocardiographic parameters, whenmeasured in the general population, have a significant asymmetricdistribution in one direction (abnormally large for size or abnormallylow for function parameters). An alternative method would be todefine abnormalities on the basis of percentile values (e.g., 95th,99th) of measurements derived from a population that includesboth healthy people and those with disease. Although these datawould still not be normally distributed, they would account forthe asymmetric distribution and the range of abnormality presentwithin the general population. The major limitation of this approachis that such population data sets simply do not exist for most echo-cardiographic variables.
Ideally, an approach that predicts outcomes or prognosis would bepreferred. That is, defining a variable as moderately deviated fromnormal would imply that there is a moderate risk for a particularadverse outcome for a patient. Although sufficient data linking riskand cardiac chamber sizes exist for several parameters (e.g., left ven-tricular [LV] size and ejection fraction [EF], left atrial [LA] volume),outcomes data are lacking for many other parameters.Unfortunately, this approach also has limitations. The first obstacleis how to best define risk. The cutoffs suggested for the same param-eter vary broadly for different risks in different patient populationsand disease states.
Last, cutoff values may be determined by experience-basedconsensus of expert opinions. An extensive debate arose amongthe members of the writing group, some of whom felt thatproviding partition values on the basis of this scientifically less-than-rigorous approach would be a disservice to the echocardiog-raphy community and that a disease-specific approach might berequired to achieve meaningful clinical categorization of theseverity of abnormality. Others felt that such cutoffs would pro-vide a uniform reference for echocardiographic reporting, whichwould be easier to interpret by referring clinicians. The compro-mise was to provide experience-based partition values only forLV EF and LA volume, while suggested partition values for addi-tional parameters of LV size and mass are listed in theAppendix. All partition values should interpreted with cautionin this perspective.
For parameters other than LV size, function, and mass as well asLA volume, only the mean value and the SD of gender-, age-, andbody surface area (BSA)–normalized cutoffs or upper and lowerlimits are reported in the appropriate sections of this document.For these parameters, measurements exceeding 61.96 SDs (i.e.,the 95% confidence interval) should be classified as abnormal.Any description of the degree of deviation from normality in the
echocardiographic report should remain at the discretion of the in-dividual laboratory, and the writing group does not recommend spe-cific partition values.
Quantification using transesophageal echocardiography (TEE)has advantages and disadvantages compared with transthoracicechocardiography (TTE). Although visualization of many cardiacstructures is improved with TEE, some differences in measure-ments have been found between TEE and TTE, particularly forchamber dimensions and thickness. These differences are primarilyattributable to the inability to obtain from the transesophagealapproach the standardized imaging planes and views used whenquantifying chamber dimensions transthoracically. It is the recom-mendation of this writing group that the same range of normalvalues for LV and right ventricular (RV) chamber dimensions andvolumes apply for both TEE and TTE. For details on specific viewsfor optimal measurements, please refer to the recently publishedTEE guidelines.3
All measurements described in this document should be per-formed on more than one cardiac cycle to account for interbeatvariability. The committee suggests the average of three beats forpatients in normal sinus rhythm and a minimum of five beats inpatients with atrial fibrillation. Because the committee acknowl-edges that the implementation of this recommendation is timeconsuming, the use of representative beats is acceptable in the clin-ical setting.
I. THE LEFT VENTRICLE
1. Measurement of LV Size
The most commonly used parameters to describe LV cavity sizeinclude linear internal dimensions and volumes. Measurements arecommonly reported for end-diastole and end-systole, which arethen used to derive parameters of global LV function. To allow com-parison among individuals with different body sizes, chamber mea-surements should be reported indexed to BSA.
1.1. LinearMeasurements. It is recommended that linear internalmeasurements of the left ventricle and its walls be performed in theparasternal long-axis view. Values should be carefully obtainedperpendicular to the LV long axis and measured at or immediatelybelow the level of the mitral valve leaflet tips. In this regard, the elec-tronic calipers should be positioned on the interface between themyocardial wall and cavity and the interface between the wall andthe pericardium. Internal dimensions can be obtained with a two-dimensional (2D) echocardiography (2DE)–guided M-modeapproach, although linear measurements obtained from 2D echocar-diographic images are preferred to avoid oblique sections of theventricle (Table 1).
1.2. Volumetric Measurements. LV volumes are measured using2DE or 3DE. Volume calculations derived from linear measurementsmay be inaccurate, because they rely on the assumption of a fixedgeometric LV shape such as a prolate ellipsoid, which does not applyin a variety of cardiac pathologies. Accordingly, the Teichholz andQuinones methods for calculating LV volumes from LV linear dimen-sions are no longer recommended for clinical use.
Volumetric measurements are usually based on tracings of theinterface between the compacted myocardium and the LV cavity.
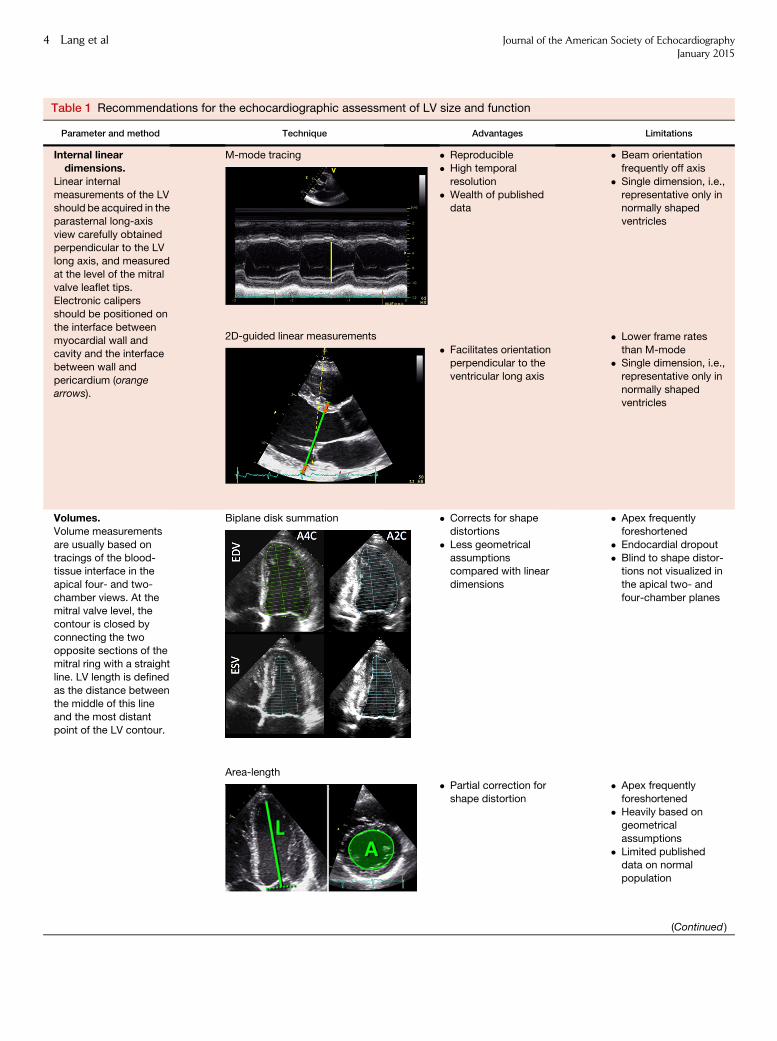
Table 1 Recommendations for the echocardiographic assessment of LV size and function
Parameter and method Technique Advantages Limitations
Internal lineardimensions.
Linear internal
measurements of the LVshould be acquired in the
parasternal long-axis
view carefully obtainedperpendicular to the LV
long axis, and measured
at the level of the mitral
valve leaflet tips.Electronic calipers
should be positioned on
the interface between
myocardial wall andcavity and the interface
between wall and
pericardium (orangearrows).
M-mode tracing
2D-guided linear measurements
� Reproducible
� High temporal
resolution
� Wealth of publisheddata
� Facilitates orientationperpendicular to the
ventricular long axis
� Beam orientation
frequently off axis
� Single dimension, i.e.,
representative only innormally shaped
ventricles
� Lower frame rates
than M-mode� Single dimension, i.e.,
representative only in
normally shapedventricles
Volumes.Volume measurements
are usually based on
tracings of the blood-tissue interface in the
apical four- and two-
chamber views. At themitral valve level, the
contour is closed by
connecting the two
opposite sections of themitral ring with a straight
line. LV length is defined
as the distance between
the middle of this lineand the most distant
point of the LV contour.
Biplane disk summation � Corrects for shape
distortions
� Less geometrical
assumptionscompared with linear
dimensions
� Apex frequently
foreshortened
� Endocardial dropout
� Blind to shape distor-tions not visualized in
the apical two- and
four-chamber planes
Area-length
� Partial correction for
shape distortion
� Apex frequently
foreshortened� Heavily based on
geometrical
assumptions
� Limited publisheddata on normal
population
(Continued )
4 Lang et al Journal of the American Society of EchocardiographyJanuary 2015
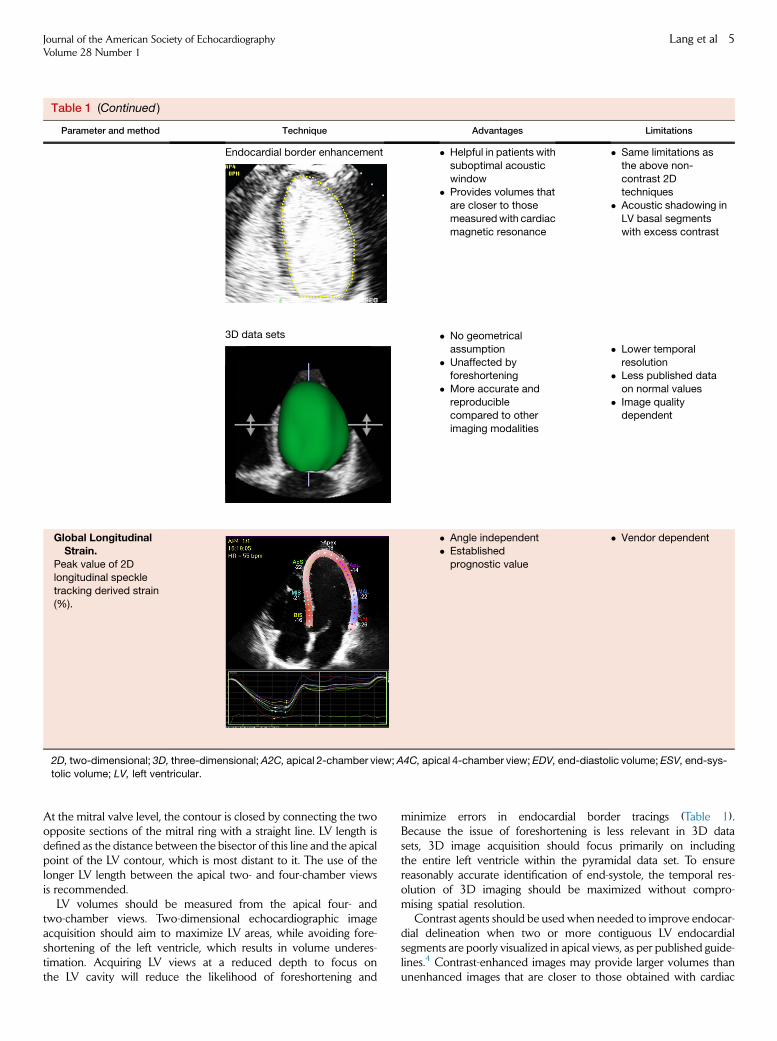
Table 1 (Continued )
Parameter and method Technique Advantages Limitations
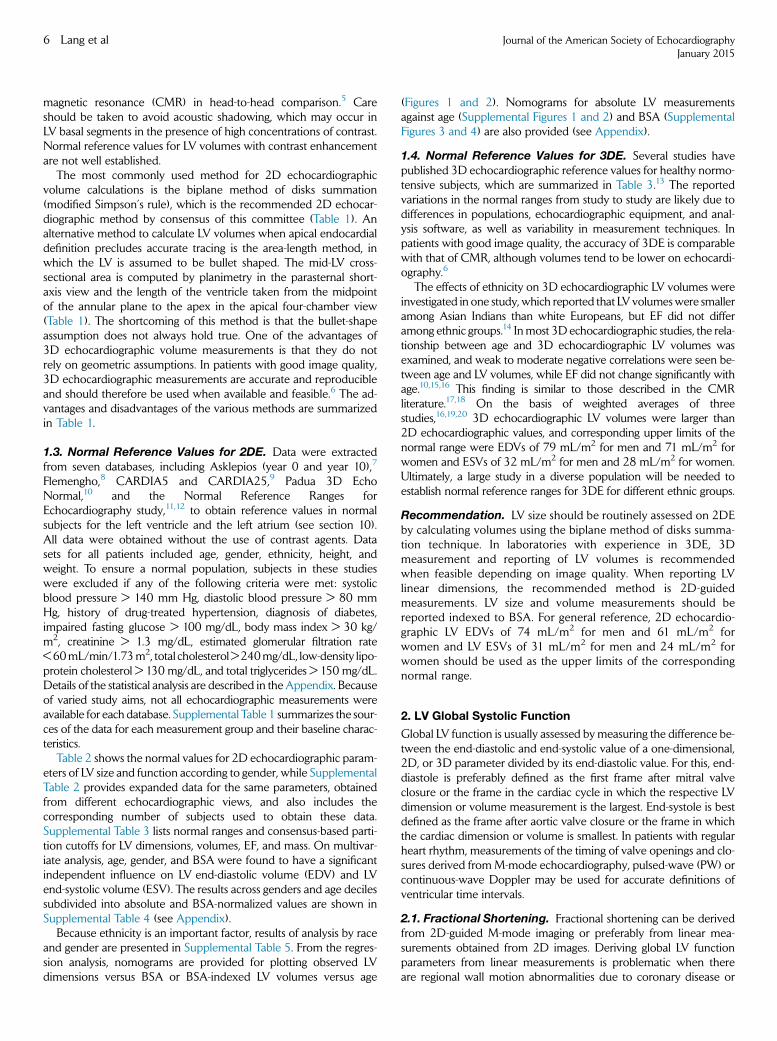
Endocardial border enhancement
3D data sets
� Helpful in patients with
suboptimal acoustic
window� Provides volumes that
are closer to those
measuredwith cardiac
magnetic resonance
� No geometrical
assumption
� Unaffected byforeshortening
� More accurate and
reproduciblecompared to other
imaging modalities
� Same limitations as
the above non-
contrast 2Dtechniques
� Acoustic shadowing in
LV basal segments
with excess contrast
� Lower temporal
resolution� Less published data
on normal values
� Image qualitydependent
Global LongitudinalStrain.
Peak value of 2D
longitudinal speckletracking derived strain
(%).
� Angle independent� Established
prognostic value
� Vendor dependent
2D, two-dimensional; 3D, three-dimensional;A2C, apical 2-chamber view;A4C, apical 4-chamber view; EDV, end-diastolic volume; ESV, end-sys-
tolic volume; LV, left ventricular.
Journal of the American Society of EchocardiographyVolume 28 Number 1
Lang et al 5
At the mitral valve level, the contour is closed by connecting the twoopposite sections of the mitral ring with a straight line. LV length isdefined as the distance between the bisector of this line and the apicalpoint of the LV contour, which is most distant to it. The use of thelonger LV length between the apical two- and four-chamber viewsis recommended.
LV volumes should be measured from the apical four- andtwo-chamber views. Two-dimensional echocardiographic imageacquisition should aim to maximize LV areas, while avoiding fore-shortening of the left ventricle, which results in volume underes-timation. Acquiring LV views at a reduced depth to focus onthe LV cavity will reduce the likelihood of foreshortening and
minimize errors in endocardial border tracings (Table 1).Because the issue of foreshortening is less relevant in 3D datasets, 3D image acquisition should focus primarily on includingthe entire left ventricle within the pyramidal data set. To ensurereasonably accurate identification of end-systole, the temporal res-olution of 3D imaging should be maximized without compro-mising spatial resolution.
Contrast agents should be used when needed to improve endocar-dial delineation when two or more contiguous LV endocardialsegments are poorly visualized in apical views, as per published guide-lines.4 Contrast-enhanced images may provide larger volumes thanunenhanced images that are closer to those obtained with cardiac
6 Lang et al Journal of the American Society of EchocardiographyJanuary 2015
magnetic resonance (CMR) in head-to-head comparison.5 Careshould be taken to avoid acoustic shadowing, which may occur inLV basal segments in the presence of high concentrations of contrast.Normal reference values for LV volumes with contrast enhancementare not well established.
The most commonly used method for 2D echocardiographicvolume calculations is the biplane method of disks summation(modified Simpson’s rule), which is the recommended 2D echocar-diographic method by consensus of this committee (Table 1). Analternative method to calculate LV volumes when apical endocardialdefinition precludes accurate tracing is the area-length method, inwhich the LV is assumed to be bullet shaped. The mid-LV cross-sectional area is computed by planimetry in the parasternal short-axis view and the length of the ventricle taken from the midpointof the annular plane to the apex in the apical four-chamber view(Table 1). The shortcoming of this method is that the bullet-shapeassumption does not always hold true. One of the advantages of3D echocardiographic volume measurements is that they do notrely on geometric assumptions. In patients with good image quality,3D echocardiographic measurements are accurate and reproducibleand should therefore be used when available and feasible.6 The ad-vantages and disadvantages of the various methods are summarizedin Table 1.
1.3. Normal Reference Values for 2DE. Data were extractedfrom seven databases, including Asklepios (year 0 and year 10),7
Flemengho,8 CARDIA5 and CARDIA25,9 Padua 3D EchoNormal,10 and the Normal Reference Ranges forEchocardiography study,11,12 to obtain reference values in normalsubjects for the left ventricle and the left atrium (see section 10).All data were obtained without the use of contrast agents. Datasets for all patients included age, gender, ethnicity, height, andweight. To ensure a normal population, subjects in these studieswere excluded if any of the following criteria were met: systolicblood pressure > 140 mm Hg, diastolic blood pressure > 80 mmHg, history of drug-treated hypertension, diagnosis of diabetes,impaired fasting glucose > 100 mg/dL, body mass index > 30 kg/m2, creatinine > 1.3 mg/dL, estimated glomerular filtration rate<60mL/min/1.73m2, total cholesterol>240mg/dL, low-density lipo-protein cholesterol > 130 mg/dL, and total triglycerides > 150 mg/dL.Details of the statistical analysis are described in the Appendix. Becauseof varied study aims, not all echocardiographic measurements wereavailable for each database. Supplemental Table 1 summarizes the sour-ces of the data for each measurement group and their baseline charac-teristics.
Table 2 shows the normal values for 2D echocardiographic param-eters of LV size and function according to gender, while SupplementalTable 2 provides expanded data for the same parameters, obtainedfrom different echocardiographic views, and also includes thecorresponding number of subjects used to obtain these data.Supplemental Table 3 lists normal ranges and consensus-based parti-tion cutoffs for LV dimensions, volumes, EF, and mass. On multivar-iate analysis, age, gender, and BSA were found to have a significantindependent influence on LV end-diastolic volume (EDV) and LVend-systolic volume (ESV). The results across genders and age decilessubdivided into absolute and BSA-normalized values are shown inSupplemental Table 4 (see Appendix).
Because ethnicity is an important factor, results of analysis by raceand gender are presented in Supplemental Table 5. From the regres-sion analysis, nomograms are provided for plotting observed LVdimensions versus BSA or BSA-indexed LV volumes versus age
(Figures 1 and 2). Nomograms for absolute LV measurementsagainst age (Supplemental Figures 1 and 2) and BSA (SupplementalFigures 3 and 4) are also provided (see Appendix).
1.4. Normal Reference Values for 3DE. Several studies havepublished 3D echocardiographic reference values for healthy normo-tensive subjects, which are summarized in Table 3.13 The reportedvariations in the normal ranges from study to study are likely due todifferences in populations, echocardiographic equipment, and anal-ysis software, as well as variability in measurement techniques. Inpatients with good image quality, the accuracy of 3DE is comparablewith that of CMR, although volumes tend to be lower on echocardi-ography.6
The effects of ethnicity on 3D echocardiographic LV volumes wereinvestigated in one study, which reported that LV volumeswere smalleramong Asian Indians than white Europeans, but EF did not differamong ethnic groups.14 Inmost 3D echocardiographic studies, the rela-tionship between age and 3D echocardiographic LV volumes wasexamined, and weak to moderate negative correlations were seen be-tween age and LV volumes, while EF did not change significantly withage.10,15,16 This finding is similar to those described in the CMRliterature.17,18 On the basis of weighted averages of threestudies,16,19,20 3D echocardiographic LV volumes were larger than2D echocardiographic values, and corresponding upper limits of thenormal range were EDVs of 79 mL/m2 for men and 71 mL/m2 forwomen and ESVs of 32 mL/m2 for men and 28 mL/m2 for women.Ultimately, a large study in a diverse population will be needed toestablish normal reference ranges for 3DE for different ethnic groups.
Recommendation. LV size should be routinely assessed on 2DEby calculating volumes using the biplane method of disks summa-tion technique. In laboratories with experience in 3DE, 3Dmeasurement and reporting of LV volumes is recommendedwhen feasible depending on image quality. When reporting LVlinear dimensions, the recommended method is 2D-guidedmeasurements. LV size and volume measurements should bereported indexed to BSA. For general reference, 2D echocardio-graphic LV EDVs of 74 mL/m2 for men and 61 mL/m2 forwomen and LV ESVs of 31 mL/m2 for men and 24 mL/m2 forwomen should be used as the upper limits of the correspondingnormal range.
2. LV Global Systolic Function
Global LV function is usually assessed bymeasuring the difference be-tween the end-diastolic and end-systolic value of a one-dimensional,2D, or 3D parameter divided by its end-diastolic value. For this, end-diastole is preferably defined as the first frame after mitral valveclosure or the frame in the cardiac cycle in which the respective LVdimension or volume measurement is the largest. End-systole is bestdefined as the frame after aortic valve closure or the frame in whichthe cardiac dimension or volume is smallest. In patients with regularheart rhythm, measurements of the timing of valve openings and clo-sures derived fromM-mode echocardiography, pulsed-wave (PW) orcontinuous-wave Doppler may be used for accurate definitions ofventricular time intervals.
2.1. Fractional Shortening. Fractional shortening can be derivedfrom 2D-guided M-mode imaging or preferably from linear mea-surements obtained from 2D images. Deriving global LV functionparameters from linear measurements is problematic when thereare regional wall motion abnormalities due to coronary disease or
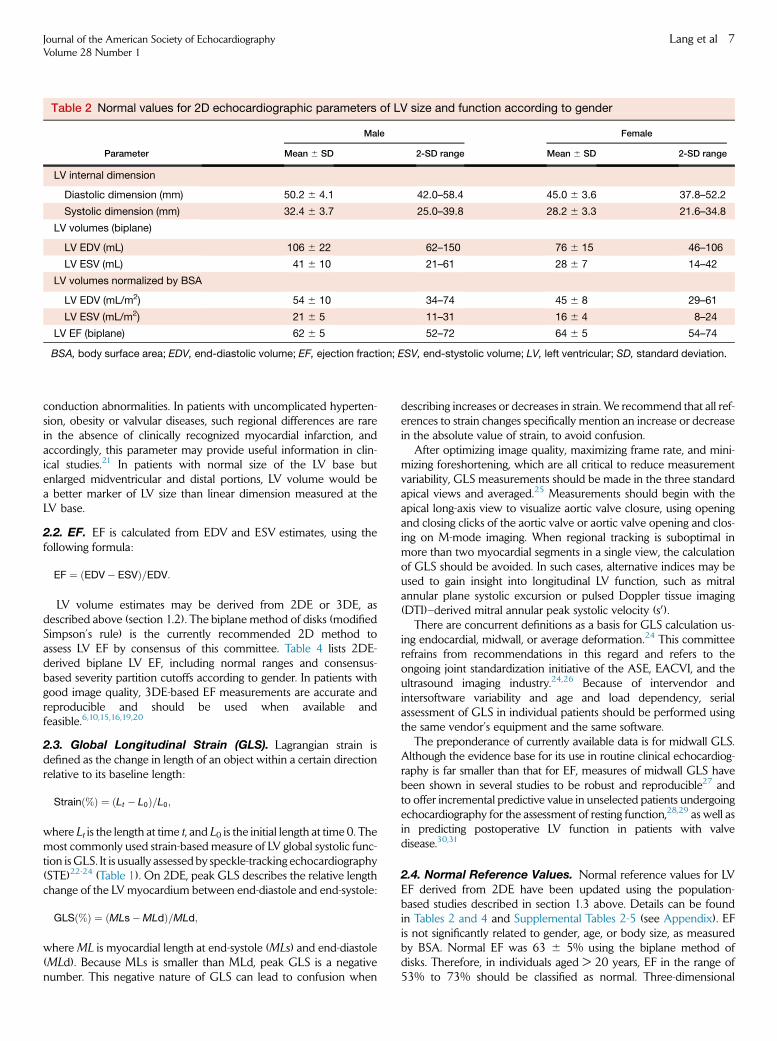
Table 2 Normal values for 2D echocardiographic parameters of LV size and function according to gender
Parameter
Male Female
Mean 6 SD 2-SD range Mean 6 SD 2-SD range
LV internal dimension
Diastolic dimension (mm) 50.2 6 4.1 42.0–58.4 45.0 6 3.6 37.8–52.2
Systolic dimension (mm) 32.4 6 3.7 25.0–39.8 28.2 6 3.3 21.6–34.8
LV volumes (biplane)
LV EDV (mL) 106 6 22 62–150 76 6 15 46–106
LV ESV (mL) 41 6 10 21–61 28 6 7 14–42
LV volumes normalized by BSA
LV EDV (mL/m2) 54 6 10 34–74 45 6 8 29–61
LV ESV (mL/m2) 21 6 5 11–31 16 6 4 8–24
LV EF (biplane) 62 6 5 52–72 64 6 5 54–74
BSA, body surface area; EDV, end-diastolic volume; EF, ejection fraction; ESV, end-stystolic volume; LV, left ventricular; SD, standard deviation.
Journal of the American Society of EchocardiographyVolume 28 Number 1
Lang et al 7
conduction abnormalities. In patients with uncomplicated hyperten-sion, obesity or valvular diseases, such regional differences are rarein the absence of clinically recognized myocardial infarction, andaccordingly, this parameter may provide useful information in clin-ical studies.21 In patients with normal size of the LV base butenlarged midventricular and distal portions, LV volume would bea better marker of LV size than linear dimension measured at theLV base.
2.2. EF. EF is calculated from EDV and ESV estimates, using thefollowing formula:
EF ¼ ðEDV� ESVÞ=EDV:
LV volume estimates may be derived from 2DE or 3DE, asdescribed above (section 1.2). The biplane method of disks (modifiedSimpson’s rule) is the currently recommended 2D method toassess LV EF by consensus of this committee. Table 4 lists 2DE-derived biplane LV EF, including normal ranges and consensus-based severity partition cutoffs according to gender. In patients withgood image quality, 3DE-based EF measurements are accurate andreproducible and should be used when available andfeasible.6,10,15,16,19,20
2.3. Global Longitudinal Strain (GLS). Lagrangian strain isdefined as the change in length of an object within a certain directionrelative to its baseline length:
Strainð%Þ ¼ ðLt � L0Þ=L0;
where Lt is the length at time t, and L0 is the initial length at time 0. Themost commonly used strain-based measure of LV global systolic func-tion is GLS. It is usually assessed by speckle-tracking echocardiography(STE)22-24 (Table 1). On 2DE, peak GLS describes the relative lengthchange of the LVmyocardium between end-diastole and end-systole:
GLSð%Þ ¼ ðMLs�MLdÞ=MLd;
whereML is myocardial length at end-systole (MLs) and end-diastole(MLd). Because MLs is smaller than MLd, peak GLS is a negativenumber. This negative nature of GLS can lead to confusion when
describing increases or decreases in strain. We recommend that all ref-erences to strain changes specifically mention an increase or decreasein the absolute value of strain, to avoid confusion.
After optimizing image quality, maximizing frame rate, and mini-mizing foreshortening, which are all critical to reduce measurementvariability, GLS measurements should be made in the three standardapical views and averaged.25 Measurements should begin with theapical long-axis view to visualize aortic valve closure, using openingand closing clicks of the aortic valve or aortic valve opening and clos-ing on M-mode imaging. When regional tracking is suboptimal inmore than two myocardial segments in a single view, the calculationof GLS should be avoided. In such cases, alternative indices may beused to gain insight into longitudinal LV function, such as mitralannular plane systolic excursion or pulsed Doppler tissue imaging(DTI)–derived mitral annular peak systolic velocity (s0).
There are concurrent definitions as a basis for GLS calculation us-ing endocardial, midwall, or average deformation.24 This committeerefrains from recommendations in this regard and refers to theongoing joint standardization initiative of the ASE, EACVI, and theultrasound imaging industry.24,26 Because of intervendor andintersoftware variability and age and load dependency, serialassessment of GLS in individual patients should be performed usingthe same vendor’s equipment and the same software.
The preponderance of currently available data is for midwall GLS.Although the evidence base for its use in routine clinical echocardiog-raphy is far smaller than that for EF, measures of midwall GLS havebeen shown in several studies to be robust and reproducible27 andto offer incremental predictive value in unselected patients undergoingechocardiography for the assessment of resting function,28,29 as well asin predicting postoperative LV function in patients with valvedisease.30,31
2.4. Normal Reference Values. Normal reference values for LVEF derived from 2DE have been updated using the population-based studies described in section 1.3 above. Details can be foundin Tables 2 and 4 and Supplemental Tables 2-5 (see Appendix). EFis not significantly related to gender, age, or body size, as measuredby BSA. Normal EF was 63 6 5% using the biplane method ofdisks. Therefore, in individuals aged > 20 years, EF in the range of53% to 73% should be classified as normal. Three-dimensional
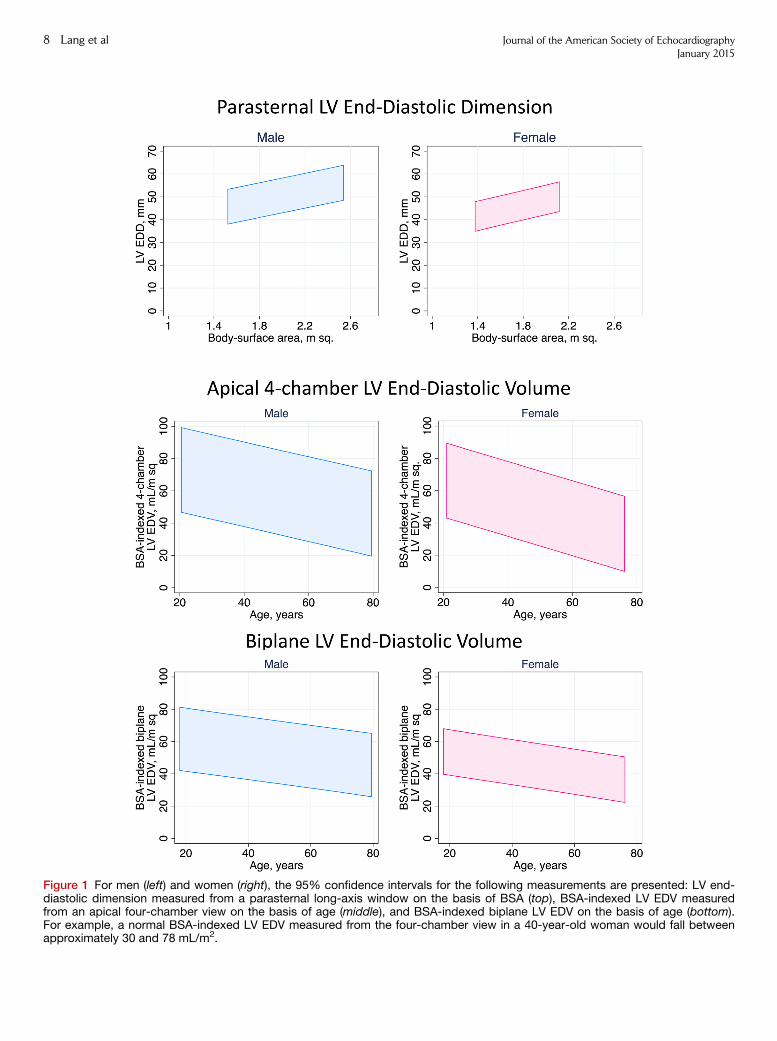
Figure 1 For men (left) and women (right), the 95% confidence intervals for the following measurements are presented: LV end-diastolic dimension measured from a parasternal long-axis window on the basis of BSA (top), BSA-indexed LV EDV measuredfrom an apical four-chamber view on the basis of age (middle), and BSA-indexed biplane LV EDV on the basis of age (bottom).For example, a normal BSA-indexed LV EDV measured from the four-chamber view in a 40-year-old woman would fall betweenapproximately 30 and 78 mL/m2.
8 Lang et al Journal of the American Society of EchocardiographyJanuary 2015
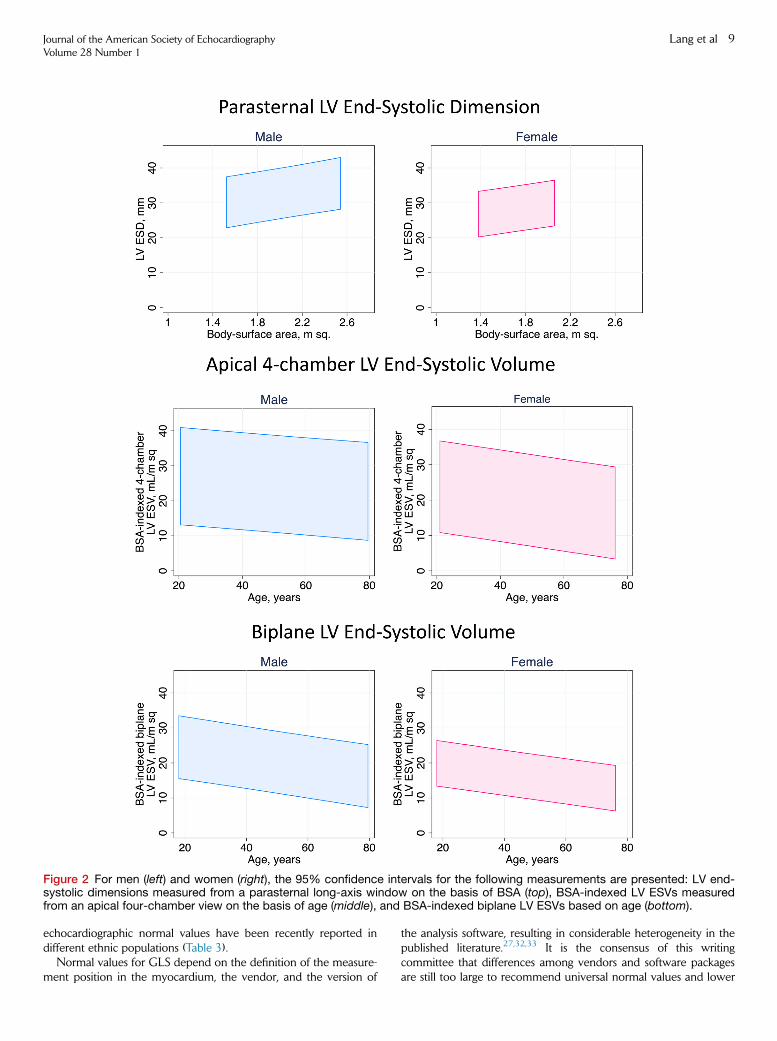
Figure 2 For men (left) and women (right), the 95% confidence intervals for the following measurements are presented: LV end-systolic dimensions measured from a parasternal long-axis window on the basis of BSA (top), BSA-indexed LV ESVs measuredfrom an apical four-chamber view on the basis of age (middle), and BSA-indexed biplane LV ESVs based on age (bottom).
Journal of the American Society of EchocardiographyVolume 28 Number 1
Lang et al 9
echocardiographic normal values have been recently reported indifferent ethnic populations (Table 3).
Normal values for GLS depend on the definition of the measure-ment position in the myocardium, the vendor, and the version of
the analysis software, resulting in considerable heterogeneity in thepublished literature.27,32,33 It is the consensus of this writingcommittee that differences among vendors and software packagesare still too large to recommend universal normal values and lower
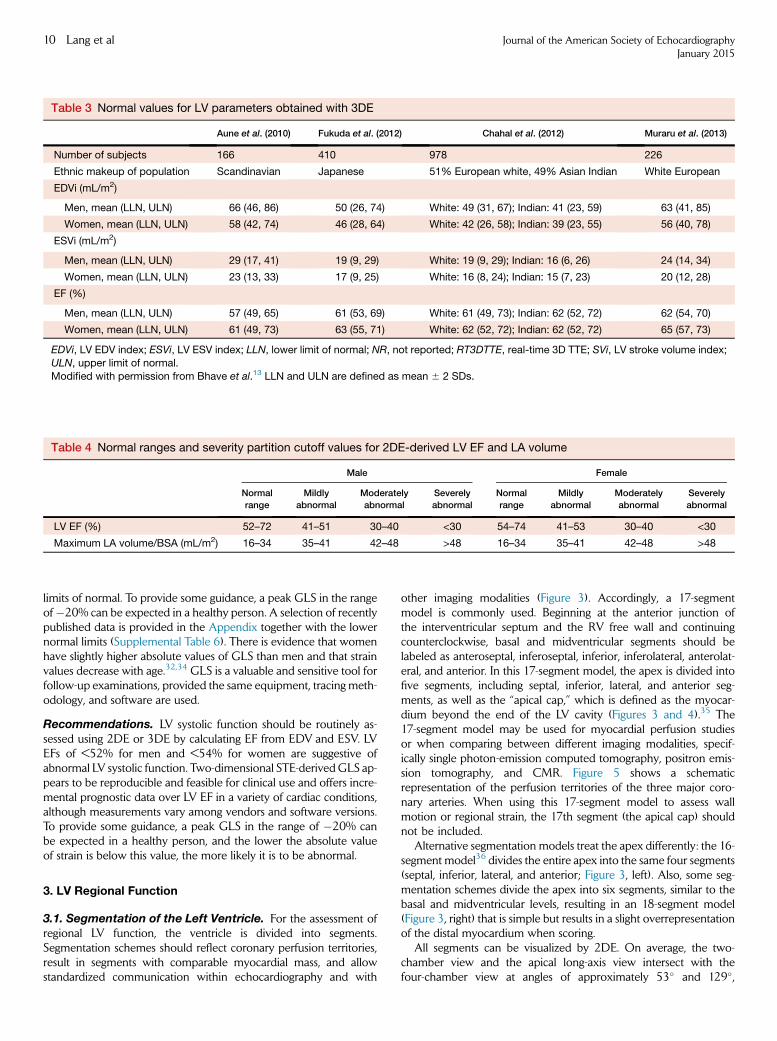
Table 3 Normal values for LV parameters obtained with 3DE
Aune et al. (2010) Fukuda et al. (2012) Chahal et al. (2012) Muraru et al. (2013)
Number of subjects 166 410 978 226
Ethnic makeup of population Scandinavian Japanese 51% European white, 49% Asian Indian White European
EDVi (mL/m2)
Men, mean (LLN, ULN) 66 (46, 86) 50 (26, 74) White: 49 (31, 67); Indian: 41 (23, 59) 63 (41, 85)
Women, mean (LLN, ULN) 58 (42, 74) 46 (28, 64) White: 42 (26, 58); Indian: 39 (23, 55) 56 (40, 78)
ESVi (mL/m2)
Men, mean (LLN, ULN) 29 (17, 41) 19 (9, 29) White: 19 (9, 29); Indian: 16 (6, 26) 24 (14, 34)
Women, mean (LLN, ULN) 23 (13, 33) 17 (9, 25) White: 16 (8, 24); Indian: 15 (7, 23) 20 (12, 28)
EF (%)
Men, mean (LLN, ULN) 57 (49, 65) 61 (53, 69) White: 61 (49, 73); Indian: 62 (52, 72) 62 (54, 70)
Women, mean (LLN, ULN) 61 (49, 73) 63 (55, 71) White: 62 (52, 72); Indian: 62 (52, 72) 65 (57, 73)
EDVi, LV EDV index; ESVi, LV ESV index; LLN, lower limit of normal; NR, not reported; RT3DTTE, real-time 3D TTE; SVi, LV stroke volume index;ULN, upper limit of normal.
Modified with permission from Bhave et al.13 LLN and ULN are defined as mean 6 2 SDs.
Table 4 Normal ranges and severity partition cutoff values for 2DE-derived LV EF and LA volume
Male Female
Normal
range
Mildly
abnormal
Moderately
abnormal
Severely
abnormal
Normal
range
Mildly
abnormal
Moderately
abnormal
Severely
abnormal
LV EF (%) 52–72 41–51 30–40 <30 54–74 41–53 30–40 <30
Maximum LA volume/BSA (mL/m2) 16–34 35–41 42–48 >48 16–34 35–41 42–48 >48
10 Lang et al Journal of the American Society of EchocardiographyJanuary 2015
limits of normal. To provide some guidance, a peak GLS in the rangeof�20% can be expected in a healthy person. A selection of recentlypublished data is provided in the Appendix together with the lowernormal limits (Supplemental Table 6). There is evidence that womenhave slightly higher absolute values of GLS than men and that strainvalues decrease with age.32,34 GLS is a valuable and sensitive tool forfollow-up examinations, provided the same equipment, tracing meth-odology, and software are used.
Recommendations. LV systolic function should be routinely as-sessed using 2DE or 3DE by calculating EF from EDV and ESV. LVEFs of <52% for men and <54% for women are suggestive ofabnormal LV systolic function. Two-dimensional STE-derived GLS ap-pears to be reproducible and feasible for clinical use and offers incre-mental prognostic data over LV EF in a variety of cardiac conditions,although measurements vary among vendors and software versions.To provide some guidance, a peak GLS in the range of �20% canbe expected in a healthy person, and the lower the absolute valueof strain is below this value, the more likely it is to be abnormal.
3. LV Regional Function
3.1. Segmentation of the Left Ventricle. For the assessment ofregional LV function, the ventricle is divided into segments.Segmentation schemes should reflect coronary perfusion territories,result in segments with comparable myocardial mass, and allowstandardized communication within echocardiography and with
other imaging modalities (Figure 3). Accordingly, a 17-segmentmodel is commonly used. Beginning at the anterior junction ofthe interventricular septum and the RV free wall and continuingcounterclockwise, basal and midventricular segments should belabeled as anteroseptal, inferoseptal, inferior, inferolateral, anterolat-eral, and anterior. In this 17-segment model, the apex is divided intofive segments, including septal, inferior, lateral, and anterior seg-ments, as well as the ‘‘apical cap,’’ which is defined as the myocar-dium beyond the end of the LV cavity (Figures 3 and 4).35 The17-segment model may be used for myocardial perfusion studiesor when comparing between different imaging modalities, specif-ically single photon-emission computed tomography, positron emis-sion tomography, and CMR. Figure 5 shows a schematicrepresentation of the perfusion territories of the three major coro-nary arteries. When using this 17-segment model to assess wallmotion or regional strain, the 17th segment (the apical cap) shouldnot be included.
Alternative segmentation models treat the apex differently: the 16-segment model36 divides the entire apex into the same four segments(septal, inferior, lateral, and anterior; Figure 3, left). Also, some seg-mentation schemes divide the apex into six segments, similar to thebasal and midventricular levels, resulting in an 18-segment model(Figure 3, right) that is simple but results in a slight overrepresentationof the distal myocardium when scoring.
All segments can be visualized by 2DE. On average, the two-chamber view and the apical long-axis view intersect with thefour-chamber view at angles of approximately 53� and 129�,
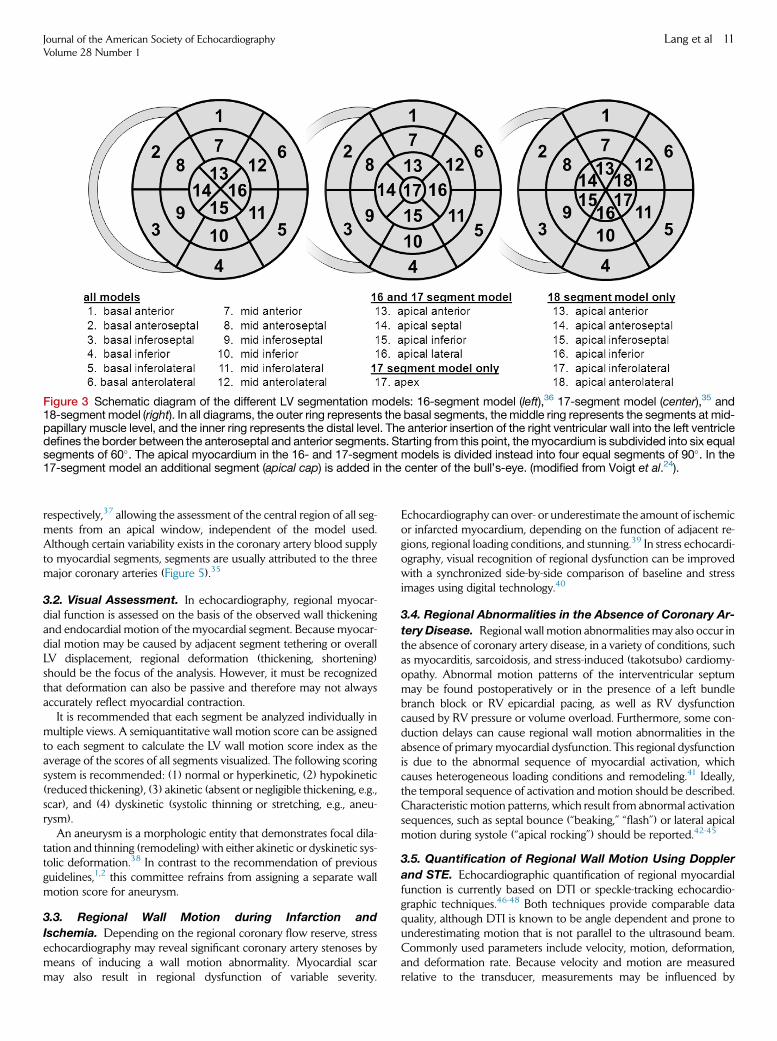
Figure 3 Schematic diagram of the different LV segmentation models: 16-segment model (left),36 17-segment model (center),35 and18-segment model (right). In all diagrams, the outer ring represents the basal segments, themiddle ring represents the segments at mid-papillary muscle level, and the inner ring represents the distal level. The anterior insertion of the right ventricular wall into the left ventricledefines the border between the anteroseptal and anterior segments. Starting from this point, themyocardium is subdivided into six equalsegments of 60�. The apical myocardium in the 16- and 17-segment models is divided instead into four equal segments of 90�. In the17-segment model an additional segment (apical cap) is added in the center of the bull’s-eye. (modified from Voigt et al.24).
Journal of the American Society of EchocardiographyVolume 28 Number 1
Lang et al 11
respectively,37 allowing the assessment of the central region of all seg-ments from an apical window, independent of the model used.Although certain variability exists in the coronary artery blood supplyto myocardial segments, segments are usually attributed to the threemajor coronary arteries (Figure 5).35
3.2. Visual Assessment. In echocardiography, regional myocar-dial function is assessed on the basis of the observed wall thickeningand endocardial motion of the myocardial segment. Because myocar-dial motion may be caused by adjacent segment tethering or overallLV displacement, regional deformation (thickening, shortening)should be the focus of the analysis. However, it must be recognizedthat deformation can also be passive and therefore may not alwaysaccurately reflect myocardial contraction.
It is recommended that each segment be analyzed individually inmultiple views. A semiquantitative wall motion score can be assignedto each segment to calculate the LV wall motion score index as theaverage of the scores of all segments visualized. The following scoringsystem is recommended: (1) normal or hyperkinetic, (2) hypokinetic(reduced thickening), (3) akinetic (absent or negligible thickening, e.g.,scar), and (4) dyskinetic (systolic thinning or stretching, e.g., aneu-rysm).
An aneurysm is a morphologic entity that demonstrates focal dila-tation and thinning (remodeling) with either akinetic or dyskinetic sys-tolic deformation.38 In contrast to the recommendation of previousguidelines,1,2 this committee refrains from assigning a separate wallmotion score for aneurysm.
3.3. Regional Wall Motion during Infarction and
Ischemia. Depending on the regional coronary flow reserve, stressechocardiography may reveal significant coronary artery stenoses bymeans of inducing a wall motion abnormality. Myocardial scarmay also result in regional dysfunction of variable severity.
Echocardiography can over- or underestimate the amount of ischemicor infarcted myocardium, depending on the function of adjacent re-gions, regional loading conditions, and stunning.39 In stress echocardi-ography, visual recognition of regional dysfunction can be improvedwith a synchronized side-by-side comparison of baseline and stressimages using digital technology.40
3.4. Regional Abnormalities in the Absence of Coronary Ar-
tery Disease. Regional wall motion abnormalities may also occur inthe absence of coronary artery disease, in a variety of conditions, suchas myocarditis, sarcoidosis, and stress-induced (takotsubo) cardiomy-opathy. Abnormal motion patterns of the interventricular septummay be found postoperatively or in the presence of a left bundlebranch block or RV epicardial pacing, as well as RV dysfunctioncaused by RV pressure or volume overload. Furthermore, some con-duction delays can cause regional wall motion abnormalities in theabsence of primary myocardial dysfunction. This regional dysfunctionis due to the abnormal sequence of myocardial activation, whichcauses heterogeneous loading conditions and remodeling.41 Ideally,the temporal sequence of activation and motion should be described.Characteristic motion patterns, which result from abnormal activationsequences, such as septal bounce (‘‘beaking,’’ ‘‘flash’’) or lateral apicalmotion during systole (‘‘apical rocking’’) should be reported.42-45
3.5. Quantification of Regional Wall Motion Using Doppler
and STE. Echocardiographic quantification of regional myocardialfunction is currently based on DTI or speckle-tracking echocardio-graphic techniques.46-48 Both techniques provide comparable dataquality, although DTI is known to be angle dependent and prone tounderestimating motion that is not parallel to the ultrasound beam.Commonly used parameters include velocity, motion, deformation,and deformation rate. Because velocity and motion are measuredrelative to the transducer, measurements may be influenced by
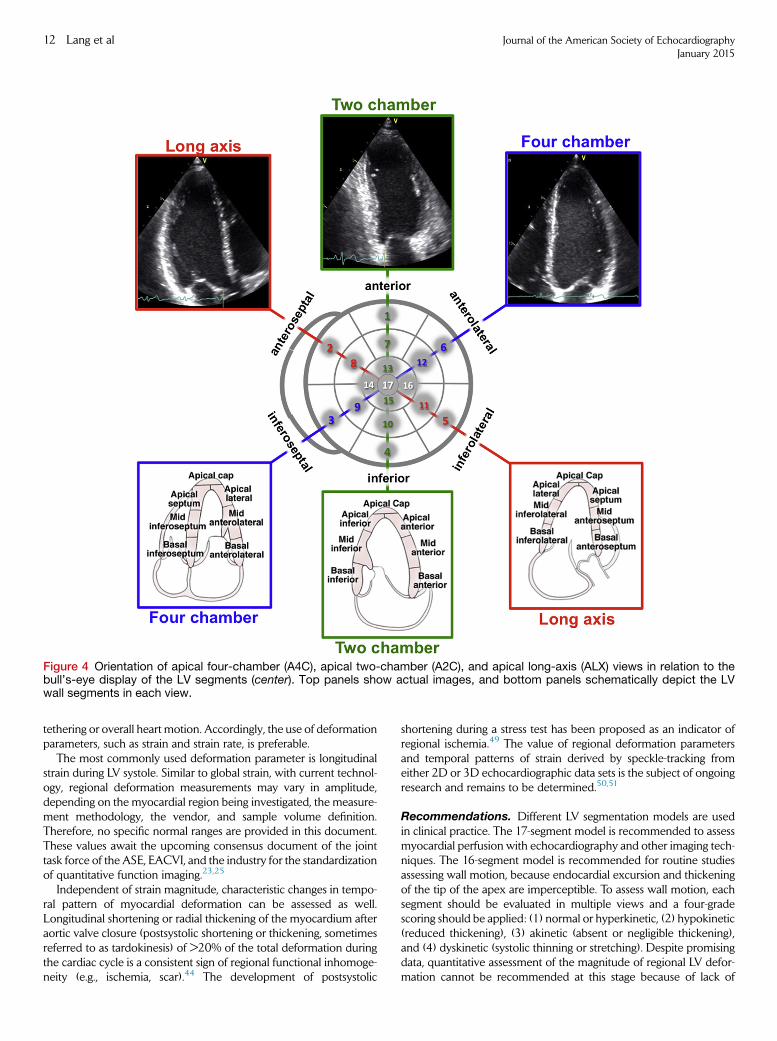
Figure 4 Orientation of apical four-chamber (A4C), apical two-chamber (A2C), and apical long-axis (ALX) views in relation to thebull’s-eye display of the LV segments (center). Top panels show actual images, and bottom panels schematically depict the LVwall segments in each view.
12 Lang et al Journal of the American Society of EchocardiographyJanuary 2015
tethering or overall heart motion. Accordingly, the use of deformationparameters, such as strain and strain rate, is preferable.
The most commonly used deformation parameter is longitudinalstrain during LV systole. Similar to global strain, with current technol-ogy, regional deformation measurements may vary in amplitude,depending on the myocardial region being investigated, the measure-ment methodology, the vendor, and sample volume definition.Therefore, no specific normal ranges are provided in this document.These values await the upcoming consensus document of the jointtask force of the ASE, EACVI, and the industry for the standardizationof quantitative function imaging.23,25
Independent of strain magnitude, characteristic changes in tempo-ral pattern of myocardial deformation can be assessed as well.Longitudinal shortening or radial thickening of the myocardium afteraortic valve closure (postsystolic shortening or thickening, sometimesreferred to as tardokinesis) of >20% of the total deformation duringthe cardiac cycle is a consistent sign of regional functional inhomoge-neity (e.g., ischemia, scar).44 The development of postsystolic
shortening during a stress test has been proposed as an indicator ofregional ischemia.49 The value of regional deformation parametersand temporal patterns of strain derived by speckle-tracking fromeither 2D or 3D echocardiographic data sets is the subject of ongoingresearch and remains to be determined.50,51
Recommendations. Different LV segmentation models are usedin clinical practice. The 17-segment model is recommended to assessmyocardial perfusion with echocardiography and other imaging tech-niques. The 16-segment model is recommended for routine studiesassessing wall motion, because endocardial excursion and thickeningof the tip of the apex are imperceptible. To assess wall motion, eachsegment should be evaluated in multiple views and a four-gradescoring should be applied: (1) normal or hyperkinetic, (2) hypokinetic(reduced thickening), (3) akinetic (absent or negligible thickening),and (4) dyskinetic (systolic thinning or stretching). Despite promisingdata, quantitative assessment of the magnitude of regional LV defor-mation cannot be recommended at this stage because of lack of
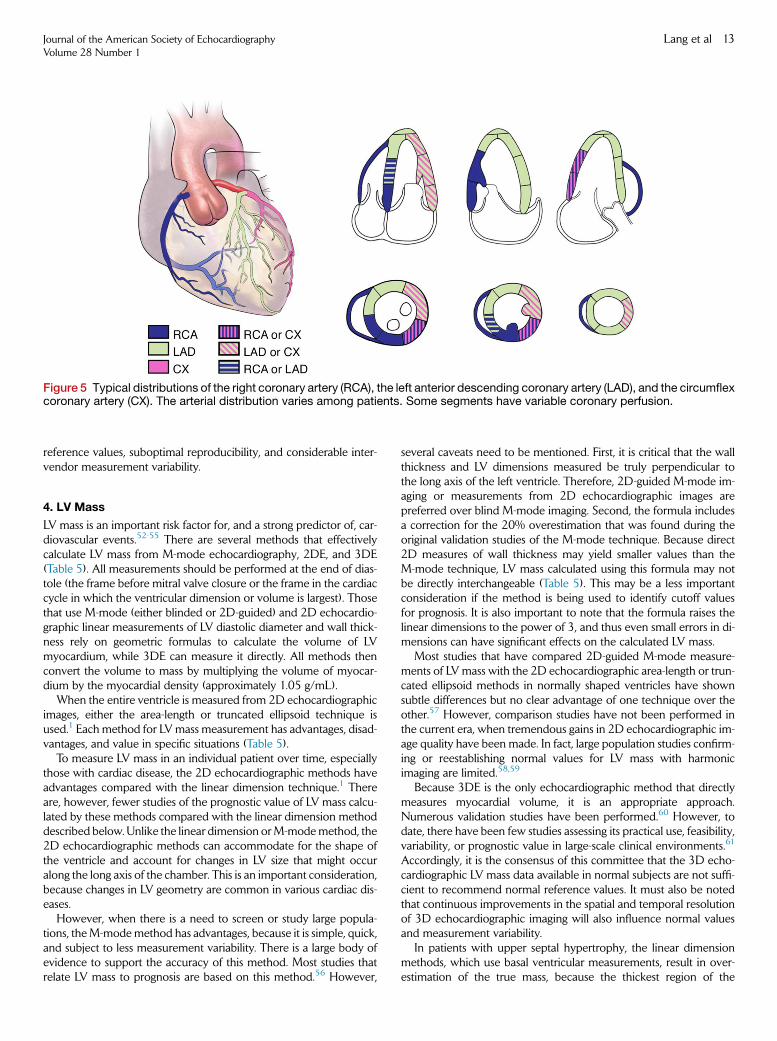
Figure 5 Typical distributions of the right coronary artery (RCA), the left anterior descending coronary artery (LAD), and the circumflexcoronary artery (CX). The arterial distribution varies among patients. Some segments have variable coronary perfusion.
Journal of the American Society of EchocardiographyVolume 28 Number 1
Lang et al 13
reference values, suboptimal reproducibility, and considerable inter-vendor measurement variability.
4. LV Mass
LV mass is an important risk factor for, and a strong predictor of, car-diovascular events.52-55 There are several methods that effectivelycalculate LV mass from M-mode echocardiography, 2DE, and 3DE(Table 5). All measurements should be performed at the end of dias-tole (the frame before mitral valve closure or the frame in the cardiaccycle in which the ventricular dimension or volume is largest). Thosethat use M-mode (either blinded or 2D-guided) and 2D echocardio-graphic linear measurements of LV diastolic diameter and wall thick-ness rely on geometric formulas to calculate the volume of LVmyocardium, while 3DE can measure it directly. All methods thenconvert the volume to mass by multiplying the volume of myocar-dium by the myocardial density (approximately 1.05 g/mL).
When the entire ventricle is measured from 2D echocardiographicimages, either the area-length or truncated ellipsoid technique isused.1 Each method for LVmass measurement has advantages, disad-vantages, and value in specific situations (Table 5).
To measure LV mass in an individual patient over time, especiallythose with cardiac disease, the 2D echocardiographic methods haveadvantages compared with the linear dimension technique.1 Thereare, however, fewer studies of the prognostic value of LV mass calcu-lated by these methods compared with the linear dimension methoddescribed below. Unlike the linear dimension orM-modemethod, the2D echocardiographic methods can accommodate for the shape ofthe ventricle and account for changes in LV size that might occuralong the long axis of the chamber. This is an important consideration,because changes in LV geometry are common in various cardiac dis-eases.
However, when there is a need to screen or study large popula-tions, theM-modemethod has advantages, because it is simple, quick,and subject to less measurement variability. There is a large body ofevidence to support the accuracy of this method. Most studies thatrelate LV mass to prognosis are based on this method.56 However,
several caveats need to be mentioned. First, it is critical that the wallthickness and LV dimensions measured be truly perpendicular tothe long axis of the left ventricle. Therefore, 2D-guided M-mode im-aging or measurements from 2D echocardiographic images arepreferred over blind M-mode imaging. Second, the formula includesa correction for the 20% overestimation that was found during theoriginal validation studies of the M-mode technique. Because direct2D measures of wall thickness may yield smaller values than theM-mode technique, LV mass calculated using this formula may notbe directly interchangeable (Table 5). This may be a less importantconsideration if the method is being used to identify cutoff valuesfor prognosis. It is also important to note that the formula raises thelinear dimensions to the power of 3, and thus even small errors in di-mensions can have significant effects on the calculated LV mass.
Most studies that have compared 2D-guided M-mode measure-ments of LV mass with the 2D echocardiographic area-length or trun-cated ellipsoid methods in normally shaped ventricles have shownsubtle differences but no clear advantage of one technique over theother.57 However, comparison studies have not been performed inthe current era, when tremendous gains in 2D echocardiographic im-age quality have been made. In fact, large population studies confirm-ing or reestablishing normal values for LV mass with harmonicimaging are limited.58,59
Because 3DE is the only echocardiographic method that directlymeasures myocardial volume, it is an appropriate approach.Numerous validation studies have been performed.60 However, todate, there have been few studies assessing its practical use, feasibility,variability, or prognostic value in large-scale clinical environments.61
Accordingly, it is the consensus of this committee that the 3D echo-cardiographic LV mass data available in normal subjects are not suffi-cient to recommend normal reference values. It must also be notedthat continuous improvements in the spatial and temporal resolutionof 3D echocardiographic imaging will also influence normal valuesand measurement variability.
In patients with upper septal hypertrophy, the linear dimensionmethods, which use basal ventricular measurements, result in over-estimation of the true mass, because the thickest region of the
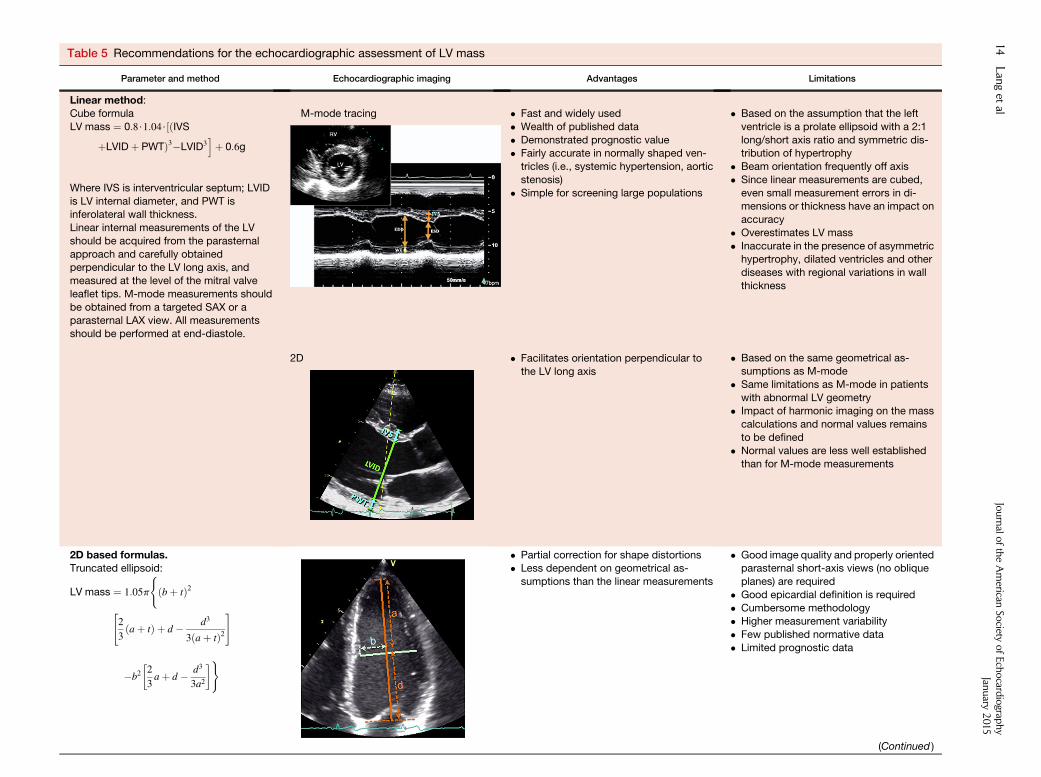
Table 5 Recommendations for the echocardiographic assessment of LV mass
Parameter and method Echocardiographic imaging Advantages Limitations
Linear method:Cube formula
LV mass ¼ 0:8$1:04$½ðIVSþLVIDþ PWTÞ3�LVID3
iþ 0:6g
Where IVS is interventricular septum; LVID
is LV internal diameter, and PWT isinferolateral wall thickness.
Linear internal measurements of the LV
should be acquired from the parasternal
approach and carefully obtainedperpendicular to the LV long axis, and
measured at the level of the mitral valve
leaflet tips. M-mode measurements should
be obtained from a targeted SAX or aparasternal LAX view. All measurements
should be performed at end-diastole.
M-mode tracing
2D
� Fast and widely used
� Wealth of published data
� Demonstrated prognostic value� Fairly accurate in normally shaped ven-
tricles (i.e., systemic hypertension, aortic
stenosis)
� Simple for screening large populations
� Facilitates orientation perpendicular to
the LV long axis
� Based on the assumption that the left
ventricle is a prolate ellipsoid with a 2:1
long/short axis ratio and symmetric dis-tribution of hypertrophy
� Beam orientation frequently off axis
� Since linear measurements are cubed,
even small measurement errors in di-mensions or thickness have an impact on
accuracy
� Overestimates LV mass
� Inaccurate in the presence of asymmetrichypertrophy, dilated ventricles and other
diseases with regional variations in wall
thickness
� Based on the same geometrical as-sumptions as M-mode
� Same limitations as M-mode in patients
with abnormal LV geometry� Impact of harmonic imaging on the mass
calculations and normal values remains
to be defined
� Normal values are less well establishedthan for M-mode measurements
2D based formulas.Truncated ellipsoid:
LV mass ¼ 1:05p
(ðbþ tÞ2
"2
3ðaþ tÞ þ d � d3
3ðaþ tÞ2#
�b2�2
3aþ d � d3
3a2
�)
� Partial correction for shape distortions� Less dependent on geometrical as-
sumptions than the linear measurements
� Good image quality and properly orientedparasternal short-axis views (no oblique
planes) are required
� Good epicardial definition is required
� Cumbersome methodology� Higher measurement variability
� Few published normative data
� Limited prognostic data
(Continued )
14Langet
alJournalo
ftheAmerican
Society
ofEchocard
iograp
hy
January
2015
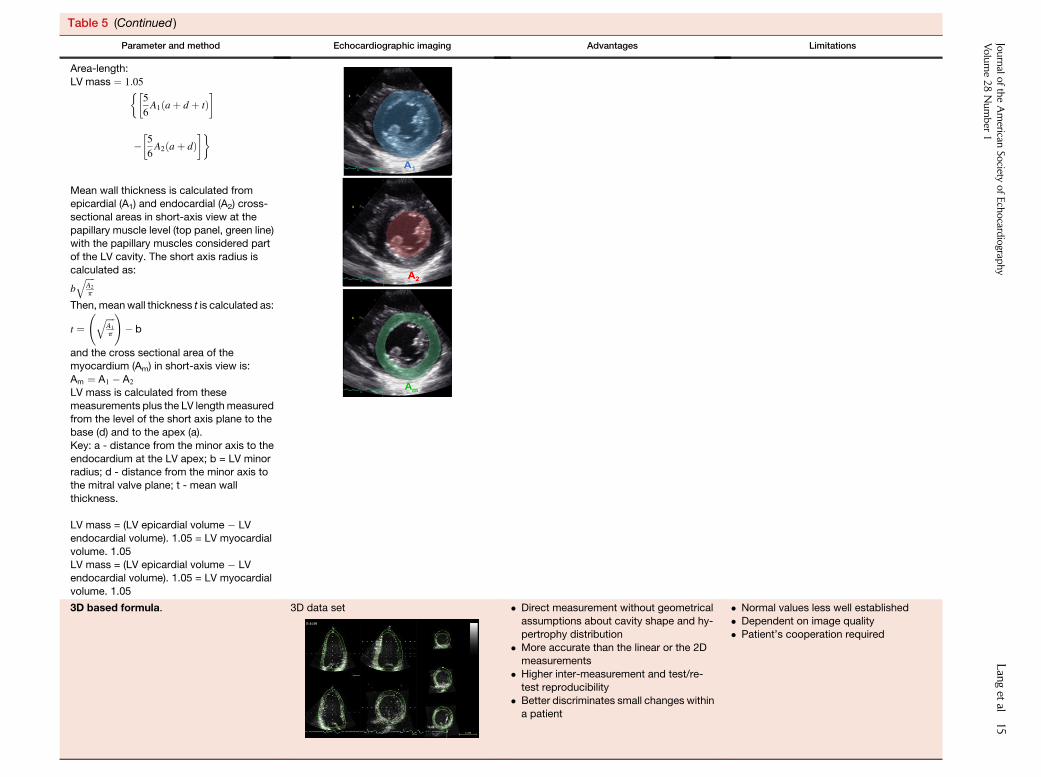
Table 5 (Continued )
Parameter and method Echocardiographic imaging Advantages Limitations
Area-length:
LV mass ¼ 1:05��5
6A1ðaþ d þ tÞ
�
��5
6A2ðaþ dÞ
��
Mean wall thickness is calculated fromepicardial (A1) and endocardial (A2) cross-
sectional areas in short-axis view at the
papillary muscle level (top panel, green line)with the papillary muscles considered part
of the LV cavity. The short axis radius is
calculated as:
bffiffiffiffiA2
p
qThen,meanwall thickness t is calculated as:
t ¼ ffiffiffiffi
A1
p
q !� b
and the cross sectional area of themyocardium (Am) in short-axis view is:
Am ¼ A1 � A2
LV mass is calculated from these
measurements plus the LV lengthmeasuredfrom the level of the short axis plane to the
base (d) and to the apex (a).
Key: a - distance from the minor axis to the
endocardium at the LV apex; b = LV minorradius; d - distance from the minor axis to
the mitral valve plane; t - mean wall
thickness.
LV mass = (LV epicardial volume � LV
endocardial volume). 1.05 = LV myocardial
volume. 1.05LV mass = (LV epicardial volume � LV
endocardial volume). 1.05 = LV myocardial
volume. 1.05
3D based formula. 3D data set � Direct measurement without geometrical
assumptions about cavity shape and hy-
pertrophy distribution
� More accurate than the linear or the 2Dmeasurements
� Higher inter-measurement and test/re-
test reproducibility
� Better discriminates small changes withina patient
� Normal values less well established
� Dependent on image quality
� Patient’s cooperation required
Journalo
ftheAmerican
Society
ofEchocard
iograp
hy
Volume28Number
1Langet
al15
16 Lang et al Journal of the American Society of EchocardiographyJanuary 2015
interventricular septum is incorporated in the measurement. Incontrast, the area-length method, which uses mid-ventricular mea-surements, underestimates LV mass, because the thickest part ofthe interventricular septum is not included in the measurement. Inthe setting of discrete upper septal or asymmetric hypertrophy, ifthese methods are used to serially assess LV mass in a patient, it iscritical to use the same methodology over time and to measurethe walls at the same level of the ventricle. The 3D method hasthe advantage of accommodating regional differences in wall thick-ness and therefore can provide the most accurate measurements ofLV mass in this setting.
The values for LV mass vary according to gender, age, body size,obesity, and region of the world. Therefore, uniform reference valuesare difficult to define. LV mass is higher in men independent of bodysize and increases with body size. Since the publication of the 2005 rec-ommendations, several studies,mostly using linearmeasurements, havereported normal values of LV mass in normal populations.59,62-66 Thelarger studies reported values close to those recommended in theprevious guidelines.62,65,66 Therefore, the same reference values andabnormality partition cutoffs as reported in the previous guidelinescontinue to be recommended (Table 6). However, characterization ofthe population being studied, and differences inmass betweendifferentethnic populations should be taken into account when determiningnormal values.10,16,67-69
The indexing of LV mass allows comparisons in subjects withdifferent body sizes. However, whether to use height, weight, orBSA as the indexing term remains controversial. Studies suggestthat indexing to height raised to allometric powers such as 1.7, 2.13,and 2.7 has advantages over indexing to BSA, especially when at-tempting to predict events in obese patients.65,70 However mostlarge population studies reporting LV mass have indexed to BSA.
Finally, calculation of relative wall thickness (RWT) with the for-mula (2 � posterior wall thickness)/(LV internal diameter at end-diastole) permits categorization of an increase in LV mass as eitherconcentric (RWT > 0.42) or eccentric (RWT # 0.42) hypertrophyand allows the identification of concentric remodeling (normal LVmass with increased RWT) (Figure 6).
Recommendations. In the normally shaped left ventricle, bothM-mode and 2D echocardiographic formulas to calculate LV masscan be used. Normal values for these techniques remain unchangedfrom the previous guidelines and should be reported indexed toBSA. Reference upper limits of normal LV mass by linear measure-ments are 95 g/m2 in women and 115 g/m2 in men. Reference up-per limits of normal LV mass by 2D measurements are 88 g/m2 inwomen and 102 g/m2 in men with 2D methods. Because 3DE isthe only echocardiographic technique that measures myocardial vol-ume directly, without geometric assumptions regarding LV shapeand distribution of wall thickening, this technique is promising andmay be used in abnormally shaped ventricles or in patients withasymmetric or localized hypertrophy. Limited upper normal limitsof 3D echocardiographic LV mass data are currently available inthe literature but are insufficient to substantiate recommendationsfor reference values.
II. THE RIGHT VENTRICLE
The right ventricle has a unique crescent shape, which addscomplexity to the quantification of its size and function. This chamberplays an important role in the morbidity and mortality of patients pre-
senting with signs and symptoms of cardiopulmonary disease. Untilrecently, little uniformity in echocardiographic imaging of the rightheart existed because of a lack of familiarity with various techniques,and the enormous attention directed toward left heart quantification.The ASE has recently published a guidelines document, endorsed bythe EACVI and the Canadian Society of Echocardiography, standard-izing the approach for the evaluation of right heart dimensions andfunction during echocardiographic assessment of the right heart inadults.71 Compared with that document, this section provides up-dated reference values for RV dimensions and most parameters ofsystolic and diastolic function, which should replace the previouslypublished guideline.
5. General Recommendations for RV Quantification
In all clinical studies, a comprehensive examination of the rightventricle should be performed, taking into account the study indica-tion and available clinical information. The operator should examinethe right ventricle using multiple acoustic windows, and the reportshould present an assessment based on both qualitative and quantita-tive parameters. Parameters that can be measured include RV andright atrial (RA) size, a measure of RV systolic function, as assessedby at least one or a combination of the following: fractional areachange (FAC), DTI-derived tricuspid lateral annular systolic velocitywave (S0), tricuspid annular plane systolic excursion (TAPSE), andRV index of myocardial performance (RIMP). RV systolic pressure,typically calculated using the tricuspid regurgitation jet and an estima-tion of RA pressure based on inferior vena cava (IVC) size and collaps-ibility, should be reported when a complete TR Doppler velocityenvelope is present.71 When feasible, additional parameters such asRV volumes and EF using 3DE should complement the basic 2Dechocardiographic measurements listed above. The recommendedmethods, as well as the advantages and limitations of each parameter,are summarized in Tables 7 and 9, whereas the new reference valuesare displayed in Tables 8 and 10. These reference values are based onpublished mean and SD data obtained from normal adult individualswithout any histories of heart or pulmonary disease (SupplementalTable 7). This document uses the same methodology as in the previ-ous RV guidelines, whereby a meta-analysis was performed for eachparameter.
Not all of the recommended values are identical to those publishedin the previous guidelines.71 On the basis of the inclusion of new datapublished in recent reports, minor changes were made in the cutoffvalues for RV dimension, S0, TAPSE, and RIMP. New publicationssince the last guidelines have resulted in changes in the referencevalues for 3DE-derived RV EF and volumes (Tables 8 and 10). It isimportant for the reader to recognize that most of the valuesproposed are not indexed to gender, BSA, or height, despite datasuggesting the advantages of indexing.72-75 As a result, it is possiblethat patients at either extreme of height or BSA may bemisclassified as having values outside the reference ranges, and it isrecommended that the interpreting physician consider theseparameters when generating the report. This potentialmisclassification also applies to other groups, such as patients withcongenital heart disease and endurance athletes, for whom specificreference values are nonexistent.76
6. Essential Imaging Windows and Views
Apical four-chamber, RV-focused apical four-chamber and modifiedapical four-chamber (Figure 7A), left parasternal long- and
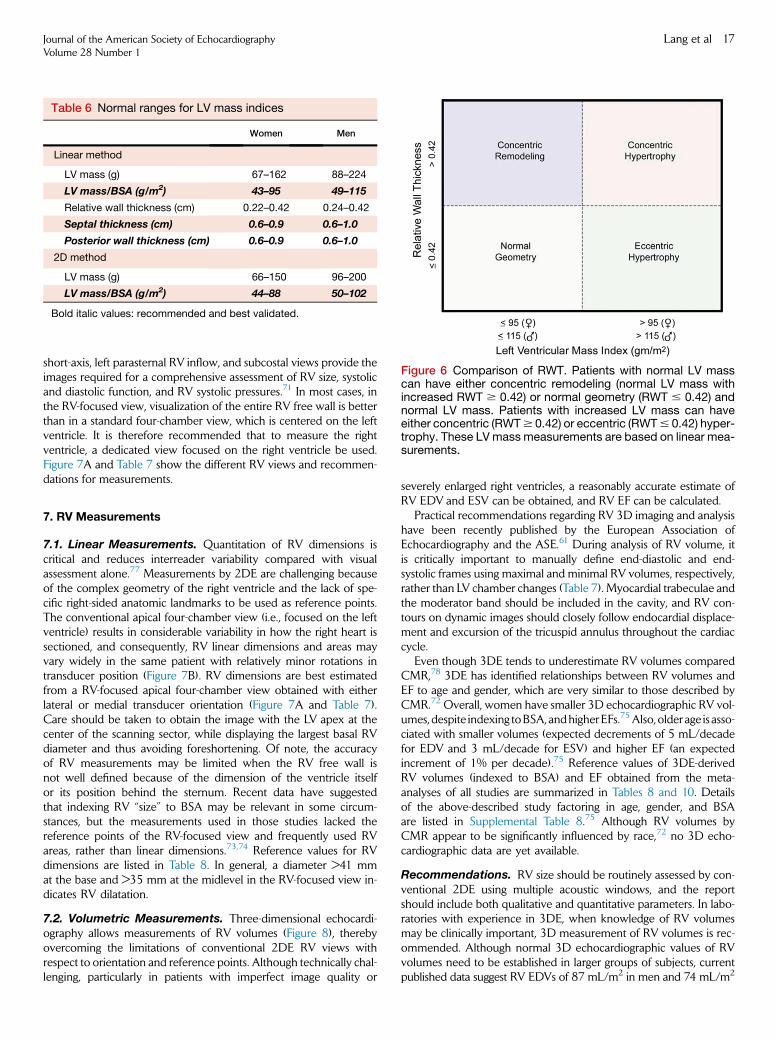
Table 6 Normal ranges for LV mass indices
Women Men
Linear method
LV mass (g) 67–162 88–224
LV mass/BSA (g/m2) 43–95 49–115
Relative wall thickness (cm) 0.22–0.42 0.24–0.42
Septal thickness (cm) 0.6–0.9 0.6–1.0
Posterior wall thickness (cm) 0.6–0.9 0.6–1.0
2D method
LV mass (g) 66–150 96–200
LV mass/BSA (g/m2) 44–88 50–102
Bold italic values: recommended and best validated.
Figure 6 Comparison of RWT. Patients with normal LV masscan have either concentric remodeling (normal LV mass withincreased RWT $ 0.42) or normal geometry (RWT # 0.42) andnormal LV mass. Patients with increased LV mass can haveeither concentric (RWT$ 0.42) or eccentric (RWT# 0.42) hyper-trophy. These LVmass measurements are based on linear mea-surements.
Journal of the American Society of EchocardiographyVolume 28 Number 1
Lang et al 17
short-axis, left parasternal RV inflow, and subcostal views provide theimages required for a comprehensive assessment of RV size, systolicand diastolic function, and RV systolic pressures.71 In most cases, inthe RV-focused view, visualization of the entire RV free wall is betterthan in a standard four-chamber view, which is centered on the leftventricle. It is therefore recommended that to measure the rightventricle, a dedicated view focused on the right ventricle be used.Figure 7A and Table 7 show the different RV views and recommen-dations for measurements.
7. RV Measurements
7.1. Linear Measurements. Quantitation of RV dimensions iscritical and reduces interreader variability compared with visualassessment alone.77 Measurements by 2DE are challenging becauseof the complex geometry of the right ventricle and the lack of spe-cific right-sided anatomic landmarks to be used as reference points.The conventional apical four-chamber view (i.e., focused on the leftventricle) results in considerable variability in how the right heart issectioned, and consequently, RV linear dimensions and areas mayvary widely in the same patient with relatively minor rotations intransducer position (Figure 7B). RV dimensions are best estimatedfrom a RV-focused apical four-chamber view obtained with eitherlateral or medial transducer orientation (Figure 7A and Table 7).Care should be taken to obtain the image with the LV apex at thecenter of the scanning sector, while displaying the largest basal RVdiameter and thus avoiding foreshortening. Of note, the accuracyof RV measurements may be limited when the RV free wall isnot well defined because of the dimension of the ventricle itselfor its position behind the sternum. Recent data have suggestedthat indexing RV ‘‘size’’ to BSA may be relevant in some circum-stances, but the measurements used in those studies lacked thereference points of the RV-focused view and frequently used RVareas, rather than linear dimensions.73,74 Reference values for RVdimensions are listed in Table 8. In general, a diameter >41 mmat the base and >35 mm at the midlevel in the RV-focused view in-dicates RV dilatation.
7.2. Volumetric Measurements. Three-dimensional echocardi-ography allows measurements of RV volumes (Figure 8), therebyovercoming the limitations of conventional 2DE RV views withrespect to orientation and reference points. Although technically chal-lenging, particularly in patients with imperfect image quality or
severely enlarged right ventricles, a reasonably accurate estimate ofRV EDV and ESV can be obtained, and RV EF can be calculated.
Practical recommendations regarding RV 3D imaging and analysishave been recently published by the European Association ofEchocardiography and the ASE.61 During analysis of RV volume, itis critically important to manually define end-diastolic and end-systolic frames using maximal and minimal RV volumes, respectively,rather than LV chamber changes (Table 7). Myocardial trabeculae andthe moderator band should be included in the cavity, and RV con-tours on dynamic images should closely follow endocardial displace-ment and excursion of the tricuspid annulus throughout the cardiaccycle.
Even though 3DE tends to underestimate RV volumes comparedCMR,78 3DE has identified relationships between RV volumes andEF to age and gender, which are very similar to those described byCMR.72 Overall, women have smaller 3D echocardiographic RV vol-umes, despite indexing toBSA, andhigherEFs.75Also, older age is asso-ciated with smaller volumes (expected decrements of 5 mL/decadefor EDV and 3 mL/decade for ESV) and higher EF (an expectedincrement of 1% per decade).75 Reference values of 3DE-derivedRV volumes (indexed to BSA) and EF obtained from the meta-analyses of all studies are summarized in Tables 8 and 10. Detailsof the above-described study factoring in age, gender, and BSAare listed in Supplemental Table 8.75 Although RV volumes byCMR appear to be significantly influenced by race,72 no 3D echo-cardiographic data are yet available.
Recommendations. RV size should be routinely assessed by con-ventional 2DE using multiple acoustic windows, and the reportshould include both qualitative and quantitative parameters. In labo-ratories with experience in 3DE, when knowledge of RV volumesmay be clinically important, 3D measurement of RV volumes is rec-ommended. Although normal 3D echocardiographic values of RVvolumes need to be established in larger groups of subjects, currentpublished data suggest RV EDVs of 87 mL/m2 in men and 74 mL/m2
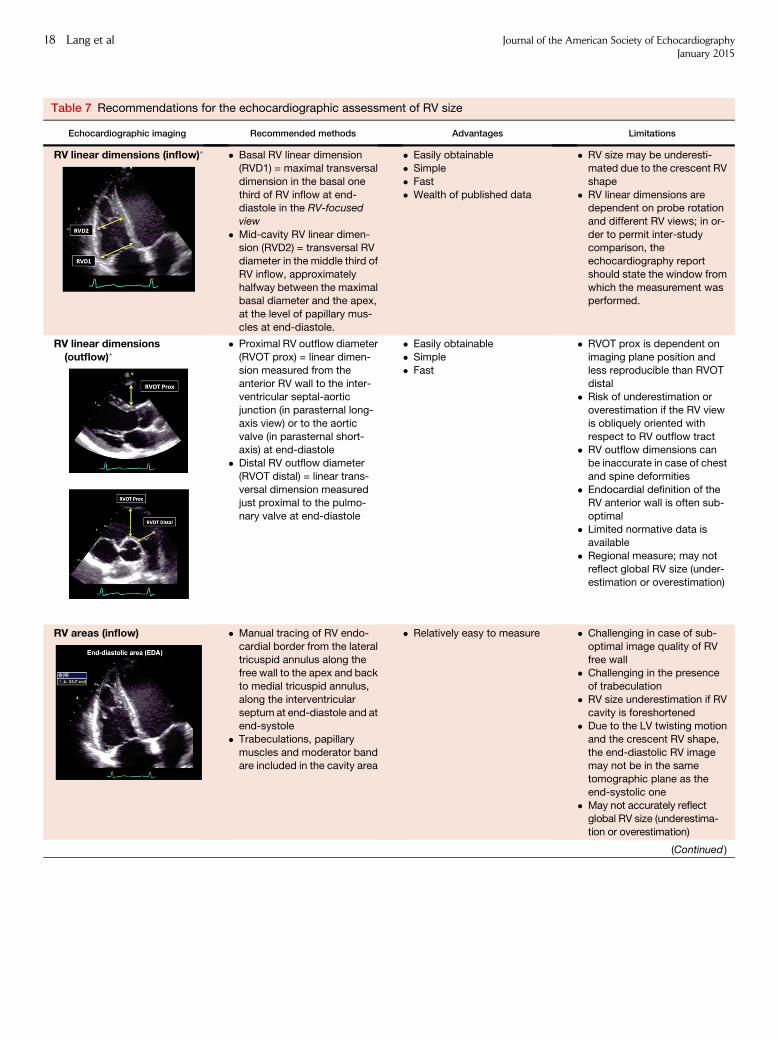
Table 7 Recommendations for the echocardiographic assessment of RV size
Echocardiographic imaging Recommended methods Advantages Limitations
RV linear dimensions (inflow)* � Basal RV linear dimension
(RVD1) = maximal transversal
dimension in the basal one
third of RV inflow at end-diastole in the RV-focused
view
� Mid-cavity RV linear dimen-sion (RVD2) = transversal RV
diameter in the middle third of
RV inflow, approximately
halfway between the maximalbasal diameter and the apex,
at the level of papillary mus-
cles at end-diastole.
� Easily obtainable
� Simple
� Fast
� Wealth of published data
� RV size may be underesti-
mated due to the crescent RV
shape
� RV linear dimensions aredependent on probe rotation
and different RV views; in or-
der to permit inter-studycomparison, the
echocardiography report
should state the window from
which the measurement wasperformed.
RV linear dimensions(outflow)*
� Proximal RV outflow diameter
(RVOT prox) = linear dimen-
sion measured from the
anterior RV wall to the inter-ventricular septal-aortic
junction (in parasternal long-
axis view) or to the aortic
valve (in parasternal short-axis) at end-diastole
� Distal RV outflow diameter
(RVOT distal) = linear trans-
versal dimension measuredjust proximal to the pulmo-
nary valve at end-diastole
� Easily obtainable
� Simple
� Fast
� RVOT prox is dependent on
imaging plane position and
less reproducible than RVOT
distal� Risk of underestimation or
overestimation if the RV view
is obliquely oriented with
respect to RV outflow tract� RV outflow dimensions can
be inaccurate in case of chest
and spine deformities
� Endocardial definition of theRV anterior wall is often sub-
optimal
� Limited normative data isavailable
� Regional measure; may not
reflect global RV size (under-
estimation or overestimation)
RV areas (inflow) � Manual tracing of RV endo-
cardial border from the lateral
tricuspid annulus along thefree wall to the apex and back
to medial tricuspid annulus,
along the interventricular
septum at end-diastole and atend-systole
� Trabeculations, papillary
muscles and moderator bandare included in the cavity area
� Relatively easy to measure � Challenging in case of sub-
optimal image quality of RV
free wall� Challenging in the presence
of trabeculation
� RV size underestimation if RV
cavity is foreshortened� Due to the LV twisting motion
and the crescent RV shape,
the end-diastolic RV imagemay not be in the same
tomographic plane as the
end-systolic one
� May not accurately reflectglobal RV size (underestima-
tion or overestimation)
(Continued )
18 Lang et al Journal of the American Society of EchocardiographyJanuary 2015
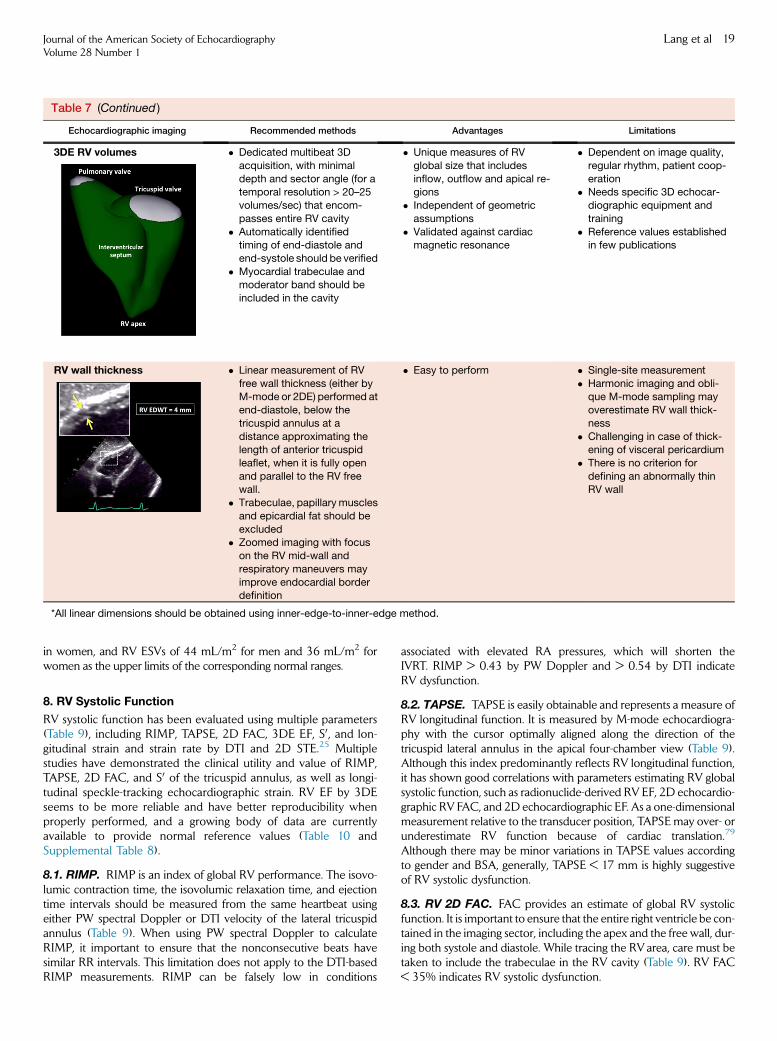
Table 7 (Continued )
Echocardiographic imaging Recommended methods Advantages Limitations
3DE RV volumes � Dedicated multibeat 3D
acquisition, with minimal
depth and sector angle (for atemporal resolution > 20–25
volumes/sec) that encom-
passes entire RV cavity
� Automatically identifiedtiming of end-diastole and
end-systole should be verified
� Myocardial trabeculae andmoderator band should be
included in the cavity
� Unique measures of RV
global size that includes
inflow, outflow and apical re-gions
� Independent of geometric
assumptions
� Validated against cardiacmagnetic resonance
� Dependent on image quality,
regular rhythm, patient coop-
eration� Needs specific 3D echocar-
diographic equipment and
training
� Reference values establishedin few publications
RV wall thickness � Linear measurement of RV
free wall thickness (either byM-mode or 2DE) performed at
end-diastole, below the
tricuspid annulus at a
distance approximating thelength of anterior tricuspid
leaflet, when it is fully open
and parallel to the RV freewall.
� Trabeculae, papillary muscles
and epicardial fat should be
excluded� Zoomed imaging with focus
on the RV mid-wall and
respiratory maneuvers may
improve endocardial borderdefinition
� Easy to perform � Single-site measurement
� Harmonic imaging and obli-que M-mode sampling may
overestimate RV wall thick-
ness
� Challenging in case of thick-ening of visceral pericardium
� There is no criterion for
defining an abnormally thinRV wall
*All linear dimensions should be obtained using inner-edge-to-inner-edge method.
Journal of the American Society of EchocardiographyVolume 28 Number 1
Lang et al 19
in women, and RV ESVs of 44 mL/m2 for men and 36 mL/m2 forwomen as the upper limits of the corresponding normal ranges.
8. RV Systolic Function
RV systolic function has been evaluated using multiple parameters(Table 9), including RIMP, TAPSE, 2D FAC, 3DE EF, S0, and lon-gitudinal strain and strain rate by DTI and 2D STE.25 Multiplestudies have demonstrated the clinical utility and value of RIMP,TAPSE, 2D FAC, and S0 of the tricuspid annulus, as well as longi-tudinal speckle-tracking echocardiographic strain. RV EF by 3DEseems to be more reliable and have better reproducibility whenproperly performed, and a growing body of data are currentlyavailable to provide normal reference values (Table 10 andSupplemental Table 8).
8.1. RIMP. RIMP is an index of global RV performance. The isovo-lumic contraction time, the isovolumic relaxation time, and ejectiontime intervals should be measured from the same heartbeat usingeither PW spectral Doppler or DTI velocity of the lateral tricuspidannulus (Table 9). When using PW spectral Doppler to calculateRIMP, it important to ensure that the nonconsecutive beats havesimilar RR intervals. This limitation does not apply to the DTI-basedRIMP measurements. RIMP can be falsely low in conditions
associated with elevated RA pressures, which will shorten theIVRT. RIMP > 0.43 by PW Doppler and > 0.54 by DTI indicateRV dysfunction.
8.2. TAPSE. TAPSE is easily obtainable and represents a measure ofRV longitudinal function. It is measured by M-mode echocardiogra-phy with the cursor optimally aligned along the direction of thetricuspid lateral annulus in the apical four-chamber view (Table 9).Although this index predominantly reflects RV longitudinal function,it has shown good correlations with parameters estimating RV globalsystolic function, such as radionuclide-derived RV EF, 2D echocardio-graphic RV FAC, and 2D echocardiographic EF. As a one-dimensionalmeasurement relative to the transducer position, TAPSE may over- orunderestimate RV function because of cardiac translation.79
Although there may be minor variations in TAPSE values accordingto gender and BSA, generally, TAPSE < 17 mm is highly suggestiveof RV systolic dysfunction.
8.3. RV 2D FAC. FAC provides an estimate of global RV systolicfunction. It is important to ensure that the entire right ventricle be con-tained in the imaging sector, including the apex and the free wall, dur-ing both systole and diastole. While tracing the RVarea, care must betaken to include the trabeculae in the RV cavity (Table 9). RV FAC< 35% indicates RV systolic dysfunction.
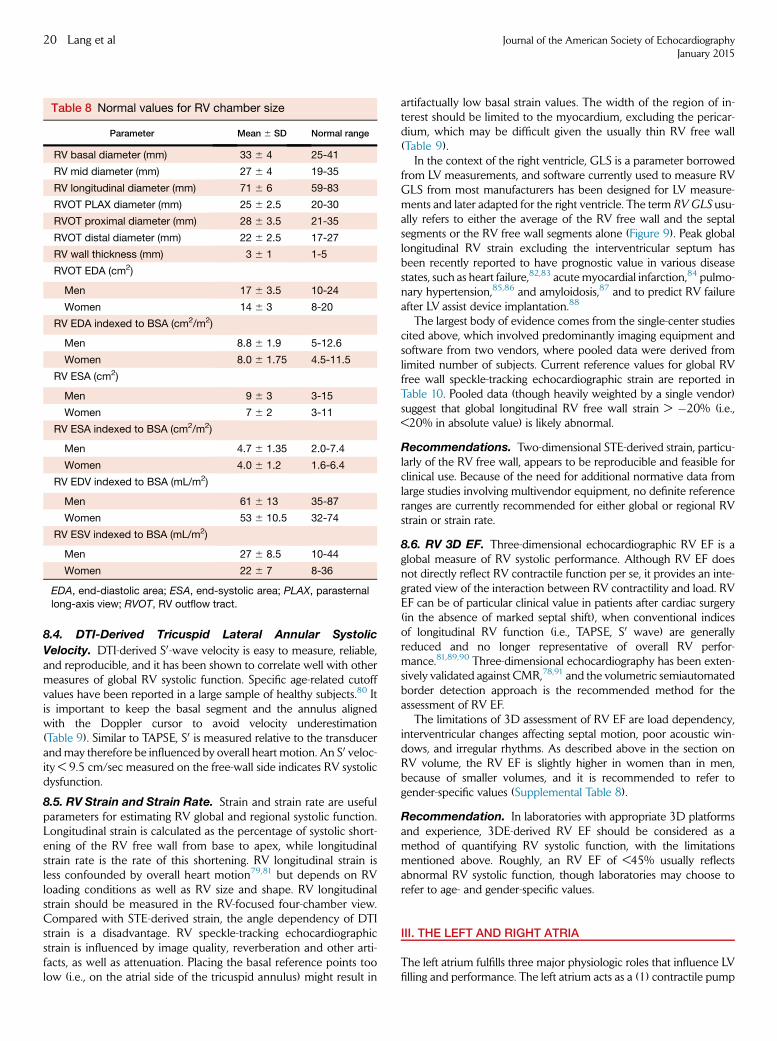
Table 8 Normal values for RV chamber size
Parameter Mean 6 SD Normal range
RV basal diameter (mm) 33 6 4 25-41
RV mid diameter (mm) 27 6 4 19-35
RV longitudinal diameter (mm) 71 6 6 59-83
RVOT PLAX diameter (mm) 25 6 2.5 20-30
RVOT proximal diameter (mm) 28 6 3.5 21-35
RVOT distal diameter (mm) 22 6 2.5 17-27
RV wall thickness (mm) 3 6 1 1-5
RVOT EDA (cm2)
Men 17 6 3.5 10-24
Women 14 6 3 8-20
RV EDA indexed to BSA (cm2/m2)
Men 8.8 6 1.9 5-12.6
Women 8.0 6 1.75 4.5-11.5
RV ESA (cm2)
Men 9 6 3 3-15
Women 7 6 2 3-11
RV ESA indexed to BSA (cm2/m2)
Men 4.7 6 1.35 2.0-7.4
Women 4.0 6 1.2 1.6-6.4
RV EDV indexed to BSA (mL/m2)
Men 61 6 13 35-87
Women 53 6 10.5 32-74
RV ESV indexed to BSA (mL/m2)
Men 27 6 8.5 10-44
Women 22 6 7 8-36
EDA, end-diastolic area; ESA, end-systolic area; PLAX, parasternal
long-axis view; RVOT, RV outflow tract.
20 Lang et al Journal of the American Society of EchocardiographyJanuary 2015
8.4. DTI-Derived Tricuspid Lateral Annular Systolic
Velocity. DTI-derived S0-wave velocity is easy to measure, reliable,and reproducible, and it has been shown to correlate well with othermeasures of global RV systolic function. Specific age-related cutoffvalues have been reported in a large sample of healthy subjects.80 Itis important to keep the basal segment and the annulus alignedwith the Doppler cursor to avoid velocity underestimation(Table 9). Similar to TAPSE, S0 is measured relative to the transducerandmay therefore be influenced by overall heart motion. An S0 veloc-ity < 9.5 cm/sec measured on the free-wall side indicates RV systolicdysfunction.
8.5. RV Strain and Strain Rate. Strain and strain rate are usefulparameters for estimating RV global and regional systolic function.Longitudinal strain is calculated as the percentage of systolic short-ening of the RV free wall from base to apex, while longitudinalstrain rate is the rate of this shortening. RV longitudinal strain isless confounded by overall heart motion79,81 but depends on RVloading conditions as well as RV size and shape. RV longitudinalstrain should be measured in the RV-focused four-chamber view.Compared with STE-derived strain, the angle dependency of DTIstrain is a disadvantage. RV speckle-tracking echocardiographicstrain is influenced by image quality, reverberation and other arti-facts, as well as attenuation. Placing the basal reference points toolow (i.e., on the atrial side of the tricuspid annulus) might result in
artifactually low basal strain values. The width of the region of in-terest should be limited to the myocardium, excluding the pericar-dium, which may be difficult given the usually thin RV free wall(Table 9).
In the context of the right ventricle, GLS is a parameter borrowedfrom LV measurements, and software currently used to measure RVGLS from most manufacturers has been designed for LV measure-ments and later adapted for the right ventricle. The term RV GLS usu-ally refers to either the average of the RV free wall and the septalsegments or the RV free wall segments alone (Figure 9). Peak globallongitudinal RV strain excluding the interventricular septum hasbeen recently reported to have prognostic value in various diseasestates, such as heart failure,82,83 acute myocardial infarction,84 pulmo-nary hypertension,85,86 and amyloidosis,87 and to predict RV failureafter LV assist device implantation.88
The largest body of evidence comes from the single-center studiescited above, which involved predominantly imaging equipment andsoftware from two vendors, where pooled data were derived fromlimited number of subjects. Current reference values for global RVfree wall speckle-tracking echocardiographic strain are reported inTable 10. Pooled data (though heavily weighted by a single vendor)suggest that global longitudinal RV free wall strain > �20% (i.e.,<20% in absolute value) is likely abnormal.
Recommendations. Two-dimensional STE-derived strain, particu-larly of the RV free wall, appears to be reproducible and feasible forclinical use. Because of the need for additional normative data fromlarge studies involving multivendor equipment, no definite referenceranges are currently recommended for either global or regional RVstrain or strain rate.
8.6. RV 3D EF. Three-dimensional echocardiographic RV EF is aglobal measure of RV systolic performance. Although RV EF doesnot directly reflect RV contractile function per se, it provides an inte-grated view of the interaction between RV contractility and load. RVEF can be of particular clinical value in patients after cardiac surgery(in the absence of marked septal shift), when conventional indicesof longitudinal RV function (i.e., TAPSE, S0 wave) are generallyreduced and no longer representative of overall RV perfor-mance.81,89,90 Three-dimensional echocardiography has been exten-sively validated against CMR,78,91 and the volumetric semiautomatedborder detection approach is the recommended method for theassessment of RV EF.
The limitations of 3D assessment of RV EF are load dependency,interventricular changes affecting septal motion, poor acoustic win-dows, and irregular rhythms. As described above in the section onRV volume, the RV EF is slightly higher in women than in men,because of smaller volumes, and it is recommended to refer togender-specific values (Supplemental Table 8).
Recommendation. In laboratories with appropriate 3D platformsand experience, 3DE-derived RV EF should be considered as amethod of quantifying RV systolic function, with the limitationsmentioned above. Roughly, an RV EF of <45% usually reflectsabnormal RV systolic function, though laboratories may choose torefer to age- and gender-specific values.
III. THE LEFT AND RIGHT ATRIA
The left atrium fulfills three major physiologic roles that influence LVfilling and performance. The left atrium acts as a (1) contractile pump
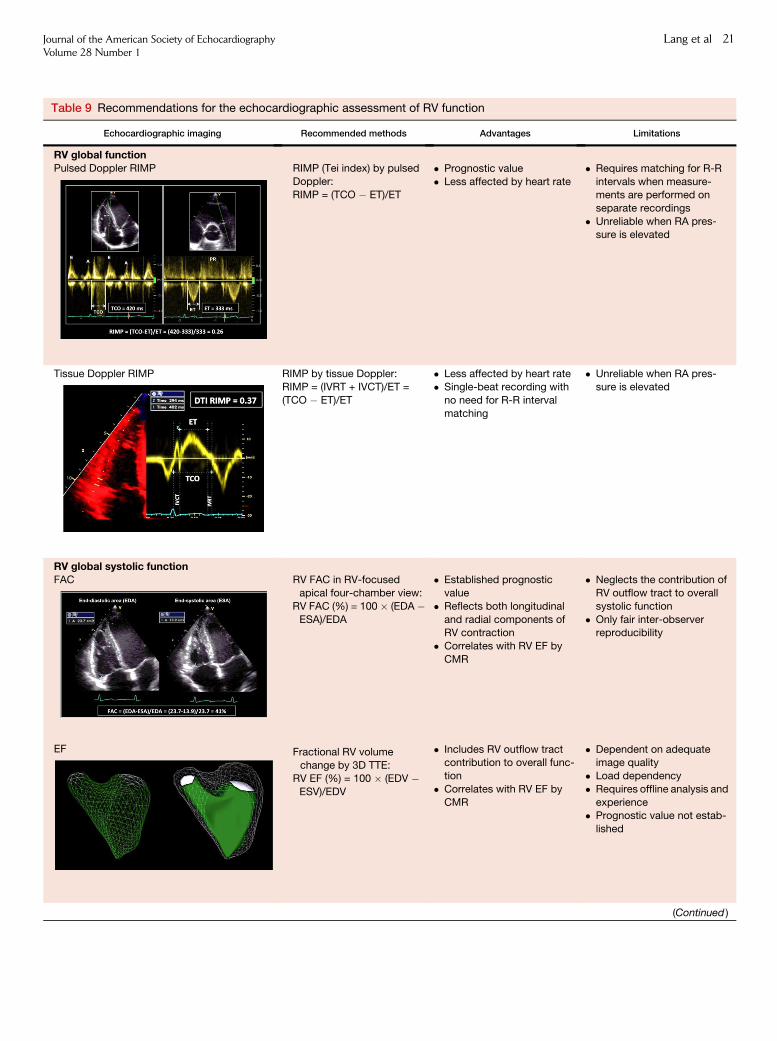
Table 9 Recommendations for the echocardiographic assessment of RV function
Echocardiographic imaging Recommended methods Advantages Limitations
RV global functionPulsed Doppler RIMP RIMP (Tei index) by pulsed
Doppler:
RIMP = (TCO � ET)/ET
� Prognostic value
� Less affected by heart rate
� Requires matching for R-R
intervals when measure-ments are performed on
separate recordings
� Unreliable when RA pres-sure is elevated
Tissue Doppler RIMP RIMP by tissue Doppler:RIMP = (IVRT + IVCT)/ET =
(TCO � ET)/ET
� Less affected by heart rate� Single-beat recording with
no need for R-R interval
matching
� Unreliable when RA pres-sure is elevated
RV global systolic functionFAC
EF
RV FAC in RV-focused
apical four-chamber view:
RV FAC (%) = 100 � (EDA �ESA)/EDA
Fractional RV volume
change by 3D TTE:RV EF (%) = 100 � (EDV �ESV)/EDV
� Established prognostic
value
� Reflects both longitudinal
and radial components ofRV contraction
� Correlates with RV EF by
CMR
� Includes RV outflow tractcontribution to overall func-
tion
� Correlates with RV EF by
CMR
� Neglects the contribution of
RV outflow tract to overall
systolic function
� Only fair inter-observerreproducibility
� Dependent on adequateimage quality
� Load dependency
� Requires offline analysis and
experience� Prognostic value not estab-
lished
(Continued )
Journal of the American Society of EchocardiographyVolume 28 Number 1
Lang et al 21
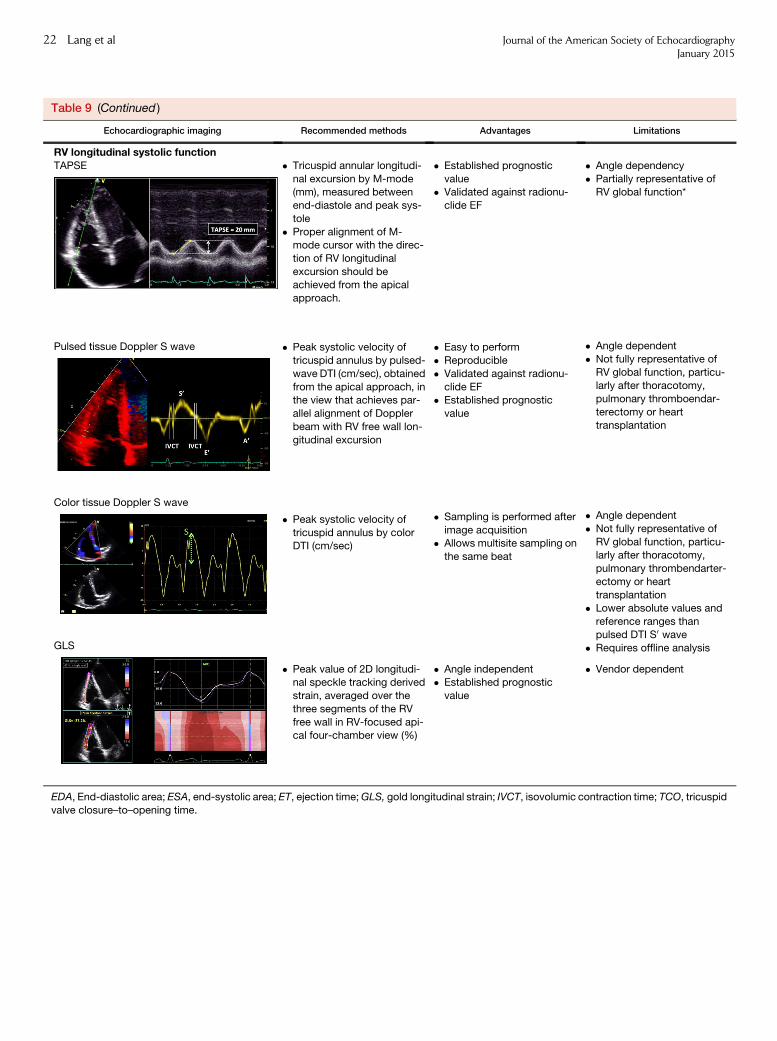
Table 9 (Continued )
Echocardiographic imaging Recommended methods Advantages Limitations
RV longitudinal systolic functionTAPSE
Pulsed tissue Doppler S wave
Color tissue Doppler S wave
GLS
� Tricuspid annular longitudi-
nal excursion by M-mode(mm), measured between
end-diastole and peak sys-
tole
� Proper alignment of M-mode cursor with the direc-
tion of RV longitudinal
excursion should beachieved from the apical
approach.
� Peak systolic velocity of
tricuspid annulus by pulsed-
wave DTI (cm/sec), obtained
from the apical approach, inthe view that achieves par-
allel alignment of Doppler
beam with RV free wall lon-
gitudinal excursion
� Peak systolic velocity of
tricuspid annulus by colorDTI (cm/sec)
� Peak value of 2D longitudi-nal speckle tracking derived
strain, averaged over the
three segments of the RV
free wall in RV-focused api-cal four-chamber view (%)
� Established prognostic
value� Validated against radionu-
clide EF
� Easy to perform
� Reproducible
� Validated against radionu-
clide EF� Established prognostic
value
� Sampling is performed after
image acquisition� Allows multisite sampling on
the same beat
� Angle independent� Established prognostic
value
� Angle dependency
� Partially representative ofRV global function*
� Angle dependent
� Not fully representative ofRV global function, particu-
larly after thoracotomy,
pulmonary thromboendar-terectomy or heart
transplantation
� Angle dependent
� Not fully representative of
RV global function, particu-larly after thoracotomy,
pulmonary thrombendarter-
ectomy or heart
transplantation� Lower absolute values and
reference ranges than
pulsed DTI S0 wave
� Requires offline analysis
� Vendor dependent
EDA, End-diastolic area; ESA, end-systolic area; ET, ejection time;GLS, gold longitudinal strain; IVCT, isovolumic contraction time; TCO, tricuspid
valve closure–to–opening time.
22 Lang et al Journal of the American Society of EchocardiographyJanuary 2015
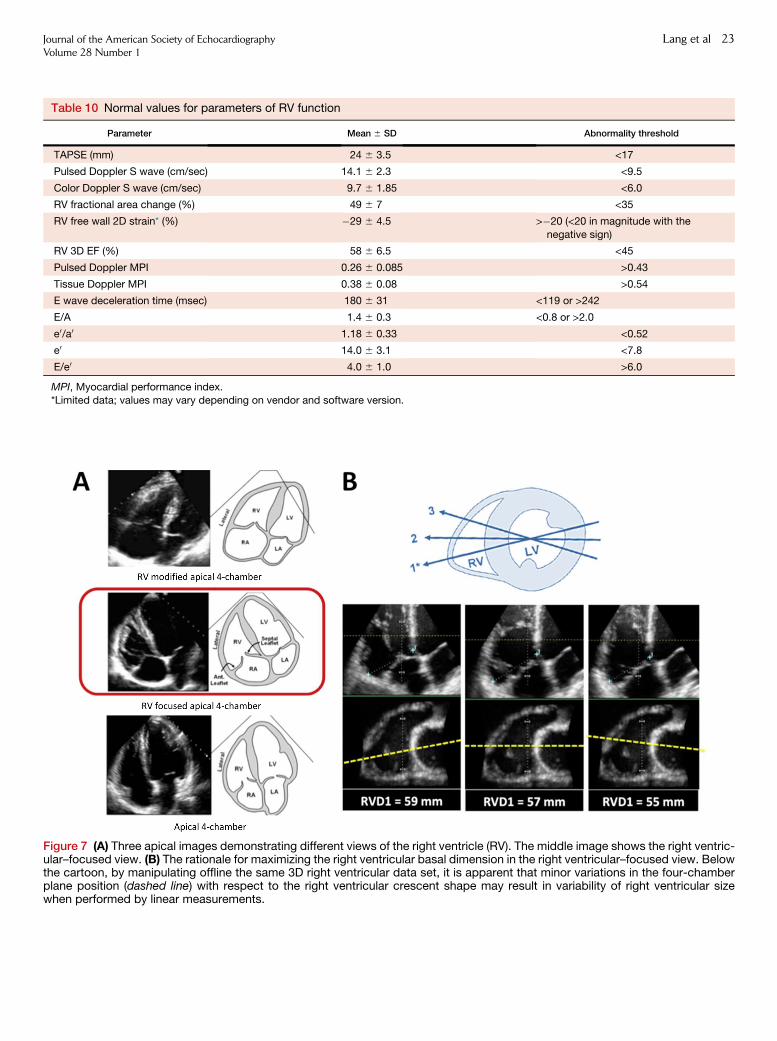
Table 10 Normal values for parameters of RV function
Parameter Mean 6 SD Abnormality threshold
TAPSE (mm) 24 6 3.5 <17
Pulsed Doppler S wave (cm/sec) 14.1 6 2.3 <9.5
Color Doppler S wave (cm/sec) 9.7 6 1.85 <6.0
RV fractional area change (%) 49 6 7 <35
RV free wall 2D strain* (%) �29 6 4.5 >�20 (<20 in magnitude with the
negative sign)
RV 3D EF (%) 58 6 6.5 <45
Pulsed Doppler MPI 0.26 6 0.085 >0.43
Tissue Doppler MPI 0.38 6 0.08 >0.54
E wave deceleration time (msec) 180 6 31 <119 or >242
E/A 1.4 6 0.3 <0.8 or >2.0
e0/a0 1.18 6 0.33 <0.52
e0 14.0 6 3.1 <7.8
E/e0 4.0 6 1.0 >6.0
MPI, Myocardial performance index.
*Limited data; values may vary depending on vendor and software version.
Figure 7 (A) Three apical images demonstrating different views of the right ventricle (RV). The middle image shows the right ventric-ular–focused view. (B) The rationale for maximizing the right ventricular basal dimension in the right ventricular–focused view. Belowthe cartoon, by manipulating offline the same 3D right ventricular data set, it is apparent that minor variations in the four-chamberplane position (dashed line) with respect to the right ventricular crescent shape may result in variability of right ventricular sizewhen performed by linear measurements.
Journal of the American Society of EchocardiographyVolume 28 Number 1
Lang et al 23
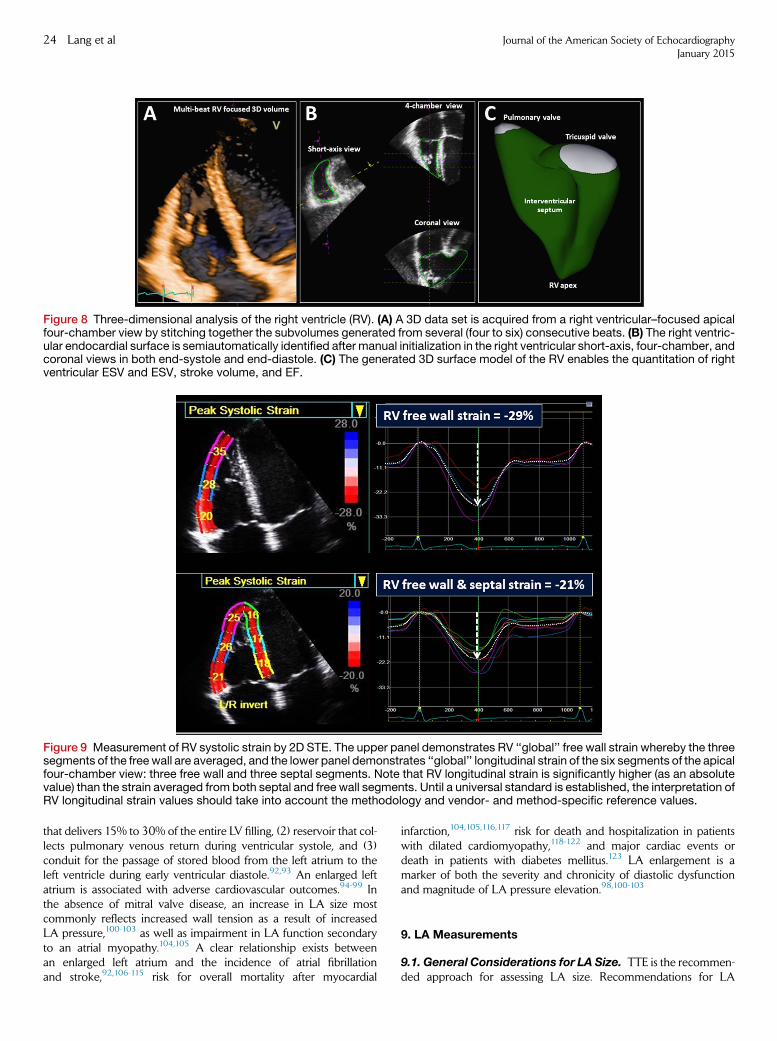
Figure 9 Measurement of RV systolic strain by 2D STE. The upper panel demonstrates RV ‘‘global’’ free wall strain whereby the threesegments of the freewall are averaged, and the lower panel demonstrates ‘‘global’’ longitudinal strain of the six segments of the apicalfour-chamber view: three free wall and three septal segments. Note that RV longitudinal strain is significantly higher (as an absolutevalue) than the strain averaged from both septal and free wall segments. Until a universal standard is established, the interpretation ofRV longitudinal strain values should take into account the methodology and vendor- and method-specific reference values.
Figure 8 Three-dimensional analysis of the right ventricle (RV). (A) A 3D data set is acquired from a right ventricular–focused apicalfour-chamber view by stitching together the subvolumes generated from several (four to six) consecutive beats. (B) The right ventric-ular endocardial surface is semiautomatically identified after manual initialization in the right ventricular short-axis, four-chamber, andcoronal views in both end-systole and end-diastole. (C) The generated 3D surface model of the RV enables the quantitation of rightventricular ESV and ESV, stroke volume, and EF.
24 Lang et al Journal of the American Society of EchocardiographyJanuary 2015
that delivers 15% to 30% of the entire LV filling, (2) reservoir that col-lects pulmonary venous return during ventricular systole, and (3)conduit for the passage of stored blood from the left atrium to theleft ventricle during early ventricular diastole.92,93 An enlarged leftatrium is associated with adverse cardiovascular outcomes.94-99 Inthe absence of mitral valve disease, an increase in LA size mostcommonly reflects increased wall tension as a result of increasedLA pressure,100-103 as well as impairment in LA function secondaryto an atrial myopathy.104,105 A clear relationship exists betweenan enlarged left atrium and the incidence of atrial fibrillationand stroke,92,106-115 risk for overall mortality after myocardial
infarction,104,105,116,117 risk for death and hospitalization in patientswith dilated cardiomyopathy,118-122 and major cardiac events ordeath in patients with diabetes mellitus.123 LA enlargement is amarker of both the severity and chronicity of diastolic dysfunctionand magnitude of LA pressure elevation.98,100-103
9. LA Measurements
9.1. General Considerations for LA Size. TTE is the recommen-ded approach for assessing LA size. Recommendations for LA
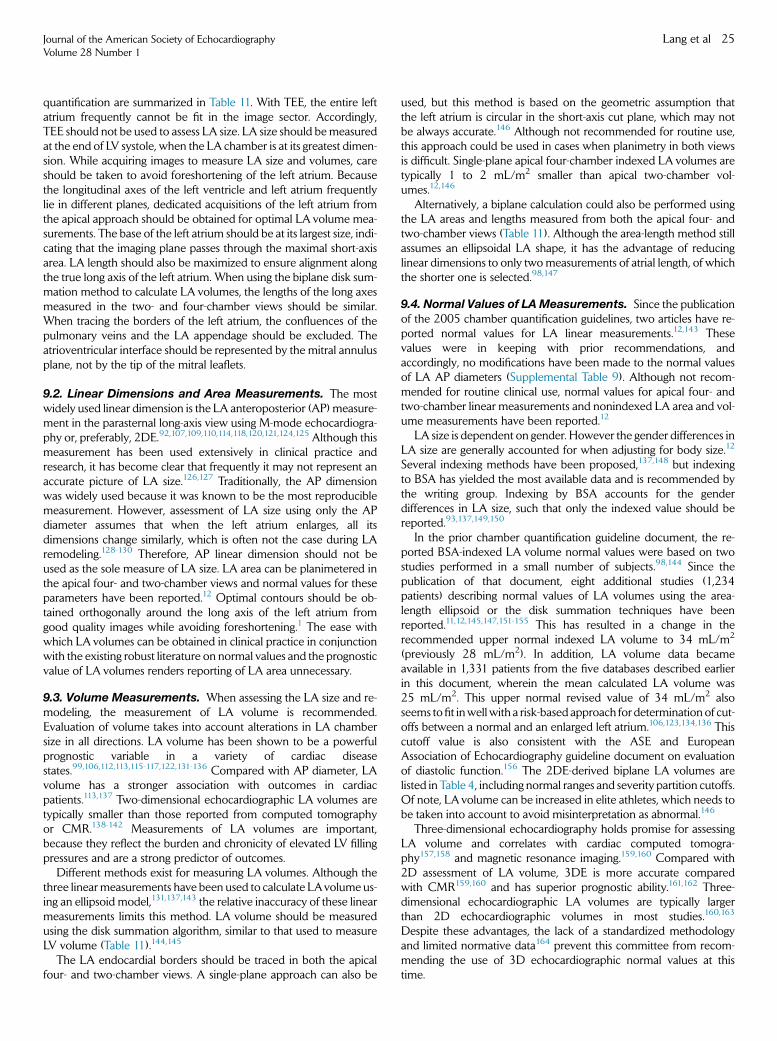
Journal of the American Society of EchocardiographyVolume 28 Number 1
Lang et al 25
quantification are summarized in Table 11. With TEE, the entire leftatrium frequently cannot be fit in the image sector. Accordingly,TEE should not be used to assess LA size. LA size should be measuredat the end of LV systole, when the LA chamber is at its greatest dimen-sion. While acquiring images to measure LA size and volumes, careshould be taken to avoid foreshortening of the left atrium. Becausethe longitudinal axes of the left ventricle and left atrium frequentlylie in different planes, dedicated acquisitions of the left atrium fromthe apical approach should be obtained for optimal LA volume mea-surements. The base of the left atrium should be at its largest size, indi-cating that the imaging plane passes through the maximal short-axisarea. LA length should also be maximized to ensure alignment alongthe true long axis of the left atrium. When using the biplane disk sum-mation method to calculate LA volumes, the lengths of the long axesmeasured in the two- and four-chamber views should be similar.When tracing the borders of the left atrium, the confluences of thepulmonary veins and the LA appendage should be excluded. Theatrioventricular interface should be represented by the mitral annulusplane, not by the tip of the mitral leaflets.
9.2. Linear Dimensions and Area Measurements. The mostwidely used linear dimension is the LA anteroposterior (AP) measure-ment in the parasternal long-axis view using M-mode echocardiogra-phy or, preferably, 2DE.92,107,109,110,114,118,120,121,124,125 Although thismeasurement has been used extensively in clinical practice andresearch, it has become clear that frequently it may not represent anaccurate picture of LA size.126,127 Traditionally, the AP dimensionwas widely used because it was known to be the most reproduciblemeasurement. However, assessment of LA size using only the APdiameter assumes that when the left atrium enlarges, all itsdimensions change similarly, which is often not the case during LAremodeling.128-130 Therefore, AP linear dimension should not beused as the sole measure of LA size. LA area can be planimetered inthe apical four- and two-chamber views and normal values for theseparameters have been reported.12 Optimal contours should be ob-tained orthogonally around the long axis of the left atrium fromgood quality images while avoiding foreshortening.1 The ease withwhich LA volumes can be obtained in clinical practice in conjunctionwith the existing robust literature on normal values and the prognosticvalue of LA volumes renders reporting of LA area unnecessary.
9.3. Volume Measurements. When assessing the LA size and re-modeling, the measurement of LA volume is recommended.Evaluation of volume takes into account alterations in LA chambersize in all directions. LA volume has been shown to be a powerfulprognostic variable in a variety of cardiac diseasestates.99,106,112,113,115-117,122,131-136 Compared with AP diameter, LAvolume has a stronger association with outcomes in cardiacpatients.113,137 Two-dimensional echocardiographic LA volumes aretypically smaller than those reported from computed tomographyor CMR.138-142 Measurements of LA volumes are important,because they reflect the burden and chronicity of elevated LV fillingpressures and are a strong predictor of outcomes.
Different methods exist for measuring LA volumes. Although thethree linearmeasurements have been used to calculate LAvolume us-ing an ellipsoid model,131,137,143 the relative inaccuracy of these linearmeasurements limits this method. LA volume should be measuredusing the disk summation algorithm, similar to that used to measureLV volume (Table 11).144,145
The LA endocardial borders should be traced in both the apicalfour- and two-chamber views. A single-plane approach can also be
used, but this method is based on the geometric assumption thatthe left atrium is circular in the short-axis cut plane, which may notbe always accurate.146 Although not recommended for routine use,this approach could be used in cases when planimetry in both viewsis difficult. Single-plane apical four-chamber indexed LA volumes aretypically 1 to 2 mL/m2 smaller than apical two-chamber vol-umes.12,146
Alternatively, a biplane calculation could also be performed usingthe LA areas and lengths measured from both the apical four- andtwo-chamber views (Table 11). Although the area-length method stillassumes an ellipsoidal LA shape, it has the advantage of reducinglinear dimensions to only twomeasurements of atrial length, of whichthe shorter one is selected.98,147
9.4. Normal Values of LAMeasurements. Since the publicationof the 2005 chamber quantification guidelines, two articles have re-ported normal values for LA linear measurements.12,143 Thesevalues were in keeping with prior recommendations, andaccordingly, no modifications have been made to the normal valuesof LA AP diameters (Supplemental Table 9). Although not recom-mended for routine clinical use, normal values for apical four- andtwo-chamber linear measurements and nonindexed LA area and vol-ume measurements have been reported.12
LA size is dependent on gender. However the gender differences inLA size are generally accounted for when adjusting for body size.12
Several indexing methods have been proposed,137,148 but indexingto BSA has yielded the most available data and is recommended bythe writing group. Indexing by BSA accounts for the genderdifferences in LA size, such that only the indexed value should bereported.93,137,149,150
In the prior chamber quantification guideline document, the re-ported BSA-indexed LA volume normal values were based on twostudies performed in a small number of subjects.98,144 Since thepublication of that document, eight additional studies (1,234patients) describing normal values of LA volumes using the area-length ellipsoid or the disk summation techniques have beenreported.11,12,145,147,151-155 This has resulted in a change in therecommended upper normal indexed LA volume to 34 mL/m2
(previously 28 mL/m2). In addition, LA volume data becameavailable in 1,331 patients from the five databases described earlierin this document, wherein the mean calculated LA volume was25 mL/m2. This upper normal revised value of 34 mL/m2 alsoseems to fit inwell with a risk-based approach for determination of cut-offs between a normal and an enlarged left atrium.106,123,134,136 Thiscutoff value is also consistent with the ASE and EuropeanAssociation of Echocardiography guideline document on evaluationof diastolic function.156 The 2DE-derived biplane LA volumes arelisted in Table 4, including normal ranges and severity partition cutoffs.Of note, LA volume can be increased in elite athletes, which needs tobe taken into account to avoid misinterpretation as abnormal.146
Three-dimensional echocardiography holds promise for assessingLA volume and correlates with cardiac computed tomogra-phy157,158 and magnetic resonance imaging.159,160 Compared with2D assessment of LA volume, 3DE is more accurate comparedwith CMR159,160 and has superior prognostic ability.161,162 Three-dimensional echocardiographic LA volumes are typically largerthan 2D echocardiographic volumes in most studies.160,163
Despite these advantages, the lack of a standardized methodologyand limited normative data164 prevent this committee from recom-mending the use of 3D echocardiographic normal values at thistime.
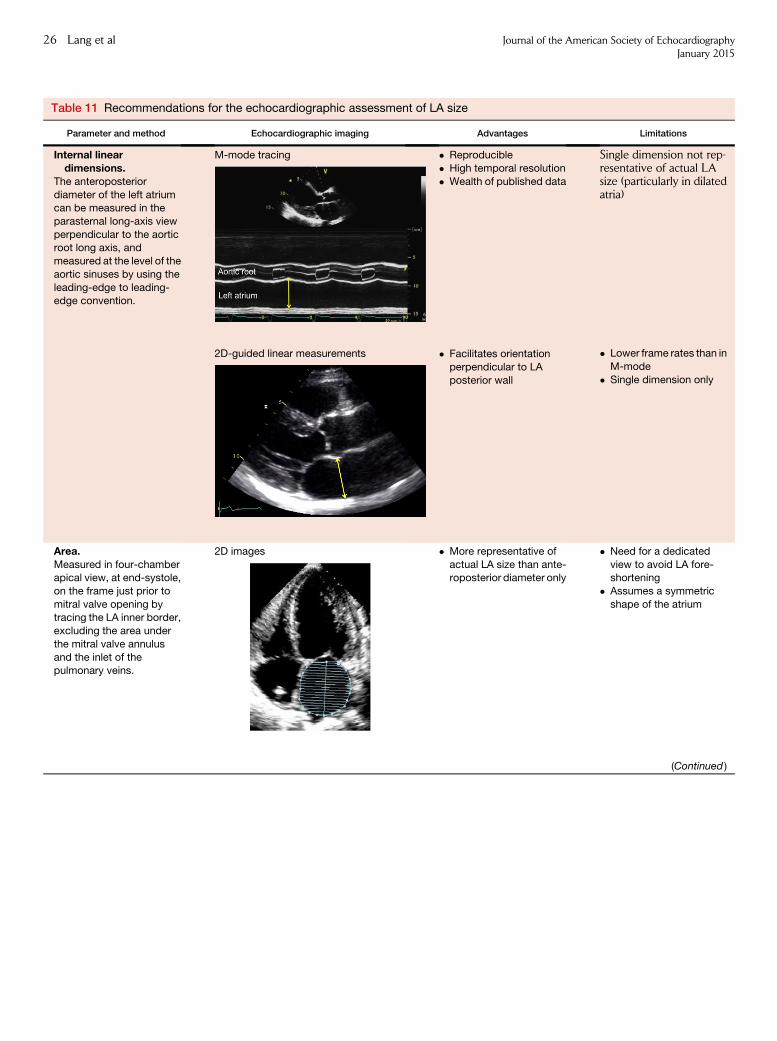
Table 11 Recommendations for the echocardiographic assessment of LA size
Parameter and method Echocardiographic imaging Advantages Limitations
Internal lineardimensions.
The anteroposterior
diameter of the left atriumcan be measured in the
parasternal long-axis view
perpendicular to the aorticroot long axis, and
measured at the level of the
aortic sinuses by using the
leading-edge to leading-edge convention.
M-mode tracing
2D-guided linear measurements
� Reproducible
� High temporal resolution
� Wealth of published data
� Facilitates orientation
perpendicular to LA
posterior wall
Single dimension not rep-resentative of actual LAsize (particularly in dilatedatria)
� Lower frame rates than in
M-mode
� Single dimension only
Area.Measured in four-chamberapical view, at end-systole,
on the frame just prior to
mitral valve opening bytracing the LA inner border,
excluding the area under
the mitral valve annulus
and the inlet of thepulmonary veins.
2D images � More representative of
actual LA size than ante-roposterior diameter only
� Need for a dedicated
view to avoid LA fore-shortening
� Assumes a symmetric
shape of the atrium
(Continued )
26 Lang et al Journal of the American Society of EchocardiographyJanuary 2015
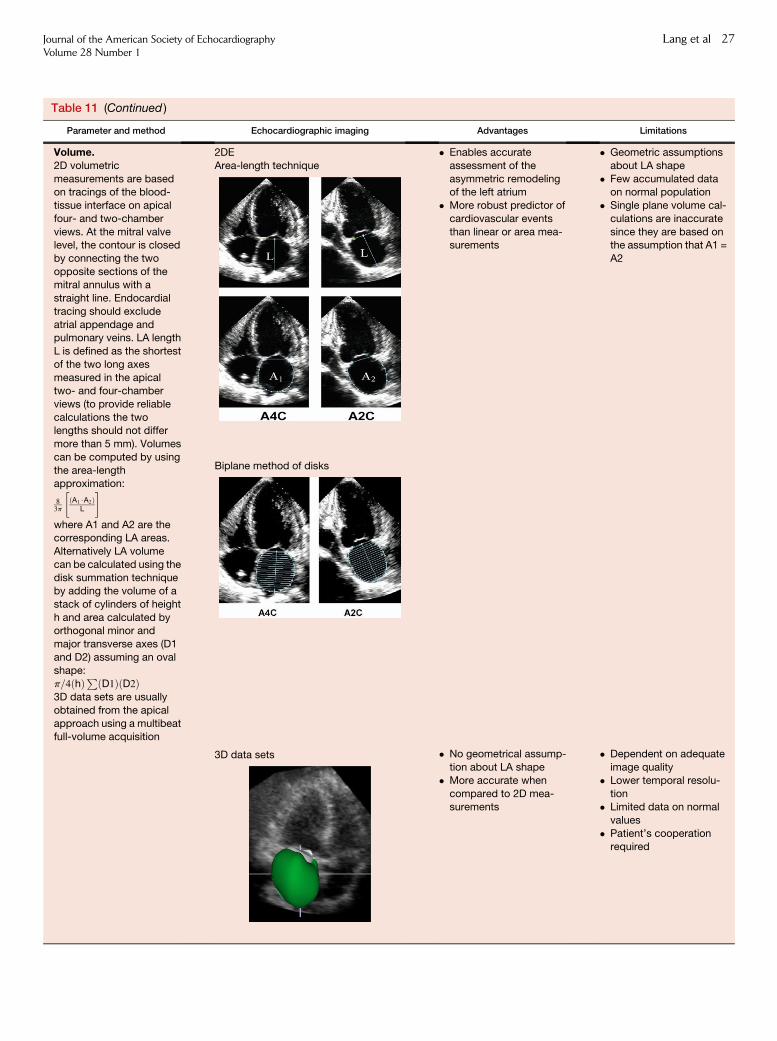
Table 11 (Continued )
Parameter and method Echocardiographic imaging Advantages Limitations
Volume.2D volumetric
measurements are basedon tracings of the blood-
tissue interface on apical
four- and two-chamber
views. At the mitral valvelevel, the contour is closed
by connecting the two
opposite sections of themitral annulus with a
straight line. Endocardial
tracing should exclude
atrial appendage andpulmonary veins. LA length
L is defined as the shortest
of the two long axes
measured in the apicaltwo- and four-chamber
views (to provide reliable
calculations the twolengths should not differ
more than 5 mm). Volumes
can be computed by using
the area-lengthapproximation:
83p
�ðA1$A2Þ
L
�where A1 and A2 are thecorresponding LA areas.
Alternatively LA volume
can be calculated using the
disk summation techniqueby adding the volume of a
stack of cylinders of height
h and area calculated byorthogonal minor and
major transverse axes (D1
and D2) assuming an oval
shape:p=4ðhÞPðD1ÞðD2Þ3D data sets are usually
obtained from the apical
approach using a multibeatfull-volume acquisition
2DE
Area-length technique
Biplane method of disks
3D data sets
� Enables accurate
assessment of the
asymmetric remodelingof the left atrium
� More robust predictor of
cardiovascular events
than linear or area mea-surements
� No geometrical assump-
tion about LA shape
� More accurate when
compared to 2D mea-surements
� Geometric assumptions
about LA shape
� Few accumulated dataon normal population
� Single plane volume cal-
culations are inaccurate
since they are based onthe assumption that A1 =
A2
� Dependent on adequate
image quality
� Lower temporal resolu-
tion� Limited data on normal
values
� Patient’s cooperationrequired
Journal of the American Society of EchocardiographyVolume 28 Number 1
Lang et al 27
28 Lang et al Journal of the American Society of EchocardiographyJanuary 2015
Recommendations. Because it is theoretically more accurate thanthe area-length method, the biplane disk summation technique,which incorporates fewer geometric assumptions, should be thepreferred method to measure LA volume in clinical practice. The up-per normal limit for 2D echocardiographic LA volume is 34 mL/m2
for both genders.
10. Right Atrial measurements
Less research and fewer clinical outcomes data are available on thequantification of RA size. Although the right atrium can be assessedfrom different views, quantification of RA size is most commonly per-formed from the apical four-chamber view (Table 12). The minor-axisdimension should be taken from a plane perpendicular to the longaxis of the right atrium, extending from the lateral border of the rightatrium to the interatrial septum. In contrast to the left atrium, RA sizeappears to be gender dependent, but prior ASE guidelines did nothave sufficient data to provide normative data by gender.1,71
Recent data obtained from three cohorts of >2,400 patients nowprovide normal values of RA dimensions for men andwomen.12,73,165
As with the left atrium, RA volumes are likely to be more robustand accurate for determination of RA size compared with linear di-mensions. At the time of the prior guideline document, limited datawere available for the determination of normative RA volumes.Because there are no standard orthogonal RA views to use for anapical biplane calculation, a single-view area-length and/or disksummation techniques has been proposed for RA volumedetermination.150,153,165-167 Of note, normal RA volumes for menare slightly larger than those for women, with indexing to BSAfailing to equalize values between genders for reasons that are notfully understood.150,165 Recommendations for RA volumenormative data are made from the two largest most contemporarydata sets12,165 (Table 13). RA volumes are underestimated with 2Dechocardiographic techniques compared with 3DE.164,165,168 RAvolumes in adult subjects appear to be smaller than LAvolumes.12,150,153,165 This is because the RA volumes were obtainedusing a single-plane method of disks, in contrast to the LA volumes,which were established using the biplane technique.
Recommendations. The recommended parameter to assess RAsize is RA volume, calculated using single-plane area-length or disksummation techniques in a dedicated apical four-chamber view.The normal ranges for 2D echocardiographic RA volume are25 6 7 mL/m2 in men and 21 6 6 mL/m2 in women.
IV. THE AORTIC ANNULUS AND AORTIC ROOT
Detailed knowledge and quantification of the aortic root and aorticvalve morphology has become even more crucial with the increasinguse of transcatheter aortic valve implantation (TAVI) and transcath-eter aortic valve replacement (TAVR) procedures. This knowledge iscritically important for preprocedural planning, intraprocedural guid-ance, and postprocedural assessment.
The aortic root extends from the basal attachments of the aorticvalve leaflets within the LV outflow tract to their distal attachmentat the tubular portion of the aorta (the sinotubular junction).169 Theaortic root is a geometrically complex structure that includes (1) theaortic valve annulus, (2) the interleaflet triangles, (3) the semilunar
aortic leaflets and their attachments, (4) the aortic sinuses ofValsalva, and (5) the sinotubular junction.170-172 Aorticmeasurements should be made at the following sites: (1) the aorticvalve annulus, (2) the maximal diameter of the sinuses of Valsalva,(3) the sinotubular junction (usually a demarcated transitionbetween the sinuses of Valsalva and the tubular portion of theascending aorta), and (4) the maximal diameter of the proximalascending aorta, including a notation of the distance between themeasurement site and the sinotubular junction (Figure 10A).
11. The Aortic Annulus
The ‘‘aortic annulus’’ is not a true or distinct anatomic structure but is avirtual ring that may be defined by joining the basal attachments, ornadirs, of the three aortic leaflets. The distal (uppermost) attachmentsof the leaflets, in the shape of a crown, form a true anatomicring169,173 (Figure 10B). Approximately two-thirds of the circumfer-ence of the lower part of the aortic root is attached to the muscularinterventricular septum, while the remaining one-third is in fibrouscontinuity with the anterior mitral valve leaflet.174 Measurement ofthe aortic valve annulus before TAVI or TAVR is a challenge, andthe ideal modality for its measurement has yet to be established.During the initial TAVI and TAVR experience, aortic annular measure-ments were routinely performed using 2DE.174,175 Although thestandard approach during the early years of TAVI and TAVR wasechocardiography using a one-dimensional measurement, thismethod has clear limitations for TAVI and TAVR valve sizing. At pre-sent, the two most commonly used imaging techniques used formeasuring the aortic annulus before TAVI or TAVR are echocardiog-raphy and multidetector computed tomography (MDCT).
With echocardiography, measurements of the aortic annulusshould be made in the zoom mode using standard electronic calipersin midsystole, when the annulus is slightly larger and rounder than indiastole, between the hinge points of the aortic valve leaflets (usuallybetween the hinge point of the right coronary cusp and the edge ofthe sinus at the side of the commissures between the left coronarycusp and the noncoronary cusp) from inner edge to inner edge. Allother aortic measurements should be made at end-diastole, in astrictly perpendicular plane to that of the long axis of the aorta.Aortic annular measurements may be difficult in patients with acous-tic blooming caused by a calcified aortic annulus.176-179 As a generalrule, calcium protuberances should be considered as part of thelumen, not of the aortic wall, and therefore excluded from thediameter measurement.
The anteroposterior diameter is commonly measured by both 2DTTE (from the parasternal long-axis view) and 3D TEE (from the lon-gitudinal view of the proximal aortic root, usually 110�–130�) and ap-proximates the minor dimension of the annulus measured byMDCT.3,176,180 However, because the annulus is often elliptical,with variable diameters, it is preferable to measure the annulus in across-sectional view, using 3D imaging, as recommended by theEuropean Association of Echocardiography and ASE guidelines181;the American College of Cardiology Foundation, AmericanAssociation for Thoracic Surgery, Society for Cardiac Angiographyand Interventions, and Society of Thoracic Surgeons consensus docu-ment on TAVR182; the Society of Cardiovascular ComputedTomography expert consensus document on MDCT183; andothers.184-187 Using 3D TEE, both the smaller (anteroposterior,sagittal) and larger (medial-lateral, coronal) diameters, as well as theperimeter and annular area, should be measured in a cross-sectional
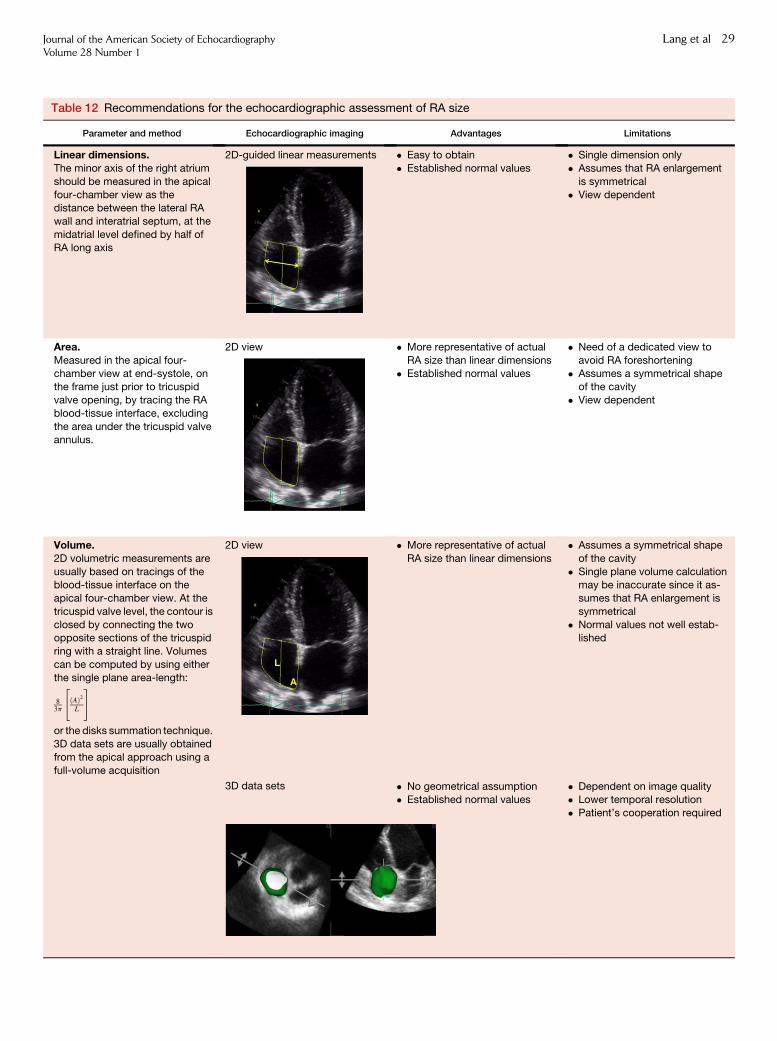
Table 12 Recommendations for the echocardiographic assessment of RA size
Parameter and method Echocardiographic imaging Advantages Limitations
Linear dimensions.The minor axis of the right atrium
should be measured in the apical
four-chamber view as thedistance between the lateral RA
wall and interatrial septum, at the
midatrial level defined by half ofRA long axis
2D-guided linear measurements � Easy to obtain
� Established normal values
� Single dimension only
� Assumes that RA enlargement
is symmetrical
� View dependent
Area.Measured in the apical four-
chamber view at end-systole, onthe frame just prior to tricuspid
valve opening, by tracing the RA
blood-tissue interface, excluding
the area under the tricuspid valveannulus.
2D view � More representative of actual
RA size than linear dimensions
� Established normal values
� Need of a dedicated view to
avoid RA foreshortening
� Assumes a symmetrical shapeof the cavity
� View dependent
Volume.2D volumetric measurements are
usually based on tracings of theblood-tissue interface on the
apical four-chamber view. At the
tricuspid valve level, the contour is
closed by connecting the twoopposite sections of the tricuspid
ring with a straight line. Volumes
can be computed by using either
the single plane area-length:
83p
"ðAÞ2L
#
or the disks summation technique.
3D data sets are usually obtained
from the apical approach using a
full-volume acquisition
2D view
3D data sets
� More representative of actual
RA size than linear dimensions
� No geometrical assumption� Established normal values
� Assumes a symmetrical shape
of the cavity
� Single plane volume calculationmay be inaccurate since it as-
sumes that RA enlargement is
symmetrical
� Normal values not well estab-lished
� Dependent on image quality� Lower temporal resolution
� Patient’s cooperation required
Journal of the American Society of EchocardiographyVolume 28 Number 1
Lang et al 29
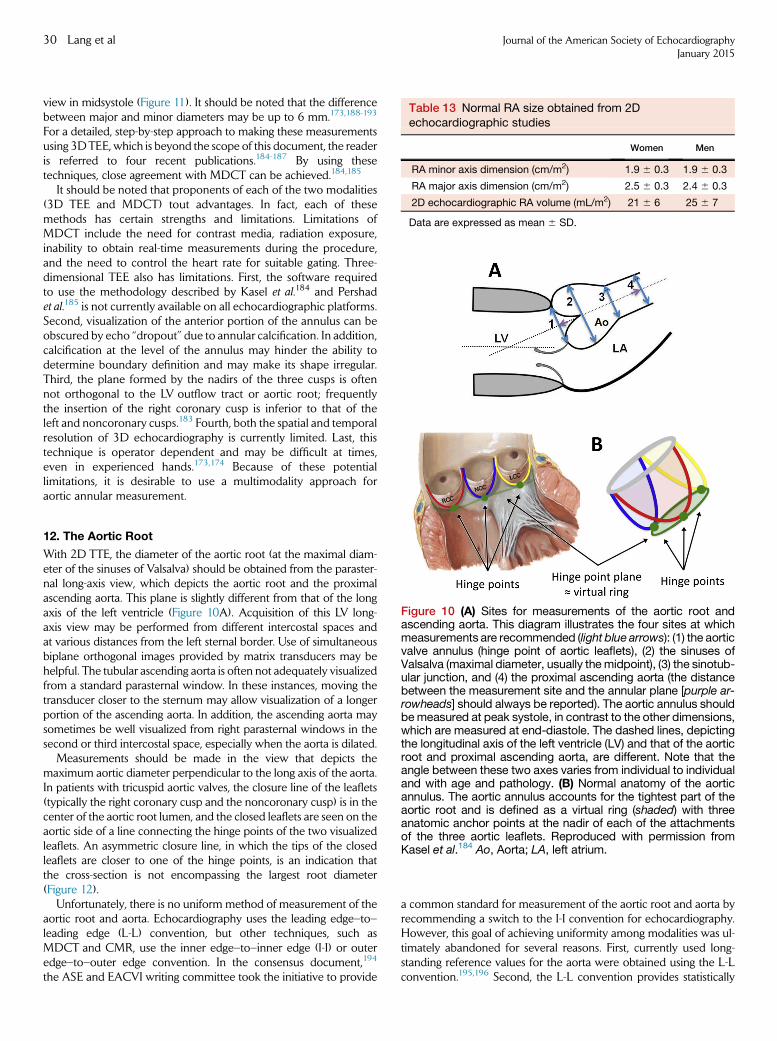
Table 13 Normal RA size obtained from 2Dechocardiographic studies
Women Men
RA minor axis dimension (cm/m2) 1.9 6 0.3 1.9 6 0.3
RA major axis dimension (cm/m2) 2.5 6 0.3 2.4 6 0.3
2D echocardiographic RA volume (mL/m2) 21 6 6 25 6 7
Data are expressed as mean 6 SD.
30 Lang et al Journal of the American Society of EchocardiographyJanuary 2015
view in midsystole (Figure 11). It should be noted that the differencebetween major and minor diameters may be up to 6 mm.173,188-193
For a detailed, step-by-step approach to making these measurementsusing 3DTEE, which is beyond the scope of this document, the readeris referred to four recent publications.184-187 By using thesetechniques, close agreement with MDCT can be achieved.184,185
It should be noted that proponents of each of the two modalities(3D TEE and MDCT) tout advantages. In fact, each of thesemethods has certain strengths and limitations. Limitations ofMDCT include the need for contrast media, radiation exposure,inability to obtain real-time measurements during the procedure,and the need to control the heart rate for suitable gating. Three-dimensional TEE also has limitations. First, the software requiredto use the methodology described by Kasel et al.184 and Pershadet al.185 is not currently available on all echocardiographic platforms.Second, visualization of the anterior portion of the annulus can beobscured by echo ‘‘dropout’’ due to annular calcification. In addition,calcification at the level of the annulus may hinder the ability todetermine boundary definition and may make its shape irregular.Third, the plane formed by the nadirs of the three cusps is oftennot orthogonal to the LV outflow tract or aortic root; frequentlythe insertion of the right coronary cusp is inferior to that of theleft and noncoronary cusps.183 Fourth, both the spatial and temporalresolution of 3D echocardiography is currently limited. Last, thistechnique is operator dependent and may be difficult at times,even in experienced hands.173,174 Because of these potentiallimitations, it is desirable to use a multimodality approach foraortic annular measurement.
Figure 10 (A) Sites for measurements of the aortic root andascending aorta. This diagram illustrates the four sites at whichmeasurements are recommended (light blue arrows): (1) the aorticvalve annulus (hinge point of aortic leaflets), (2) the sinuses ofValsalva (maximal diameter, usually themidpoint), (3) the sinotub-ular junction, and (4) the proximal ascending aorta (the distancebetween the measurement site and the annular plane [purple ar-rowheads] should always be reported). The aortic annulus shouldbemeasured at peak systole, in contrast to the other dimensions,which are measured at end-diastole. The dashed lines, depictingthe longitudinal axis of the left ventricle (LV) and that of the aorticroot and proximal ascending aorta, are different. Note that theangle between these two axes varies from individual to individualand with age and pathology. (B) Normal anatomy of the aorticannulus. The aortic annulus accounts for the tightest part of theaortic root and is defined as a virtual ring (shaded) with threeanatomic anchor points at the nadir of each of the attachmentsof the three aortic leaflets. Reproduced with permission fromKasel et al.184 Ao, Aorta; LA, left atrium.
12. The Aortic Root
With 2D TTE, the diameter of the aortic root (at the maximal diam-eter of the sinuses of Valsalva) should be obtained from the paraster-nal long-axis view, which depicts the aortic root and the proximalascending aorta. This plane is slightly different from that of the longaxis of the left ventricle (Figure 10A). Acquisition of this LV long-axis view may be performed from different intercostal spaces andat various distances from the left sternal border. Use of simultaneousbiplane orthogonal images provided by matrix transducers may behelpful. The tubular ascending aorta is often not adequately visualizedfrom a standard parasternal window. In these instances, moving thetransducer closer to the sternum may allow visualization of a longerportion of the ascending aorta. In addition, the ascending aorta maysometimes be well visualized from right parasternal windows in thesecond or third intercostal space, especially when the aorta is dilated.
Measurements should be made in the view that depicts themaximum aortic diameter perpendicular to the long axis of the aorta.In patients with tricuspid aortic valves, the closure line of the leaflets(typically the right coronary cusp and the noncoronary cusp) is in thecenter of the aortic root lumen, and the closed leaflets are seen on theaortic side of a line connecting the hinge points of the two visualizedleaflets. An asymmetric closure line, in which the tips of the closedleaflets are closer to one of the hinge points, is an indication thatthe cross-section is not encompassing the largest root diameter(Figure 12).
Unfortunately, there is no uniform method of measurement of theaortic root and aorta. Echocardiography uses the leading edge–to–leading edge (L-L) convention, but other techniques, such asMDCT and CMR, use the inner edge–to–inner edge (I-I) or outeredge–to–outer edge convention. In the consensus document,194
the ASE and EACVI writing committee took the initiative to provide
a common standard for measurement of the aortic root and aorta byrecommending a switch to the I-I convention for echocardiography.However, this goal of achieving uniformity among modalities was ul-timately abandoned for several reasons. First, currently used long-standing reference values for the aorta were obtained using the L-Lconvention.195,196 Second, the L-L convention provides statistically
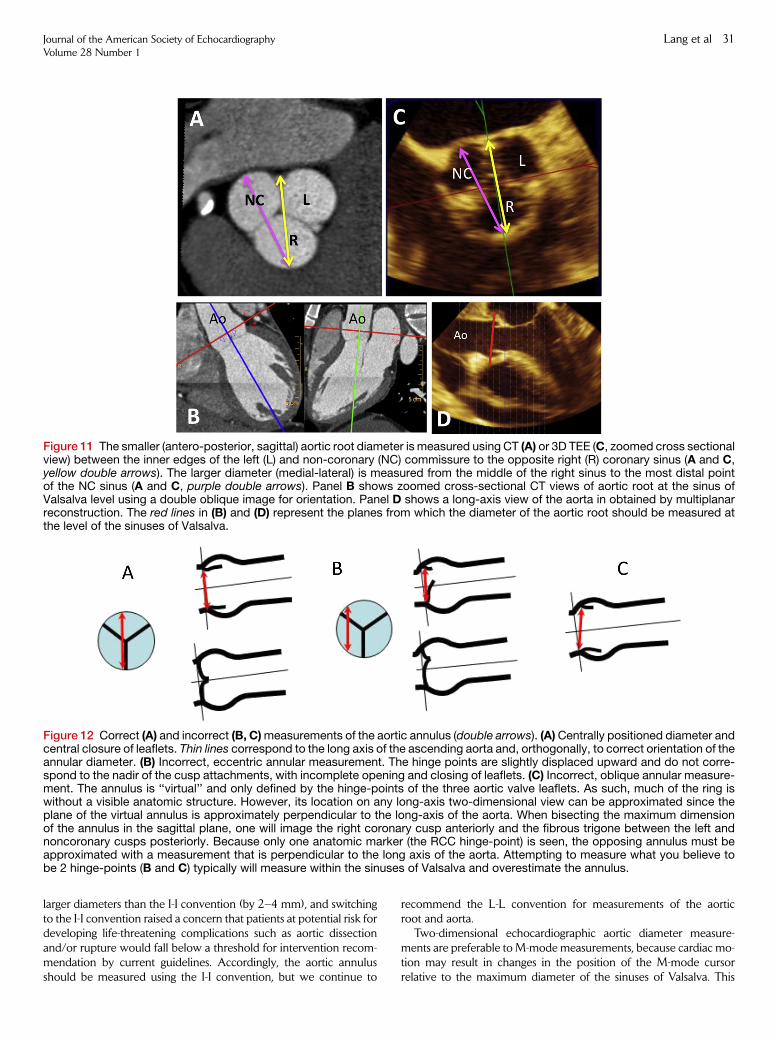
Figure 11 The smaller (antero-posterior, sagittal) aortic root diameter is measured using CT (A) or 3D TEE (C, zoomed cross sectionalview) between the inner edges of the left (L) and non-coronary (NC) commissure to the opposite right (R) coronary sinus (A and C,yellow double arrows). The larger diameter (medial-lateral) is measured from the middle of the right sinus to the most distal pointof the NC sinus (A and C, purple double arrows). Panel B shows zoomed cross-sectional CT views of aortic root at the sinus ofValsalva level using a double oblique image for orientation. Panel D shows a long-axis view of the aorta in obtained by multiplanarreconstruction. The red lines in (B) and (D) represent the planes from which the diameter of the aortic root should be measured atthe level of the sinuses of Valsalva.
Figure 12 Correct (A) and incorrect (B, C)measurements of the aortic annulus (double arrows). (A)Centrally positioned diameter andcentral closure of leaflets. Thin lines correspond to the long axis of the ascending aorta and, orthogonally, to correct orientation of theannular diameter. (B) Incorrect, eccentric annular measurement. The hinge points are slightly displaced upward and do not corre-spond to the nadir of the cusp attachments, with incomplete opening and closing of leaflets. (C) Incorrect, oblique annular measure-ment. The annulus is ‘‘virtual’’ and only defined by the hinge-points of the three aortic valve leaflets. As such, much of the ring iswithout a visible anatomic structure. However, its location on any long-axis two-dimensional view can be approximated since theplane of the virtual annulus is approximately perpendicular to the long-axis of the aorta. When bisecting the maximum dimensionof the annulus in the sagittal plane, one will image the right coronary cusp anteriorly and the fibrous trigone between the left andnoncoronary cusps posteriorly. Because only one anatomic marker (the RCC hinge-point) is seen, the opposing annulus must beapproximated with a measurement that is perpendicular to the long axis of the aorta. Attempting to measure what you believe tobe 2 hinge-points (B and C) typically will measure within the sinuses of Valsalva and overestimate the annulus.
Journal of the American Society of EchocardiographyVolume 28 Number 1
Lang et al 31
larger diameters than the I-I convention (by 2–4 mm), and switchingto the I-I convention raised a concern that patients at potential risk fordeveloping life-threatening complications such as aortic dissectionand/or rupture would fall below a threshold for intervention recom-mendation by current guidelines. Accordingly, the aortic annulusshould be measured using the I-I convention, but we continue to
recommend the L-L convention for measurements of the aorticroot and aorta.
Two-dimensional echocardiographic aortic diameter measure-ments are preferable to M-mode measurements, because cardiac mo-tion may result in changes in the position of the M-mode cursorrelative to the maximum diameter of the sinuses of Valsalva. This
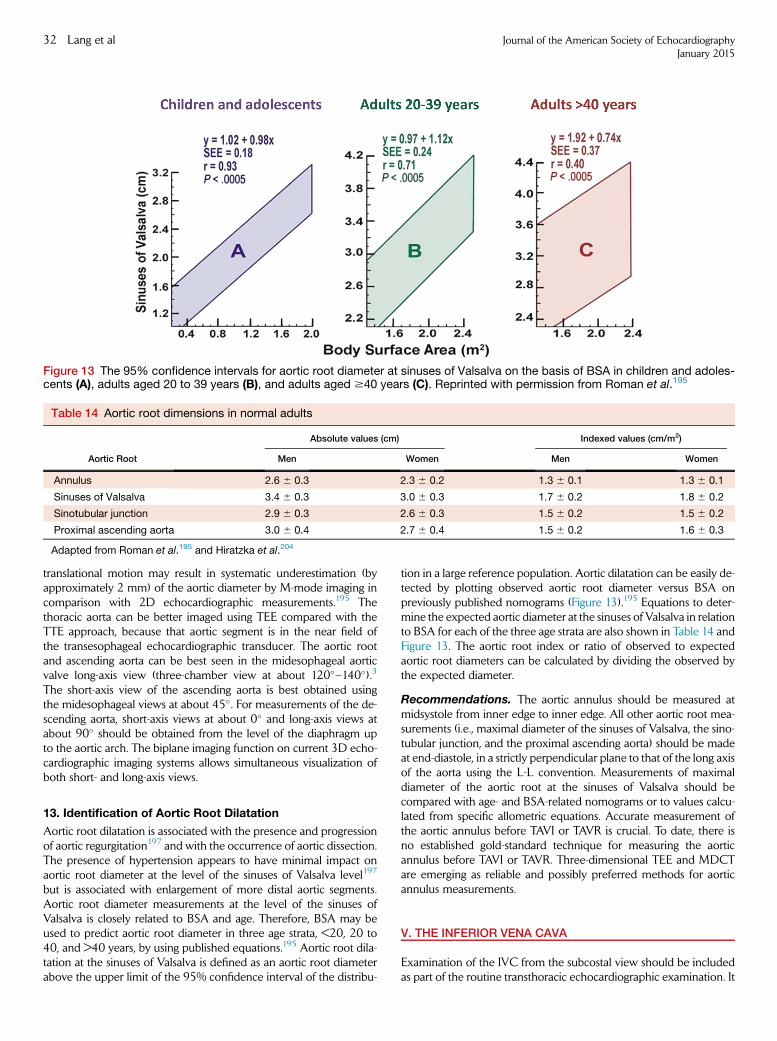
Figure 13 The 95% confidence intervals for aortic root diameter at sinuses of Valsalva on the basis of BSA in children and adoles-cents (A), adults aged 20 to 39 years (B), and adults aged $40 years (C). Reprinted with permission from Roman et al.195
Table 14 Aortic root dimensions in normal adults
Aortic Root
Absolute values (cm) Indexed values (cm/m2)
Men Women Men Women
Annulus 2.6 6 0.3 2.3 6 0.2 1.3 6 0.1 1.3 6 0.1
Sinuses of Valsalva 3.4 6 0.3 3.0 6 0.3 1.7 6 0.2 1.8 6 0.2
Sinotubular junction 2.9 6 0.3 2.6 6 0.3 1.5 6 0.2 1.5 6 0.2
Proximal ascending aorta 3.0 6 0.4 2.7 6 0.4 1.5 6 0.2 1.6 6 0.3
Adapted from Roman et al.195 and Hiratzka et al.204
32 Lang et al Journal of the American Society of EchocardiographyJanuary 2015
translational motion may result in systematic underestimation (byapproximately 2 mm) of the aortic diameter by M-mode imaging incomparison with 2D echocardiographic measurements.195 Thethoracic aorta can be better imaged using TEE compared with theTTE approach, because that aortic segment is in the near field ofthe transesophageal echocardiographic transducer. The aortic rootand ascending aorta can be best seen in the midesophageal aorticvalve long-axis view (three-chamber view at about 120�–140�).3
The short-axis view of the ascending aorta is best obtained usingthe midesophageal views at about 45�. For measurements of the de-scending aorta, short-axis views at about 0� and long-axis views atabout 90� should be obtained from the level of the diaphragm upto the aortic arch. The biplane imaging function on current 3D echo-cardiographic imaging systems allows simultaneous visualization ofboth short- and long-axis views.
13. Identification of Aortic Root Dilatation
Aortic root dilatation is associated with the presence and progressionof aortic regurgitation197 and with the occurrence of aortic dissection.The presence of hypertension appears to have minimal impact onaortic root diameter at the level of the sinuses of Valsalva level197
but is associated with enlargement of more distal aortic segments.Aortic root diameter measurements at the level of the sinuses ofValsalva is closely related to BSA and age. Therefore, BSA may beused to predict aortic root diameter in three age strata, <20, 20 to40, and >40 years, by using published equations.195 Aortic root dila-tation at the sinuses of Valsalva is defined as an aortic root diameterabove the upper limit of the 95% confidence interval of the distribu-
tion in a large reference population. Aortic dilatation can be easily de-tected by plotting observed aortic root diameter versus BSA onpreviously published nomograms (Figure 13).195 Equations to deter-mine the expected aortic diameter at the sinuses of Valsalva in relationto BSA for each of the three age strata are also shown in Table 14 andFigure 13. The aortic root index or ratio of observed to expectedaortic root diameters can be calculated by dividing the observed bythe expected diameter.
Recommendations. The aortic annulus should be measured atmidsystole from inner edge to inner edge. All other aortic root mea-surements (i.e., maximal diameter of the sinuses of Valsalva, the sino-tubular junction, and the proximal ascending aorta) should be madeat end-diastole, in a strictly perpendicular plane to that of the long axisof the aorta using the L-L convention. Measurements of maximaldiameter of the aortic root at the sinuses of Valsalva should becompared with age- and BSA-related nomograms or to values calcu-lated from specific allometric equations. Accurate measurement ofthe aortic annulus before TAVI or TAVR is crucial. To date, there isno established gold-standard technique for measuring the aorticannulus before TAVI or TAVR. Three-dimensional TEE and MDCTare emerging as reliable and possibly preferred methods for aorticannulus measurements.
V. THE INFERIOR VENA CAVA
Examination of the IVC from the subcostal view should be includedas part of the routine transthoracic echocardiographic examination. It
Journal of the American Society of EchocardiographyVolume 28 Number 1
Lang et al 33
is generally agreed that the diameter of the IVC should be measuredin the subcostal view with the patient in the supine position at 1.0 to2.0 cm from the junction with the right atrium, using the long-axisview. For accuracy, this measurement should be made perpendicularto the IVC long axis. The diameter of the IVC decreases in response toinspiration when the negative intrathoracic pressure leads to anincrease in RV filling from the systemic veins. The diameter of theIVC and the percentage decrease in the diameter during inspirationcorrelate with RA pressure. The relationship may be quantified asthe collapsibility index.198 Evaluation of the inspiratory responseoften requires a brief sniff, as normal inspiration may not elicit thisresponse.
For simplicity and uniformity of reporting, specific values of RApressure, rather than ranges, should be used in the determination ofsystolic pulmonary artery pressure. IVC diameter < 2.1 cm that col-lapses >50% with a sniff suggests normal RA pressure of 3 mm Hg(range, 0–5 mm Hg), whereas IVC diameter > 2.1 cm that col-lapses < 50% with a sniff suggests high RA pressure of 15 mm Hg(range, 10–20 mm Hg).199 In scenarios in which IVC diameter andcollapse do not fit this paradigm, an intermediate value of 8 mmHg (range, 5–10 mm Hg) may be used, or, preferably, other indicesof RA pressure should be integrated to downgrade or upgrade tothe normal or high values of RA pressure. It should be noted that innormal young athletes, the IVC may be dilated in the presence ofnormal pressure.200,201 In addition, the IVC is commonly dilatedand may not collapse in patients on ventilators, so it should not beroutinely used in such cases to estimate RA pressure.202 However,IVC diameter measured on TEE at the cavoatrial junction has beensuccessfully used to derive central venous pressure in anesthetizedmechanically ventilated patients.203 The use of the IVC size and dy-namics is encouraged for estimation of RA pressure. This estimateshould be used in estimation of the pulmonary artery pressure onthe basis of the tricuspid regurgitant jet velocity, rather than assuminga constant RA pressure for all patients.
NOTICE AND DISCLAIMER
This report is made available by the ASE and EACVI as a courtesyreference source for members. This report contains recommenda-tions only and should not be used as the sole basis to make medicalpractice decisions or for disciplinary action against any employee.The statements and recommendations contained in this report arebased primarily on the opinions of experts, rather than on scientifi-cally verified data. The ASE and EACVI make no express or impliedwarranties regarding the completeness or accuracy of the informationin this report, including the warranty of merchantability or fitness for aparticular purpose. In no event shall the ASE and EACVI be liable toyou, your patients, or any other third parties for any decision made oraction taken by you or such other parties in reliance on this informa-tion. Nor does your use of this information constitute the offering ofmedical advice by the ASE and EACVI or create any physician-patientrelationship between the ASE and EACVI and your patients oranyone else.
REFERENCES
1. Lang RM, Bierig M, Devereux RB, Flachskampf FA, Foster E, Pellikka PA,et al. Recommendations for chamber quantification: a report from theAmerican Society of Echocardiography’s Guidelines and Standards Com-
mittee and the Chamber Quantification Writing Group, developed inconjunction with the European Association of Echocardiography, abranch of the European Society of Cardiology. J Am Soc Echocardiogr2005;18:1440-63.
2. Lang RM, Bierig M, Devereux RB, Flachskampf FA, Foster E, Pellikka PA,et al. Recommendations for chamber quantification. Eur J Echocardiogr2006;7:79-108.
3. Hahn RT, Abraham T, Adams MS, Bruce CJ, Glas KE, Lang RM, et al.Guidelines for performing a comprehensive transesophageal echocardio-graphic examination: recommendations from the American Society ofEchocardiography and the Society of Cardiovascular Anesthesiologists.J Am Soc Echocardiogr 2013;26:921-64.
4. Mulvagh SL, Rakowski H, Vannan MA, Abdelmoneim SS, Becher H,Bierig SM, et al. American Society of Echocardiography Consensus State-ment on the Clinical Applications of Ultrasonic Contrast Agents in Echo-cardiography. J Am Soc Echocardiogr 2008;21:1179-201. quiz 281.
5. Hoffmann R, von Bardeleben S, Kasprzak JD, Borges AC, ten Cate F,Firschke C, et al. Analysis of regional left ventricular function by cineven-triculography, cardiacmagnetic resonance imaging, and unenhanced andcontrast-enhanced echocardiography: a multicenter comparison ofmethods. J Am Coll Cardiol 2006;47:121-8.
6. Dorosz JL, Lezotte DC, Weitzenkamp DA, Allen LA, Salcedo EE. Perfor-mance of 3-dimensional echocardiography in measuring left ventricularvolumes and ejection fraction: a systematic review and meta-analysis. JAm Coll Cardiol 2012;59:1799-808.
7. Rietzschel ER, De Buyzere ML, Bekaert S, Segers P, De Bacquer D,Cooman L, et al. Rationale, design, methods and baseline characteristicsof the Asklepios Study. Eur J Cardiovasc Prev Rehabil 2007;14:179-91.
8. Kuznetsova T, Herbots L, Lopez B, Jin Y, Richart T, Thijs L, et al. Preva-lence of left ventricular diastolic dysfunction in a general population.Circ Heart Fail 2009;2:105-12.
9. Friedman GD, Cutter GR, Donahue RP, Hughes GH, Hulley SB,Jacobs DR Jr, et al. CARDIA: study design, recruitment, and somecharacteristics of the examined subjects. J Clin Epidemiol 1988;41:1105-16.
10. MuraruD, Badano LP, Peluso D, Dal Bianco L, Casablanca S, KocabayG,et al. Comprehensive analysis of left ventricular geometry and functionby three-dimensional echocardiography in healthy adults. J AmSoc Echo-cardiogr 2013;26:618-28.
11. Lancellotti P, Badano LP, Lang RM, Akhaladze N, Athanassopoulos GD,Barone D, et al. Normal Reference Ranges for Echocardiography: ratio-nale, study design, and methodology (NORRE Study). Eur Heart J Cardi-ovasc Imaging 2013;14:303-8.
12. Kou S, Caballero L, Dulgheru R, Voilliot D, De Sousa C, Kacharava G,et al. Echocardiographic reference ranges for normal cardiac chambersize: results from the NORRE study. Eur Heart J Cardiovasc Imaging2014;15:680-90.
13. Bhave NM, Lang RM. Evaluation of left ventricular structure and func-tion by three-dimensional echocardiography. Curr Opin Crit Care2013;19:387-96.
14. Chahal NS, Lim TK, Jain P, Chambers JC, Kooner JS, Senior R. Popula-tion-based reference values for 3D echocardiographic LV volumes andejection fraction. JACC Cardiovasc Imaging 2012;5:1191-7.
15. Kaku K, Takeuchi M, Otani K, Sugeng L, Nakai H, Haruki N, et al. Age-and gender-dependency of left ventricular geometry assessed withreal-time three-dimensional transthoracic echocardiography. J Am SocEchocardiogr 2011;24:541-7.
16. Fukuda S, Watanabe H, Daimon M, Abe Y, Hirashiki A, Hirata K, et al.Normal values of real-time 3-dimensional echocardiographic parametersin a healthy Japanese population: the JAMP-3D Study. Circ J 2012;76:1177-81.
17. Germans T, Gotte MJ, Nijveldt R, Spreeuwenberg MD, Beek AM,Bronzwaer JG, et al. Effects of aging on left atrioventricular couplingand left ventricular filling assessed using cardiac magnetic resonance im-aging in healthy subjects. Am J Cardiol 2007;100:122-7.
18. Sandstede J, Lipke C, Beer M, Hofmann S, Pabst T, Kenn W, et al.Age- and gender-specific differences in left and right ventricular cardiac
34 Lang et al Journal of the American Society of EchocardiographyJanuary 2015
function and mass determined by cine magnetic resonance imaging. EurRadiol 2000;10:438-42.
19. MuraruD, Badano LP, Piccoli G, Gianfagna P, DelMestre L, Ermacora D,et al. Validation of a novel automated border-detection algorithm forrapid and accurate quantitation of left ventricular volumes based onthree-dimensional echocardiography. Eur J Echocardiogr 2010;11:359-68.
20. Aune E, Baekkevar M, Rodevand O, Otterstad JE. Reference values forleft ventricular volumes with real-time 3-dimensional echocardiography.Scand Cardiovasc J 2010;44:24-30.
21. Lang RM, Borow KM, Neumann A, Janzen D. Systemic vascular resis-tance: an unreliable index of left ventricular afterload. Circulation1986;74:1114-23.
22. Reisner SA, Lysyansky P, Agmon Y, Mutlak D, Lessick J, Friedman Z.Global longitudinal strain: a novel index of left ventricular systolic func-tion. J Am Soc Echocardiogr 2004;17:630-3.
23. Dalen H, Thorstensen A, Aase SA, Ingul CB, Torp H, Vatten LJ, et al.Segmental and global longitudinal strain and strain rate based on echo-cardiography of 1266 healthy individuals: the HUNT study in Norway.Eur J Echocardiogr 2010;11:176-83.
24. Voigt JU, Pedrizzetti G, Lysyansky P, Marwick TH, Houle HC,Baumann R, et al. Definitions for a Common Standard for 2D SpeckleTracking Echocardiography. Consensus document of the EACVI/ASE/Industry Task Force to Standardize Deformation Imaging. Eur Heart JCardiovasc Imaging 2014 (in press).
25. Mor-Avi V, Lang RM, Badano LP, Belohlavek M, Cardim NM,DerumeauxG, et al. Current and evolving echocardiographic techniquesfor the quantitative evaluation of cardiac mechanics: ASE/EAEconsensus statement on methodology and indications endorsed by theJapanese Society of Echocardiography. J Am Soc Echocardiogr 2011;24:277-313.
26. Thomas JD, Badano LP. EACVI-ASE-industry initiative to standardizedeformation imaging: a brief update from the co-chairs. Eur Heart J Car-diovasc Imaging 2013;14:1039-40.
27. Yingchoncharoen T, Agarwal S, Popovic ZB, Marwick TH. Normalranges of left ventricular strain: a meta-analysis. J Am Soc Echocardiogr2013;26:185-91.
28. Mignot A, Donal E, Zaroui A, Reant P, Salem A, Hamon C, et al. Globallongitudinal strain as a major predictor of cardiac events in patients withdepressed left ventricular function: a multicenter study. J Am Soc Echo-cardiogr 2010;23:1019-24.
29. Stanton T, Leano R, Marwick TH. Prediction of all-cause mortalityfrom global longitudinal speckle strain: comparison with ejection frac-tion and wall motion scoring. Circ Cardiovasc Imaging 2009;2:356-64.
30. Di Salvo G, Rea A, Mormile A, Limongelli G, D’Andrea A, Pergola V,et al. Usefulness of bidimensional strain imaging for predicting outcomein asymptomatic patients aged </= 16 years with isolated moderate tosevere aortic regurgitation. Am J Cardiol 2012;110:1051-5.
31. Witkowski TG, Thomas JD, Debonnaire PJ, Delgado V, Hoke U,Ewe SH, et al. Global longitudinal strain predicts left ventriculardysfunction after mitral valve repair. Eur Heart J Cardiovasc Imaging2013;14:69-76.
32. KocabayG,Muraru D, Peluso D, Cucchini U, Mihaila S, Padayattil-Jose S,et al. Normal left ventricular mechanics by two-dimensional speckletracking echocardiography. Rev Esp Cardiol 2014;67:651-8.
33. Takigiku K, TakeuchiM, Izumi C, Yuda S, Sakata K, OhteN, et al. Normalrange of left ventricular 2-dimensional strain: Japanese UltrasoundSpeckle Tracking of the Left Ventricle (JUSTICE) study. Circ J 2012;76:2623-32.
34. Kuznetsova T, Herbots L, Richart T, D’Hooge J, Thijs L, Fagard RH, et al.Left ventricular strain and strain rate in a general population. Eur Heart J2008;29:2014-23.
35. CerqueiraMD,WeissmanNJ, Dilsizian V, Jacobs AK, Kaul S, LaskeyWK,et al. Standardized myocardial segmentation and nomenclature fortomographic imaging of the heart. A statement for healthcare profes-sionals from the Cardiac Imaging Committee of the Council on Clinical
Cardiology of the American Heart Association. Circulation 2002;105:539-42.
36. Schiller NB, Shah PM, Crawford M, DeMaria A, Devereux R,Feigenbaum H, et al. Recommendations for quantitation of the leftventricle by two-dimensional echocardiography. American Society ofEchocardiography Committee on Standards, Subcommittee on Quanti-tation of Two-Dimensional Echocardiograms. J Am Soc Echocardiogr1989;2:358-67.
37. Amzulescu MS, Slavich M, Florian A, Goetschalckx K, Voigt JU. Doestwo-dimensional image reconstruction from three-dimensional full vol-ume echocardiography improve the assessment of left ventricularmorphology and function? Echocardiography 2013;30:55-63.
38. Voigt JU, Lindenmeier G, Exner B, Regenfus M, Werner D, Reulbach U,et al. Incidence and characteristics of segmental postsystolic longitudinalshortening in normal, acutely ischemic, and scarred myocardium. J AmSoc Echocardiogr 2003;16:415-23.
39. LiebermanAN,Weiss JL, Jugdutt BI, Becker LC, Bulkley BH, Garrison JG,et al. Two-dimensional echocardiography and infarct size: relationship ofregional wall motion and thickening to the extent of myocardial infarc-tion in the dog. Circulation 1981;63:739-46.
40. Takeuchi M, Sonoda S, Miura Y, Kuroiwa A. Reproducibility of dobut-amine digital stress echocardiography. J Am Soc Echocardiogr 1997;10:344-51.
41. Lumens J, Leenders GE, Cramer MJ, De Boeck BW, Doevendans PA,Prinzen FW, et al. Mechanistic evaluation of echocardiographic dyssyn-chrony indices: patient data combined with multiscale computer simula-tions. Circ Cardiovasc Imaging 2012;5:491-9.
42. Little WC, Reeves RC, Arciniegas J, Katholi RE, Rogers EW. Mechanismof abnormal interventricular septal motion during delayed left ventricularactivation. Circulation 1982;65:1486-91.
43. Parsai C, Bijnens B, Sutherland GR, Baltabaeva A, Claus P, Marciniak M,et al. Toward understanding response to cardiac resynchronization ther-apy: left ventricular dyssynchrony is only one of multiple mechanisms.Eur Heart J 2009;30:940-9.
44. Voigt JU, Schneider TM, Korder S, Szulik M, Gurel E, Daniel WG, et al.Apical transverse motion as surrogate parameter to determine regionalleft ventricular function inhomogeneities: a new, integrative approachto left ventricular asynchrony assessment. Eur Heart J 2009;30:959-68.
45. Stankovic I, Aarones M, Smith HJ, Voros G, Kongsgaard E, Neskovic AN,et al. Dynamic relationship of left-ventricular dyssynchrony and contrac-tile reserve in patients undergoing cardiac resynchronization therapy. EurHeart J 2014;35:48-55.
46. Heimdal A, Stoylen A, Torp H, Skjaerpe T. Real-time strain rate imagingof the left ventricle by ultrasound. J Am Soc Echocardiogr 1998;11:1013-9.
47. Leitman M, Lysyansky P, Sidenko S, Shir V, Peleg E, BinenbaumM, et al.Two-dimensional strain-a novel software for real-time quantitative echo-cardiographic assessment of myocardial function. J Am Soc Echocardiogr2004;17:1021-9.
48. Stefani L, Toncelli L, Gianassi M, Manetti P, Di Tante V, Vono MR, et al.Two-dimensional tracking and TDI are consistent methods for evaluatingmyocardial longitudinal peak strain in left and right ventricle basal seg-ments in athletes. Cardiovasc Ultrasound 2007;5:7.
49. Voigt JU, Exner B, Schmiedehausen K, Huchzermeyer C, Reulbach U,Nixdorff U, et al. Strain-rate imaging during dobutamine stress echocar-diography provides objective evidence of inducible ischemia. Circulation2003;107:2120-6.
50. Maffessanti F, Nesser HJ, Weinert L, Steringer-Mascherbauer R, Niel J,Gorissen W, et al. Quantitative evaluation of regional left ventricularfunction using three-dimensional speckle tracking echocardiography inpatients with and without heart disease. Am J Cardiol 2009;104:1755-62.
51. Badano LP, Cucchini U, Muraru D, Al Nono O, Sarais C, Iliceto S. Use ofthree-dimensional speckle tracking to assess left ventricular myocardialmechanics: inter-vendor consistency and reproducibility of strain mea-surements. Eur Heart J Cardiovasc Imaging 2013;14:285-93.
Journal of the American Society of EchocardiographyVolume 28 Number 1
Lang et al 35
52. Verdecchia P, Carini G, Circo A, Dovellini E, Giovannini E, LombardoM,et al. Left ventricular mass and cardiovascular morbidity in essential hy-pertension: the MAVI study. J Am Coll Cardiol 2001;38:1829-35.
53. Schillaci G, Verdecchia P, Porcellati C, Cuccurullo O, Cosco C,Perticone F. Continuous relation between left ventricular mass andcardiovascular risk in essential hypertension. Hypertension 2000;35:580-6.
54. Ghali JK, Liao Y, Simmons B, Castaner A, Cao G, Cooper RS. The prog-nostic role of left ventricular hypertrophy in patients with or without cor-onary artery disease. Ann Intern Med 1992;117:831-6.
55. Verma A, Meris A, Skali H, Ghali JK, Arnold JM, BourgounM, et al. Prog-nostic implications of left ventricular mass and geometry followingmyocardial infarction: the VALIANT (VALsartan In Acute myocardialiNfarcTion) Echocardiographic Study. JACC Cardiovasc Imaging 2008;1:582-91.
56. Armstrong AC, Gidding S, Gjesdal O, Wu C, Bluemke DA, Lima JA. LVmass assessed by echocardiography and CMR, cardiovascular outcomes,and medical practice. JACC Cardiovasc Imaging 2012;5:837-48.
57. Park SH, Shub C, Nobrega TP, Bailey KR, Seward JB. Two-dimensionalechocardiographic calculation of left ventricular mass as recommendedby the American Society of Echocardiography: correlation with autopsyand M-mode echocardiography. J Am Soc Echocardiogr 1996;9:119-28.
58. McGavigan AD, Dunn FG, Goodfield NE. Secondary harmonic imagingoverestimates left ventricular mass compared to fundamental echocardi-ography. Eur J Echocardiogr 2003;4:178-81.
59. de Las Fuentes L, Spence KE, Davila-Roman VG, Waggoner AD. Arenormative values for LV geometry and mass based on fundamental im-aging valid with use of harmonic imaging? J Am Soc Echocardiogr2010;23:1317-22.
60. Mor-Avi V, Sugeng L,Weinert L,MacEneaney P, Caiani EG, Koch R, et al.Fast measurement of left ventricular mass with real-time three-dimen-sional echocardiography: comparison with magnetic resonance imaging.Circulation 2004;110:1814-8.
61. Lang RM, Badano LP, Tsang W, Adams DH, Agricola E, Buck T, et al.EAE/ASE recommendations for image acquisition and display usingthree-dimensional echocardiography. J Am Soc Echocardiogr 2012;25:3-46.
62. LamCS, Roger VL, Rodeheffer RJ, Bursi F, Borlaug BA, Ommen SR, et al.Cardiac structure and ventricular-vascular function in persons with heartfailure and preserved ejection fraction from Olmsted County, Minne-sota. Circulation 2007;115:1982-90.
63. Ng AC, Tran da T, NewmanM, Allman C, Vidaic J, Lo ST, et al. Left ven-tricular longitudinal and radial synchrony and their determinants inhealthy subjects. J Am Soc Echocardiogr 2008;21:1042-8.
64. Chahal NS, Lim TK, Jain P, Chambers JC, Kooner JS, Senior R. Ethnicity-related differences in left ventricular function, structure and geometry: apopulation study of UK Indian Asian and Europeanwhite subjects. Heart2010;96:466-71.
65. Chirinos JA, Segers P, De Buyzere ML, Kronmal RA, Raja MW, DeBacquer D, et al. Left ventricular mass: allometric scaling, normativevalues, effect of obesity, and prognostic performance. Hypertension2010;56:91-8.
66. Cuspidi C, Facchetti R, Sala C, Bombelli M, Negri F, Carugo S, et al.Normal values of left-ventricular mass: echocardiographic findingsfrom the PAMELA study. J Hypertens 2012;30:997-1003.
67. Kizer JR, Arnett DK, Bella JN, Paranicas M, Rao DC, Province MA, et al.Differences in left ventricular structure between black and white hyper-tensive adults: the Hypertension Genetic Epidemiology Network study.Hypertension 2004;43:1182-8.
68. Rodriguez CJ, Diez-Roux AV, Moran A, Jin Z, Kronmal RA, Lima J,et al. Left ventricular mass and ventricular remodeling among Hispan-ic subgroups compared with non-Hispanic blacks and whites: MESA(Multi-ethnic Study of Atherosclerosis). J Am Coll Cardiol 2010;55:234-42.
69. ParkCM,March K, Ghosh AK, Jones S, Coady E, TusonC, et al. Left-ven-tricular structure in the Southall And Brent REvisited (SABRE) study: ex-plaining ethnic differences. Hypertension 2013;61:1014-20.
70. de Simone G, Kizer JR, Chinali M, Roman MJ, Bella JN, Best LG, et al.Normalization for body size and population-attributable risk of left ven-tricular hypertrophy: the Strong Heart Study. Am J Hypertens 2005;18:191-6.
71. Rudski LG, Lai WW, Afilalo J, Hua L, Handschumacher MD,Chandrasekaran K, et al. Guidelines for the echocardiographic assess-ment of the right heart in adults: a report from the American Societyof Echocardiography endorsed by the European Association of Echocar-diography, a registered branch of the European Society of Cardiology,and the Canadian Society of Echocardiography. J Am Soc Echocardiogr2010;23:685-713. quiz 86-8.
72. Kawut SM, Lima JA, Barr RG, Chahal H, Jain A, Tandri H, et al. Sex andrace differences in right ventricular structure and function: the multi-ethnic study of atherosclerosis-right ventricle study. Circulation 2011;123:2542-51.
73. D’Oronzio U, SennO, Biaggi P, Gruner C, Jenni R, Tanner FC, et al. Rightheart assessment by echocardiography: gender and body size matters. JAm Soc Echocardiogr 2012;25:1251-8.
74. Willis J, Augustine D, Shah R, Stevens C, Easaw J. Right ventricularnormal measurements: time to index? J Am Soc Echocardiogr 2012;25:1259-67.
75. Maffessanti F, Muraru D, Esposito R, Gripari P, Ermacora D, Santoro C,et al. Age-, body size-, and sex-specific reference values for right ventric-ular volumes and ejection fraction by three-dimensional echocardiogra-phy: a multicenter echocardiographic study in 507 healthy volunteers.Circ Cardiovasc Imaging 2013;6:700-10.
76. D’Andrea A, Cocchia R, Caso P, Riegler L, Scarafile R, Salerno G, et al.Global longitudinal speckle-tracking strain is predictive of left ventricularremodeling after coronary angioplasty in patients with recent non-STelevation myocardial infarction. Int J Cardiol 2011;153:185-91.
77. Ling LF, Obuchowski NA, Rodriguez L, Popovic Z, Kwon D,Marwick TH. Accuracy and interobserver concordance of echocardio-graphic assessment of right ventricular size and systolic function: a qualitycontrol exercise. J Am Soc Echocardiogr 2012;25:709-13.
78. Shimada YJ, Shiota M, Siegel RJ, Shiota T. Accuracy of right ventricularvolumes and function determined by three-dimensional echocardiogra-phy in comparison with magnetic resonance imaging: a meta-analysisstudy. J Am Soc Echocardiogr 2010;23:943-53.
79. Giusca S, Dambrauskaite V, Scheurwegs C, D’Hooge J, Claus P,Herbots L, et al. Deformation imaging describes right ventricular functionbetter than longitudinal displacement of the tricuspid ring. Heart 2010;96:281-8.
80. Innelli P, Esposito R, Olibet M, Nistri S, Galderisi M. The impact of ageingon right ventricular longitudinal function in healthy subjects: a pulsed tis-sue Doppler study. Eur J Echocardiogr 2009;10:491-8.
81. Maffessanti F, Gripari P, Tamborini G, Muratori M, Fusini L, Alamanni F,et al. Evaluation of right ventricular systolic function after mitral valverepair: a two-dimensional Doppler, speckle-tracking, and three-dimensional echocardiographic study. J Am Soc Echocardiogr 2012;25:701-8.
82. Verhaert D, Mullens W, Borowski A, Popovic ZB, Curtin RJ, Thomas JD,et al. Right ventricular response to intensivemedical therapy in advanceddecompensated heart failure. Circ Heart Fail 2010;3:340-6.
83. Guendouz S, Rappeneau S, Nahum J, Dubois-Rande JL, Gueret P,Monin JL, et al. Prognostic significance and normal values of 2D strainto assess right ventricular systolic function in chronic heart failure. CircJ 2012;76:127-36.
84. Antoni ML, Scherptong RW, Atary JZ, Boersma E, Holman ER, van derWall EE, et al. Prognostic value of right ventricular function in patients af-ter acute myocardial infarction treated with primary percutaneous coro-nary intervention. Circ Cardiovasc Imaging 2010;3:264-71.
85. Hardegree EL, Sachdev A, Villarraga HR, Frantz RP, McGoon MD,Kushwaha SS, et al. Role of serial quantitative assessment of right ventric-ular function by strain in pulmonary arterial hypertension. Am J Cardiol2013;111:143-8.
86. Haeck ML, Scherptong RW, Marsan NA, Holman ER, Schalij MJ, Bax JJ,et al. Prognostic value of right ventricular longitudinal peak systolic strain
36 Lang et al Journal of the American Society of EchocardiographyJanuary 2015
in patients with pulmonary hypertension. Circ Cardiovasc Imaging 2012;5:628-36.
87. Cappelli F, Porciani MC, Bergesio F, Perlini S, Attana P, MoggiPignone A, et al. Right ventricular function in AL amyloidosis: char-acteristics and prognostic implication. Eur Heart J Cardiovasc Imaging2012;13:416-22.
88. Grant AD, Smedira NG, Starling RC, Marwick TH. Independent and in-cremental role of quantitative right ventricular evaluation for the predic-tion of right ventricular failure after left ventricular assist deviceimplantation. J Am Coll Cardiol 2012;60:521-8.
89. Unsworth B, Casula RP, Kyriacou AA, Yadav H, Chukwuemeka A,Cherian A, et al. The right ventricular annular velocity reduction causedby coronary artery bypass graft surgery occurs at the moment of pericar-dial incision. Am Heart J 2010;159:314-22.
90. Lindqvist P, Holmgren A, Zhao Y, HeneinMY. Effect of pericardial repairafter aortic valve replacement on septal and right ventricular function. IntJ Cardiol 2012;155:388-93.
91. SugengL,Mor-AviV,Weinert L,Niel J, EbnerC, Steringer-Mascherbauer R,et al. Multimodality comparison of quantitative volumetric analysis of theright ventricle. JACC Cardiovasc Imaging 2010;3:10-8.
92. RoscaM, Lancellotti P, Popescu BA, Pierard LA. Left atrial function: path-ophysiology, echocardiographic assessment, and clinical applications.Heart 2011;97:1982-9.
93. Spencer KT, Mor-Avi V, Gorcsan J, DeMaria AN, Kimball TR,Monaghan MJ, et al. Effects of aging on left atrial reservoir, conduit,and booster pump function: a multi-institution acoustic quantificationstudy. Heart 2001;85:272-7.
94. Bouzas-Mosquera A, Broullon FJ, Alvarez-Garcia N, Mendez E, Peteiro J,Gandara-Sambade T, et al. Left atrial size and risk for all-cause mortalityand ischemic stroke. Can Med Assoc J 2011;183:E657-64.
95. Kizer JR, Bella JN, Palmieri V, Liu JE, Best LG, Lee ET, et al. Left atrialdiameter as an independent predictor of first clinical cardiovascularevents in middle-aged and elderly adults: The Strong Heart Study(SHS). Am Heart J 2006;151:412-8.
96. Lancellotti P, Donal E, Magne J, Moonen M, O’Connor K, Daubert JC,et al. Risk stratification in asymptomatic moderate to severe aortic steno-sis: the importance of the valvular, arterial and ventricular interplay.Heart 2010;96:1364-71.
97. Le Tourneau T, Messika-Zeitoun D, Russo A, Detaint D, Topilsky Y,Mahoney DW, et al. Impact of Left Atrial Volume on Clinical Outcomein Organic Mitral Regurgitation. J Am Coll Cardiol 2010;56:570-8.
98. Tsang TSM, Barnes ME, Gersh BJ, Bailey KR, Seward JB. Left atrial vol-ume as a morphophysiologic expression of left ventricular diastolicdysfunction and relation to cardiovascular risk burden. Am J Cardiol2002;90:1284-9.
99. Tsang TSM, Barnes ME, Gersh BJ, Takemoto Y, Rosales AG, Bailey KR,et al. Prediction of risk for first age-related cardiovascular events in anelderly population: The incremental value of echocardiography. J AmColl Cardiol 2003;42:1199-205.
100. Appleton CP, Galloway JM, GonzalezMS, Gaballa M, Basnight MA. Esti-mation of left ventricular filling pressures using two-dimensional andDoppler echocardiography in adult patients with cardiac disease. Addi-tional value of analyzing left atrial size, left atrial ejection fraction andthe difference in duration of pulmonary venous and mitral flow velocityat atrial contraction. J Am Coll Cardiol 1993;22:1972-82.
101. Geske JB, Sorajja P, Nishimura RA, Ommen SR. The Relationship of LeftAtrial Volume and Left Atrial Pressure in PatientsWith Hypertrophic Car-diomyopathy: An Echocardiographic and Cardiac Catheterization Study.J Am Soc Echocardiogr 2009;22:961-6.
102. Guron CW, Hartford M, Rosengren A, Thelle D, Wallentin I, Caidahl K.Usefulness of atrial size inequality as an indicator of abnormal left ventric-ular filling. Am J Cardiol 2005;95:1448-52.
103. SimekCL, FeldmanMD, Haber HL,WuCC, Jayaweera AR, Kaul S. Rela-tionship between left ventricular wall thickness and left atrial size: com-parison with other measures of diastolic function. J Am Soc Echocardiogr1995;8:37-47.
104. Ersboll M, Anderson MJ, Valeur N, Mogensen UM, Waziri H,Moller JE, et al. The prognostic value of left atrial peak reservoir strainin acute myocardial infarction is dependent on left ventricular longitu-dinal function and left atrial size. Circ Cardiovasc Imaging 2013;6:26-33.
105. Lonborg JT, Engstrom T, Moller JE, Ahtarovski KA, Kelbaek H,Holmvang L, et al. Left atrial volume and function in patients followingST elevation myocardial infarction and the association with clinicaloutcome: a cardiovascular magnetic resonance study. Eur Heart J Cardi-ovasc Imaging 2013;14:118-26.
106. Barnes ME,Miyasaka Y, Seward JB, Gersh BJ, Rosales AG, Bailey KR, et al.Left atrial volume in the prediction of first ischemic stroke in an elderlycohort without atrial fibrillation. Mayo Clin Proc 2004;79:1008-14.
107. Benjamin EJ, Dagostino RB, Belanger AJ, Wolf PA, Levy D. Left Atrial Sizeand the Risk of Stroke and Death - the Framingham Heart-Study. Circu-lation 1995;92:835-41.
108. Bolca O, Akdemir O, Eren M, Dagdeviren B, Yildirim A, Tezel T. Leftatrial maximum volume is a recurrence predictor in lone-atrial fibrillation- An acoustic quantification study. Jpn Heart J 2002;43:241-8.
109. Di Tullio MR, Sacco RL, Sciacca RR, Homma S. Left atrial size and therisk of ischemic stroke in an ethnically mixed population. Stroke 1999;30:2019-24.
110. Flaker GC, Fletcher KA, Rothbart RM, Halperin JL, Hart RG. Clinical andEchocardiographic Features of Intermittent Atrial-Fibrillation That PredictRecurrent Atrial-Fibrillation. Am J Cardiol 1995;76:355-8.
111. Kottkamp H. Fibrotic Atrial Cardiomyopathy: A Specific Disease/Syn-drome Supplying Substrates for Atrial Fibrillation, Atrial Tachycardia, Si-nus Node Disease, AV Node Disease, and ThromboembolicComplications. J Cardiovasc Electrophysiol 2012;23:797-9.
112. Tsang TS, Gersh BJ, Appleton CP, Tajik AJ, Barnes ME, Bailey KR, et al.Left ventricular diastolic dysfunction as a predictor of the first diagnosednonvalvular atrial fibrillation in 840 elderly men and women. J Am CollCardiol 2002;40:1636-44.
113. Tsang TS, Barnes ME, Bailey KR, Leibson CL, Montgomery SC,Takemoto Y, et al. Left trial volume: Important risk marker of incidentatrial fibrillation in 1655 older men and women. Mayo Clin Proc 2001;76:467-75.
114. Vaziri SM, Larson MG, Benjamin EJ, Levy D. Echocardiographic predic-tors of nonrheumatic atrial fibrillation. The FraminghamHeart Study. Cir-culation 1994;89:724-30.
115. Tsang TS, BarnesME, Gersh BJ, Bailey KR, Seward JB. Risks for atrial fibril-lation and congestive heart failure in patients >= 65 years of age withabnormal left ventricular diastolic relaxation. Am J Cardiol 2004;93:54-8.
116. Beinart R, Boyko V, Schwammenthal E, Kuperstein R, Sagie A, Hod H,et al. Long-term prognostic significance of left atrial volume in acutemyocardial infarction. J Am Coll Cardiol 2004;44:327-34.
117. Moller JE, Hillis GS, Oh JK, Seward JB, Reeder GS, Wright RS, et al. Leftatrial volume - A powerful predictor of survival after acute myocardialinfarction. Circulation 2003;107:2207-12.
118. Dini FL, Cortigiani L, Baldini U, Boni A, Nuti R, Barsotti L, et al.Prognostic value of left atrial enlargement in patients with idiopathicdilated cardiomyopathy and ischemic cardiomyopathy. Am J Cardiol2002;89:518-23.
119. Kim H, Cho YK, Jun DH, Nam CW, Han SW, Hur SH, et al. Prognosticimplications of the NT-ProBNP level and left atrial size in non-ischemicdilated cardiomyopathy. Circ J 2008;72:1658-65.
120. ModenaMG,Muia N, Sgura FA, Molinari R, Castelli A, Rossi R. Left atrialsize is themajor predictor of cardiac death and overall clinical outcome inpatients with dilated cardiomyopathy: A long-term follow-up study. ClinCardiol 1997;20:553-60.
121. Quinones MA, Greenberg BH, Kopelen HA, Koilpillai C, Limacher MC,Shindler DM, et al. Echocardiographic predictors of clinical outcome inpatients with Left Ventricular Dysfunction enrolled in the SOLVD Regis-try and Trials: Significance of left ventricular hypertrophy. J Am Coll Car-diol 2000;35:1237-44.
Journal of the American Society of EchocardiographyVolume 28 Number 1
Lang et al 37
122. Sabharwal N, Cemin R, Rajan K, Hickman M, Lahiri A, Senior R. Useful-ness of left atrial volume as a predictor of mortality in patients withischemic cardiomyopathy. Am J Cardiol 2004;94:760-3.
123. Poulsen MK, Dahl JS, Henriksen JE, Hey TM, Hoilund-Carlsen PF, Beck-Nielsen H, et al. Left atrial volume index: relation to long-term clinicaloutcome in type 2 diabetes. J Am Coll Cardiol 2013;62:2416-21.
124. Olshansky B, Heller EN, Mitchell LB, Chandler M, Slater W, Green M,et al. Are transthoracic echocardlographic parameters associated withatrial fibrillation recurrence or stroke? - Results from the atrial fibrillationfollow-up investigation of rhythm management (AFFIRM) study. J AmColl Cardiol 2005;45:2026-33.
125. Rusinaru D, Tribouilloy C, Grigioni F, Avierinos JF, Suri RM, Barbieri A,et al. Left Atrial Size Is a Potent Predictor of Mortality in Mitral Regurgi-tation Due to Flail Leaflets Results From a Large International Multi-center Study. Circ Cardiovasc Imaging 2011;4:473-81.
126. Schabelman S, Schiller NB, Silverman NH, Ports TA. Left Atrial VolumeEstimation by Two-Dimensional Echocardiography. Cathet CardiovascDiagn 1981;7:165-78.
127. Wade MR, Chandraratna PAN, Reid CL, Lin SL, Rahimtoola SH. Accu-racy of Nondirected and Directed M-Mode Echocardiography as an Es-timate of Left Atrial Size. Am J Cardiol 1987;60:1208-11.
128. Lester SJ, Ryan EW, Schiller NB, Foster E. Best method in clinical practiceand in research studies to determine left atrial size. Am J Cardiol 1999;84:829-32.
129. Loperfido F, Pennestri F, Digaetano A, Scabbia E, Santarelli P,Mongiardo R, et al. Assessment of left atrial dimensions by cross sectionalechocardiography in patients with mitral valve disease. Br Heart J 1983;50:570-8.
130. Vyas H, Jackson K, Chenzbraun A. Switching to volumetric left atrialmeasurements: impact on routine echocardiographic practice. Eur JEchocardiogr 2011;12.
131. Gottdiener JS, Kitzman DW, Aurigemma GP, Arnold AM, Manolio TA.Left atrial volume, geometry, and function in systolic and diastolic heartfailure of persons >= 65 years of age (The Cardiovascular Health Study).Am J Cardiol 2006;97:83-9.
132. Losi Ma, Betocchi S, Aversa M, Lombardi R, Miranda M, Ciampi Q, et al.Determinants of the development of atrial fibrillation in hypertrophiccardiomyopathy. Circulation 2002;106:710.
133. Rossi A, Cicoira M, Zanolla L, Sandrini R, Golia G, Zardini P, et al. De-terminants and prognostic value of left atrial volume in patients withdilated cardiomyopathy. J Am Coll Cardiol 2002;40:1425-30.
134. Takemoto Y, Barnes ME, Seward JB, Lester SJ, Appleton CA, Gersh BJ,et al. Usefulness of left atrial volume in predicting first congestive heartfailure in patients >= 65 years of age with well-preserved left ventricularsystolic function. Am J Cardiol 2005;96:832-6.
135. Tani T, Tanabe K, Ono M, Yamaguchi K, Okada M, Sumida T, et al.Left atrial volume and the risk of paroxysmal atrial fibrillation in pa-tients with hypertrophic cardiomyopathy. J Am Soc Echocardiogr2004;17:644-8.
136. Tsang TS, AbhayaratnaWP, BarnesME, Miyasaka Y, Gersh BJ, Bailey KR,et al. Prediction of cardiovascular outcomes with left atrial size - Is volumesuperior to area or diameter? J Am Coll Cardiol 2006;47:1018-23.
137. Pritchett AM, Jacobsen SJ, Mahoney DW, Rodeheffer RJ, Bailey KR,Redfield MM. Left atrial volume as an index of left atrial size: apopulation-based study. J Am Coll Cardiol 2003;41:1036-43.
138. Jenkins C, Bricknell K, Marwick TH. Use of real-time three-dimensionalechocardiography to measure left atrial volume: Comparison with otherechocardiographic techniques. J Am Soc Echocardiogr 2005;18:991-7.
139. Maceira AM, Cosin-Sales J, Roughton M, Prasad SK, Pennell DJ. Refer-ence left atrial dimensions and volumes by steady state free precessioncardiovascular magnetic resonance. J Cardiovasc Magn Reson 2010;12:65.
140. Rodevand O, Bjornerheim R, Ljosland M, Maehle J, Smith HJ, Ihlen H.Left atrial volumes assessed by three- and two-dimensional echocardiog-raphy compared to MRI estimates. Int J Cardiovasc Imaging 1999;15:397-410.
141. Stojanovska J, Cronin P, Patel S, Gross BH, Oral H, Chughtai K, et al.Reference Normal Absolute and Indexed Values From ECG-GatedMDCT: Left Atrial Volume, Function, and Diameter. Am J Roentgenol2011;197:631-7.
142. Ujino K, Barnes ME, Cha SS, Langins AP, Bailey KR, Seward JB, et al.Two-dimensional echocardiographic methods for assessment of left atrialvolume. Am J Cardiol 2006;98:1185-8.
143. Aurigemma GP, Gottdiener JS, Arnold AM, Chinali M, Hill JC,Kitzman D. Left Atrial Volume and Geometry in Healthy Aging The Car-diovascular Health Study. Circ Cardiovasc Imaging 2009;2:282-9.
144. Thomas L, Levett K, Boyd A, Leung DYC, Schiller NB, Ross DL.Compensatory changes in atrial volumes with normal aging: Is atrialenlargement inevitable? J Am Coll Cardiol 2002;40:1630-5.
145. Yamaguchi K, Tanabe K, Tani T, Yagi T, Fujii Y, Konda T, et al. Left atrialvolume in normal Japanese adults. Circ J 2006;70:285-8.
146. Russo C, Hahn RT, Jin ZZ, Homma S, Sacco RL, Di Tullio MR. Compar-ison of Echocardiographic Single-Plane versus Biplane Method in theAssessment of Left Atrial Volume and Validation by Real Time Three-Dimensional Echocardiography. J Am Soc Echocardiogr 2010;23:954-60.
147. Nistri S, Galderisi M, Ballo P, Olivotto I, D’Andrea A, Pagliani L, et al. De-terminants of echocardiographic left atrial volume: implications fornormalcy. Eur J Echocardiogr 2011;12:826-33.
148. Vasan RS, Levy D, Larson MG, Benjamin EJ. Interpretation of echocar-diographic measurements: a call for standardization. Am Heart J 2000;139:412-22.
149. Knutsen KM, Stugaard M, Michelsen S, Otterstad JE. M-mode echocar-diographic findings in apparently healthy, non-athletic Norwegiansaged 20-70 years. Influence of age, sex and body surface area. J InternMed 1989;225:111-5.
150. Wang Y, Gutman JM, HeilbronD,WahrD, Schiller NB. Atrial volume in anormal adult population by two-dimensional echocardiography. Chest1984;86:595-601.
151. Cacciapuoti F, Scognamiglio A, Paoli VD, Romano C, Cacciaputo F. LeftAtrial Volume Index as Indicator of Left Venticular Diastolic Dysfunction.J Cardiovasc Ultrasound 2012;20:25-9.
152. Orban M, Bruce CJ, Pressman GS, Leinveber P, Romero-Corral A,Korinek J, et al. Dynamic Changes of Left Ventricular Performance andLeft Atrial Volume Induced by the Mueller Maneuver in Healthy YoungAdults and Implications for Obstructive Sleep Apnea, Atrial Fibrillation,and Heart Failure. Am J Cardiol 2008;102:1557-61.
153. WhitlockM, Garg A, Gelow J, Jacobson T, Broberg C. Comparison of Leftand Right Atrial Volume by Echocardiography Versus Cardiac MagneticResonance Imaging Using the Area-Length Method. Am J Cardiol 2010;106:1345-50.
154. Yoshida C, Nakao S, Goda A, Naito Y, Matsumoto M, Otsuka M, et al.Value of assessment of left atrial volume and diameter in patients withheart failure but with normal left ventricular ejection fraction and mitralflow velocity pattern. Eur J Echocardiogr 2009;10:278-81.
155. Iwataki M, Takeuchi M, Otani K, Kuwaki H, Haruki N, Yoshitani H, et al.Measurement of left atrial volume from transthoracic three-dimensionalechocardiographic datasets using the biplane Simpson’s technique. J AmSoc Echocardiogr 2012;25:1319-26.
156. Nagueh SF, Appleton CP, Gillebert TC, Marino PN, Oh JK, Smiseth OA,et al. Recommendations for the evaluation of left ventriculardiastolic function by echocardiography. J Am Soc Echocardiogr 2009;22:107-33.
157. Miyasaka Y, Tsujimoto S, Maeba H, Yuasa F, Takehana K, Dote K, et al.Left atrial volume by real-time three-dimensional echocardiography: vali-dation by 64-slice multidetector computed tomography. J Am Soc Echo-cardiogr 2011;24:680-6.
158. Rohner A, Brinkert M, Kawel N, Buechel RR, Leibundgut G, Grize L,et al. Functional assessment of the left atrium by real-time three-dimen-sional echocardiography using a novel dedicated analysis tool: initial vali-dation studies in comparison with computed tomography. Eur JEchocardiogr 2011;12:497-505.
38 Lang et al Journal of the American Society of EchocardiographyJanuary 2015
159. Artang R, Migrino RQ, Harmann L, BowersM,Woods TD. Left atrial vol-ume measurement with automated border detection by 3-dimensionalechocardiography: comparison with Magnetic Resonance Imaging. Car-diovasc Ultrasound 2009;7:16.
160. Mor-Avi V, Yodwut C, Jenkins C, Kuhl H, Nesser HJ, Marwick TH, et al.Real-time 3D echocardiographic quantification of left atrial volume:multicenter study for validation with CMR. JACC Cardiovasc Imaging2012;5:769-77.
161. Caselli S, Canali E, FoschiML, Santini D, Di Angelantonio E, PandianNG,et al. Long-term prognostic significance of three-dimensional echocardio-graphic parameters of the left ventricle and left atrium. Eur J Echocardiogr2010;11:250-6.
162. Suh IW, Song JM, Lee EY, Kang SH, Kim MJ, Kim JJ, et al. Left atrial vol-ume measured by real-time 3-dimensional echocardiography predictsclinical outcomes in patients with severe left ventricular dysfunctionand in sinus rhythm. J Am Soc Echocardiogr 2008;21:439-45.
163. Maddukuri PV, Vieira ML, DeCastro S, Maron MS, Kuvin JT, Patel AR,et al. What is the best approach for the assessment of left atrial size? Com-parison of various unidimensional and two-dimensional parameters withthree-dimensional echocardiographically determined left atrial volume. JAm Soc Echocardiogr 2006;19:1026-32.
164. Aune E, Baekkevar M, Roislien J, Rodevand O, Otterstad JE. Normalreference ranges for left and right atrial volume indexes and ejection frac-tions obtained with real-time three-dimensional echocardiography. Eur JEchocardiogr 2009;10:738-44.
165. Peluso D, Badano LP, Muraru D, Dianco LD, Cucchini U, Kocabay G,et al. Right Atrial Size and FUnction assessed with three-dimensionaland speckle-tracking echocardiography in 200 healthy volunteers. EurHeart J Cardiovasc Imaging 2013;14:1106-14.
166. DePace NL, Ren JF, Kotler MN, Mintz GS, Kimbiris D, Kalman P. Two-dimensional echocardiographic determination of right atrial emptyingvolume: a noninvasive index in quantifying the degree of tricuspid regur-gitation. Am J Cardiol 1983;52:525-9.
167. Kaplan JD, Evans GT, Foster E, Lim D, Schiller NB. Evaluation of Electro-cardiographic Criteria for Right Atrial Enlargement by Quantitative 2-Dimensional Echocardiography. J Am Coll Cardiol 1994;23:747-52.
168. Quraini D, Pandian NG, Patel AR. Three-Dimensional Echocardio-graphic Analysis of Right Atrial Volume in Normal and Abnormal Hearts:Comparison of Biplane and Multiplane Methods. Echocardiogr J Cardi-ovasc Ultrasound Allied Tech 2012;29:608-13.
169. Anderson RH. Clinical anatomy of the aortic root. Heart 2000;84:670-3.170. Anderson RH. Further anatomical insights regarding the Ross procedure.
Ann Thorac Surg 2006;81:411-2.171. Piazza N, de Jaegere P, Schultz C, Becker AE, Serruys PW, Anderson RH.
Anatomy of the aortic valvar complex and its implications for transcath-eter implantation of the aortic valve. Circ Cardiovasc Interv 2008;1:74-81.
172. Ho SY. Structure and anatomy of the aortic root. Eur J Echocardiogr2009;10:i3-10.
173. Messika-Zeitoun D, Serfaty JM, Brochet E, Ducrocq G, Lepage L,Detaint D, et al. Multimodal assessment of the aortic annulus diameter:implications for transcatheter aortic valve implantation. J Am Coll Car-diol 2010;55:186-94.
174. Moss RR, Ivens E, Pasupati S, Humphries K, ThompsonCR,Munt B, et al.Role of echocardiography in percutaneous aortic valve implantation.JACC Cardiovasc Imaging 2008;1:15-24.
175. Walther T, Dewey T, Borger MA, Kempfert J, Linke A, Becht R, et al.Transapical aortic valve implantation: step by step. Ann Thorac Surg2009;87:276-83.
176. Tops LF, Wood DA, Delgado V, Schuijf JD, Mayo JR, Pasupati S, et al.Noninvasive evaluation of the aortic root with multislice computed to-mography implications for transcatheter aortic valve replacement.JACC Cardiovasc Imaging 2008;1:321-30.
177. Kazui T, Izumoto H, Yoshioka K, Kawazoe K. Dynamic morphologicchanges in the normal aortic annulus during systole and diastole. J HeartValve Dis 2006;15:617-21.
178. Shiran A, Adawi S, Ganaeem M, Asmer E. Accuracy and reproducibilityof left ventricular outflow tract diameter measurement using transtho-racic when compared with transesophageal echocardiography in systoleand diastole. Eur J Echocardiogr 2009;10:319-24.
179. Hamdan A, Guetta V, Konen E, Goitein O, Segev A, Raanani E, et al.Deformation dynamics and mechanical properties of the aortic annulusby 4-dimensional computed tomography: insights into the functionalanatomy of the aortic valve complex and implications for transcatheteraortic valve therapy. J Am Coll Cardiol 2012;59:119-27.
180. Chin D. Echocardiography for transcatheter aortic valve implantation.Eur J Echocardiogr 2009;10:i21-9.
181. Zamorano JL, Badano LP, Bruce C, Chan KL, Goncalves A, Hahn RT,et al. EAE/ASE recommendations for the use of echocardiography innew transcatheter interventions for valvular heart disease. J Am Soc Echo-cardiogr 2011;24:937-65.
182. Holmes DR Jr., Mack MJ, Kaul S, Agnihotri A, Alexander KP, Bailey SR,et al. 2012 ACCF/AATS/SCAI/STS expert consensus document ontranscatheter aortic valve replacement. J Am Coll Cardiol 2012;59:1200-54.
183. Achenbach S, Delgado V, Hausleiter J, Schoenhagen P, Min JK,Leipsic JA. SCCTexpert consensus document on computed tomographyimaging before transcatheter aortic valve implantation (TAVI)/transcath-eter aortic valve replacement (TAVR). J Cardiovasc Comput Tomogr2012;6:366-80.
184. Kasel AM, Cassese S, Bleiziffer S, Amaki M, Hahn RT, Kastrati A, et al.Standardized imaging for aortic annular sizing: implications for transcath-eter valve selection. JACC Cardiovasc Imaging 2013;6:249-62.
185. Pershad A, Stone D, Morris MF, Fang K, Gellert G. Aortic annulusmeasurement and relevance to successful transcatheter aortic valvereplacement: a new technique using 3D TEE. J Interv Cardiol2013;26:302-9.
186. Hahn RT, KhaliqueO,WilliamsMR, Koss E, Paradis JM, Daneault B, et al.Predicting paravalvular regurgitation following transcatheter valvereplacement: utility of a novel method for three-dimensional echocardio-graphic measurements of the aortic annulus. J Am Soc Echocardiogr2013;26:1043-52.
187. Flachskampf FA, Wouters PF, Edvardsen T, Evangelista A, Habib G,Hoffman P, et al. Recommendations for transoesophageal echocardiog-raphy: EACVI update 2014. Eur Heart J Cardiovasc Imaging 2014;15:353-65.
188. Hutter A,Opitz A, Bleiziffer S, RugeH, Hettich I, Mazzitelli D, et al. Aorticannulus evaluation in transcatheter aortic valve implantation. CatheterCardiovasc Interv 2010;76:1009-19.
189. Leipsic J, Gurvitch R, Labounty TM, Min JK, Wood D, Johnson M, et al.Multidetector computed tomography in transcatheter aortic valve im-plantation. JACC Cardiovasc Imaging 2011;4:416-29.
190. Delgado V, Ng AC, van de Veire NR, van der Kley F, Schuijf JD,Tops LF, et al. Transcatheter aortic valve implantation: role of multi-detector row computed tomography to evaluate prosthesis positioningand deployment in relation to valve function. Eur Heart J 2010;31:1114-23.
191. Willson AB, Webb JG, Freeman M, Wood DA, Gurvitch R,Thompson CR, et al. Computed tomography-based sizing recommenda-tions for transcatheter aortic valve replacement with balloon-expandablevalves: Comparison with transesophageal echocardiography and ratio-nale for implementation in a prospective trial. J Cardiovasc Comput To-mogr 2012;6:406-14.
192. Utsunomiya H, Yamamoto H, Horiguchi J, Kunita E, Okada T,Yamazato R, et al. Underestimation of aortic valve area in calcified aorticvalve disease: effects of left ventricular outflow tract ellipticity. Int J Car-diol 2012;157:347-53.
193. Gurvitch R, Webb JG, Yuan R, Johnson M, Hague C, Willson AB,et al. Aortic annulus diameter determination by multidetectorcomputed tomography: reproducibility, applicability, and implicationsfor transcatheter aortic valve implantation. JACC Cardiovasc Interv2011;4:1235-45.
Journal of the American Society of EchocardiographyVolume 28 Number 1
Lang et al 39
194. Goldstein SA, Evangelista A, Abbara S, Arai A, Acsh F, Badano LP, et al.ASE/EAE recommendations for multimodality imaging techniques fordiseases of the aorta: Expert consensus statement. J Am Soc Echocardiogr2014 (in press).
195. RomanMJ, Devereux RB, Kramer-Fox R, O’Loughlin J. Two-dimensionalechocardiographic aortic root dimensions in normal children and adults.Am J Cardiol 1989;64:507-12.
196. Vasan RS, Larson MG, Benjamin EJ, Levy D. Echocardiographic refer-ence values for aortic root size: the Framingham Heart Study. J AmSoc Echocardiogr 1995;8:793-800.
197. RomanMJ,DevereuxRB,NilesNW,Hochreiter C,Kligfield P, SatoN, et al.Aortic root dilatation as a cause of isolated, severe aortic regurgitation. Prev-alence, clinical and echocardiographic patterns, and relation to left ventric-ular hypertrophy and function. Ann Intern Med 1987;106:800-7.
198. Moreno FL, Hagan AD, Holmen JR, Pryor TA, Strickland RD, Castle CH.Evaluation of size and dynamics of the inferior vena cava as an index ofright-sided cardiac function. Am J Cardiol 1984;53:579-85.
199. Brennan JM, Blair JE, Goonewardena S, Ronan A, Shah D, Vasaiwala S,et al. Reappraisal of the use of inferior vena cava for estimating right atrialpressure. J Am Soc Echocardiogr 2007;20:857-61.
200. Kircher BJ, Himelman RB, Schiller NB. Noninvasive estimation of rightatrial pressure from the inspiratory collapse of the inferior vena cava.Am J Cardiol 1990;66:493-6.
201. Goldhammer E, Mesnick N, Abinader EG, Sagiv M. Dilated inferior venacava: a common echocardiographic finding in highly trained elite ath-letes. J Am Soc Echocardiogr 1999;12:988-93.
202. Jue J, Chung W, Schiller NB. Does inferior vena cava size predict rightatrial pressures in patients receiving mechanical ventilation? J Am SocEchocardiogr 1992;5:613-9.
203. Arthur ME, Landolfo C, Wade M, Castresana MR. Inferior vena cavadiameter (IVCD) measured with transesophageal echocardiography(TEE) can be used to derive the central venous pressure (CVP) in anes-thetized mechanically ventilated patients. Echocardiography 2009;26:140-9.
204. Hiratzka LF, Bakris GL, Beckman JA, Bersin RM, Carr VF, Casey DE Jr,et al. 2010 ACCF/AHA/AATS/ACR/ASA/SCA/SCAI/SIR/STS/SVMguidelines for the diagnosis and management of patients with ThoracicAortic Disease: a report of the American College of Cardiology Founda-tion/American Heart Association Task Force on Practice Guidelines,American Association for Thoracic Surgery, American College of Radi-ology, American Stroke Association, Society of Cardiovascular Anesthe-siologists, Society for Cardiovascular Angiography and Interventions,Society of Interventional Radiology, Society of Thoracic Surgeons, andSociety for Vascular Medicine. Circulation 2010;121:e266-369.
205. Mosteller RD. Simplified calculation of body-surface area. N Engl J Med1987;317:1098.
39.e1 Lang et al Journal of the American Society of EchocardiographyJanuary 2015
APPENDIX
Methods
When possible, data on systolic blood pressure, diastolic blood pres-sure, diagnosis of hypertension, treatment of hypertension, diagnosisof diabetes, fasting glucose levels, creatinine levels, total cholesterollevel, low-density lipoprotein cholesterol levels, and triglyceride levelswere obtained. BSA was calculated using the Mosteller formula.205
Body mass index was calculated by dividing the weight in kilogramsby the height in meters squared.
Echocardiographic Measurements
Transthoracic echocardiographic measurements were performed foreach of the studies as per available published guidelines.1 Values forthe following measurements were provided from the following 2D
transthoracic echocardiographic views: LV end-diastolic diameterand LV end-systolic diameter from the parasternal long-axis view;LV EDV, LV ESV, and LV EF from the apical four- and two-chamber views; and LV EDV, LV ESV, LV stroke volume, and LVEF from the biplane view.
Statistical Analysis
All studied parameters were found to satisfy a normal distribution us-ing the Kolmogorov-Smirnov test, and summary data for these vari-ables are expressed as mean 6 SD. Multivariate analysis was usedto determine the dependence of the measured parameters on age,gender, and BSA. Simple univariate linear regression against agewas then used to construct the presented nomograms normalizedfor BSA and divided by gender as mean and 95% confidence inter-vals. P values < .05 were considered significant.
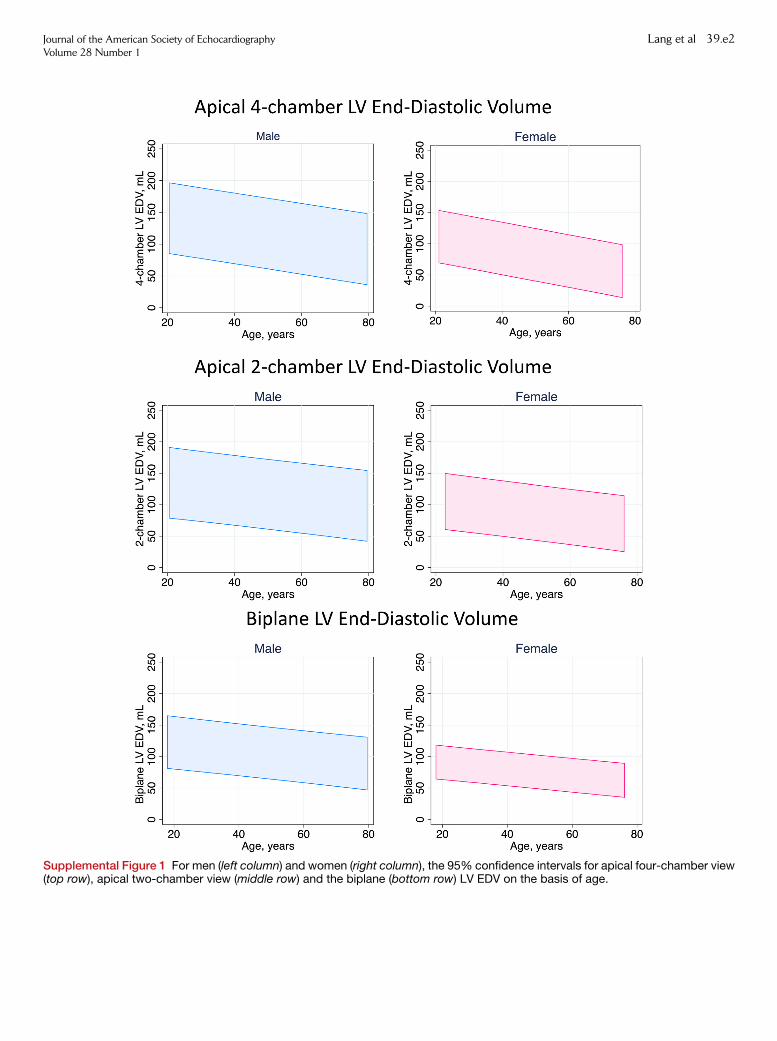
Supplemental Figure 1 For men (left column) and women (right column), the 95% confidence intervals for apical four-chamber view(top row), apical two-chamber view (middle row) and the biplane (bottom row) LV EDV on the basis of age.
Journal of the American Society of EchocardiographyVolume 28 Number 1
Lang et al 39.e2
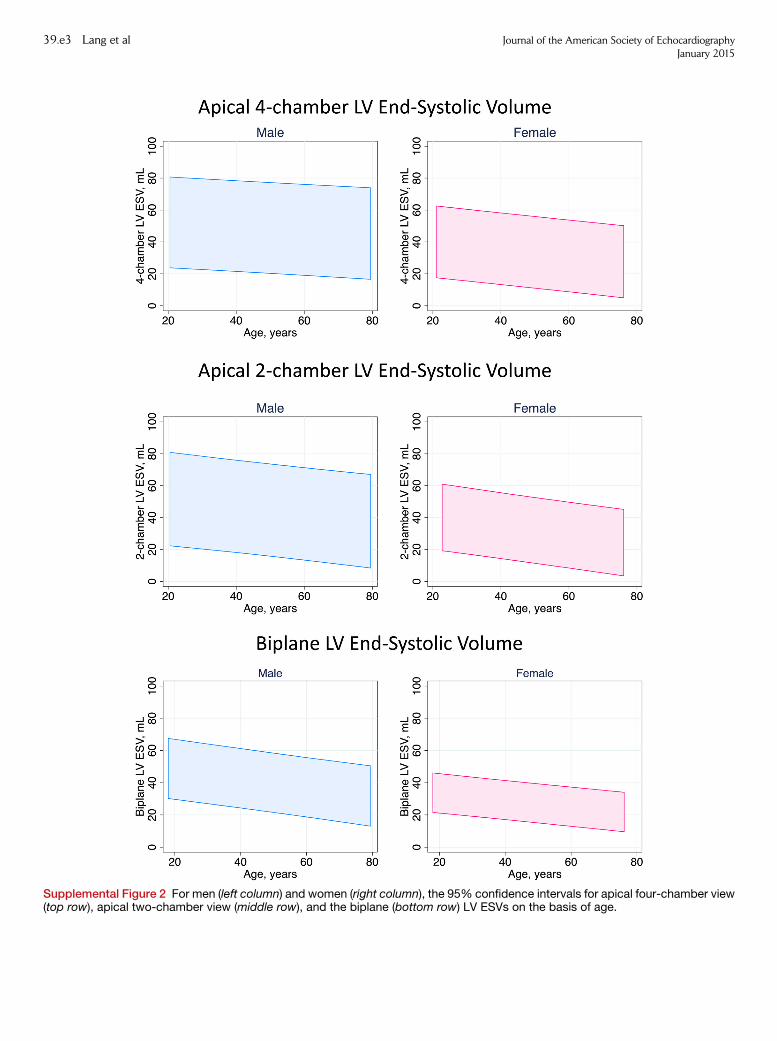
Supplemental Figure 2 For men (left column) and women (right column), the 95% confidence intervals for apical four-chamber view(top row), apical two-chamber view (middle row), and the biplane (bottom row) LV ESVs on the basis of age.
39.e3 Lang et al Journal of the American Society of EchocardiographyJanuary 2015
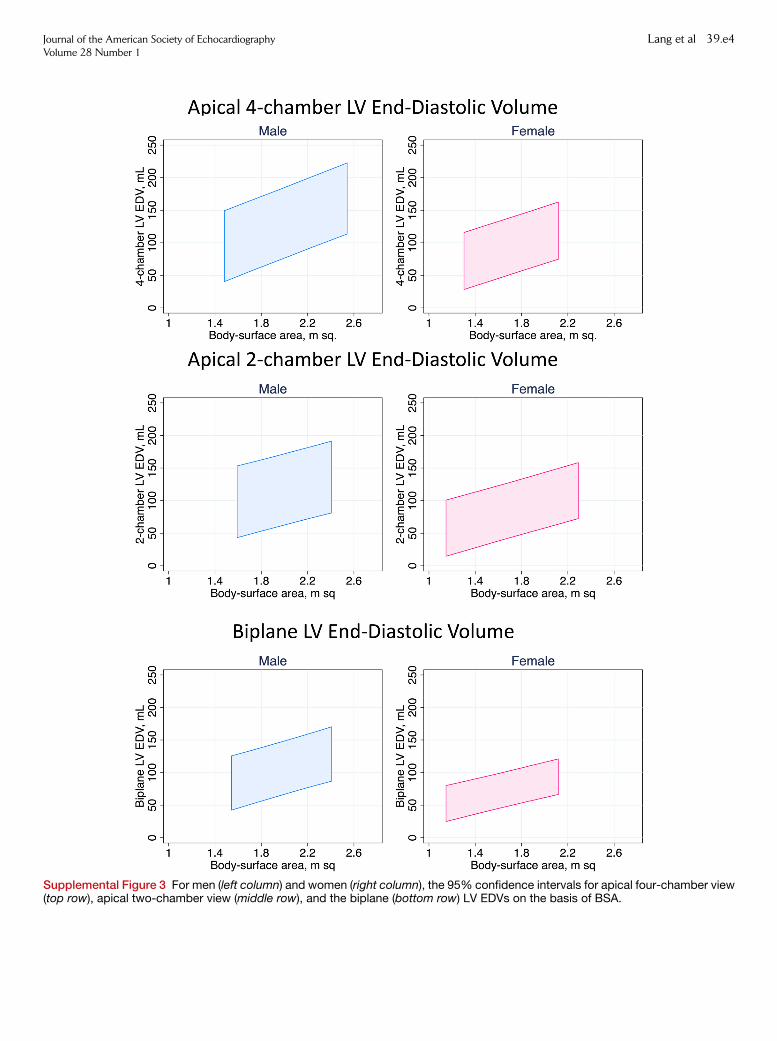
Supplemental Figure 3 For men (left column) and women (right column), the 95% confidence intervals for apical four-chamber view(top row), apical two-chamber view (middle row), and the biplane (bottom row) LV EDVs on the basis of BSA.
Journal of the American Society of EchocardiographyVolume 28 Number 1
Lang et al 39.e4
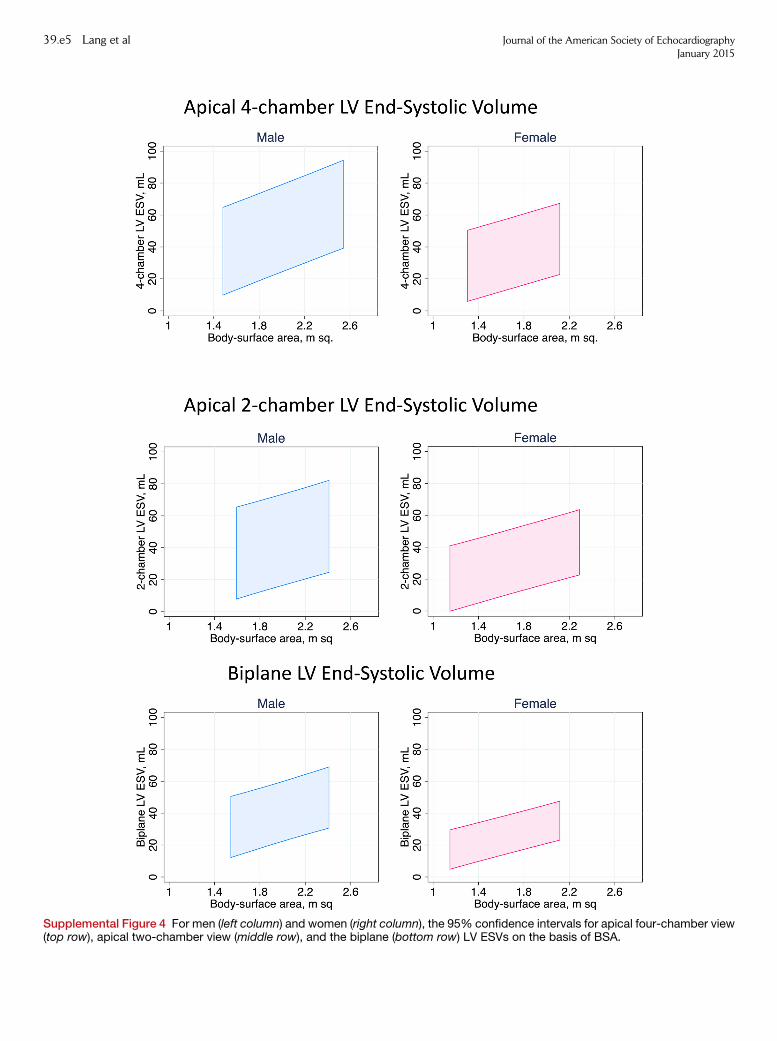
Supplemental Figure 4 For men (left column) and women (right column), the 95% confidence intervals for apical four-chamber view(top row), apical two-chamber view (middle row), and the biplane (bottom row) LV ESVs on the basis of BSA.
39.e5 Lang et al Journal of the American Society of EchocardiographyJanuary 2015
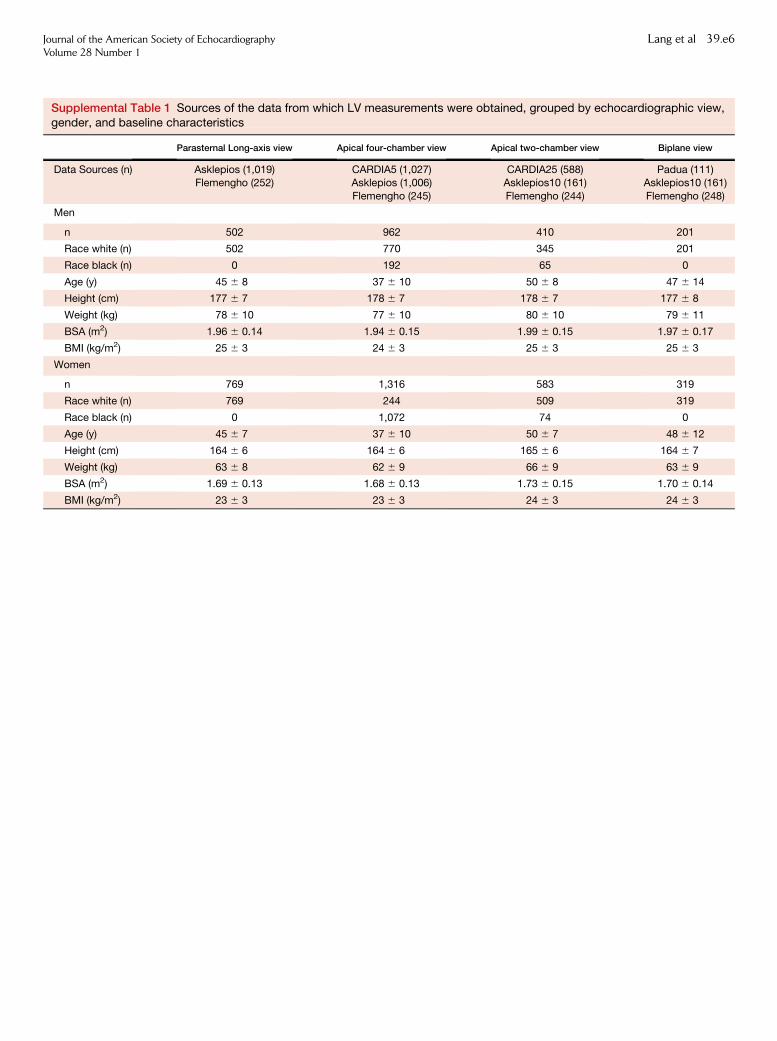
Supplemental Table 1 Sources of the data from which LV measurements were obtained, grouped by echocardiographic view,gender, and baseline characteristics
Parasternal Long-axis view Apical four-chamber view Apical two-chamber view Biplane view
Data Sources (n) Asklepios (1,019)Flemengho (252)
CARDIA5 (1,027)Asklepios (1,006)
Flemengho (245)
CARDIA25 (588)Asklepios10 (161)
Flemengho (244)
Padua (111)Asklepios10 (161)
Flemengho (248)
Men
n 502 962 410 201
Race white (n) 502 770 345 201
Race black (n) 0 192 65 0
Age (y) 45 6 8 37 6 10 50 6 8 47 6 14
Height (cm) 177 6 7 178 6 7 178 6 7 177 6 8
Weight (kg) 78 6 10 77 6 10 80 6 10 79 6 11
BSA (m2) 1.96 6 0.14 1.94 6 0.15 1.99 6 0.15 1.97 6 0.17
BMI (kg/m2) 25 6 3 24 6 3 25 6 3 25 6 3
Women
n 769 1,316 583 319
Race white (n) 769 244 509 319
Race black (n) 0 1,072 74 0
Age (y) 45 6 7 37 6 10 50 6 7 48 6 12
Height (cm) 164 6 6 164 6 6 165 6 6 164 6 7
Weight (kg) 63 6 8 62 6 9 66 6 9 63 6 9
BSA (m2) 1.69 6 0.13 1.68 6 0.13 1.73 6 0.15 1.70 6 0.14
BMI (kg/m2) 23 6 3 23 6 3 24 6 3 24 6 3
Journal of the American Society of EchocardiographyVolume 28 Number 1
Lang et al 39.e6
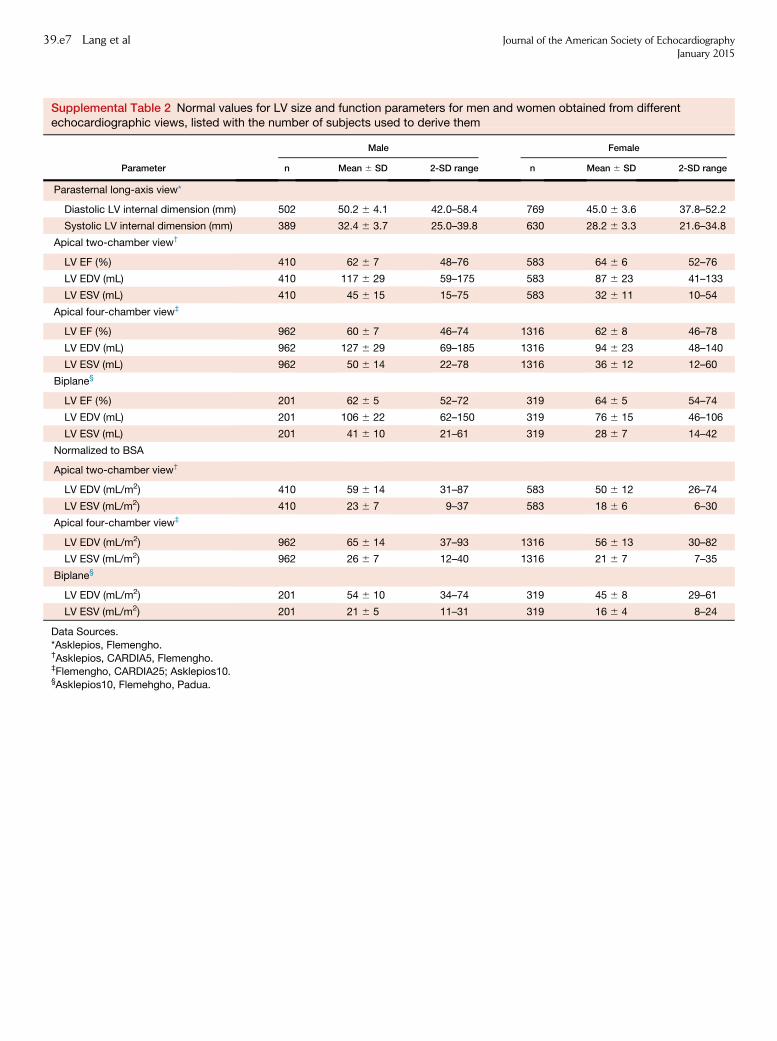
Supplemental Table 2 Normal values for LV size and function parameters for men and women obtained from differentechocardiographic views, listed with the number of subjects used to derive them
Parameter
Male Female
n Mean 6 SD 2-SD range n Mean 6 SD 2-SD range
Parasternal long-axis view*
Diastolic LV internal dimension (mm) 502 50.2 6 4.1 42.0–58.4 769 45.0 6 3.6 37.8–52.2
Systolic LV internal dimension (mm) 389 32.4 6 3.7 25.0–39.8 630 28.2 6 3.3 21.6–34.8
Apical two-chamber view†
LV EF (%) 410 62 6 7 48–76 583 64 6 6 52–76
LV EDV (mL) 410 117 6 29 59–175 583 87 6 23 41–133
LV ESV (mL) 410 45 6 15 15–75 583 32 6 11 10–54
Apical four-chamber view‡
LV EF (%) 962 60 6 7 46–74 1316 62 6 8 46–78
LV EDV (mL) 962 127 6 29 69–185 1316 94 6 23 48–140
LV ESV (mL) 962 50 6 14 22–78 1316 36 6 12 12–60
Biplane§
LV EF (%) 201 62 6 5 52–72 319 64 6 5 54–74
LV EDV (mL) 201 106 6 22 62–150 319 76 6 15 46–106
LV ESV (mL) 201 41 6 10 21–61 319 28 6 7 14–42
Normalized to BSA
Apical two-chamber view†
LV EDV (mL/m2) 410 59 6 14 31–87 583 50 6 12 26–74
LV ESV (mL/m2) 410 23 6 7 9–37 583 18 6 6 6–30
Apical four-chamber view‡
LV EDV (mL/m2) 962 65 6 14 37–93 1316 56 6 13 30–82
LV ESV (mL/m2) 962 26 6 7 12–40 1316 21 6 7 7–35
Biplane§
LV EDV (mL/m2) 201 54 6 10 34–74 319 45 6 8 29–61
LV ESV (mL/m2) 201 21 6 5 11–31 319 16 6 4 8–24
Data Sources.
*Asklepios, Flemengho.†Asklepios, CARDIA5, Flemengho.‡Flemengho, CARDIA25; Asklepios10.§Asklepios10, Flemehgho, Padua.
39.e7 Lang et al Journal of the American Society of EchocardiographyJanuary 2015
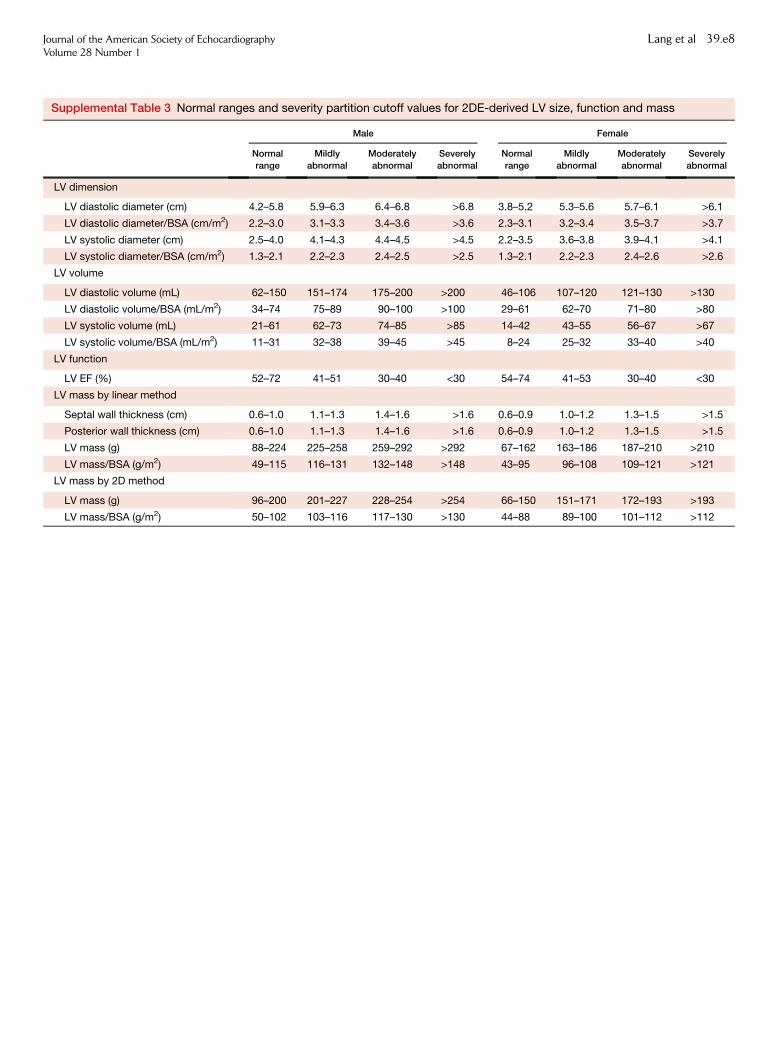
Supplemental Table 3 Normal ranges and severity partition cutoff values for 2DE-derived LV size, function and mass
Male Female
Normal
range
Mildly
abnormal
Moderately
abnormal
Severely
abnormal
Normal
range
Mildly
abnormal
Moderately
abnormal
Severely
abnormal
LV dimension
LV diastolic diameter (cm) 4.2–5.8 5.9–6.3 6.4–6.8 >6.8 3.8–5.2 5.3–5.6 5.7–6.1 >6.1
LV diastolic diameter/BSA (cm/m2) 2.2–3.0 3.1–3.3 3.4–3.6 >3.6 2.3–3.1 3.2–3.4 3.5–3.7 >3.7
LV systolic diameter (cm) 2.5–4.0 4.1–4.3 4.4–4.5 >4.5 2.2–3.5 3.6–3.8 3.9–4.1 >4.1
LV systolic diameter/BSA (cm/m2) 1.3–2.1 2.2–2.3 2.4–2.5 >2.5 1.3–2.1 2.2–2.3 2.4–2.6 >2.6
LV volume
LV diastolic volume (mL) 62–150 151–174 175–200 >200 46–106 107–120 121–130 >130
LV diastolic volume/BSA (mL/m2) 34–74 75–89 90–100 >100 29–61 62–70 71–80 >80
LV systolic volume (mL) 21–61 62–73 74–85 >85 14–42 43–55 56–67 >67
LV systolic volume/BSA (mL/m2) 11–31 32–38 39–45 >45 8–24 25–32 33–40 >40
LV function
LV EF (%) 52–72 41–51 30–40 <30 54–74 41–53 30–40 <30
LV mass by linear method
Septal wall thickness (cm) 0.6–1.0 1.1–1.3 1.4–1.6 >1.6 0.6–0.9 1.0–1.2 1.3–1.5 >1.5
Posterior wall thickness (cm) 0.6–1.0 1.1–1.3 1.4–1.6 >1.6 0.6–0.9 1.0–1.2 1.3–1.5 >1.5
LV mass (g) 88–224 225–258 259–292 >292 67–162 163–186 187–210 >210
LV mass/BSA (g/m2) 49–115 116–131 132–148 >148 43–95 96–108 109–121 >121
LV mass by 2D method
LV mass (g) 96–200 201–227 228–254 >254 66–150 151–171 172–193 >193
LV mass/BSA (g/m2) 50–102 103–116 117–130 >130 44–88 89–100 101–112 >112
Journal of the American Society of EchocardiographyVolume 28 Number 1
Lang et al 39.e8
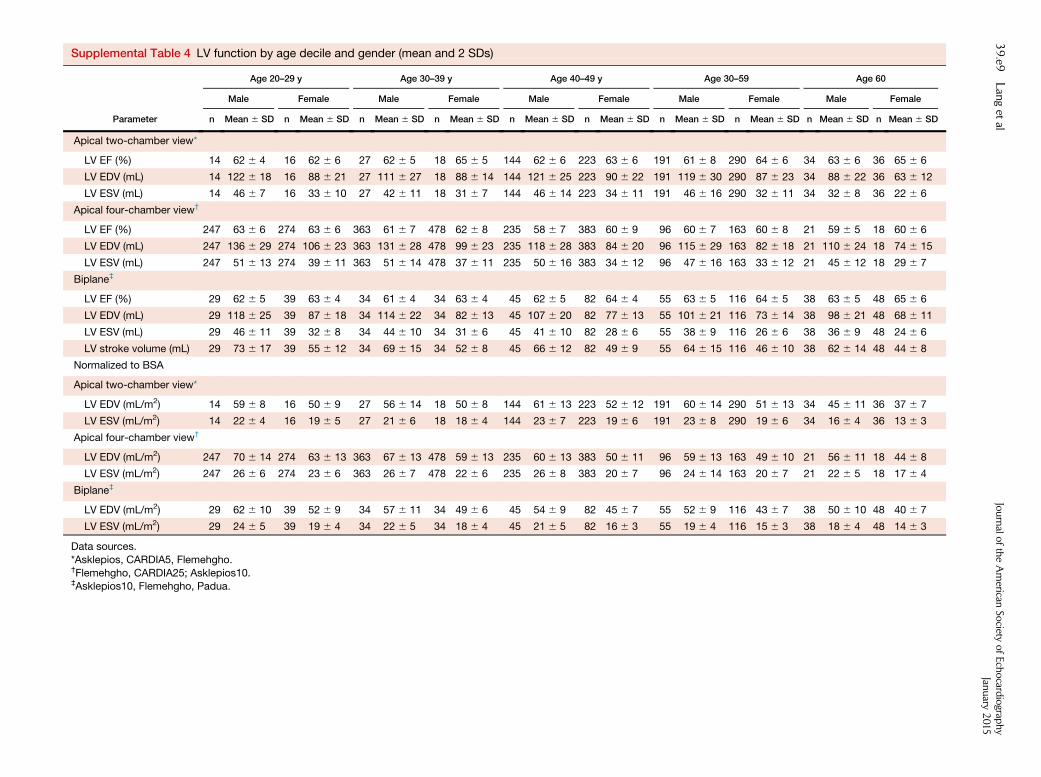
Supplemental Table 4 LV function by age decile and gender (mean and 2 SDs)
Parameter
Age 20–29 y Age 30–39 y Age 40–49 y Age 30–59 Age 60
Male Female Male Female Male Female Male Female Male Female
n Mean 6 SD n Mean 6 SD n Mean 6 SD n Mean 6 SD n Mean 6 SD n Mean 6 SD n Mean 6 SD n Mean 6 SD n Mean 6 SD n Mean 6 SD
Apical two-chamber view*
LV EF (%) 14 62 6 4 16 62 6 6 27 62 6 5 18 65 6 5 144 62 6 6 223 63 6 6 191 61 6 8 290 64 6 6 34 63 6 6 36 65 6 6
LV EDV (mL) 14 122 6 18 16 88 6 21 27 111 6 27 18 88 6 14 144 121 6 25 223 90 6 22 191 119 6 30 290 87 6 23 34 88 6 22 36 63 6 12
LV ESV (mL) 14 46 6 7 16 33 6 10 27 42 6 11 18 31 6 7 144 46 6 14 223 34 6 11 191 46 6 16 290 32 6 11 34 32 6 8 36 22 6 6
Apical four-chamber view†
LV EF (%) 247 63 6 6 274 63 6 6 363 61 6 7 478 62 6 8 235 58 6 7 383 60 6 9 96 60 6 7 163 60 6 8 21 59 6 5 18 60 6 6
LV EDV (mL) 247 136 6 29 274 106 6 23 363 131 6 28 478 99 6 23 235 118 6 28 383 84 6 20 96 115 6 29 163 82 6 18 21 110 6 24 18 74 6 15
LV ESV (mL) 247 51 6 13 274 39 6 11 363 51 6 14 478 37 6 11 235 50 6 16 383 34 6 12 96 47 6 16 163 33 6 12 21 45 6 12 18 29 6 7
Biplane‡
LV EF (%) 29 62 6 5 39 63 6 4 34 61 6 4 34 63 6 4 45 62 6 5 82 64 6 4 55 63 6 5 116 64 6 5 38 63 6 5 48 65 6 6
LV EDV (mL) 29 118 6 25 39 87 6 18 34 114 6 22 34 82 6 13 45 107 6 20 82 77 6 13 55 101 6 21 116 73 6 14 38 98 6 21 48 68 6 11
LV ESV (mL) 29 46 6 11 39 32 6 8 34 44 6 10 34 31 6 6 45 41 6 10 82 28 6 6 55 38 6 9 116 26 6 6 38 36 6 9 48 24 6 6
LV stroke volume (mL) 29 73 6 17 39 55 6 12 34 69 6 15 34 52 6 8 45 66 6 12 82 49 6 9 55 64 6 15 116 46 6 10 38 62 6 14 48 44 6 8
Normalized to BSA
Apical two-chamber view*
LV EDV (mL/m2) 14 59 6 8 16 50 6 9 27 56 6 14 18 50 6 8 144 61 6 13 223 52 6 12 191 60 6 14 290 51 6 13 34 45 6 11 36 37 6 7
LV ESV (mL/m2) 14 22 6 4 16 19 6 5 27 21 6 6 18 18 6 4 144 23 6 7 223 19 6 6 191 23 6 8 290 19 6 6 34 16 6 4 36 13 6 3
Apical four-chamber view†
LV EDV (mL/m2) 247 70 6 14 274 63 6 13 363 67 6 13 478 59 6 13 235 60 6 13 383 50 6 11 96 59 6 13 163 49 6 10 21 56 6 11 18 44 6 8
LV ESV (mL/m2) 247 26 6 6 274 23 6 6 363 26 6 7 478 22 6 6 235 26 6 8 383 20 6 7 96 24 6 14 163 20 6 7 21 22 6 5 18 17 6 4
Biplane‡
LV EDV (mL/m2) 29 62 6 10 39 52 6 9 34 57 6 11 34 49 6 6 45 54 6 9 82 45 6 7 55 52 6 9 116 43 6 7 38 50 6 10 48 40 6 7
LV ESV (mL/m2) 29 24 6 5 39 19 6 4 34 22 6 5 34 18 6 4 45 21 6 5 82 16 6 3 55 19 6 4 116 15 6 3 38 18 6 4 48 14 6 3
Data sources.
*Asklepios, CARDIA5, Flemehgho.†Flemehgho, CARDIA25; Asklepios10.‡Asklepios10, Flemehgho, Padua.
39.e9
Langet
alJournalo
ftheAmerican
Society
ofEchocard
iograp
hy
January
2015
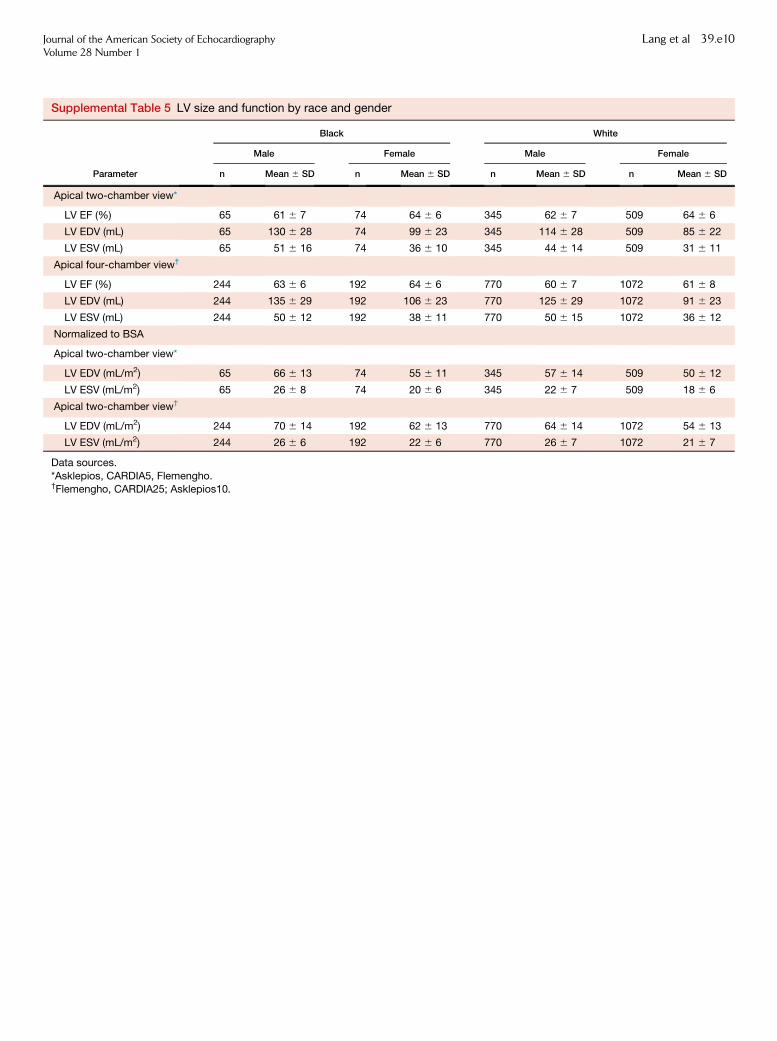
Supplemental Table 5 LV size and function by race and gender
Parameter
Black White
Male Female Male Female
n Mean 6 SD n Mean 6 SD n Mean 6 SD n Mean 6 SD
Apical two-chamber view*
LV EF (%) 65 61 6 7 74 64 6 6 345 62 6 7 509 64 6 6
LV EDV (mL) 65 130 6 28 74 99 6 23 345 114 6 28 509 85 6 22
LV ESV (mL) 65 51 6 16 74 36 6 10 345 44 6 14 509 31 6 11
Apical four-chamber view†
LV EF (%) 244 63 6 6 192 64 6 6 770 60 6 7 1072 61 6 8
LV EDV (mL) 244 135 6 29 192 106 6 23 770 125 6 29 1072 91 6 23
LV ESV (mL) 244 50 6 12 192 38 6 11 770 50 6 15 1072 36 6 12
Normalized to BSA
Apical two-chamber view*
LV EDV (mL/m2) 65 66 6 13 74 55 6 11 345 57 6 14 509 50 6 12
LV ESV (mL/m2) 65 26 6 8 74 20 6 6 345 22 6 7 509 18 6 6
Apical two-chamber view†
LV EDV (mL/m2) 244 70 6 14 192 62 6 13 770 64 6 14 1072 54 6 13
LV ESV (mL/m2) 244 26 6 6 192 22 6 6 770 26 6 7 1072 21 6 7
Data sources.
*Asklepios, CARDIA5, Flemengho.†Flemengho, CARDIA25; Asklepios10.
Journal of the American Society of EchocardiographyVolume 28 Number 1
Lang et al 39.e10
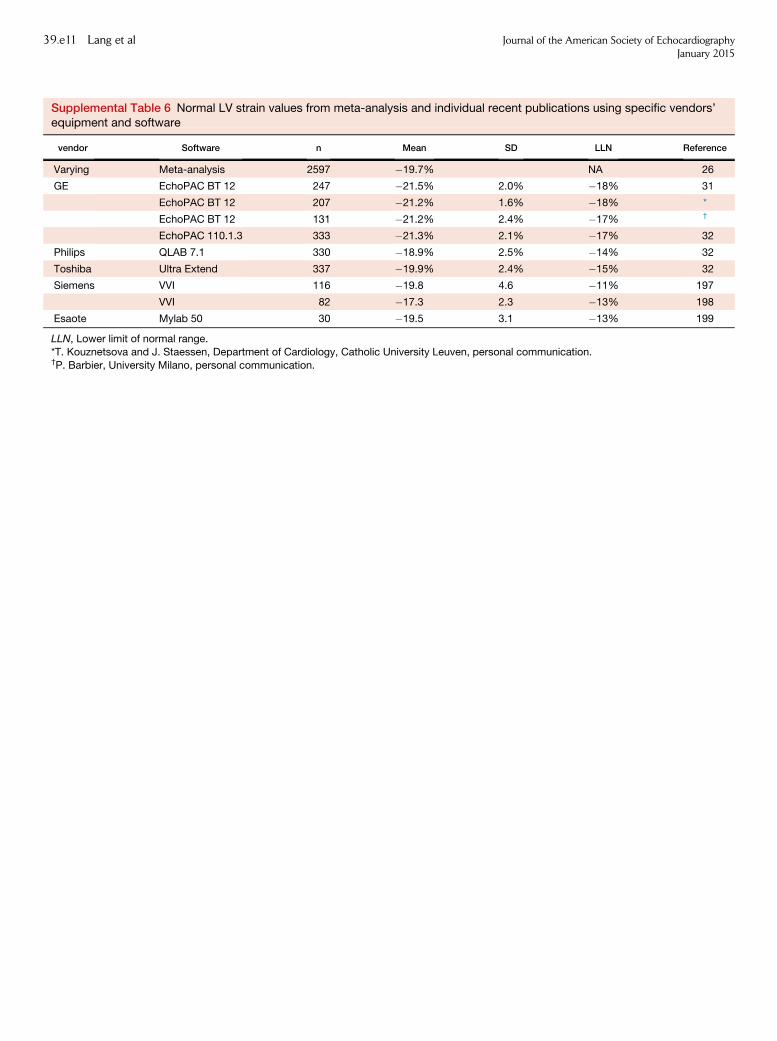
Supplemental Table 6 Normal LV strain values from meta-analysis and individual recent publications using specific vendors’equipment and software
vendor Software n Mean SD LLN Reference
Varying Meta-analysis 2597 �19.7% NA 26
GE EchoPAC BT 12 247 �21.5% 2.0% �18% 31
EchoPAC BT 12 207 �21.2% 1.6% �18% *
EchoPAC BT 12 131 �21.2% 2.4% �17% †
EchoPAC 110.1.3 333 �21.3% 2.1% �17% 32
Philips QLAB 7.1 330 �18.9% 2.5% �14% 32
Toshiba Ultra Extend 337 �19.9% 2.4% �15% 32
Siemens VVI 116 �19.8 4.6 �11% 197
VVI 82 �17.3 2.3 �13% 198
Esaote Mylab 50 30 �19.5 3.1 �13% 199
LLN, Lower limit of normal range.*T. Kouznetsova and J. Staessen, Department of Cardiology, Catholic University Leuven, personal communication.†P. Barbier, University Milano, personal communication.
39.e11 Lang et al Journal of the American Society of EchocardiographyJanuary 2015
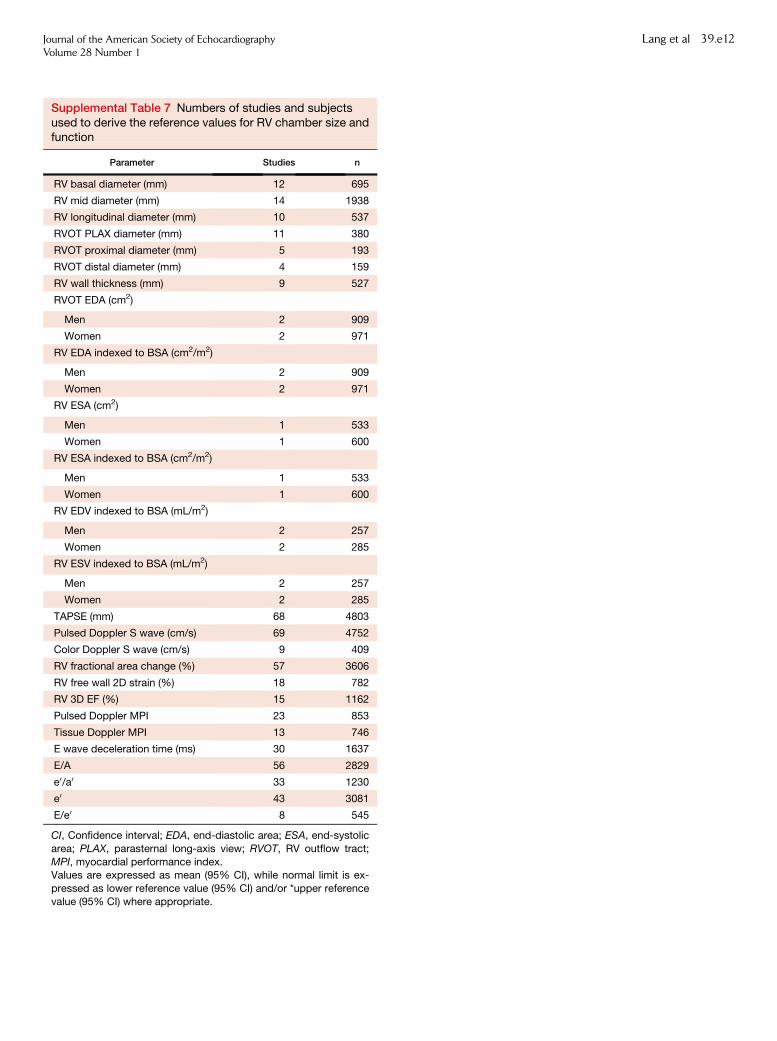
Supplemental Table 7 Numbers of studies and subjectsused to derive the reference values for RV chamber size andfunction
Parameter Studies n
RV basal diameter (mm) 12 695
RV mid diameter (mm) 14 1938
RV longitudinal diameter (mm) 10 537
RVOT PLAX diameter (mm) 11 380
RVOT proximal diameter (mm) 5 193
RVOT distal diameter (mm) 4 159
RV wall thickness (mm) 9 527
RVOT EDA (cm2)
Men 2 909
Women 2 971
RV EDA indexed to BSA (cm2/m2)
Men 2 909
Women 2 971
RV ESA (cm2)
Men 1 533
Women 1 600
RV ESA indexed to BSA (cm2/m2)
Men 1 533
Women 1 600
RV EDV indexed to BSA (mL/m2)
Men 2 257
Women 2 285
RV ESV indexed to BSA (mL/m2)
Men 2 257
Women 2 285
TAPSE (mm) 68 4803
Pulsed Doppler S wave (cm/s) 69 4752
Color Doppler S wave (cm/s) 9 409
RV fractional area change (%) 57 3606
RV free wall 2D strain (%) 18 782
RV 3D EF (%) 15 1162
Pulsed Doppler MPI 23 853
Tissue Doppler MPI 13 746
E wave deceleration time (ms) 30 1637
E/A 56 2829
e0/a0 33 1230
e0 43 3081
E/e0 8 545
CI, Confidence interval; EDA, end-diastolic area; ESA, end-systolic
area; PLAX, parasternal long-axis view; RVOT, RV outflow tract;
MPI, myocardial performance index.Values are expressed as mean (95% CI), while normal limit is ex-
pressed as lower reference value (95% CI) and/or *upper reference
value (95% CI) where appropriate.
Journal of the American Society of EchocardiographyVolume 28 Number 1
Lang et al 39.e12
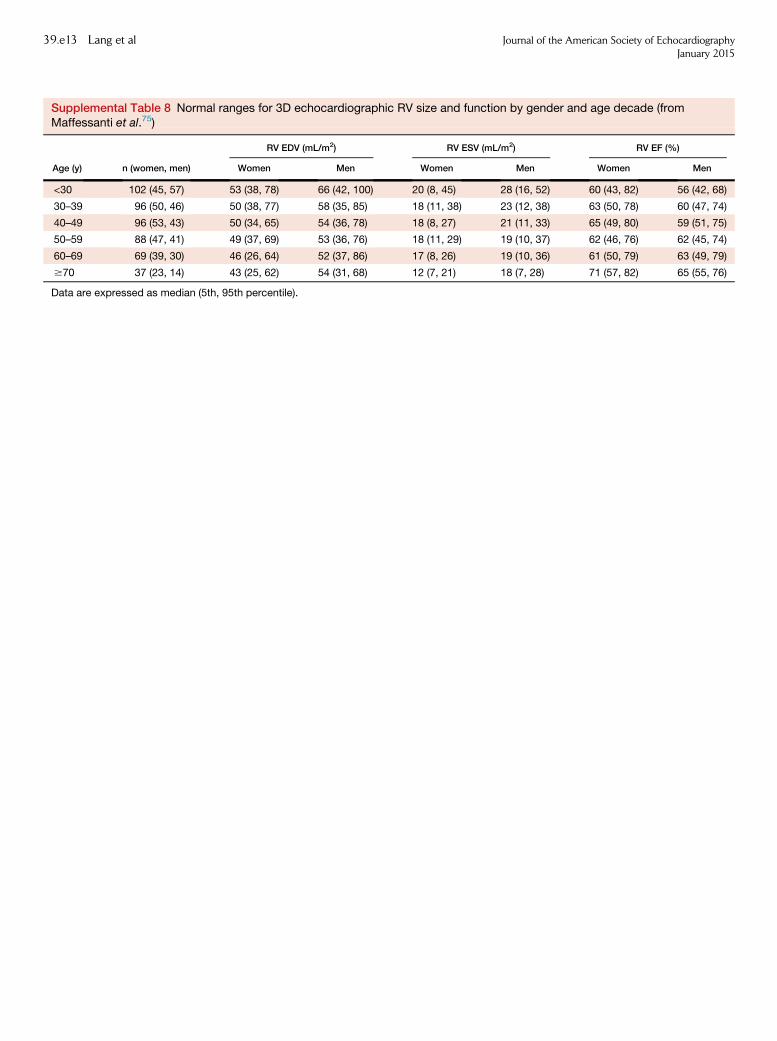
Supplemental Table 8 Normal ranges for 3D echocardiographic RV size and function by gender and age decade (fromMaffessanti et al.75)
Age (y) n (women, men)
RV EDV (mL/m2) RV ESV (mL/m2) RV EF (%)
Women Men Women Men Women Men
<30 102 (45, 57) 53 (38, 78) 66 (42, 100) 20 (8, 45) 28 (16, 52) 60 (43, 82) 56 (42, 68)
30–39 96 (50, 46) 50 (38, 77) 58 (35, 85) 18 (11, 38) 23 (12, 38) 63 (50, 78) 60 (47, 74)
40–49 96 (53, 43) 50 (34, 65) 54 (36, 78) 18 (8, 27) 21 (11, 33) 65 (49, 80) 59 (51, 75)
50–59 88 (47, 41) 49 (37, 69) 53 (36, 76) 18 (11, 29) 19 (10, 37) 62 (46, 76) 62 (45, 74)
60–69 69 (39, 30) 46 (26, 64) 52 (37, 86) 17 (8, 26) 19 (10, 36) 61 (50, 79) 63 (49, 79)
$70 37 (23, 14) 43 (25, 62) 54 (31, 68) 12 (7, 21) 18 (7, 28) 71 (57, 82) 65 (55, 76)
Data are expressed as median (5th, 95th percentile).
39.e13 Lang et al Journal of the American Society of EchocardiographyJanuary 2015
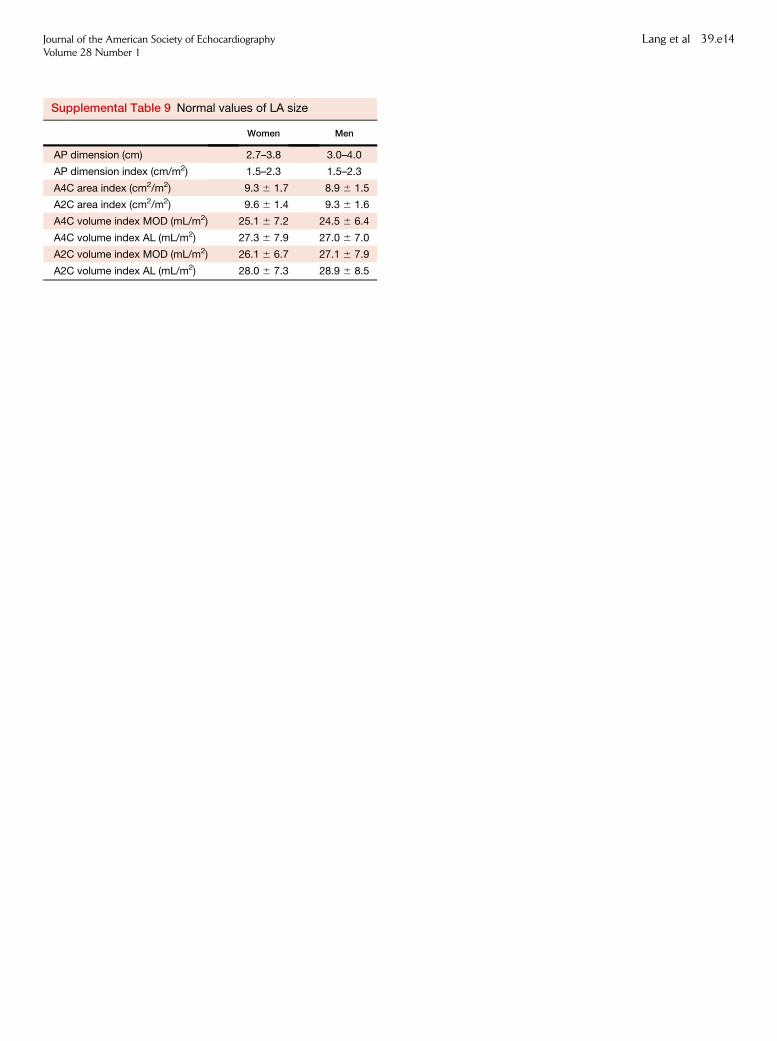
Supplemental Table 9 Normal values of LA size
Women Men
AP dimension (cm) 2.7–3.8 3.0–4.0
AP dimension index (cm/m2) 1.5–2.3 1.5–2.3
A4C area index (cm2/m2) 9.3 6 1.7 8.9 6 1.5
A2C area index (cm2/m2) 9.6 6 1.4 9.3 6 1.6
A4C volume index MOD (mL/m2) 25.1 6 7.2 24.5 6 6.4
A4C volume index AL (mL/m2) 27.3 6 7.9 27.0 6 7.0
A2C volume index MOD (mL/m2) 26.1 6 6.7 27.1 6 7.9
A2C volume index AL (mL/m2) 28.0 6 7.3 28.9 6 8.5
Journal of the American Society of EchocardiographyVolume 28 Number 1
Lang et al 39.e14
Related Documents