Brief article Recognizing one’s own face Tilo T.J. Kircher a,b, * , Carl Senior b , Mary L. Phillips b , Sophia Rabe-Hesketh b , Philip J. Benson c , Edward T. Bullmore d , Mick Brammer b , Andrew Simmons b , Mathias Bartels a , Anthony S. David b a Department of Psychiatry, University of Tuebingen, Osianderstrasse 24, D-72076 Tu ¨bingen, Germany b Institute of Psychiatry and GKT School of Medicine, De Crespigny Park, London SE5 8AF, UK c University Laboratory of Physiology, Parks Road, Oxford OX1 3PT, UK d Department of Psychiatry, University of Cambridge, Addenbrooke’s Hospital, Cambridge CB2 2QQ, UK Received 28 September 1998; received in revised form 24 June 2000; accepted 7 July 2000 Abstract We report two studies of facial self-perception using individually tailored, standardized facial photographs of a group of volunteers and their partners. A computerized morphing procedure was used to merge each target face with an unknown control face. In the first set of experiments, a discrimination task revealed a delayed response time for the more extensively morphed self-face stimuli. In a second set of experiments, functional magnetic resonance imaging (fMRI) was used to measure brain activation while subjects viewed morphed versions of either their own or their partner’s face, alternating in blocks with presentation of an unknown face. When subjects viewed themselves (minus activation for viewing an unknown face), increased blood oxygenation was detected in right limbic (hippocampal formation, insula, anterior cingulate), left prefrontal cortex and superior temporal cortex. In the partner (versus unknown) experiment, only the right insula was activated. We suggest that a neural network involving the right hemisphere in conjunction with left-sided associative and executive regions underlies the process of visual self-recognition. Together, this combination produces the unique experience of self-awareness. q 2001 Elsevier Science B.V. All rights reserved. Keywords: Face recognition; Self-concept; Self-perception; Reaction time; Functional imaging 1. Introduction The face is our most characteristic external feature. Mirror recognition does not Cognition 78 (2001) B1–B15 www.elsevier.com/locate/cognit 0010-0277/01/$ - see front matter q 2001 Elsevier Science B.V. All rights reserved. PII: S0010-0277(00)00104-9 COGNITION * Corresponding author. Department of Psychiatry, University of Tuebingen, Osianderstrasse 24, D- 72076 Tu ¨bingen, Germany. Tel.: 149-7071-2982311; fax: 149-7071-294141. E-mail address: [email protected] (T.T.J. Kircher).

Welcome message from author
This document is posted to help you gain knowledge. Please leave a comment to let me know what you think about it! Share it to your friends and learn new things together.
Transcript
Brief article
Recognizing one's own face
Tilo T.J. Kirchera,b,*, Carl Seniorb, Mary L. Phillipsb,Sophia Rabe-Heskethb, Philip J. Bensonc, Edward T. Bullmored,
Mick Brammerb, Andrew Simmonsb, Mathias Bartelsa,Anthony S. Davidb
aDepartment of Psychiatry, University of Tuebingen, Osianderstrasse 24, D-72076 TuÈbingen, GermanybInstitute of Psychiatry and GKT School of Medicine, De Crespigny Park, London SE5 8AF, UK
cUniversity Laboratory of Physiology, Parks Road, Oxford OX1 3PT, UKdDepartment of Psychiatry, University of Cambridge, Addenbrooke's Hospital, Cambridge CB2 2QQ, UK
Received 28 September 1998; received in revised form 24 June 2000; accepted 7 July 2000
Abstract
We report two studies of facial self-perception using individually tailored, standardized
facial photographs of a group of volunteers and their partners. A computerized morphing
procedure was used to merge each target face with an unknown control face. In the ®rst set
of experiments, a discrimination task revealed a delayed response time for the more extensively
morphed self-face stimuli. In a second set of experiments, functional magnetic resonance
imaging (fMRI) was used to measure brain activation while subjects viewed morphed versions
of either their own or their partner's face, alternating in blocks with presentation of an unknown
face. When subjects viewed themselves (minus activation for viewing an unknown face),
increased blood oxygenation was detected in right limbic (hippocampal formation, insula,
anterior cingulate), left prefrontal cortex and superior temporal cortex. In the partner (versus
unknown) experiment, only the right insula was activated. We suggest that a neural network
involving the right hemisphere in conjunction with left-sided associative and executive regions
underlies the process of visual self-recognition. Together, this combination produces the unique
experience of self-awareness. q 2001 Elsevier Science B.V. All rights reserved.
Keywords: Face recognition; Self-concept; Self-perception; Reaction time; Functional imaging
1. Introduction
The face is our most characteristic external feature. Mirror recognition does not
T.T.J. Kircher et al. / Cognition 78 (2001) B1±B15 B1
Cognition 78 (2001) B1±B15www.elsevier.com/locate/cognit
0010-0277/01/$ - see front matter q 2001 Elsevier Science B.V. All rights reserved.
PII: S0010-0277(00)00104-9
COGN I T I O N
* Corresponding author. Department of Psychiatry, University of Tuebingen, Osianderstrasse 24, D-
72076 TuÈbingen, Germany. Tel.: 149-7071-2982311; fax: 149-7071-294141.
E-mail address: [email protected] (T.T.J. Kircher).

occur in humans before 18 months or in other primates, except adult great apes
(Gallup, 1970; Parker, Mitchell, & Boccia, 1994). Several investigations have
shown that the processing of self-relevant information differs from processing objec-
tive information. For example, in word recognition studies, self-referential encoding
facilitates recall better than any other mnemonic strategy (Kihlstrom & Klein, 1997;
Schacter, 1989). Listening to autobiographical episodes (Fink et al., 1996) or
judging one's own personality traits (Kircher, Brammer, Simmons, Bartels, &
David, 2000) has been shown to activate distinct cerebral areas. Speci®c operations
underlying self-processing have been proposed (Schacter, 1989; Snodgrass &
Thompson, 1997). In previous imaging studies, verbal material has been used to
investigate semantic self-referential knowledge (Craik et al., 1999). However, a
stronger and more direct cue for investigating self-information processing is one's
own face, with which we are very familiar from mirror re¯ections and photographs.
Understanding of how we recognize a familiar face has grown through experiments
in cognitive psychology (Bruce & Young, 1986), neurophysiology (Seeck et al.,
1993), neuroimaging (Haxby et al., 1996; Kapur, Friston, Young, Frith, & Frack-
owiak, 1995), and neuropsychological studies of patients with face recognition
de®cits (prosopagnosia) (Sergent & Poncet, 1990). Surprisingly, little research has
been devoted to facial self-recognition, presumably because it is assumed that this
cannot be separated from familiar face recognition. Some patients with severe
prosopagnosia (Sergent & Poncet, 1990) and Alzheimer's disease (Bologna &
Camp, 1997) fail to recognize themselves in the mirror yet no pure cases of `autop-
rosopagnosia' have been described. In an event-related potential (ERP) study by
Ninomiya, Onitsuka, Chen, Sato, and Tashiro (1998) a larger P300 response to the
subject's own face compared to familiar faces has been reported.
One major problem when studying self-face processing is to control for emotional
salience and overlearnedness, since both are known to in¯uence processing (Klatzky
& Forrest, 1984; Phillips et al., 1997; Valentine & Bruce, 1986; Young, Hay,
McWeeny, Flude, & Ellis, 1985). In our study, we tried to overcome this by
using the face of each subject's partner for comparison. We used morphed versions
of the subject's own face and their partner's face, each blended with an unknown,
same sex identity, and conducted two sets of experiments. In the ®rst set, we
measured reaction time and categorical boundaries for recognition of the subject's
own face and their partner's face. In the second set, we measured cerebral activation
with fMRI while subjects viewed the same stimuli. We predicted a speci®c beha-
vioural and neural response when subjects viewed their own face because of its
outstanding subjective importance.
2. Materials and methods
2.1. Reaction time experiments
2.1.1. Subjects
Twenty healthy, male volunteers participated in the behavioural study (mean age
T.T.J. Kircher et al. / Cognition 78 (2001) B1±B15B2

31 years, mean IQ estimate 113; National Adult Reading Test, Nelson & Willison,
1991). Exclusion criteria were history of brain injury, and past and current psychia-
tric or neurological illness. No subject was taking regular medication. Neither the
subjects nor their female partners wore spectacles and none had facial hair. Subjects
had known their partners for between 1 and 16 years (median 2.7).
2.1.2. Stimuli
Coloured, full face, frontal view photographs were taken of the 20 participants
and their partners in a photo studio under standardized conditions. The partner's face
was chosen as an emotionally salient and highly overlearned non-self face. A simi-
lar-looking novel face (identity unknown to participants) matched for age and sex
was paired with each of the self and partner faces. All the photos were digitized; the
subjects' faces were then mirror transposed and a black template was applied semi-
automatically to remove non-facial attributes such as background, hair and ears. The
individual faces were manipulated (`morphed') using a computer warping package
with their assigned identities in 5% steps (Benson, 1994), resulting in graded blend-
ing of facial features between two same sex identities. The purpose of this was to
have a number of representations of an individual's face which were suf®ciently
novel to prevent habituation, yet were easily recognizable.
2.1.3. Experimental design
Subjects were initially familiarized with the endpoint of the morph series, i.e. the
real identities, once for 15 s. Subjects were then presented with the morphed images
along the dimensions self versus unknown and partner versus unknown. The 21
faces of one morph series were presented on a computer screen, one image at a
time, in a randomized order and again serially, starting from each endpoint (presen-
tation order: `known' ®rst and `unknown' ®rst). The repeated use of versions of the
same novel face controlled for familiarity. Each series (presentation order:
`random', `known', `unknown') was presented with a short pause between each
run, twice per subject in a pseudorandom order. The subjects had to indicate whether
or not the face was known to them (self, partner) by pressing one of two buttons with
the right or left index ®nger. The subjects were given the instruction: `If the face on
the screen looks more like you (partner), press the right button with your right index
®nger, if the face looks more like the other person, press the left button with the left
index ®nger.' The image was displayed until a button was pressed; after a 1 s interval
with the screen blank, a ®xation point appeared in the centre of the screen and the
next face was shown.
2.2. fMRI experiments
Six weeks after the behavioural study, a subgroup of six subjects (mean age 31
years, mean IQ estimate 115) participated in two 5 min fMRI experiments for
presentation of the self versus novel and partner versus novel face series. The
seven faces closest to the overlearned endpoint (100±70% self or partner) in each
series were presented one at a time on a computer screen in a randomized order for 2
T.T.J. Kircher et al. / Cognition 78 (2001) B1±B15 B3

s, each followed by a 1 s blank screen. This was followed by presentation of seven
faces from the unknown endpoint (non-self, non-partner) in a similar manner. As
distracters, two faces of the opposite end of the morph spectrum were randomly
intermingled into each block to ensure that subjects attended. Stimuli were presented
3.5 m from the subject, subtending visual angles of 108 horizontally and 88 verti-
cally. Each experiment consisted of ten separate 30 s presentation phases, alternating
between overlearned (phase A) and novel (phase B) stimuli, with the ®rst presenta-
tion being `overlearned'. In the `B' phase of both experiments repeated morphed
versions of a novel identity's face were employed. Therefore, this face soon became
familiar and hence, in addition to processing of facial con®gurations per se, famil-
iarity was controlled for across both phases of both experiments. The presentation
order of the two experiments was counterbalanced across subjects. Subjects indi-
cated whether the identity was overlearned (self or partner) or novel by pressing one
of two buttons with the right thumb as quickly and accurately as possible. To
familiarize subjects with the stimuli, they viewed the endpoints of each morphed
series for 15 s in the scanner. Prior to MRI data acquisition, subjects were presented
with six faces as a practice block.
2.2.1. Image acquisition and analysis
Functional MRI data were acquired using a GE Signa 1.5 T system (General
Electric, Milwaukee, WI, USA) with an ANMR operating console and hardware
(Advanced Nuclear Magnetic Resonance, Woburn, MA, USA) for gradient echo-
planar imaging (EPI) at the Maudsley Hospital, London. One hundred T2*-weighted
images depicting BOLD contrast were acquired at each of 14 non-contiguous near
axial planes (7 mm thick with 0.7 mm slice skip; in-plane resolution 3 mm) parallel
to the intercommissural (AC-PC) line: TE � 40 ms, TR � 3 s, ¯ip angle 908,number of signal averages 1. At the same session, a 43 slice, high resolution inver-
sion recovery echoplanar image of the whole brain was acquired in the AC-PC plane
with TE � 73 ms, TI � 180 ms, TR � 16 000 ms, in-plane resolution 1.5 mm, slice
thickness 3 mm, slice gap 0.3 mm. Rigid body motion in 3D was estimated and
corrected by realignment and regression (Brammer et al., 1997). Periodic change in
MR signal intensity at the frequency of alternation between A and B tasks was
estimated by ®tting a sinusoidal regression model to the fMRI time series observed
at each voxel. The model included sine and cosine waves at the frequency of the
experimental input function, with amplitudes g and d , respectively. The standar-
dized power of response at experimentally determined frequency was estimated by
P � �g2 1 d2� divided by its standard error. The sign of g identi®ed the timing of
maximum MR signal with respect to the input function: if g . 0, the maximum
signal was observed in the ®rst condition; if g , 0, the maximum signal was
observed in the second condition. Parametric maps representing P and g at each
intracerebral voxel were constructed. To sample the distribution of P under the null
hypothesis that observed values of P were not determined by experimental design,
the 99 images observed in each plane were randomly permuted and P was estimated
as above in each permuted time series. This process was repeated ten times, resulting
in ten permutated power maps at each plane for each subject. Observed and
T.T.J. Kircher et al. / Cognition 78 (2001) B1±B15B4

permuted power maps were transformed into the standard space of Talairach and
Tournoux (1988) as previously described (Brammer et al., 1997), and smoothed by a
2D Gaussian ®lter with full width at half maximum of 14.4 mm. The median
observed power at each intracerebral voxel in standard space was tested against a
critical value of the permutation distribution for median power ascertained from the
permuted power maps. For a one-tailed test of size a � 0:001, the critical value was
the 100(1 2 a )th percentile value of the permutation distribution. Voxels for which
observed median power exceeded this critical value were considered activated and
coloured according to the sign of median g . Activated voxels with median g . 0
were coloured red and superimposed on a grey scale EPI template image to form a
generic brain activation map (GBAM) (Brammer et al., 1997).
We used repeated measures analysis of variance to estimate task-related differ-
ences in the power of functional response at each voxel. The main effect of task was
tested for signi®cance by permutation at voxels which demonstrated signi®cant
activation by one task or both (Bullmore et al., 1999; Edington, 1980).
3. Results
3.1. Behavioural experiments
We performed an analysis of the perceived categorical boundaries for each
subject in each trial. When the responses for each trial are sorted from image 1 to
21, the categorical boundary is de®ned as the mean between the ®rst image judged as
`unknown' and the image after the last image judged as `known'. In both the self/
unknown and the partner/unknown conditions, subjects judged stimuli as belonging
to distinct categories with a sharp boundary between them (see Fig. 1). A regression
of categorical boundary was performed on the `order of presentation' and `identity'
again with a random effect for subject. There was a signi®cant effect for `order of
presentation' (P , 0:001) but not for `identity', and no `order' £ `identity' interac-
tion. That is to say that the categorical boundary of the target identity (opposite from
the starting point) regardless of `self' or `partner' or the order of the serial presenta-
tion occurred sooner than in the random presentation.
For the analysis of response times, we subdivided the morph series into different
blocks. This was done to test for the effect of the morphing process. Four blocks of
each of the series in each experiment were formed and compared: face 1 (over-
learned: self/partner) versus face 21 (novel), faces 1±3 versus faces 19±21, faces 1±7
versus faces 15±21 and faces 4±7 versus faces 15±18. A further division of faces 8±
10 versus faces 12±14 was not carried out because of a high variability in the identity
judgement across the subjects in this area. Because the data were skewed, a loga-
rithmic transformation of the data was performed prior to analysis. The difference
between the mean reaction times for the self/partner faces and the novel faces (1
versus 21, 1±3 versus 19±21, 1±7 versus 15±21, 4±7 versus 15±18) was regressed on
a dummy variable for partner versus self and two dummy variables for order of
presentation (reference presentation order: `known' ®rst), with a random effect for
T.T.J. Kircher et al. / Cognition 78 (2001) B1±B15 B5

subject to take account of the repeated measures design. Four regression analyses
were carried out, one for each type of difference. Three signi®cance tests were
carried out for each regression. Test (1) was for a difference in reaction time between
the overlearned and novel faces when looking at one's own face (`self') in the
presentation order `known' ®rst. We found signi®cant reaction time differences
for face 1 versus face 21 (P � 0:001), faces 1±3 versus faces 19±21 (P , 0:001),
faces 1±7 versus faces 15±21 (P , 0:001) and faces 4±7 versus faces 15±18
(P , 0:001). In Test (2) we looked for the effect of presentation order. Signi®cant
results were present for face 1 versus face 21 (P � 0:001), faces 1±3 versus faces
19±21 (P , 0:001), faces 1±7 versus faces 15±21 (P � 0:001) and faces 4±7 versus
faces 15±18 (P , 0:001). In Test (3) there was no difference in the effect of partner
versus self.
We tested direct differences in reaction times of the overlearned spectrum of the
morphs between self and partner across the grouped morphing blocks using a
random effects model. We only found signi®cant differences in reaction time
between `self' and `partner' for faces 4±7 (P � 0:01) in the presentation order
`known' ®rst (Table 1).
In summary, we did not ®nd major differences in the processing between one's
own face and the partner's face.
T.T.J. Kircher et al. / Cognition 78 (2001) B1±B15B6
Fig. 1. Data from the behavioural experiment. The graph shows the results from the categorization
analysis. On the x-axis, image 1 represents either the subject's own (self) or their partner's face (partner)
morphed in 20 steps with an unknown identity (number 21) of the same sex. The y-axis depicts the
percentage of subjects judging a given (or lower numbered) image as unknown. The graphs represent the
presentation order (PO). PO ªknownº represents the serial presentation starting from face 1 to 21, PO
ªunknownº represents from face 21 to 1 and PO ªrandomº represents the random order.

T.T.J. Kircher et al. / Cognition 78 (2001) B1±B15 B7
Tab
le1
Dif
fere
nce
sin
resp
on
seti
me
inre
lati
on
toth
em
orp
hin
gpro
cess
a
Fac
e1
(ov
erle
arn
ed)
Fac
e21
(novel
)
Fac
es1±3
(over
lear
ned
)
Fac
es19±21
(novel
)
Fac
es1±7
(over
lear
ned
)
Fac
es15±
21
(novel
)
Fac
es4±7
(over
lear
ned
)
Fac
es15±18
(novel
)
Ex
per
imen
t1
:o
rder
of
pre
sen
tati
on
,`k
no
wn
'
(fro
mfa
ce1
to2
1)
Sel
f4
03
9(1
33
48
)589
(345)
1821
(4552)
584
(294)
1240
(2003)
576
(271)
805
(381)
571
(263)
Par
tner
68
6(2
84
)383
(224)
602
(254)
415
(228)
630
(294)
433
(218)
651
(359)
447
(214)
Sig
ni®
cance
NS
NS
NS
0.0
1
Ex
per
imen
t2
:o
rder
of
pre
sen
tati
on
,`u
nk
no
wn
'
(fro
mfa
ce2
1to
1)
Sel
f5
13
(32
1)
928
(724)
524
(345)
632
(299)
554
(330)
574
(252)
577
(355)
532
(308)
Par
tner
44
9(2
93
)696
(309)
446
(244)
616
(389)
459
(237)
549
(211)
469
(245)
500
(223)
Sig
ni®
cance
NS
NS
NS
NS
Ex
per
imen
t3
:o
rder
of
pre
sen
tati
on
,ra
nd
om
Sel
f5
51
(28
6)
620
(268)
554
(201)
571
(216)
614
(209)
589
(207)
660
(246)
603
(203)
Par
tner
48
7(8
9)
580
(147)
498
(123)
533
(110)
563
(113)
551
(130)
612
(129)
564
(153)
Sig
ni®
cance
NS
NS
NS
NS
aF
aces
wer
em
orp
hed
in5
%in
crem
ents
from
the
iden
titi
esN
o.1
(sel
for
par
tner
)to
No.21
(novel
mal
eor
fem
ale)
.O
rigin
alre
acti
on
tim
es(m
s)ar
egiv
enas
the
mea
n
(SD
).
3.2. fMRI experiments
3.2.1. Individual analysis of `own face' and `partner's face' experiments
Accuracy of identity judgement for both the self and the partner experiment was
99.2% (98.3±100%, SD 0.6%). Reaction time data recorded during the scanning
procedure showed no signi®cant differences between the two experiments when
responses were compared for the two overlearned faces (self: 1069 ms, SD 100
ms; partner: 1092 ms, SD 97 ms; P � 0:8).
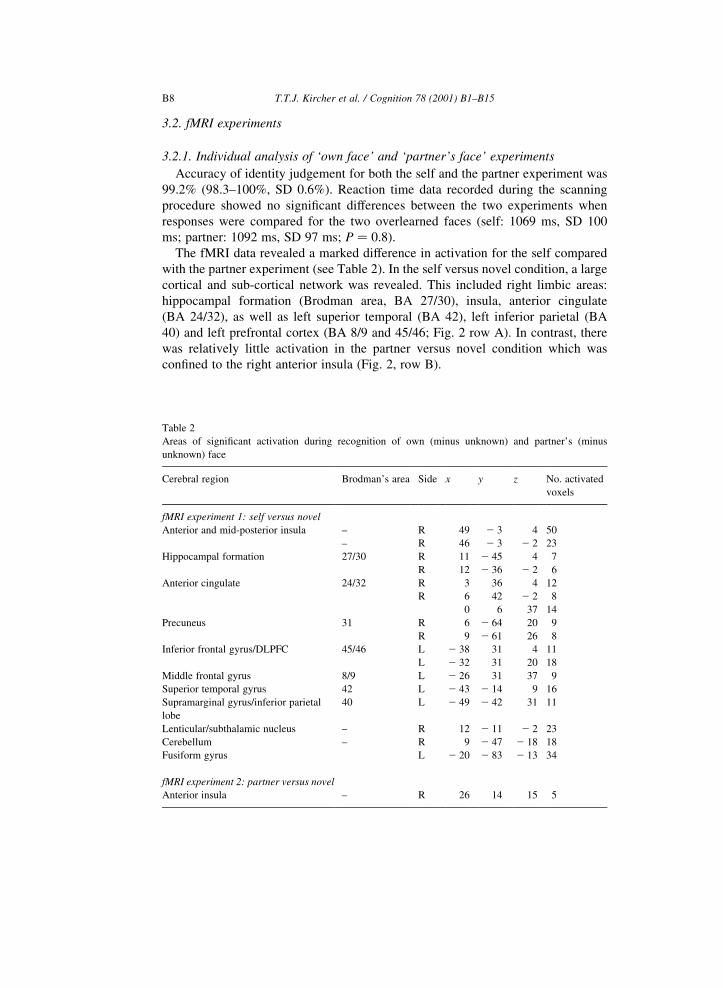
The fMRI data revealed a marked difference in activation for the self compared
with the partner experiment (see Table 2). In the self versus novel condition, a large
cortical and sub-cortical network was revealed. This included right limbic areas:
hippocampal formation (Brodman area, BA 27/30), insula, anterior cingulate
(BA 24/32), as well as left superior temporal (BA 42), left inferior parietal (BA
40) and left prefrontal cortex (BA 8/9 and 45/46; Fig. 2 row A). In contrast, there
was relatively little activation in the partner versus novel condition which was
con®ned to the right anterior insula (Fig. 2, row B).
T.T.J. Kircher et al. / Cognition 78 (2001) B1±B15B8
Table 2
Areas of signi®cant activation during recognition of own (minus unknown) and partner's (minus
unknown) face
Cerebral region Brodman's area Side x y z No. activated
voxels
fMRI experiment 1: self versus novel
Anterior and mid-posterior insula ± R 49 2 3 4 50
± R 46 2 3 2 2 23
Hippocampal formation 27/30 R 11 2 45 4 7
R 12 2 36 2 2 6
Anterior cingulate 24/32 R 3 36 4 12
R 6 42 2 2 8
0 6 37 14
Precuneus 31 R 6 2 64 20 9
R 9 2 61 26 8
Inferior frontal gyrus/DLPFC 45/46 L 2 38 31 4 11
L 2 32 31 20 18
Middle frontal gyrus 8/9 L 2 26 31 37 9
Superior temporal gyrus 42 L 2 43 2 14 9 16
Supramarginal gyrus/inferior parietal
lobe
40 L 2 49 2 42 31 11
Lenticular/subthalamic nucleus ± R 12 2 11 2 2 23
Cerebellum ± R 9 2 47 2 18 18
Fusiform gyrus L 2 20 2 83 2 13 34
fMRI experiment 2: partner versus novel
Anterior insula ± R 26 14 15 5
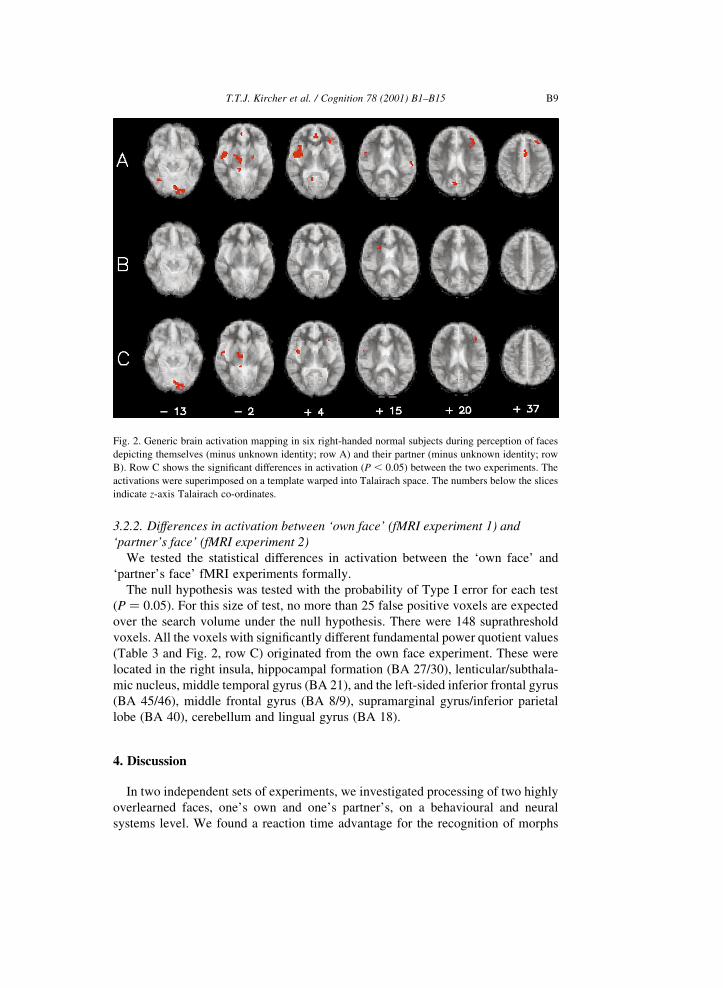
3.2.2. Differences in activation between `own face' (fMRI experiment 1) and
`partner's face' (fMRI experiment 2)
We tested the statistical differences in activation between the `own face' and
`partner's face' fMRI experiments formally.
The null hypothesis was tested with the probability of Type I error for each test
(P � 0:05). For this size of test, no more than 25 false positive voxels are expected
over the search volume under the null hypothesis. There were 148 suprathreshold
voxels. All the voxels with signi®cantly different fundamental power quotient values
(Table 3 and Fig. 2, row C) originated from the own face experiment. These were
located in the right insula, hippocampal formation (BA 27/30), lenticular/subthala-
mic nucleus, middle temporal gyrus (BA 21), and the left-sided inferior frontal gyrus
(BA 45/46), middle frontal gyrus (BA 8/9), supramarginal gyrus/inferior parietal
lobe (BA 40), cerebellum and lingual gyrus (BA 18).
4. Discussion
In two independent sets of experiments, we investigated processing of two highly
overlearned faces, one's own and one's partner's, on a behavioural and neural
systems level. We found a reaction time advantage for the recognition of morphs
T.T.J. Kircher et al. / Cognition 78 (2001) B1±B15 B9
Fig. 2. Generic brain activation mapping in six right-handed normal subjects during perception of faces
depicting themselves (minus unknown identity; row A) and their partner (minus unknown identity; row
B). Row C shows the signi®cant differences in activation (P , 0:05) between the two experiments. The
activations were superimposed on a template warped into Talairach space. The numbers below the slices
indicate z-axis Talairach co-ordinates.

of overlearned faces compared with strangers' faces. The morphing procedure as
well as the order of presentation in¯uenced the response times signi®cantly. Facial
identity appears to be perceived categorically. There was no difference in categorical
boundaries for self/novel and partner/novel. In summary, one's own face is not
processed differently on a behavioural level when compared with another over-
learned, emotionally salient face, the partner's. In two fMRI experiments, we
demonstrated that recognition of the own face activated right limbic and left prefron-
tal regions, whereas recognition of the partner involved only the right insula.
In a related study to ours, Beale and Keil (1995) compared the recognition of
famous and novel morphed identities. They found a reaction time advantage for the
famous faces. A higher processing speed for familiar faces (self or famous), whether
morphed or unmorphed (Keenan et al., 1999; Klatzky & Forrest, 1984; Tong &
Nakayama, 1999; Valentine & Bruce, 1986; Young et al., 1985), was replicated in
our study, where the response time was faster for the overlearned faces. The faster
recognition of famous or overlearned identities could be attributed to face processing
models, in which the face recognition units and person identity nodes process
information from very familiar (overlearned) faces more quickly than that from
less familiar ones (Bruce & Young, 1986) because of ease of access to stored
representation and semantic information, respectively. We extended the ®ndings
of Beale and Keil (1995) and showed that categorical perception of faces occurs
also between overlearned and recently familiarized faces. Another ®nding is the fact
that categorical boundaries depend on the order of presentation of the morphs. The
boundaries are shifted towards the identity the serial presentation started with. This
presumably re¯ects a response bias whereby subjects `anticipate' the boundary.
Comparing the response time of the two highly overlearned faces, self and part-
ner, directly in a post-hoc analysis, we found a small but signi®cantly slower proces-
T.T.J. Kircher et al. / Cognition 78 (2001) B1±B15B10
Table 3
Cerebral regions showing signi®cantly different power of response between experiment 1 (`own face')
and experiment 2 (`partner's face') (response: own face . partner's face)
Cerebral region BA Side Tal. xa Tal. y Tal. z No. of activated
voxelsb
Fusiform gyrus ± L 2 14 2 81 2 13 29
Lenticular/subthalamic nucleus ± R 12 2 11 2 2 17
Middle temporal gyrus 21 R 46 2 3 2 7 16
Anterior and mid-posterior
insula
± R 40 2 3 4 10
± R 52 2 6 2 2 8
Inferior frontal gyrus 45 L 2 38 25 20 6
Supramarginal gyrus/inferior
parietal lobe
40 L 2 49 2 39 31 6
Hippocampal formation 30 R 9 2 36 2 2 4
a Talairach co-ordinates (mm) refer to the voxel with the maximum FPQ (fundamental power quotient)
in each regional cluster.b The probability of false activation of each voxel in the generic brain map over all six subjects was
,0.05.

sing speed for the self faces when they were morphed more (faces 4±7), but not when
morphed less extensively (faces 1±3). The effect is subtle, since it was not present in
the multiple regression analysis and it was found in the serial presentation (order
`known' ®rst) but neither in the random presentation nor in the fMRI experiments, in
which randomized presentation order was also employed. The combination of serial
presentation and strong morphing produces a delayed recognition for the self
compared with the partner's face. We can speculate that the delayed recognition
effect might be due to a mismatch of the internal representation of the self face and
reality. For example, many people think that a snapshot of themselves is not an
accurate representation. The morphing procedure might exaggerate the mismatch
between self-representation and photograph even further, resulting in a more
complex veri®cation process, which leads to a longer response time.
Previous PET and fMRI studies have investigated cerebral areas engaged in
recognition memory of faces (Grady et al., 1995; Gur et al., 1997; Haxby et al.,
1996; Kapur et al., 1995; Sergent, Ohta, & MacDonald, 1992). In these studies
subjects had to acquire new information just before or while being scanned. In
newer related studies, recognition of a number of different famous or unfamiliar
faces (George et al., 1999) or objects (Gauthier, Tarr, Anderson, Skudlarski, & Gore,
1999) was compared. We were not interested in mere familiarity but rather self-
recognition or awareness. We matched the self face with the partner's face in order
to control for emotional salience and overlearnedness (familiarity). It is assumed
that subjects see their own face and their partner's face on a daily basis. The subjects
were also extensively familiarized with all the stimulus material 6 weeks prior to,
and through repeated presentations, during scanning. The activation consequent
upon recognizing one's own face was more extensive and the pattern was striking.
The right limbic regions, which were extensively activated when self was contrasted
with novel, are known to be engaged in pleasant and unpleasant emotional responses
(Lane et al., 1997; Phillips et al., 1997). A study of autobiographical memory has
shown the engagement of right limbic regions in the recollection of personal
memories (Fink et al., 1996). Preilowski (1979) measured skin conductance in
split-brain patients and healthy subjects while faces of themselves, faces of persons
they knew well, emotional scenes and objects were presented to one hemi®eld for
100 ms. The number of galvanic skin responses was higher to the own face presented
to the right hemisphere than to any other stimulus-visual ®eld combination in both
groups. We interpret the activation of the right limbic system in our study as a
unique, strong emotional response to seeing our own face. This emotional response
seems to be present both for morphed, as in our experiment, and for unmorphed
faces (Preilowski, 1979). The left prefrontal cortex, which was only activated by self
faces, is thought to have an important role in executive processes such as the
integration of information to form a coherent `whole' from multi-modal inputs
(Miller, 1992; Vandenberghe, Price, Wise, Josephs, & Frackowiak, 1996).
In response to the partner's face, the activation of the anterior insula, about 1 cm
above the activation site in the self condition, could re¯ect an emotional response to
the both intimate and familiar partner's face. We assume that the gender of the
subject's partner did not bias the results, since in both face experiments we used
T.T.J. Kircher et al. / Cognition 78 (2001) B1±B15 B11

same sex control faces. A sex bias (i.e. males viewing female faces) should therefore
have been cancelled out. Replication of the study with other intimately known
individuals (e.g. siblings and women viewing male faces) would nonetheless be
desirable.
One explanation for the differences in activation between the two fMRI experi-
ments is that memory and veri®cation processes are being stimulated in the self
condition only rather than processes inherent in self-recognition. This is unlikely
given the closeness of the matching within each experiment and the employment of
an initially unknown, but recently familiar face as the control condition in both,
hence the minimal activation in the partner versus novel face experiment. Further-
more, there was little difference found between self and partner in the reaction times
or categorical boundaries in the behavioural experiment. Nevertheless, we are unac-
customed to picking out our own face from a range of possible faces, unlike the more
frequent task of identifying a well known person's face in a crowd. A component of
the activation may therefore re¯ect such novelty and the additional attentional
deployment. Finally, the differences in activation between the self and partner
experiments may have been exaggerated by the morphing procedure, that is, morph-
ing may have interacted with self-recognition in some way to engage attention, for
example. However, even if this were the case, the presence or absence of self-
relevant information is the crucial factor distinguishing the two experiments and
not the morphing procedure.
The combination of right limbic and left cortical activation could underlie human
self-recognition. We suggest that it is this limbic-cortical connection which enables
the integration of affect and cognition. Experiments with split-brain patients
(Gallois, Ovelacq, Hautecoeur, & Dereux, 1988; Preilowski, 1979; Sperry, Zaidel
& Zaidel, 1979) have shown that although rudimentary self-recognition occurs in
the disconnected right hemisphere, only transcallosal transfer of information enables
the sensory experience to reach awareness. The onset of self-recognition in human
infancy correlates with the myelination of ®bres in the frontal lobe (Kinney, Brody,
Kloman, & Gilles, 1988). Isolated failures of self-recognition have yet to emerge in
the neurological literature. Such failure does not seem to occur following isolated
frontal lesions or in cases of amnesia with profound loss of autobiographical
memory (Tulving, 1993) where there is a preservation in the sense of self. The
relatively widespread and bilateral activation we have demonstrated in response
to the self stimuli suggests that many processes contribute to self-perception with
some built-in redundancy, hence the resistance to disruption by common neurolo-
gical lesions.
5. Conclusion
We have reported evidence of a distinct neural substrate underlying facial self-
recognition involving the right limbic system and left prefrontal and temporo-parie-
tal cortex. One's own face is a stimulus that activates unique self-referential proces-
sing. We suggest that the interplay of both emotional and associative cognitive
T.T.J. Kircher et al. / Cognition 78 (2001) B1±B15B12
processes is necessary for the unique perception of a coherent self. Further studies
are needed to clarify the speci®c nature of the neural correlates of visual self-
recognition.
Acknowledgements
T.K. was supported by the German Research Council (DFG), C.S. was supported
by the Pilkington Family Trusts and the McDonnell Foundation in Cognitive
Neuroscience, and E.T.B. and M.LP. were supported by the Wellcome Trust. We
thank P.K. McGuire and P. Fletcher for advice on earlier versions of the manuscript,
and S.C.R. Williams and C. Andrew for technical support.
References
Beale, J. M., & Keil, F. (1995). Categorical effects in the perception of faces. Cognition, 57 (3), 217±239.
Benson, P. J. (1994). Morph transformation of the facial image. Image and Vision Computing, 12 (10),
691±696.
Bologna, S. M., & Camp, C. J. (1997). Covert versus overt self-recognition in late stage Alzheimer's
disease. Journal of the International Neuropsychological Society, 3, 195±198.
Brammer, M. J., Bullmore, E. T., Simmons, A., Williams, S. C., Grasby, P. M., Howard, R. J., Woodruff,
P. W., & Rabe-Hesketh, S. (1997). Generic brain activation mapping in functional magnetic resonance
imaging: a nonparametric approach. Magnetic Resonance Imaging, 15 (7), 763±770.
Bruce, V., & Young, A. (1986). Understanding face recognition. British Journal of Psychology, 77, 305±
327.
Bullmore, E. T., Brammer, M. J., Rabe-Hesketh, S., Curtis, V. A., Morris, R. G., Williams, S. C. R.,
Sharma, T., McGuire, P. K., Rabe-Hesketh, S., & Williams, S. C. (1999). Methods for diagnosis and
treatment of stimulus-correlated motion in generic brain activation studies using fMRI. Human Brain
Mapping, 7 (1), 38±48.
Craik, F. I. M., Moroz, T. M., Moscovitch, M., Stuss, D., Winocur, G., Tulving, E., & Kapur, S. (1999). In
search of the self: a positron emission tomography study. Psychological Science, 10 (1), 26±34.
Edington, E. S. (1980). Randomization tests. New York: Marcel Dekker.
Fink, G. R., Markowitsch, H. J., Reinkemeier, M., Bruckbauer, T., Kessler, J., & Heiss, W. (1996).
Cerebral representations of ones own past: neural networks in autobiographical memory. Journal
of Neuroscience, 16 (13), 4275±4282.
Gallois, P., Ovelacq, E., Hautecoeur, P., & Dereux, J. F. (1988). Disconnexion et reconnaissance des
visages. Revue Neurologique, 144 (2), 113±119.
Gallup, G. G. (1970). Chimpanzees: self-recognition. Science, 167, 86±87.
Gauthier, I., Tarr, M. J., Anderson, A. W., Skudlarski, P., & Gore, J. C. (1999). Activation of the middle
fusiform `face area' increases with expertise in recognizing novel objects. Nature Neuroscience, 2 (6),
568±573.
George, N., Dolan, R. J., Fink, G. R., Baylis, G. C., Russell, C., & Driver, J. (1999). Contrast polarity and
face recognition in the human fusiform gyrus. Nature Neuroscience, 2 (6), 574±580.
Grady, C., McIntosh, A. R., Horwitz, B., Maisog, J. M., Ungerleider, L. G., Mentis, M. J., Pietrini, P.,
Schapiro, M. B., & Haxby, J. V. (1995). Age-related reductions in human recognition memory due to
impaired encoding. Science, 269, 218±221.
Gur, R. C., Ragland, J. D., Mozley, L. H., Mozley, P. D., Smith, R., Alavi, A., Bilker, W., & Gur, R. E.
(1997). Lateralized changes in regional cerebral blood ¯ow during performance of verbal and facial
recognition tasks: correlations with performance and ªeffortº. Brain and Cognition, 33 (3), 388±414.
Haxby, J. V., Ungerleider, L. G., Horwitz, B., Maisog, J. M., Rapoport, S. I., & Grady, C. L. (1996). Face
T.T.J. Kircher et al. / Cognition 78 (2001) B1±B15 B13

encoding and recognition in the human brain. Proceedings of the National Academy of Sciences of the
United States of America, 93 (2), 922±927.
Kapur, N., Friston, K. J., Young, A., Frith, C. D., & Frackowiak, R. S. (1995). Activation of human
hippocampal formation during memory for faces: a PET study. Cortex, 31 (1), 99±108.
Keenan, J. P., McCutcheon, B., Freund, S., Gallup, G. G., Sanders, G., & Pascual Leone, A. (1999). Left
hand advantage in a self-face recognition task. Neuropsychologia, 37 (12), 1421±1425.
Kihlstrom, J. F., & Klein, S. B. (1997). Self-knowledge and self-awareness. In J. G. Snodgrass, & R. L.
Thompson (Eds.), The self across psychology: self-recognition, self-awareness, and the self-concept
(pp. 5±17). New York: New York Academy of Sciences.
Kinney, H. C., Brody, B. A., Kloman, A. S., & Gilles, F. H. (1988). Sequence of central nervous system
myelination in human infancy. II. Patterns of myelination in autopsied infants. Journal of Neuro-
pathology and Experimental Neurology, 47 (3), 217±234.
Kircher, T., Brammer, M., Simmons, M.A., Bartels, M., & David, A. S. (2000) The neural correlates of
intentional and incidental self processing. Manuscript submitted for publication.
Klatzky, R. L., & Forrest, F. H. (1984). Recognizing familiar and unfamiliar faces. Memory & Cognition,
12 (1), 60±70.
Lane, R. D., Reiman, E. M., Bradley, M. M., Lang, P. J., Ahern, G. L., Davidson, R. J., & Schwartz, G. E.
(1997). Neuroanatomical correlates of pleasant and unpleasant emotion. Neuropsychologia, 35 (11),
1437±1444.
Miller, L. A. (1992). Impulsivity, risk-taking, and the ability to synthesize fragmented information after
frontal lobectomy. Neuropsychologia, 30 (1), 69±79.
Nelson, H. E., & Willison, J. (1991). National Adult Reading Test (NART) (2nd ed.). Berkshire: NFER-
NELSON.
Ninomiya, H., Onitsuka, T., Chen, C. H., Sato, E., & Tashiro, N. (1998). P300 in response to the subject's
own face. Psychiatry and Clinical Neurosciences, 52, 519±522.
Parker, S. T., Mitchell, R. W., & Boccia, M. C. (1994). Self awareness in animals and humans.
Cambridge: Cambridge University Press.
Phillips, M. L., Young, A. W., Senior, C., Brammer, M. J., Andrew, C., Calder, A. J., Bullmore, E. T.,
Perrett, D. I., Rowland, D., Williams, S. C. R., Gray, J. A., & David, A. S. (1997). A speci®c neural
substrate for perceiving facial expressions of disgust. Nature, 389, 495±498.
Preilowski, B. (1979). Consciousness after complete surgical section of the forebrain commissures in
man. In I. S. Russell, M. W. van Hoff, & G. Berlucchi (Eds.), Structure and function of cerebral
commissures (pp. 411±420). London: Macmillan Press.
Schacter, D. L. (1989). On the relation between memory and consciousness: dissociable interactions and
conscious experience. In H. L. Roediger, & F. I. M. Craik (Eds.), Varieties on memory and conscious-
ness: essays in honor of Endel Tulving (pp. 355±389). Hillsdale, NJ: Lawrence Erlbaum Associates.
Seeck, M., Mainwaring, N., Blume, H., Dubuisson, D., Cosgrove, R., Mesulam, M. M., & Schomer, D. L.
(1993). Differential neural activity in the human temporal lobe evoked by faces of family members
and friends. Annals of Neurology, 34, 369±372.
Sergent, J., Ohta, S., & MacDonald, B. (1992). Functional anatomy of face and object processing. Brain,
115, 15±36.
Sergent, J., & Poncet, M. (1990). From covert to overt recognition of faces in a prosopagnosic patient.
Brain, 113, 989±1004.
Snodgrass, J. G., & Thompson, R. L. (1997). Self-knowledge and self-awareness. New York: New York
Academy of Sciences.
Sperry, R. W., Zaidel, E., & Zaidel, D. (1979). Self recognition and social awareness in the deconnected
minor hemisphere. Neuropsychologia, 17 (2), 153±166.
Talairach, J., & Tournoux, P. (1988). Co-planar stereotactic atlas of the human brain. Stuttgart: Thieme
Verlag.
Tong, F., & Nakayama, K. (1999). Robust representations for faces: evidence from visual search. Journal
of Experimental Psychology: Human Perception and Performance, 25 (4), 1016±1035.
Tulving, E. (1993). Self-knowledge of an amnesic is represented abstractly. In T. K. Srull, & R. S. Wyer
(Eds.), The mental representation of trait and autobiographical knowledge about the self. Advances in
social cognition (pp. 147±156). Hillsdale, NJ: Erlbaum.
T.T.J. Kircher et al. / Cognition 78 (2001) B1±B15B14

Valentine, T., & Bruce, V. (1986). Recognizing familiar faces: the role of distinctiveness and familiarity.
Canadian Journal of Psychology, 40 (3), 300±305.
Vandenberghe, R., Price, C., Wise, R., Josephs, O., & Frackowiak, R. S. (1996). Functional anatomy of a
common semantic system for words and pictures. Nature, 383 (6597), 254±256.
Young, A. W., Hay, D. C., McWeeny, K. H., Flude, B. M., & Ellis, A. W. (1985). Matching familiar and
unfamiliar faces on internal and external features. Perception, 14, 737±746.
T.T.J. Kircher et al. / Cognition 78 (2001) B1±B15 B15
Related Documents