Recent Advances in Performance Measurement of Federal Workforce Development Programs Evaluation and Performance Management of Job Training Programs Organized by European Commission Directorate-General for Employment, Social Affairs and Equal Opportunity and University of Maryland School of Public Policy Randall W. Eberts W.E. Upjohn Institute for Employment Research November 7, 2009

Recent Advances in Performance Measurement of Federal Workforce Development Programs
Jan 01, 2016
Recent Advances in Performance Measurement of Federal Workforce Development Programs. Evaluation and Performance Management of Job Training Programs - PowerPoint PPT Presentation
Welcome message from author
This document is posted to help you gain knowledge. Please leave a comment to let me know what you think about it! Share it to your friends and learn new things together.
Transcript

Recent Advances in Performance Measurement of Federal
Workforce Development Programs
Evaluation and Performance Management of Job Training Programs
Organized by European Commission Directorate-General for Employment, Social Affairs and Equal Opportunity and University of Maryland School of Public Policy
Randall W. EbertsW.E. Upjohn Institute for Employment Research
November 7, 2009

2
Purpose
• Describes a Department of Labor project conducted by the Upjohn Institute that addresses some of the problems with current workforce system performance targets outlined in previous presentations:– Cream skimming– Inability to account for differences in local labor market conditions
• Accounts for factors outside the control of state and local administrators– By “outside the control,” we mean factors that affect performance
outcomes but are not related to the services and other assistance provided by the programs
– Local labor market conditions (unemployment rates)– Personal characteristics of participants (prior work history, educational
attainment, barriers to employment)• Offers a systematic, objective and transparent framework for:
– Setting targets – Focusing on the value-added of WIA services– Diagnosing WIA performance – Leveling the playing field

3
Framework
• Procedure follows the basic regression-adjusted approach used to adjust JTPA performance targets
• Uses estimates of the effects of unemployment rates and personal characteristics on performance outcomes, based on all WIA exiters in all 50 states
• Estimates are based on the experience of individual participants within their local labor markets
• Procedure allows the aggregation of performance outcomes and factors from the individual to the WIB to the State to the Nation– By using the same weights for each level of jurisdiction, the
differences add up– Thus the targets are consistent across jurisdictions
• Focus on three WIA programs and three common measures
4
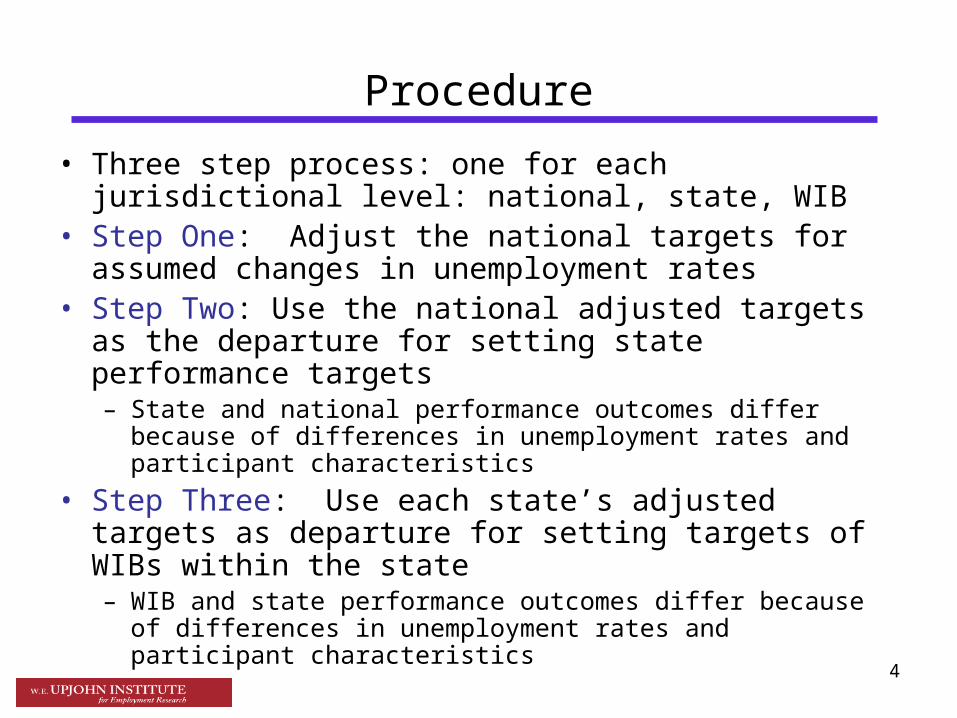
Procedure
• Three step process: one for each jurisdictional level: national, state, WIB
• Step One: Adjust the national targets for assumed changes in unemployment rates
• Step Two: Use the national adjusted targets as the departure for setting state performance targets– State and national performance outcomes differ because of
differences in unemployment rates and participant characteristics
• Step Three: Use each state’s adjusted targets as departure for setting targets of WIBs within the state– WIB and state performance outcomes differ because of
differences in unemployment rates and participant characteristics
5
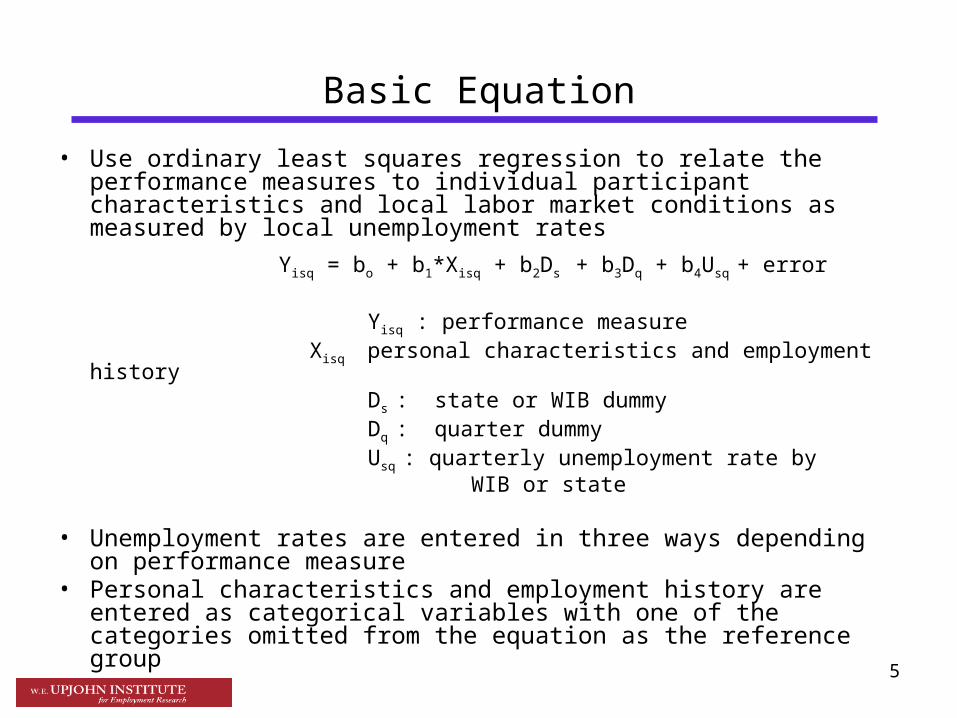
Basic Equation
• Use ordinary least squares regression to relate the performance measures to individual participant characteristics and local labor market conditions as measured by local unemployment rates
Yisq = bo + b1*Xisq + b2Ds + b3Dq + b4Usq + error
Yisq : performance measure Xisq personal characteristics and employment history
Ds : state or WIB dummy Dq : quarter dummy Usq : quarterly unemployment rate by WIB or state
• Unemployment rates are entered in three ways depending on performance measure
• Personal characteristics and employment history are entered as categorical variables with one of the categories omitted from the equation as the reference group
6
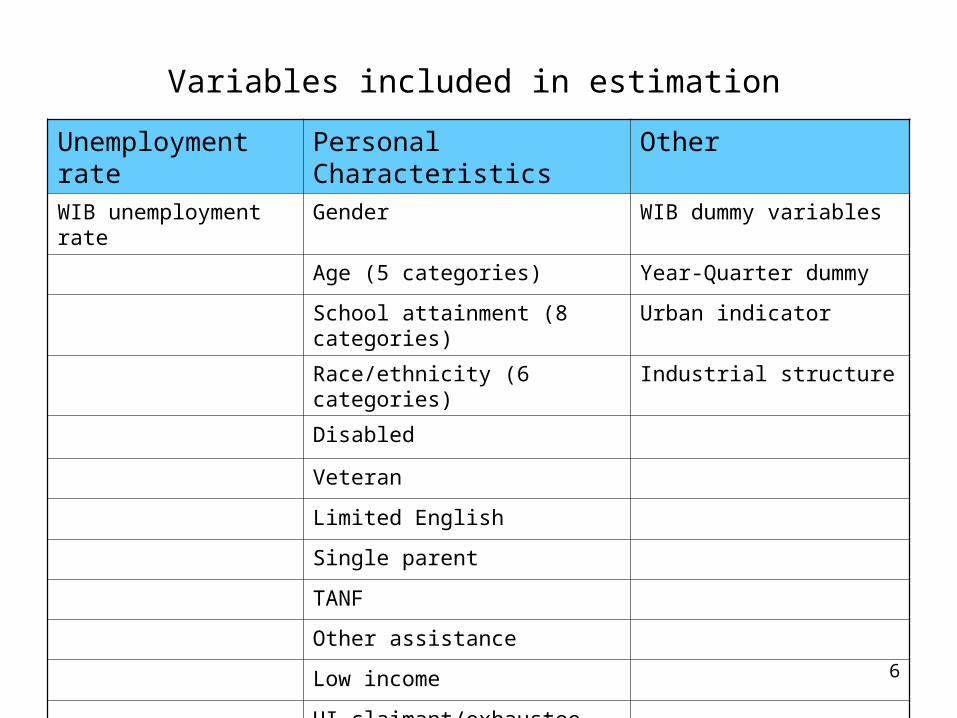
Unemployment rate Personal Characteristics OtherWIB unemployment rate Gender WIB dummy variables
Age (5 categories) Year-Quarter dummy
School attainment (8 categories) Urban indicator
Race/ethnicity (6 categories) Industrial structure
Disabled
Veteran
Limited English
Single parent
TANF
Other assistance
Low income
UI claimant/exhaustee
Prior employment
Variables included in estimation
7
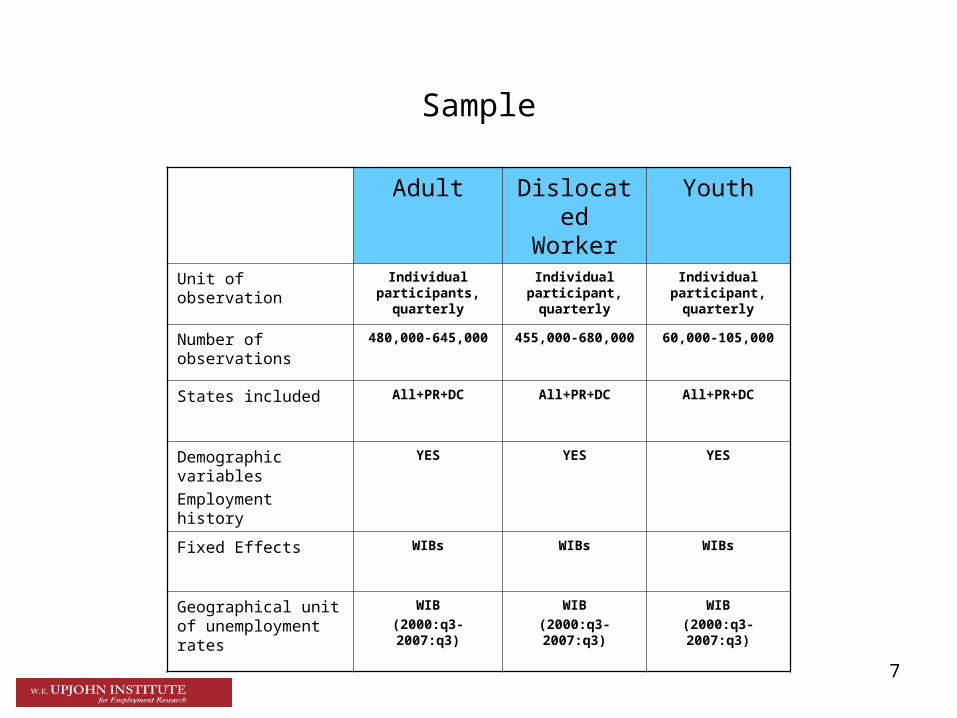
Sample
Adult Dislocated Worker
Youth
Unit of observation Individual participants,
quarterly
Individual participant,
quarterly
Individual participant,
quarterly
Number of observations
480,000-645,000 455,000-680,000 60,000-105,000
States included All+PR+DC All+PR+DC All+PR+DC
Demographic variables
Employment history
YES YES YES
Fixed Effects WIBs WIBs WIBs
Geographical unit of unemployment rates
WIB
(2000:q3-2007:q3)
WIB
(2000:q3-2007:q3)
WIB
(2000:q3-2007:q3)
8
05
10
15
mo
nthl
y u
nem
ploy
me
nt r
ate
January 2000 November 2008months from January 2000
(max) ur/(min) ur (p 50) ur
Counties with employment greater than 100,000
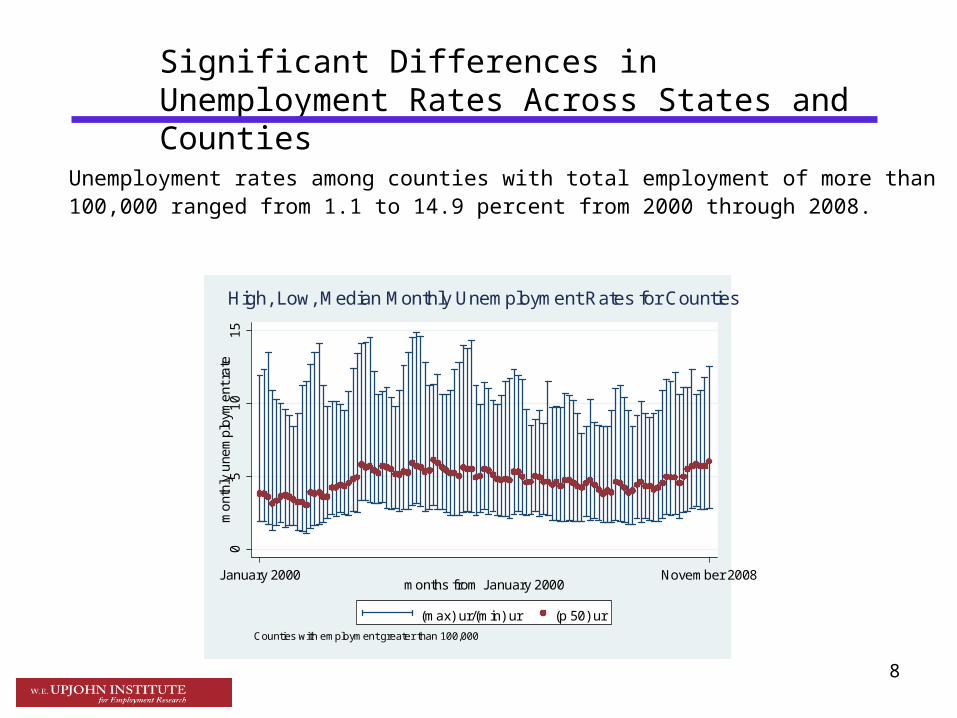
High, Low, Median Monthly Unemployment Rates for Counties
Unemployment rates among counties with total employment of more than 100,000 ranged from 1.1 to 14.9 percent from 2000 through 2008.
Significant Differences in Unemployment Rates Across States and Counties
9
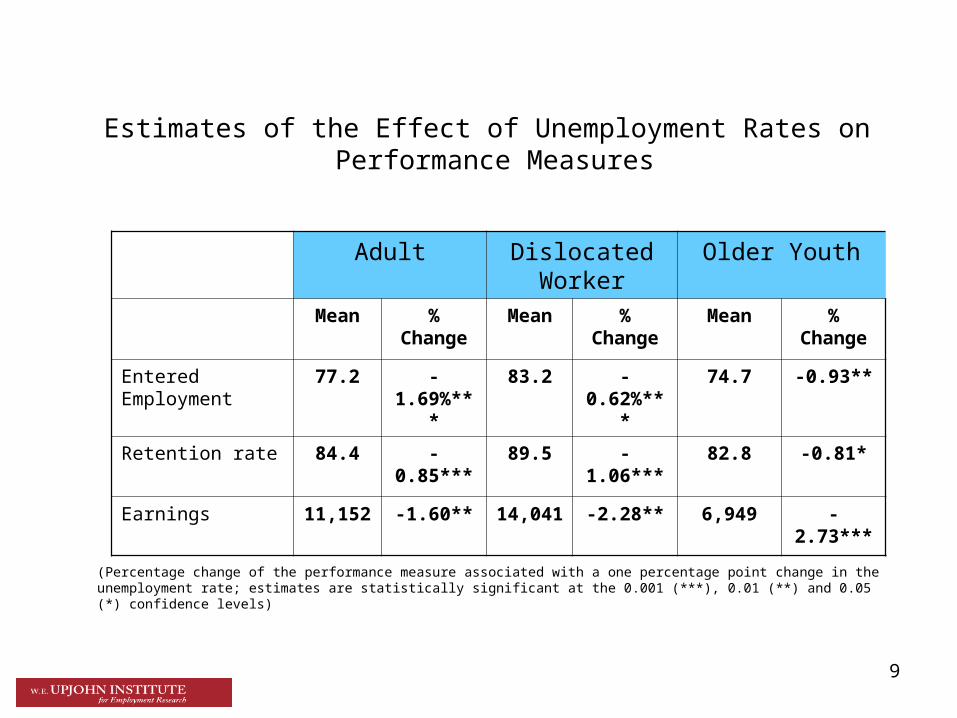
Estimates of the Effect of Unemployment Rates on Performance Measures
Adult Dislocated Worker
Older Youth
Mean % Change
Mean % Change
Mean % Change
Entered Employment
77.2 -1.69%*** 83.2 -0.62%*** 74.7 -0.93**
Retention rate 84.4 -0.85*** 89.5 -1.06*** 82.8 -0.81*
Earnings 11,152 -1.60** 14,041 -2.28** 6,949 -2.73***
(Percentage change of the performance measure associated with a one percentage point change in the unemployment rate; estimates are statistically significant at the 0.001 (***), 0.01 (**) and 0.05 (*) confidence levels)
10
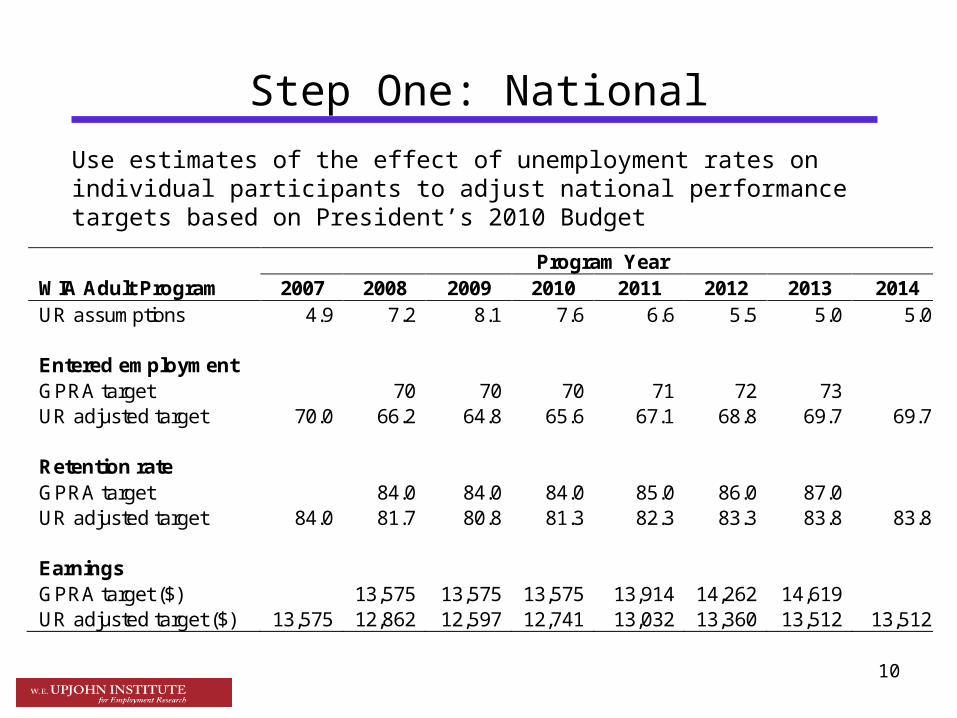
Step One: National
Program Year WIA Adult Program 2007 2008 2009 2010 2011 2012 2013 2014 UR assumptions 4.9 7.2 8.1 7.6 6.6 5.5 5.0 5.0 Entered employment GPRA target 70 70 70 71 72 73 UR adjusted target 70.0 66.2 64.8 65.6 67.1 68.8 69.7 69.7 Retention rate GPRA target 84.0 84.0 84.0 85.0 86.0 87.0 UR adjusted target 84.0 81.7 80.8 81.3 82.3 83.3 83.8 83.8 Earnings GPRA target ($) 13,575 13,575 13,575 13,914 14,262 14,619 UR adjusted target ($) 13,575 12,862 12,597 12,741 13,032 13,360 13,512 13,512
Use estimates of the effect of unemployment rates on individual participants to adjust national performance targets based on President’s 2010 Budget
11
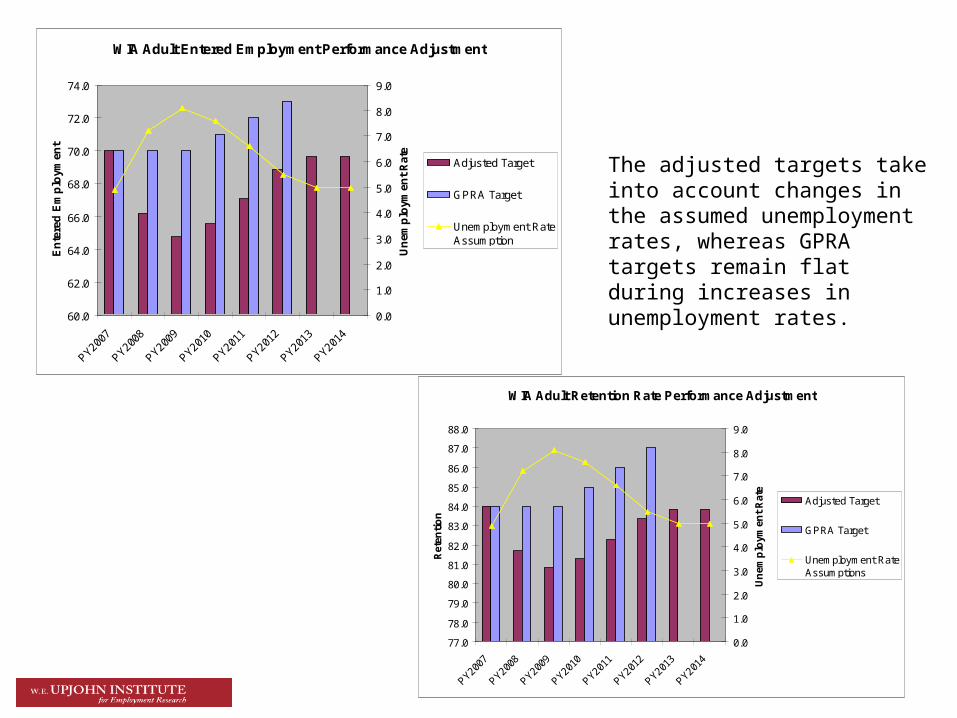
WIA Adult Entered Employment Performance Adjustment
60.0
62.0
64.0
66.0
68.0
70.0
72.0
74.0
PY2007
PY2008
PY2009
PY2010
PY2011
PY2012
PY2013
PY2014
En
tere
d E
mp
loym
ent
0.0
1.0
2.0
3.0
4.0
5.0
6.0
7.0
8.0
9.0
Un
emp
loym
ent
Rat
e
Adjusted Target
GPRA Target
Unemployment RateAssumption
WIA Adult Retention Rate Performance Adjustment
77.0
78.0
79.0
80.0
81.0
82.0
83.0
84.0
85.0
86.0
87.0
88.0
PY2007
PY2008
PY2009
PY2010
PY2011
PY2012
PY2013
PY2014
Ret
enti
on
0.0
1.0
2.0
3.0
4.0
5.0
6.0
7.0
8.0
9.0
Un
emp
loym
ent
Rat
e
Adjusted Target
GPRA Target
Unemployment RateAssumptions
The adjusted targets take into account changes in the assumed unemployment rates, whereas GPRA targets remain flat during increases in unemployment rates.
12
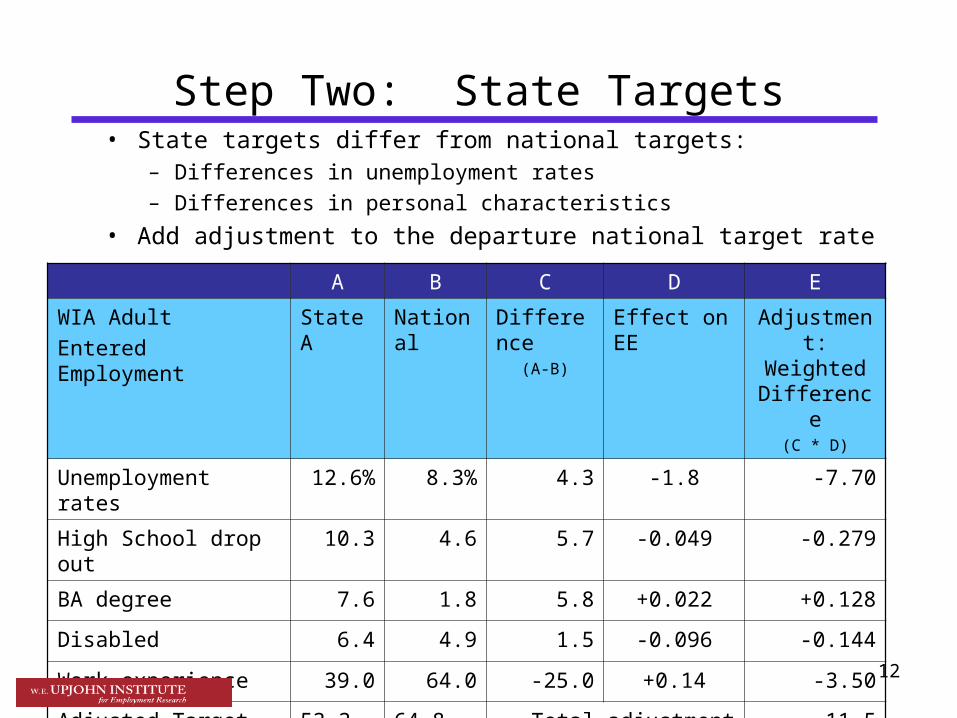
Step Two: State Targets• State targets differ from national targets:
– Differences in unemployment rates– Differences in personal characteristics
• Add adjustment to the departure national target rate
A B C D E
WIA Adult
Entered Employment
State A National Difference(A-B)
Effect on EE Adjustment: Weighted Difference
(C * D)
Unemployment rates 12.6% 8.3% 4.3 -1.8 -7.70
High School drop out 10.3 4.6 5.7 -0.049 -0.279
BA degree 7.6 1.8 5.8 +0.022 +0.128
Disabled 6.4 4.9 1.5 -0.096 -0.144
Work experience 39.0 64.0 -25.0 +0.14 -3.50
Adjusted Target 53.3 64.8 Total adjustment(add column E)
-11.5

13
Step Three: WIB Targets• WIB targets differ from state targets:
– Differences in unemployment rates– Differences in personal characteristics
• Add adjustment to departure state target rate
A B C D E
WIA Adult
Entered Employment
WIB A in State A
State A Difference(A-B)
Effect on EE Adjustment: Weighted Difference
(C * D)
Unemployment rates 7.8% 12.6% -4.8 -1.8 +8.64
High School drop out 4.7 10.3 -5.7 -0.049 +0.279
BA degree 9.3 7.6 +1.7 +0.022 +0.037
Disabled 2.3 6.4 -4.1 -0.096 +0.394
Work experience 39.5 39.0 -0.05 +0.14 +0.07
Adjusted Target 62.7 53.3 Total adjustment(add column E)
+9.42

14
Adjustments Add Up • Adjustments add up from WIB to State to Nation
– Based on differences in characteristics– Weights are the same at all levels
A B C D E F
WIA Adult
Entered Employment
WIB A in State A
State A National Effect on EE
Difference in WIB and National
(C – A)
Adjustment: Weighted Difference
(D * E)
Unemployment rates 7.8% 12.6% 8.3% -1.8 -0.50 +0.9
High School drop out 4.7 10.3 4.6 -0.049 +0.10 -0.005
BA degree 9.3 7.6 1.8 +0.022 +7.5 +0.165
Disabled 2.3 6.4 4.9 -0.096 -2.6 +0.250
Work experience 39.5 39.0 64.0 +0.14 -24.5 -3.43
Adjusted Target 62.7 53.3 64.8 Total adjustment
(add column F)
-2.12

15
Illinois Adj. Target 60.5 80.2 11748 69.8 85.6 15848 54.9 43.5 17.3Illinois Adj. Factor: Unemp. Rate -1.3 0.7 -188 -0.7 0.7 -87 -1.0 -1.5 -1.7Illinois Adj. Factor: State -0.1 0.1 15 0.2 0.2 35 0.0 0.0 0.0Illinois Adj. Factor: Personal -3.0 -1.5 -675 0.2 0.7 1127 -2.6 -3.8 -2.2Indiana Adj. Target 64.8 81.6 12851 72.0 85.6 15780 62.6 48.8 20.2Indiana Adj. Factor: Unemp. Rate -0.2 -0.5 -35 -0.1 -0.5 -16 -0.2 -0.3 -0.3Indiana Adj. Factor: State 0.0 1.1 9 1.3 1.6 22 0.0 0.0 0.0Indiana Adj. Factor: Personal 0.2 0.2 280 0.6 0.6 1001 4.3 0.2 -0.7Kansas Adj. Target 70.1 84.3 13996 72.9 86.4 16143 58.4 51.4 23.9Kansas Adj. Factor: Unemp. Rate 2.5 0.8 370 1.4 0.8 171 1.9 2.9 3.3Kansas Adj. Factor: State 0.0 0.5 -5 0.6 0.7 -12 0.0 0.0 0.0Kansas Adj. Factor: Personal 2.8 2.2 1034 0.7 1.0 1211 -2.0 -0.3 -0.7Michigan Adj. Target 58.4 79.3 11665 68.4 85.0 15914 53.1 41.6 13.4Michigan Adj. Factor: Unemp. Rate -4.8 -0.4 -709 -2.7 -0.4 -328 -3.7 -5.6 -6.4Michigan Adj. Factor: State 0.0 0.5 9 0.6 0.8 22 0.0 0.0 0.0Michigan Adj. Factor: Personal -1.6 -1.7 -232 0.2 0.7 1446 -1.7 -1.6 -1.4Minnesota Adj. Target 63.7 80.7 12391 70.8 86.2 17190 54.1 50.3 21.1Minnesota Adj. Factor: Unemp. Rate 0.6 0.6 86 0.3 0.6 40 0.5 0.7 0.8Minnesota Adj. Factor: State 0.0 0.4 -2 0.5 0.5 -5 0.0 0.0 0.0Minnesota Adj. Factor: Personal -1.7 -1.1 -291 -0.1 1.2 2382 -4.9 0.8 -0.9Missouri Adj. Target 61.2 79.6 11699 64.4 82.3 15183 59.5 50.3 18.8Missouri Adj. Factor: Unemp. Rate -0.5 0.3 -75 -0.3 0.3 -35 -0.4 -0.6 -0.7Missouri Adj. Factor: State 0.0 0.1 0 0.1 0.1 0 0.0 0.0 0.0Missouri Adj. Factor: Personal -3.1 -1.6 -822 -5.6 -2.1 445 1.4 2.1 -1.7
Examples of Performance Adjustments
State Adjustment ee ret earnings ee ret earnings place att lit
Adult Dislocated Youth
The adjusted targets, and their components, are shown for six states. It should be noted that the direction of the effect of the unemployment rate may be different for retention than for the other two performance measures since retention is estimated as the change in the unemployment. Differences in the changes in the unemployment rate between the state and the nation may be different from the differences in the levels.
16
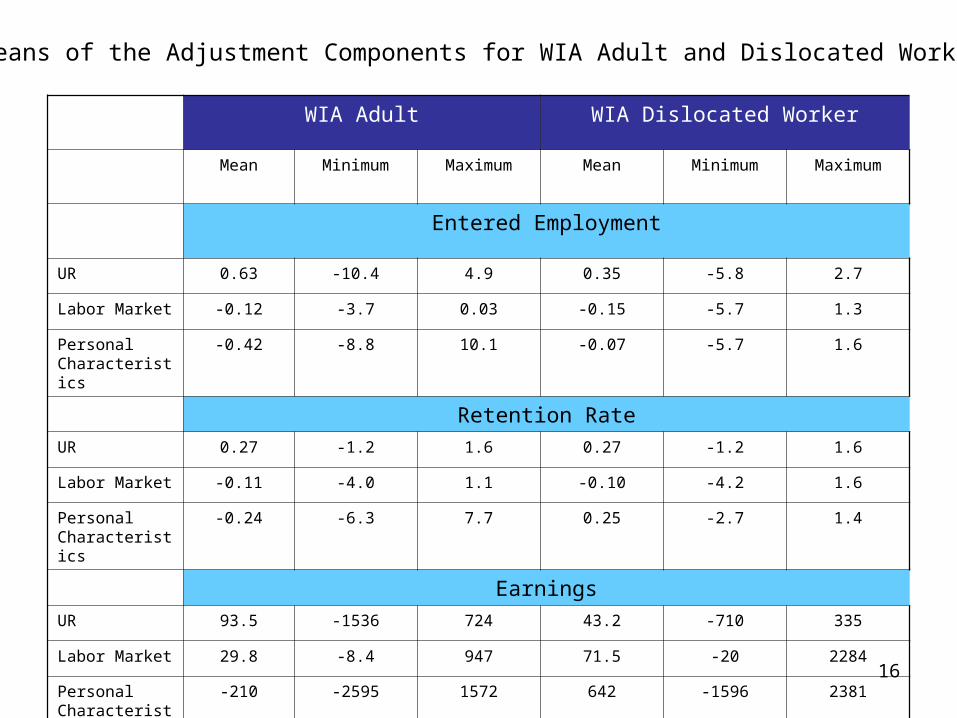
WIA Adult WIA Dislocated Worker
Mean Minimum Maximum Mean Minimum Maximum
Entered Employment
UR 0.63 -10.4 4.9 0.35 -5.8 2.7
Labor Market -0.12 -3.7 0.03 -0.15 -5.7 1.3
Personal Characteristics
-0.42 -8.8 10.1 -0.07 -5.7 1.6
Retention Rate
UR 0.27 -1.2 1.6 0.27 -1.2 1.6
Labor Market -0.11 -4.0 1.1 -0.10 -4.2 1.6
Personal Characteristics
-0.24 -6.3 7.7 0.25 -2.7 1.4
Earnings
UR 93.5 -1536 724 43.2 -710 335
Labor Market 29.8 -8.4 947 71.5 -20 2284
Personal Characteristics
-210 -2595 1572 642 -1596 2381
Means of the Adjustment Components for WIA Adult and Dislocated Workers
17
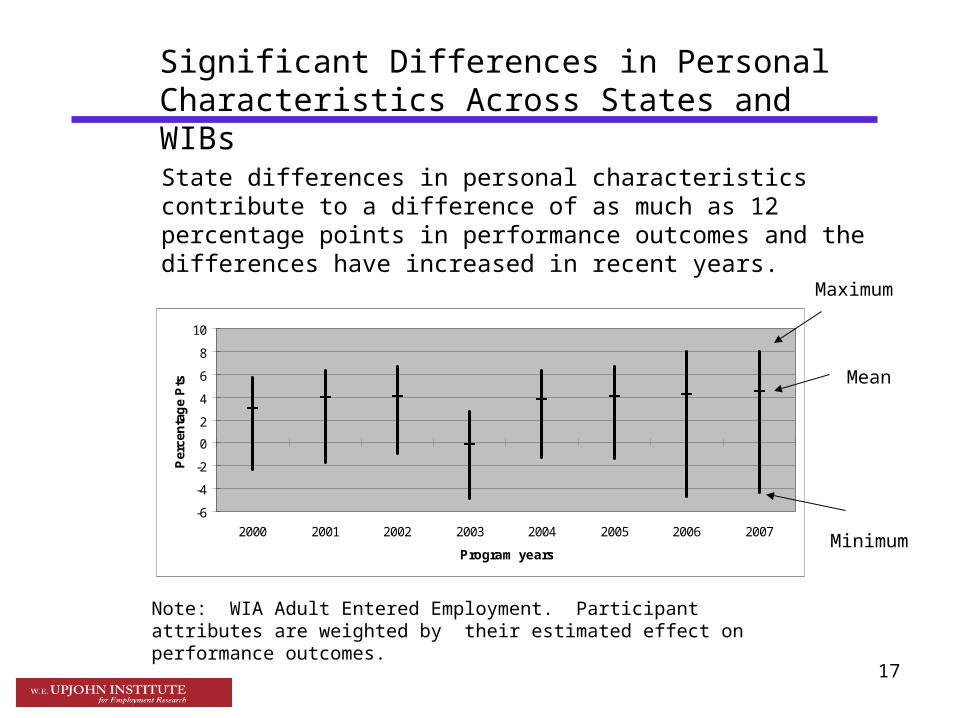
State differences in personal characteristics contribute to a difference of as much as 12 percentage points in performance outcomes and the differences have increased in recent years.
Significant Differences in Personal Characteristics Across States and WIBs
-6
-4
-2
0
2
4
6
8
10
2000 2001 2002 2003 2004 2005 2006 2007
Program years
Per
cen
tag
e P
ts
Note: WIA Adult Entered Employment. Participant attributes are weighted by their estimated effect on performance outcomes.
Mean
Minimum
Maximum
18
Summary
• Target adjustment procedure provides a systematic, transparent, and objective way to set national, state, and WIB performance targets for WIA programs
• Adjustment factors, since they are related to factors that are familiar to administrators, can be easily scrutinized to better understand and diagnose programs– Also familiar since state adjustment procedure is similar to the
JTPA method
• National performance targets have already been adopted by USDOL and GAO
• Currently exploring adjustments at the state and WIB levels

19
Contact Information
Randall Eberts
W.E. Upjohn Institute for Employment Research
300 South Westnedge Ave.
Kalamazoo, MI 49007
269-343-5541
Related Documents