EMF-2103(NP) Revision 2 Realistic Large Break LOCA Methodology for Pressurized Water Reactors November 2010

Welcome message from author
This document is posted to help you gain knowledge. Please leave a comment to let me know what you think about it! Share it to your friends and learn new things together.
Transcript
EMF-2103(NP)Revision 2
Realistic Large Break LOCA Methodology forPressurized Water Reactors
November 2010
AREVA NP Inc.
Realistic Large Break LOCA Methodology forPressurized Water Reactors
ISSUED IN ON-UNEDOCUMENT SYSTEM
OOE:~O
EMF-2103(NP)Revision 2
Prepared:
B. M. DunnRealistic LBLOCA
I;/;~h~/oDate
. Contributors (In alphabetical order): Charlie Batt, Andrei Burghelea, Ken Carlson,Hueiming Chow, Mireille Cortes, Eric Coryell, Philippe Dias, Scott Franz,Michael Garrett, Scott Ghan, Monte Giles, Gene Jensen, Rachel Love,Thomas Luedeke, Robert Martin, Harold Massie, Brian Mays, Jeff McElroy,Mark Miller, Larry Nielsen, Nithian Nithianandan, Wanda Rom.an, Parvez Salim,Paul Sohn, Hong Tang, Don Todd, Maggie Wang, Albert Yang
Reviewed:
Approved:
Approved:
Approved:
AREVA NP Inc.
~------------Realistic LBLOCA
Realistic LBLOCA
IIj;e!e%Date
If It 2-IUJID
Date
\\hz-- \ LOll)
Date
U.S. Nuclear Regulatory Commission Report Disclaimer
Important Notice Regarding the Contents and Use of This Document
Please Read Carefully
This technical report was derived through research and development programs sponsored by AREVA NP Inc. It is being submitted by AREVA NP to the U.S. Nuclear Regulatory Commission as part of a technical contribution to facilitate safety analyses by licensees of the U.S. Nuclear Regulatory Commission which utilize AREVA NP fabricated reload fuel or technical services provided by AREVA NP for light water power reactors and it is true and correct to the best of AREVA NP's knowledge, information, and belief. The information contained herein may be used by the U.S. Nuclear Regulatory Commission in its review of this report and, under the terms of the respective agreements, by licensees or applicants before the U.S. Nuclear Regulatory Commission which are customers of AREVA NP in their demonstration of compliance with the U.S. Nuclear Regulatory Commission's regulations.
AREVA NP's warranties and representations concerning the subject matter of this document are those set forth in the agreement between AREVA NP and the Customer pursuant to which this document is issued. Accordingly, except as otherwise expressly provided in such agreement, neither AREVA NP nor any person acting on its behalf:
a. makes any warranty, or representation, express or implied, with respect to the accuracy, completeness, or usefulness of the information contained in this document, or that the use of any information, apparatus, method, or process disclosed in this document will not infringe privately owned rights;
or
b. assumes any liabilities with respect to the use of, or for damages resulting from the use of, any information, apparatus, method, or process disclosed in this document.
AREVA NP Inc.
EMF-2103(NP) Revision 2
Realistic Large Break LOCA Methodology for Pressurized Water Reactors
Copyright © 2010
AREVA NP Inc.
All Right Reserved

EMF-2103(NP)
Revison 2Realistic Large Break LOCA Methodology for Pressurized Water Reactors Page i
AREVA NP Inc.
Nature of Changes
Item Page Description and Justification
1. All Changes incorporated into Revision 2 are too extensive to itemize. Therefore, this version is considered to be an entire rewrite.
EMF-2103(NP)
Revison 2Realistic Large Break LOCA Methodology for Pressurized Water Reactors Page ii
AREVA NP Inc.
Contents
1.0 Introduction ....................................................................................................................1-1
2.0 Methodology Roadmap ..................................................................................................2-1 2.1 Requirements and Code Capabilities.................................................................2-1 2.2 Assessment and Ranging of Parameters ...........................................................2-3 2.3 Sensitivity and Uncertainty Analysis...................................................................2-4
3.0 Requirements and Code Capabilities.............................................................................3-1 3.1 Scenario Specification (CSAU Step 1) ...............................................................3-1 3.2 Nuclear Power Plant Selection (CSAU Step 2) ..................................................3-4 3.3 Phenomena Identification and Ranking, PIRT (CSAU Step 3)...........................3-6 3.4 Frozen Code Version Selection (CSAU Step 4) .................................................3-8
3.4.1 COPERNIC2 and RODEX3A Fuel Rod Performance Codes ...................................................................................................3-8
3.4.2 S-RELAP5..........................................................................................3-10 3.5 Provision of Complete Code Documentation (CSAU Step 5)...........................3-11 3.6 Determination of Code Applicability (CSAU Step 6).........................................3-12
3.6.1 Field Equations...................................................................................3-12 3.6.2 Closure Equations ..............................................................................3-13 3.6.3 Code Numerics...................................................................................3-13 3.6.4 Structure and Nodalization .................................................................3-14
4.0 Assessment and Ranging of Parameters.......................................................................4-1 4.1 Establishment of Assessment Matrix (CSAU Step 7).........................................4-1
4.1.1 PIRT Considerations ............................................................................4-2 4.1.2 Nodalization Considerations.................................................................4-2 4.1.3 Scaling Considerations.........................................................................4-3 4.1.4 Compensating Errors ...........................................................................4-3 4.1.5 Summary ..............................................................................................4-3
4.2 Define Nodalization for NPP Calculations (CSAU Step 8) .................................4-9 4.2.1 Nodalization Methodology ..................................................................4-10 4.2.2 Numerical Considerations ..................................................................4-11 4.2.3 Loop Model.........................................................................................4-12
4.2.3.1 Hot Leg ..............................................................................4-13 4.2.3.2 Steam Generator ...............................................................4-14 4.2.3.3 Pump Suction ....................................................................4-14 4.2.3.4 Reactor Coolant Pump.......................................................4-15 4.2.3.5 Cold Leg and Break ...........................................................4-15 4.2.3.6 ECCS.................................................................................4-16 4.2.3.7 Pressurizer.........................................................................4-16
4.2.4 Reactor Vessel Model ........................................................................4-17 4.2.4.1 Downcomer........................................................................4-17 4.2.4.2 Lower Vessel .....................................................................4-18 4.2.4.3 Core, Core Bypass, and Fuel ............................................4-19 4.2.4.4 Upper Plenum/Upper Head................................................4-21
4.2.5 Containment Model ............................................................................4-22
EMF-2103(NP)
Revison 2Realistic Large Break LOCA Methodology for Pressurized Water Reactors Page iii
AREVA NP Inc.
4.2.6 Plant Model Summary ........................................................................4-23 4.3 Determine Code and Experimental Accuracy (CSAU Step 9)..........................4-33
4.3.1 Separate Effects Tests .......................................................................4-33 4.3.1.1 THTF Heat Transfer...........................................................4-34 4.3.1.2 THTF Level Swell...............................................................4-38 4.3.1.3 GE Level Swell ..................................................................4-42 4.3.1.4 FRIGG-2 ............................................................................4-46 4.3.1.5 Bennett Tube .....................................................................4-59 4.3.1.6 FLECHT and FLECHT-SEASET........................................4-62 4.3.1.7 PDTF SMART Tests ..........................................................4-80 4.3.1.8 Marviken Tests ..................................................................4-88 4.3.1.9 Westinghouse/EPRI 1/3 Scale Tests ...............................4-101 4.3.1.10 AREVA CCFL Tests.........................................................4-106 4.3.1.11 UPTF Tests......................................................................4-110
4.3.1.11.1 UPTF Tests 6 and 7......................................4-110 4.3.1.11.2 UPTF Test 8..................................................4-114 4.3.1.11.3 UPTF Tests 10 and 29..................................4-116 4.3.1.11.4 UPTF Tests 10 and 12..................................4-119 4.3.1.11.5 UPTF Test 11................................................4-120
4.3.1.12 CCTF Tests .....................................................................4-147 4.3.1.13 SCTF Tests......................................................................4-176 4.3.1.14 ACHILLES Tests..............................................................4-214 4.3.1.15 Multi-Dimensional Flow Testing.......................................4-226 4.3.1.16 Moby Dick Test 3141 .......................................................4-233 4.3.1.17 Assessment of Total Heat Transfer in
FLECHT-SEASET Test 31504.........................................4-237 4.3.2 Integral Effects Tests........................................................................4-243
4.3.2.1 LOFT Assessments .........................................................4-243 4.3.2.1.1 LOFT Facility.................................................4-244 4.3.2.1.2 LOFT Test Descriptions ................................4-246 4.3.2.1.3 LOFT Assessment Summary........................4-247 4.3.2.1.4 LOFT Test L2-3 Assessment ........................4-249 4.3.2.1.5 LOFT Test L2-5 Assessment ........................4-249 4.3.2.1.6 LOFT Test LP-02-6 Assessment ..................4-249 4.3.2.1.7 LOFT Test LP-LB-1 Assessment ..................4-250
4.3.2.2 Semiscale Tests ..............................................................4-260 4.3.2.2.1 Semiscale Facilities ......................................4-260 4.3.2.2.2 Semiscale Test Descriptions.........................4-262 4.3.2.2.3 Test S-06-3 Assessment...............................4-264 4.3.2.2.4 Test S-07-1 Assessment...............................4-264
4.3.3 Methodology Treatment of PIRT Phenomena..................................4-268 4.3.3.1 Important PIRT Phenomena Not Treated
Statistically .......................................................................4-268 4.3.3.1.1 Core Multi-Dimensional Flow and
Void Distributions ..........................................4-268 4.3.3.1.2 Liquid Entrainment in the Core .....................4-270 4.3.3.1.3 Core Flow Reversal/Stagnation ....................4-271 4.3.3.1.4 Upper Plenum Liquid
Entrainment/Deentrainment ..........................4-271
EMF-2103(NP)
Revison 2Realistic Large Break LOCA Methodology for Pressurized Water Reactors Page iv
AREVA NP Inc.
4.3.3.1.5 Countercurrent Flow Limit .............................4-273 4.3.3.1.6 Hot Leg
Entrainment/Deentrainment ..........................4-273 4.3.3.1.7 Two-Phase Pump Degradation.....................4-273 4.3.3.1.8 Pump Differential Pressure Loss ..................4-274 4.3.3.1.9 Noncondensible Transport ............................4-274 4.3.3.1.10 Downcomer Entrainment ..............................4-274 4.3.3.1.11 Downcomer Liquid Level
Oscillations....................................................4-275 4.3.3.1.12 Lower Plenum Sweepout ..............................4-275 4.3.3.1.13 Steam Binding...............................................4-276 4.3.3.1.14 Cold Leg Condensation ................................4-276 4.3.3.1.15 Fuel Rod, Stored Energy, Gap
Conductivity ..................................................4-277 4.3.3.1.16 Fuel Rod, Stored Energy, Axial and
Radial Peaking..............................................4-278 4.3.3.1.17 Fuel Rod, Decay Heat, Ballooning,
Rupture and Post-Rupture Fuel Relocation .....................................................4-278
4.3.3.1.18 Downcomer, Flow Pattern, CCFL, Slug Flow, and Non-Equilibrium....................4-282
4.3.3.1.19 Downcomer, Multi-D Phenomena .................4-283 4.3.3.1.20 Downcomer, Downcomer Boiling,
Noding...........................................................4-284 4.3.3.1.21 Loop, Flow Oscillation...................................4-284
4.3.3.2 Important PIRT Phenomena Treated Statistically .......................................................................4-291 4.3.3.2.1 Stored Energy ...............................................4-291 4.3.3.2.2 Oxidation.......................................................4-293 4.3.3.2.3 Decay Heat ...................................................4-294 4.3.3.2.4 Departure from Nucleate Boiling...................4-296 4.3.3.2.5 Core Post-CHF Heat Transfer ......................4-296 4.3.3.2.6 Tmin ................................................................4-298 4.3.3.2.7 Break Flow ....................................................4-299 4.3.3.2.8 Accumulator Discharge.................................4-299 4.3.3.2.9 Reactor Vessel Hot Walls .............................4-299 4.3.3.2.10 Containment Pressure ..................................4-300 4.3.3.2.11 Upper Head Temperature, Initial
Coolant Temperature ....................................4-300 4.3.4 Application of Code Biases ..............................................................4-306
4.4 Determine Effect of Scale (CSAU Step 10) ....................................................4-308 4.4.1 Test Scaling......................................................................................4-308
4.4.1.1 Blowdown ........................................................................4-309 4.4.1.2 Refill .................................................................................4-309 4.4.1.3 Reflood ............................................................................4-310
4.4.2 Code Scaling ....................................................................................4-310 4.4.2.1 Post-CHF and Reflood Heat Transfer..............................4-311 4.4.2.2 Scaling from Tests ...........................................................4-315
4.4.2.2.1 Film Boiling Heat Transfer ............................4-315
EMF-2103(NP)
Revison 2Realistic Large Break LOCA Methodology for Pressurized Water Reactors Page v
AREVA NP Inc.
4.4.2.2.2 Core Entrainment..........................................4-315 4.4.2.2.3 Critical Flow at Break ....................................4-316 4.4.2.2.4 Carry-over to Steam Generator ....................4-316 4.4.2.2.5 Pump Scaling................................................4-317 4.4.2.2.6 Cold Leg Condensation ................................4-318 4.4.2.2.7 ECC Water Bypass of Downcomer
during Refill and Lower Plenum Sweep-Out ....................................................4-318
4.4.2.2.8 Loop Oscillations...........................................4-320
5.0 Sensitivity and Uncertainty Analysis ..............................................................................5-1 5.1 Determination of the Effect of Reactor Input Parameters and State
(CSAU Step 11)..................................................................................................5-1 5.1.1 Fixed Design Factors ...........................................................................5-2 5.1.2 Operational Process.............................................................................5-2
5.1.2.1 Determining Important Process Parameters........................5-2 5.1.2.2 Quantifying Uncertainty for Process
Parameters ..........................................................................5-3 5.1.2.3 Treatment of Time in Cycle..................................................5-4 5.1.2.4 Treatment of Axial and Radial Power Shapes .....................5-5 5.1.2.5 Treatment of GDC-35 Criteria..............................................5-6
5.2 Performance of NPP Sensitivity Calculations and Determination of Combined Bias and Uncertainty (CSAU Steps 12 and 13) ................................5-6 5.2.1 Statistical Approach..............................................................................5-6 5.2.2 Application of Methodology ................................................................5-13
5.3 Determination of Combined Bias and Uncertainty and Determination of Total Uncertainty (CSAU Steps 13 and 14) ..........................5-14
6.0 References.....................................................................................................................6-1
Appendix A Time Step Sensitivity....................................................................................... A-1
Appendix B Sample PWR Licensing Analyses................................................................... B-1 B.1 Introduction........................................................................................................ B-1
B.1.1 Analysis ............................................................................................... B-2 B.1.2 Description of Analytical Models ......................................................... B-2 B.1.3 GDC-35 Limiting Condition Determination .......................................... B-3 B.1.4 Overall Statistical Compliance to Criteria ............................................ B-5 B.1.5 Application of Heat Transfer Correlations ........................................... B-5
B.2 Westinghouse 3-Loop PWR ............................................................................ B-19 B.2.1 Summary ........................................................................................... B-19 B.2.2 Plant Description and Summary of Analysis Parameters.................. B-19 B.2.3 Realistic Large Break LOCA Results ................................................ B-20 B.2.4 Conclusions....................................................................................... B-21
B.3 Westinghouse 4-Loop PWR ............................................................................ B-52 B.3.1 Summary ........................................................................................... B-52 B.3.2 Plant Description and Summary of Analysis Parameters.................. B-52 B.3.3 Realistic Large Break LOCA Results ................................................ B-53 B.3.4 Conclusions....................................................................................... B-54
B.4 CE 2x4 PWR ................................................................................................... B-85
EMF-2103(NP)
Revison 2Realistic Large Break LOCA Methodology for Pressurized Water Reactors Page vi
AREVA NP Inc.
B.4.1 Summary ........................................................................................... B-85 B.4.2 Plant Description and Summary of Analysis Parameters.................. B-85 B.4.3 Realistic Large Break LOCA Results ................................................ B-86 B.4.4 Conclusions....................................................................................... B-88
B.5 References .................................................................................................... B-141
Appendix C Incorporation of M5® Cladding Properties....................................................... C-1 C.1 References ........................................................................................................ C-1
EMF-2103(NP)
Revison 2Realistic Large Break LOCA Methodology for Pressurized Water Reactors Page vii
AREVA NP Inc.
Tables
Table 3.1: Phenomena Identification and Ranking Table for PWR LBLOCA..........................3-15
Table 3.2: Models Added to S-RELAP5 from COPERNIC2 and RODEX3A ..........................3-17
Table 3.3: Field Equations/Models in S-RELAP5 ...................................................................3-18
Table 3.4: Phenomena/Processes in S-RELAP5....................................................................3-19
Table 4.1: Validation Needs for Important PIRT Entries ...........................................................4-4
Table 4.2: Assessment Matrix Tests and Phenomena Addressed ...........................................4-7
Table 4.3: Large Break LOCA Nodalization............................................................................4-24
Table 4.4: Parameters, FRIGG-2 Void Distribution Experiments............................................4-47
Table 4.5: PDTF SMART Tests Chosen for S-RELAP5 Verification and Validation .....................................................................................................................4-82
Table 4.6: Comparison of Effluent Temperature for the Plant-Consistent Model, Westinghouse/EPRI 1/3 Scale Tests .........................................................................4-104
Table 4.7: UPTF Test 6 and Test 7 Conditions.....................................................................4-122
Table 4.8: Test Phase Parameters for Test 10 Run 081 ......................................................4-123
Table 4.9: Test Phase Parameters for Test 29 Run 212/211 ...............................................4-123
Table 4.10: CCTF Test Conditions .......................................................................................4-151
Table 4.11: Summary Comparison of Measured and Calculated PCT, CCTF Tests 54, 62, 67, and 68 ............................................................................................4-151
Table 4.12: Test Data for SCTF-II Tests Modeled ................................................................4-181
Table 4.13: Phase I Assessment Results, SCTF Tests ........................................................4-183
Table 4.14: Phase II Assessment Results, SCTF Tests .......................................................4-183
Table 4.15: Moby Dick Facility Dimensions ..........................................................................4-235
Table 4.16: LOFT Nuclear Large Break Test Parameters ....................................................4-251
Table 4.17: Event Sequence for LOFT Test L2-3 .................................................................4-252
Table 4.18: Event Sequence for LOFT Test L2-5 .................................................................4-253
Table 4.19: Event Sequence for LOFT Test LP-02-6 ...........................................................4-254
Table 4.20: Event Sequence for LOFT Test LP-LB-1 ...........................................................4-255
Table 4.21: Methodology Treatment of Important PIRT Phenomena ...................................4-286
Table 4.22: Summary of Evaluated Uncertainties of Important PIRT Parameters................4-289
Table 4.23: Film Boiling Multiplier .........................................................................................4-302
Table 4.24: Dispersed Flow Film Boiling Multiplier ...............................................................4-302
Table 4.25: Biases Used in Assessments.............................................................................4-307
Table 4.26: Test Ranges for Film Boiling Heat Transfer Test Comparison...........................4-322
EMF-2103(NP)
Revison 2Realistic Large Break LOCA Methodology for Pressurized Water Reactors Page viii
AREVA NP Inc.
Table 5.1: NPP Parameters for Consideration in the Performance of a RLBLOCA Analysis ......................................................................................................5-15
Table 5.2: Relationship of PIRT to Operational Parameters...................................................5-16
Table B.1: Sampled LBLOCA Parameters............................................................................. B-13
Table B.2: Identification of Heat Transfer Parameters during a Limiting LBLOCA Simulation ................................................................................................................... B-14
Table B.3: Simulation and Application Space for CHF during Blowdown .............................. B-15
Table B.4: Simulation and Application Space for Film Boiling Heat Transfer Including Thermal Radiation ....................................................................................... B-16
Table B.5: Simulation and Application Space for Transition Boiling Heat Transfer ............... B-17
Table B.6: Simulation and Application Space for Nucleate Boiling Heat Transfer (late reflood) ................................................................................................................ B-17
Table B.7: Summary of Full Range of Applicability ................................................................ B-18
Table B.8: 3-Loop Westinghouse Summary of Major Parameters for Minimum Margin Case................................................................................................................ B-22
Table B.9: 3-Loop Westinghouse Plant Operating Range Supported by the RLBLOCA Analysis ..................................................................................................... B-23
Table B.10: 3-Loop Westinghouse Containment Initial and Boundary Conditions ................ B-26
Table B.11: 3-Loop Westinghouse Passive Heat Sinks in Containment ............................... B-27
Table B.12: 3-Loop Westinghouse Statistical Distribution Used for Process Parameters.................................................................................................................. B-28
Table B.13: 3-Loop Westinghouse Compliance with 10 CFR 50.46...................................... B-29
Table B.14: 3-Loop Westinghouse Calculated Event Times for Limiting Margin Case............................................................................................................................ B-30
Table B.15: Westinghouse 3-Loop Heat Transfer Parameters for Limiting Margin Case............................................................................................................................ B-31
Table B.16: Summary of Limiting Values for Top Minimum Margin Cases within the Set Used to Establish the Probability Evaluation .................................................. B-32
Table B.17: Summary of 4-Loop Westinghouse Plant Major Parameters for Limiting Transient........................................................................................................ B-55
Table B.18: 4-Loop Westinghouse Plant Operating Range Supported by the LOCA Analysis ............................................................................................................ B-56
Table B.19: 4-Loop Westinghouse Containment Initial and Boundary Conditions ................ B-59
Table B.20: 4-Loop Westinghouse Passive Heat Sinks in Containment ............................... B-60
Table B.21: 4-Loop Westinghouse Statistical Distribution Used for Process Parameters.................................................................................................................. B-61
Table B.22: 4-Loop Westinghouse Compliance with 10 CFR 50.46...................................... B-62
EMF-2103(NP)
Revison 2Realistic Large Break LOCA Methodology for Pressurized Water Reactors Page ix
AREVA NP Inc.
Table B.23: 4-Loop Westinghouse Calculated Event Times for Limiting Margin Case............................................................................................................................ B-63
Table B.24: Westinghouse 4-Loop Heat Transfer Parameters for Limiting Margin Case............................................................................................................................ B-64
Table B.25: Summary of Limiting Values for Top Minimum Margin Cases within the Set Used to Establish the Probability Evaluation .................................................. B-65
Table B.26: CE 2x4 Summary of Major Parameters for Limiting Transient ........................... B-89
Table B.27: CE 2x4 Plant Operating Range Supported by the LOCA Analysis..................... B-90
Table B.28: CE 2x4 Containment Initial and Boundary Conditions........................................ B-93
Table B.29: CE 2x4 Passive Heat Sinks in Containment....................................................... B-94
Table B.30: CE 2x4 Statistical Distribution Used for Process Parameters ............................ B-95
Table B.31: CE 2x4 COPERNIC2 Compliance with 10 CFR 50.46 ....................................... B-96
Table B.32: CE 2x4 RODEX3A Compliance with 10 CFR 50.46........................................... B-97
Table B.33: CE 2x4 Calculated Event Times for Limiting Margin Case................................. B-98
Table B.34: CE 2x4 Heat Transfer Parameters for Limiting Margin Case (COPERNIC2)............................................................................................................. B-99
Table B.35: CE 2x4 Heat Transfer Parameters for Limiting Margin Case (RODEX3A)............................................................................................................... B-100
Table B.36: Summary of Limiting Values for Top Minimum Margin Cases within the Set Used to Establish the Probability Evaluation (COPERNIC2 with M5® Cladding) ........................................................................................................... B-101
Table B.37: Summary of Limiting Values for Top Minimum Margin Cases within the Set Used to Establish the Probability Evaluation (RODEX3A with Zirc-4 Cladding)......................................................................................................... B-102
EMF-2103(NP)
Revison 2Realistic Large Break LOCA Methodology for Pressurized Water Reactors Page x
AREVA NP Inc.
Figures
Figure 2.1: Code Scaling, Applicability, and Uncertainty Methodology Flow Chart ..................2-6
Figure 4.1: Sample Loop Nodalization for NPP ......................................................................4-25
Figure 4.2: Sample Steam Generator Secondary Nodalization for NPP ................................4-26
Figure 4.3: Double-Ended Guillotine and Split Break Nodalization.........................................4-27
Figure 4.4: Sample Reactor Vessel Nodalization for NPP......................................................4-28
Figure 4.5: Westinghouse/AREVA 3- and 4-Loop and CE 2x4 Plant Vessel Downcomer Configurations..........................................................................................4-29
Figure 4.6: NPP Core Nodalization.........................................................................................4-30
Figure 4.7: Sample NPP Upper Plenum Nodalization – Axial Plane ......................................4-31
Figure 4.8: Sample NPP Upper Plenum Nodalization – Cross-Sectional Plane.....................4-32
Figure 4.9: Comparison of Calculated HTC to Measured HTC, ORNL THTF.........................4-36
Figure 4.10: Distribution for HTC Scaling, ORNL THTF .........................................................4-37
Figure 4.11: Comparisons of Void Profiles, ORNL THTF Test 3.09.10j..................................4-39
Figure 4.12: Comparison of Void Profiles, ORNL THTF Test 3.09.10m .................................4-40
Figure 4.13: Comparison of Void Profiles, ORNL THTF Test 3.09.10dd ................................4-41
Figure 4.14: Void Profiles at 40 seconds for the 1 foot GE Level Swell Test 1004-3 ..........................................................................................................................4-44
Figure 4.15: Void Profiles at 100 seconds for the 1 foot GE Level Swell Test 1004-3 ..................................................................................................................4-45
Figure 4.16: Comparison of Calculated and Measured Void Fraction, FRIGG-2 Test 313007 .................................................................................................................4-48
Figure 4.17: Comparison of Calculated and Measured Void Fraction, FRIGG-2 Test 313014 .................................................................................................................4-49
Figure 4.18: Comparison of Calculated and Measured Void Fraction, FRIGG-2 Test 313016 .................................................................................................................4-50
Figure 4.19: Comparison of Calculated and Measured Void Fraction, FRIGG-2 Test 313020 .................................................................................................................4-51
Figure 4.20: Comparison of Calculated and Measured Void Fraction, FRIGG-2 Test 313060 .................................................................................................................4-52
Figure 4.21: Comparison of Calculated and Measured Void Fraction, FRIGG-2 Test 313010 .................................................................................................................4-53
Figure 4.22: Comparison of Calculated and Measured Void Fraction, FRIGG-2 Test 313013 .................................................................................................................4-54
Figure 4.23: Comparison of Calculated and Measured Void Fraction, FRIGG-2 Test 313017 .................................................................................................................4-55
EMF-2103(NP)
Revison 2Realistic Large Break LOCA Methodology for Pressurized Water Reactors Page xi
AREVA NP Inc.
Figure 4.24: Comparison of Calculated and Measured Void Fraction, FRIGG-2 Test 313019 .................................................................................................................4-56
Figure 4.25: Comparison of Calculated and Measured Void Fraction, FRIGG-2 Test 313030 .................................................................................................................4-57
Figure 4.26: Comparison of Calculated and Measured Void Fraction at the Same Location for all 27 FRIGG-2 Tests ...............................................................................4-58
Figure 4.27: Wall Temperature Profiles, Bennett Heated Tube Test 5358 .............................4-60
Figure 4.28: Wall Temperature Profiles, Bennett Heated Tube Test 5379 .............................4-61
Figure 4.29: Maximum Clad Temperature at All Measured Elevations, FLECHT-SEASET Test 31805 ....................................................................................................4-66
Figure 4.30: Maximum Clad Temperature at All Measured Elevations, FLECHT-SEASET Test 31504 ....................................................................................................4-67
Figure 4.31: Maximum Clad Temperature at All Measured Elevations, FLECHT-SEASET Test 31203 ....................................................................................................4-68
Figure 4.32: Maximum Clad Temperature at All Measured Elevations, FLECHT-SEASET Test 31302 ....................................................................................................4-69
Figure 4.33: Maximum Clad Temperature at All Measured Elevations, FLECHT-SEASET Test 31701 ....................................................................................................4-70
Figure 4.34: Maximum Clad Temperature at All Measured Elevations, FLECHT-SEASET Test 34209 ....................................................................................................4-71
Figure 4.35: Maximum Clad Temperature at All Measured Elevations, FLECHT-SEASET Test 32013 ....................................................................................................4-72
Figure 4.36: Maximum Clad Temperature at All Measured Elevations, FLECHT Skewed Test 13609 .....................................................................................................4-73
Figure 4.37: Maximum Clad Temperature at All Measured Elevations, FLECHT Skewed Test 13914 .....................................................................................................4-74
Figure 4.38: Calculated and Measured Rod Surface Temperature at 78 inches, FLECHT-SEASET Test 31504.....................................................................................4-75
Figure 4.39: Steam Temperatures Calculated at 75.6 inches and Measured at 72 inches, FLECHT-SEASET Test 31504 ........................................................................4-76
Figure 4.40: Accumulated Water Mass in the Test Section, FLECHT-SEASET Test 31504 ...................................................................................................................4-77
Figure 4.41: Rod Quench Time, FLECHT-SEASET Test 31504 ............................................4-78
Figure 4.42: Maximum Cladding Temperatures versus Axial Elevation from FLECHT-SEASET Test 31504 Time Step and Node Size Sensitivities .......................4-79
Figure 4.43: Comparison of Predicted PCT and Measured Data, PDTF SMART...................4-83
Figure 4.44: MCT versus Elevation Comparison to Data for 4-in/s-Flooding-Rate Test, PDTF SMART .....................................................................................................4-84
EMF-2103(NP)
Revison 2Realistic Large Break LOCA Methodology for Pressurized Water Reactors Page xii
AREVA NP Inc.
Figure 4.45: MCT versus Elevation Comparison to Data for 2-in/s-Flooding-Rate Test, PDTF SMART .....................................................................................................4-85
Figure 4.46: MCT versus Elevation Comparison to Data for 1-in/s-Flooding-Rate Test, PDTF SMART .....................................................................................................4-86
Figure 4.47: MCT versus Elevation Comparison to Data for Variable-Flooding-Rate Test, PDTF SMART ...............................................................4-87
Figure 4.48: Comparison of Break Mass Flow Rates, Marviken Test 2..................................4-90
Figure 4.49: Comparison of Break Mass Flow Rates, Marviken Test 6..................................4-91
Figure 4.50: Comparison of Break Mass Flow Rates, Marviken Test 8..................................4-92
Figure 4.51: Comparison of Break Mass Flow Rates, Marviken Test 16................................4-93
Figure 4.52: Comparison of Break Mass Flow Rates, Marviken Test 17................................4-94
Figure 4.53: Comparison of Break Mass Flow Rates, Marviken Test 20................................4-95
Figure 4.54: Comparison of Break Mass Flow Rates, Marviken Test 22................................4-96
Figure 4.55: Comparison of Break Mass Flow Rates, Marviken Test 24................................4-97
Figure 4.56: Comparison of Break Mass Flow Rates, Marviken Test 25................................4-98
Figure 4.57: Comparison of Calculated and Measured Mass Fluxes (All Nine Marviken Tests)............................................................................................................4-99
Figure 4.58: Break Flow Uncertainty, Marviken Tests ..........................................................4-100
Figure 4.59: Comparison of Calculated and Measured Effluent Temperature for the Plant-Specific Model, Westinghouse/EPRI 1/3 Scale Tests.................................4-105
Figure 4.60: Comparison between Mini-Loop CCFL Data of a Westinghouse 17x17 UTP and Bankoff .............................................................................................4-107
Figure 4.61: Comparison between Mini-Loop CCFL Data of a Westinghouse 15x15 UTP and Bankoff .............................................................................................4-108
Figure 4.62: Comparison between Mini-Loop CCFL Data of a Combustion Engineering 14x14 UTP and Bankoff .........................................................................4-109
Figure 4.63: Lower Plenum Liquid Level Comparison UPTF Test 6 Run 131 ......................4-124
Figure 4.64: Lower Plenum Liquid Level Comparison UPTF Test 6 Run 132 ......................4-125
Figure 4.65: Lower Plenum Liquid Level Comparison UPTF Test 6 Run 133 ......................4-126
Figure 4.66: Lower Plenum Liquid Level Comparison UPTF Test 6 Run 135 ......................4-127
Figure 4.67: Lower Plenum Liquid Level Comparison UPTF Test 6 Run 136 ......................4-128
Figure 4.68: Lower Plenum Liquid Level Comparison UPTF Test 7 Run 203 ......................4-129
Figure 4.69: Broken Cold Leg Liquid Temperature UPTF Test 6 Run 135...........................4-130
Figure 4.70: Lower Head Liquid Temperature UPTF Test 6 Run 135 ..................................4-131
Figure 4.71: Total Cold Leg Break Flow UPTF Test 6 Run 135 ...........................................4-132
Figure 4.72: Cold Leg Temperature Comparison UPTF Test 8 Run 111..............................4-133
EMF-2103(NP)
Revison 2Realistic Large Break LOCA Methodology for Pressurized Water Reactors Page xiii
AREVA NP Inc.
Figure 4.73: Flow Regime Comparison UPTF Test 8 Run 111 ............................................4-134
Figure 4.74: Cold Leg Temperature Comparison UPTF Test 8 Run 112..............................4-135
Figure 4.75: Flow Regime Comparison UPTF Test 8 Run 112 ............................................4-136
Figure 4.76: Countercurrent Flow of Steam and Water UPTF Test 10 Run 081 ..................4-137
Figure 4.77: Countercurrent Flow of Steam and Water UPTF Test 29 Run 212/211 ......................................................................................................................4-138
Figure 4.78: Carryover to Steam Generators UPTF Test 10 Run 081..................................4-139
Figure 4.79: Cumulative Water Carryover to Steam Generators UPTF Test 29 Run 211/212...............................................................................................................4-140
Figure 4.80: Countercurrent Flow of Steam and Water UPTF Test 10 Run 080 ..................4-141
Figure 4.81: Upper Plenum Pressure Comparison UPTF Test 10 Run 080 .........................4-142
Figure 4.82: Calculated Downflow Comparison UPTF Test 10 Run 080..............................4-143
Figure 4.83: Countercurrent Flow of Steam and Water UPTF Test 12 Run 014 ..................4-144
Figure 4.84: Upper Plenum Pressure Comparison UPTF Test 12 Run 014 .........................4-145
Figure 4.85: Calculated Downflow Comparison UPTF Test 12 Run 014..............................4-146
Figure 4.86: Calculated and Measured Vessel Bottom Pressures CCTF Test Run 54........................................................................................................................4-152
Figure 4.87: Calculated and Measured Upper Plenum Pressures CCTF Test Run 62........................................................................................................................4-153
Figure 4.88: Calculated and Measured Upper Plenum Pressures CCTF Test Run 67........................................................................................................................4-154
Figure 4.89: Calculated and Measured Upper Plenum Pressures CCTF Test Run 68........................................................................................................................4-155
Figure 4.90: Calculated and Measured Downcomer Differential Pressure CCTF Test Run 54................................................................................................................4-156
Figure 4.91: Calculated and Measured Downcomer Differential Pressure CCTF Test Run 62................................................................................................................4-157
Figure 4.92: Calculated and Measured Downcomer Differential Pressure CCTF Test Run 67................................................................................................................4-158
Figure 4.93: Calculated and Measured Downcomer Differential Pressure CCTF Test Run 68................................................................................................................4-159
Figure 4.94: Comparison of Core Differential Pressures CCTF Test Run 54 .......................4-160
Figure 4.95: Comparison of Core Differential Pressures CCTF Test Run 62 .......................4-161
Figure 4.96: Comparison of Core Differential Pressures CCTF Test Run 67 .......................4-162
Figure 4.97: Comparison of Core Differential Pressures CCTF Test Run 68 .......................4-163
Figure 4.98: Comparison of Liquid Level in Containment Tank II CCTF Test Run 54........................................................................................................................4-164
EMF-2103(NP)
Revison 2Realistic Large Break LOCA Methodology for Pressurized Water Reactors Page xiv
AREVA NP Inc.
Figure 4.99: Comparison of Liquid Level in Containment Tank II CCTF Test Run 62 ...............................................................................................................................4-165
Figure 4.100: Comparison of Liquid Level in Containment Tank II CCTF Test Run 67........................................................................................................................4-166
Figure 4.101: Comparison of Liquid Level in Containment Tank II CCTF Test Run 68........................................................................................................................4-167
Figure 4.102: Comparison of Rod Surface Temperatures for High Power Bundles at 2.035 meters Elevation CCTF Test Run 54 .............................................4-168
Figure 4.103: Comparison of Rod Surface Temperatures for High Power Bundles at 2.035 meters Elevation CCTF Test Run 62 .............................................4-169
Figure 4.104: Comparison of Rod Surface Temperatures for High Power Bundles at 2.035 meters Elevation CCTF Test Run 67 .............................................4-170
Figure 4.105: Comparison of Rod Surface Temperatures for High Power Bundles at 2.035 meters Elevation CCTF Test Run 68 .............................................4-171
Figure 4.106: Comparison of Peak Surface Temperatures versus Elevation for High Power Bundles CCTF Test Run 54 ...................................................................4-172
Figure 4.107: Comparison of Peak Surface Temperatures versus Elevation for High Power Bundles CCTF Test Run 62 ...................................................................4-173
Figure 4.108: Comparison of Peak Surface Temperatures versus Elevation for High Power Bundles CCTF Test Run 67 ...................................................................4-174
Figure 4.109: Comparison of Peak Surface Temperatures versus Elevation for High Power Bundles CCTF Test Run 68 ...................................................................4-175
Figure 4.110: Fuel Assembly Pressure Comparison SCTF-II S2-11 ....................................4-184
Figure 4.111: Fuel Assembly Pressure Comparison SCTF-II S2-AC1 .................................4-185
Figure 4.112: Fuel Assembly Pressure Comparison SCTF-II S2-10 ....................................4-186
Figure 4.113: Fuel Assembly Pressure Comparison SCTF-II S2-SH1 .................................4-187
Figure 4.114: Fuel Assembly Pressure Comparison SCTF-II S2-17 ....................................4-188
Figure 4.115: Fuel Assembly Pressure Comparison SCTF-II S2-18 ....................................4-189
Figure 4.116: Core Differential Pressure Comparison SCTF-II S2-11..................................4-190
Figure 4.117: Core Differential Pressure Comparison SCTF-II S2-AC1...............................4-191
Figure 4.118: Core Differential Pressure Comparison SCTF-II S2-10..................................4-192
Figure 4.119: Core Differential Pressure Comparison SCTF-II S2-SH1...............................4-193
Figure 4.120: Core Differential Pressure Comparison SCTF-II S2-17..................................4-194
Figure 4.121: Core Differential Pressure Comparison SCTF-II S2-18..................................4-195
Figure 4.122: Differential Pressure: Upper Plenum – Downcomer SCTF-II S2-11 ...............4-196
Figure 4.123: Differential Pressure: Upper Plenum – Downcomer SCTF-II S2-AC1 ............................................................................................................................4-197
EMF-2103(NP)
Revison 2Realistic Large Break LOCA Methodology for Pressurized Water Reactors Page xv
AREVA NP Inc.
Figure 4.124: Differential Pressure: Upper Plenum – Downcomer SCTF-II S2-10 ...............4-198
Figure 4.125: Differential Pressure: Upper Plenum – Downcomer SCTF-II S2-SH1 ............................................................................................................................4-199
Figure 4.126: Differential Pressure: Upper Plenum – Downcomer SCTF-II S2-17 ...............4-200
Figure 4.127: Differential Pressure: Upper Plenum – Downcomer SCTF-II S2-18 ...............4-201
Figure 4.128: Liquid Level in S/W Separator SCTF-II S2-11 ................................................4-202
Figure 4.129: Liquid Level in S/W Separator SCTF-II S2-AC1 .............................................4-203
Figure 4.130: Liquid Level in S/W Separator SCTF-II S2-10 ................................................4-204
Figure 4.131: Liquid Level in S/W Separator SCTF-II S2-SH1 .............................................4-205
Figure 4.132: Liquid Level in S/W Separator SCTF-II S2-17 ................................................4-206
Figure 4.133: Liquid Level in S/W Separator SCTF-II S2-18 ................................................4-207
Figure 4.134: Temperature Comparison at 1.905 meters SCTF-II S2-11.............................4-208
Figure 4.135: Temperature Comparison at 1.905 meters SCTF-II S2-AC1..........................4-209
Figure 4.136: Temperature Comparison at 1.905 meters SCTF-II S2-10.............................4-210
Figure 4.137: Temperature Comparison at 1.905 meters SCTF-II S2-SH1..........................4-211
Figure 4.138: Temperature Comparison at 1.905 meters SCTF-II S2-17.............................4-212
Figure 4.139: Temperature Comparison at 1.905 meters SCTF-II S2-18.............................4-213
Figure 4.140: Thermocouple Variation Range at the PCT Elevation ACHILLES ISP 25 ........................................................................................................................4-218
Figure 4.141: Nitrogen Insurge Impact at 1.08 meters ACHILLES ISP 25 ...........................4-219
Figure 4.142: Nitrogen Insurge Impact at 1.81 meters ACHILLES ISP 25 ...........................4-220
Figure 4.143: Nitrogen Insurge Impact at 2.13 meters ACHILLES ISP 25 ...........................4-221
Figure 4.144: Nitrogen Insurge Impact at 2.33 meters ACHILLES ISP 25 ...........................4-222
Figure 4.145: Nitrogen Insurge Impact at 2.65 meters ACHILLES ISP 25 ...........................4-223
Figure 4.146: Nitrogen Insurge Impact at 3.18 meters ACHILLES ISP 25 ...........................4-224
Figure 4.147: Downcomer Pressure Comparison ACHILLES ISP 25...................................4-225
Figure 4.148: Axial Velocities at 32.5 inches, Asymmetric Flow - Test 1..............................4-228
Figure 4.149: Axial Flow Fractions for Asymmetric Flow - Test 1 .........................................4-229
Figure 4.150: Axial Velocities at 32.5 inches, for Asymmetric Flow - Test 2.........................4-230
Figure 4.151: Axial Flow Fractions for Asymmetric Flow – Test 2 ........................................4-231
Figure 4.152: Axial Velocities at 32.5 inches, for Asymmetric Flow - Test 3.........................4-232
Figure 4.153: Comparison of Moby Dick Data and S-RELAP5 Calculated Pressures ...................................................................................................................4-236
Figure 4.154: Ratio of Convective to Total Heat Transfer, Calculated and Measured ...................................................................................................................4-240
EMF-2103(NP)
Revison 2Realistic Large Break LOCA Methodology for Pressurized Water Reactors Page xvi
AREVA NP Inc.
Figure 4.155: Total Heat Transfer Coefficient, Calculated and Measured............................4-241
Figure 4.156: Convective Heat Transfer Coefficient .............................................................4-242
Figure 4.157: Comparison of PCTs versus Core Elevations LOFT Test L2-3 with S-RELAP5..................................................................................................................4-256
Figure 4.158: Comparison of PCTs versus Core Elevation, LOFT Test L2-5.......................4-257
Figure 4.159: Comparison of PCTs versus Core Elevations, LOFT Test LP-02-6................4-258
Figure 4.160: Comparison of PCTs versus Core Elevation, LOFT Test LP-LB-1.................4-259
Figure 4.161: Assessment of Semiscale LBLOCA Test S-06-3, PCTs.................................4-266
Figure 4.162: Assessment of Semiscale LBLOCA Test S-07-1, PCTs versus Elevation ....................................................................................................................4-267
Figure 4.163: CONMAS Multiplier as a Function of Cold Leg Void Fraction ........................4-290
Figure 4.164: COPERNIC2 Cumulative Centerline Fuel Temperature Error Distribution .................................................................................................................4-303
Figure 4.165: RODEX3A Bias as a Function of Fuel Pin Burnup .........................................4-304
Figure 4.166: Temperature Distribution in the Vessel Wall – S-RELAP5 versus Exact Solution ............................................................................................................4-305
Figure 4.167: Data Based Nusselt Number versus Reynolds Number for FLECHT-SEASET Steam Cooling Tests Compared with Dittus-Boelter Correlation..................................................................................................................4-314
Figure A.1: Time Step Sensitivity of Westinghouse 3-Loop Analysis ...................................... A-3
Figure A.2: Variability of Westinghouse 3-Loop Analysis ........................................................ A-4
Figure A.3: Time Step Sensitivity of Westinghouse 4-Loop Analysis ...................................... A-5
Figure A.4: Variability of Westinghouse 4-Loop Analysis ........................................................ A-6
Figure A.5: Time Step Sensitivity of CE Analysis .................................................................... A-7
Figure A.6: Variability of CE Analysis ...................................................................................... A-8
Figure B.1: 3-Loop Westinghouse Scatter Plot of Operational Parameters........................... B-33
Figure B.2: 3-Loop Westinghouse PCT versus PCT Time Scatter Plot from the Case Set ..................................................................................................................... B-35
Figure B.3: 3-Loop Westinghouse PCT versus Break Size Scatter Plot from the Case Set ..................................................................................................................... B-36
Figure B.4: 3-Loop Westinghouse Maximum Oxidation versus PCT Scatter Plot from the Case Set ....................................................................................................... B-37
Figure B.5: 3-Loop Westinghouse Total Oxidation versus PCT Scatter Plot from the Case Set ............................................................................................................... B-38
Figure B.6: 3-Loop Westinghouse Peak Cladding Temperature (Independent of Elevation) for the Limiting Margin Case ...................................................................... B-39
Figure B.7: 3-Loop Westinghouse Break Flow for the Limiting Margin Case ........................ B-40
EMF-2103(NP)
Revison 2Realistic Large Break LOCA Methodology for Pressurized Water Reactors Page xvii
AREVA NP Inc.
Figure B.8: 3-Loop Westinghouse Core Inlet Mass Flux for the Limiting Margin Case............................................................................................................................ B-41
Figure B.9: 3-Loop Westinghouse Core Outlet Mass Flux for the Limiting Margin Case............................................................................................................................ B-42
Figure B.10: 3-Loop Westinghouse Void Fraction at RCS Pumps for the Limiting Margin Case................................................................................................................ B-43
Figure B.11: 3-Loop Westinghouse ECCS Flows (Includes Accumulator, Charging, SI and RHR) for the Limiting Margin Case ................................................. B-44
Figure B.12: 3-Loop Westinghouse Upper Plenum Pressure for the Limiting Margin Case................................................................................................................ B-45
Figure B.13: 3-Loop Westinghouse Collapsed Liquid Level in the Downcomer for the Limiting Margin Case ............................................................................................ B-46
Figure B.14: 3-Loop Westinghouse Collapsed Liquid Level in the Lower Plenum for the Limiting Margin Case ....................................................................................... B-47
Figure B.15: 3-Loop Westinghouse Collapsed Liquid Level in the Core for the Limiting Margin Case .................................................................................................. B-48
Figure B.16: 3-Loop Westinghouse Containment and Loop Pressures for the Limiting Margin Case .................................................................................................. B-49
Figure B.17: 3-Loop Westinghouse Pressure Difference between Upper Plenum and Downcomer .......................................................................................................... B-50
Figure B.18: 3-Loop Westinghouse Validation of BOCR Time using MPR CCFL Correlation................................................................................................................... B-51
Figure B.19: 4-Loop Westinghouse Scatter Plot of Operational Parameters......................... B-66
Figure B.20: 4-Loop Westinghouse PCT versus PCT Time Scatter Plot from the Case Set ..................................................................................................................... B-68
Figure B.21: 4-Loop Westinghouse PCT versus Break Size Scatter Plot from the Case Set ..................................................................................................................... B-69
Figure B.22: 4-Loop Westinghouse Maximum Oxidation versus PCT Scatter Plot from the Case Set ....................................................................................................... B-70
Figure B.23: 4-Loop Westinghouse Total Oxidation versus PCT Scatter Plot from the Case Set ............................................................................................................... B-71
Figure B.24: 4-Loop Westinghouse Peak Cladding Temperature (Independent of Elevation) for the Limiting Margin Case ...................................................................... B-72
Figure B.25: 4-Loop Westinghouse Break Flow for the Limiting Margin Case ...................... B-73
Figure B.26: 4-Loop Westinghouse Core Inlet Mass Flux for the Limiting Margin Case............................................................................................................................ B-74
Figure B.27: 4-Loop Westinghouse Core Outlet Mass Flux for the Limiting Margin Case................................................................................................................ B-75
Figure B.28: 4-Loop Westinghouse Void Fraction at RCS Pumps for the Limiting Margin Case................................................................................................................ B-76
EMF-2103(NP)
Revison 2Realistic Large Break LOCA Methodology for Pressurized Water Reactors Page xviii
AREVA NP Inc.
Figure B.29: 4-Loop Westinghouse ECCS Flows (Includes Accumulator, Charging, SI and RHR) for the Limiting Margin Case ................................................. B-77
Figure B.30: 4-Loop Westinghouse Upper Plenum Pressure for the Limiting Margin Case................................................................................................................ B-78
Figure B.31: 4-Loop Westinghouse Collapsed Liquid Level in the Downcomer for the Limiting Margin Case ............................................................................................ B-79
Figure B.32: 4-Loop Westinghouse Collapsed Liquid Level in the Lower Plenum for the Limiting Margin Case ....................................................................................... B-80
Figure B.33: 4-Loop Westinghouse Collapsed Liquid Level in the Core for the Limiting Margin Case .................................................................................................. B-81
Figure B.34: 4-Loop Westinghouse Containment and Loop Pressures for the Limiting Margin Case .................................................................................................. B-82
Figure B.35: 4-Loop Westinghouse Pressure Difference between Upper Plenum and Downcomer .......................................................................................................... B-83
Figure B.36: 4-Loop Westinghouse Validation of BOCR Time using MPR CCFL Correlation................................................................................................................... B-84
Figure B.37: CE 2x4 Scatter Plot of Operational Parameters (COPERNIC2)...................... B-103
Figure B.38: CE 2x4 PCT versus PCT Time Scatter Plot from the Case Set (COPERNIC2)........................................................................................................... B-105
Figure B.39: CE 2x4 PCT versus Break Size Scatter Plot from the Case Set (COPERNIC2)........................................................................................................... B-106
Figure B.40: CE 2x4 Maximum Oxidation versus PCT Scatter Plot from the Case Set (COPERNIC2) .................................................................................................... B-107
Figure B.41: CE 2x4 Total Oxidation versus PCT Scatter Plot from the Case Set (COPERNIC2)........................................................................................................... B-108
Figure B.42: CE 2x4 Peak Cladding Temperature (Independent of Elevation) for the Limiting Margin Case (COPERNIC2) .................................................................. B-109
Figure B.43: CE 2x4 Break Flow for the Limiting Margin Case (COPERNIC2) ................... B-110
Figure B.44: CE 2x4 Core Inlet Mass Flux for the Limiting Margin Case (COPERNIC2)........................................................................................................... B-111
Figure B.45: CE 2x4 Core Outlet Mass Flux for the Limiting Margin Case (COPERNIC2)........................................................................................................... B-112
Figure B.46: CE 2x4 Void Fraction at RCS Pumps for the Limiting Margin Case (COPERNIC2)........................................................................................................... B-113
Figure B.47: CE 2x4 ECCS Flows (Includes SIT, Charging, SI and RHR) for the Limiting Margin Case (COPERNIC2) ........................................................................ B-114
Figure B.48: CE 2x4 Upper Plenum Pressure for the Limiting Margin Case (COPERNIC2)........................................................................................................... B-115
Figure B.49: CE 2x4 Collapsed Liquid Level in the Downcomer for the Limiting Margin Case (COPERNIC2) ..................................................................................... B-116
EMF-2103(NP)
Revison 2Realistic Large Break LOCA Methodology for Pressurized Water Reactors Page xix
AREVA NP Inc.
Figure B.50: CE 2x4 Collapsed Liquid Level in the Lower Plenum for the Limiting Margin Case (COPERNIC2) ..................................................................................... B-117
Figure B.51: CE 2x4 Collapsed Liquid Level in the Core for the Limiting Margin Case (COPERNIC2) ................................................................................................. B-118
Figure B.52: CE 2x4 Containment and Loop Pressures for the Limiting Margin Case (COPERNIC2) ................................................................................................. B-119
Figure B.53: CE 2x4 Pressure Difference between Upper Plenum and Downcomer (COPERNIC2)....................................................................................... B-120
Figure B.54: CE 2x4 Validation of BOCR Time using MPR CCFL Correlation (COPERNIC2)........................................................................................................... B-121
Figure B.55: CE 2x4 Scatter Plot of Operational Parameters (RODEX3A) ......................... B-122
Figure B.56: CE 2x4 PCT versus PCT Time Scatter Plot from the Case Set (RODEX3A)............................................................................................................... B-124
Figure B.57: CE 2x4 PCT versus Break Size Scatter Plot from the Case Set (RODEX3A)............................................................................................................... B-125
Figure B.58: CE 2x4 Maximum Oxidation versus PCT Scatter Plot from the Case Set (RODEX3A) ........................................................................................................ B-126
Figure B.59: CE 2x4 Total Oxidation versus PCT Scatter Plot from the Case Set (RODEX3A)............................................................................................................... B-127
Figure B.60: CE 2x4 Peak Cladding Temperature (Independent of Elevation) for the Limiting Margin Case (RODEX3A)...................................................................... B-128
Figure B.61: CE 2x4 Break Flow for the Limiting Margin Case (RODEX3A) ....................... B-129
Figure B.62: CE 2x4 Core Inlet Mass Flux for the Limiting Margin Case (RODEX3A)............................................................................................................... B-130
Figure B.63: CE 2x4 Core Outlet Mass Flux for the Limiting Margin Case (RODEX3A)............................................................................................................... B-131
Figure B.64: CE 2x4 Void Fraction at RCS Pumps for the Limiting Margin Case (RODEX3A)............................................................................................................... B-132
Figure B.65: CE 2x4 ECCS Flows (Includes SIT, Charging, SI and RHR) for the Limiting Margin Case (RODEX3A)............................................................................ B-133
Figure B.66: CE 2x4 Upper Plenum Pressure for the Limiting Margin Case (RODEX3A)............................................................................................................... B-134
Figure B.67: CE 2x4 Collapsed Liquid Level in the Downcomer for the Limiting Margin Case (RODEX3A) ......................................................................................... B-135
Figure B.68: CE 2x4 Collapsed Liquid Level in the Lower Plenum for the Limiting Margin Case (RODEX3A) ......................................................................................... B-136
Figure B.69: CE 2x4 Collapsed Liquid Level in the Core for the Limiting Margin Case (RODEX3A) ..................................................................................................... B-137
Figure B.70: CE 2x4 Containment and Loop Pressures for the Limiting Margin Case (RODEX3A) ..................................................................................................... B-138

EMF-2103(NP)
Revison 2Realistic Large Break LOCA Methodology for Pressurized Water Reactors Page xx
AREVA NP Inc.
Figure B.71: CE 2x4 Pressure Difference between Upper Plenum and Downcomer (RODEX3A) .......................................................................................... B-139
Figure B.72: CE 2x4 Validation of BOCR Time using MPR CCFL Correlation (RODEX3A)............................................................................................................... B-140
EMF-2103(NP)
Revison 2Realistic Large Break LOCA Methodology for Pressurized Water Reactors Page xxi
AREVA NP Inc.
Nomenclature
Acronym Definition
ACC accumulator ANP advanced nuclear products ANS American Nuclear Society ASME American Society of Mechanical Engineers BIASI Biasi CHF multiplier BLCL broken loop cold leg BLHL broken loop hot leg BST blowdown suppression tank BWR boiling water reactor CCFL countercurrent flow limitation CCTF Cylindrical Core Test Facility CE Combustion Engineering CFR Code of Federal Regulations CHF critical heat flux CONMAS interfacial condensation heat transfer coefficient multiplier CONMSG interfacial condensation heat transfer coefficient multiplier, vapor CSAU Code Scaling, Applicability, and Uncertainty DEG double-ended guillotine DFFBHTC dispersed flow film boiling heat transfer coefficient DIW deionized water tank DMS document management system DNB departure from nucleate boiling ECC emergency core cooling ECCS emergency core cooling system EDR Experimental Data Report EHL end of heated length EPRI Electric Power Research Institute FCTF Fuel Cooling Test Facility FIJ Interphase friction multiplier FILMBL film boiling FIMIST post-CHF mist flow regime FLECHT Full Length Emergency Cooling Heat Transfer HEM homogeneous equilibrium model HHSI high head safety injection HPC high probability of compliance HPI high pressure injection HPSI high pressure safety injection HTP high thermal performance
EMF-2103(NP)
Revison 2Realistic Large Break LOCA Methodology for Pressurized Water Reactors Page xxii
AREVA NP Inc.
IET Integral Effects Test ILCL intact loop cold leg ILHL intact loop hot leg INEEL Idaho National Environmental Engineering Laboratory (formerly INEL) INEL Idaho National Engineering Laboratory JAERI Japan Atomic Energy Research Institute KWU Kraftwerk Union (SPC), now AREVA GmbH LANL Los Alamos National Laboratory LBLOCA large break loss-of-coolant accident LHGR linear heat generation rate LHSI low head safety injection LOCA loss-of-coolant accident LOCE loss-of-coolant experiment LOFT Loss of Fluid Test LOOP Loss of Offsite Power LPCI low pressure coolant injection LPSI low pressure safety injection MCT maximum clad temperature MLHGR maximum linear heat generation rate MSIV main steam isolation valve NAI Numerical Applications, Inc. NPP nuclear power plant NRC United States Nuclear Regulatory Commission ORNL Oak Ridge National Laboratory PCT peak cladding temperature PDF probability density function PDTF Product Development Test Facility PFM pipe flow meter PIRT Phenomena Identification and Ranking Table PLC programmable logic controllers PWR pressurized water reactor QLR Quick Look Report RABS reflood assisted bypass system RABV reflood assisted bypass valve RCP reactor coolant pump RCS reactor coolant system RLBLOCA realistic large break loss-of-coolant accident RWST refueling water storage tank
EMF-2103(NP)
Revison 2Realistic Large Break LOCA Methodology for Pressurized Water Reactors Page xxiii
AREVA NP Inc.
SBLOCA small break loss-of-coolant accident SCTF Slab Core Test Facility SDR Software Development Record SEASET System Effects and Separate Effects Tests SET Separate Effects Test SIT Safety Injection Tank SMART SMall Array Reflood Test SPC Siemens Power Corporation SRP Standard Review Plan THTF Thermal-Hydraulic Test Facility TMDPJUN time-dependent junction TMDPVOL time-dependent volume TMINK maximum temperature for transition boiling UCSP upper core support plate UPTF Upper Plenum Test Facility UTP upper tie plate
EMF-2103(NP)
Revison 2Realistic Large Break LOCA Methodology for Pressurized Water Reactors Page 1-1
AREVA NP Inc.
1.0 Introduction
This report describes the AREVA NP Inc. (AREVA) methodology developed for the realistic
evaluation of a large break loss-of-coolant accident (LBLOCA) for pressurized water reactors
(PWRs) with recirculation (U-tube) steam generators. Specifically Westinghouse 3- and 4-loop
designs, Combustion Engineering (CE) 2x4 designs and AREVA 3- and 4-loop designs all with
fuel assembly lengths of 14 feet or less, and emergency core cooling system (ECCS) injection
to the cold legs, are covered. The methodology was originally developed by AREVA in the early
2000s and approved by the U.S. Nuclear Regulatory Commission (NRC) as EMF-2103(P)(A)
Revision 0 in April 2003. In 2006, AREVA submitted EMF-2103(P) Revision 1 as a limited
scope change to the methodology. During the review it was recognized that the limited scope of
Revision 1 was insufficient for future licensing. Revision 1 was, therefore, withdrawn from
review and replaced by a development program culminating in the Revision 2 methodology
documented herein. The documentation provided for and labeled as Revision 2 is complete in
its intended scope. Between the withdrawal of Revision 1 and the submittal and approval of this
revision, plant licensing was accomplished with an interim approach, termed the “Transition
Program,” based on Revision 0 but incorporating methodology changes to address NRC
concerns. This methodology is documented on a plant specific basis when applied for licensing.
Although the Revision 2 documentation is complete and self-contained, the methodology does
build on and incorporates much of the Revision 0 approach and generally incorporates the
“Transition Program” modifications by directly including them in the methodology. The most
significant modifications to the Revision 0 methodology are:
1. The Forslund-Rohsenow correlation is no longer used in determining the fuel cladding
temperature. For the dispersed flow film boiling regime in the core, Wong-Hochreiter
with enhancements replaces the use of Sleicher-Rouse. This alteration is presented in
Sections 4.3.1.1 and 4.3.1.6 and is assessed in Sections 4.3.1.17 and 4.3.3.2.5.
2. A rod-to-rod radiation model has been incorporated into the methodology and the reflood
heat transfer benchmarking has been redone. This alteration is presented in
Sections 4.3.1.17, 4.3.3.2.5, and 4.4.2.1.
EMF-2103(NP)
Revison 2Realistic Large Break LOCA Methodology for Pressurized Water Reactors Page 1-2
AREVA NP Inc.
3. A cold leg condensation model, specific to the pumped injection period of the accident,
has been incorporated. In Revision 0, the cold leg condensation was underpredicted
during the post-accumulator phase resulting in subcooled water entering the
downcomer, and the potential suppression of downcomer boiling. This alteration is
presented in Sections 4.3.1.9, 4.3.1.11, and 4.3.3.1.14.
4. The statistical evaluation has been upgraded, with the application of the Tukey
methodology, to resolve concerns over a multi-variant versus uni-variant evaluation. This
alteration is presented in Section 5.2.
5. The COPERNIC2 fuel performance code has been added as a source of fuel initial
conditions. COPERNIC2 is NRC approved and addresses the issue of
burnup-dependent fuel pellet thermal conductivity. For RODEX3 applications, an
additional conservatism is incorporated in the code bias to account for thermal
conductivity degradation. These alterations are presented in Section 4.3.3.2.1.
6. The methodology has been upgraded such that a direct calculation of second cycle fuel
performance is accomplished. This expands the range of evaluations and assures that
fuel experiencing its second burn will be evaluated and, if limiting, recognized as limiting.
This alteration is presented in Section 5.1.2.3.
7. The break modeling was altered from Revision 0 to concur with the approach outlined in
Regulatory Guide 1.157. This alteration is presented in Section 4.3.3.2.7.
8. The interfacial drag package has been modified with improved logic for transition
between flow regimes to cover a wider range of experimental data. This change does
not address a specific concern or issue, but serves to update the state-of–the-art of
S-RELAP5. The details of this alteration are presented in Reference 11.
9. The interphase heat transfer for mist flow was modified to raise steam temperatures.
The details of this change are presented in Reference 11.
The methodology complies with the revised LOCA ECCS rule as issued by the NRC in 1988
(Reference 1). This rule allows the use of realistic LOCA evaluation models in place of the
prescribed conservative evaluation models specified by 10 CFR 50 Appendix K, provided that it
can be established with a high probability that the criteria of 10 CFR 50.46 are met.
EMF-2103(NP)
Revison 2Realistic Large Break LOCA Methodology for Pressurized Water Reactors Page 1-3
AREVA NP Inc.
The basis for the revised rule is a large body of research performed after the 1973 LOCA ECCS
rule was implemented, which shows the prescribed Appendix K analysis methods are
unnecessarily conservative. A compendium of ECCS research (Reference 2) was issued by the
NRC in 1988 and references the relevant thermal-hydraulic research upon which the realistic
LOCA rule was based.
The realistic evaluation model rule does not prescribe the analytical methods or uncertainty
techniques to be used. However, a Regulatory Guide (Reference 3) was issued to provide
guidance for realistic LOCA analyses. The NRC also independently developed and
demonstrated the code scaling, applicability and uncertainty (CSAU) methodology
(Reference 4) for quantifying uncertainties in realistic codes. The 95th percentile of the
probability distribution is accepted (Reference 3) as providing the level of conservatism required
by the rule.
This report provides a description of the AREVA PWR realistic LBLOCA (RLBLOCA)
methodology and demonstrates its application to representative nuclear power plants. The
methodology documentation is provided in a format consistent with that outlined in the "CSAU
Evaluation Methodology," which specifies that a roadmap be provided for the methodology
followed by a detailed discussion. Each of the steps outlined in CSAU is addressed in both the
roadmap section (Section 2.0) and the detailed description sections (Sections 3.0, 4.0, and 5.0).
As outlined in CSAU, the development of this methodology relies on documentation of the
associated computer codes. The models and correlations document (Reference 11)
demonstrates the applicability of the codes to the chosen event scenario and Nuclear Power
Plant (NPP) types through the use of a phenomena identification and ranking table (PIRT)
process. The PIRT identifies the models and correlations in the codes for which biases and
uncertainties are required or conservatisms demonstrated.
The results of the computer code assessments reported in the verification and validation report
(Reference 5) provide the information required to define how the important PIRT phenomena
are treated in the uncertainty analysis. The treatments range from simply acknowledging and
accepting conservatism in code results to defining biases and uncertainties, including their
distributions that are required to treat the PIRT phenomena statistically.
EMF-2103(NP)
Revison 2Realistic Large Break LOCA Methodology for Pressurized Water Reactors Page 2-1
AREVA NP Inc.
2.0 Methodology Roadmap
This section provides an overview of the methodology and its development. Revision 2 is a
comprehensive improvement to the original RLBLOCA methodology documented in
EMF-2103(P)(A) Revision 0 (Reference 6). A large body of the work that supported Revision 0
still remains applicable to Revision 2. Thus, although the documentation provided herein is
complete and self sufficient, much of the content is the same as was provided in Revision 0.
This section outlines the CSAU methodology followed by AREVA and points to where detailed
discussions of the individual steps are presented. The CSAU approach to realistic LOCA
analysis is diagramed in Figure 2.1. The CSAU procedure has three major elements:
• Requirements and Code Capabilities (Section 3.0)
• Assessment and Ranging of Parameters (Section 4.0)
• Sensitivity and Uncertainty Analysis (Section 5.0)
AREVA's RLBLOCA evaluation methodology is defined and documented consistent with the
CSAU procedure as shown in the following three sections. AREVA's CSAU-compliant
procedure for PWRs is applicable to various plant designs as detailed in Section 1.0.
2.1 Requirements and Code Capabilities
The requirements and code capabilities discussion identifies and compares scenario-modeling
requirements with code capabilities to determine the applicability of the code to the particular
scenario and to identify potential limitations. This is accomplished through the performance of
the following six CSAU steps:
• Scenario Specification (Section 3.1)
• Nuclear Power Plant Selection (Section 3.2)
• Phenomena Identification and Ranking (Section 3.3)
• Frozen Code Version Selection (Section 3.4)
• Provision of Complete Code Documentation (Section 3.5)
• Determination of Code Applicability (Section 3.6)
EMF-2103(NP)
Revison 2Realistic Large Break LOCA Methodology for Pressurized Water Reactors Page 2-2
AREVA NP Inc.
The scenario being addressed in this report is the LBLOCA. The licensing criteria for this event
are:
• The calculated maximum fuel element cladding temperature shall not exceed 2200 °F.
• The calculated total oxidation of the cladding shall nowhere exceed 0.17 times the total cladding thickness before oxidation. As used in this subparagraph total oxidation means the total thickness of cladding metal that would be locally converted to oxide if all the oxygen absorbed by and reacted with the cladding locally were converted to stoichiometric zirconium dioxide. If cladding rupture is calculated to occur, the inside surfaces of the cladding shall be included in the oxidation, beginning at the calculated time of rupture. Cladding thickness before oxidation means the radial distance from inside to outside the cladding, after any calculated rupture or swelling has occurred but before significant oxidation. Where the calculated conditions of transient pressure and temperature lead to a prediction of cladding swelling, with or without cladding rupture, the unoxidized cladding thickness shall be defined as the cladding cross-sectional area, taken at a horizontal plane at the elevation of the rupture, if it occurs, or at the elevation of the highest cladding temperature if no rupture is calculated to occur, divided by the average circumference at that elevation. For ruptured cladding the circumference does not include the rupture opening.
• The calculated total amount of hydrogen generated from the chemical reaction of the cladding with water or steam shall not exceed 0.01 times the hypothetical amount that would be generated if all of the metal in the cladding cylinders surrounding the fuel, excluding the cladding surrounding the plenum volume, were to react.
• Calculated changes in core geometry shall be such that the core remains amenable to cooling.
• After any calculated successful initial operation of the ECCS, the calculated core temperature shall be maintained at an acceptably low value and decay heat shall be removed for the extended period of time required by the long-lived radioactivity remaining in the core.
The first three of these criteria are addressed by the RLBLOCA methodology. The remaining
two require evaluations beyond the capability of the methodology and are treated separately
during plant evaluations.
The selected NPP types to which the methodology is to be applicable includes those PWRs with
recirculating (U-tube) type steam generators and initial ECCS injection into the cold legs.
Provided herein (Appendix B) are sample problems for a Westinghouse 4-loop PWR design, a
Westinghouse 3-loop PWR design, and a Combustion Engineering 2x4 loop design.
A PIRT was prepared for the scenario and NPP types covered by this evaluation model. The
PIRT was developed by AREVA from a combination of published PIRTs (Reference 2), reviews
by external experts, and a peer review conducted by AREVA personnel and external experts.
The PIRT that resulted from this process is provided in Table 3.1.
EMF-2103(NP)
Revison 2Realistic Large Break LOCA Methodology for Pressurized Water Reactors Page 2-3
AREVA NP Inc.
The codes selected for the performance of the RLBLOCA analysis include the RODEX3A and
COPERNIC2 fuel rod codes (References 7, 8, 9 and 10) and the S-RELAP5 system code
(References 5, 11, 12, and 13). Documents were developed for each of the codes to address
the models and correlations used, the theory applied, and the validation against data.
Guidelines were constructed to assist users in the development of S-RELAP5 plant models and
the execution of RLBLOCA application analyses. Verification was also performed to confirm the
models reported in the documentation are the models actually contained in the codes
(Reference 5). In addition, the ICECON containment code (References 14 and 15) was
incorporated into the S-RELAP5 code to closely couple the containment and the primary
system.
The final step in the requirements and code capabilities element is to demonstrate that the code
is applicable to the chosen scenario and NPP types. This objective is accomplished by
comparing the important scenario phenomena from the PIRT and the selected NPP modeling
requirements with the capabilities of the chosen codes. The results of this comparison
demonstrate that the chosen codes are applicable to the scenario and NPP types, as shown in
Section 3.6.
2.2 Assessment and Ranging of Parameters
The assessment and ranging of parameters element is used to quantify the uncertainties and
biases that are to be addressed in the analysis of the chosen scenario with the chosen codes.
This element includes four steps:
• Establishment of Assessment Matrix (Section 4.1)
• NPP Nodalization Definition (Section 4.2)
• Definition of Code and Experimental Accuracy (Section 4.3)
• Determination of Effect of Scale (Section 4.4)
The assessment matrix identifies those experimental benchmarks necessary to quantify the
biases and uncertainties that must be encompassed within the calculation approach of the
methodology. The matrix was largely established in Revision 0, and includes separate effects
tests (SETs) and integral effects tests (IETs) chosen to demonstrate individual model validity,
combined methodology validity and scalability. For Revision 2, the original assessment matrix
EMF-2103(NP)
Revison 2Realistic Large Break LOCA Methodology for Pressurized Water Reactors Page 2-4
AREVA NP Inc.
was preserved with some additions. Section 4.1 and Table 4.1 provide a detailed discussion of
the matrix and its basis. The NPP nodalization is a refinement of that implemented in
Revision 0. Section 4.2 describes the NPP noding arrangement and its justification, including
those changes incorporated into Revision 2. The execution of the assessment matrix is
presented in Section 4.3. Each of the assessment tests is modeled with S-RELAP5 and the
appropriate auxiliary code (COPERNIC2 or RODEX3A), incorporating the methodology
guidelines to the extent possible given the limitations imposed by experimental benchmarks.
The results of these benchmarks are presented and interpreted in Section 4.3, along with a
presentation of the uncertainties and biases developed and how they are incorporated into the
methodology for each key PIRT phenomena. Scalability considerations are presented in
Section 4.4.
2.3 Sensitivity and Uncertainty Analysis
The sensitivity and uncertainty analysis element combines the code and model uncertainties
and the plant specific contributors needed to obtain a total uncertainty and to provide a basis for
making an acceptability statement with respect to the established safety criteria. The following
steps are included in this CSAU element:
• Determination of the Effect of Reactor Input Parameters and State (Section 5.1)
• Performance of NPP Sensitivity Calculations and Determination of Combined Bias and
Uncertainty (Section 5.2)
• Determination of Combined Bias and Uncertainty and Determination of Total Uncertainty
(Section 5.3)
The NPP input parameters and possible operating states were reviewed to determine the
applicable input parameters and state. This review identified a list of inputs that might impact
the RLBLOCA event. Actual NPP operating conditions and typical technical specifications were
assessed to identify allowed operating conditions. A discussion of these types of parameters,
including the identification of those necessary for the application of the methodology (power
peaking for example), is provided in Section 5.1.
The methodology for determination of the combined biases and uncertainties, and the
development of a final statement of probability of compliance with the criteria of 10 CFR 50.46,
EMF-2103(NP)
Revison 2Realistic Large Break LOCA Methodology for Pressurized Water Reactors Page 2-5
AREVA NP Inc.
is addressed in Section 5.2. Section 5.3 discusses the determination of a measure of total
uncertainty. To perform these last two CSAU steps, a non-parametric statistical approach has
been used. Non-parametric statistics allows for the treatment of a large number of parameter
and plant initial condition uncertainties through direct calculations with the model and associated
computer codes. A large number of case inputs are generated by randomly selecting values for
all parameters being treated statistically. For this methodology, the number of cases is
determined in accordance with the requirements put forth in Section 5.2. The method
determines that the three applicable criteria of 10 CFR 50.46 (2200 °F PCT, 17 percent local
oxidation, and 1 percent core average oxidation) are met with at lease a 95 percent probability
with 95 percent confidence. The method does not specifically determine the limiting values for
each of these three parameters. Rather, a minimum margin to any of the criteria, determined
with 95 percent coverage and a 95 percent confidence is determined. This minimum margin is
reported as demonstrating compliance to the 10 CFR 50.46 criteria. To provide further
guidance as to plant performance against the criteria, the values of the three parameters for the
most limiting cases used to establish the probability and confidence will also be reported.
Appendix B provides examples of the application of the methodology and the reporting of
compliance for three sample plant applications.
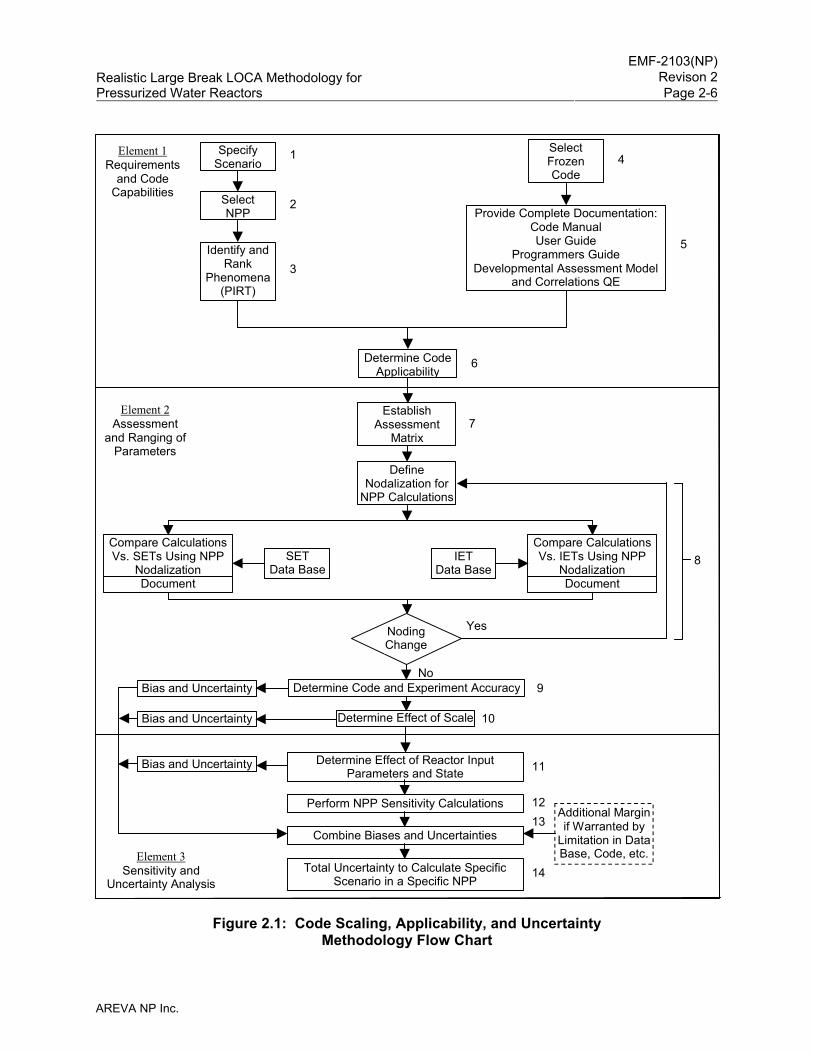
EMF-2103(NP)
Revison 2Realistic Large Break LOCA Methodology for Pressurized Water Reactors Page 2-6
AREVA NP Inc.
Figure 2.1: Code Scaling, Applicability, and Uncertainty
Methodology Flow Chart
Element 1Requirements
and CodeCapabilities
SpecifyScenario
SelectNPP
Identify andRank
Phenomena(PIRT)
SelectFrozenCode
Provide Complete Documentation:Code ManualUser Guide
Programmers GuideDevelopmental Assessment Model
and Correlations QE
Determine CodeApplicability
1
2
3
4
5
6
Element 2Assessment
and Ranging ofParameters
EstablishAssessment
Matrix
DefineNodalization for
NPP Calculations
Compare CalculationsVs. SETs Using NPP
NodalizationDocument
Compare CalculationsVs. IETs Using NPP
NodalizationDocument
SETData Base
IETData Base
NodingChange
7
Yes
NoDetermine Code and Experiment Accuracy
Determine Effect of Scale
Bias and Uncertainty
Bias and Uncertainty
9
10
8
Element 3Sensitivity and
Uncertainty Analysis
Bias and Uncertainty Determine Effect of Reactor InputParameters and State
Perform NPP Sensitivity Calculations
Combine Biases and Uncertainties
Total Uncertainty to Calculate SpecificScenario in a Specific NPP
Additional Marginif Warranted by
Limitation in DataBase, Code, etc.
11
1213
14
EMF-2103(NP)
Revison 2Realistic Large Break LOCA Methodology for Pressurized Water Reactors Page 3-1
AREVA NP Inc.
3.0 Requirements and Code Capabilities
The objective of the first element of the CSAU methodology is to establish the analysis
requirements and to demonstrate the chosen codes can address these requirements. The
important phenomena are determined from the event scenario and NPP types and documented
in the PIRT. The ability of the codes to address the important phenomena must then be
demonstrated. Documents must be developed that contain sufficient detail to permit the code
models to be correlated with the important PIRT phenomena.
3.1 Scenario Specification (CSAU Step 1)
According to the CSAU process, the first step in the construction of a realistic evaluation model
is the identification and description of the event to be evaluated. This is termed the event
scenario. For the modeling described herein, the event is that of a LOCA. A reasonable and
useful definition is provided by the standard review plan for RLBLOCA (Reference 16).
Loss-of-coolant accidents (LOCA) are postulated accidents that would result from the loss of reactor coolant, at a rate in excess of the capability of the normal reactor coolant makeup system, from piping breaks in the reactor coolant pressure boundary. The piping breaks are postulated to occur at various locations and include a spectrum of break sizes, up to a maximum pipe break equivalent in size to the double-ended rupture of the largest pipe in the reactor coolant pressure boundary.
A large break LOCA initiates with an instantaneous rupture of a reactor coolant system (RCS)
pipe, resulting in the rapid loss-of-coolant from the RCS. It is the coolant loss and its
replacement with emergency coolant that is the subject assessment of LBLOCA evaluation
models. Two top level considerations apply to the model presented here:
1. The rupture or break occurs in the RCS piping. Although it is possible to envision ruptures in components, those events are considered beyond the design basis and not subjects for this evaluation model.
2. This evaluation model applies only to the larger possible breaks, break areas greater than 0.1 times the cross-sectional area of the largest flow area pipe within the RCS. Smaller breaks are evaluated with a separate evaluation model.
EMF-2103(NP)
Revison 2Realistic Large Break LOCA Methodology for Pressurized Water Reactors Page 3-2
AREVA NP Inc.
The rate of coolant loss is governed, in part, by the break area, which ranges from 0.1 times the
largest pipe area to twice the area of the pipe within which the rupture occurred. For plants
covered by this evaluation model, the break can occur in three locations:
1. The hot leg pipe between the reactor vessel and the steam generator (hot leg break),
2. The cold leg between the steam generator and the reactor coolant pump (pump suction break), and
3. The cold leg between the reactor coolant pump and the reactor vessel (pump discharge break).
A LBLOCA evaluation must consider breaks at all of these locations. However, as will be
shown in the following text, the pump discharge break comprises the greatest challenge to the
emergency equipment and results in the most severe consequences for the reactor core.
Although a great deal of the modeling herein is applicable to any of the break locations; it is
specific only for pump discharge breaks.
To support the pump discharge as the worst break location, it is useful to describe a simplified
LBLOCA scenario:
The break occurs and substantial RCS coolant is expelled to the containment. The emergency systems are activated and inject replacement coolant into the cold legs between the reactor coolant pump and the reactor vessel. This coolant transfers to the reactor vessel and the core to provide core cooling.
When the break is in the pump discharge piping up to one-third, depending on the plant being
evaluated, of the emergency coolant can flow directly out the break and not provide core
cooling. Because of the design of the RCS loop, this loss can not occur for a hot leg break;
essentially all of the emergency coolant must pass through the reactor vessel, providing core
cooling in the process. Thus, a hot leg break, with its high flooding rate, refills the core with
water sooner than either pump discharge or pump suction breaks and is much less severe.
The relation of a pump suction break to a pump discharge break is similar to that with a hot leg
break in that there is no immediate loss of emergency coolant to the break. Although it is
possible to loose emergency coolant to the break by entrainment, the efficiency of that process
is less than that for a pump discharge break. The resistance to the break from the reactor
vessel is higher for a pump suction break and the resistance from the core outlet through the hot
EMF-2103(NP)
Revison 2Realistic Large Break LOCA Methodology for Pressurized Water Reactors Page 3-3
AREVA NP Inc.
leg pipe connecting to the break is lower, making emergency coolant delivery to the core easier
for pump suction breaks. Therefore, because a pump discharge break more easily discharges
all coolant, particularly liquid coolant, to the containment and is most likely to discharge the
emergency coolant to the break, it can be identified as the worst break location. Accordingly,
the hot leg and pump suction locations can be eliminated from specific consideration within this
methodology.
The following details the progression of the scenario. A LBLOCA event is typically described in
three phases: (1) blowdown, (2) refill, and (3) reflood. For realistic evaluations, the blowdown
phase is defined as the time period from initiation of the break until flow from the accumulators
or safety injection tanks (SITs) begins to discharge. This definition is different than the
traditional definition of blowdown, which extends the blowdown period until the RCS pressure
approaches containment pressure. The blowdown phase typically lasts between 12 to
25 seconds, depending on the break size. The refill phase lasts from the end of blowdown until
a fluid mixture, supported by ECCS water, penetrates the bottom of the active core region. The
reflood phase lasts from the end of refill until the core is quenched.
Following the initiation of the break, the blowdown phase is characterized by a sudden
depressurization from operating pressure down to the saturation pressure of the hot leg fluid.
For larger cold leg breaks, an immediate flow reversal and stagnation occurs in the core due to
flow out the break, which causes the fuel rods to pass through critical heat flux (CHF), usually
within 1 second following the break. Following this initial rapid depressurization, the RCS
depressurizes at a more gradual rate. Reactor trip and emergency injection signals occur when
either the low-pressure setpoint or the containment high-pressure setpoint are reached.
However, for LBLOCA, reactor trip and scram are essentially inconsequential, as reactor
shutdown is accomplished by moderator feedback. During blowdown, core cooling is supported
by the natural evolution of the RCS flow pattern as driven by the break flow.
When the system pressure falls below the accumulator (or SIT) pressure, flow from the
accumulator is injected into the cold legs ending the blowdown period and initiating the refill
period. Once the system pressure falls below the respective shutoff heads of the high head
safety injection (HHSI) pumps and the low head safety injection (LHSI) pumps, and the system
startup time delays are met, Safety Injection System flows begin injecting into the RCS. While
some of the ECCS flow bypasses the core and goes directly out of the break, the downcomer
EMF-2103(NP)
Revison 2Realistic Large Break LOCA Methodology for Pressurized Water Reactors Page 3-4
AREVA NP Inc.
and lower plenum gradually refill until the mixture in the lower head and lower plenum regions
reaches the bottom of the active core and the reflood period begins. Core cooling is supported
by the natural evolution of the RCS flow pattern as driven by the break flow and condensation
on the emergency coolant being injected. Towards the end of the refill period, heat transfer
from the fuel rods is relative low, steam cooling and rod-to-rod radiation being the primary
mechanisms.
Once the lower plenum is refilled to the bottom of the fuel rod heated length, refill ends and the
reflood phase begins. Substantial ECCS fluid was retained in the downcomer during refill. This
provides the driving head to move coolant into the core. As the mixture level moves up the
core, steam is generated and liquid is entrained, providing cooling in the upper core regions. As
the two-phase mixture expands into the upper plenum, some liquid may deentrain and flow
downward back into the cooler core regions. The remaining entrained liquid passes into the
steam generators where it vaporizes, adding to the steam that must be discharged through the
break and out of the system. The difficulty of venting steam is, in general, referred to as steam
binding. It acts to impede core reflood rates. With the initiation of reflood, a quench front starts
to progress up the core. With the advancement of the quench front, the cooling in the upper
regions of the core increases, eventually arresting the rise in fuel rod surface temperatures.
Later the core is quenched and a pool cooling process is established that can maintain the
cladding temperature near saturation, so long as the ECCS provides makeup for the boiling.
The RLBLOCA methodology must analyze the probable and possible consequences of the
scenario (a LBLOCA at the pump discharge) and determine the plant will meet the
10 CFR 50.46 criteria, as discussed in Section 2.1, with high probability.
3.2 Nuclear Power Plant Selection (CSAU Step 2)
The selected NPP types to which the methodology is to be applied include those PWRs with
U-tube type steam generators and initial ECCS injection into the cold legs. The specific plant
types are enumerated in Section 1.0. These NPP types have similar hot and cold legs,
pressurizers, steam generators, and vessels. The largest difference among the NPP types is
the number of hot and cold legs, and steam generators. However, experience in the
performance of LBLOCA analyses for these NPPs has shown that all three types behave
similarly.
EMF-2103(NP)
Revison 2Realistic Large Break LOCA Methodology for Pressurized Water Reactors Page 3-5
AREVA NP Inc.
All of these NPP types have inverted U-tube steam generators; a pressurizer connected to a hot
leg; and initially injects ECCS coolant into the cold legs. The steam generators can all be
modeled with downcomer, boiler, plenum, dryer/separator, and steam dome regions. The
pressurizers are essentially the same and can be modeled with axial nodes, associated heat
structures, heaters, sprays, and a surge line connected to a hot leg. The plant nodalization for a
loop is described in Section 4.2 and is illustrated in Figure 4.1.
The configuration of the vessels for all three-plant types is also essentially the same and can be
modeled in the code with the same major divisions and nodalization schemes. The coolant
enters the vessel through the inlet nozzles and flows into the downcomer. In the downcomer, a
small fraction of the flow diverts into the upper head, but the majority of the flow goes down the
downcomer (for upflow plants) into the lower head/plenum region.1 From here the majority of
the flow goes up through the active core with some flow bypassing the core through the baffle
and guide tubes. From the core, the flow enters the upper plenum and exits the vessel through
the hot leg nozzles.
The principal difference in the vessels is in the connection between the downcomer and the
lower plenum/lower head. In some CE designs, there may be a flow skirt that is intended to
force part of the flow to pass through the lower head before going into the lower plenum region.
The NPP model of the lower plenum has been nodalized to address this vessel configuration
difference. The plant nodalization for the vessel is described in Section 4.2 and illustrated in
Figure 4.4.
As indicated above, a principle difference between these NPP types is in the number of hot and
cold legs, and steam generators. The Westinghouse and AREVA 3-loop designs have three hot
legs, cold legs and steam generators. The Westinghouse and AREVA 4-loop designs have four
hot legs, cold legs, and steam generators. CE 2x4 designs have two hot legs, four cold legs
and two steam generators.
1 For down flow baffle plants, the flow into the downcomer splits, with some flow going into the bypass region and
the remainder of the flow continuing down the downcomer. In this plant configuration, the downcomer and bypass flow both enter the core.
EMF-2103(NP)
Revison 2Realistic Large Break LOCA Methodology for Pressurized Water Reactors Page 3-6
AREVA NP Inc.
A typical vessel loop configuration is shown in Figure 4.5. This figure shows the location of the
cold legs (arrows pointing into vessel) and hot legs (arrows pointing out of vessel) for the three
NPP types. Since the hot legs pass through the vessel downcomer region into the upper
plenum, they essentially provide a flow path blockage at the elevation of the hot and cold legs in
all three NPP types. As illustrated in this figure, the flow paths for the 4-loop and the 2x4 plants
are similar in relation to their hot and cold legs.
Provided in Appendix B are sample problems for a Westinghouse 4-loop PWR design, a
Westinghouse 3-Loop PWR design, and a CE 2x4 PWR design. Table B.9, Table B.18, and
Table B.27 provide values for some of the important NPP parameters. As illustrated, a major
difference in the important NPP parameters is the accumulator pressure for the Westinghouse
and AREVA designs, and the SITs in the CE designs. The impact of this difference is shown in
the sequence of events given in Table B.14, Table B.23, and Table B.33, where the SIT flow
initiation is delayed in the CE design until the pressure in the cold legs drops below the SIT
pressure. Taking into account this delay in the SIT delivery, the sequence of events is similar
for all three of the NPP types.
3.3 Phenomena Identification and Ranking, PIRT (CSAU Step 3)
A key step in the CSAU process is to identify and rank the important phenomena that should be
addressed in analyzing the selected scenario. This step is performed by experts who are
knowledgeable regarding LBLOCA phenomena that occur during each transient phase. The
resultant PIRT provides the basis for: (1) determining code applicability (does the code properly
model the important phenomena); (2) establishing the assessment matrix (identifying test data
that contain the appropriate phenomena during each accident phase); and (3) identifying
phenomenological parameters to be ranged and quantified for evaluating uncertainties.
The AREVA PIRT for the chosen scenario has evolved through multiple stages of review
(including experts within AREVA and from outside the company) and adjustment. Its foundation
includes an independently developed PIRT (Reference 2), review and development by an
expert panel (including experts both within AREVA and from outside the company), and
adjustments or updates to incorporate improved understanding of the phenomena. Table 3.1
provides the current version upon which Revision 2 of this methodology is based. Each
phenomena is given a ranking, where importance is proportional to the numerical value (e.g.,
EMF-2103(NP)
Revison 2Realistic Large Break LOCA Methodology for Pressurized Water Reactors Page 3-7
AREVA NP Inc.
9 = extreme importance and 1 = least importance). The ranking indicates the important
phenomena that should be simulated by a RLBLOCA evaluation model.
The following definitions apply to the PIRT in Table 3.1:
1. Blowdown: The blowdown phase of the LOCA is defined as the time period from initiation of
the break until flow from the accumulators or safety injection tanks begins.
2. Refill: The refill phase of the LOCA begins when the accumulators or SITs begin injecting
and continues until the mixture level in the vessel refills the lower plenum and begins to flow
into the heated core region.
3. Reflood: The reflood phase of the transient begins when the lower plenum fills and
emergency core cooling (ECC) begins flowing into the bottom of the active core and
continues until the temperature transient throughout the core has been terminated. At that
time, the LOCA stored energy and decay heat are being removed and the LOCA has been
reduced to an issue of maintaining long-term cooling.
The following items were revised or added to the EMF-2103(P)(A) Revision 0 final PIRT:
• Fuel rod, stored energy - Increased from Level 2 to a Level 5 importance during refill.
Higher energy within the pellet will affect cladding temperatures during this period, which
may, for some plants with capable ECCS systems, become the peak cladding
temperature (PCT).
• Upper head, initial temperature - Increased to a Level 5 during refill. It is possible for
water within the upper head of a Westinghouse designed Tcold plant to suspend and
dump during refill potentially reducing the cladding temperatures.
• Hot leg,entrainment/deentrainment - Increased from Level 5 to a Level 6 during reflood
to better reflect its potential impact on steam binding.
• Pressurizer, early blowdown quench – Reduced from Level 5 to Level 3 to reflect the
importance attributed to this issue in the final Revision 0 methodology.
• Cold leg, condensation during pumped injection - Separated from the accumulator
injection to reflect the effect that heating the ECCS injection water closer to saturation
EMF-2103(NP)
Revison 2Realistic Large Break LOCA Methodology for Pressurized Water Reactors Page 3-8
AREVA NP Inc.
would have on downcomer boiling during reflood after accumulator injection ended. This
item was rated as importance level 7 during reflood as compared to the combined
accumulator pumped injection reflood rating of Level 5 in Revision 0.
• Downcomer, multi-D phenomena - Increased from Level 2 to Level 5 during reflood to
better capture the importance of downcomer nodalization on code stability.
• Downcomer, saturated nucleate boiling - Increased from Level 2 to Level 7 during
reflood to capture the importance of downcomer boiling on the prediction of the scenario
for high power plants with low pressure containments.
• Break, containment pressure – Decreased from Level 7 to Level 6 to better reflect the
sensitivity of the scenario to changes in break backpressure during refill and reflood.
3.4 Frozen Code Version Selection (CSAU Step 4)
The codes selected for use in the RLBLOCA methodology include the RODEX3A
(References 7, 8, and 9) and COPERNIC2 (Reference 10) fuel performance codes, and
S-RELAP5 (References 5, 11, 12, and 13) for system analysis. RODEX3A will be used to set
the initial fuel temperatures for the evaluation of Zircaloy-clad fuel and COPERNIC2 will be used
for M5®. The S-RELAP5 code is a RELAP5-based thermal-hydraulic system code used for
performing LOCA and non-LOCA analyses. The versions of these codes used in the
development of this methodology are UOCT09 for S-RELAP5, UDEC02 for COPERNIC2 and
UFEB07 for RODEX3A.
3.4.1 COPERNIC2 and RODEX3A Fuel Rod Performance Codes
A key to a RLBLOCA analysis is the model used for calculating fuel rod performance. In
particular, the initial operating temperature of the fuel pellets (stored energy), the internal fuel
rod gas pressure, and the transient gap conductance are significant parameters, which affect
the calculated PCT. AREVA will use COPERNIC2 to calculate the required fuel characteristics
as a function of fuel rod exposure and power history except for Zircaloy-clad fuel for which
RODEX3A will be used. This particular arrangement is necessary since the use of
COPERNIC2 is restricted to M5® cladding. This restriction is not due to limitations in the
physical models in the code, but is rather based on SER restrictions associated with the current
EMF-2103(NP)
Revison 2Realistic Large Break LOCA Methodology for Pressurized Water Reactors Page 3-9
AREVA NP Inc.
NRC approval of COPERNIC2. The physical models in COPERNIC2 could be extended for use
with Zircaloy cladding, and some of the validation of the code (the Loss of Fluid Test (LOFT)
assessments in Section 4.3.2.1) was based on test results using Zircaloy cladding.
The COPERNIC2 and RODEX3A fuel rod performance codes were originally developed and
NRC-approved for use by AREVA with respect to fuel rod mechanical design. Portions of these
codes were incorporated in S-RELAP5 to permit coupled calculations of fuel rod thermal
properties (thermal conductivity, heat capacity, and gap conductance), during both the
steady-state and the transient phases of an S-RELAP5 LBLOCA analysis. The COPERNIC2
and RODEX3A (Reference 11, Sections 7.5 and 7.3, respectively) routines incorporated into
S-RELAP5 were for the calculation of fuel pellet temperature, thermal expansion, cladding
elastic strain, gap width and gap gas pressure, which in turn determine the fuel rod thermal
properties and gap conductance. Table 3.2 provides a description of the models and routines
incorporated into S-RELAP5.
Long-term burnup dependent “permanent” fuel rod effects such as pellet densification and
swelling, cladding creep, and fission gas release will not change appreciably during the course
of a LBLOCA transient. Calculations of these effects are performed to initialize the fuel rod
parameters, but are not altered during the transient and, thus, not included in the fuel rod model
routines in S-RELAP5. The fuel pellet and cladding strains associated with these “permanent”
effects are calculated in separate executions of the standalone COPERNIC2 or RODEX3A
codes (which burn the fuel rods through the exposure histories required for the individual rods
being analyzed). The results of these exposure analyses are then transferred to S-RELAP5 and
used to initialize the values of the burnup dependent “permanent” effects in the COPERNIC2 or
RODEX3A routines.
The fuel rod analysis for an S-RELAP5-based LBLOCA calculation then proceeds in three
steps:
1. The standalone fuel rod code (COPERNIC2 or RODEX3A) is used to determine fuel rod properties at the end of a specified exposure history.
2. An S-RELAP5 steady-state analysis is performed using the fuel rod models in S-RELAP5, with the permanent burnup dependent fuel properties being defined by data transferred from Step 1. During this steady-state analysis, power related properties such as fuel
EMF-2103(NP)
Revison 2Realistic Large Break LOCA Methodology for Pressurized Water Reactors Page 3-10
AREVA NP Inc.
temperatures and thermal properties are allowed to migrate to values consistent with the final steady-state power of the system. The initial transient stored energy is determined and adjusted for uncertainty and bias during this phase.
3. An S-RELAP5 transient analysis is performed using initial fuel rod thermal conditions from Step 2, and using the fuel rod models in S-RELAP5 to determine fuel rod thermal properties and gap conductance during the transient.
3.4.2 S-RELAP5
S-RELAP5 is an AREVA-modified version of RELAP5/MOD2 (Reference 17), which
incorporates the computer portability aspects of RELAP5/MOD3 (Reference 18) and
modifications to the constitutive package to provide congruency with literature correlations and
to improve the simulation of key LBLOCA experiments. The field equations are basically in the
same form as RELAP5/MOD2 with the addition of full two-dimensional momentum equations.
This two-dimensional capability is only applied to the downcomer, core and upper plenum
regions in the RLBLOCA methodology, but can be applied anywhere in the reactor system
through input. The S-RELAP5 code structure was modified to be essentially the same as
RELAP5/MOD3. The coding for reactor kinetics, control systems, and trip systems was also
replaced by that from RELAP5/MOD3.
The following list summarizes the major modifications and improvements incorporated into
S-RELAP5 relative to RELAP5/MOD2:
• Multi-dimensional Capability: A full two-dimensional treatment was added to the
hydrodynamic field equations.
• Energy Equations: The energy equations were modified to better conserve energies
transported into and out of a control volume.
• Numerical Solution of Hydrodynamic Field Equations: The reduction of the hydrodynamic
finite-difference equations to a pressure equation is obtained analytically in S-RELAP5.
• State of Steam-Noncondensible Mixture: The state relations were modified to correctly
simulate accumulator depressurization and to prevent code failures during the period of
accumulator ECC water injection.
EMF-2103(NP)
Revison 2Realistic Large Break LOCA Methodology for Pressurized Water Reactors Page 3-11
AREVA NP Inc.
• Hydrodynamic Constitutive Models: Significant modifications and enhancements were
made to the interphase friction and interphase mass transfer models.
• Choked Flow: The computation of the equation of state at the choked plane was modified.
• Countercurrent Flow Limiting: A Bankoff form correlation was implemented, which can be
reduced to either a Wallis type or Kutateladze type countercurrent flow limitation (CCFL)
correlation.
• Component Models: A revised two-phase pump degradation model based on Electric
Power Research Institute (EPRI) data was implemented.
• Fuel Model: Initial fuel conditions are supplied by either COPERNIC2 or RODEX3A. To be
consistent, the fuel deformation and conductivity models from both of these codes have
been included in S-RELAP5.
• Containment Back Pressure: ICECON coding and subroutines were placed in S-RELAP5 to
a cocurrent containment pressure calculations.
To provide a realistic time variant containment boundary condition for break flow calculations,
the coding for ICECON was essentially inserted as a subroutine into S-RELAP5. Break flows
and enthalpies are transferred to the containment routines, which continuously feed back
calculated pressure and temperature to S-RELAP5 time dependent volumes, against which the
break flows are calculated. ICECON (References 14 and 15) is based on CONTEMPT LT-022
(Reference 19). ICECON was originally approved for calculating a conservative containment
back pressure under Appendix K rules, but it can also be used with realistic input, and only
minor modifications, to give an approximate realistic back pressure calculation. AREVA
performed sensitivity calculations to evaluate the effects of containment back pressure. The
results showed that, although the RLBLOCA model does not demonstrate a high sensitivity of
calculated PCT to containment back pressure, there is a slight impact on cladding temperatures.
Therefore, the containment back pressure calculation is designed to provide a reasonable, yet
slightly conservative, approximation to the containment pressure.
3.5 Provision of Complete Code Documentation (CSAU Step 5)
The documentation for the codes used in the development of this methodology is provided in
References 7, 8, and 9 for the RODEX3A code, Reference 10 for COPERNIC2, References 5,
EMF-2103(NP)
Revison 2Realistic Large Break LOCA Methodology for Pressurized Water Reactors Page 3-12
AREVA NP Inc.
11, 12, and 13 for the S-RELAP5 code, and References 14 and 15 for the ICECON code. The
documentation describes the models and correlations used in the codes; defines the code
inputs and provides a description of the code structure. These documents were verified against
the actual coding to ensure the documentation and coding are consistent (Reference 5).
The code validation is provided in Reference 5, which compares the code predictions to
measured data in a number of SET and IET facilities. In addition, AREVA has guidelines
covering the development of S-RELAP5 input for the NPP model and procedures for performing
an actual analysis.
3.6 Determination of Code Applicability (CSAU Step 6)
The objective of the determination and code applicability step of CSAU is to demonstrate that
the selected codes are capable of modeling the chosen event for all NPP types. This is
accomplished by comparing the event and important phenomena identified in the PIRT with the
models and correlations documents for the selected codes. Four attributes are needed to make
this comparison:
• Field equations that provide code capability to address global processes.
• Closure (constitutive) equations, which support the conservation equations by providing
code capability to model and scale specific phenomena or processes.
• Code numerics that demonstrate code capability to perform calculations efficiently and
reliably.
• Structure and nodalization, which address code capability to model the NPP geometry
and components, and to provide efficient and accurate NPP predictions.
These four attributes are discussed in the following sections.
3.6.1 Field Equations
The field equations (conservation of mass, momentum, and energy) must possess the capability
of simulating each of the distinct phases (blowdown, refill, and reflood) of a LBLOCA. During
the refill and reflood phases, countercurrent flow occurs at various locations in the RCS, and
subcooled liquid coexists with superheated steam in parts of the reactor core. Therefore, for
realistic analyses, the field equations must be non-homogeneous (unequal velocity for each
EMF-2103(NP)
Revison 2Realistic Large Break LOCA Methodology for Pressurized Water Reactors Page 3-13
AREVA NP Inc.
phase) and non-equilibrium (unequal temperature for each phase). The presence of nitrogen in
the accumulator requires an additional field equation to model and track the movement of this
noncondensible gas.
The required field equations are given in Table 3.3. The relationships to specific PIRT-important
phenomena along with references to specific models are provided in Table 3.4. As indicated in
Table 3.3 and Table 3.4, the S-RELAP5 code has the required field equations and models to
address the important LBLOCA phenomena.
3.6.2 Closure Equations
Closure equations (constitutive models and correlations) are required to support the basic field
equations. The closure equations are essential for modeling the processes and phenomena
given in the PIRT (see Table 3.1). The S-RELAP5 constitutive models and correlations are
presented in Reference 11. The verification and validation of the code models and correlations
are given in Reference 5. The two documents together demonstrate that the S-RELAP5 code
adequately simulates LBLOCA events with a high level of confidence.
The capability of the S-RELAP5 code closure equations to meet the requirements of the PIRT
(see Table 3.1) is summarized in Table 3.3. The closure equations address wall friction,
interphase friction, mass transfer (interphase heat transfer), wall-to-fluid heat transfer,
form-losses, and similar functions. The various models require flow regime maps, boiling
curves, state relationships, and fluid and material properties for completeness. As indicated in
Table 3.3, the S-RELAP5 code has the required closure equations to address the important
LBLOCA phenomena.
3.6.3 Code Numerics
The numerical solutions contained in S-RELAP5 were extensively tested and checked
(Reference 11, Section 2.6). For the RLBLOCA methodology, the adequacy of S-RELAP5
numerics is demonstrated in the performance of the assessments reported in Reference 5 and
summarized in Section 4.3 herein. In addition, the adequacy of the numerics was also
demonstrated by the time step sensitivity analysis reported in Appendix A.
EMF-2103(NP)
Revison 2Realistic Large Break LOCA Methodology for Pressurized Water Reactors Page 3-14
AREVA NP Inc.
3.6.4 Structure and Nodalization
To properly model a NPP, a code must be able to adequately model the important components
and control systems of the NPP with respect to the chosen accident scenario. The S-RELAP5
code has the ability, as indicated in Table 3.4,(Reference 11), to model all the major
components and associated control systems of the reference plants (listed in Section 1.0). The
modeling of each of the NPP components is discussed in detail in AREVA guidelines and
summarized in Section 4.2. Section 4.2 also describes the studies that were performed to
determine the final plant nodalization.

EMF-2103(NP)
Revison 2Realistic Large Break LOCA Methodology for Pressurized Water Reactors Page 3-15
AREVA NP Inc.
Table 3.1: Phenomena Identification and Ranking Table for PWR LBLOCA
EMF-2103(NP)
Revison 2Realistic Large Break LOCA Methodology for Pressurized Water Reactors Page 3-16
AREVA NP Inc.
Table 3.1: Phenomena Identification and Ranking Table for PWR LBLOCA (continued)
EMF-2103(NP)
Revison 2Realistic Large Break LOCA Methodology for Pressurized Water Reactors Page 3-17
AREVA NP Inc.
Table 3.2: Models Added to S-RELAP5 from COPERNIC2 and RODEX3A
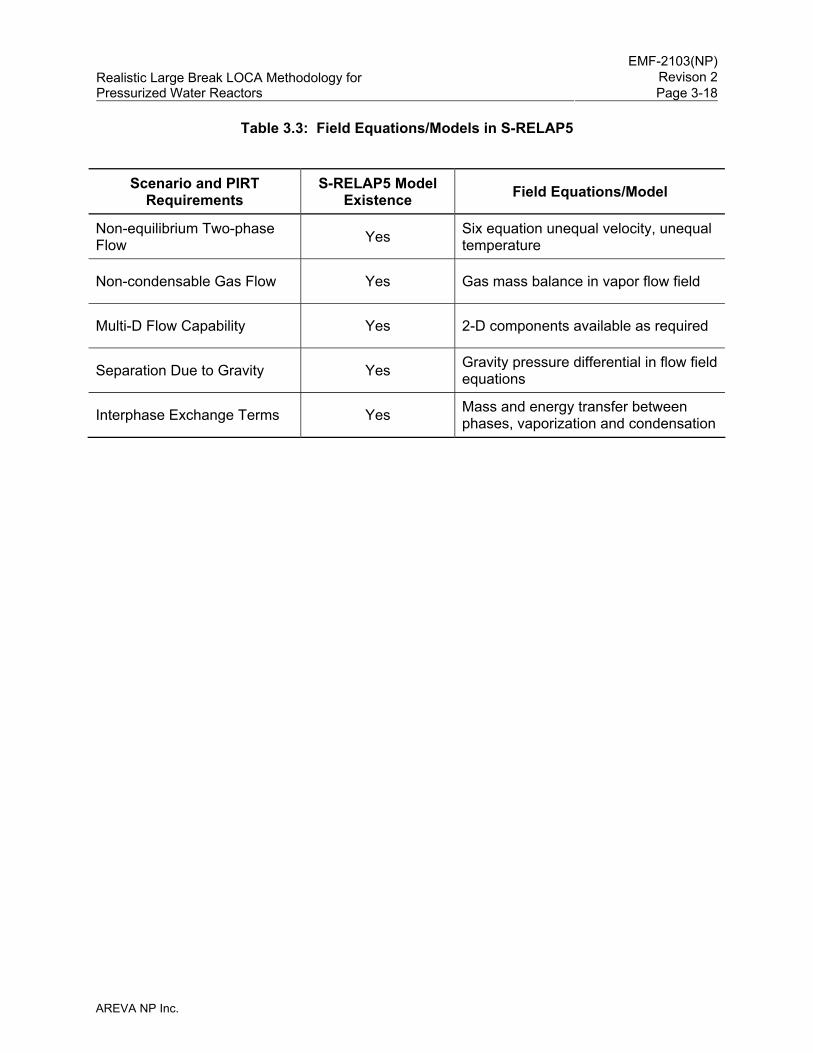
EMF-2103(NP)
Revison 2Realistic Large Break LOCA Methodology for Pressurized Water Reactors Page 3-18
AREVA NP Inc.
Table 3.3: Field Equations/Models in S-RELAP5
Scenario and PIRT Requirements
S-RELAP5 Model Existence Field Equations/Model
Non-equilibrium Two-phase Flow Yes Six equation unequal velocity, unequal
temperature
Non-condensable Gas Flow Yes Gas mass balance in vapor flow field
Multi-D Flow Capability Yes 2-D components available as required
Separation Due to Gravity Yes Gravity pressure differential in flow field equations
Interphase Exchange Terms Yes Mass and energy transfer between phases, vaporization and condensation
EMF-2103(NP)
Revison 2Realistic Large Break LOCA Methodology for Pressurized Water Reactors Page 3-19
AREVA NP Inc.
Table 3.4: Phenomena/Processes in S-RELAP5
EMF-2103(NP)
Revison 2Realistic Large Break LOCA Methodology for Pressurized Water Reactors Page 3-20
AREVA NP Inc.
Table 3.4: Phenomena/Processes in S-RELAP5 (continued)

EMF-2103(NP)
Revison 2Realistic Large Break LOCA Methodology for Pressurized Water Reactors Page 3-21
AREVA NP Inc.
Table 3.4: Phenomena/Processes in S-RELAP5 (continued)
EMF-2103(NP)
Revison 2Realistic Large Break LOCA Methodology for Pressurized Water Reactors Page 3-22
AREVA NP Inc.
Table 3.4: Phenomena/Processes in S-RELAP5 (continued)
EMF-2103(NP)
Revison 2Realistic Large Break LOCA Methodology for Pressurized Water Reactors Page 4-1
AREVA NP Inc.
4.0 Assessment and Ranging of Parameters
The assessment and ranging of parameters element establishes the assessment matrix to be
used in defining the NPP nodalization, quantifying the code accuracy, and demonstrating any
code or model scale effects.
4.1 Establishment of Assessment Matrix (CSAU Step 7)
The following four considerations are taken into account in establishing the assessment matrix.
The first consideration is the important phenomena identified in the PIRT process described in
Section 3.3 (CSAU Step 3) and presented in Table 3.1. The assessment matrix, Table 4.2,
includes experiments that address the important phenomena, defined as those phenomena
ranked 5 or higher in Table 3.1. The selected experiments must have sufficient data to
determine code accuracy, including bias and uncertainty, for the important phenomena.
The second consideration is that of NPP nodalization. Here experiments are selected that are
representative of the types of NPPs being addressed and cover the identified phases of the
selected scenario. Thus, for this application, experiments are selected that are representative
of Westinghouse/AREVA 3- and 4-loop designs and CE 2x4 designs. The experiments also
should cover one or more of the LBLOCA phases identified in Section 3.1 (CSAU Step 1)—
blowdown, refill, and reflood.
The third consideration is to demonstrate that the code and NPP nodalization have the ability to
scale from experiments of different sizes to a full size NPP for which analyses will be performed.
Generally this is done by selecting a number of assessments in facilities of different scale and
demonstrating that the code and NPP nodalization are capable of consistently predicting the
experimental data from all the experiments.
The fourth and final consideration is with respect to compensating code errors. The
development process embodies substantial methodology verification and validation. The use of
a PIRT process and the benchmarking of the methodology during validation against
experiments chosen to measure the methodology performance regarding the PIRT phenomena
provide substantial assurance that compensating errors do not significantly impact the
methodology predictions. These tests include both SETs and IETs dealing with the most
EMF-2103(NP)
Revison 2Realistic Large Break LOCA Methodology for Pressurized Water Reactors Page 4-2
AREVA NP Inc.
important LOCA phenomena. With a comprehensive set of such benchmarks setting the validity
and final assessment of the methodology, it can be concluded that if the methodology contains
compensating errors, these errors do not impugn the ability of the methodology to reliably
predict the course and outcome of LBLOCA transients.
4.1.1 PIRT Considerations
The PIRT presented in Section 3.0 (see Table 3.1) provides a qualitative expression of what is
perceived to be the degree of importance of key phenomena present in a LBLOCA. All these
phenomena are accounted for either statistically or with a bias (perhaps a null bias), and a
justification for the selected treatment is provided. Within Revision 0 of this methodology,
sensitivity studies were used, in part, to determine which phenomena or processes required
assessment by the validation matrix. However, once a decision to validate the treatment of a
phenomena or process is made, the process by which the decision was made is no longer of
consequence unless the decision is changed. In that case, a revised decision process and
result must be described and justified. The Revision 2 validation matrix includes all of the
phenomena or processes selected for validation in Revision 0 and will not repeat the discussion
of sensitivity studies for those parameters, phenomena, or processes. An accounting, including
PIRT revisions made in Revision 2, of the validation matrix is made in Table 4.1. Where an item
ranked 5 or higher is not included in the validation matrix, an explanation, sensitivity study or
other, is provided in Table 4.1 and Section 4.3.3.1 to justify the exclusion.
Table 4.1 lists the moderate and high ranked PIRT phenomena or processes (ranked five or
higher) and the analytical parameters that primarily affect them. These are then cross
referenced to the decision on including them in the validation matrix or the reason for exclusion.
If a sensitivity study is part of the justification, the conclusion from the study is also provided.
The final entry includes the reference section within which additional discussion is provided.
4.1.2 Nodalization Considerations
In the selection of the specific tests to be analyzed in each test facility, plant nodalization was an
important consideration and, given the extensive experimental facility database developed,
provided considerable support for that selected for plant modeling. One additional test facility
was identified strictly to address nodalization effects. That test facility was the Slab Core Test
EMF-2103(NP)
Revison 2Realistic Large Break LOCA Methodology for Pressurized Water Reactors Page 4-3
AREVA NP Inc.
Facility (SCTF), where specific assessments were performed to address radial nodalization with
variations in radial power distributions.
4.1.3 Scaling Considerations
Within the test facility database developed to support the PIRT considerations are facilities that
span a scaling range of 1:1500 to 1:1. In addition, some specific tests were performed as a
counterpart to tests performed in other facilities. Where data are available, these tests were
added to the assessment matrix.
4.1.4 Compensating Errors
The issue of compensating errors arises primarily from the use of correlations and closure
relations in the code. The interaction of the various correlations and closure relations can be
such that an error in one of these models is compensated for by an error in another model.
These compensating errors can result in the code being able to predict specific tests but
incapable of predicting other tests. For the LBLOCA, only those compensating errors, which
could function in one manner in the assessments and in an entirely different manner in the
LBLOCA, are a concern. Thus, the assessment matrix must include tests that can be scaled up
and that cover the range of the LBLOCA PIRT phenomena. The compensating error issue is
addressed in the test matrix through the FLECHT-SEASET, SCTF, CCTF, and THTF for the
core phenomena and Upper Plenum Test Facility (UPTF) for most of the other major RCS
components. The LOFT and Semiscale benchmarks provide further assurance by
benchmarking the methodology as an integral.
4.1.5 Summary
Given these four considerations, the assessment matrix described in Table 4.2 was developed.
Table 4.2 lists the test facilities, the actual tests analyzed from each test facility, and the
associated phenomena being examined.

EMF-2103(NP)
Revison 2Realistic Large Break LOCA Methodology for Pressurized Water Reactors Page 4-4
AREVA NP Inc.
Table 4.1: Validation Needs for Important PIRT Entries

EMF-2103(NP)
Revison 2Realistic Large Break LOCA Methodology for Pressurized Water Reactors Page 4-5
AREVA NP Inc.
Table 4.1: Validation Needs for Important PIRT Entries (continued)

EMF-2103(NP)
Revison 2Realistic Large Break LOCA Methodology for Pressurized Water Reactors Page 4-6
AREVA NP Inc.
Table 4.1: Validation Needs for Important PIRT Entries (continued)

EMF-2103(NP)
Revison 2Realistic Large Break LOCA Methodology for Pressurized Water Reactors Page 4-7
AREVA NP Inc.
Table 4.2: Assessment Matrix Tests and Phenomena Addressed

EMF-2103(NP)
Revison 2Realistic Large Break LOCA Methodology for Pressurized Water Reactors Page 4-8
AREVA NP Inc.
Table 4.2: Assessment Matrix Tests and Phenomena Addressed (continued)
EMF-2103(NP)
Revison 2Realistic Large Break LOCA Methodology for Pressurized Water Reactors Page 4-9
AREVA NP Inc.
4.2 Define Nodalization for NPP Calculations (CSAU Step 8)
Reference 4 ("Quantifying Reactor Safety Margins") makes the following statements regarding
nodalization:
The plant model must be nodalized finely enough to represent both the important phenomena and design characteristics of the NPP but coarsely enough to remain economical.
Thus, the preferred path is to establish a standard NPP nodalization for the subsequent analysis. This minimizes or removes nodalization, and the freedom to manipulate noding, as a contributor to uncertainty.
Therefore, a nodalization selection procedure defines the minimum noding needed to capture the important phenomena. This procedure starts with analyst experience in previous code assessment and application studies and any documented nodalization studies. Next, nodalization studies are performed during the simulation of separate- and integral-effects code data comparisons. Finally, an iterative process using the NPP model is employed to determine sufficiency of the NPP model nodalization.
Given these general recommendations, the goal of a nodalization methodology is to optimize
somewhat independent priorities. These include preserving dominant phenomena, minimizing
code uncertainty, conforming to design characteristics, and minimizing computational expense.
The AREVA RLBLOCA guidelines are quantitatively explicit wherever possible to remove
nodalization as a contributor to uncertainty. Because not all plants of the same type are
identical, the guidelines provide guidance for deriving the appropriate nodalization. This
strategy serves both to remove nodalization as a contributor to uncertainty and to define a
method for automating the generation of input for a RLBLOCA analysis.
As described by Step 8 of the CSAU process, this task is iterative and was so during
development of Revision 0 (Reference 6) of the methodology. Revision 2 of the methodology
initiates the basic nodalization with the Revision 0 model and improves it, in selected areas,
based on studies, described later in this section. Because the nodalization requirements are
strictly applied, uncertainty associated with nodalization becomes part of the studies to
determine the statistics of key uncertainty parameters.
The derived input prescription defines the standardized nodalization scheme, specifies a logical
numbering system, and recommends key parameter inputs for the S-RELAP5 input model.
Noding details were determined from experience with simulation of integral- and
separate-effects tests (Reference 5) that result in a technically and economically sound
EMF-2103(NP)
Revison 2Realistic Large Break LOCA Methodology for Pressurized Water Reactors Page 4-10
AREVA NP Inc.
nodalization scheme for simulating LBLOCA in a PWR. Assessment calculations of the
FLECHT-SEASET reflood experiments provide data for the axial nodalization of the core region.
Studies of the Cylindrical Core Test Facility (CCTF) and SCTF were used to identify
two-dimensional modeling techniques for the downcomer and core. Analyses of the LOFT and
Semiscale experiments gave information describing the primary coolant loops, reactor coolant
pumps, reactor vessel, and steam generators. Assessments of UPTF tests also were used to
identify two-dimensional modeling techniques and provide useful plant information, including
experimental data on full-scale downcomer fluid behavior during all phases of a LBLOCA.
Column 1 of Table 4.3 defines a particular NPP component or coolant system region and the
S-RELAP5 components generally used for its simulation. Column 2 lists the important
phenomena associated with the component as evaluated through the PIRT process
(Section 3.3). Column 3 defines the number of cells required, based on user experience and
assessment calculations, to provide adequate detail.
4.2.1 Nodalization Methodology
The necessary conditions for a satisfactory nodalization methodology are to discriminate key
structural characteristics, to obtain reasonable steady-state agreement with plant data, to
preserve first order accuracy of dominant phenomena, and to minimize PCT sensitivity to
nodalization. The ability of the code and associated nodalization to describe key structural
components is addressed in Section 3.6.4, where it is demonstrated that the code is capable of
modeling key components. Obtaining reasonable steady-state results is implicitly aided by strict
conformance to structural design characteristics (e.g., elevations and volumes).
The most challenging of the necessary conditions is the task to preserve dominant phenomena.
The ability of a computer code to capture LBLOCA phenomena cannot separate the
contributions of the applicable phenomenological models and nodalization. While it was stated
that strict adherence to nodalization transfers the burden of code uncertainty to the uncertainty
analysis of key LBLOCA parameters, every effort was made to provide a nodalization scheme
that minimizes nodalization uncertainty.
Experience indicates that S-RELAP5 plant models of Westinghouse/AREVA 3- and 4-loop
PWRs and CE 2x4 loop PWRs require between 200 and 500 volume component nodes,
junction flow paths, and heat structures. The AREVA 3- and 4- loop plants closely pattern the
EMF-2103(NP)
Revison 2Realistic Large Break LOCA Methodology for Pressurized Water Reactors Page 4-11
AREVA NP Inc.
Westinghouse 3- and 4- loop plants and do not require separate nodalization schemes. The
following figures show the modeling techniques.
Figure 4.1: Sample Loop Nodalization for NPP
Figure 4.2: Sample Steam Generator Secondary Nodalization for NPP
Figure 4.3: Double-Ended Guillotine and Split Break Nodalization
Figure 4.4: Sample Reactor Vessel Nodalization for NPP
Figure 4.5: Westinghouse/AREVA 3- and 4-Loop and CE 2x4 Plant Vessel Downcomer Configurations
Figure 4.6: NPP Core Nodalization
Figure 4.7: Sample NPP Upper Plenum Nodalization – Axial Plane
Figure 4.8: Sample NPP Upper Plenum Nodalization – Cross-Sectional Plane
The following sections discuss the nodalization of each major plant component in the context of
the PIRT (Section 3.3), and describe the evolution of the nodalization schemes.
4.2.2 Numerical Considerations
The nodalization of a particular model translates into a computational array used to solve the
mass, momentum, and energy equations; thus, numerical constraints also must be considered
in the sizing and configuration of component volumes. The primary numerical issues are
accuracy, numerical stability, and code variability. While optimizing all three of these is
necessary to have useable results, some code variability can be tolerated provided it is
reasonably defined. However, numerical stability must be assured before performing production
calculations to assess accuracy through code/data comparisons.
In general, the RELAP5 series of codes have a solid foundation regarding numerical stability.
This is discussed in Reference 11. However, both nodalization and time step decisions can
influence numerical stability. It is generally understood that numerical solutions are well
behaved if the number of mesh points is sufficiently small. Such small nodes necessitate
equally small time steps to satisfy the Courant stability requirement, leading to long
uneconomical code execution times. Conversely, it was shown that modeling interfacial drag
contributes to the stability of coarser mesh models for two-phase flow codes, such as RELAP5
EMF-2103(NP)
Revison 2Realistic Large Break LOCA Methodology for Pressurized Water Reactors Page 4-12
AREVA NP Inc.
(Reference 20). While modeling interfacial drag works to destabilize the solution for small mesh
sizes, it supports the courser mesh models required for economical code execution times. As a
result, considering hydraulic phenomena exclusively, spatial mesh configuration is not a high
concern for numerical stability.
For code accuracy, mesh sizing becomes more important for heated surfaces. Steep
temperature gradients influence the adjacent fluid conditions. For this reason, small mesh sizes
are used on heated surfaces to capture expected phenomena.
The final figure-of-merit for quantifying code variability comes from the calculation of the hot rod
PCT. For a set of equivalent input models, differing only in time step (constrained to be less
than the Courant limit), comparisons of PCT traces can be used to evaluate expected code
variability. By using this approach, nodalization decisions can be made in an effort to minimize
the impact of code variability.
In summary, the iteration process for defining a nodalization methodology included decisions to
change a component nodalization based on the analysis of either assessments (integral- and
separate-effects) or plant sensitivity studies. These calculative results were generally used to
confirm the adequacy of a chosen nodalization scheme.
4.2.3 Loop Model
The loop includes those components outside the reactor vessel, including the pressurizer and
ECCS. All loops are modeled individually (i.e., the unbroken loops are not lumped into a single
combined loop). Each loop models the hot leg piping, steam generator primary and secondary
fluid volume and heat transfer, pump suction piping, and pump discharge cold leg piping. Each
loop also contains modeling of the accumulator, and high- and low-pressure injection ECCSs.
The nodalization scheme is presented in Figure 4.1 for a sample loop with the pressurizer.
The following are key features and assumptions for the reactor coolant loops.
EMF-2103(NP)
Revison 2Realistic Large Break LOCA Methodology for Pressurized Water Reactors Page 4-13
AREVA NP Inc.
• The nodalization detail for the coolant loops, pressurizer, and primary and secondary sides of the steam generators was selected to give consistent results.
Assessment of loop nodalization comes from various facility test programs, including SCTF,
CCTF, LOFT, Semiscale, and UPTF. In addition, the Westinghouse/EPRI 1/3 Scale
Steam/Water tests, a separate-effects test examining ECC mixing in the cold leg, is also a
useful assessment. Acceptance of nodalization schemes was based on the general agreement
in code/data comparisons for pressures, differential pressures, mass flow rates, and heat
structure temperatures.
4.2.3.1 Hot Leg
The hot leg connects the reactor vessel to the steam generator inlet plenum. [
] The entrainment of droplets from the reactor vessel
will enhance the effect of steam binding, which inhibits reflood. Code-to-data comparisons of
tests performed at the CCTF and the UPTF (Sections 4.3.1.12 and 4.3.1.11.3, respectively)
show that S-RELAP5 predicts entrainment between the reactor vessel and the steam generator
inlet plenum accurately to a slight overprediction. This is acceptable because the result will be a
reasonable to slightly conservative simulation of steam binding and its impact on cladding
temperature.
EMF-2103(NP)
Revison 2Realistic Large Break LOCA Methodology for Pressurized Water Reactors Page 4-14
AREVA NP Inc.
4.2.3.2 Steam Generator
The steam generator nodalization scheme is essentially identical to the traditional approach
used by other large thermal-hydraulic codes such as TRAC and RELAP5 (References 4 and 21,
respectively). [
]
The dominant phenomena of importance are the steady-state heat balance and steam binding
during reflood. Heat balance is ensured by the use of control systems controlling feed water
and steam flow depending on steam generator inventory. Benchmark simulations of the CCTF
tests (Section 4.3.1.12) showed S-RELAP5 conservatively estimates the steam binding effect in
the steam generator tubes. Therefore, the nodalization scheme is acceptable.
4.2.3.3 Pump Suction
[
]
EMF-2103(NP)
Revison 2Realistic Large Break LOCA Methodology for Pressurized Water Reactors Page 4-15
AREVA NP Inc.
4.2.3.4 Reactor Coolant Pump
The pump is a component model, meaning that the pump physics is independent of
nodalization; hence, the primary objective of the nodalization scheme is to ensure consistency
with the structural characteristics. [
]
4.2.3.5 Cold Leg and Break
The cold leg extends from the RCS pump discharge to, and including, the reactor vessel inlet
nozzle. [
] The break model is either a
double-ended guillotine with discharge from both cold leg volumes or a split with discharge from
both cold leg volumes. The difference between the guillotine and the split is that the flow path
between the two cold leg volumes at the break plane is preserved for a split break and closed
for a guillotine break. The noding configuration for the two break types is shown in Figure 4.3.
[
]
EMF-2103(NP)
Revison 2Realistic Large Break LOCA Methodology for Pressurized Water Reactors Page 4-16
AREVA NP Inc.
Condensation driven by the cold ECCS water coming in contact with steam is also a primary
phenomenological concern for cold leg modeling. This parameter was identified as a key
uncertainty parameter for RLBLOCA and any nodalization dependence is absorbed within the
assessment that quantifies this uncertainty.
4.2.3.6 ECCS
The ECCS includes models for the accumulator and the piping connecting it to the RCS with
sufficient detail to allow the code to accurately predict coolant flow splits for low-pressure
injection flows. Figure 4.1 includes a typical nodalization for the ECCS of a three-loop plant.
The accumulators are the dominant component in the ECCS. [
]
The dominant phenomena of importance are the accumulator liquid discharge, the pumped
injection rate, and the noncondensible gas transport following accumulator liquid discharge.
Activity in the accumulator lines can be characterized as a period of single-phase
incompressible flow (accumulator water discharge) followed by a two-phase mixture; nitrogen
from the accumulator and water from the low pressure injection system. Noncondensible gas
transport to the cold leg can continue for several seconds after the end of liquid discharge and
may, for some events, be limited by critical flow. The nitrogen in the accumulator will transport
from the accumulator to the RCS by gas expansion and pressure forces. Dissolved nitrogen will
come out of solution as the system pressure decreases.
4.2.3.7 Pressurizer
The pressurizer vessel is modeled with [
] The dominant phenomena of interest are early lower core quench
and critical flow in the surge line. Neither phenomenon shows much sensitivity to nodalization
EMF-2103(NP)
Revison 2Realistic Large Break LOCA Methodology for Pressurized Water Reactors Page 4-17
AREVA NP Inc.
because the surge line remains choked during the period in which these concerns are important
(blowdown).
4.2.4 Reactor Vessel Model
The key components of the reactor vessel are the downcomer, lower head and plenum, core,
and upper head and plenum. The nodalization is presented in Figure 4.4. The key features and
assumptions for the reactor vessel are:
4.2.4.1 Downcomer
The reactor downcomer is modeled using [
]
EMF-2103(NP)
Revison 2Realistic Large Break LOCA Methodology for Pressurized Water Reactors Page 4-18
AREVA NP Inc.
For asymmetric cold and hot leg connections to the reactor vessel, the only practical
nodalization option is [
]
The dominant downcomer LBLOCA phenomena (condensation, hot wall effects,
multi-dimensional flow, CCFL, and entrainment) affect the refill period. These phenomena
primarily influence the duration of ECCS bypass. The hot wall effect is conservatively treated by
forcing nucleate boiling for any portion of the downcomer in contact with water.
The UPTF Test 6 (Section 4.3.1.11.1) experiments investigated the countercurrent flow of
steam, reactor coolant and ECC water in the downcomer during the refill phase for a 4-loop
PWR LOCA and were used to validate the downcomer nodalization.
A downcomer noding sensitivity study was also done on a 4-loop plant model. The base
modeling comprises [
] . The
conclusion from the study was that the lower plenum refill is relatively insensitive to downcomer
nodalization for uniform ECC water injection into all intact loops.
[
] This improvement to the axial and azimuthal noding density
gives a well converged model of the downcomer, which captures relevant geometric features.
4.2.4.2 Lower Vessel
The lower vessel includes all volumes [
]
EMF-2103(NP)
Revison 2Realistic Large Break LOCA Methodology for Pressurized Water Reactors Page 4-19
AREVA NP Inc.
• [
]
The dominant nodalization-influenced LBLOCA phenomena of importance are liquid sweep-out
and steam water mixture content as the plant approaches the bottom of core recovery. The
nodalization of the lower vessel region is shown in Figure 4.4. As demonstrated in the
UPTF Test 6 assessment (Section 4.3.1.11.1), the calculation of the sweep-out phenomenon is
conservatively overpredicted.
4.2.4.3 Core, Core Bypass, and Fuel
The core region extends from the bottom of the active core to the top of the upper core support
plate. [
]
The most important contributor to nodalization sensitivity is expected to be core nodalization
because it directly affects the liquid distribution in the core. The key phenomena of importance
influenced by nodalization are the heat transfer modes, entrainment/deentrainment,
multi-dimensional flow, stored energy, oxidation, core power distribution, and decay heat. Since
the heat transfer modes, entrainment/deentrainment, hot region power, decay heat and stored

EMF-2103(NP)
Revison 2Realistic Large Break LOCA Methodology for Pressurized Water Reactors Page 4-20
AREVA NP Inc.
energy are treated statistically, adequate representation of multi-dimensional flow phenomenon
is of prime relevance for nodalization.
Given the expense of moving to a finer nodalization, the axial nodalization was defined in the
range of [ ] . The node lengths are the smallest defined for the S-RELAP5 plant model; hence, they will
define the Courant limit.
[
]
EMF-2103(NP)
Revison 2Realistic Large Break LOCA Methodology for Pressurized Water Reactors Page 4-21
AREVA NP Inc.
4.2.4.4 Upper Plenum/Upper Head
The upper plenum region extends from the top of the upper core support plate to the core
support ledge in the vessel wall (the bottom of the upper head wall). [
]
The dominant phenomena of importance are entrainment/deentrainment, fallback (CCFL), and
upper head temperature. The entrainment phenomenon is considered in the same manner as it
was for the hot legs. The upper head temperature is treated statistically. [
] This
configuration captures the preference for fallback to colder assemblies as demonstrated in the
plant sample problems (Appendix B), showing a general conservatism in the treatment of liquid
fallback.
In many plants, flow asymmetry into the upper plenum can exist. Flow can either travel directly
into the upper plenum or be forced through a support column or mixer vane nozzle and then
deposited in the middle of the upper plenum. [
] The configuration is necessary to
allow for the possibility that the hot assembly is beneath a standpipe or mixer vane nozzle. For
EMF-2103(NP)
Revison 2Realistic Large Break LOCA Methodology for Pressurized Water Reactors Page 4-22
AREVA NP Inc.
plants without mixer vane nozzles, only a single TOODEE component (again with a 3x3
geometry) is employed.
4.2.5 Containment Model
Nodalization of the containment for the RLBLOCA is defined in a separate input file from the
normal S-RELAP5 input. The containment model input is equivalent to the input used for the
ICECON code (Reference 14), which is the AREVA proprietary version of the CONTEMPT code
(Reference 19). ICECON was incorporated as a routine in S-RELAP5. The S-RELAP5 input
file contains a link between the S-RELAP5 input and the ICECON input. [
] S-RELAP5 drives the
containment calculations with mass flow and enthalpy, and the ICECON subroutines return
containment pressure and temperature to update the S-RELAP5 time-dependent volumes.
Because the ICECON model provides only containment pressure and temperature for
S-RELAP5, a simple model is adequate. For a dry containment, the ICECON model is a single
volume representing the containment space within the inner steel liner. This simple model is
also used for annular or sub-atmospheric containments. For an ice condenser containment, the
model has four volumes: (1) the lower compartment containing the reactor primary coolant
system; the upper compartment containing the refueling channel, (2) refueling equipment and
polar cranes; (3) the ice chest containing borated ice for condensing steam discharged to the
containment; and (4) the dead-end volume containing the auxiliary pipe tunnel, the fan
accumulator compartments and the instrument room.
The dominant parameter of interest related to the containment model is containment pressure.
The goal of the modeling is to provide a reasonable prediction that remains responsive to the
industry held perception that lower containment pressures increase steam binding and restrict
the reflooding process buy imposing higher steam specific volumes. Three modeling concepts
assure this:
1. The heat structure modeling is in line with the recommendations of NUREG-0800
Branch Technical Position 6.2 (Reference 16). This assures that the interior heat
absorbing structures are modeled with recognition of the probable best-estimate
characterization.
EMF-2103(NP)
Revison 2Realistic Large Break LOCA Methodology for Pressurized Water Reactors Page 4-23
AREVA NP Inc.
2. The containment condensing heat transfer is a practical bound of benchmark data for
ten experiments. Although the benchmarks were conducted using GOTHIC
(Reference 68, Figure 5-42, page 5-48), the result was the establishment of a
benchmark data set for the condensing heat transfer coefficient to the Uchida
correlation. [
]
3. The containment volume is treated statistically by ranging from its best-estimate value to
the maximum possible free volume within the containment exterior walls. The free
volume is a major determinant in establishing the containment pressure. This volume
can not be larger than the volume within the outer containment walls. Because the
volume within the outer walls is easy to compute, the use of this volume as an upper
bound to the free volume assures that a reasonable-to-conservative volume is applied.
The combination of these three factors provides assurance that the containment pressure
applied in the RLBLOCA calculation is conservative but not so much so as to seriously bias the
results.
4.2.6 Plant Model Summary
The nodalization described in this section was developed by applying the approach described in
Reference 4. This nodalization development methodology was an iterative approach. The base
nodalization originated through experience gained by RELAP5 users at the Idaho National
Engineering Laboratory and by ANF-RELAP and S-RELAP5 users at AREVA. The nodalization
was refined from both plant and code assessment tests, which used the same nodalization and
modeling choices as in the full NPP model for those portions of the assessment model that
would affect the phenomena being examined.
The uncertainty associated with the nodalization is considered minimal and is subsumed in the
uncertainties determined for key LBLOCA parameters because, to the extent possible, the NPP
nodalization was used in determining those uncertainties.

EMF-2103(NP)
Revison 2Realistic Large Break LOCA Methodology for Pressurized Water Reactors Page 4-24
AREVA NP Inc.
Table 4.3: Large Break LOCA Nodalization

Realistic Large Break LOCA Methodology forPressurized Water Reactors
Figure 4.1: Sample Loop Nodalization for NPP
AREVA NP Inc.
EMF-2103(NP)Revison 2Page 4-25
Realistic Large Break LOCA Methodology forPressurized Water Reactors
EMF-2103(NP)Revison 2Page 4-26
Figure 4.2: Sample Steam Generator Secondary Nodalization forNPP
AREVA NP Inc.
Realistic Large Break LOCA Methodology forPressurized Water Reactors
EMF-2103(NP)Revison 2Page 4-27
Figure 4.3: Double-Ended Guillotine and Split Break Nodalization
AREVA NP Inc.
Realistic Large Break LOCA Methodology forPressurized Water Reactors
Figure 4.4: Sample Reactor Vessel Nodalization for NPP
AREVA NP Inc.
EMF-2103(NP)Revison 2Page 4-28
Realistic Large Break LOCA Methodology forPressurized Water Reactors
EMF-2103(NP)Revison 2Page 4-29
Figure 4.5: Westinghouse/AREVA 3- and 4-Loop and CE 2x4 PlantVessel Downcomer Configurations
AREVA NP Inc.
Realistic Large Break LOCA Methodology forPressurized Water Reactors
Figure 4.6: NPP Core Nodalization
AREVA NP Inc.
EMF-2103(NP)Revison 2Page 4-30
Realistic Large Break LOCA Methodology forPressurized Water Reactors
EMF-2103(NP)Revison 2Page 4-31
Figure 4.7: Sample NPP Upper Plenum Nodalization - Axial Plane
AREVA NP Inc.

Realistic Large Break LOCA Methodology forPressurized Water Reactors
Figure 4.8: Sample NPP Upper Plenum Nodalization Cross-Sectional Plane
AREVA NP Inc.
EMF-2103(NP)Revison 2Page 4-32
EMF-2103(NP)
Revison 2Realistic Large Break LOCA Methodology for Pressurized Water Reactors Page 4-33
AREVA NP Inc.
4.3 Determine Code and Experimental Accuracy (CSAU Step 9)
This section provides the evaluation of the code assessments reported in Reference 5 with
respect to the RLBLOCA methodology. The code assessments from Reference 5 applicable to
the RLBLOCA methodology are those discussed in Section 4.1 and listed in the assessment
matrix, Table 4.2. These assessments were chosen to address the important PIRT phenomena
identified in Table 3.1. The cross correlation between assessments and PIRT phenomena is
provided in Table 4.2. In addition, some assessments were chosen to address issues of code
scalability; these assessments and the discussion with respect to scalability are provided in
Section 4.4.
One purpose of the assessments is to determine the capability of S-RELAP5 to predict the
important phenomena in large-scale PWR systems. Section 4.2 discussed the appropriate
nodalization to represent PWR system components. For the assessment results to apply to
large-scale PWRs, the nodalization used in the assessments must be consistent with the
large-scale plant nodalization in the regions where the phenomena are being assessed. As far
as possible, AREVA used the plant nodalization described in Section 4.2, Table 4.3, and
internal S-RELAP5 input guidelines to derive assessment nodalizations which are consistent
with the PWR application nodalization. However, unique features of small-scale facilities can
require deviations from the guidelines. The detailed nodalizations for the experimental facility
assessments are given for each assessment in Reference 5. For the most part, the assessment
nodalizations are consistent with the plant application, and where deviations were made, the
reasons for the deviations and the effects on results are discussed.
4.3.1 Separate Effects Tests
SETs from numerous different facilities were used to assess the capabilities of the S-RELAP5
methodology to predict LOCA and transient phenomena. The detailed results comparing
calculations against measured test data are given in the S-RELAP5 code verification and
validation report, Reference 5. The SET assessments in Reference 5 also provide the
information necessary to assess code capability for the RLBLOCA methodology. Detailed
results from Reference 5 will be summarized herein with respect to the LBLOCA phenomena
addressed. Table 4.2 shows the SET facilities, the tests selected, and the PIRT phenomena to
be addressed.
EMF-2103(NP)
Revison 2Realistic Large Break LOCA Methodology for Pressurized Water Reactors Page 4-34
AREVA NP Inc.
4.3.1.1 THTF Heat Transfer
The Oak Ridge National Laboratory (ORNL) thermal-hydraulic test facility (THTF) was used to
perform numerous heat transfer tests using full-length electrically heated fuel rod simulators.
The facility, tests, and assessments are detailed in Section 3.1 of Reference 5. The
assessment tests consisted of numerous steady-state film boiling tests, transient boiloff tests,
and reflood tests. [
]
The THTF is a high-pressure, thermal-hydraulic loop designed as a tool for heat transfer
studies. The test section consists of a simulated fuel bundle placed inside a cylindrical pipe with
inlet and outlet plena. There is no flow in the annular region between the test bundle and the
test section barrel. The test bundle is, in terms of geometry, quite similar to an 8x8 segment of
a Westinghouse 17x17 fuel design and is instrumented with a large number of thermocouples.
The simulated fuel rods consist of a central heating element, thermocouples, and simulated
cladding. The heating element is a nickel alloy, the electrical insulation is boron nitride, and the
outer sheath is stainless steel.
The S-RELAP5 model for the THTF test bundle was a single rod with a flow channel and heat
structures appropriate for single channel with volumes attached to the inlet and outlet to apply
the flow, inlet temperature, and pressure boundary conditions. The model used 6 inch nodes
since bulging and rupture are not an issue for these tests (they use heater rods to simulate the
core). [
] Each of the test cases were evaluated using the appropriate boundary conditions
associated with the test cases. The pressures ranged from 300 to 2100 psia.
EMF-2103(NP)
Revison 2Realistic Large Break LOCA Methodology for Pressurized Water Reactors Page 4-35
AREVA NP Inc.
[
]
Overall the results of the S-RELAP5 transient test predictions [
] are acceptable. In the bulk of the cases, the uncertainties for the HTC
bias were sufficient to make the data and the predictions agree. For reflood cases that had data
outside the predicted range, the predictions by S-RELAP5 were conservative. [
]
The CHF bias developed in this analysis is applied to all RLBLOCA NPP calculations. The
development of the bias and the uncertainty for post-CHF heat transfer is presented in
Section 4.3.3.2.
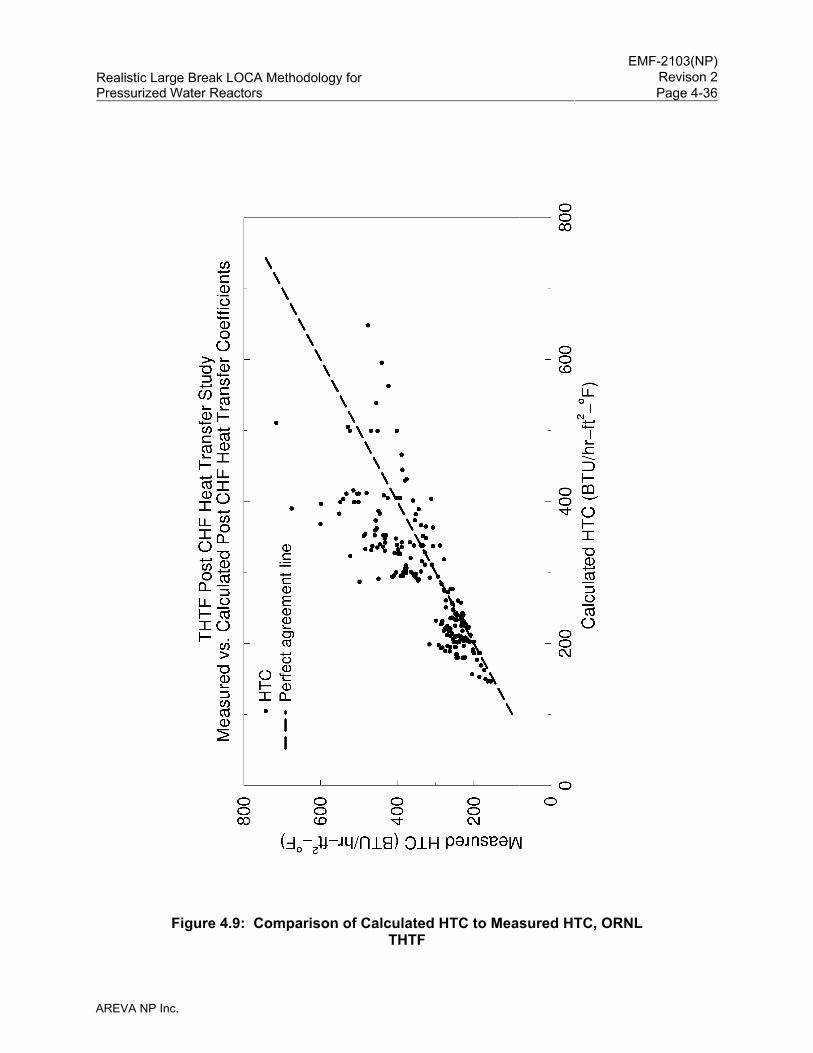
EMF-2103(NP)
Revison 2Realistic Large Break LOCA Methodology for Pressurized Water Reactors Page 4-36
AREVA NP Inc.
Figure 4.9: Comparison of Calculated HTC to Measured HTC, ORNL THTF
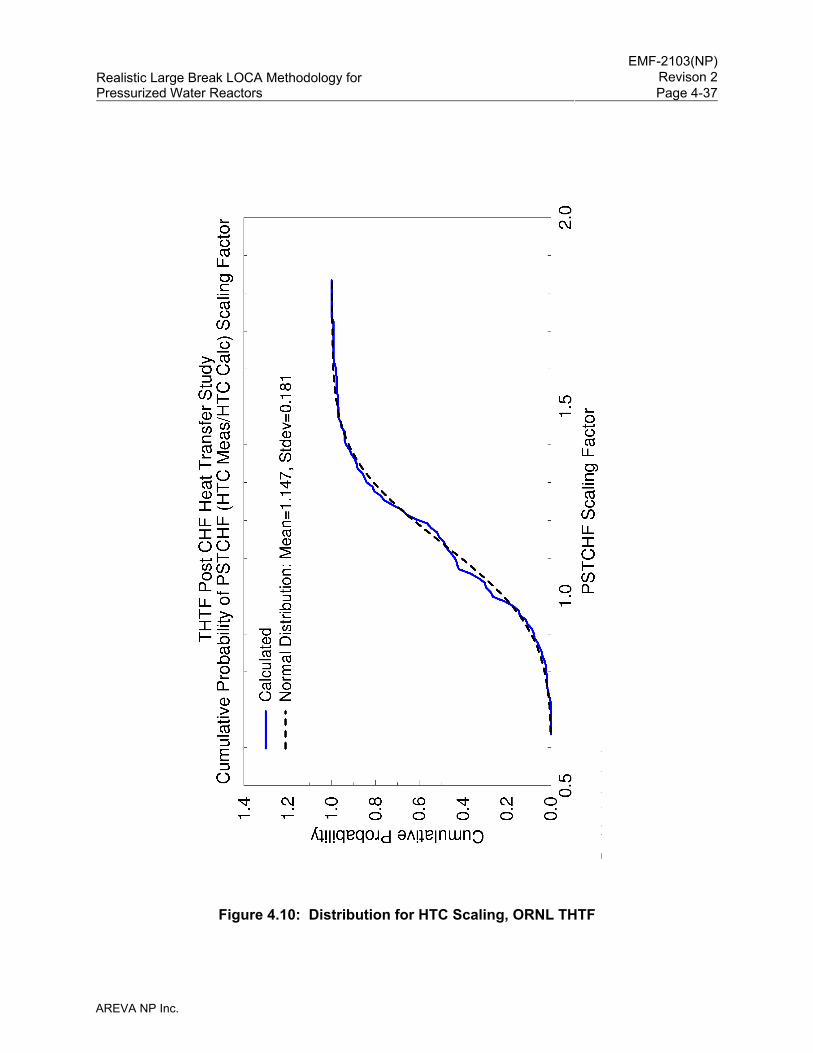
EMF-2103(NP)
Revison 2Realistic Large Break LOCA Methodology for Pressurized Water Reactors Page 4-37
AREVA NP Inc.
Figure 4.10: Distribution for HTC Scaling, ORNL THTF
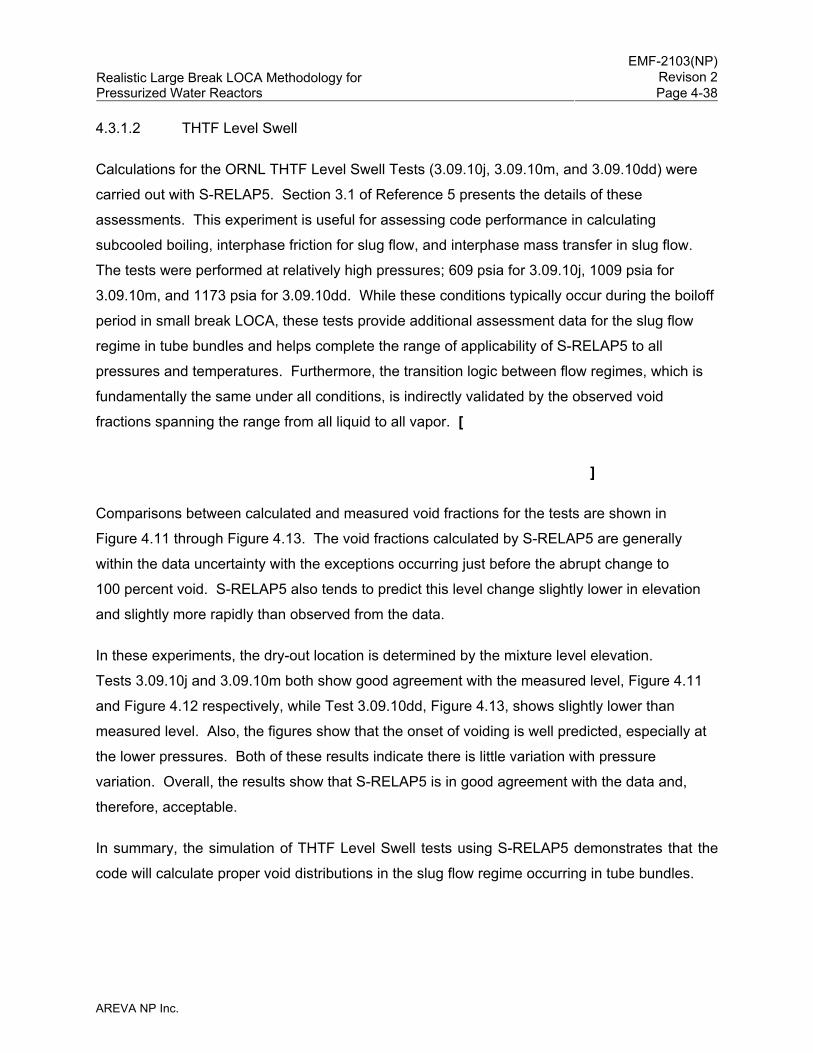
EMF-2103(NP)
Revison 2Realistic Large Break LOCA Methodology for Pressurized Water Reactors Page 4-38
AREVA NP Inc.
4.3.1.2 THTF Level Swell
Calculations for the ORNL THTF Level Swell Tests (3.09.10j, 3.09.10m, and 3.09.10dd) were
carried out with S-RELAP5. Section 3.1 of Reference 5 presents the details of these
assessments. This experiment is useful for assessing code performance in calculating
subcooled boiling, interphase friction for slug flow, and interphase mass transfer in slug flow.
The tests were performed at relatively high pressures; 609 psia for 3.09.10j, 1009 psia for
3.09.10m, and 1173 psia for 3.09.10dd. While these conditions typically occur during the boiloff
period in small break LOCA, these tests provide additional assessment data for the slug flow
regime in tube bundles and helps complete the range of applicability of S-RELAP5 to all
pressures and temperatures. Furthermore, the transition logic between flow regimes, which is
fundamentally the same under all conditions, is indirectly validated by the observed void
fractions spanning the range from all liquid to all vapor. [
]
Comparisons between calculated and measured void fractions for the tests are shown in
Figure 4.11 through Figure 4.13. The void fractions calculated by S-RELAP5 are generally
within the data uncertainty with the exceptions occurring just before the abrupt change to
100 percent void. S-RELAP5 also tends to predict this level change slightly lower in elevation
and slightly more rapidly than observed from the data.
In these experiments, the dry-out location is determined by the mixture level elevation.
Tests 3.09.10j and 3.09.10m both show good agreement with the measured level, Figure 4.11
and Figure 4.12 respectively, while Test 3.09.10dd, Figure 4.13, shows slightly lower than
measured level. Also, the figures show that the onset of voiding is well predicted, especially at
the lower pressures. Both of these results indicate there is little variation with pressure
variation. Overall, the results show that S-RELAP5 is in good agreement with the data and,
therefore, acceptable.
In summary, the simulation of THTF Level Swell tests using S-RELAP5 demonstrates that the
code will calculate proper void distributions in the slug flow regime occurring in tube bundles.
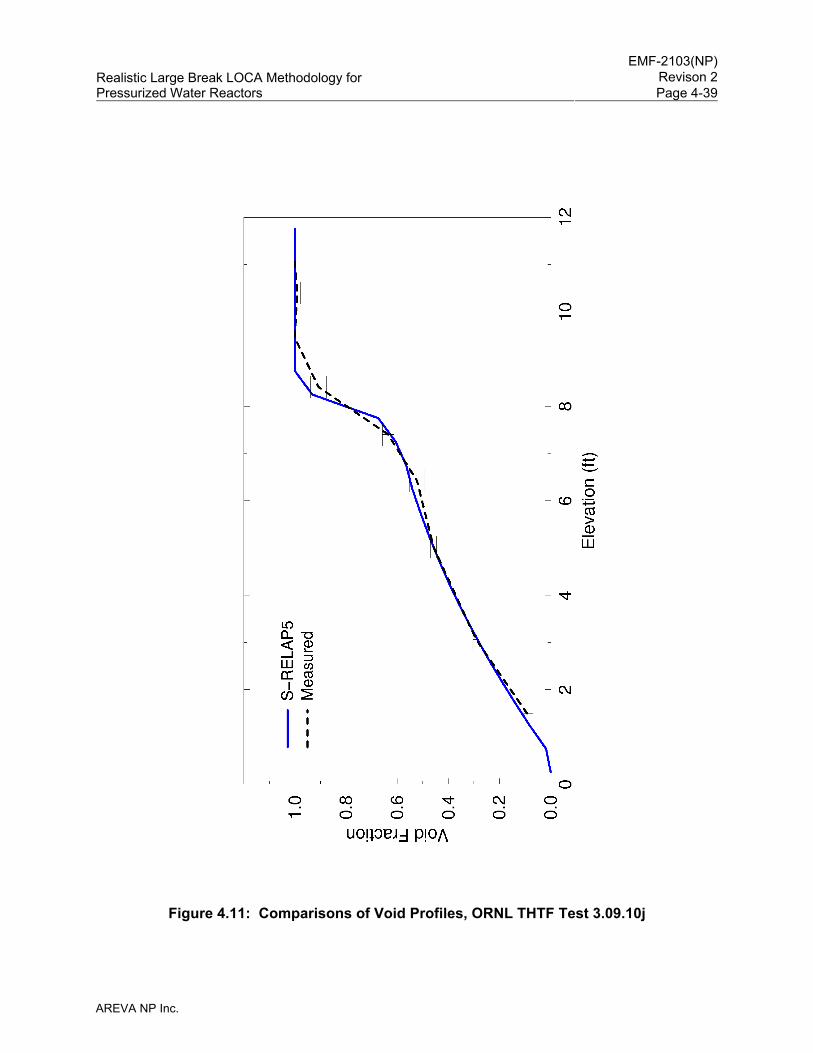
EMF-2103(NP)
Revison 2Realistic Large Break LOCA Methodology for Pressurized Water Reactors Page 4-39
AREVA NP Inc.
Figure 4.11: Comparisons of Void Profiles, ORNL THTF Test 3.09.10j
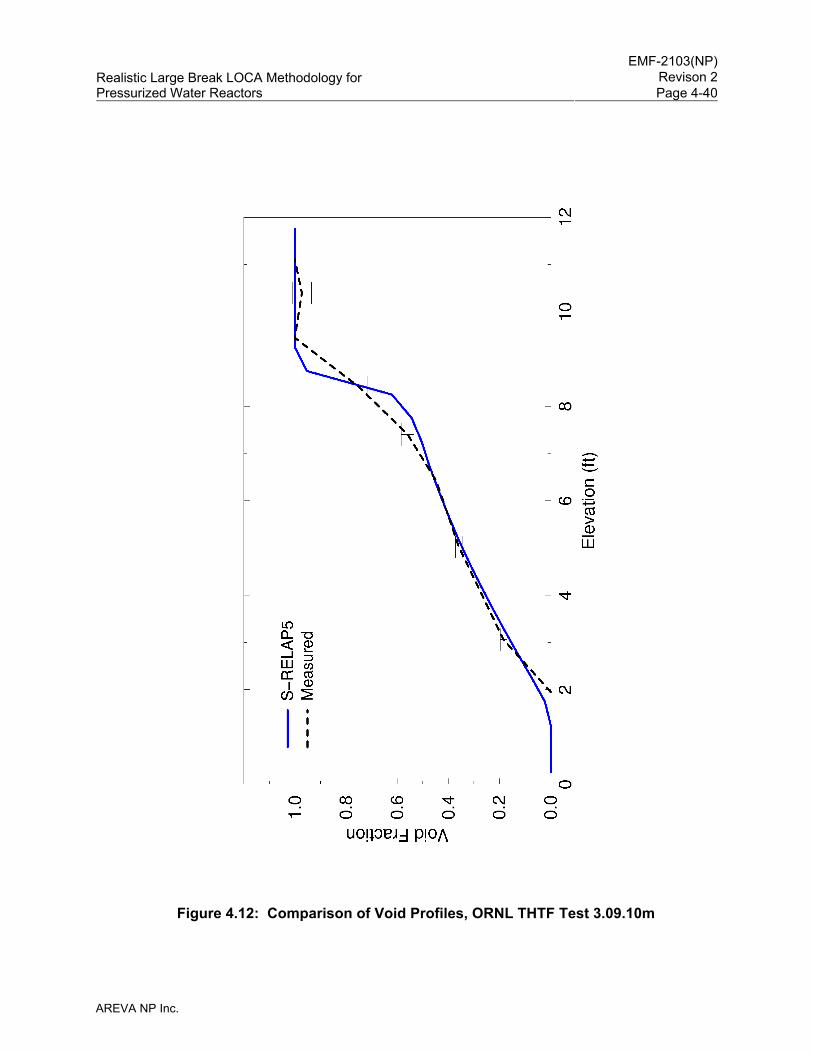
EMF-2103(NP)
Revison 2Realistic Large Break LOCA Methodology for Pressurized Water Reactors Page 4-40
AREVA NP Inc.
Figure 4.12: Comparison of Void Profiles, ORNL THTF Test 3.09.10m
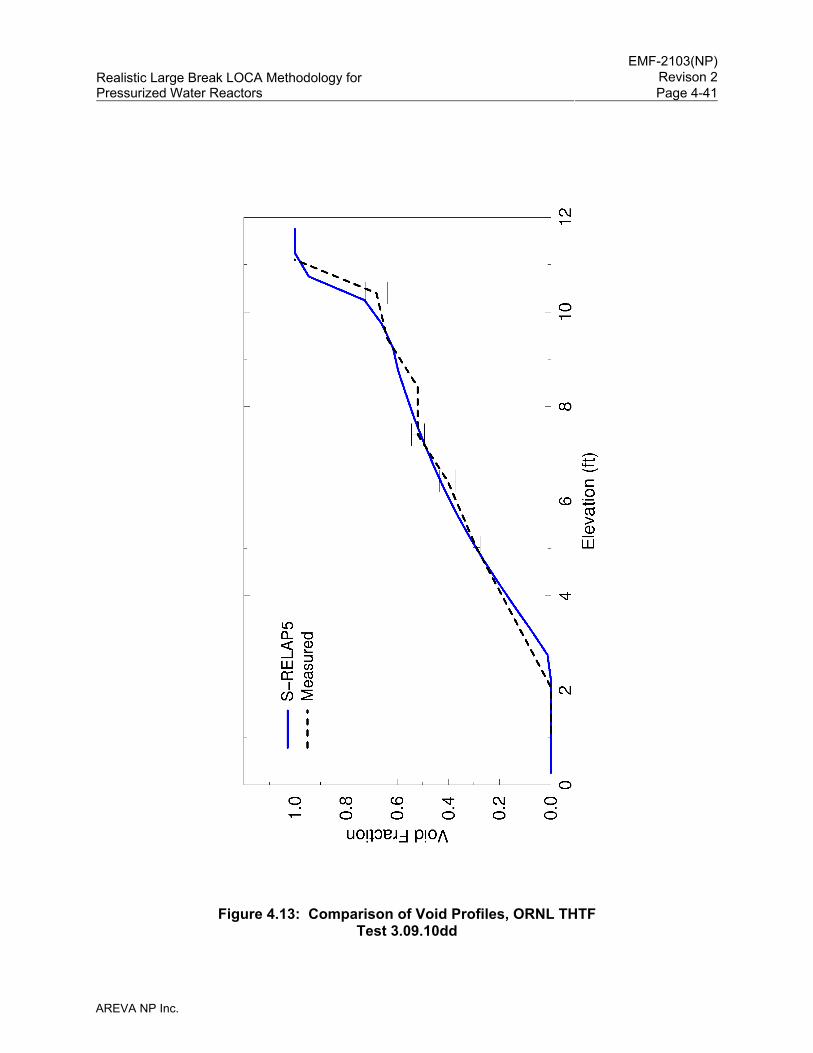
EMF-2103(NP)
Revison 2Realistic Large Break LOCA Methodology for Pressurized Water Reactors Page 4-41
AREVA NP Inc.
Figure 4.13: Comparison of Void Profiles, ORNL THTF Test 3.09.10dd
EMF-2103(NP)
Revison 2Realistic Large Break LOCA Methodology for Pressurized Water Reactors Page 4-42
AREVA NP Inc.
4.3.1.3 GE Level Swell
The GE Level Swell Test 1004-3 was simulated using S-RELAP5 to validate the interphase heat
transfer and the interphase friction models for the bubbly and slug flow regimes. The test is
essentially a small break blowdown of a vertical vessel 14 foot high by 1 foot in diameter. The
vessel was initially pressurized to 1011 psi and filled with saturated water up to the 10.4 foot
elevation. The void fraction distribution was measured axially in the test. This assessment
provides a test of the two-fluid interphase models in predicting the flow regimes and void
fraction distributions that occur under depressurization conditions.
Since the GE test facility is atypical of a PWR, a simple nodalization approach is used to model
the facility. The test vessel is modeled using a 27 node PIPE component with an average node
height of approximately 0.5 feet. A two-phase discharge (flow) coefficient of 0.7 is required to
simulate the pressure response. Section 3.6 of Reference 5 provides details of the GE Level
Swell test, the S-RELAP5 input model, and a discussion of results.
The purpose of this assessment was to validate some of the interphase heat transfer and
interphase friction models in the bubbly and slug flow regimes. Comparisons of measured
versus calculated void fraction distributions are made at two transient times, 40 and
100 seconds. Figure 4.14 and Figure 4.15 show the S-RELAP5 calculated void fraction results
along with data at 40 and 100 seconds, respectively. It can be seen from these figures that, at
both times, the S-RELAP5 calculated void distributions provide excellent agreement and are
within the range of experimental uncertainty. The calculated flow regimes are bubbly flow below
the void fraction of 0.25; slug flow from the void fraction of 0.25 up to the two-phase mixture
level position (which occurs at around the void fraction of 0.3 to 0.6); and annular-mist flow
(close to single-phase steam) above the mixture level. The results indicate, for this slow
transient condition, the two-fluid interphase friction and heat transfer models implemented in
S-RELAP5 are applicable.
The jump of void fraction from ~0.4 to ~0.99 within neighboring volumes distinctly defines the
location of a two-phase mixture level. The interphase friction models for slug flow, vertical
stratification, and annular-mist flow work in harmony to produce a smooth, but sharp transition
from a low void fraction region to a high void fraction (close to 1.0) region.
EMF-2103(NP)
Revison 2Realistic Large Break LOCA Methodology for Pressurized Water Reactors Page 4-43
AREVA NP Inc.
In a non-equilibrium code such as S-RELAP5, the phase exchange (vapor generation) process
during blowdown is calculated using flow regime dependent interphase heat transfer models.
The calculated liquid and vapor (steam) temperatures are close to the saturation temperature.
This shows that the interphase heat transfer submodels described in Section 3.4 of
Reference 11, particularly those for the metastable state conditions, are appropriate and
adequate for treating the depressurization phenomena.
In summary, the simulation of GE Level Swell Test 1004-3 using S-RELAP5 demonstrates the
code will calculate proper void and fluid temperature distribution in bubbly and slug flow regimes
in large diameter vertical pipes. The assessment validates the interphase heat transfer and the
interphase friction models for the bubbly and slug flow regimes in S-RELAP5.
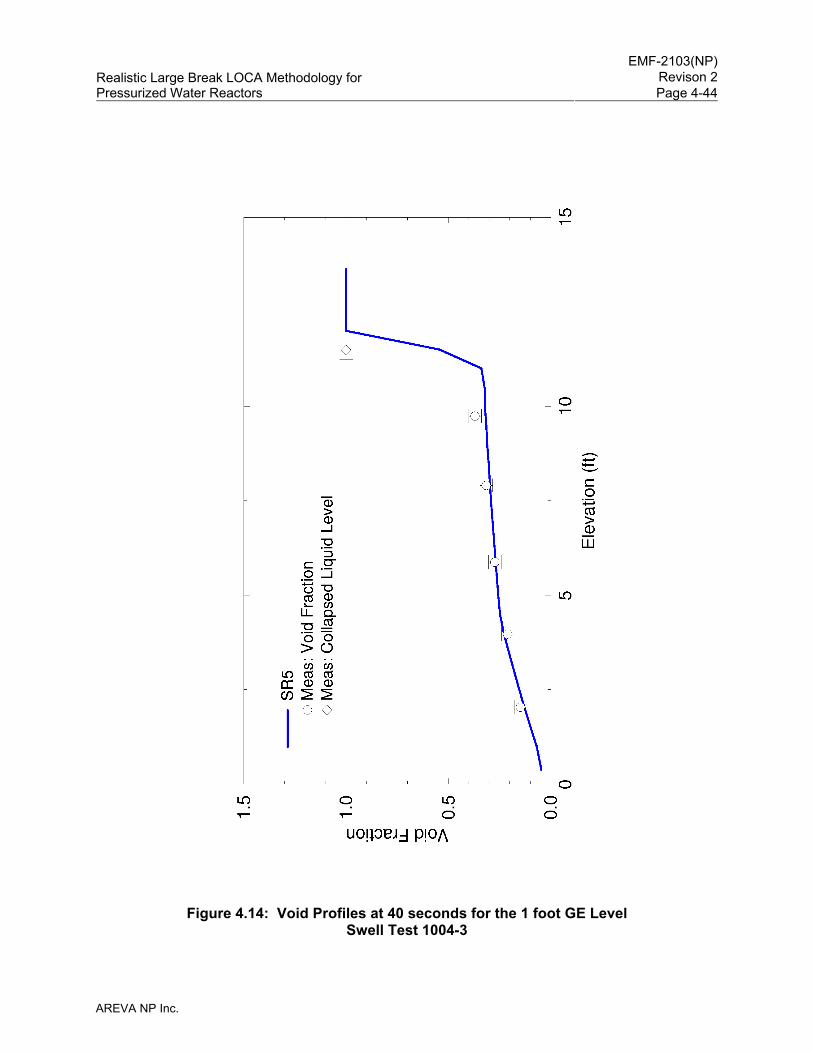
EMF-2103(NP)
Revison 2Realistic Large Break LOCA Methodology for Pressurized Water Reactors Page 4-44
AREVA NP Inc.
Figure 4.14: Void Profiles at 40 seconds for the 1 foot GE Level Swell Test 1004-3
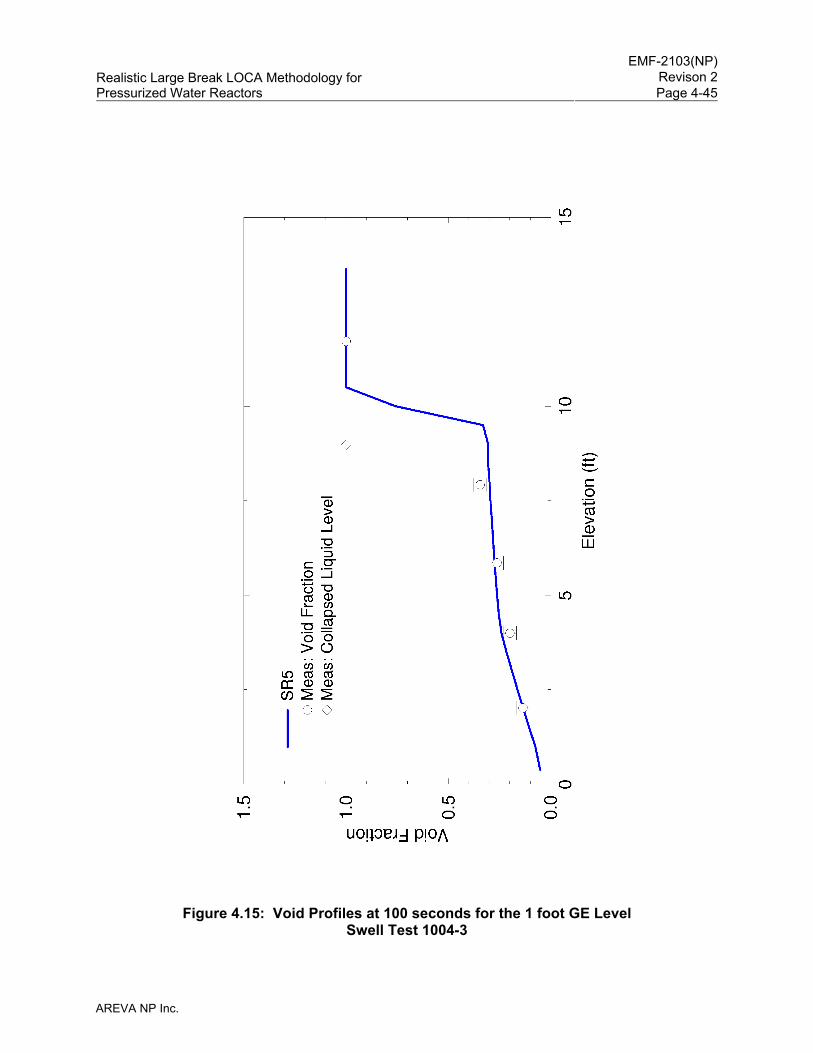
EMF-2103(NP)
Revison 2Realistic Large Break LOCA Methodology for Pressurized Water Reactors Page 4-45
AREVA NP Inc.
Figure 4.15: Void Profiles at 100 seconds for the 1 foot GE Level Swell Test 1004-3
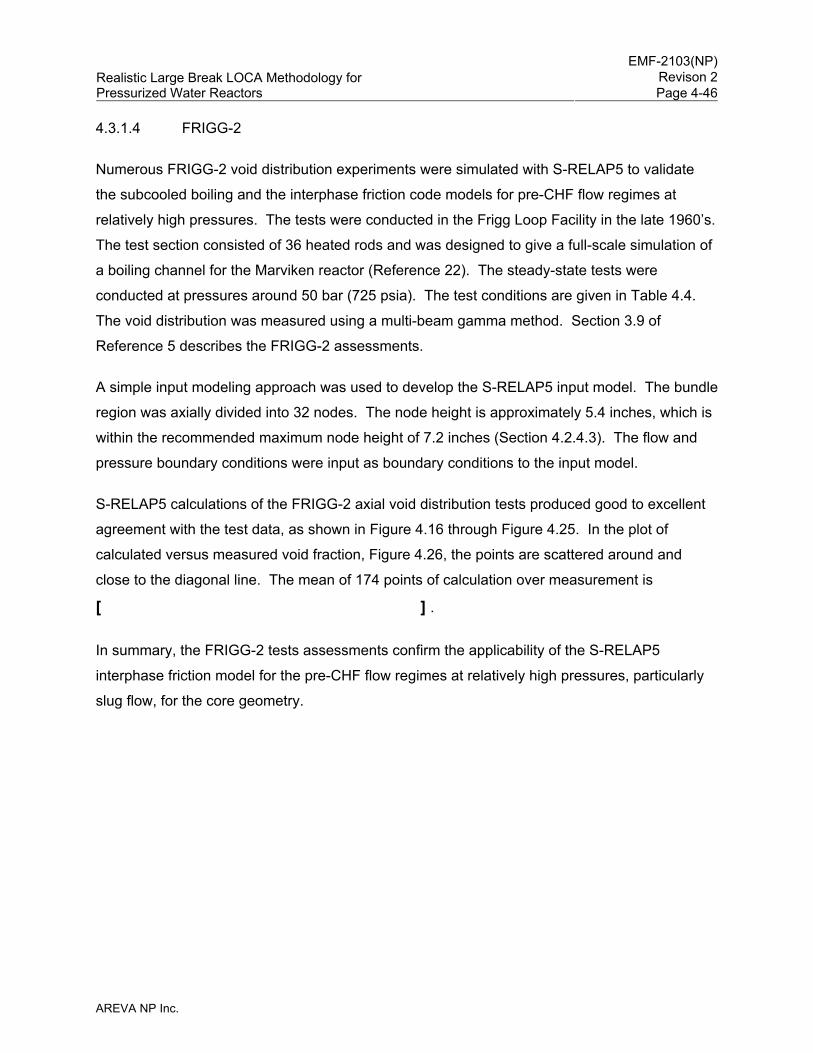
EMF-2103(NP)
Revison 2Realistic Large Break LOCA Methodology for Pressurized Water Reactors Page 4-46
AREVA NP Inc.
4.3.1.4 FRIGG-2
Numerous FRIGG-2 void distribution experiments were simulated with S-RELAP5 to validate
the subcooled boiling and the interphase friction code models for pre-CHF flow regimes at
relatively high pressures. The tests were conducted in the Frigg Loop Facility in the late 1960’s.
The test section consisted of 36 heated rods and was designed to give a full-scale simulation of
a boiling channel for the Marviken reactor (Reference 22). The steady-state tests were
conducted at pressures around 50 bar (725 psia). The test conditions are given in Table 4.4.
The void distribution was measured using a multi-beam gamma method. Section 3.9 of
Reference 5 describes the FRIGG-2 assessments.
A simple input modeling approach was used to develop the S-RELAP5 input model. The bundle
region was axially divided into 32 nodes. The node height is approximately 5.4 inches, which is
within the recommended maximum node height of 7.2 inches (Section 4.2.4.3). The flow and
pressure boundary conditions were input as boundary conditions to the input model.
S-RELAP5 calculations of the FRIGG-2 axial void distribution tests produced good to excellent
agreement with the test data, as shown in Figure 4.16 through Figure 4.25. In the plot of
calculated versus measured void fraction, Figure 4.26, the points are scattered around and
close to the diagonal line. The mean of 174 points of calculation over measurement is
[ ] .
In summary, the FRIGG-2 tests assessments confirm the applicability of the S-RELAP5
interphase friction model for the pre-CHF flow regimes at relatively high pressures, particularly
slug flow, for the core geometry.
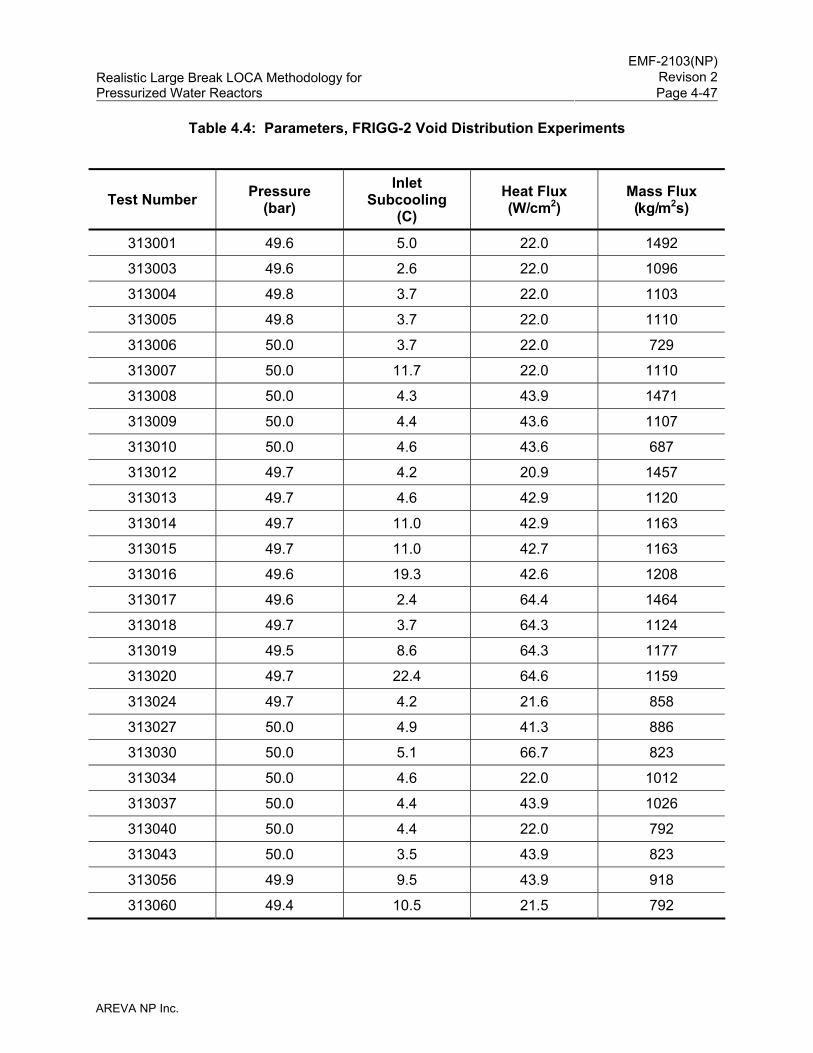
EMF-2103(NP)
Revison 2Realistic Large Break LOCA Methodology for Pressurized Water Reactors Page 4-47
AREVA NP Inc.
Table 4.4: Parameters, FRIGG-2 Void Distribution Experiments
Test Number Pressure (bar)
Inlet Subcooling
(C) Heat Flux (W/cm2)
Mass Flux (kg/m2s)
313001 49.6 5.0 22.0 1492
313003 49.6 2.6 22.0 1096
313004 49.8 3.7 22.0 1103
313005 49.8 3.7 22.0 1110
313006 50.0 3.7 22.0 729
313007 50.0 11.7 22.0 1110
313008 50.0 4.3 43.9 1471
313009 50.0 4.4 43.6 1107
313010 50.0 4.6 43.6 687
313012 49.7 4.2 20.9 1457
313013 49.7 4.6 42.9 1120
313014 49.7 11.0 42.9 1163
313015 49.7 11.0 42.7 1163
313016 49.6 19.3 42.6 1208
313017 49.6 2.4 64.4 1464
313018 49.7 3.7 64.3 1124
313019 49.5 8.6 64.3 1177
313020 49.7 22.4 64.6 1159
313024 49.7 4.2 21.6 858
313027 50.0 4.9 41.3 886
313030 50.0 5.1 66.7 823
313034 50.0 4.6 22.0 1012
313037 50.0 4.4 43.9 1026
313040 50.0 4.4 22.0 792
313043 50.0 3.5 43.9 823
313056 49.9 9.5 43.9 918
313060 49.4 10.5 21.5 792
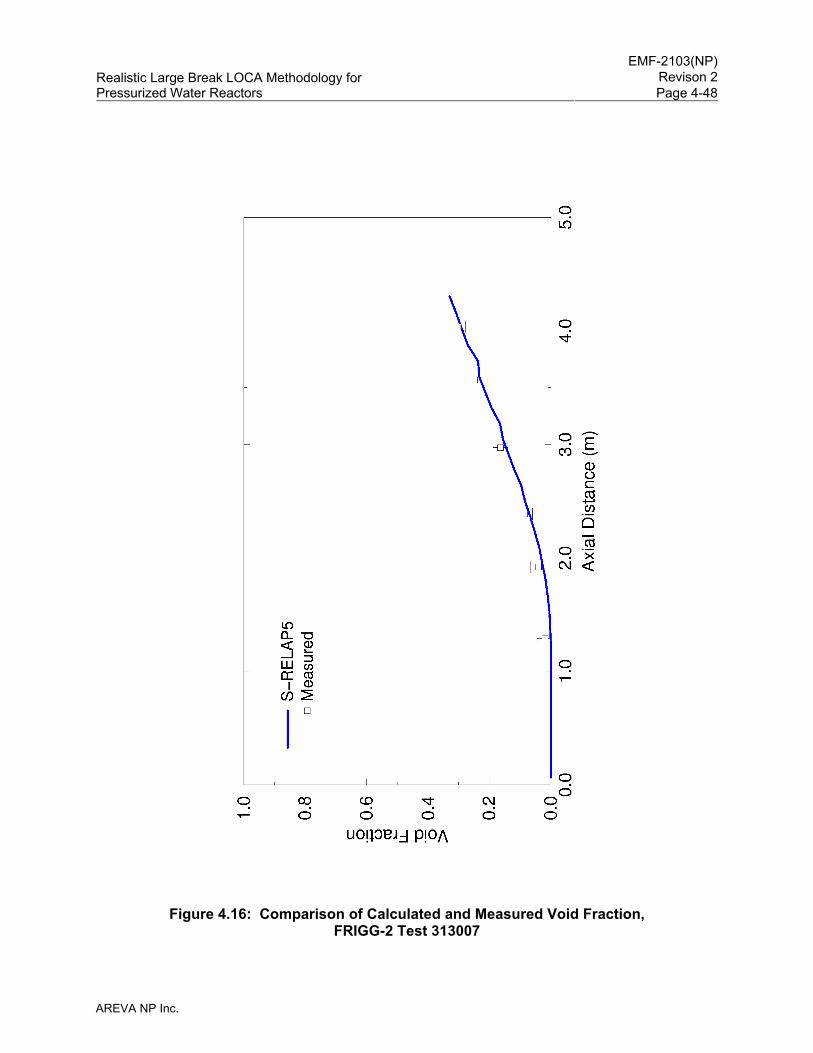
EMF-2103(NP)
Revison 2Realistic Large Break LOCA Methodology for Pressurized Water Reactors Page 4-48
AREVA NP Inc.
Figure 4.16: Comparison of Calculated and Measured Void Fraction, FRIGG-2 Test 313007
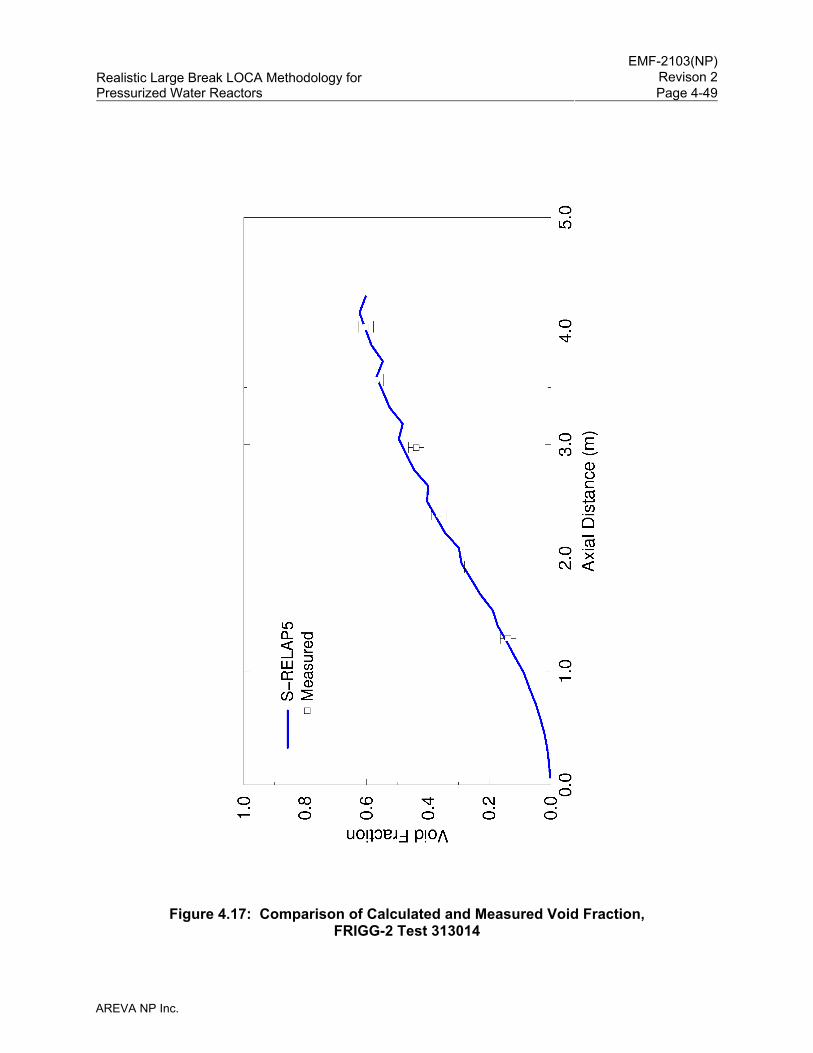
EMF-2103(NP)
Revison 2Realistic Large Break LOCA Methodology for Pressurized Water Reactors Page 4-49
AREVA NP Inc.
Figure 4.17: Comparison of Calculated and Measured Void Fraction, FRIGG-2 Test 313014
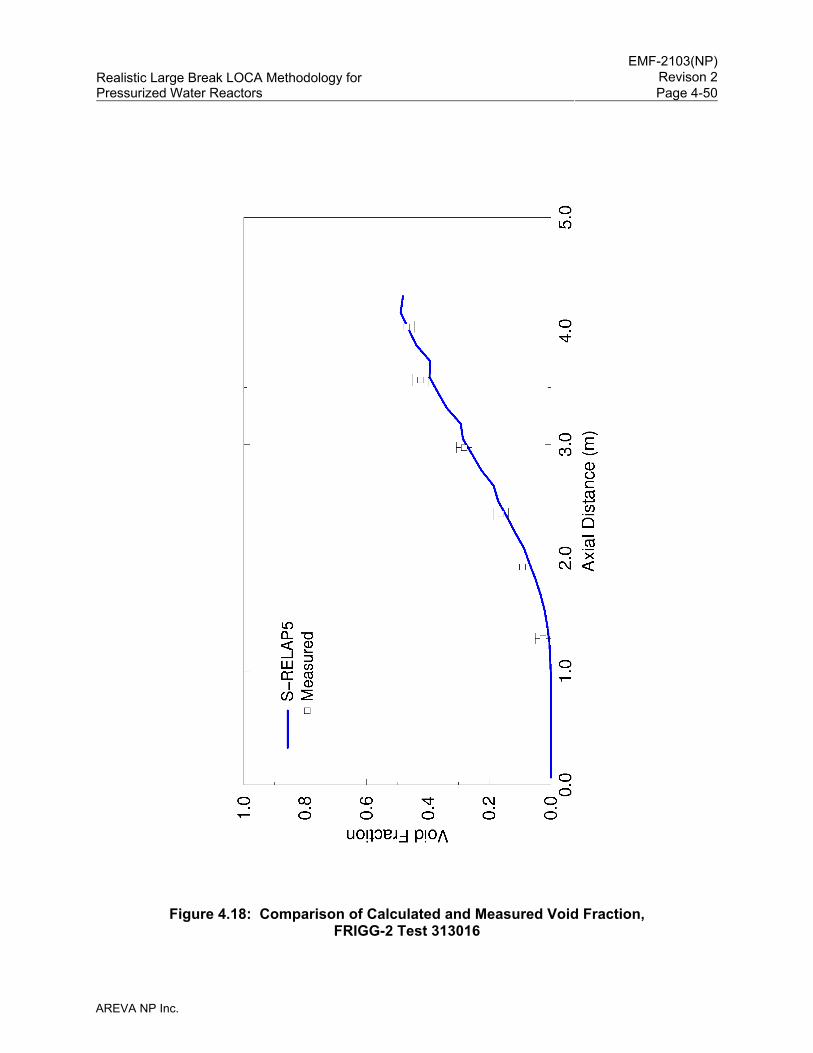
EMF-2103(NP)
Revison 2Realistic Large Break LOCA Methodology for Pressurized Water Reactors Page 4-50
AREVA NP Inc.
Figure 4.18: Comparison of Calculated and Measured Void Fraction, FRIGG-2 Test 313016
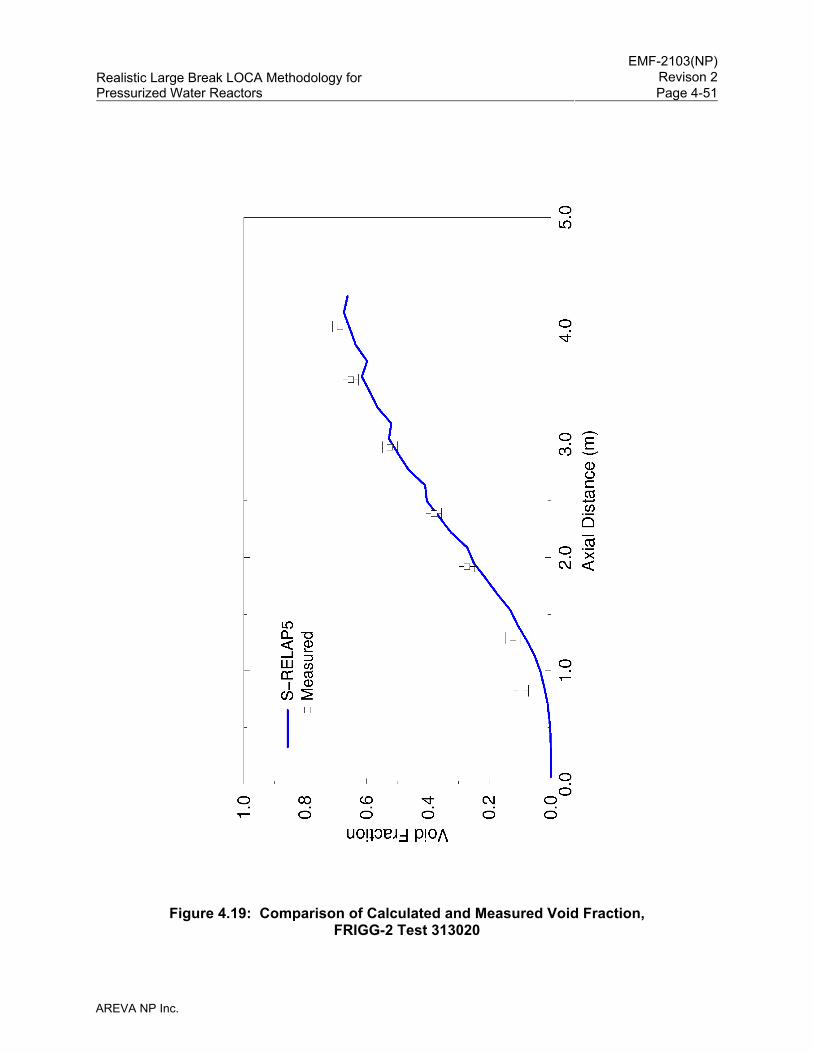
EMF-2103(NP)
Revison 2Realistic Large Break LOCA Methodology for Pressurized Water Reactors Page 4-51
AREVA NP Inc.
Figure 4.19: Comparison of Calculated and Measured Void Fraction, FRIGG-2 Test 313020
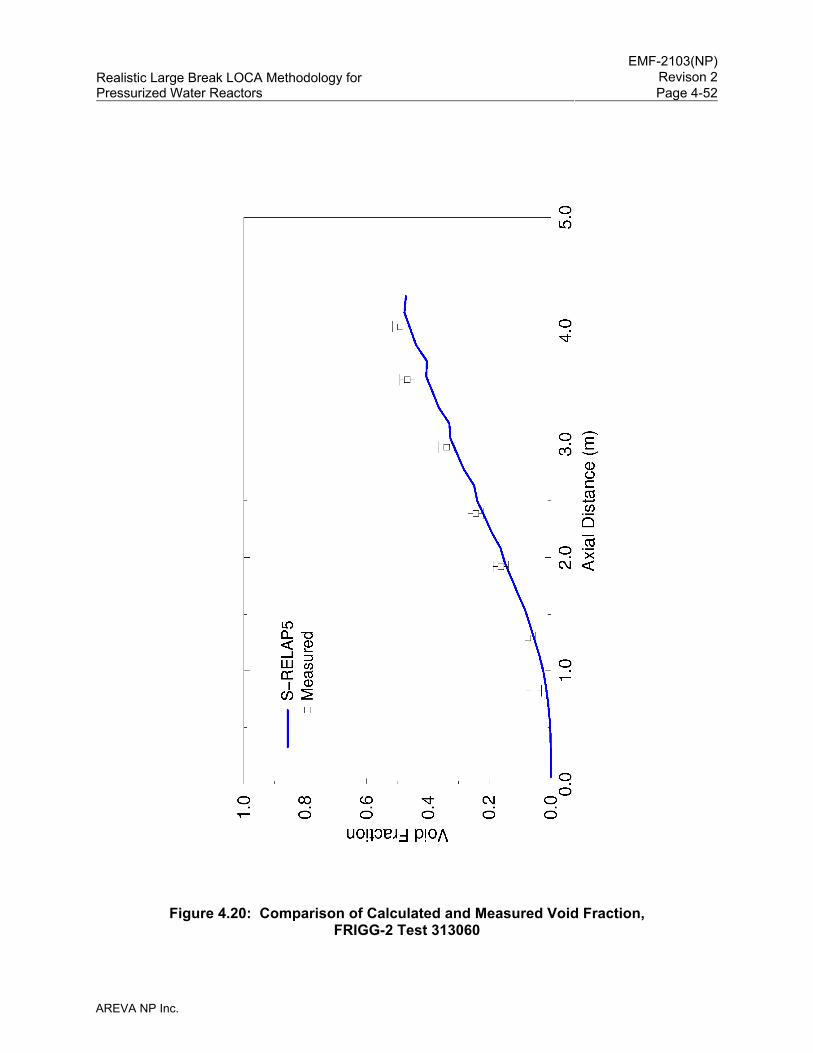
EMF-2103(NP)
Revison 2Realistic Large Break LOCA Methodology for Pressurized Water Reactors Page 4-52
AREVA NP Inc.
Figure 4.20: Comparison of Calculated and Measured Void Fraction, FRIGG-2 Test 313060
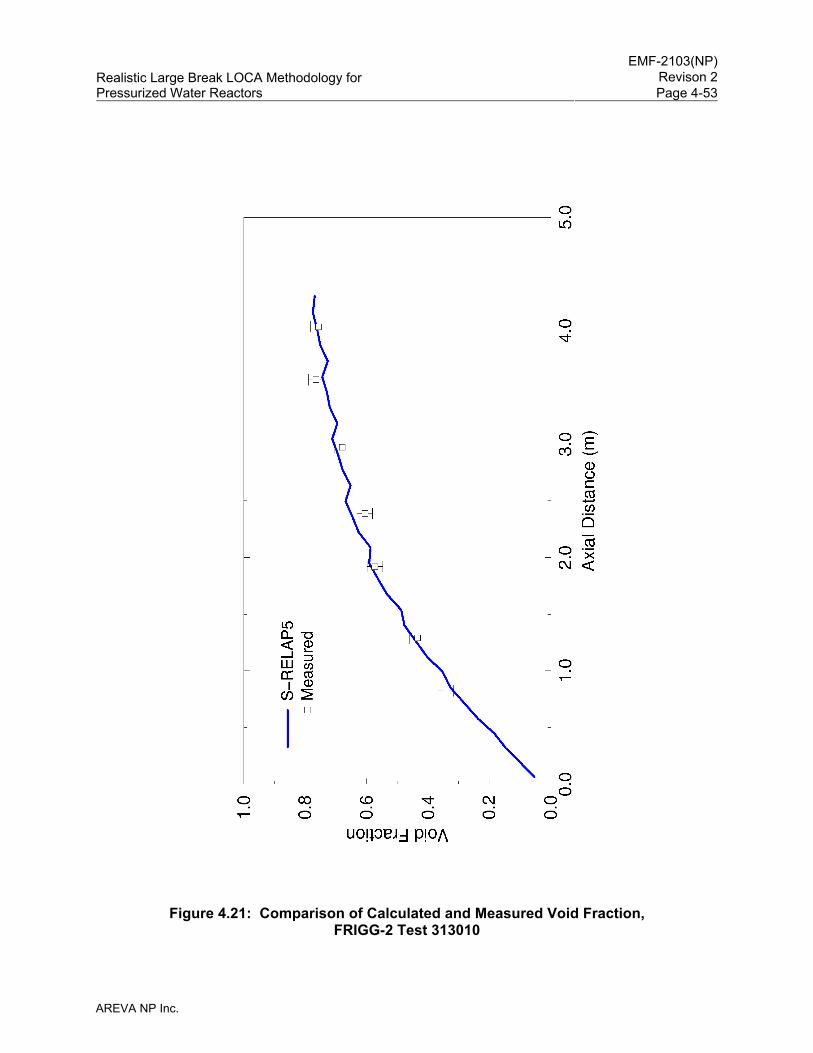
EMF-2103(NP)
Revison 2Realistic Large Break LOCA Methodology for Pressurized Water Reactors Page 4-53
AREVA NP Inc.
Figure 4.21: Comparison of Calculated and Measured Void Fraction, FRIGG-2 Test 313010
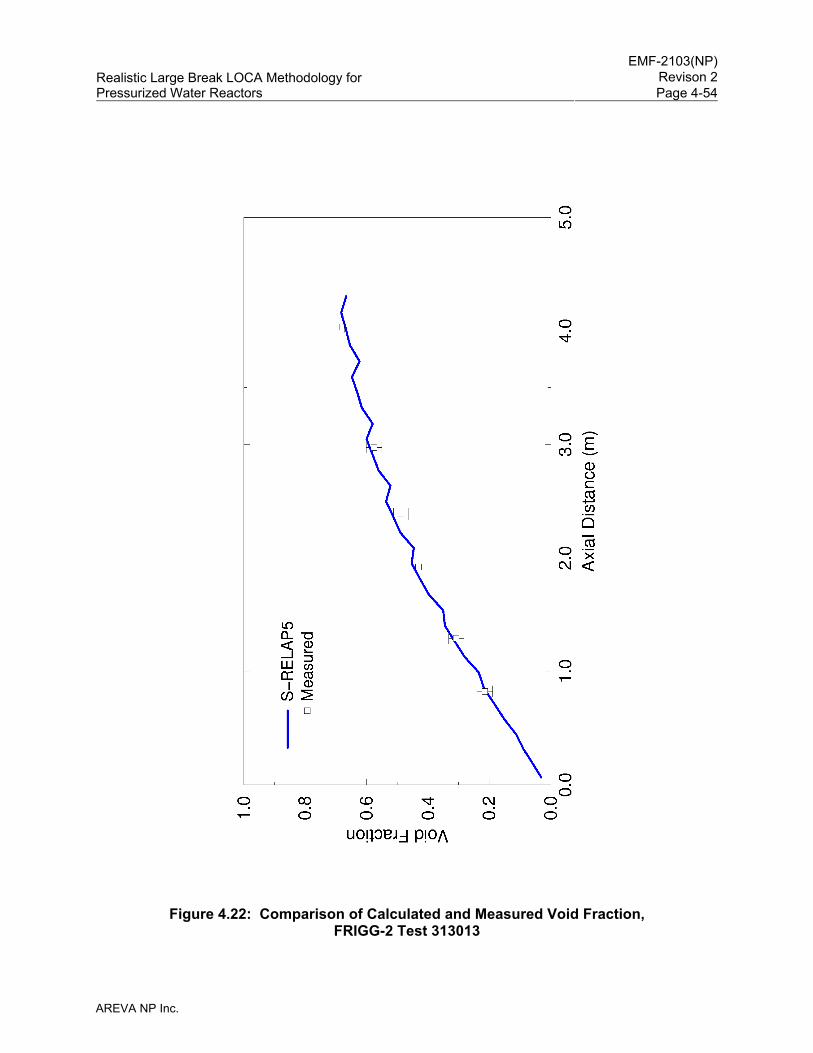
EMF-2103(NP)
Revison 2Realistic Large Break LOCA Methodology for Pressurized Water Reactors Page 4-54
AREVA NP Inc.
Figure 4.22: Comparison of Calculated and Measured Void Fraction, FRIGG-2 Test 313013
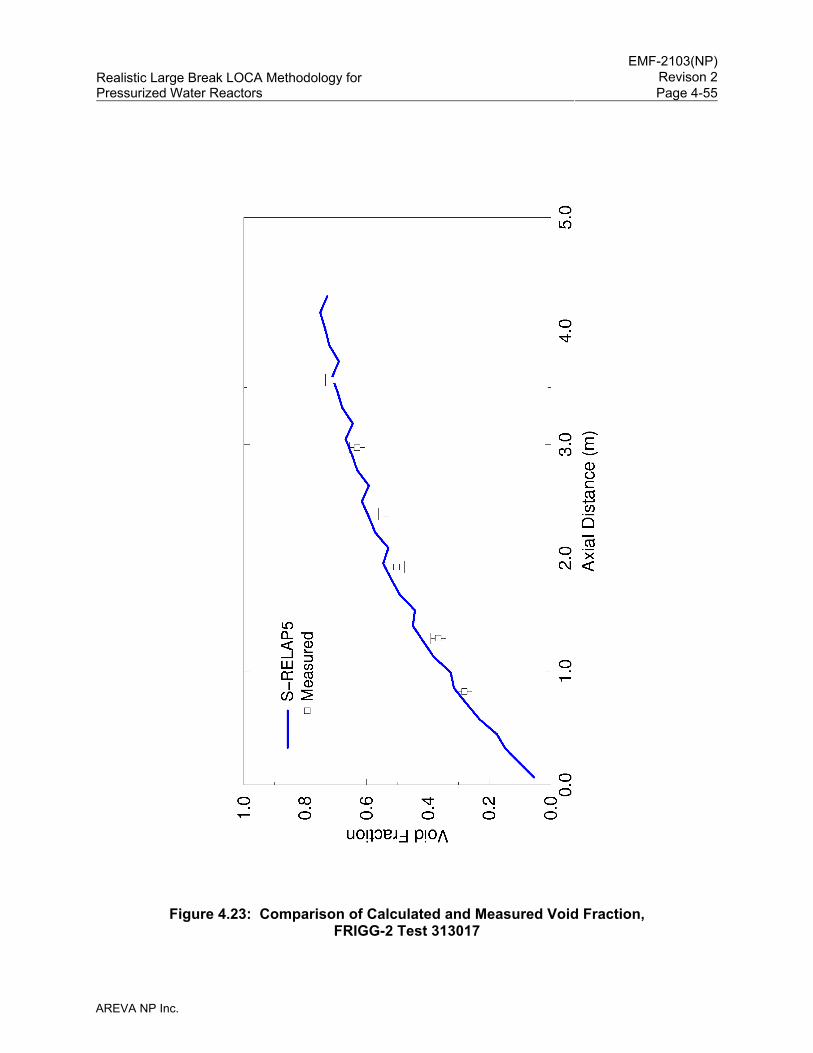
EMF-2103(NP)
Revison 2Realistic Large Break LOCA Methodology for Pressurized Water Reactors Page 4-55
AREVA NP Inc.
Figure 4.23: Comparison of Calculated and Measured Void Fraction, FRIGG-2 Test 313017
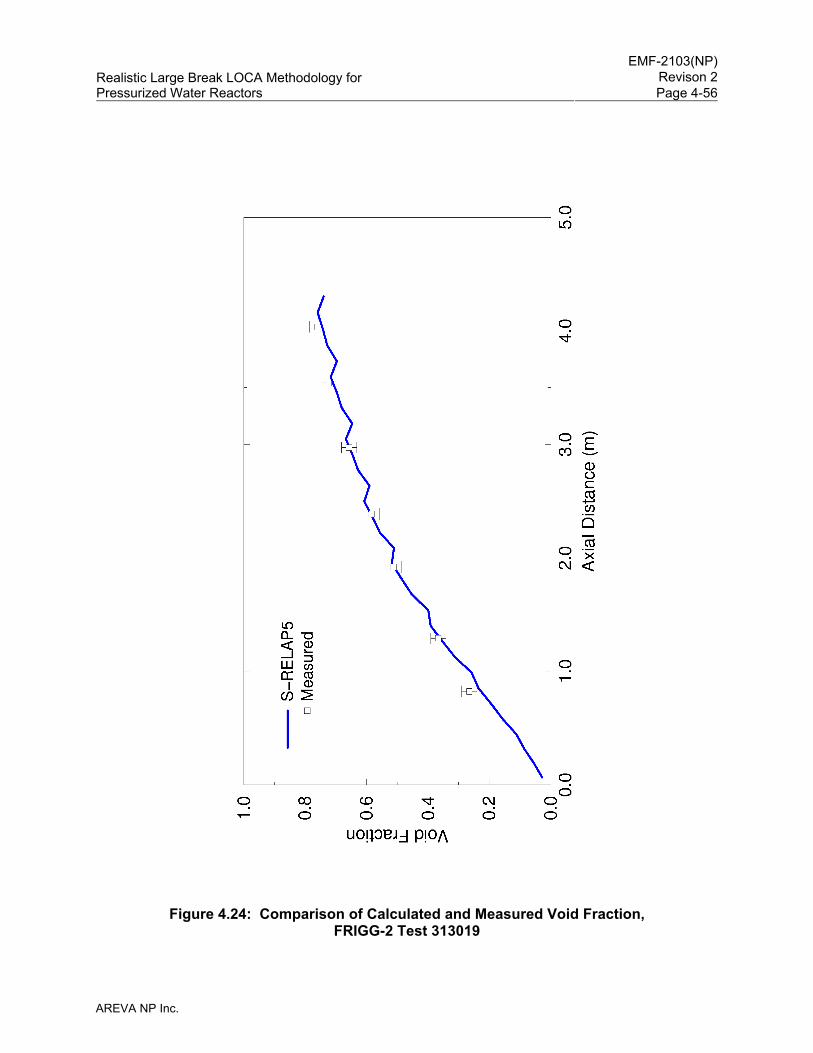
EMF-2103(NP)
Revison 2Realistic Large Break LOCA Methodology for Pressurized Water Reactors Page 4-56
AREVA NP Inc.
Figure 4.24: Comparison of Calculated and Measured Void Fraction, FRIGG-2 Test 313019
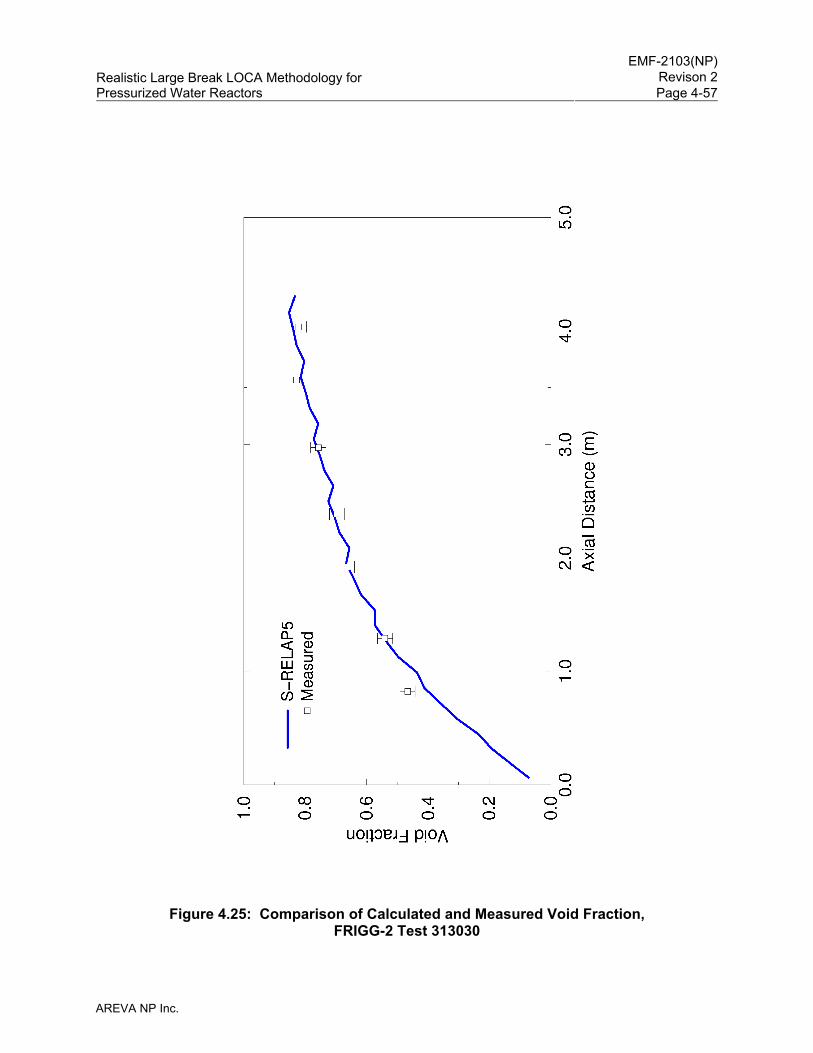
EMF-2103(NP)
Revison 2Realistic Large Break LOCA Methodology for Pressurized Water Reactors Page 4-57
AREVA NP Inc.
Figure 4.25: Comparison of Calculated and Measured Void Fraction, FRIGG-2 Test 313030
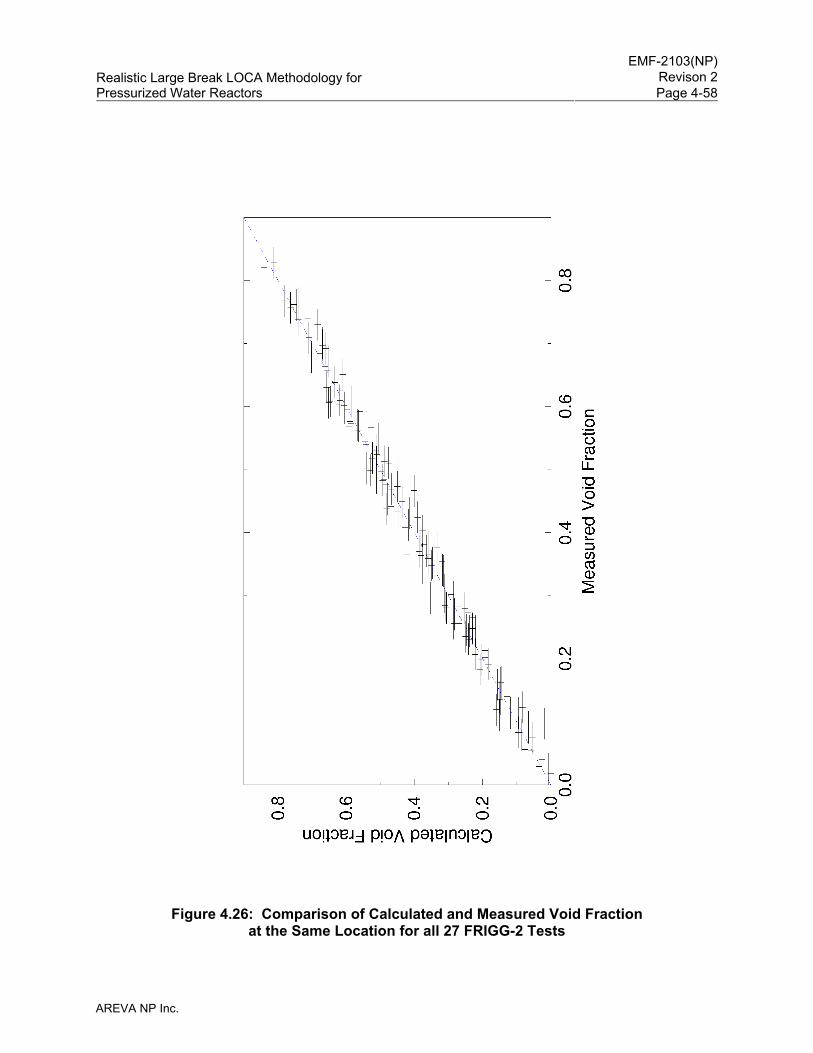
EMF-2103(NP)
Revison 2Realistic Large Break LOCA Methodology for Pressurized Water Reactors Page 4-58
AREVA NP Inc.
Figure 4.26: Comparison of Calculated and Measured Void Fraction at the Same Location for all 27 FRIGG-2 Tests
EMF-2103(NP)
Revison 2Realistic Large Break LOCA Methodology for Pressurized Water Reactors Page 4-59
AREVA NP Inc.
4.3.1.5 Bennett Tube
Bennett Heated Tube Tests 5358 and 5379 were simulated using S-RELAP5 to evaluate the
applicability of the Biasi and post-CHF heat transfer correlations in the code. The Bennett
heated tube tests were conducted by the UKAEA Research Group to measure the dry-out [
] location and the surface temperature profiles in the region beyond the dry-out point.
Test 5358 is a low flow test with mass flux of 379.7 kg/m2-s and Test 5379 is a high flow test
with a mass flux of 3797.4 kg/m2-s.
The test tube was a simple heated tube with a 0.497 inch inner diameter, a 0.625 inch outer
diameter, a total length of 228 inches, and a heated length of 219 inches for the two selected
tests. A simple input modeling approach was used to develop the S-RELAP5 input model. The
heated test section was modeled using a 26 node PIPE component. Larger node heights were
used in the lower and upper portion of the test section. However, a node height of 6.0 inches
was used in the middle region of the test section that is of interest to assess the heat transfer
correlations. This node height is within the recommended maximum node height of 7.2 inches
(Section 4.2.4.3). The flow and pressure boundary conditions were input as boundary
conditions to the input model. The details of the two tests, the S-RELAP5 input model, and the
assessment results are discussed in Section 3.2 of Reference 5.
As shown in Figure 4.27 and Figure 4.28, the calculated CHF positions agree well with the data
for both tests. Figure 4.27 shows that for the low mass flux case, the wall temperatures in the
film boiling region are well predicted. Figure 4.28 shows that for the high mass flux case, the
calculated wall temperatures stay rather flat in the post-CHF region and are higher than the data
in the top-end region. In the simulation, the bias on the Biasi CHF correlation is not used.
Since the bias is less than 1.0, the predicted CHF position would have moved slightly below the
current position, resulting in the prediction of a slightly higher cladding temperature in the film
boiling region.
In summary, the simulation of the Bennett heated tube tests using S-RELAP5 demonstrate that
the code will calculate CHF and post-CHF heat transfer reasonably well during a LBLOCA in a
PWR.
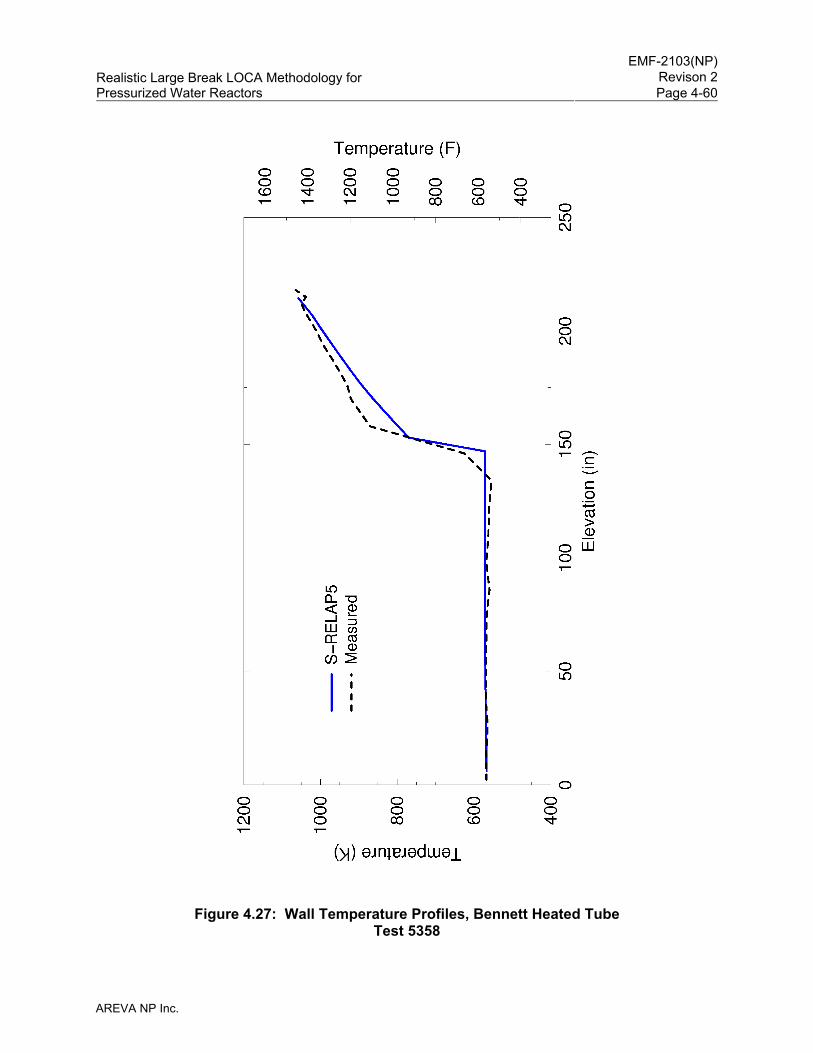
EMF-2103(NP)
Revison 2Realistic Large Break LOCA Methodology for Pressurized Water Reactors Page 4-60
AREVA NP Inc.
Figure 4.27: Wall Temperature Profiles, Bennett Heated Tube Test 5358
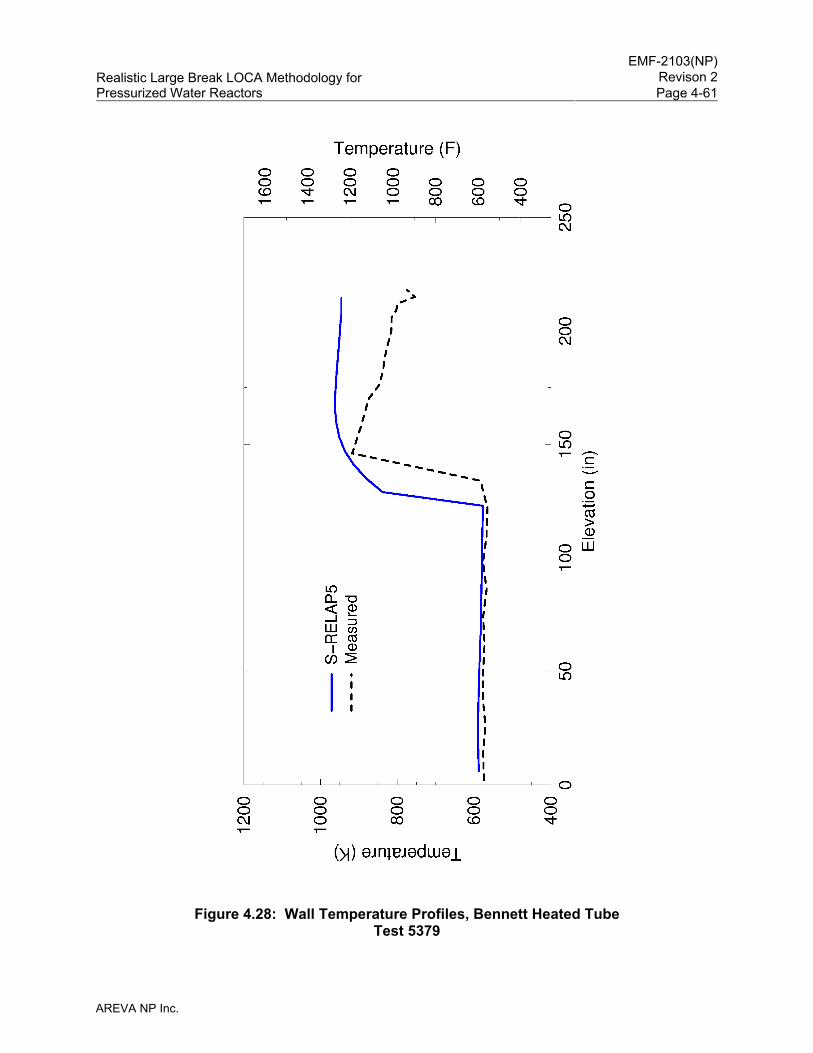
EMF-2103(NP)
Revison 2Realistic Large Break LOCA Methodology for Pressurized Water Reactors Page 4-61
AREVA NP Inc.
Figure 4.28: Wall Temperature Profiles, Bennett Heated Tube Test 5379

EMF-2103(NP)
Revison 2Realistic Large Break LOCA Methodology for Pressurized Water Reactors Page 4-62
AREVA NP Inc.
4.3.1.6 FLECHT and FLECHT-SEASET
Full Length Emergency Cooling Heat Transfer - System Effects and Separate Effects
(FLECHT-SEASET) Tests and Full Length Emergency Cooling Heat Transfer (FLECHT)
Low-Flooding-Rate Skewed Tests (Skewed) are widely used to assess system codes. The
detailed S-RELAP5 assessments for these facilities are given in Section 3.3 of Reference 5.
The purpose of these assessments was to evaluate the S-RELAP5 code reflood heat transfer
and hydrodynamics, using different axial power profiles and reflood rates.
[
]
The FLECHT-SEASET facility used the Westinghouse 17x17 geometry for the reference fuel
design while the FLECHT facility used the Westinghouse 15x15 geometry for the reference fuel
design. The forced reflood SETs are with injection or flooding rates that are very demanding for
simulations with the realistic system codes. AREVA selected the FLECHT-SEASET
EMF-2103(NP)
Revison 2Realistic Large Break LOCA Methodology for Pressurized Water Reactors Page 4-63
AREVA NP Inc.
Tests 31504, 31701, 31302, 31203, 31805, 32013, and 34209, and FLECHT Skewed
Tests 13609 and 13914 to validate the reflood modeling capability of S-RELAP5 for the
RLBLOCA methodology. For LBLOCA reflood, the selection covers the whole range of
pressure, subcooling, and flooding rate, and includes cosine and skewed axial power profiles.
[
]
In the remainder of this section, key code-to-data comparisons are presented with minimal
discussion. Consequently, Section 3.3 of Reference 5 should be consulted for the complete
analysis.
Figure 4.29 through Figure 4.37 show the calculated maximum surface temperatures and the
measured temperature data at various elevations in the simulated fuel assemblies for the
FLECHT-SEASET and FLECHT Skewed tests. The S-RELAP5 calculated PCT is generally
within the measured data and slightly exceeds the data above the 100 inch elevation. These
results are sufficiently close to the expected outcome where the best-estimate calculations are
in good agreement with the data and conservatisms are brought in through the uncertainty
multipliers. The results from the FLECHT Skewed comparisons, Figure 4.36 and Figure 4.37,
show the calculated maximum temperatures slightly exceeding the data at the lower elevations,
and then greatly exceeding the measurements near the top of the test section. With respect to
plant calculations, it is expected that clad temperatures for top-peaked cases will be
overpredicted while bottom- and mid-plane-peaked cases will be well predicted.
The calculated and measured temperatures at the 78 inch elevation, approximately the PCT
location, are shown for Test 31504 in Figure 4.38. For this case, the calculated rod surface
temperature during the temperature rise and peak portion of the test compares well with the
measured data and after the peak temperature tends to underpredict the temperature. Although
the measured temperature is underpredicted slightly, the calculated quench is delayed by
approximately 50 seconds.
EMF-2103(NP)
Revison 2Realistic Large Break LOCA Methodology for Pressurized Water Reactors Page 4-64
AREVA NP Inc.
Steam temperature is one of the important parameters in determining the heat transfer rate
during the reflood phase. Figure 4.39 shows the calculated and measured steam temperatures
for FLECHT-SEASET Test 31504. Test 31504 shows excellent agreement up to 200 seconds
and then overpredicts the measurements until the calculated quench time is approached.
In both the wall and steam temperature comparisons, the calculated results were in good
agreement with the data until approximately 200 seconds, and then the data comparisons show
differences between measured and calculated temperatures from 200 seconds to 300 seconds.
In this time frame, the void fraction is decreasing from 0.98 at 200 seconds to 0.75 at
300 seconds, and decreases further at later times. In terms of heat transfer, this time frame
marks the transition from highly dispersed flow film boiling to dispersed flow film boiling, and
then to film boiling when the void fraction drops below 0.90. This is also the region where the
turbulence enhancement factor to the vapor convection heat transfer starts influencing the
overall heat transfer, and, to a lesser extent, the transition to film boiling heat transfer. The
truncation of the turbulence enhancement and the transition to film boiling heat transfer were
determined empirically by examining the results from the heat transfer bias and uncertainty
determination discussed in Section 5.1 of Reference 5. The heat transfer biases, having values
close to 1.0, indicate that the best overall fit was obtained. Since the PCT is not affected, these
results are considered acceptable.
The calculated water mass accumulation is generally less than measured. Most of the mass
accumulation occurs early in the transient, as the lower half of the test section is filled. Once
the water accumulation reaches the high power mid-plane region of the test bundle, the water
accumulation becomes a balance between injected water entering, and entrained and
evaporated water leaving. Figure 4.40 compares the calculated versus measured liquid mass
inventory from Test 31504.
The measured quench times correspond to the time at which the cooldown rate shows a distinct
increase (Section E-12 in Reference 23) at an elevation. The time at which this occurs is
calculated from the mean of all the thermocouples at that elevation. The calculated quench time
is the time at which the wall temperature drops below the value of TMINK (700 K in this
analysis) and the void fraction is less than 0.95. The results from Test 31504, Figure 4.41,
shows the comparison between measured and calculated quench times. The comparison
shows relatively good agreement between the calculated and measured quench times.
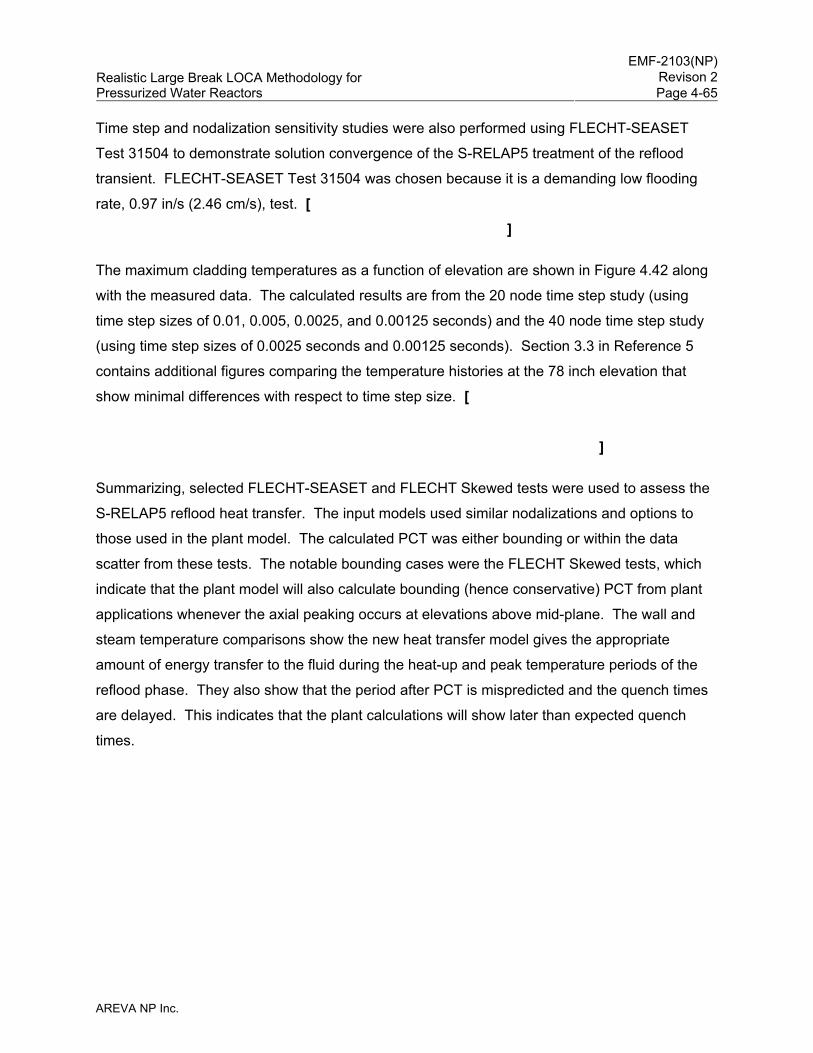
EMF-2103(NP)
Revison 2Realistic Large Break LOCA Methodology for Pressurized Water Reactors Page 4-65
AREVA NP Inc.
Time step and nodalization sensitivity studies were also performed using FLECHT-SEASET
Test 31504 to demonstrate solution convergence of the S-RELAP5 treatment of the reflood
transient. FLECHT-SEASET Test 31504 was chosen because it is a demanding low flooding
rate, 0.97 in/s (2.46 cm/s), test. [
]
The maximum cladding temperatures as a function of elevation are shown in Figure 4.42 along
with the measured data. The calculated results are from the 20 node time step study (using
time step sizes of 0.01, 0.005, 0.0025, and 0.00125 seconds) and the 40 node time step study
(using time step sizes of 0.0025 seconds and 0.00125 seconds). Section 3.3 in Reference 5
contains additional figures comparing the temperature histories at the 78 inch elevation that
show minimal differences with respect to time step size. [
]
Summarizing, selected FLECHT-SEASET and FLECHT Skewed tests were used to assess the
S-RELAP5 reflood heat transfer. The input models used similar nodalizations and options to
those used in the plant model. The calculated PCT was either bounding or within the data
scatter from these tests. The notable bounding cases were the FLECHT Skewed tests, which
indicate that the plant model will also calculate bounding (hence conservative) PCT from plant
applications whenever the axial peaking occurs at elevations above mid-plane. The wall and
steam temperature comparisons show the new heat transfer model gives the appropriate
amount of energy transfer to the fluid during the heat-up and peak temperature periods of the
reflood phase. They also show that the period after PCT is mispredicted and the quench times
are delayed. This indicates that the plant calculations will show later than expected quench
times.
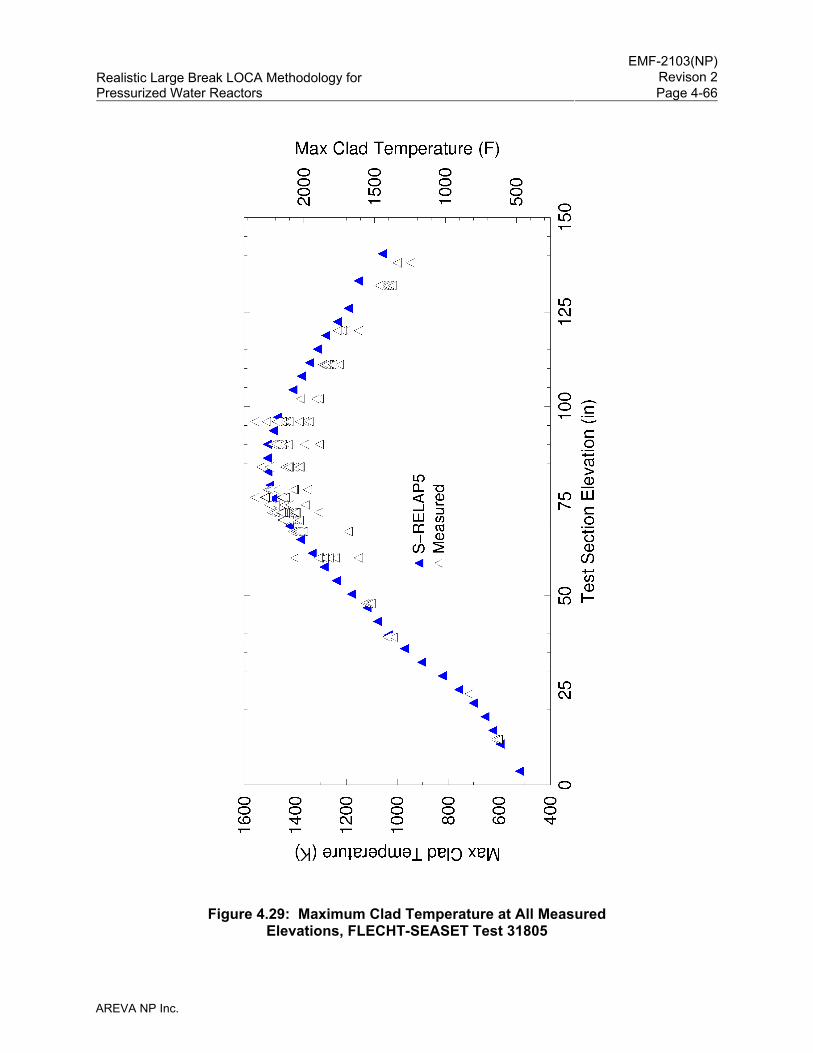
EMF-2103(NP)
Revison 2Realistic Large Break LOCA Methodology for Pressurized Water Reactors Page 4-66
AREVA NP Inc.
Figure 4.29: Maximum Clad Temperature at All Measured Elevations, FLECHT-SEASET Test 31805
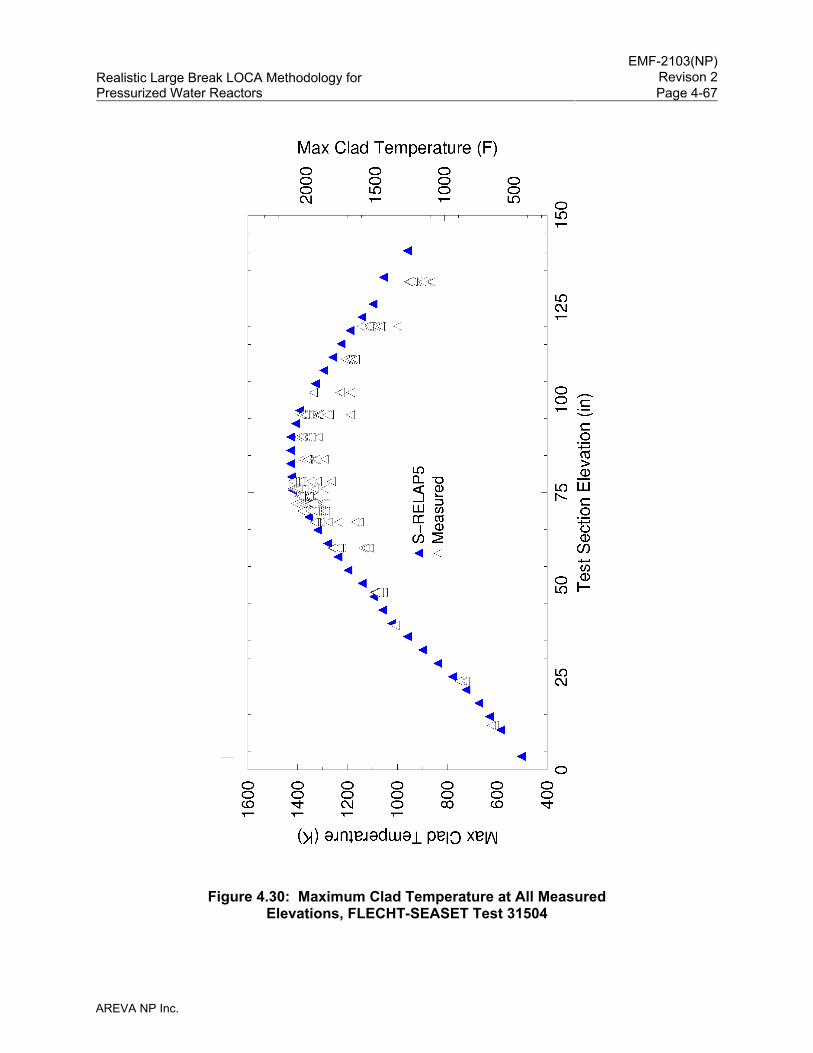
EMF-2103(NP)
Revison 2Realistic Large Break LOCA Methodology for Pressurized Water Reactors Page 4-67
AREVA NP Inc.
Figure 4.30: Maximum Clad Temperature at All Measured Elevations, FLECHT-SEASET Test 31504
EMF-2103(NP)
Revison 2Realistic Large Break LOCA Methodology for Pressurized Water Reactors Page 4-68
AREVA NP Inc.
Figure 4.31: Maximum Clad Temperature at All Measured Elevations, FLECHT-SEASET Test 31203
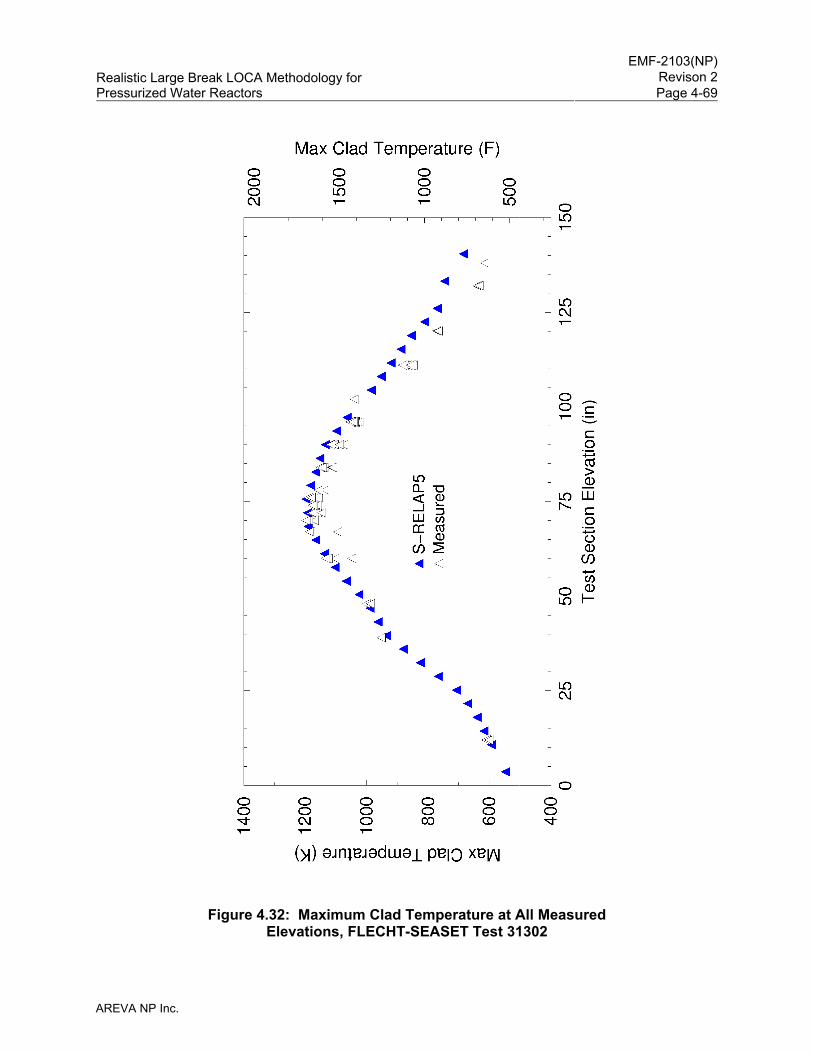
EMF-2103(NP)
Revison 2Realistic Large Break LOCA Methodology for Pressurized Water Reactors Page 4-69
AREVA NP Inc.
Figure 4.32: Maximum Clad Temperature at All Measured Elevations, FLECHT-SEASET Test 31302
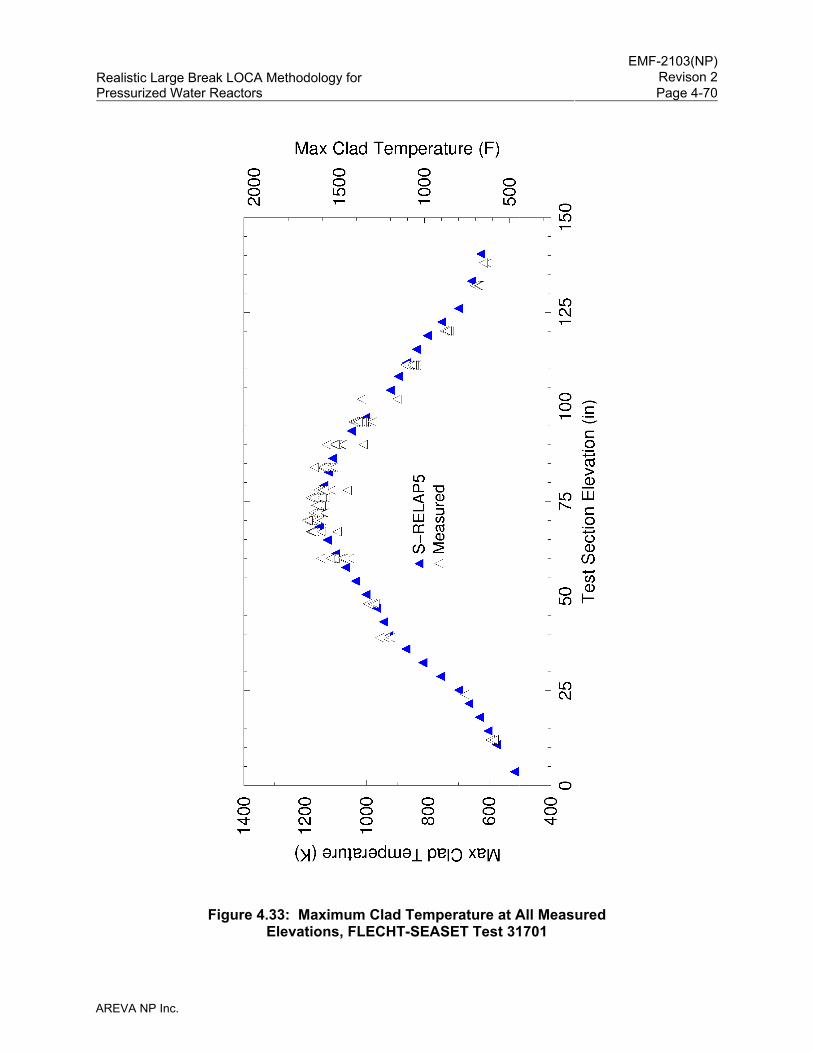
EMF-2103(NP)
Revison 2Realistic Large Break LOCA Methodology for Pressurized Water Reactors Page 4-70
AREVA NP Inc.
Figure 4.33: Maximum Clad Temperature at All Measured Elevations, FLECHT-SEASET Test 31701
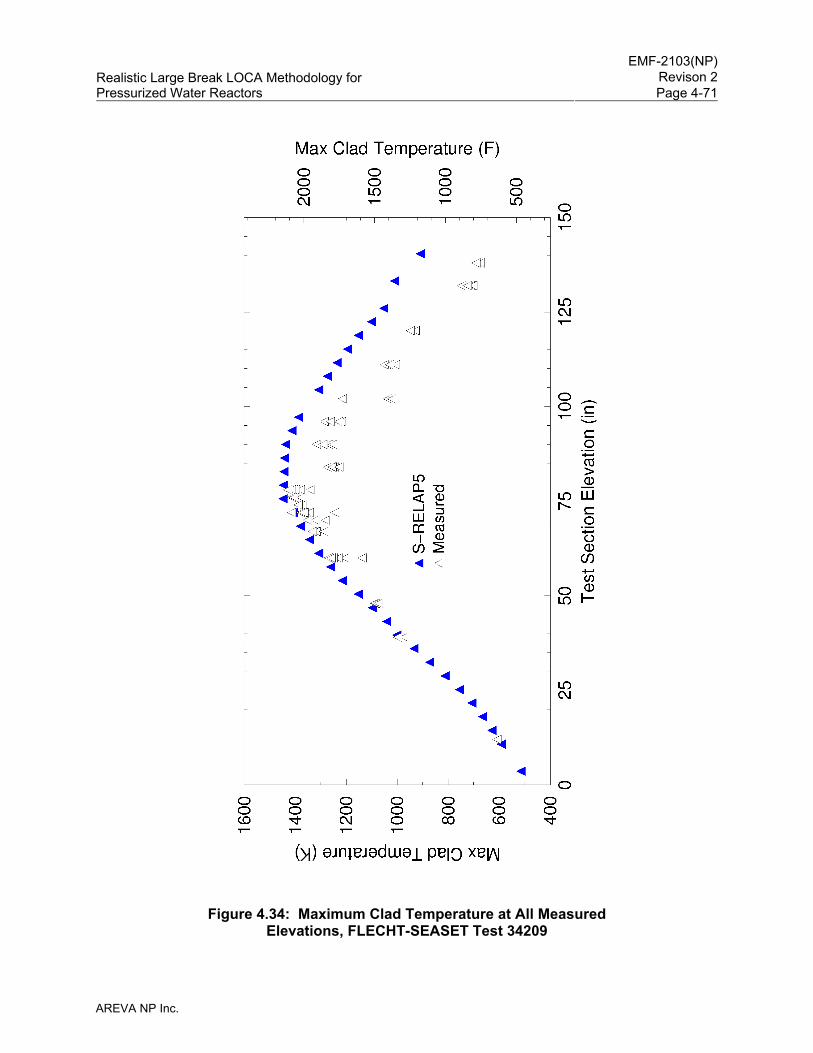
EMF-2103(NP)
Revison 2Realistic Large Break LOCA Methodology for Pressurized Water Reactors Page 4-71
AREVA NP Inc.
Figure 4.34: Maximum Clad Temperature at All Measured Elevations, FLECHT-SEASET Test 34209
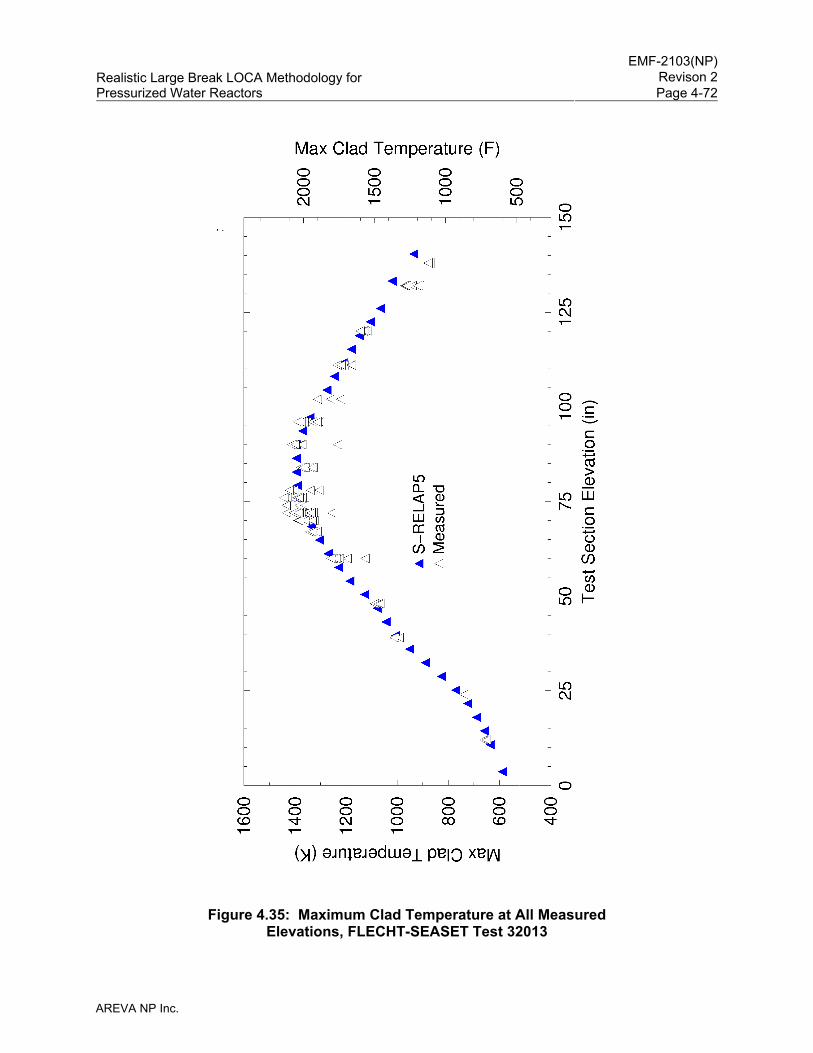
EMF-2103(NP)
Revison 2Realistic Large Break LOCA Methodology for Pressurized Water Reactors Page 4-72
AREVA NP Inc.
Figure 4.35: Maximum Clad Temperature at All Measured Elevations, FLECHT-SEASET Test 32013

EMF-2103(NP)
Revison 2Realistic Large Break LOCA Methodology for Pressurized Water Reactors Page 4-73
AREVA NP Inc.
Figure 4.36: Maximum Clad Temperature at All Measured Elevations, FLECHT Skewed Test 13609
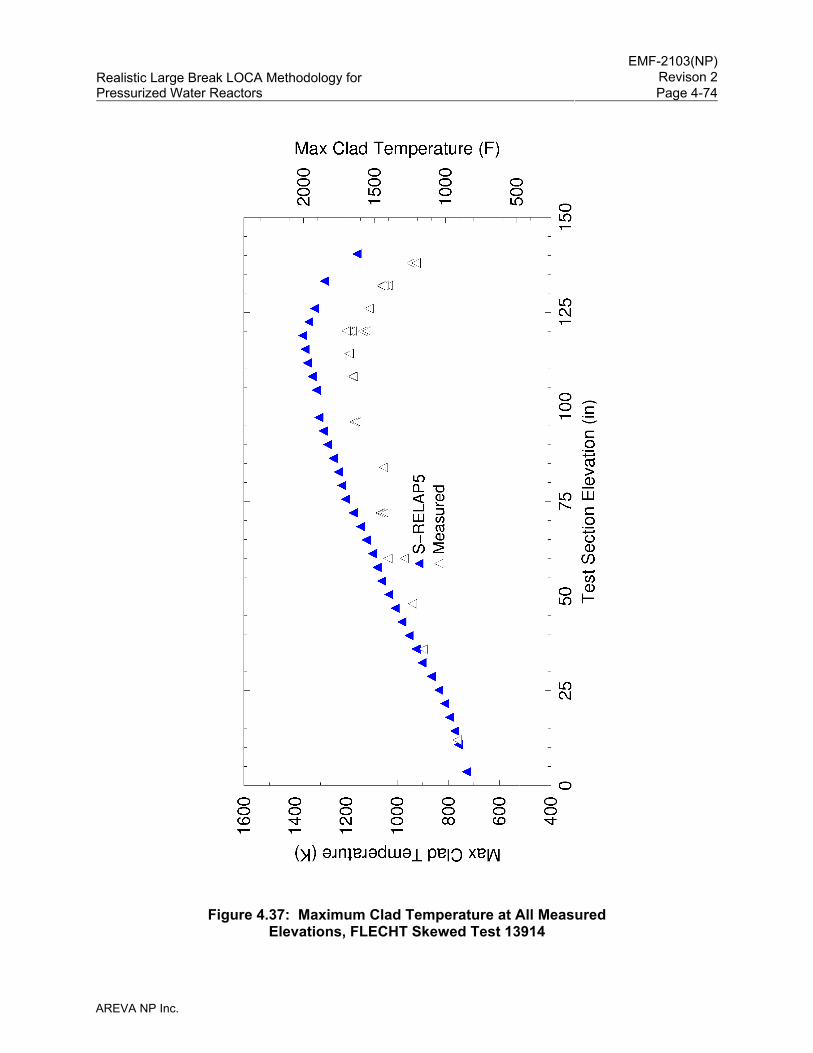
EMF-2103(NP)
Revison 2Realistic Large Break LOCA Methodology for Pressurized Water Reactors Page 4-74
AREVA NP Inc.
Figure 4.37: Maximum Clad Temperature at All Measured Elevations, FLECHT Skewed Test 13914
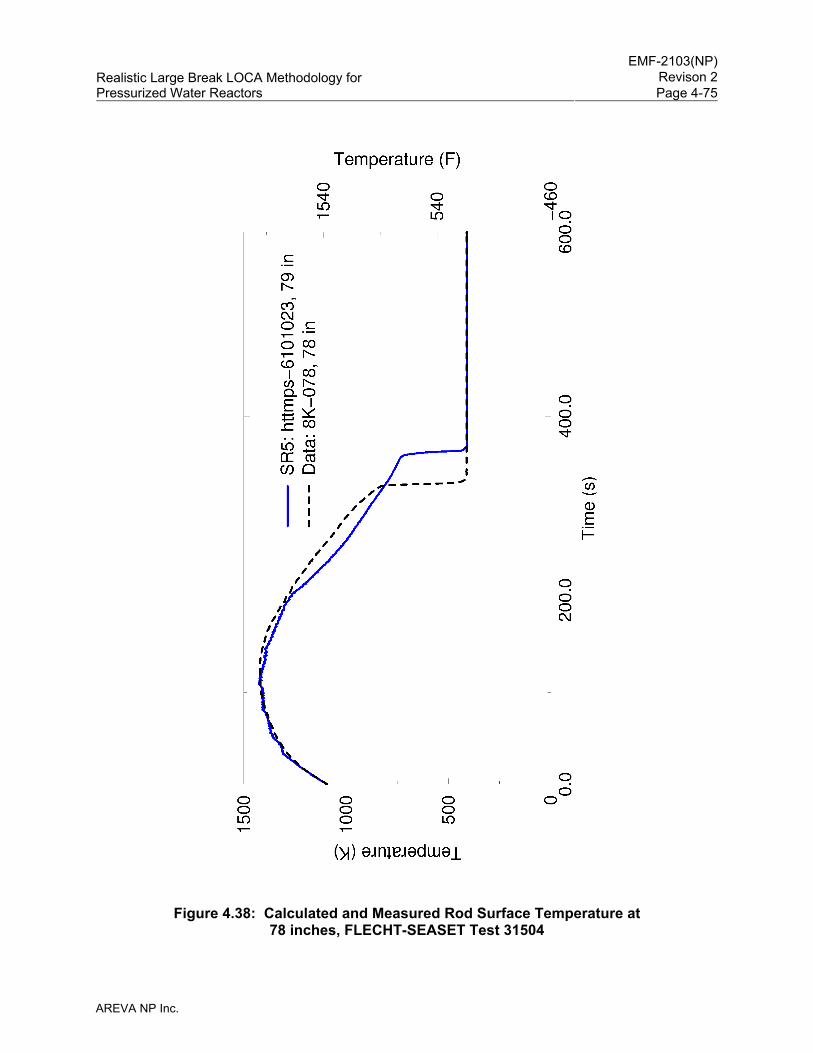
EMF-2103(NP)
Revison 2Realistic Large Break LOCA Methodology for Pressurized Water Reactors Page 4-75
AREVA NP Inc.
Figure 4.38: Calculated and Measured Rod Surface Temperature at 78 inches, FLECHT-SEASET Test 31504
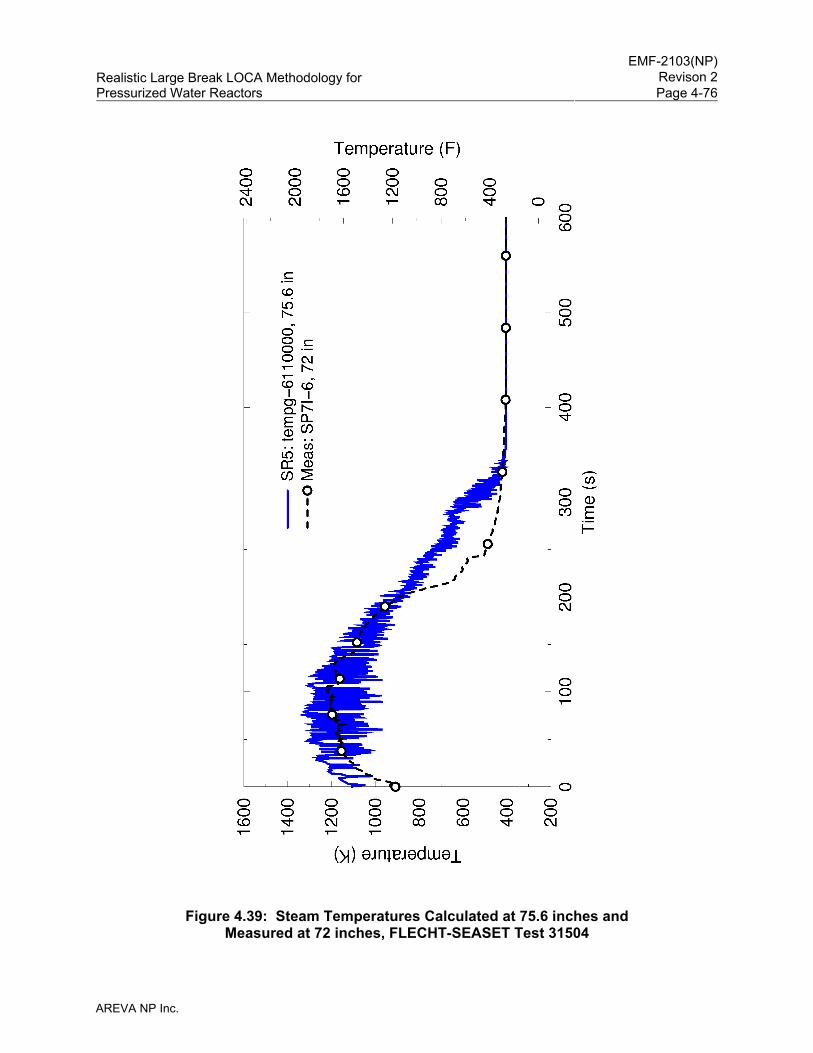
EMF-2103(NP)
Revison 2Realistic Large Break LOCA Methodology for Pressurized Water Reactors Page 4-76
AREVA NP Inc.
Figure 4.39: Steam Temperatures Calculated at 75.6 inches and Measured at 72 inches, FLECHT-SEASET Test 31504
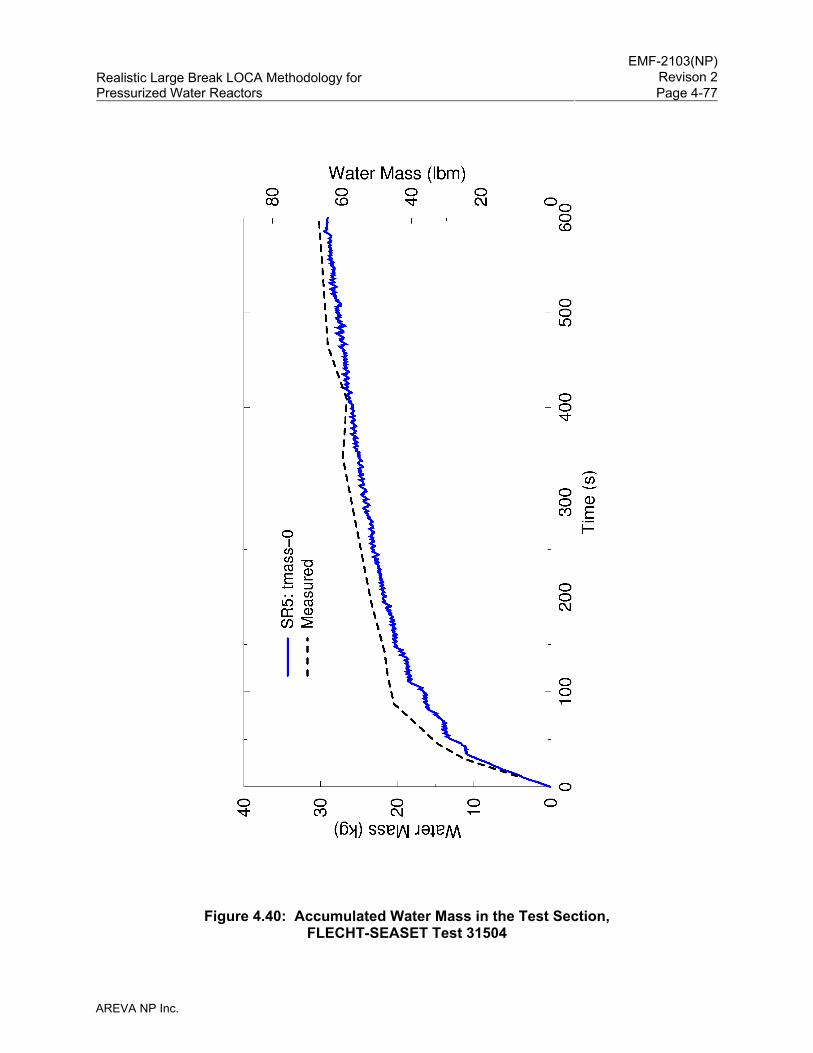
EMF-2103(NP)
Revison 2Realistic Large Break LOCA Methodology for Pressurized Water Reactors Page 4-77
AREVA NP Inc.
Figure 4.40: Accumulated Water Mass in the Test Section, FLECHT-SEASET Test 31504
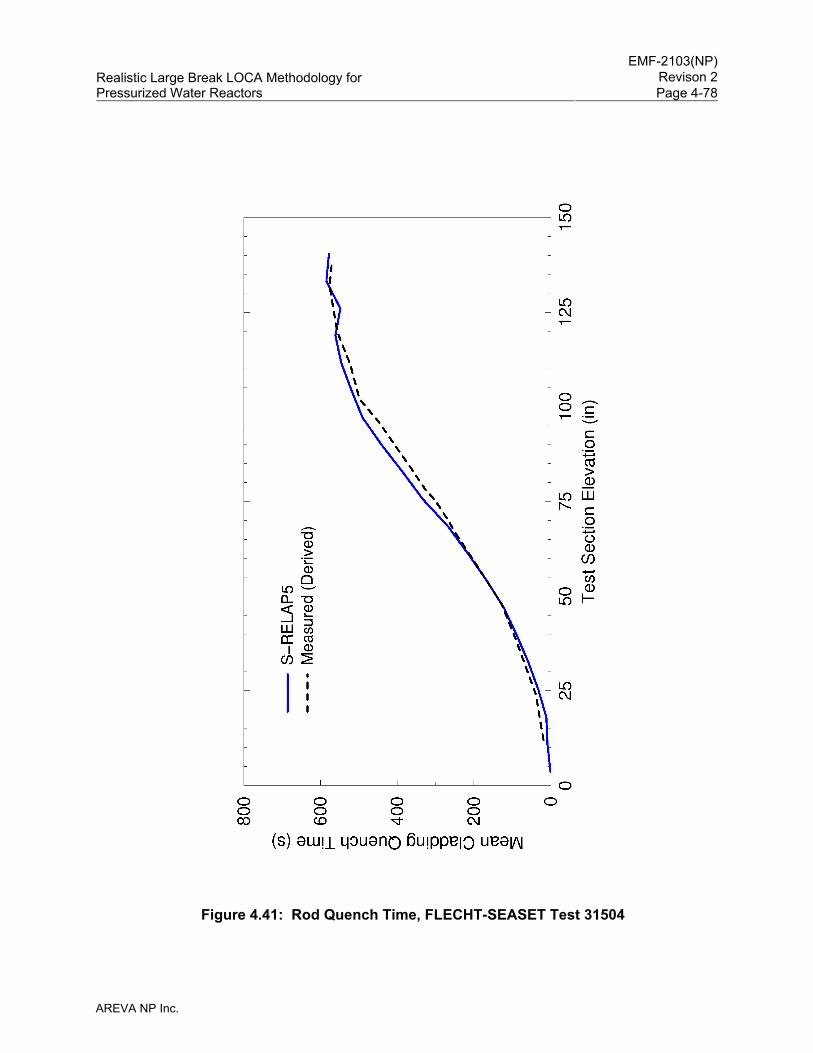
EMF-2103(NP)
Revison 2Realistic Large Break LOCA Methodology for Pressurized Water Reactors Page 4-78
AREVA NP Inc.
Figure 4.41: Rod Quench Time, FLECHT-SEASET Test 31504
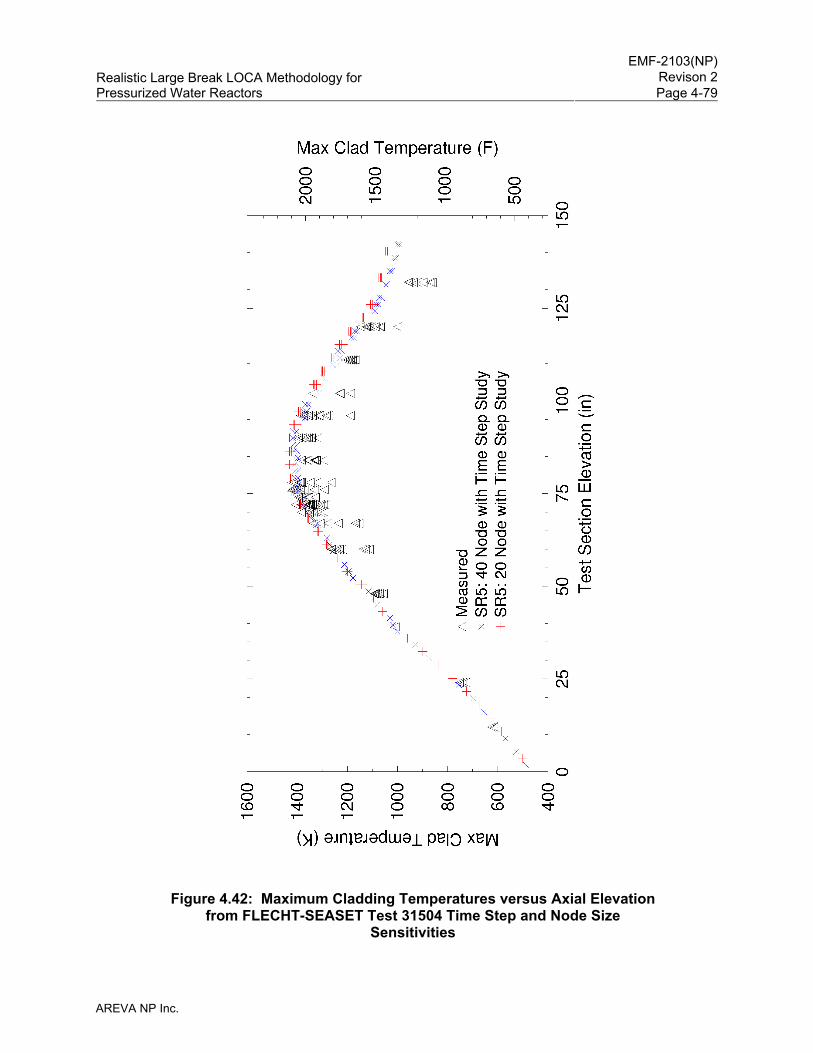
EMF-2103(NP)
Revison 2Realistic Large Break LOCA Methodology for Pressurized Water Reactors Page 4-79
AREVA NP Inc.
Figure 4.42: Maximum Cladding Temperatures versus Axial Elevation from FLECHT-SEASET Test 31504 Time Step and Node Size
Sensitivities
EMF-2103(NP)
Revison 2Realistic Large Break LOCA Methodology for Pressurized Water Reactors Page 4-80
AREVA NP Inc.
4.3.1.7 PDTF SMART Tests
The Product Development Test Facility (PDTF) SMall Array Reflood Test (SMART) tests were
performed by AREVA to show that the HTP spacer was thermodynamically equivalent to a
mixing-vane-type spacer with respect to reflood and PCT. The purpose of the facility was
primarily to demonstrate equivalence between differing fuel designs and not to demonstrate the
performance of either. That being said, a reasonable benchmark of the reflood test results does
offer insight as to the range of capability of the S-RELAP5 code in simulating reflood behavior.
The PDTF SMART tests were similar to the FLECHT-SEASET tests, but performed in an
AREVA facility. The test assemblies were 6x6, full-height, simulated PWR assemblies. The rod
diameter and pitch were characteristic of AREVA's 15x15 PWR fuel design. The test assembly
had a uniform radial power distribution and a chopped cosine axial power distribution. The tests
simulated five different flooding conditions. Of the five flooding rate conditions, four were
constant-flooding-rate tests and one was a variable-flooding-rate test. The
constant-flooding-rate tests had flooding rates of 0.6, 1.0, 2.0, and 4.0 in/s. The
variable-flooding-rate tests started at 8.0 in/s and ramped rapidly to a constant 1.0 in/s flooding
rate. The 0.6 in/s tests were terminated prematurely; therefore, they were eliminated for the
verification and validation of S-RELAP5. The tests selected for the simulation are listed in
Table 4.5. Further details of the tests and the test facility are provided in Reference 5
(Section 3.4).
Two S-RELAP5 models were developed; one with HTP spacer grids and one with mixing-vane
type spacers. Since the test bundle is small, there will be rod-to-shroud radiation heat transfer.
Therefore, for each model, each benchmark was run with and without the core shroud explicitly
modeled. The heated portion of the assembly for these models was divided into 20
hydrodynamic and heat structure sections of approximately equal length, with one additional
section for the unheated portion of the bundle at the top of the assembly. The input model is
described in detail in Section 3.4 of Reference 5.
Figure 4.43 shows the PCT for each of the benchmarks. Figure 4.44 through Figure 4.47 show
the maximum cladding temperature as a function of elevation and independent of time for all
four benchmarks and the two test sets. With a few exceptions, the data lie within or below the
range of the S-RELAP5 predictions.

EMF-2103(NP)
Revison 2Realistic Large Break LOCA Methodology for Pressurized Water Reactors Page 4-81
AREVA NP Inc.
In summary, from the simulation of the PDTF SMART reflood tests, it can be concluded that the
S-RELAP5 code can adequately predict the core thermal-hydraulic behavior during the reflood
phase of a LBLOCA.
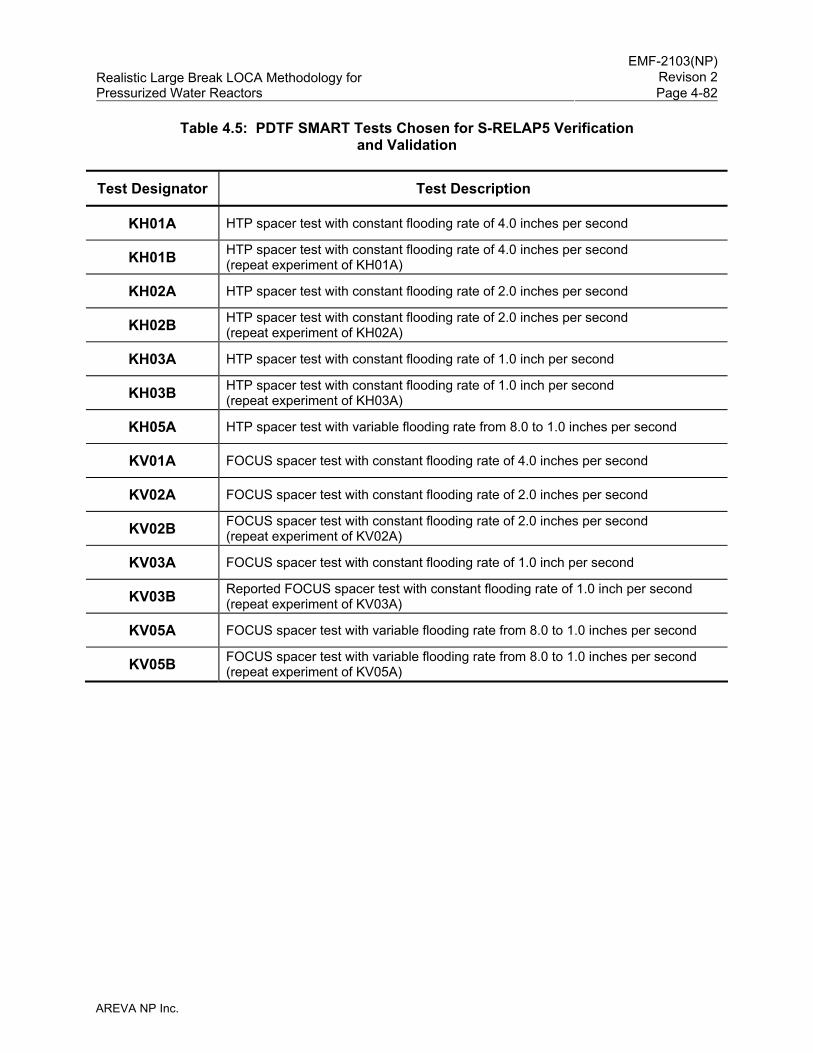
EMF-2103(NP)
Revison 2Realistic Large Break LOCA Methodology for Pressurized Water Reactors Page 4-82
AREVA NP Inc.
Table 4.5: PDTF SMART Tests Chosen for S-RELAP5 Verification and Validation
Test Designator Test Description
KH01A HTP spacer test with constant flooding rate of 4.0 inches per second
KH01B HTP spacer test with constant flooding rate of 4.0 inches per second (repeat experiment of KH01A)
KH02A HTP spacer test with constant flooding rate of 2.0 inches per second
KH02B HTP spacer test with constant flooding rate of 2.0 inches per second (repeat experiment of KH02A)
KH03A HTP spacer test with constant flooding rate of 1.0 inch per second
KH03B HTP spacer test with constant flooding rate of 1.0 inch per second (repeat experiment of KH03A)
KH05A HTP spacer test with variable flooding rate from 8.0 to 1.0 inches per second
KV01A FOCUS spacer test with constant flooding rate of 4.0 inches per second
KV02A FOCUS spacer test with constant flooding rate of 2.0 inches per second
KV02B FOCUS spacer test with constant flooding rate of 2.0 inches per second (repeat experiment of KV02A)
KV03A FOCUS spacer test with constant flooding rate of 1.0 inch per second
KV03B Reported FOCUS spacer test with constant flooding rate of 1.0 inch per second (repeat experiment of KV03A)
KV05A FOCUS spacer test with variable flooding rate from 8.0 to 1.0 inches per second
KV05B FOCUS spacer test with variable flooding rate from 8.0 to 1.0 inches per second (repeat experiment of KV05A)
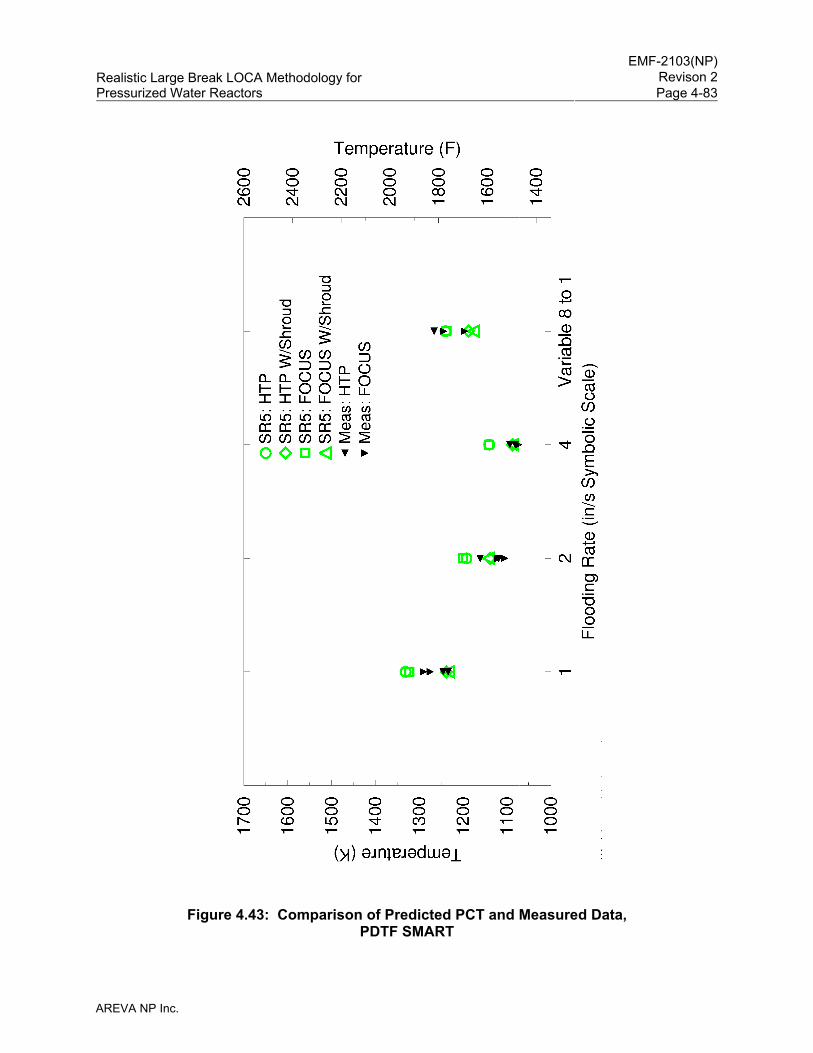
EMF-2103(NP)
Revison 2Realistic Large Break LOCA Methodology for Pressurized Water Reactors Page 4-83
AREVA NP Inc.
Figure 4.43: Comparison of Predicted PCT and Measured Data, PDTF SMART
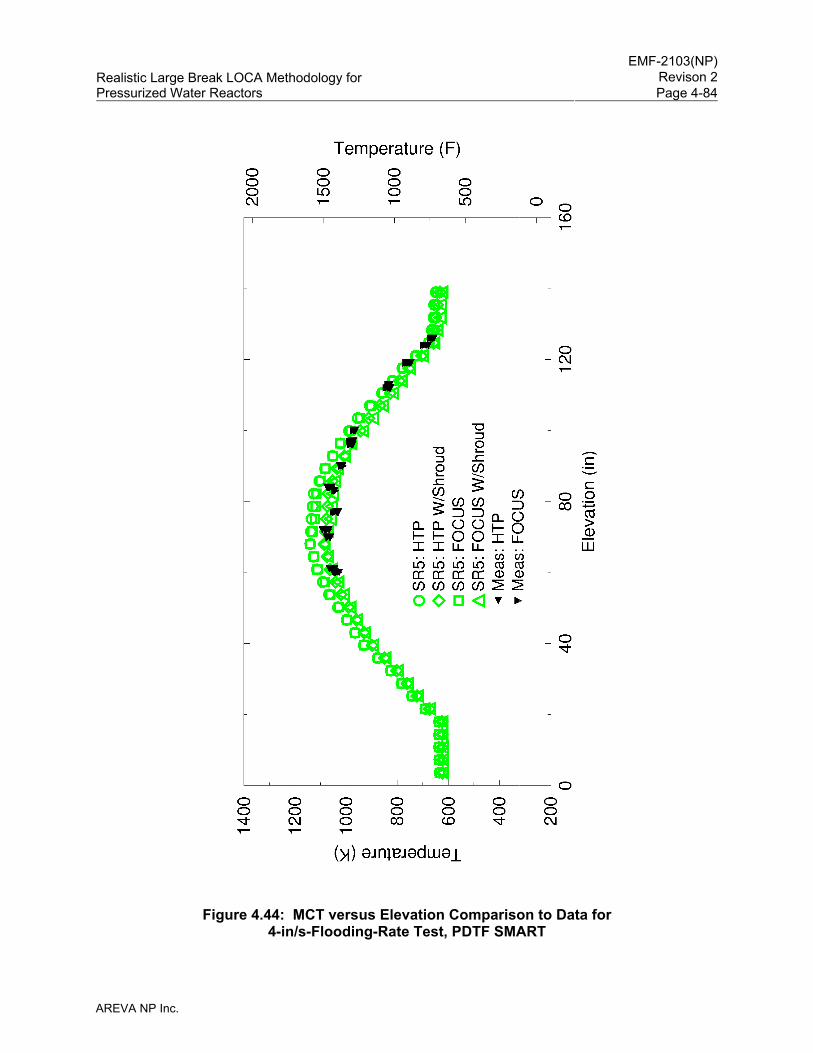
EMF-2103(NP)
Revison 2Realistic Large Break LOCA Methodology for Pressurized Water Reactors Page 4-84
AREVA NP Inc.
Figure 4.44: MCT versus Elevation Comparison to Data for 4-in/s-Flooding-Rate Test, PDTF SMART
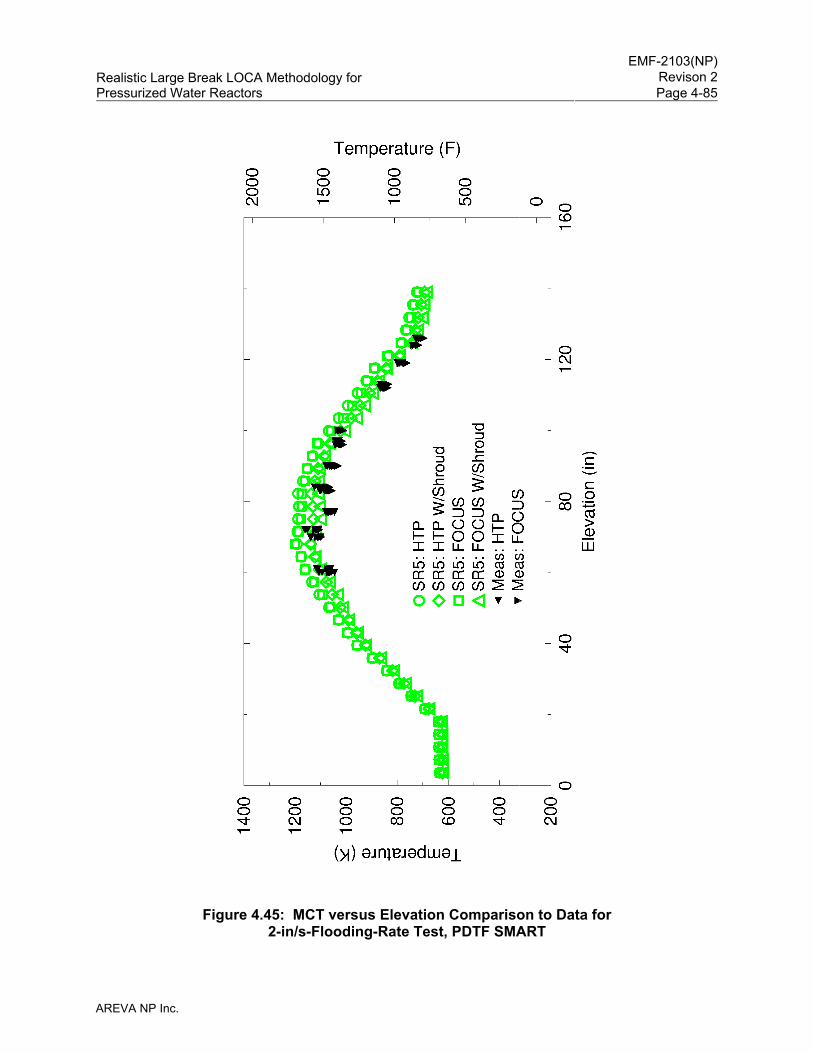
EMF-2103(NP)
Revison 2Realistic Large Break LOCA Methodology for Pressurized Water Reactors Page 4-85
AREVA NP Inc.
Figure 4.45: MCT versus Elevation Comparison to Data for 2-in/s-Flooding-Rate Test, PDTF SMART
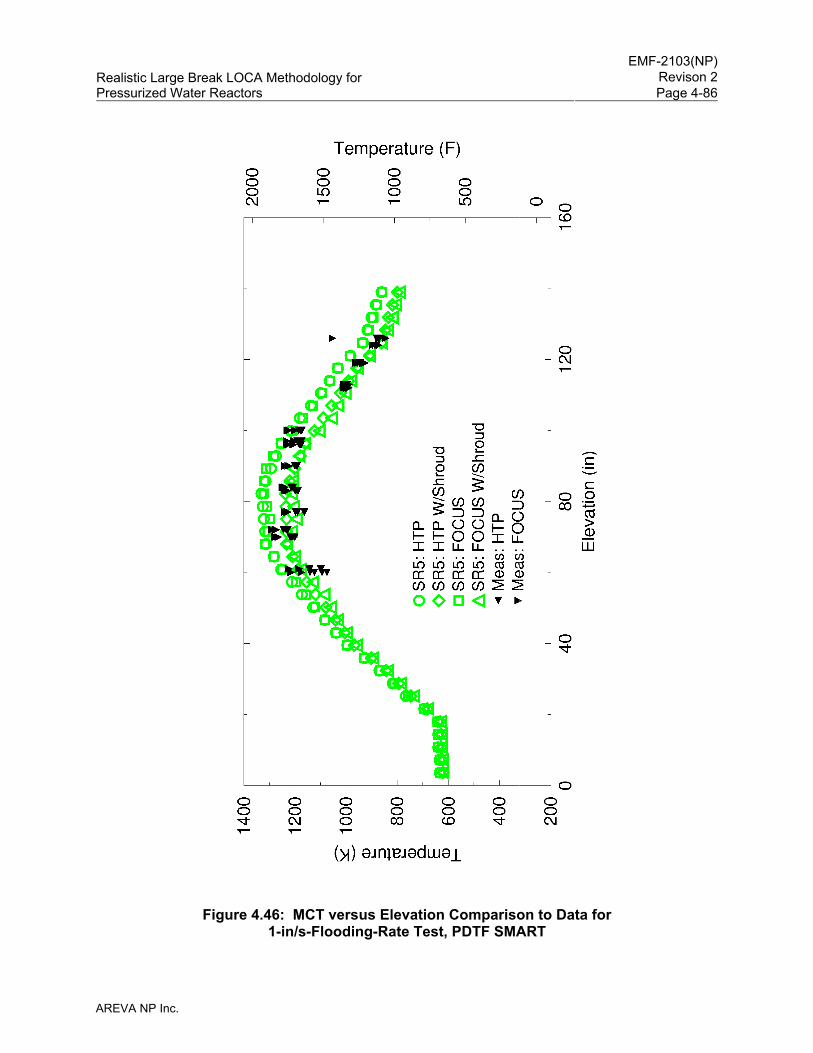
EMF-2103(NP)
Revison 2Realistic Large Break LOCA Methodology for Pressurized Water Reactors Page 4-86
AREVA NP Inc.
Figure 4.46: MCT versus Elevation Comparison to Data for 1-in/s-Flooding-Rate Test, PDTF SMART
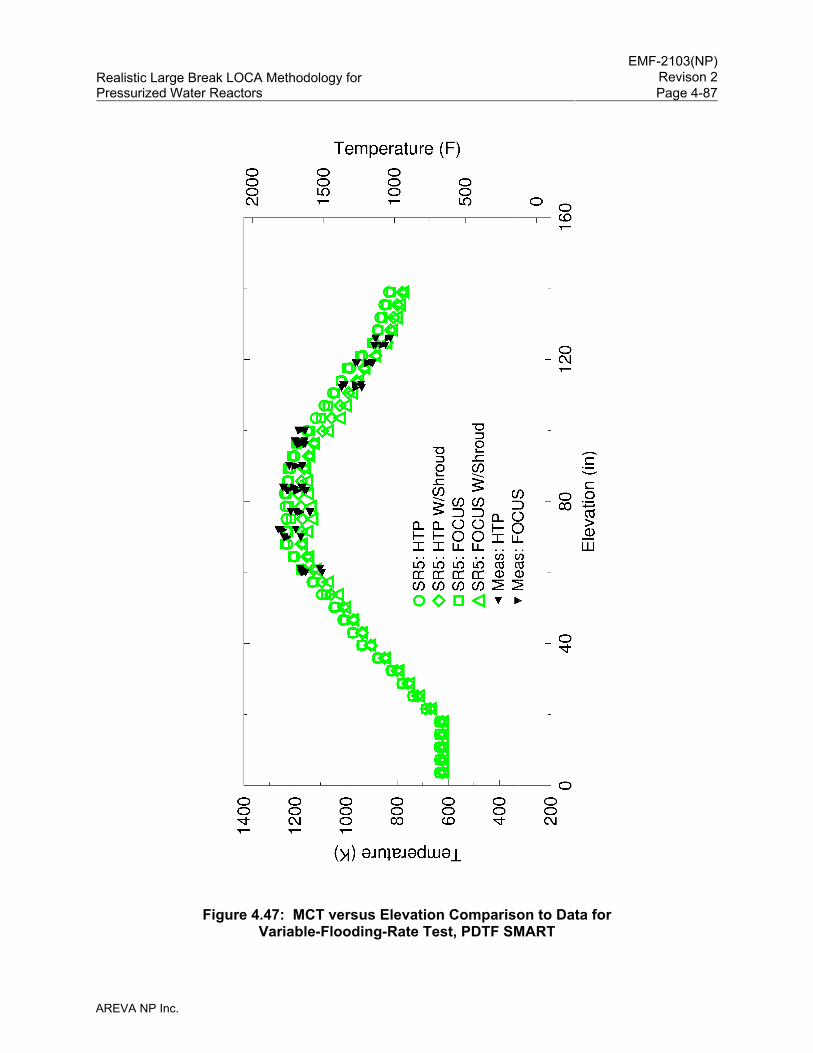
EMF-2103(NP)
Revison 2Realistic Large Break LOCA Methodology for Pressurized Water Reactors Page 4-87
AREVA NP Inc.
Figure 4.47: MCT versus Elevation Comparison to Data for Variable-Flooding-Rate Test, PDTF SMART
EMF-2103(NP)
Revison 2Realistic Large Break LOCA Methodology for Pressurized Water Reactors Page 4-88
AREVA NP Inc.
4.3.1.8 Marviken Tests
Nine Marviken full-scale critical flow tests were simulated using S-RELAP5 to provide
uncertainty information for the critical flow model. The Marviken full-scale critical flow test data
were used in the CSAU methodology (Reference 4) to determine the critical flow multipliers and
uncertainties for the break flow model. The Marviken test data are also widely used in
assessing critical flow models for various system codes. The tests selected for the
assessments are Tests 2, 6, 8, 16, 17, 20, 22, 24, and 25.
The Marviken test facility and test data are well documented. The facility has four main parts:
(1) a full-scale boiling water reactor (BWR) vessel; (2) a discharge pipe attached to the bottom
of the vessel; (3) a test nozzle connected to the downstream end of the discharge pipe, and
(4) a rupture disk assembly attached to the downstream end of the nozzle. Nozzles of various
length-to-diameter (L/D) ratios were used in the tests.
Since the primary purpose of the test simulation is to benchmark the HEM critical flow model in
S-RELAP5, the break junction and the upstream node L/D are important in calculating the
critical flow. The test vessel was modeled using 42 nodes with fine nodalization at the bottom of
the tank, in order to properly represent the fluid conditions at the inlet to the discharge piping.
The discharge piping, together with the nozzle, was modeled using seven nodes. The node that
connects to the break junction consisted of the nozzle and a 0.4 meter discharge pipe resulting
in an L/D variation for this node from about 1.1 to 5.0. The L/D variation for the break node in
the plant cases typically are within this range. The HEM critical flow model option and the
abrupt area change option “2” were selected at the break junction. Details of the test facility, the
S-RELAP5 input model, and the results are discussed in detail in Section 3.5 of Reference 5. A
summary of the results is discussed below.
The S-RELAP5 calculated critical flow mass fluxes and the measured values are sampled at
one second intervals. A total of 535 pairs of calculated and measured values from the nine
tests were collected. Figure 4.48 to Figure 4.56 show the code-to-data comparisons of mass
flow rates at the break. The calculations agree well with the data. The worst situation is in the
subcooled-to-two-phase transition region where the differences are larger.
Figure 4.57 shows the comparison of the calculated mass flux versus the data for all nine cases.
The figure clearly shows that the comparison points are uniformly scattered around the
EMF-2103(NP)
Revison 2Realistic Large Break LOCA Methodology for Pressurized Water Reactors Page 4-89
AREVA NP Inc.
45 degree line. The ratios of (calculated mass flux minus data)-to-data are used to compute the
statistics.
The ratios given in Figure 4.58 were evaluated first by separating the subcooled choking and
two-phase choking and then as an overall data set. [
] Reference 2
(Section 6.1.2) states the maximum extended mass flux error in two fluid code simulations of
Marviken is on the order of ±20 percent; the Marviken data report (Reference 24) gives a mass
flux error of ±15 percent. Thus, the calculation benchmark uncertainty is approximately equal to
the reported test value, indicating excellent agreement.
In summary, the HEM critical flow model in S-RELAP5 was shown to adequately calculate the
critical break flow.
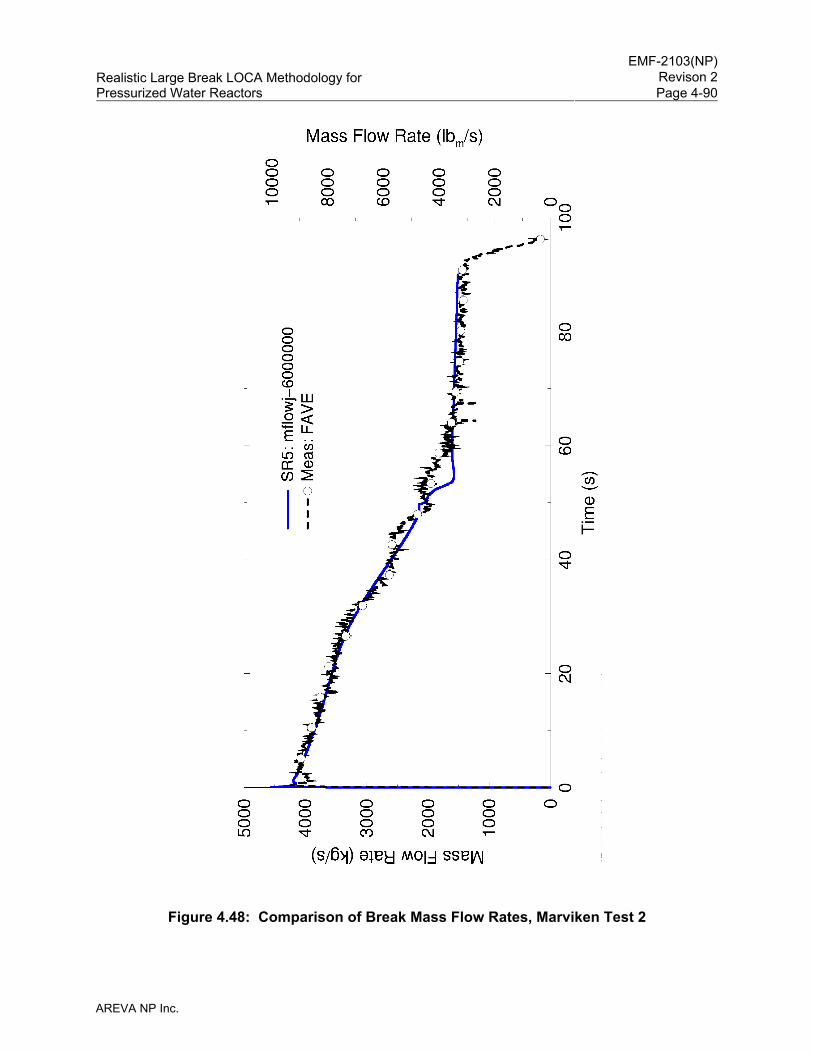
EMF-2103(NP)
Revison 2Realistic Large Break LOCA Methodology for Pressurized Water Reactors Page 4-90
AREVA NP Inc.
Figure 4.48: Comparison of Break Mass Flow Rates, Marviken Test 2
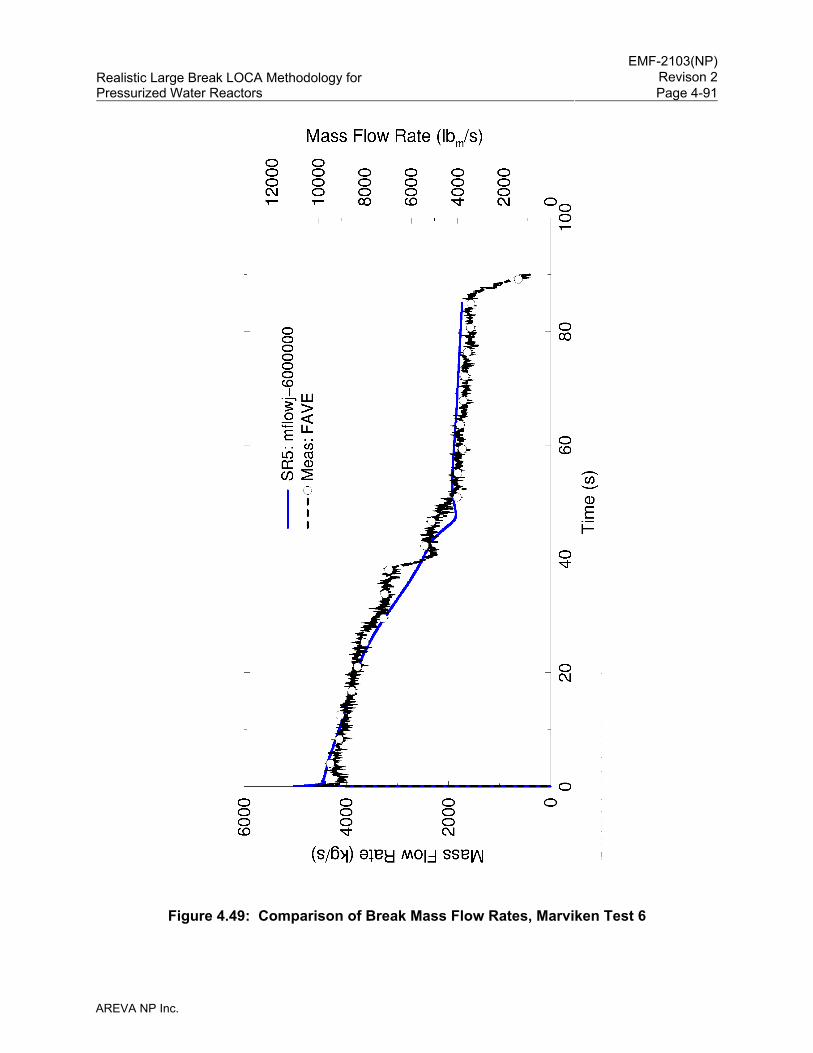
EMF-2103(NP)
Revison 2Realistic Large Break LOCA Methodology for Pressurized Water Reactors Page 4-91
AREVA NP Inc.
Figure 4.49: Comparison of Break Mass Flow Rates, Marviken Test 6
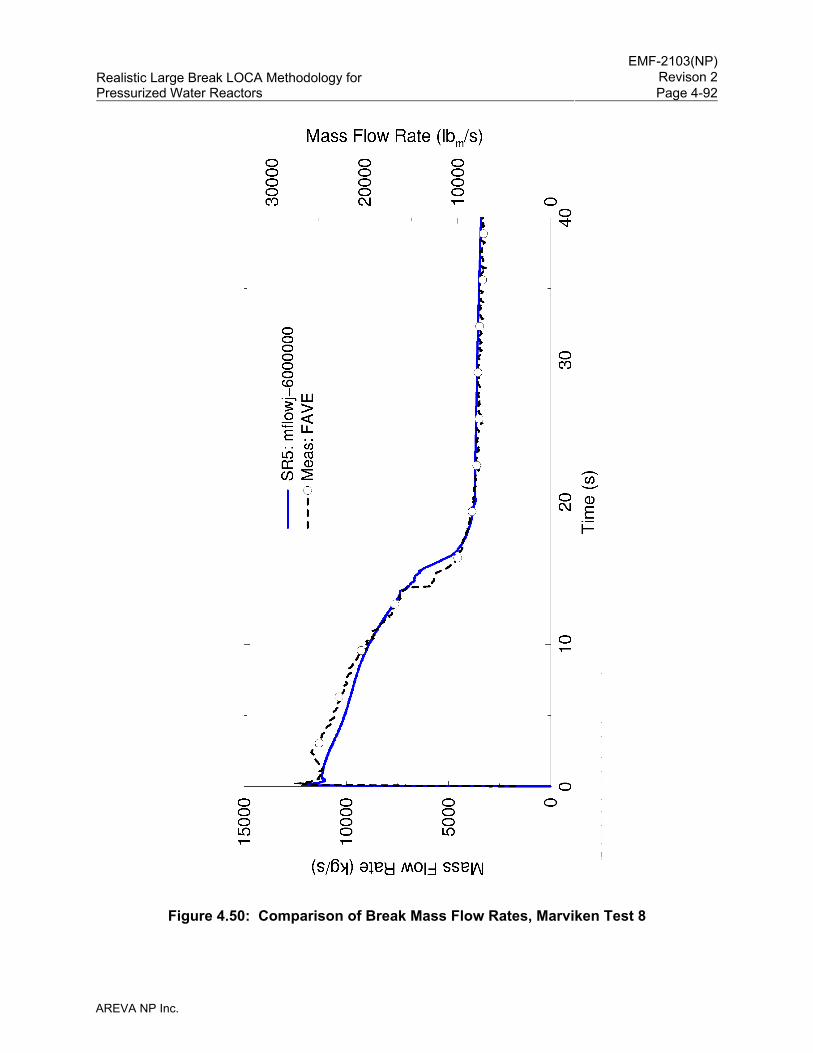
EMF-2103(NP)
Revison 2Realistic Large Break LOCA Methodology for Pressurized Water Reactors Page 4-92
AREVA NP Inc.
Figure 4.50: Comparison of Break Mass Flow Rates, Marviken Test 8
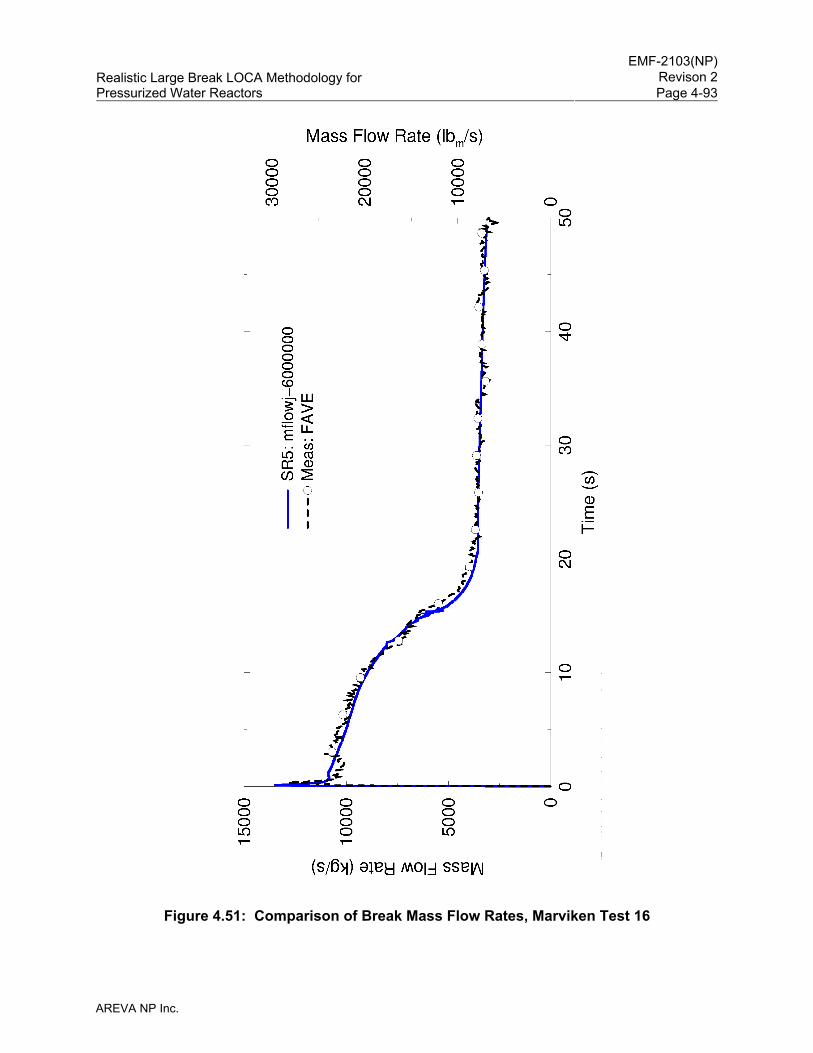
EMF-2103(NP)
Revison 2Realistic Large Break LOCA Methodology for Pressurized Water Reactors Page 4-93
AREVA NP Inc.
Figure 4.51: Comparison of Break Mass Flow Rates, Marviken Test 16
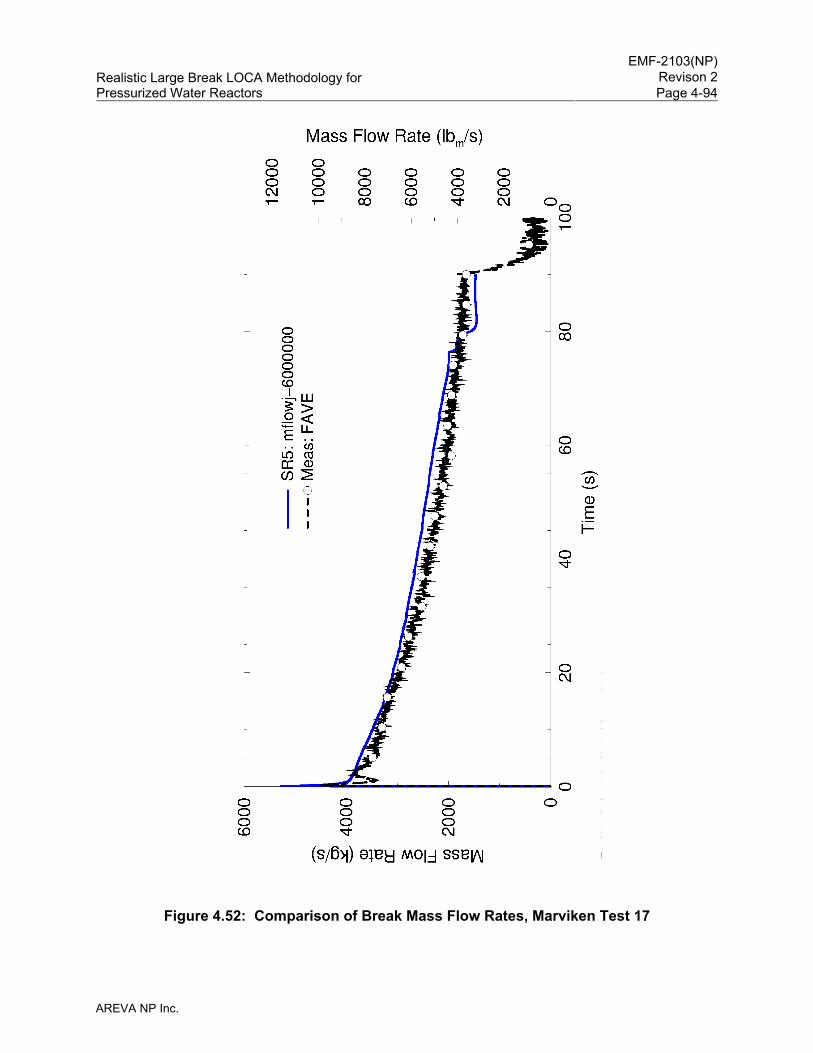
EMF-2103(NP)
Revison 2Realistic Large Break LOCA Methodology for Pressurized Water Reactors Page 4-94
AREVA NP Inc.
Figure 4.52: Comparison of Break Mass Flow Rates, Marviken Test 17
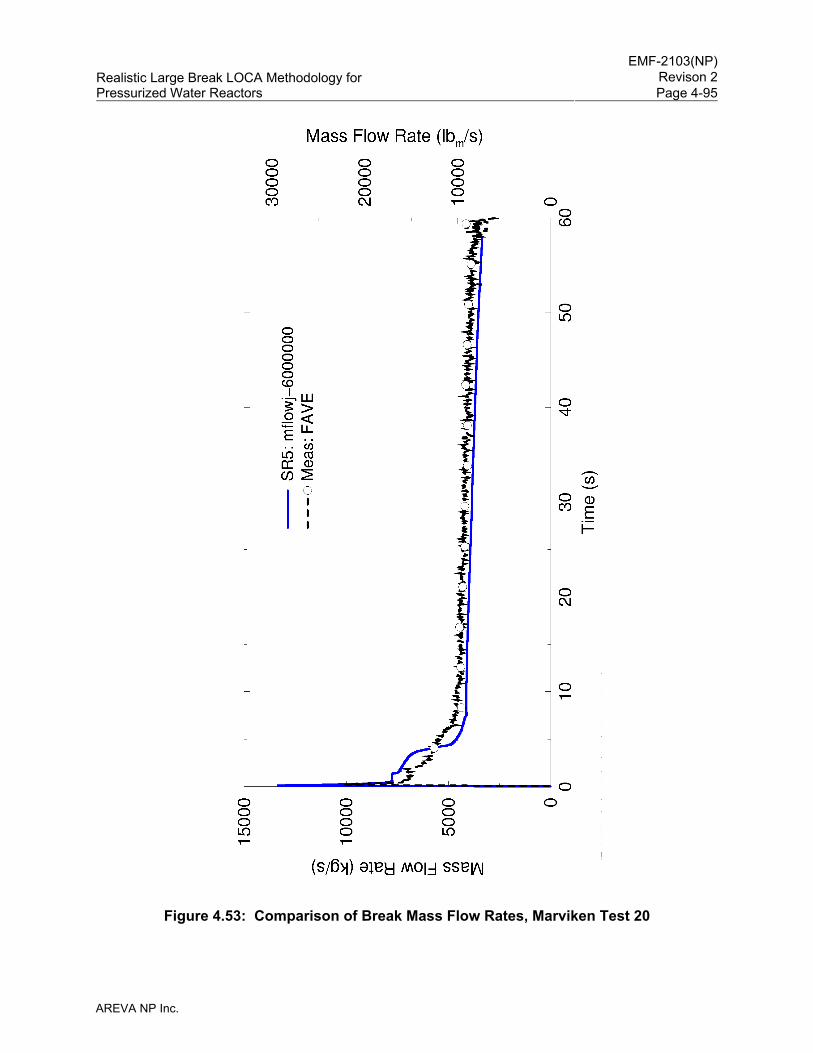
EMF-2103(NP)
Revison 2Realistic Large Break LOCA Methodology for Pressurized Water Reactors Page 4-95
AREVA NP Inc.
Figure 4.53: Comparison of Break Mass Flow Rates, Marviken Test 20
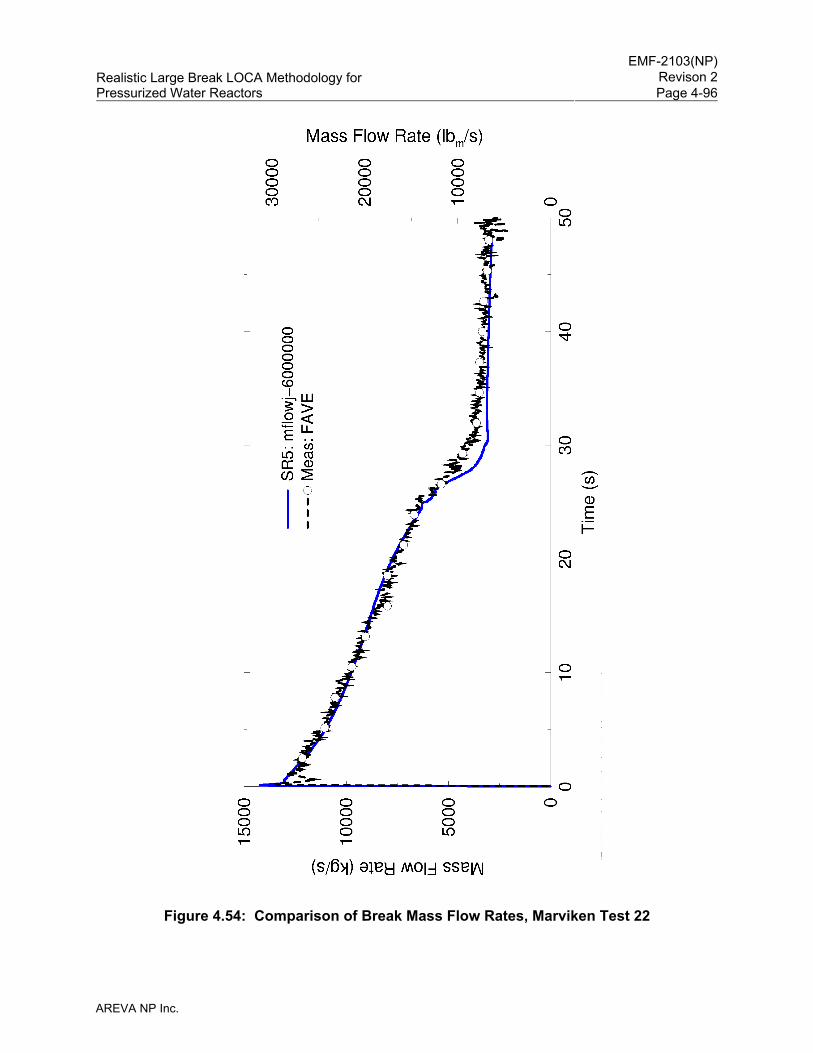
EMF-2103(NP)
Revison 2Realistic Large Break LOCA Methodology for Pressurized Water Reactors Page 4-96
AREVA NP Inc.
Figure 4.54: Comparison of Break Mass Flow Rates, Marviken Test 22
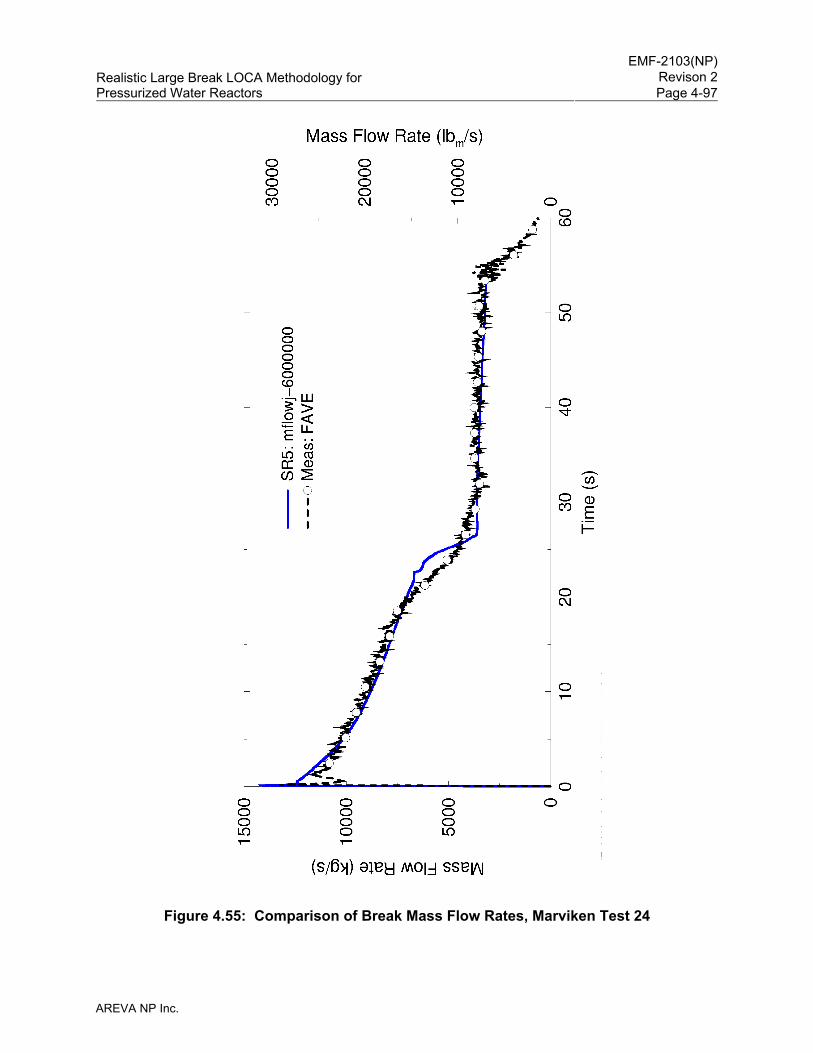
EMF-2103(NP)
Revison 2Realistic Large Break LOCA Methodology for Pressurized Water Reactors Page 4-97
AREVA NP Inc.
Figure 4.55: Comparison of Break Mass Flow Rates, Marviken Test 24
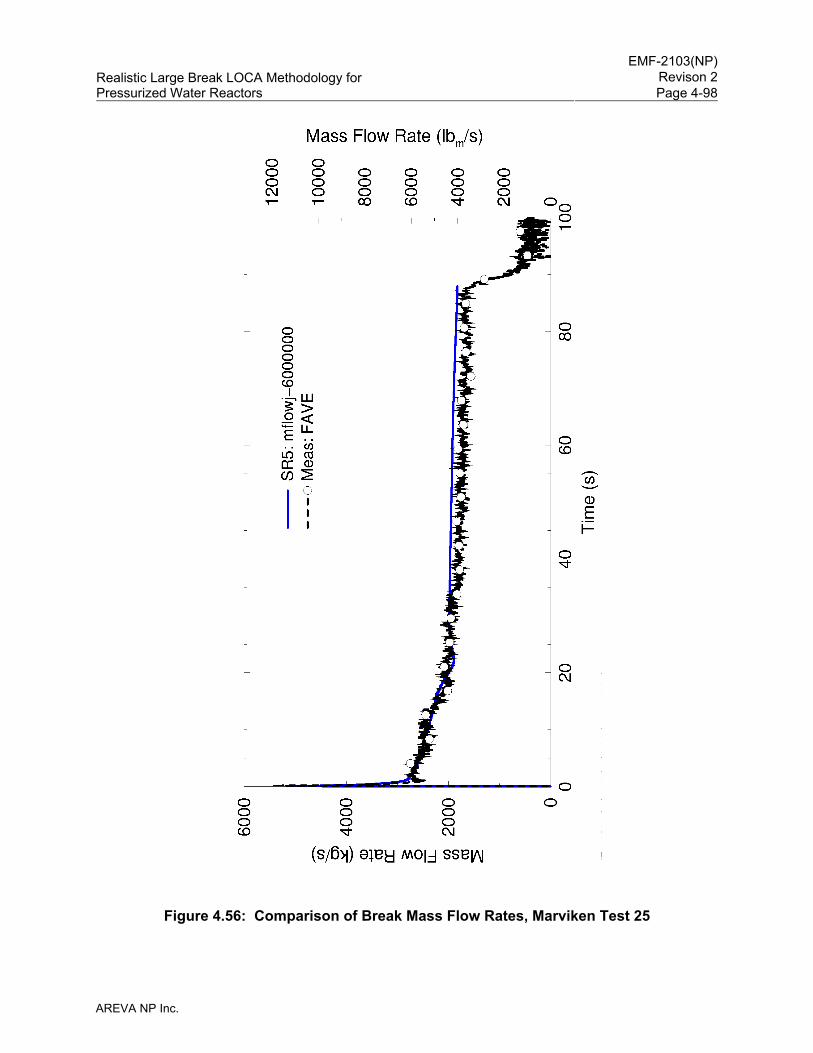
EMF-2103(NP)
Revison 2Realistic Large Break LOCA Methodology for Pressurized Water Reactors Page 4-98
AREVA NP Inc.
Figure 4.56: Comparison of Break Mass Flow Rates, Marviken Test 25
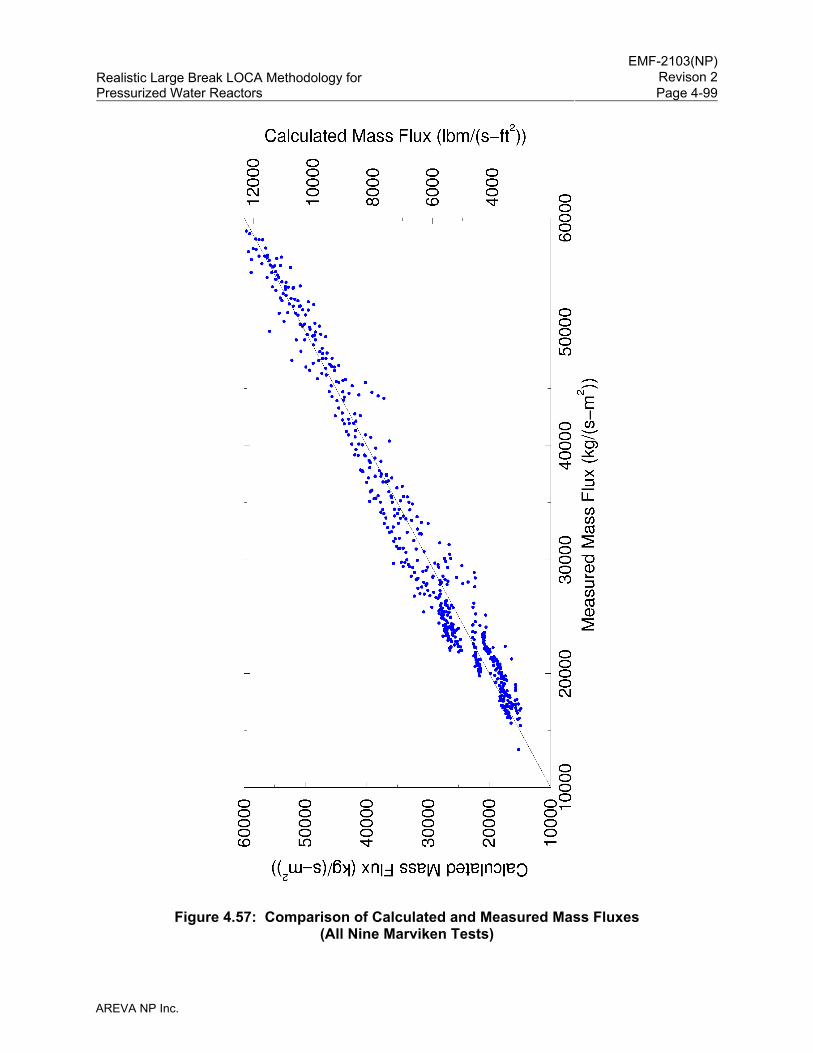
EMF-2103(NP)
Revison 2Realistic Large Break LOCA Methodology for Pressurized Water Reactors Page 4-99
AREVA NP Inc.
Figure 4.57: Comparison of Calculated and Measured Mass Fluxes (All Nine Marviken Tests)
EMF-2103(NP)
Revison 2Realistic Large Break LOCA Methodology for Pressurized Water Reactors Page 4-100
AREVA NP Inc.
Figure 4.58: Break Flow Uncertainty, Marviken Tests
EMF-2103(NP)
Revison 2Realistic Large Break LOCA Methodology for Pressurized Water Reactors Page 4-101
AREVA NP Inc.
4.3.1.9 Westinghouse/EPRI 1/3 Scale Tests
Twenty-three Westinghouse/EPRI 1/3-scale tests were simulated using S-RELAP5 to assess
the ability of the code to calculate the cold leg condensation during the accumulator and
pumped-safety injection periods of a LBLOCA.
The principal feature of the test facility was a simulated cold leg break in a 10.42-inch, inside
diameter straight pipe. Two ECC injection points were provided so that the pipe lengths
downstream of the injection point were either scaled to a typical PWR or were full length.
Superheated steam from the boiler flowed through the inlet surge tank and an inlet flow
chamber before entering the test section. The inlet flow chamber was designed to yield a
uniform velocity profile entering the test section. Cold water from the storage tank entered the
test section through either the scaled length ECC injection point or the full length injection point.
The effluent fluid exited the test section into the outlet surge tank. The surge tanks upstream
and downstream of the test section help maintain constant pressure boundary conditions for
circumstances where large pressure oscillations occurred inside the test section. A tank of air
connected to the downstream surge tank is used to control the test specific constant pressure
boundary conditions. The test section was fitted at the top and bottom with thermocouples,
which provided temperature data for both the vapor and liquid phase in the case of stratified
flow inside the test section. Pressure drops along the test section also were measured.
One of the important phenomena identified in PWR LBLOCA is the mixing of the ECCS water
with the steam in the cold leg during the LBLOCA refill and reflood phases. The controlling
parameter is the interphase condensation heat transfer coefficient. As part of Revision 2 of the
RLBLOCA methodology, an interphase condensation model was developed using UPTF
Tests 8 and 25, and several Westinghouse/EPRI 1/3-scale tests. These tests generally cover
both the accumulator and pumped injection period of a LBLOCA. The cold leg condensation
model is summarized in Section 4.3.3.1.14 and discussed in detail in Section 5.2 of
Reference 5.
Section 3.8 of Reference 5 documents the assessment results and a sensitivity study of the
multiplier on the interfacial heat transfer coefficient. The results are used to support the overall
application of the RLBLOCA methodology.
EMF-2103(NP)
Revison 2Realistic Large Break LOCA Methodology for Pressurized Water Reactors Page 4-102
AREVA NP Inc.
The S-RELAP5 input model consists of the test section and the upstream and downstream
surge tanks. The nodalization of the test section is consistent with the RLBLOCA methodology
guidelines. The cold leg piping from the ECC injection point to the downcomer is divided into
three nodes. The nodalization of the cold leg piping upstream from the ECC injection point is not
important since it only provides the steam flow boundary to the model. The condensation model
is used in the ECC injection and cold leg nodes downstream of the injection node. Time
dependent volumes and junctions are used to provide the flow and pressure boundary
conditions. Air is modeled in the test vessel boundary node in order to allow air flow back into
the test sections (which was observed in some of the high ECC injection tests).
For the S-RELAP5 assessments, the difference between the liquid effluent temperature and the
injection temperature was the primary data because it relates directly to the interfacial
condensation heat transfer rate over the entire test section. The capability of S-RELAP5 in
predicting the interfacial condensation heat transfer in the mixing of ECCS water and steam can
be assessed by calculating and comparing this temperature difference to measured data.
Twenty three runs were assessed; thirteen correspond to the reflood phase after accumulator
injection and the other ten to the reflood accumulator injection phase. The primary result sought
in this study is the effluent liquid temperature (i.e., the liquid phase temperature at the exit of the
test section). For all the cases run, the thermal-hydraulic variables were sufficiently steady at
100 seconds except for several reflood-accumulator tests. Hence the effluent temperatures at
100 seconds were used to compare with the measured data.
Table 4.6 compares the calculated and measured effluent temperature for all the cases. The
information from Table 4.6 is plotted in Figure 4.59. The total amount of interfacial heat transfer
is approximately proportional to the difference between the liquid effluent temperature and the
inlet temperature (i.e., ECC liquid temperature). Denote this difference by ΔT. The ratio of the
calculated ΔT and the measured ΔT approximates the ratio between the code-predicted
condensation heat transfer and the actual value. Hence, R is defined as
( )( )
effluent in measured
effluent in calculated
T TR
T T−
=− .
EMF-2103(NP)
Revison 2Realistic Large Break LOCA Methodology for Pressurized Water Reactors Page 4-103
AREVA NP Inc.
Deviation from unity of R represents a code bias in predicting the interfacial condensation heat
transfer during the ECC/steam mixing process. [
] The results show that S-RELAP5 calculated acceptable cold leg condensation rates
for the tests that cover both the scaled accumulator and the pumped injection ECC flow rates.
In summary, the EPRI 1/3-scaled test benchmarks show that by using the cold leg condensation
model described in Section 4.3.3.1.14, S-RELAP5 will calculate acceptable cold leg
condensation rates during the accumulator and pumped injection phases of a LBLOCA in a
PWR.
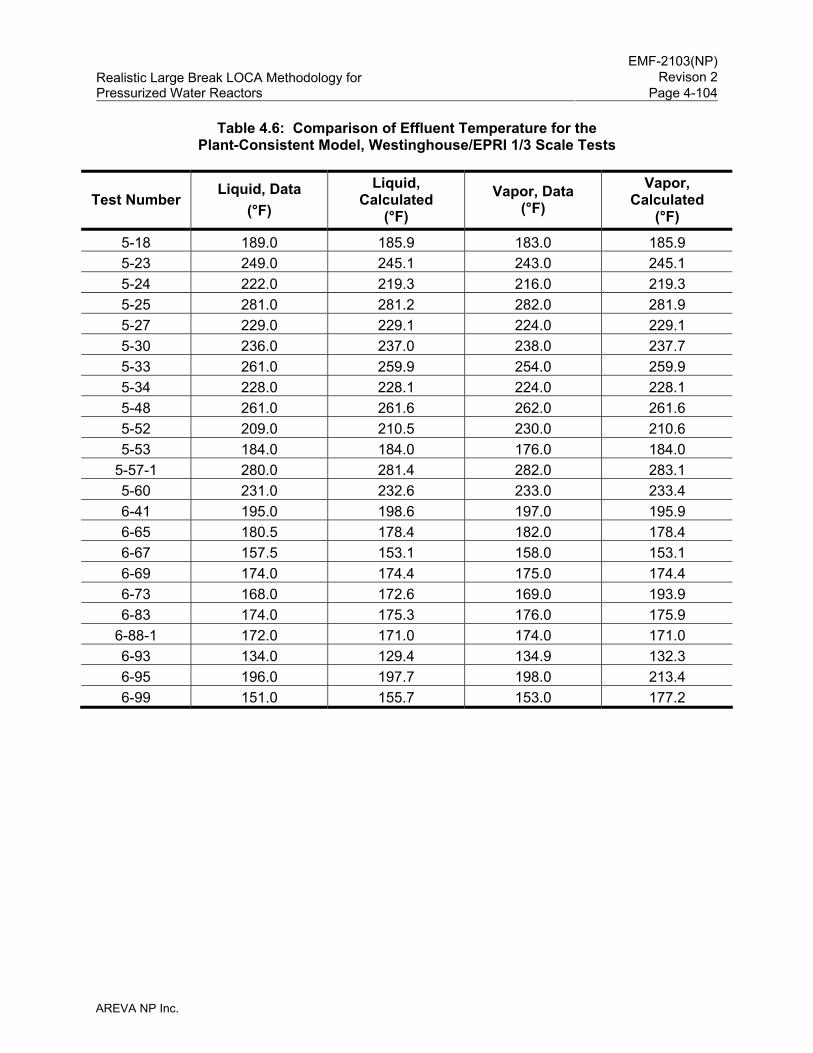
EMF-2103(NP)
Revison 2Realistic Large Break LOCA Methodology for Pressurized Water Reactors Page 4-104
AREVA NP Inc.
Table 4.6: Comparison of Effluent Temperature for the Plant-Consistent Model, Westinghouse/EPRI 1/3 Scale Tests
Test Number Liquid, Data
(°F)
Liquid, Calculated
(°F) Vapor, Data
(°F) Vapor,
Calculated (°F)
5-18 189.0 185.9 183.0 185.9 5-23 249.0 245.1 243.0 245.1 5-24 222.0 219.3 216.0 219.3 5-25 281.0 281.2 282.0 281.9 5-27 229.0 229.1 224.0 229.1 5-30 236.0 237.0 238.0 237.7 5-33 261.0 259.9 254.0 259.9 5-34 228.0 228.1 224.0 228.1 5-48 261.0 261.6 262.0 261.6 5-52 209.0 210.5 230.0 210.6 5-53 184.0 184.0 176.0 184.0
5-57-1 280.0 281.4 282.0 283.1 5-60 231.0 232.6 233.0 233.4 6-41 195.0 198.6 197.0 195.9 6-65 180.5 178.4 182.0 178.4 6-67 157.5 153.1 158.0 153.1 6-69 174.0 174.4 175.0 174.4 6-73 168.0 172.6 169.0 193.9 6-83 174.0 175.3 176.0 175.9
6-88-1 172.0 171.0 174.0 171.0 6-93 134.0 129.4 134.9 132.3 6-95 196.0 197.7 198.0 213.4 6-99 151.0 155.7 153.0 177.2
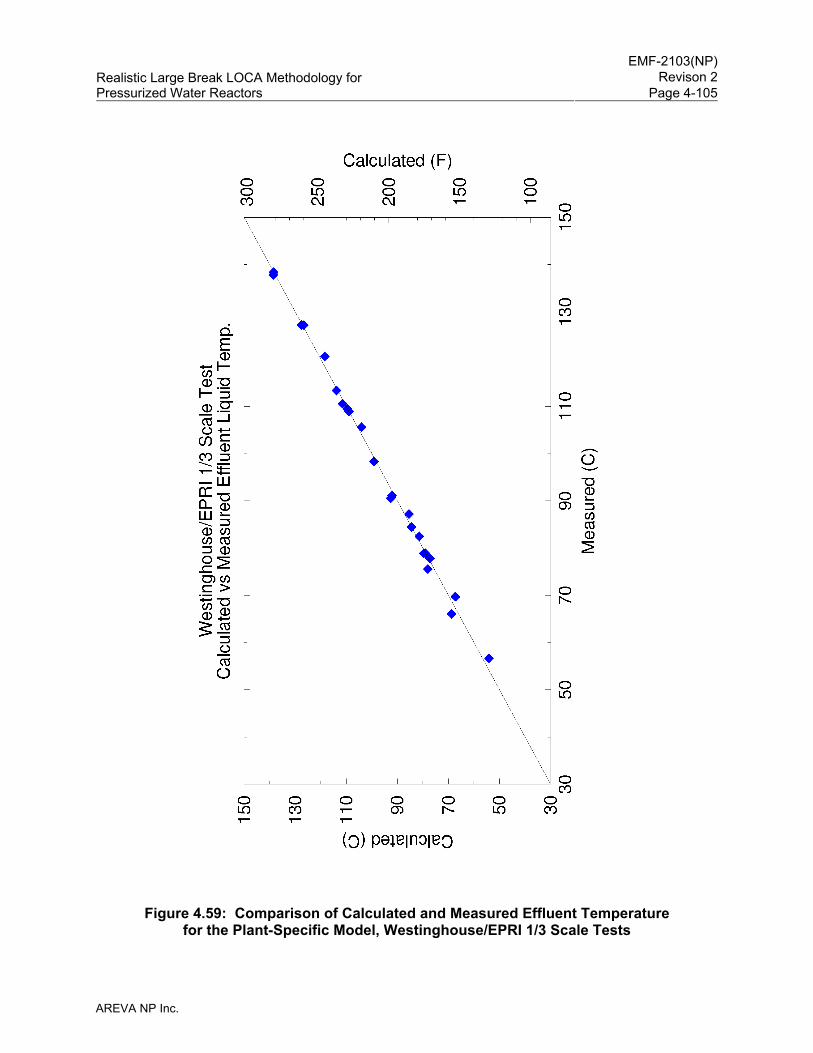
EMF-2103(NP)
Revison 2Realistic Large Break LOCA Methodology for Pressurized Water Reactors Page 4-105
AREVA NP Inc.
Figure 4.59: Comparison of Calculated and Measured Effluent Temperature for the Plant-Specific Model, Westinghouse/EPRI 1/3 Scale Tests
EMF-2103(NP)
Revison 2Realistic Large Break LOCA Methodology for Pressurized Water Reactors Page 4-106
AREVA NP Inc.
4.3.1.10 AREVA CCFL Tests
As described in Section 3.9 of Reference 25, a small-scale test facility was used to flow test the
upper tie plates (UTPs) of interest and determine whether or not the S-RELAP5 calculation of
CCFL was sufficient (i.e., accurate or conservative). UTPs from AREVA designs for
Westinghouse 15x15 and 17x17 fuel assemblies and a CE 14x14 fuel assembly were obtained
and flow tested in the mini-loop of the PDTF. The testing consisted of measuring the liquid
penetration in an upflow air channel containing the UTP. CCFL parameters were estimated
from the measured data and compared to the corresponding flooding curve predicted for the
geometry by the Bankoff correlation (Reference 11) used in the S-RELAP5 CCFL model.
For the geometries used in the experiments, the following hydraulic diameters and resulting
intercept (c') were used to calculate the Bankoff flooding curves used for comparison purposes:
Figure 4.60, Figure 4.61, and Figure 4.62 compare mini-loop data with Bankoff. In all cases, the
measured data are conservative (acceptable agreement) with respect to the flooding curves
using the RLBLOCA parameters [ ].
In summary, the Bankoff CCFL model applied to the AREVA Mini-Loop CCFL data
demonstrates this model computes conservative CCFL with respect to the measured CCFL
from representative UTPs.

Realistic Large Break LOCA Methodology forPressurized Water Reactors
2.0
EMF-2103(NP)Revison 2
Page 4-107
1.5
~Q)-Q)
E~ 1.0co0Q)N"0coQ)-co-::::l~ 0.5
D
DD
D
D
-- Bankoff correlationD data
0.00.0 0.5 1.0 1.5
Kutateladze Parameters (Kr1/2)
2.0
Figure 4.60: Comparison between Mini-Loop CCFL Data of aWestinghouse 17x17 UTP and Bankoff
AREVA NP Inc.
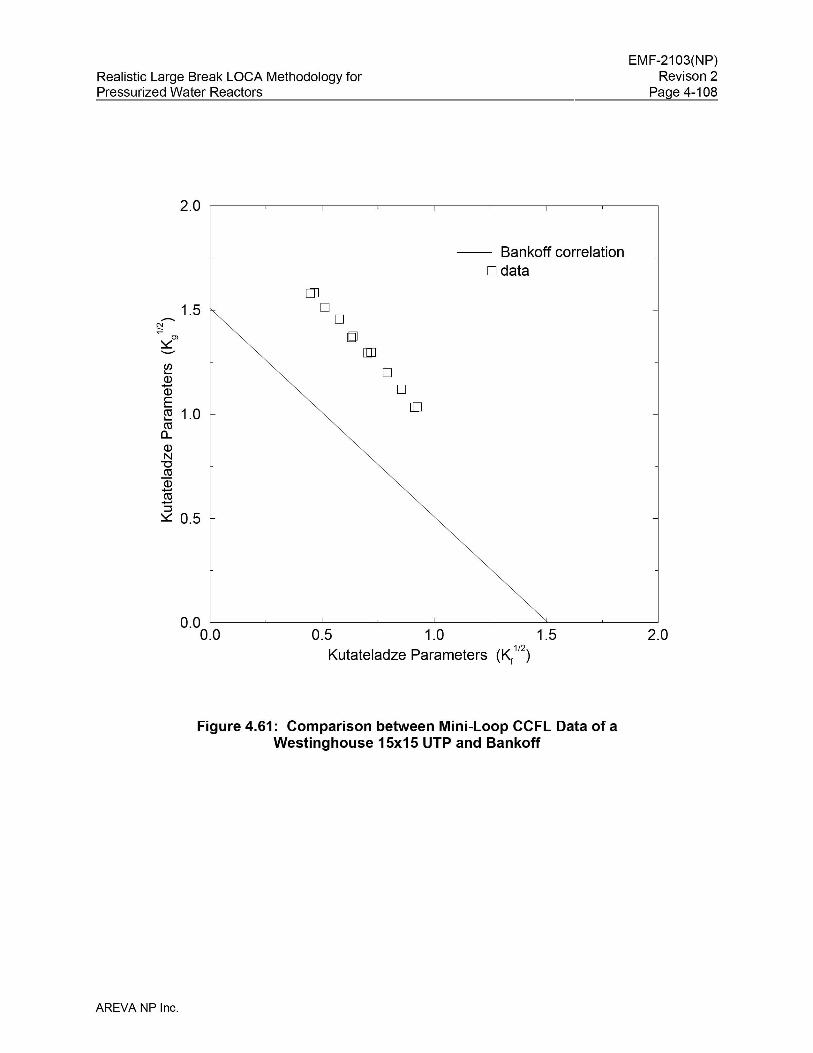
Realistic Large Break LOCA Methodology forPressurized Water Reactors
2.0
-- Bankoff correlationD data
EMF-2103(NP)Revison 2
Page 4-108
1.5
~Q)
Q3E~ 1.0co0Q)N"0coQ)-co-~
::::c::: 0.5
0.00.0
[J]
DD
D[J]
DD
[]
0.5 1.0 1.5Kutateladze Parameters (Kr1/2)
2.0
Figure 4.61: Comparison between Mini-Loop CCFL Data of aWestinghouse 15x15 UTP and Bankoff
AREVA NP Inc.
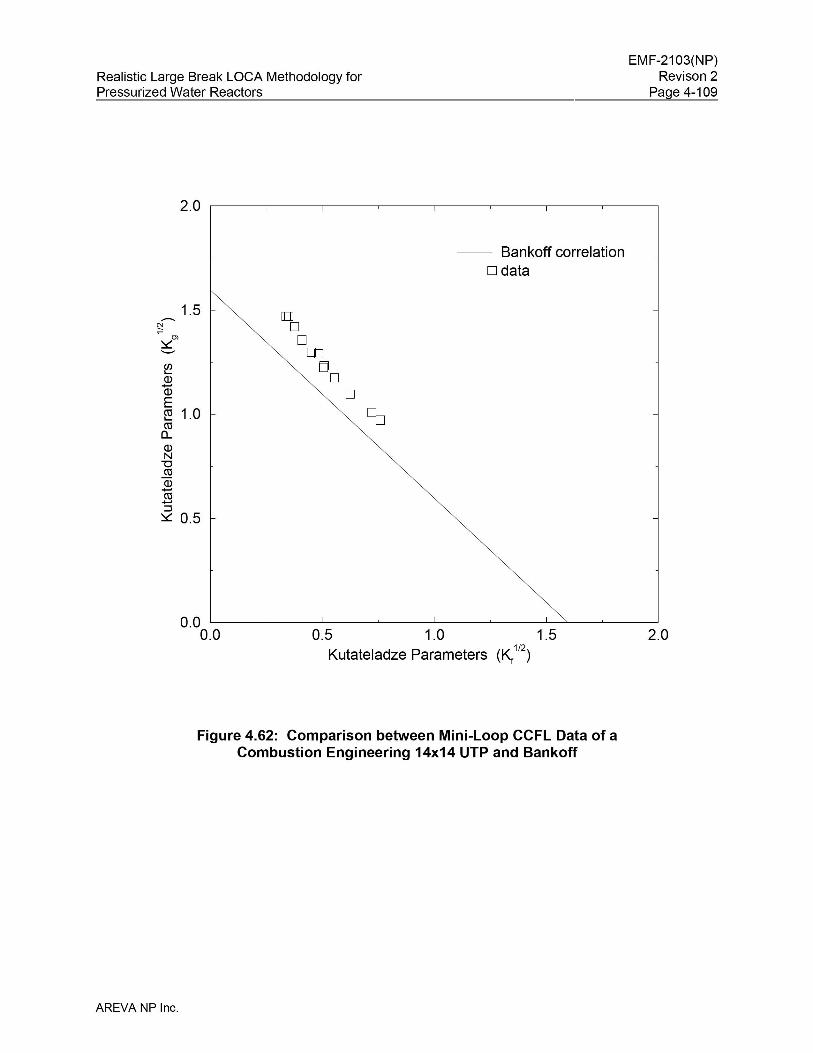
Realistic Large Break LOCA Methodology forPressurized Water Reactors
2.0
-- Bankoff correlationD data
EMF-2103(NP)Revison 2
Page 4-109
1.5
~Q}-Q}
E~ 1.0co0Q}N
"0coQ}-co-::J~ 0.5
0.00.0
[]D
DOJ
DD
D
0.5 1.0 1.5Kutateladze Parameters (~1/2)
2.0
Figure 4.62: Comparison between Mini-Loop CCFL Data of aCombustion Engineering 14x14 UTP and Bankoff
AREVA NP Inc.
EMF-2103(NP)
Revison 2Realistic Large Break LOCA Methodology for Pressurized Water Reactors Page 4-110
AREVA NP Inc.
4.3.1.11 UPTF Tests
UPTF was operated by Kraftwerk Union AG (KWU) where several separate and integral effects
tests were conducted under the 2D/3D Program. UPTF was designed to simulate a German
four-loop, 3900 MWt PWR primary system. It was intended to provide a full-scale simulation of
thermal-hydraulic behavior in the primary system during the end-of-blowdown, refill, and reflood
phases of a PWR LBLOCA. (Note that the refill period, as defined for the RLBLOCA PIRT,
includes the end-of-blowdown and refill as defined in UPTF experimental reports).
The reactor vessel, the core barrel, and the greater part of the vessel internals were a full-sized
representation of a PWR, as were the four hot and cold legs that simulated three intact loops
and one broken loop. The reactor core, steam generators, and coolant pumps were replaced by
simulators. Steam produced in a real core during refill/reflood, and the water entrained by this
steam, were simulated by steam and water injection sources in the core simulator. Steam
production on the primary side of an actual intact-loop steam generator was simulated by
injecting steam into the steam generator simulator. The system was capable of simulating both
cold and hot leg breaks, including ECC water injection into both intact and broken cold legs and
hot legs and into the downcomer. Additional details of the test facility are given in Section 3.7 of
Reference 5.
The specific tests assessed with S-RELAP5 include selected runs from the following test series,
Tests 6, 7, 8, 10, 12, and 29. The CCFL correlation developed under the 2D/3D program by
MPR Associates uses UPTF Test 11 directly in the input model and, therefore, this test was not
explicitly simulated.
4.3.1.11.1 UPTF Tests 6 and 7
UPTF Test 6 (Runs 131, 132, 133, 135, and 136) and UPTF Test 7 (Phase IV Run 203) were
simulated using S-RELAP5 to demonstrate the ability of S-RELAP5 to self-limit countercurrent
flow in the downcomer and to predict acceptable lower plenum refill behavior, including ECC
bypass during the refill phase of a LOCA in a PWR. These tests were conducted under the
2D/3D program and were designed specifically to investigate the ECC penetration and
countercurrent flow phenomena in the downcomer of a PWR during the refill portion of a LOCA.
During the blowdown phase of a LBLOCA, the reactor vessel rapidly depressurizes, causing
most of the liquid in the primary system to either flash to steam or flow out through the break.
EMF-2103(NP)
Revison 2Realistic Large Break LOCA Methodology for Pressurized Water Reactors Page 4-111
AREVA NP Inc.
When the primary system pressure falls below the accumulator pressure, ECC from the
accumulators flows into the cold legs. The ECC interacts with the loop steam in the cold legs
and with the steam flowing upwards in the downcomer. This steam-water interaction creates a
complicated multidimensional flow pattern in the downcomer. The resulting countercurrent flow
in the downcomer is important since it affects how quickly the lower plenum refills and when
core reflooding starts.
For Tests 6 and 7, the UPTF system was configured to simulate the refill phase of a cold leg
break PWR LBLOCA. These tests were steady-state runs. The pump simulators were closed
and only the cold leg valve was opened. In Test 6, five benchmark runs (Runs 131, 132, 133,
135, and 136) were performed, each with a different steam injection rate in the core and the
steam generator simulators, to establish points on the flooding curve for UPTF. ECC was
injected at approximately 485 kg/s to each of the intact cold legs. Test 7 consisted of four runs
(Runs 200, 201, 202, and 203), each performed with several combinations of steam flow and
ECC injection. In all runs, steam was injected only through the core simulator and various
combinations of loops were used for ECC injection. Since the loops were blocked and the hot
leg break valve was closed, the injected steam was forced to flow up through the downcomer,
interacting with the ECC water before finally flowing out through the broken cold leg. Only Run
203 was simulated using S-RELAP5 in order to complete the low steam flow flooding curve.
Table 4.7 shows the Test 6 and Test 7 conditions.
Since the primary purpose of Tests 6 and 7 was to evaluate the CCF behavior in the
downcomer, a simplified S-RELAP5 input model was used for test simulations. The intact cold
legs, the downcomer, and the lower plenum were modeled using the RLBLOCA guidelines. The
remaining portion of the vessel and hot legs were modeled using a simplified approach. The
complete loops were not modeled. The cold leg section, from pump discharge to downcomer, is
modeled as four nodes. The downcomer is modeled using a 9x8 two-dimensional (z, θ)
component. A loss coefficient of [ ] is applied at the θ-junctions to account for the blockage
effect due to the hot leg penetrations in the downcomer. The cold leg condensation model,
summarized in Section 4.3.3.1.14 and described in more detail in Section 5.2 of Reference 5,
was applied in the intact cold legs. In the Test 6 input model, mixture level tracking is turned on
in all the lower head/lower plenum nodes. Since lower head draining is activated in Test 7, the
mixture level tracking in both nodes of the lower head is turned off to avoid interaction with lower
head draining. UPTF Tests 6 and 7, the S-RELAP5 input model, and the results of the
EMF-2103(NP)
Revison 2Realistic Large Break LOCA Methodology for Pressurized Water Reactors Page 4-112
AREVA NP Inc.
simulation are discussed in more detail in Section 3.7.2 of Reference 5. A summary of the
results is provided below.
• Little water was delivered to the downcomer and lower plenum during the period that the intact cold legs were filling with ECC water. Only after the cold legs were filled to a quasi-steady level did a significant amount of ECC begin to penetrate the downcomer and lower plenum.
• When ECC penetration to the lower plenum did occur, the penetration rate tended to vary inversely with the rate of steam flow in the downcomer.
• In both tests, during the period of ECC penetration, ECC water from the two cold legs opposite the broken cold leg tended to penetrate directly downward to the lower plenum. ECC water from the cold leg adjacent to the broken cold leg tended to be bypassed to the broken cold leg. Even though the source of the bypassed water is difficult to identify from the S-RELAP5 results, an acceptable amount of water is bypassed in the calculation for all the runs.
• Highly unstable flow conditions were observed in the downcomer during the tests, as well as in the S-RELAP5 results, during the entire transient period.
Specific LBLOCA refill phenomena addressed by the Tests 6 and 7 benchmarks include:
• Lower plenum refill and ECC bypass
Figure 4.63 through Figure 4.68 show the lower plenum liquid level measured and
calculated by S-RELAP5 for each test run. The code is shown to consistently underpredict
the lower plenum fill rate. Figure 4.71 shows, as an example, the predicted and estimated
(by MPR Associates, Reference 26) integrated vessel side break flow for Run 135. The
results for other cases are given in Section 3.7.2 of Reference 5. These results show
S-RELAP5 overpredicted the ECC bypass in all the Test 6 runs and slightly underpredicted
the bypass in the Test 7 Run 203. It is to be noted that in Run 203 water was drained from
the lower head in order to avoid the water entering the core simulator injectors. The
Run 203 prediction may be influenced by the interaction of the lower head draining with the
lower head sweep-out. The lower head draining is atypical to LBLOCA. These results show
S-RELAP5 will calculate acceptable to conservative ECC bypass during the refill phase
resulting in an acceptable beginning of core recovery time.
EMF-2103(NP)
Revison 2Realistic Large Break LOCA Methodology for Pressurized Water Reactors Page 4-113
AREVA NP Inc.
• Downcomer multi-dimensional effects
Highly separated downcomer flows were observed in the tests. This phenomenon is difficult
to simulate using system codes like S-RELAP5, which was found to distribute water more
uniformly in the azimuthal direction in the downcomer. The primary reason for this behavior
is that S-RELAP5 results are based on the use of an average void fraction in a fluid node
and numerical diffusion. This homogenization of fluid in the downcomer in the S-RELAP5
calculation can affect the flow distribution between the downcomer and lower plenum during
the refill phase of a LBLOCA. However, this homogenization is also one of the major
reasons for the acceptable-to-conservative ECC bypass prediction.
• Downcomer countercurrent flow
The various runs were performed with a wide range of downcomer steam flow rates and with
two-phase flow conditions, including countercurrent flow. In all cases, the code with the
interphase drag models predicted either conservative or acceptable downcomer penetration
of ECC water. These results justify that there is no need to use an explicit CCFL correlation
to calculate acceptable ECC bypass using S-RELAP5 during the refill phase of a LBLOCA.
• Downcomer condensation
The measured and predicted liquid temperatures in the broken cold leg and lower head for
Run 135 are shown as an example in Figure 4.69 and Figure 4.70, respectively. From
Figure 4.66 it can be seen that the test started at about 30 seconds, and the period of
interest is from approximately 60 to 120 seconds. Therefore, the initial mismatch between
the input and the data will have no effect with respect to the period of interest. These results
show S-RELAP5, with the cold leg condensation model summarized in Section 4.3.3.1.14
and described in detail in Section 5.2 of Reference 5, calculates acceptable condensation
rates due to the steam-ECC water interaction in the cold legs and downcomer. This means
that there is no need to apply biases to the interphase condensation models to calculate the
condensation in the downcomer due to the steam-ECC water interaction.
• Lower plenum sweepout
The code was shown to overestimate the lower plenum sweepout rate, which is partially
responsible for the acceptable ECC bypass. This is primarily due to the 1-D modeling of the
EMF-2103(NP)
Revison 2Realistic Large Break LOCA Methodology for Pressurized Water Reactors Page 4-114
AREVA NP Inc.
lower plenum/lower head where, as expected, the flow behavior during the refill phase is
highly multi-dimensional.
In summary, from the simulation results of UPTF Tests 6 and 7, it can be concluded that
S-RELAP5 will conservatively calculate lower plenum sweep-out, lower plenum refill, and ECC
bypass rates. This results in a conservative beginning of core recovery time during a LBLOCA
in a PWR. S-RELAP5 also calculates acceptable downcomer condensation rates due to
steam-ECC water interaction.
4.3.1.11.2 UPTF Test 8
UPTF Test 8 was used to verify the S-RELAP5 cold leg condensation model. UPTF Test 8 was
performed under the 2D/3D program to investigate the thermal-hydraulic behavior of ECC water
injection in the cold legs during the end-of-blowdown, refill, and reflood phases of a postulated
LOCA. Of particular interest in the test are the pressure and fluid oscillations occurring in the
cold legs and the ECC entrainment through the reactor vessel side break. Oscillations can be
induced by the condensation of steam from the injection of subcooled ECC water, the formation
of a liquid plug in the cold leg (slug flow regime), and the transition to the stratified flow regime.
UPTF Test 8 was performed by: (1) isolating the intact loop (Loop 1) closest to the broken loop
(Loop 4) at the pump simulator; (2) opening one of the two intact loops (Loop 3) opposite to the
broken loop, stabilizing the pressure drop between the upper plenum and the downcomer;
(3) opening the break valves in the broken loop; (4) injecting steam into the test vessel; and
(5) varying ECC water injection into the other intact loop (Loop 2) cold leg. UPTF Test 8
consisted of two runs (Run 111 and Run 112) that differed by the value of the flow resistance
applied in the pump simulator of intact Loop 2. The different resistance results in a different
steam rate into intact Loop 2.
Since the primary purpose of the S-RELAP5 simulation is to verify the adequacy of the cold leg
condensation model, only the Loop 2 steam generator outlet plenum to downcomer are
modeled. The cold leg piping from the pump discharge to the downcomer is modeled as four
nodes as described in the RLBLOCA analysis guidelines. The modeling of the remaining cold
leg segment is not important since it just provides the steam inlet flow boundary. The cold leg
condensation model is applied to the ECC injection node and all downstream nodes. This
includes the selection of the non-stratified option in the ECC injection node. The cold leg
EMF-2103(NP)
Revison 2Realistic Large Break LOCA Methodology for Pressurized Water Reactors Page 4-115
AREVA NP Inc.
condensation model is summarized in Section 4.3.3.1.14 and is described in detail in
Section 5.2 of Reference 5.
The measured flow and pressure are input as the boundary conditions to the model.
UPTF Test 8, the S-RELAP5 input model, and the benchmark results are discussed in detail in
Section 3.7.3 of Reference 5.
The primary results from the comparisons of S-RELAP5 to the UPTF data for Test 8 Run 111
and Run 112 (Figure 4.72 through Figure 4.75) are:
• The primary objective of the test simulation was to validate the adequacy of the prediction of the water temperature entering the downcomer, due to its effect on downcomer boiling during the post-accumulator injection period of a postulated LBLOCA. From Figure 4.72 and Figure 4.74 it can be seen that S-RELAP5 correctly predicted the cold leg liquid temperature for both runs.
• Figure 4.73 and Figure 4.75 show the measured steam temperature upstream of the ECC injection node (A900), the measured liquid temperature near the top of the cold leg (A391—just downstream of the ECC injection location), and the S-RELAP5 calculated flow regime in the injection node for Runs 111 and 112, respectively. The fluid temperature near the top of the pipe is an indication of the flow transition from plug flow (subcooled temperature, Flow Regime 5) to stratified flow (fluid temperature is close to the steam temperature). Since the non-stratified option is selected in the ECC injection node, the predicted flow regime is annular-mist (Flow Regime 6) instead of stratified (Flow Regime 10), and there are some flow regime oscillations in the S-RELAP5 calculation for Run 112. [
] The S-RELAP5 calculated flow regimes are in general agreement with the MPR evaluation as well as from the indication of the thermocouple data shown in Figure 4.73 and Figure 4.75.
In summary, it can be concluded that the S-RELAP5 cold leg condensation model correctly
calculates the temperature of the water entering the downcomer during the reflood phase of a
postulated LBLOCA.
EMF-2103(NP)
Revison 2Realistic Large Break LOCA Methodology for Pressurized Water Reactors Page 4-116
AREVA NP Inc.
4.3.1.11.3 UPTF Tests 10 and 29
UPTF Test 10, Run 081 (Test 10B), and Test 29, Runs 211 and 212 (Test 29B), were analyzed
to provide specific S-RELAP5 input modeling guidelines for the hot leg and steam generator
inlet plenum regions to ensure adequate prediction of the liquid entrainment to the steam
generator tube region, and to limit countercurrent flow at the UTP during the reflood phase of a
postulated LBLOCA. These tests were separate effect tests specifically designed under the
2D/3D program to investigate water mass distribution in the upper plenum, hot leg, and steam
generator inlet plenum, and tube regions during reflood. Limiting water down flow into the core
is important because it provides a source of additional core cooling and reduces the likelihood of
water carryout to the steam generators. Water carryover to the steam generators is directly
related to the prediction of steam binding, which results from liquid vaporization in the steam
generator tubes.
For UPTF Tests 10 and 29, the UPTF system was configured to simulate the reflood phase of a
cold leg break PWR LBLOCA. For these tests, the lower plenum and lower downcomer were
filled with water to block steam flow directly from the core to the downcomer and cold legs. A
mixture of steam and water was injected into the core simulator to simulate reflood steam
generation and water entrainment. The injected steam and entrained water then flowed to the
hot legs via the upper core support plate and upper plenum. From the hot legs, the steam/water
mixture flowed into the steam generator simulator inlet plenum and to the cyclone separators
where water was separated from the mixture. The separated water was stored and measured
in holding tanks, while the steam (and any unseparated water) flowed onward through the pump
simulators, intact cold legs, upper downcomer and broken cold leg, and flowed out the break
into the containment simulator. Each test consisted of a sequence of phases using different
steam and water injection rates. Test 10 Run 081 was a 300 second transient consisting of four
different flow phases. The conditions for the four phases of this test are given in Table 4.8.
Test 29 Runs 211 and 212 were 900 second transients consisting of six different flow phases.
Each phase consisted of a period of constant steam and water flow rates, followed by a period
of no flow. The first two phases of Run 211 and last three phases of Run 212 were flawed.
Consequently, the S-RELAP5 predictions will be compared to Run 212 data from Phases 1 and
2 (0 through 300 seconds), and Run 211 data from Phases 3 through 6 (300 through
EMF-2103(NP)
Revison 2Realistic Large Break LOCA Methodology for Pressurized Water Reactors Page 4-117
AREVA NP Inc.
900 seconds). The test parameters for the six phases in combined Run 212/211 are shown in
Table 4.9.
The specific LBLOCA reflood phenomena addressed by UPTF Tests 10 and 29 benchmarks
are:
• Steam generator steam binding
• Upper plenum two-phase flow
• Core-to-upper plenum countercurrent flow
• Upper plenum, hot leg, and steam generator inlet plenum entrainment and deentrainment
Since UPTF Tests 10 and 29 are separate effect tests to investigate water mass distribution in
the upper plenum, hot leg, and steam generator inlet plenum and tube regions during reflood, a
simplified modeling approach was used. The models for the core simulator, upper plenum, hot
leg and steam generator inlet plenum were developed using the RLBLOCA modeling guidelines.
Loops are not modeled, instead pressure boundaries are provided at the cold leg, as well as the
cyclone separator region. A lumped modeling approach is used for the intact hot legs. The
input model is summarized below:
EMF-2103(NP)
Revison 2Realistic Large Break LOCA Methodology for Pressurized Water Reactors Page 4-118
AREVA NP Inc.
These specific modeling options promote entrainment of liquid to the steam generator tube
region and limit liquid down flow from the upper plenum to the core region. UPTF Tests 10 and
29, the S-RELAP5 input model, and the simulation results are discussed in detail in
Section 3.7.5 of Reference 5.
The following general observations can be made regarding the S-RELAP5 simulations of UPTF
Tests 10 and 29.
• Overall the predictions of total water carryover to the steam generator simulators indicate
that the code overpredicts (adequate agreement with data) the liquid carryover to the steam
generators. This is conservative because it will result in an overprediction of steam binding,
which in turn will reduce the reflood flooding rate.
• Overall the predictions of total fallback to the lower plenum region also were shown to be
conservative in that the fallback to the core was underpredicted (adequate agreement with
data). This is consistent with the overprediction of liquid carryover to the steam generators
because more liquid will be present in the upper plenum to be carried over to the steam
generators.
Figure 4.76 and Figure 4.77 present plots of Kutateladze parameters at the core exit calculated
from the S-RELAP5 results for UPTF Tests 10 and 29, respectively. Values, that were
calculated using the UPTF correlation (which was developed using the UPTF CCFL tests), are
also shown in these figures. The figures clearly show S-RELAP5 calculates conservative liquid
down flow relative to the UPTF correlation.
Figure 4.78 and Figure 4.79 show the liquid carryover to the steam generators for UPTF
Tests 10 and 29, respectively. Again, both plots clearly show S-RELAP5 generally overpredicts
the carryover of liquid to the steam generators.
In summary, it can be concluded that S-RELAP5 will calculate acceptable liquid entrainment to
the steam generator tube region and countercurrent flow at the upper core tie plate for a PWR
during the reflood phase of a LBLOCA.
EMF-2103(NP)
Revison 2Realistic Large Break LOCA Methodology for Pressurized Water Reactors Page 4-119
AREVA NP Inc.
4.3.1.11.4 UPTF Tests 10 and 12
UPTF Test 10 (Run 080) and Test 12 (Run 014) were simulated using S-RELAP5 to
demonstrate the ability of the code to properly limit countercurrent flow at the UTP (which
connects the core region to the upper plenum region of a PWR) during the LBLOCA reflood
phase. Limiting water down flow into the core is important because it provides a source of
additional core cooling. It also increases the likelihood of water carryout to the steam
generators with the associated steam binding effect. These tests, conducted under the 2D/3D
program, were specifically designed to simulate the upper core, the upper plenum, and hot leg
fluid flow behavior during the reflood phase of a LBLOCA transient. These tests differed from
Test 10 (Run 081) and Test 29 in that flow was allowed between the downcomer and core
region and Test 12 included nitrogen injection.
UPTF Test 10, Run 080 was performed to examine countercurrent flow through the UTP. The
lower plenum was filled with water to a level of 1.2 meters (3.94 feet), steam was injected into
the core, and subcooled water was injected into the intact hot legs. The boundary conditions
set up countercurrent flow of steam and water through the UTP.
UPTF Test 12, Run 014 was performed to examine countercurrent flow through the UTP. The
water level in the lower vessel at the start of the test was low enough (0.56 meters, 1.84 feet) to
allow steam to flow from the core to the downcomer and broken cold leg. Steam was injected
into the core, and subcooled water was injected into the intact hot legs. These boundary
conditions setup countercurrent flow of steam and water through the UTP.
Since the primary purpose of these benchmarks is to demonstrate the ability of S-RELAP5 to
properly limit countercurrent flow at the upper tie plate, a simplified modeling approach was
used to model the test facility. [
] The
tests, input model and benchmark results are discussed in detail in Section 3.7.4 of
Reference 5.
The key parameters to be compared between the S-RELAP5 simulations and the test results
are the down flow of water to the lower vessel region, the Kutateladze countercurrent flow
parameters calculated at the junctions between the core and upper plenum, and the upper
plenum pressure. Reduced down flow of water to the lower vessel generally is considered to be
EMF-2103(NP)
Revison 2Realistic Large Break LOCA Methodology for Pressurized Water Reactors Page 4-120
AREVA NP Inc.
conservative because it leads to reduced core cooling. Figure 4.80 through Figure 4.82 show
results for UPTF Test 10, Run 080. Figure 4.83 through Figure 4.85 give similar results for
UPTF Test 12, Run 014.
Figure 4.80 and Figure 4.83 show plots of Kutateladze parameters calculated from the
S-RELAP5 results for Test 10, Run 080 and Test 12, Run 014, respectively. The Kutateladze
parameters are calculated using the MPR correlation, which was developed using these tests
and are also shown in the figures. From these figures it can be concluded that S-RELAP5
calculated conservative liquid down flow through the UTP. The comparison between the
measured and predicted mass flow rate at the UTP (shown in Figure 4.82 and Figure 4.85,
respectively) for these two tests also support the conservative liquid down flow conclusion.
Figure 4.81 and Figure 4.84 show the calculated and measured upper plenum pressures for
Runs 080 and 014, respectively. These results show S-RELAP5 correctly calculates the
pressure for both test cases.
The presence of nitrogen in the system does not appear to have a significant impact on CCFL.
One of the differences between Test 12, Run 14, compared to Test 10, Run 080, is that nitrogen
was injected into the system in Test 12. Comparisons of the Kutateladze parameters indicate
that the presence of the nitrogen in the system does not affect either the S-RELAP5 calculation
or the UPTF experimental results for CCFL.
In summary, the results for simulation of UPTF Test 10, Run 080, and Test 12, Run 014, show
S-RELAP5 adequately calculates the liquid down flow during the reflood phase of a LBLOCA in
a PWR.
4.3.1.11.5 UPTF Test 11
UPTF Test 11 is a series of quasi-steady-state SETs conducted under the 2D/3D program to
investigate countercurrent flow of steam and saturated water in the hot leg of a PWR under
LBLOCA conditions. The test consisted of a series of flow conditions to map out countercurrent
flow curves at two different pressure conditions, 0.3 MPa (low pressure case) and 1.5 MPa (high
pressure case). Also under the 2D/3D program, MPR Associates (Reference 27) developed a
Wallis form CCFL correlation by using a least square fit to the data. [
]
EMF-2103(NP)
Revison 2Realistic Large Break LOCA Methodology for Pressurized Water Reactors Page 4-121
AREVA NP Inc.
[
] Since the CCFL correlation was developed from UPTF
Test 11 data, the assessment of the phenomena is best performed with independent data.
Therefore, the UPTF Test 11 assessment was not performed as part of the Revision 2
methodology. However, since other UPTF CCFL assessments demonstrated that the code
calculated CCFL replicates the input parameters used in the analysis, further assessment is
unnecessary.
The UPTF test facility is full-scale. Therefore, the CCFL model developed from UPTF Test 11
will be applied at the junction between the hot leg and the steam generator inlet plenum for
analyses of PWR plants and all the appropriate small/full-scale tests (refer to Table 4.2).
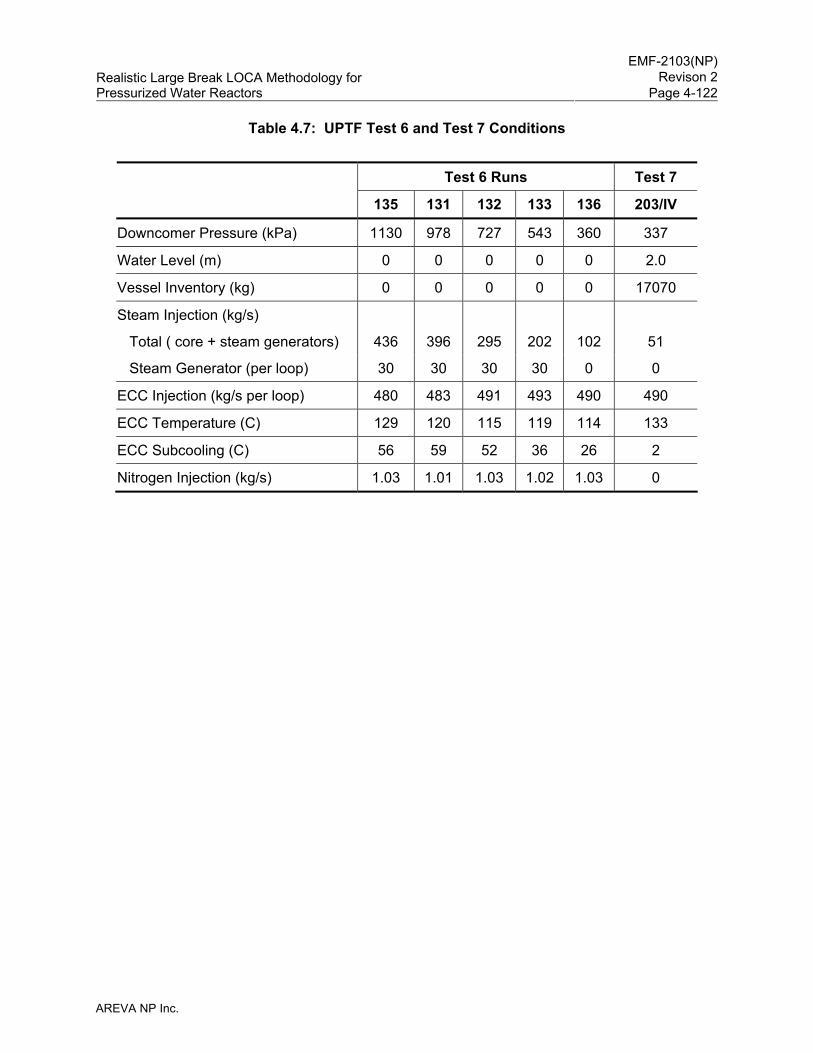
EMF-2103(NP)
Revison 2Realistic Large Break LOCA Methodology for Pressurized Water Reactors Page 4-122
AREVA NP Inc.
Table 4.7: UPTF Test 6 and Test 7 Conditions
Test 6 Runs Test 7 135 131 132 133 136 203/IV
Downcomer Pressure (kPa) 1130 978 727 543 360 337
Water Level (m) 0 0 0 0 0 2.0
Vessel Inventory (kg) 0 0 0 0 0 17070
Steam Injection (kg/s)
Total ( core + steam generators) 436 396 295 202 102 51
Steam Generator (per loop) 30 30 30 30 0 0
ECC Injection (kg/s per loop) 480 483 491 493 490 490
ECC Temperature (C) 129 120 115 119 114 133
ECC Subcooling (C) 56 59 52 36 26 2
Nitrogen Injection (kg/s) 1.03 1.01 1.03 1.02 1.03 0
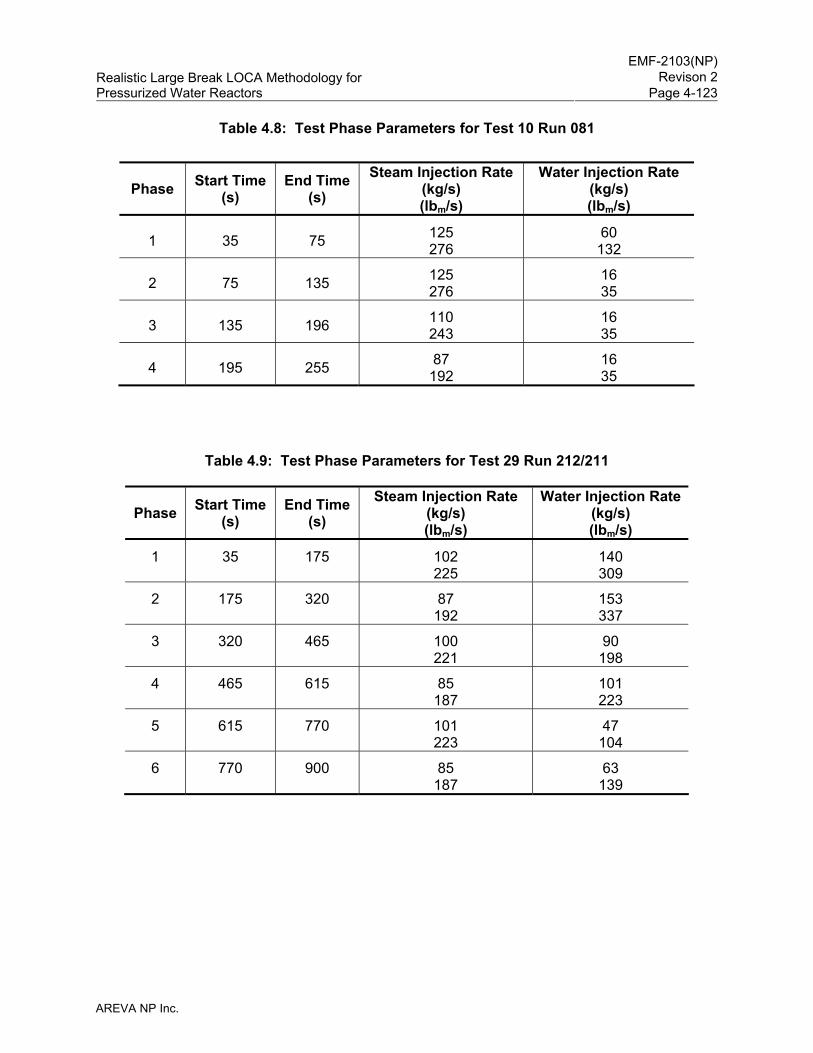
EMF-2103(NP)
Revison 2Realistic Large Break LOCA Methodology for Pressurized Water Reactors Page 4-123
AREVA NP Inc.
Table 4.8: Test Phase Parameters for Test 10 Run 081
Phase Start Time (s)
End Time (s)
Steam Injection Rate(kg/s) (lbm/s)
Water Injection Rate (kg/s) (lbm/s)
1 35 75 125 276
60 132
2 75 135 125 276
16 35
3 135 196 110 243
16 35
4 195 255 87 192
16 35
Table 4.9: Test Phase Parameters for Test 29 Run 212/211
Phase Start Time (s)
End Time (s)
Steam Injection Rate (kg/s) (lbm/s)
Water Injection Rate (kg/s) (lbm/s)
1 35 175 102 225
140 309
2 175 320 87 192
153 337
3 320 465 100 221
90 198
4 465 615 85 187
101 223
5 615 770 101 223
47 104
6 770 900 85 187
63 139
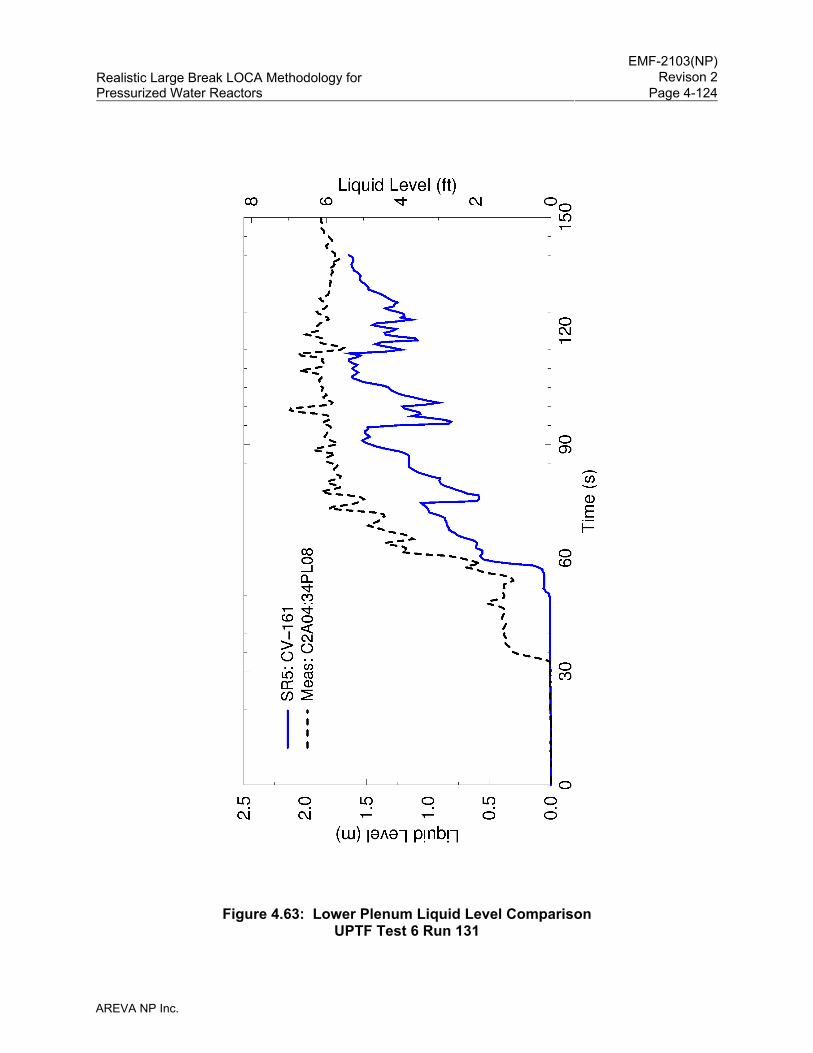
EMF-2103(NP)
Revison 2Realistic Large Break LOCA Methodology for Pressurized Water Reactors Page 4-124
AREVA NP Inc.
Figure 4.63: Lower Plenum Liquid Level Comparison UPTF Test 6 Run 131
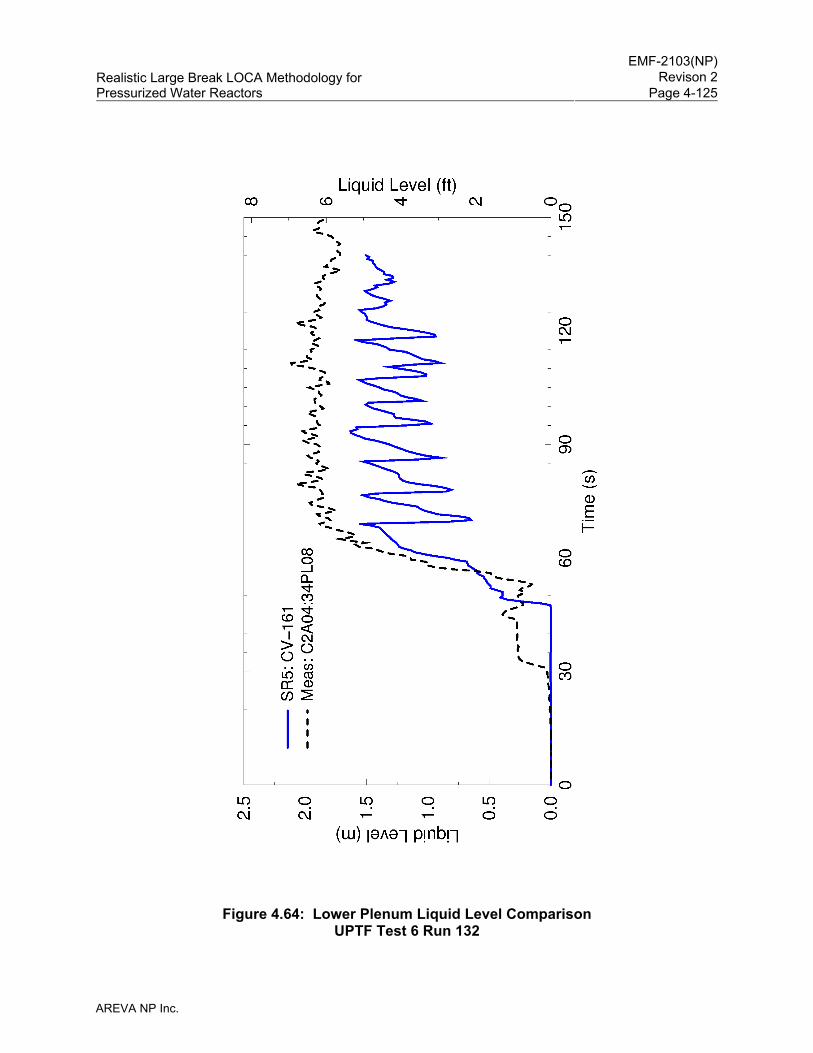
EMF-2103(NP)
Revison 2Realistic Large Break LOCA Methodology for Pressurized Water Reactors Page 4-125
AREVA NP Inc.
Figure 4.64: Lower Plenum Liquid Level Comparison UPTF Test 6 Run 132
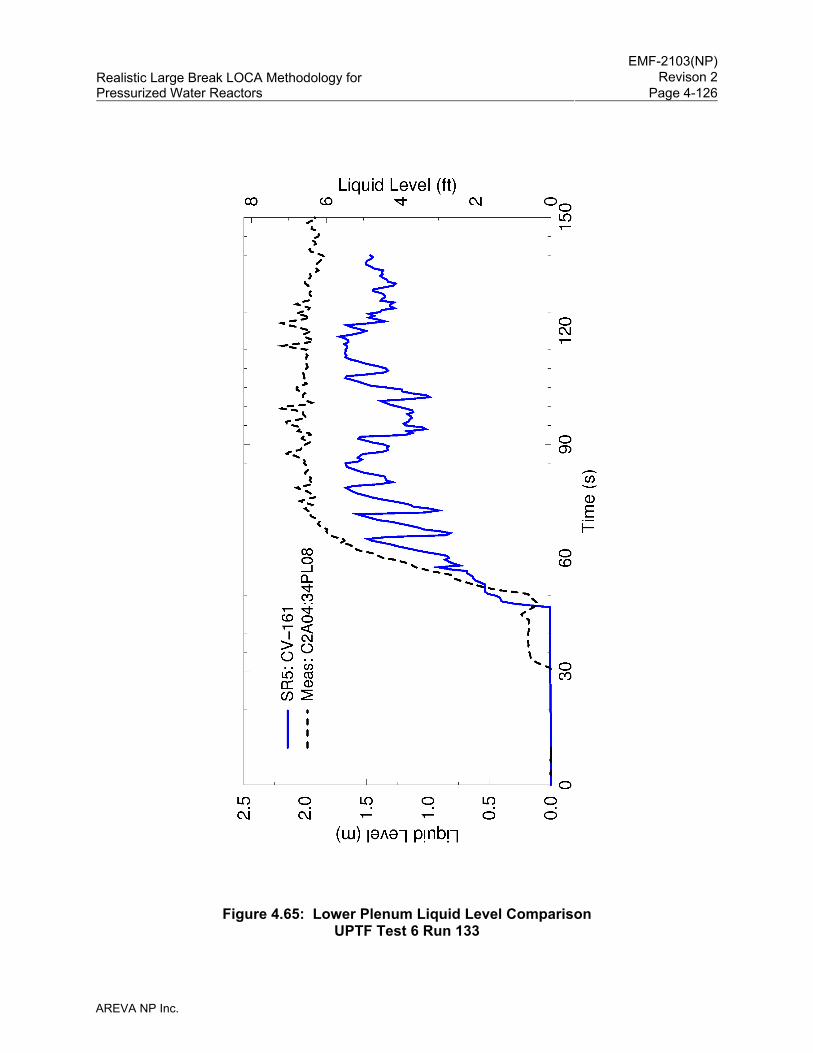
EMF-2103(NP)
Revison 2Realistic Large Break LOCA Methodology for Pressurized Water Reactors Page 4-126
AREVA NP Inc.
Figure 4.65: Lower Plenum Liquid Level Comparison UPTF Test 6 Run 133
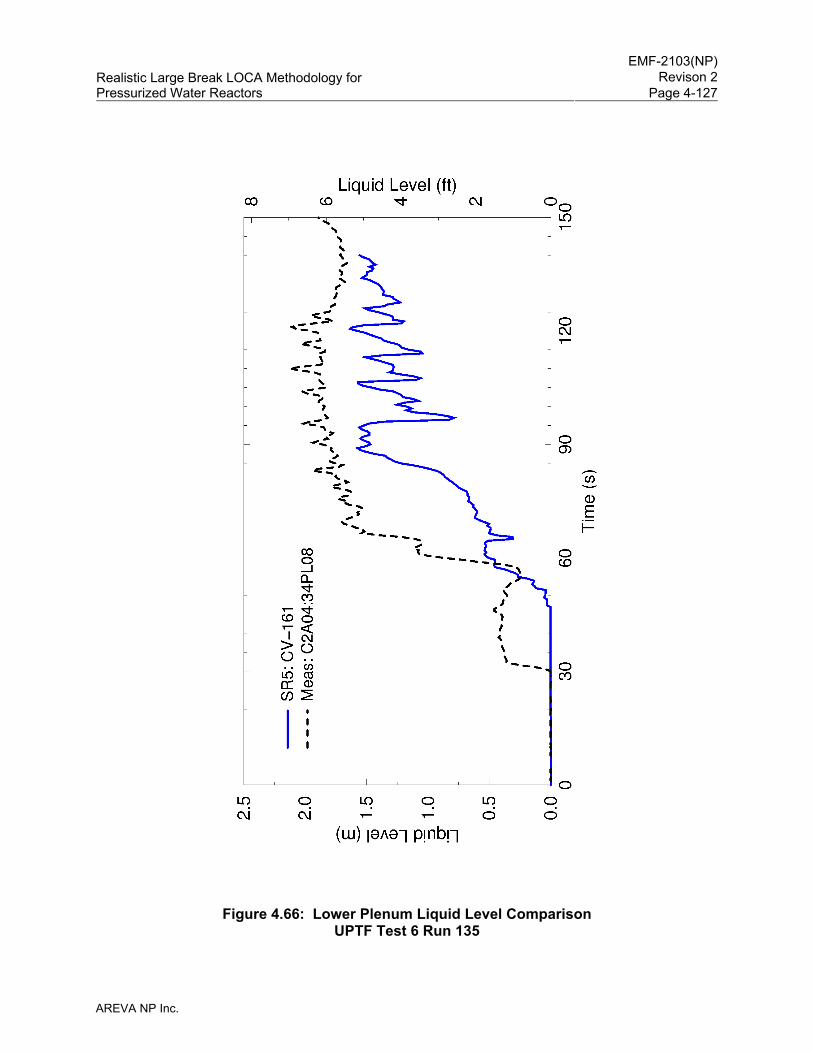
EMF-2103(NP)
Revison 2Realistic Large Break LOCA Methodology for Pressurized Water Reactors Page 4-127
AREVA NP Inc.
Figure 4.66: Lower Plenum Liquid Level Comparison UPTF Test 6 Run 135
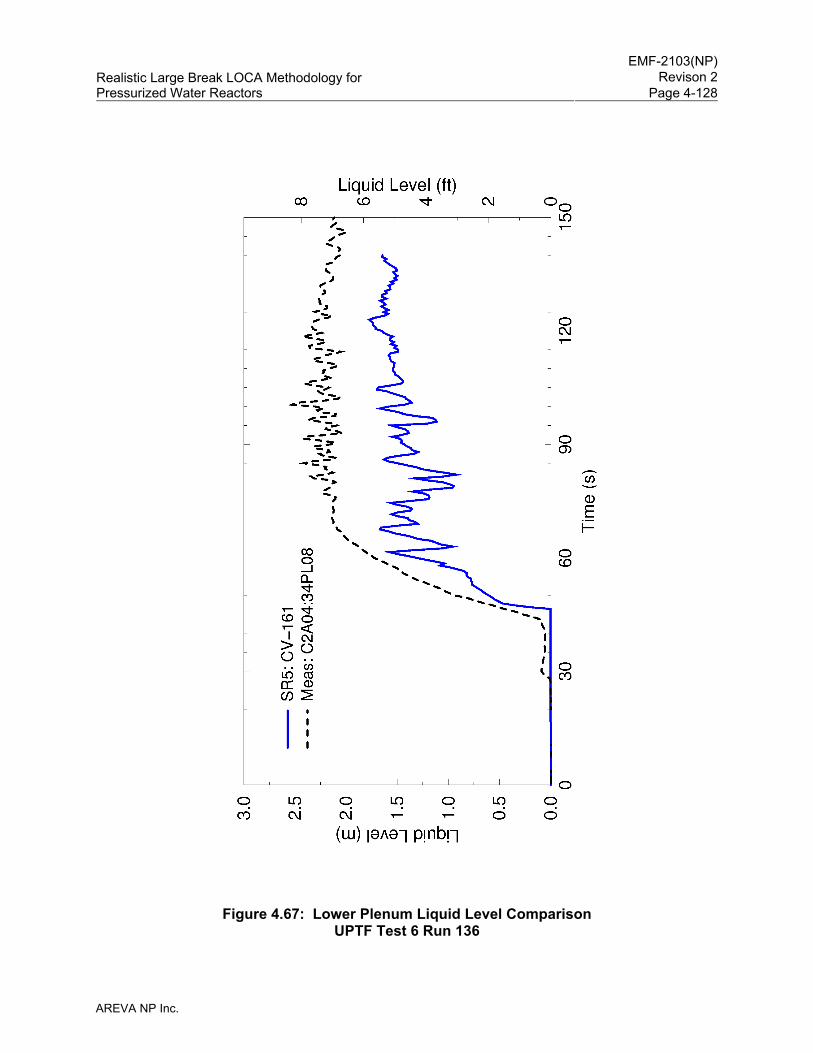
EMF-2103(NP)
Revison 2Realistic Large Break LOCA Methodology for Pressurized Water Reactors Page 4-128
AREVA NP Inc.
Figure 4.67: Lower Plenum Liquid Level Comparison UPTF Test 6 Run 136
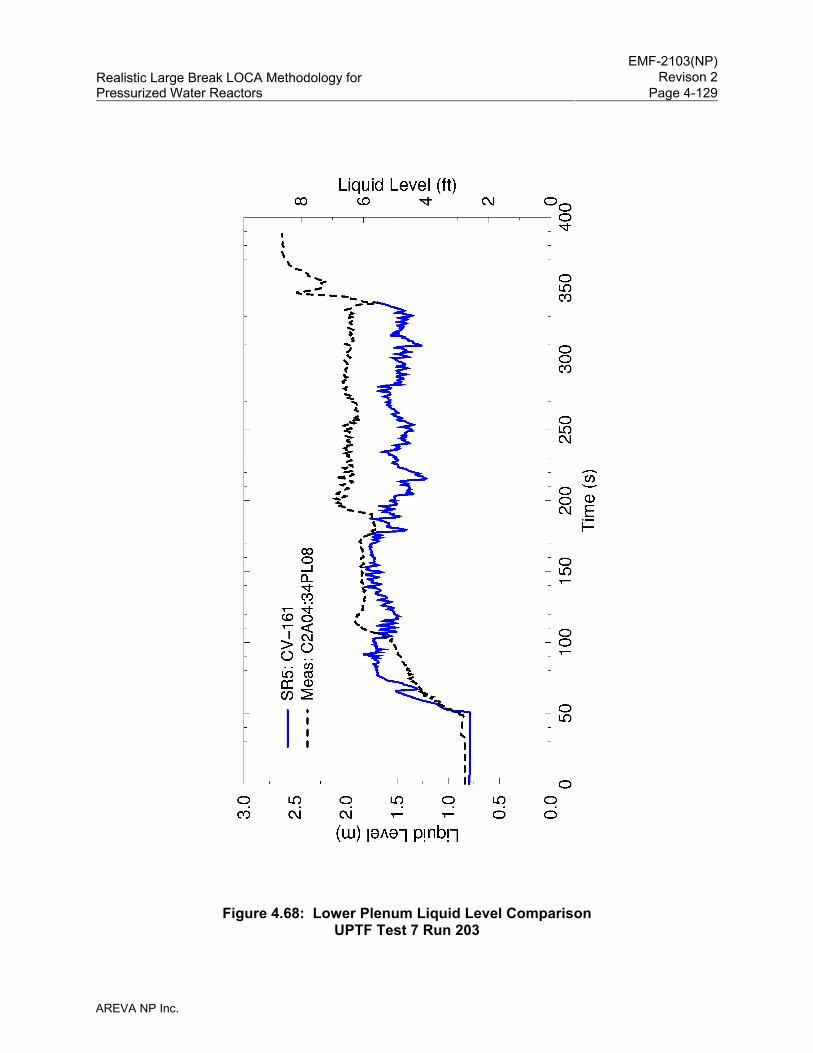
EMF-2103(NP)
Revison 2Realistic Large Break LOCA Methodology for Pressurized Water Reactors Page 4-129
AREVA NP Inc.
Figure 4.68: Lower Plenum Liquid Level Comparison UPTF Test 7 Run 203
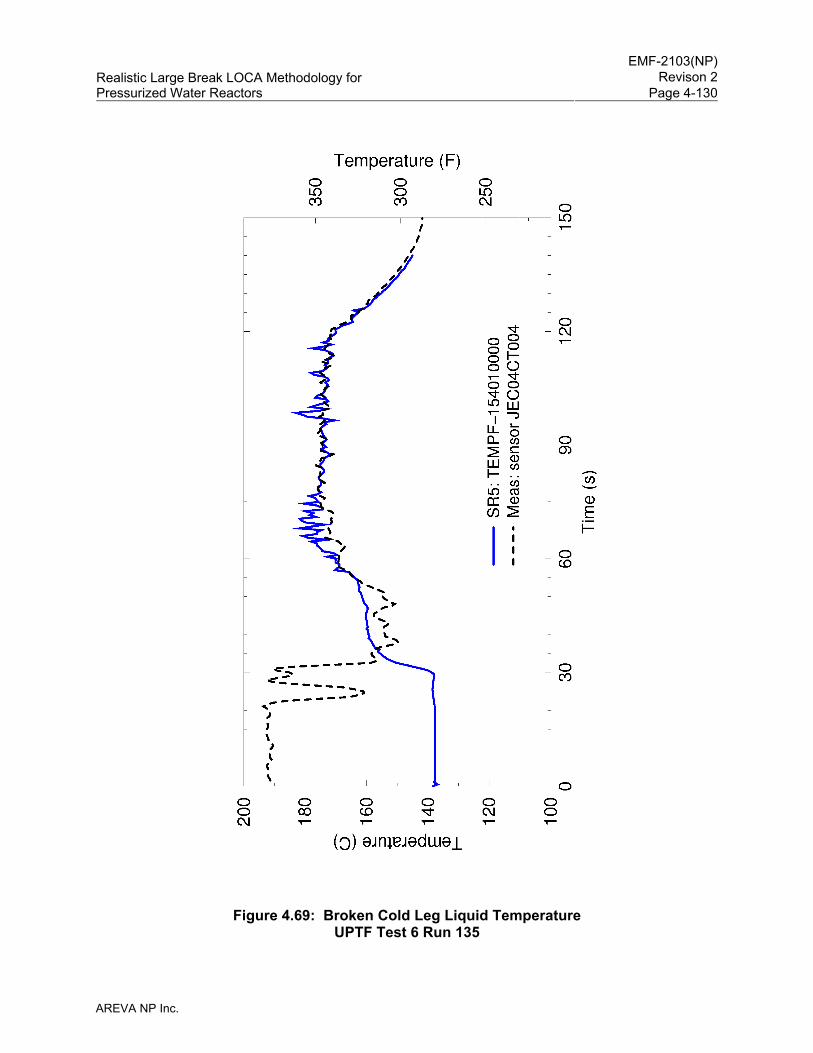
EMF-2103(NP)
Revison 2Realistic Large Break LOCA Methodology for Pressurized Water Reactors Page 4-130
AREVA NP Inc.
Figure 4.69: Broken Cold Leg Liquid Temperature UPTF Test 6 Run 135
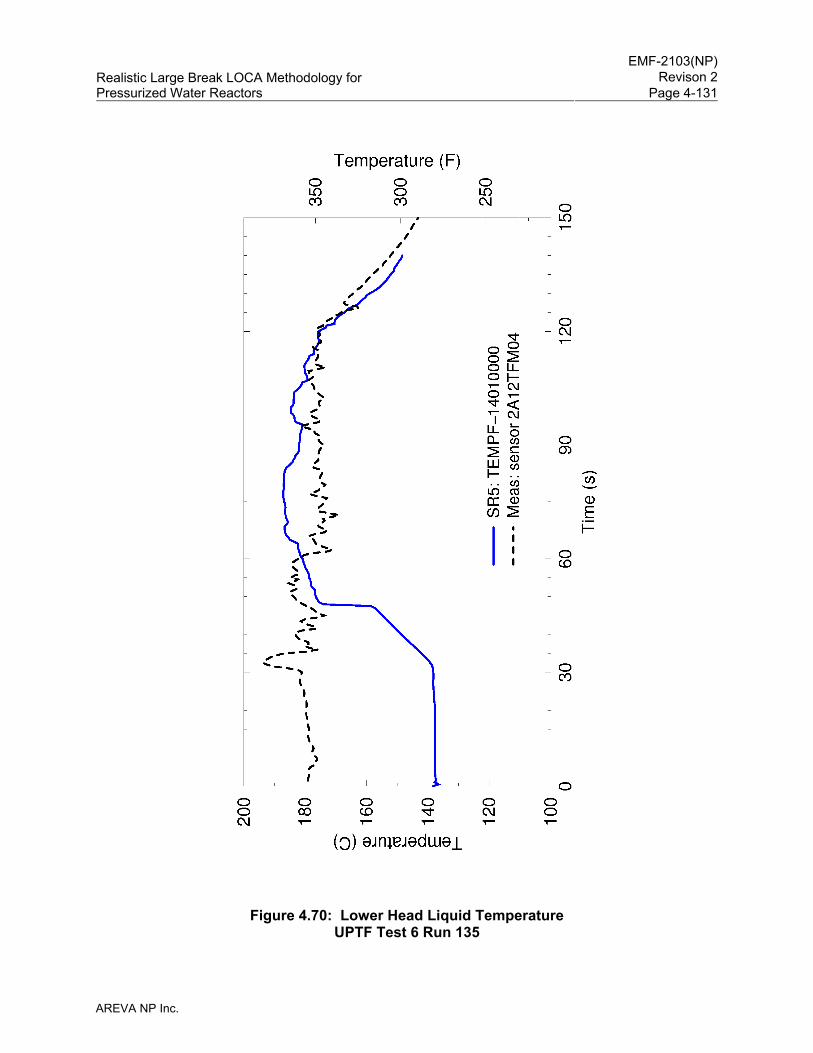
EMF-2103(NP)
Revison 2Realistic Large Break LOCA Methodology for Pressurized Water Reactors Page 4-131
AREVA NP Inc.
Figure 4.70: Lower Head Liquid Temperature UPTF Test 6 Run 135
EMF-2103(NP)
Revison 2Realistic Large Break LOCA Methodology for Pressurized Water Reactors Page 4-132
AREVA NP Inc.
Figure 4.71: Total Cold Leg Break Flow UPTF Test 6 Run 135
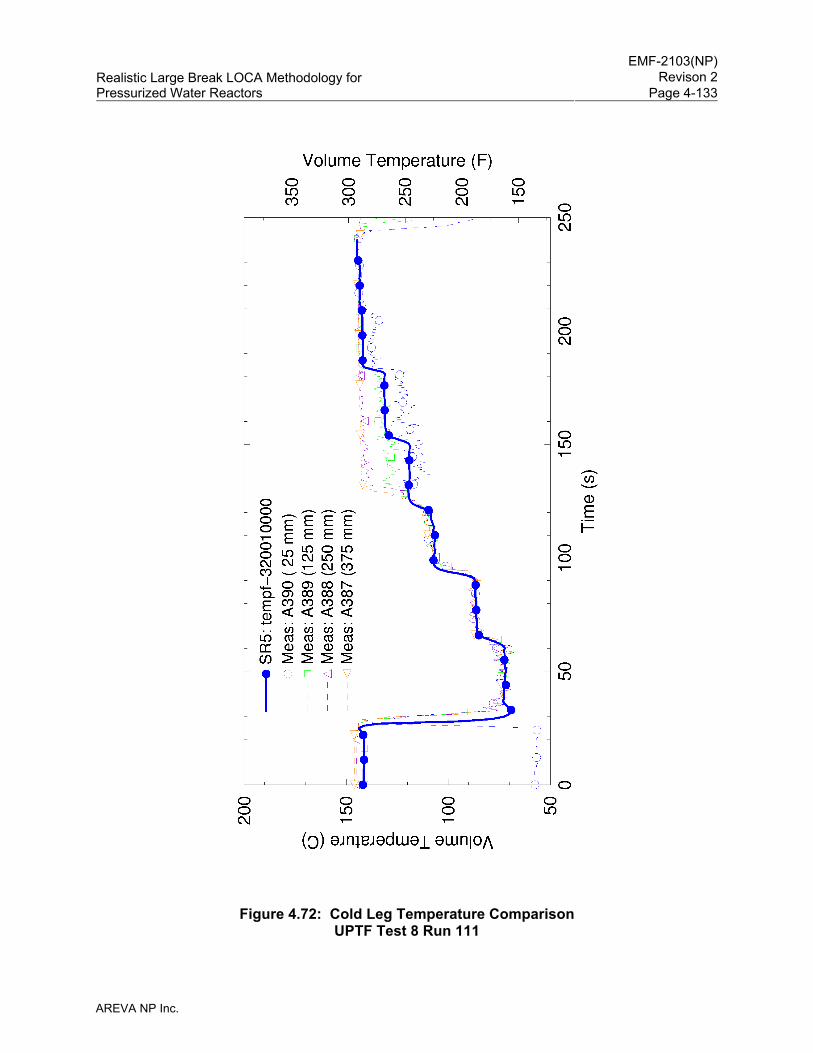
EMF-2103(NP)
Revison 2Realistic Large Break LOCA Methodology for Pressurized Water Reactors Page 4-133
AREVA NP Inc.
Figure 4.72: Cold Leg Temperature Comparison UPTF Test 8 Run 111
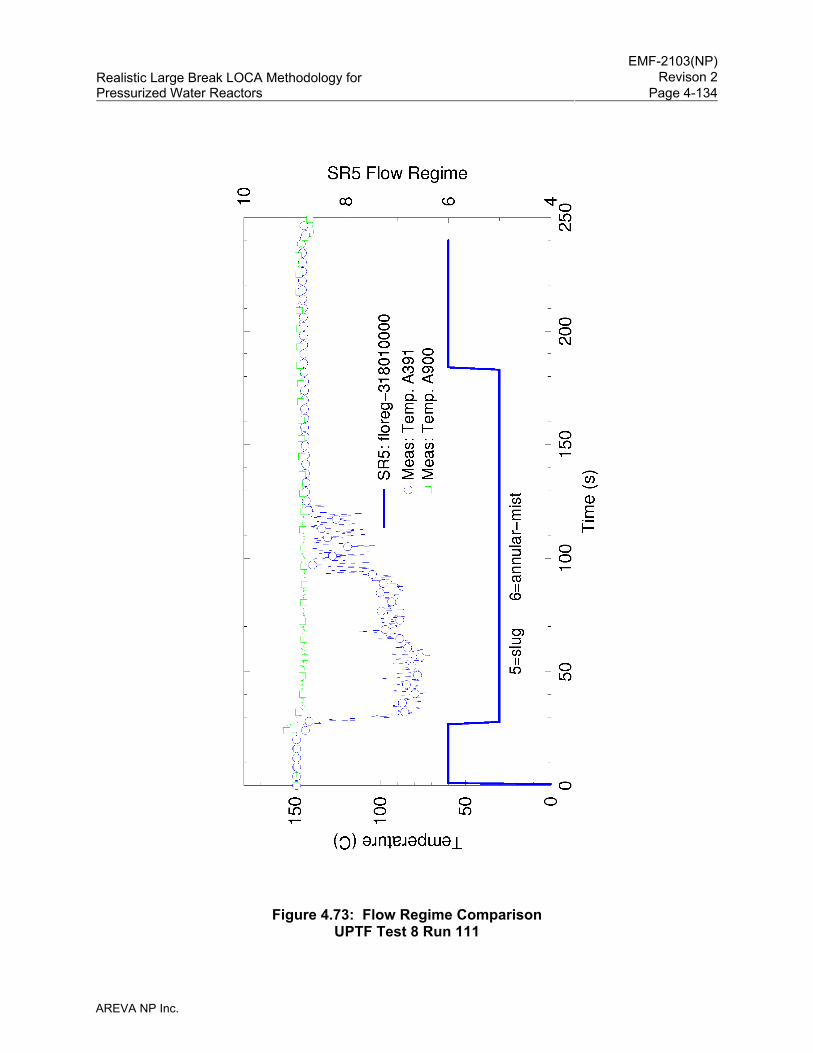
EMF-2103(NP)
Revison 2Realistic Large Break LOCA Methodology for Pressurized Water Reactors Page 4-134
AREVA NP Inc.
Figure 4.73: Flow Regime Comparison UPTF Test 8 Run 111
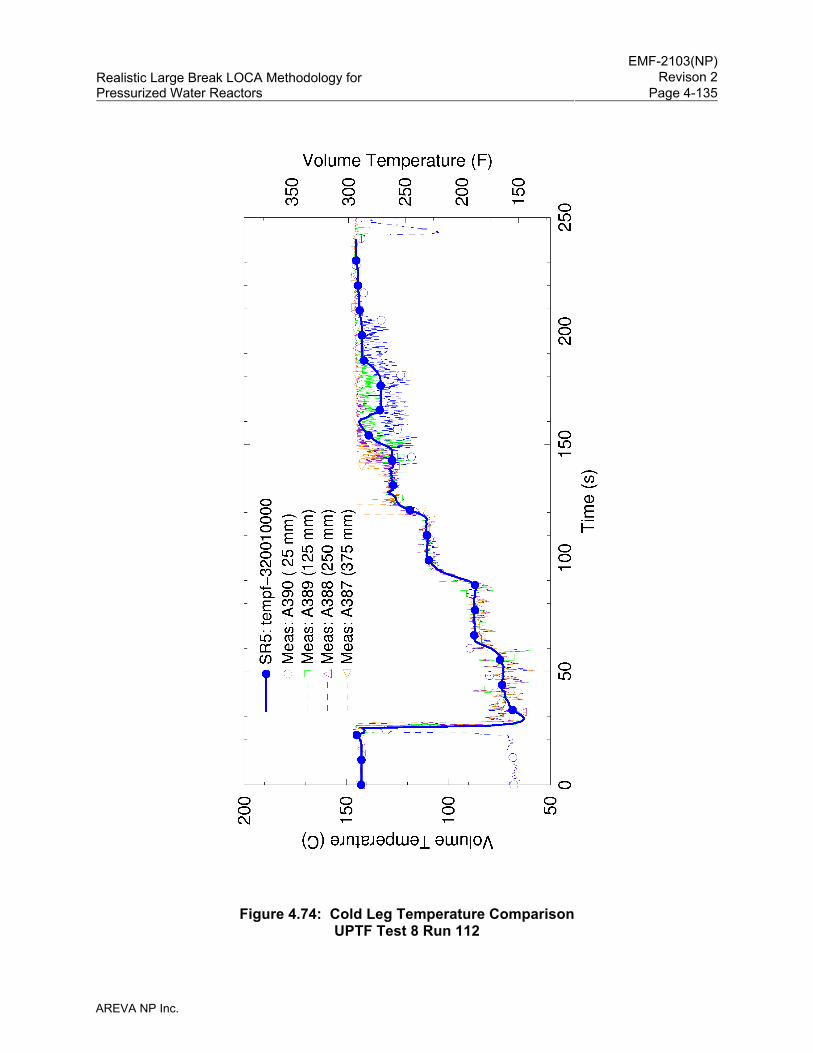
EMF-2103(NP)
Revison 2Realistic Large Break LOCA Methodology for Pressurized Water Reactors Page 4-135
AREVA NP Inc.
Figure 4.74: Cold Leg Temperature Comparison UPTF Test 8 Run 112
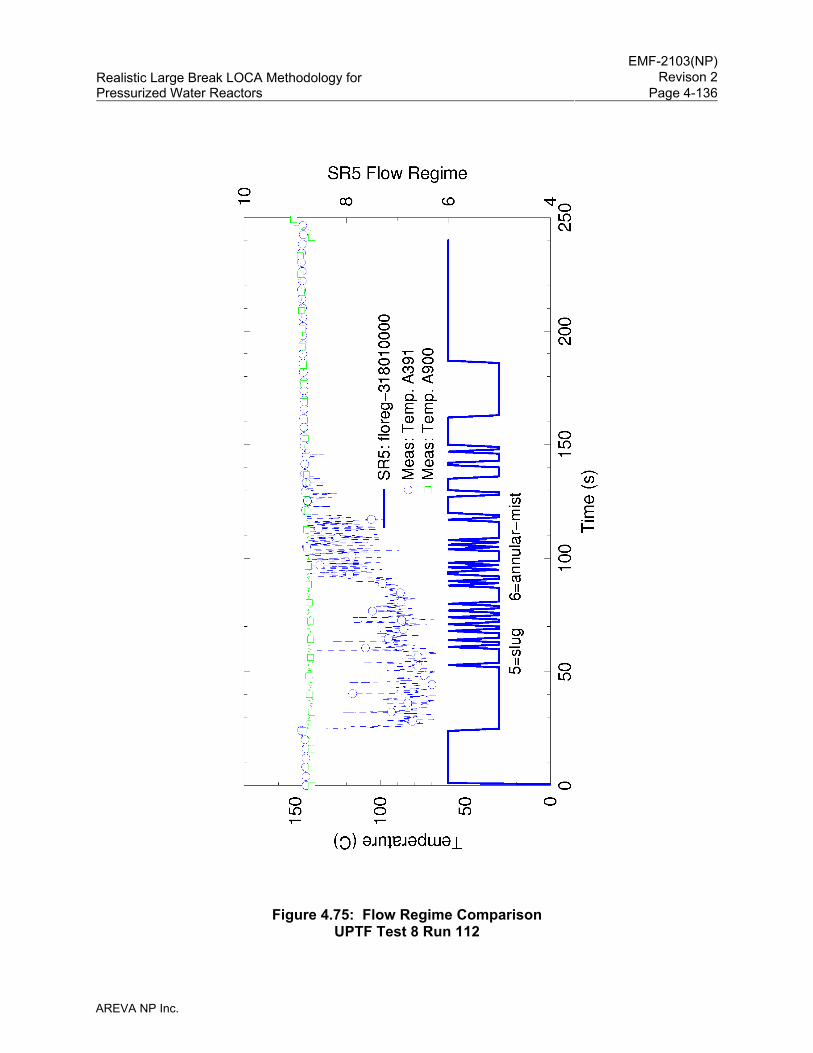
EMF-2103(NP)
Revison 2Realistic Large Break LOCA Methodology for Pressurized Water Reactors Page 4-136
AREVA NP Inc.
Figure 4.75: Flow Regime Comparison UPTF Test 8 Run 112
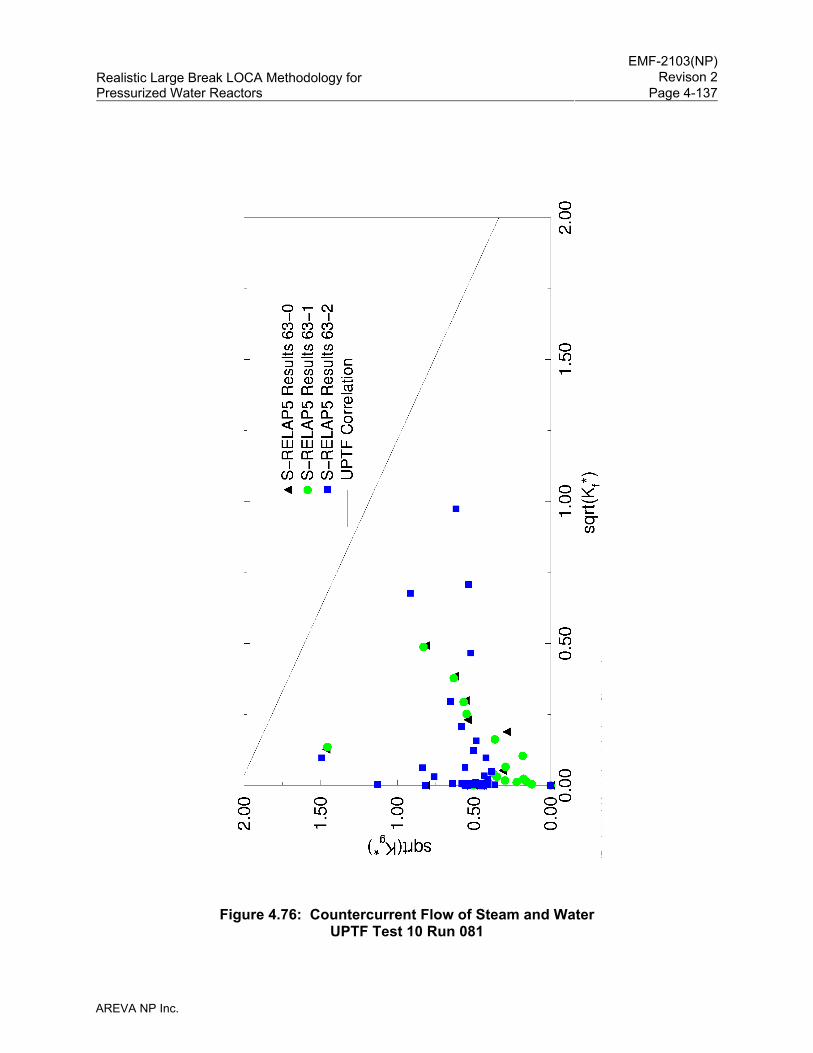
EMF-2103(NP)
Revison 2Realistic Large Break LOCA Methodology for Pressurized Water Reactors Page 4-137
AREVA NP Inc.
Figure 4.76: Countercurrent Flow of Steam and Water UPTF Test 10 Run 081

EMF-2103(NP)
Revison 2Realistic Large Break LOCA Methodology for Pressurized Water Reactors Page 4-138
AREVA NP Inc.
Figure 4.77: Countercurrent Flow of Steam and Water UPTF Test 29 Run 212/211
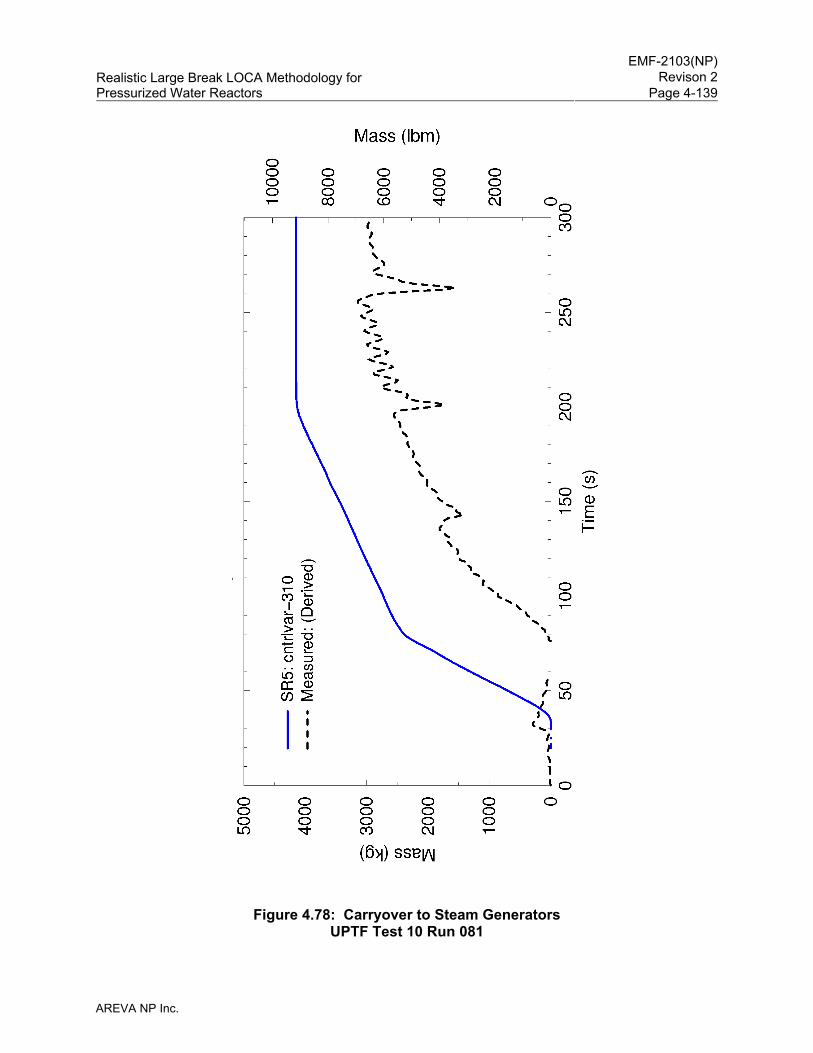
EMF-2103(NP)
Revison 2Realistic Large Break LOCA Methodology for Pressurized Water Reactors Page 4-139
AREVA NP Inc.
Figure 4.78: Carryover to Steam Generators UPTF Test 10 Run 081
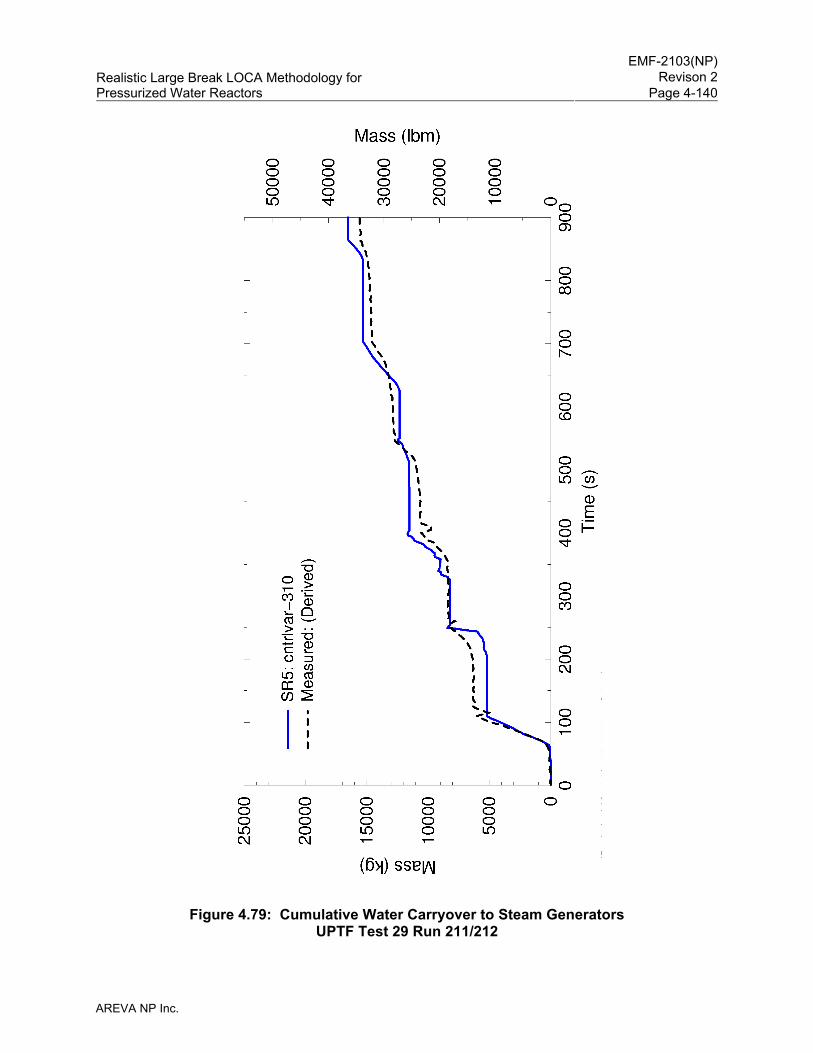
EMF-2103(NP)
Revison 2Realistic Large Break LOCA Methodology for Pressurized Water Reactors Page 4-140
AREVA NP Inc.
Figure 4.79: Cumulative Water Carryover to Steam Generators UPTF Test 29 Run 211/212
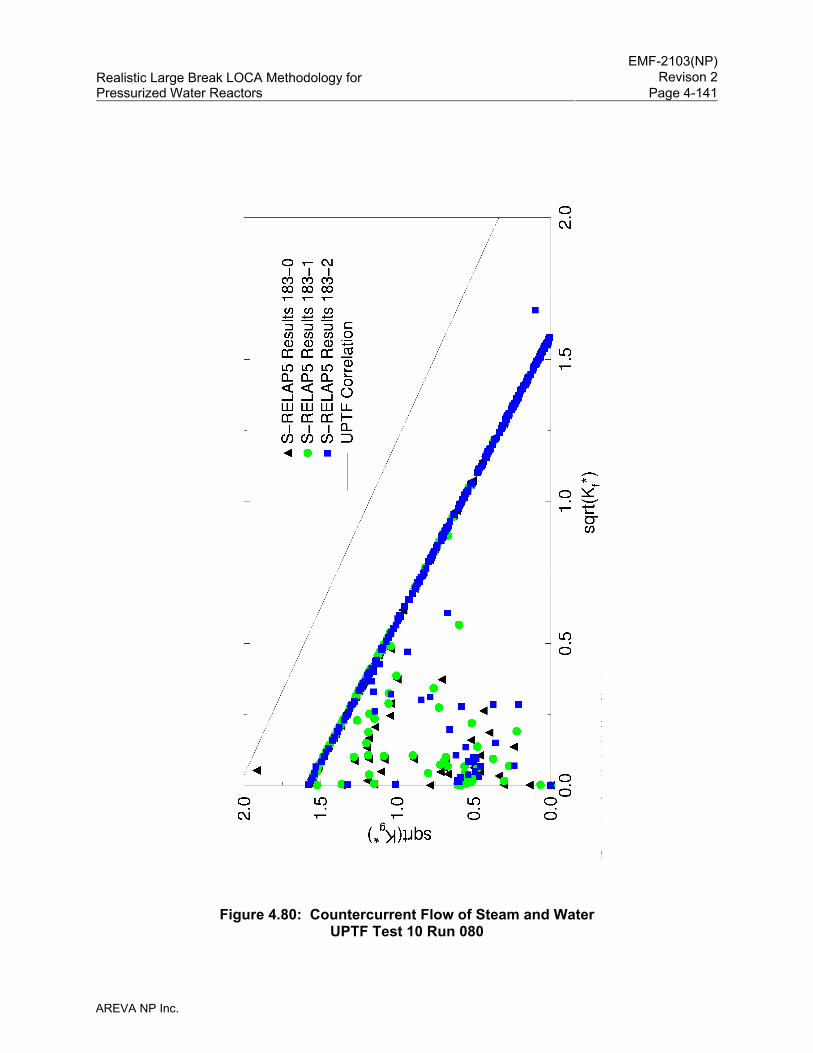
EMF-2103(NP)
Revison 2Realistic Large Break LOCA Methodology for Pressurized Water Reactors Page 4-141
AREVA NP Inc.
Figure 4.80: Countercurrent Flow of Steam and Water UPTF Test 10 Run 080
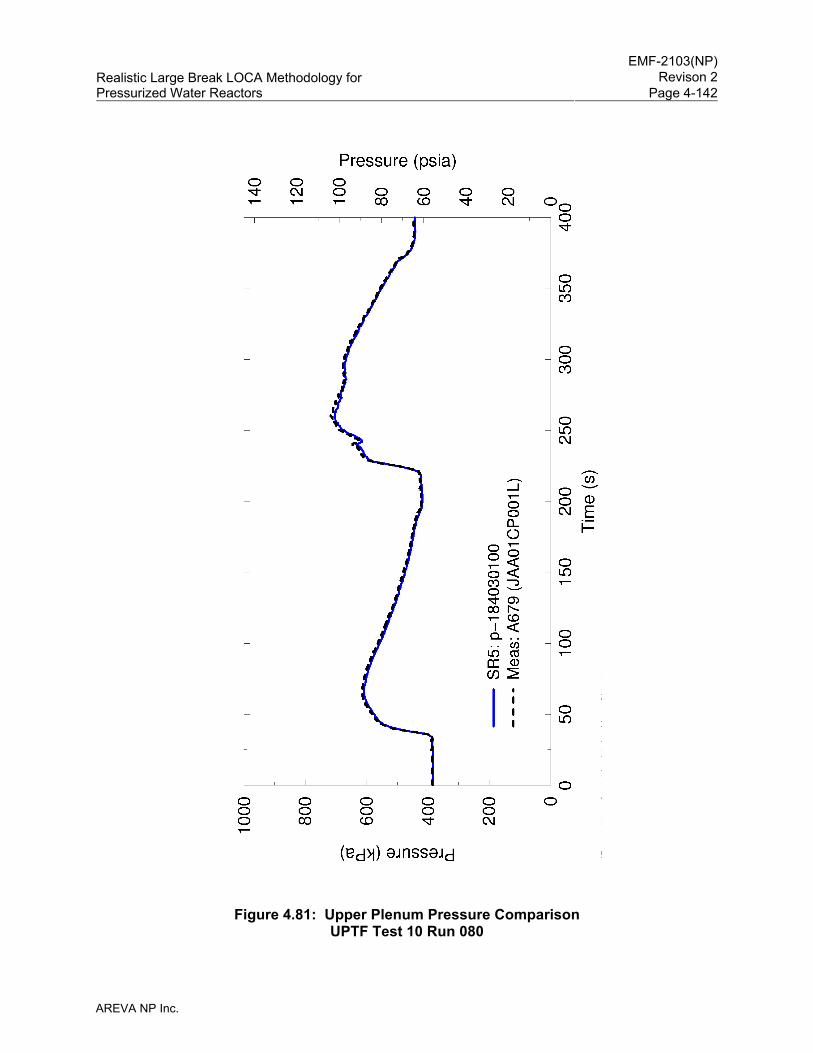
EMF-2103(NP)
Revison 2Realistic Large Break LOCA Methodology for Pressurized Water Reactors Page 4-142
AREVA NP Inc.
Figure 4.81: Upper Plenum Pressure Comparison UPTF Test 10 Run 080
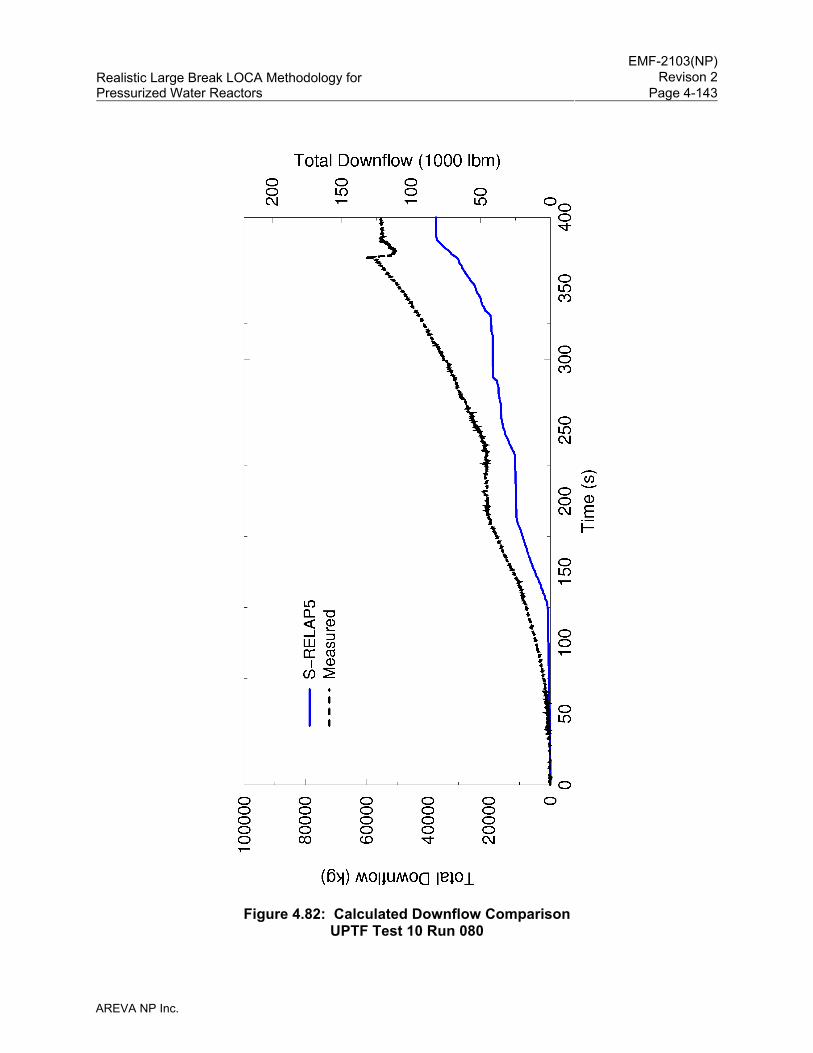
EMF-2103(NP)
Revison 2Realistic Large Break LOCA Methodology for Pressurized Water Reactors Page 4-143
AREVA NP Inc.
Figure 4.82: Calculated Downflow Comparison UPTF Test 10 Run 080
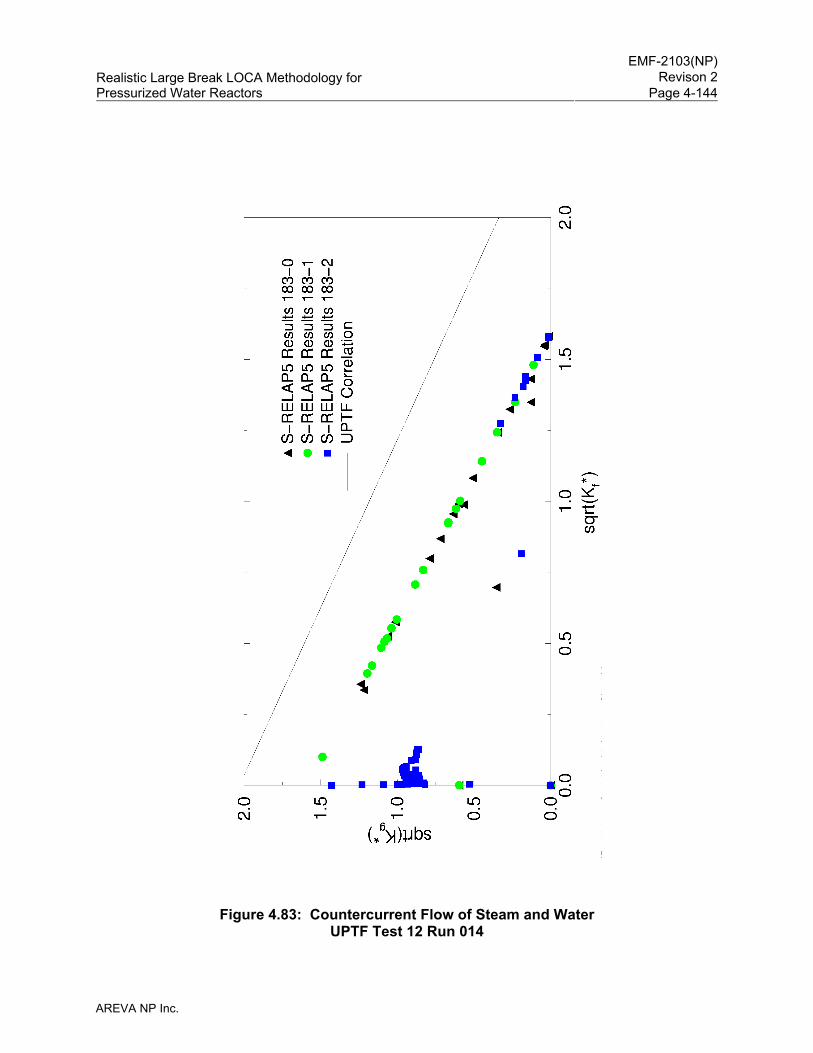
EMF-2103(NP)
Revison 2Realistic Large Break LOCA Methodology for Pressurized Water Reactors Page 4-144
AREVA NP Inc.
Figure 4.83: Countercurrent Flow of Steam and Water UPTF Test 12 Run 014
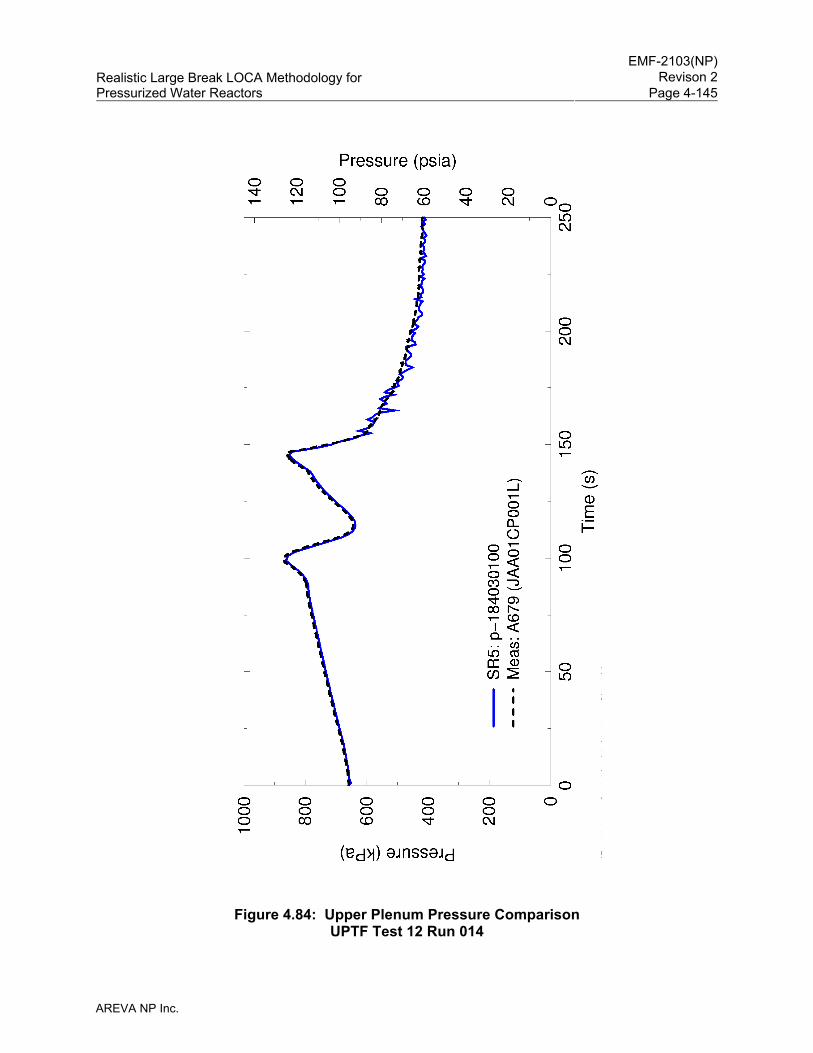
EMF-2103(NP)
Revison 2Realistic Large Break LOCA Methodology for Pressurized Water Reactors Page 4-145
AREVA NP Inc.
Figure 4.84: Upper Plenum Pressure Comparison UPTF Test 12 Run 014
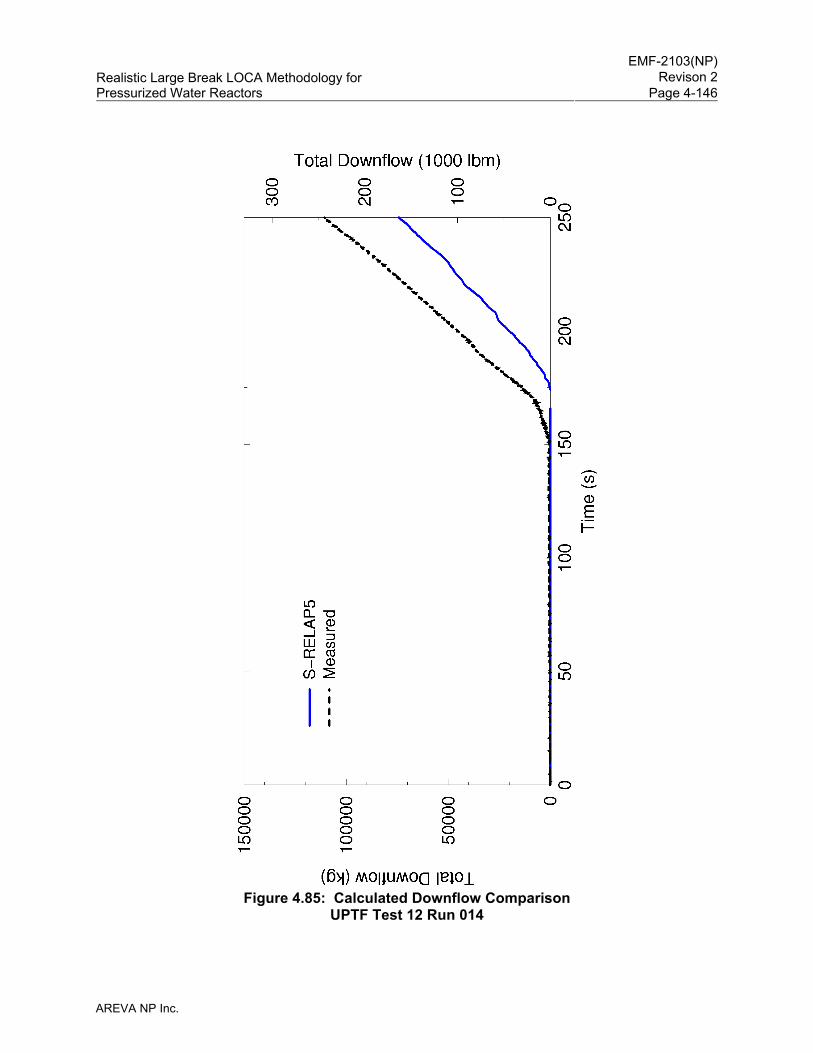
EMF-2103(NP)
Revison 2Realistic Large Break LOCA Methodology for Pressurized Water Reactors Page 4-146
AREVA NP Inc.
Figure 4.85: Calculated Downflow Comparison
UPTF Test 12 Run 014
EMF-2103(NP)
Revison 2Realistic Large Break LOCA Methodology for Pressurized Water Reactors Page 4-147
AREVA NP Inc.
4.3.1.12 CCTF Tests
Four, from a series of 29, Cylindrical Core Test Facility (CCTF) CORE-II tests were chosen as a
diverse sample of behaviors to evaluate the capability of S-RELAP5 to predict core and primary
system thermal-hydraulic phenomena occurring during the reflood phase of LBLOCA in a PWR.
CCTF Core-II tests were conducted under the 2D/3D program to provide a major and useful
database of LBLOCA reflood behavior in PWRs. Of particular interest are the simulations of
reflood behavior in Westinghouse 4–loop PWRs in which ECC is injected into the cold leg.
CCTF is a full-height, 1/21 scale model of the RCS of a 4-loop PWR plant. The facility was
designed to reasonably simulate the flow conditions, including ECC flow behavior in the
downcomer, and reactor core responses in the primary system of a PWR during the refill and
reflood phases of a LBLOCA.
Tests 54, 62, 67, and 68 were chosen to evaluate the performance of S-RELAP5 during vessel
reflood. The tests are representative of a series of CCTF system gravity reflood tests with
certain aspects of refill included. Simulation of these tests provides an understanding of key
reflood phenomena and comparisons of predicted and measured results for assessment of
various S-RELAP5 thermal-hydraulic models and their dynamic interactions. Table 4.10
summarizes the key test parameters.
Since CCTF is a full-height, 1/21 scale model of the primary coolant system of a 4-loop plant,
the RLBLOCA guidelines were used, wherever possible, to model the test facility. The
downcomer is represented by a 9x8 2-dimensional (z, θ) component. The lower plenum is
divided into two axial nodes. The upper plenum is modeled using two two-dimensional (z, r)
components each having three axial levels. One component represents the region in the guide
assembly simulators; it is divided into two radial rings. The second component represents the
reminder of the upper plenum; it is divided into three radial rings.
The bundle region is modeled using an 18x4 two-dimensional (z, r) component. The lower
17 axial nodes represent the 3.66 meter (144 inch) active core region and Node 18 represents
the distance between the top of the active core and the upper core tie plate. The four radial flow
channels correspond to the three power zones. The first radial ring represents the hot assembly
and the second ring represents the reminder of the high-power region, Region-A. The third and
fourth rings represent the medium power region, Region-B, and the low power region,
Region-C. The bundles in each ring are represented by one rod. In the hot channel (central
EMF-2103(NP)
Revison 2Realistic Large Break LOCA Methodology for Pressurized Water Reactors Page 4-148
AREVA NP Inc.
ring) there is an additional rod that represents a hot rod. Bundle heat transfer multipliers,
FILMBL and DFFBHTC are set to [ ]. Since all the
heated rods in a bundle have the same power, and the PCTs in all the tests simulated are below
1800oF, the rod-to-rod radiation model was not used.
The steam generator tube region is modeled using eight nodes and the cold leg piping from the
pump discharge to the downcomer inlet is modeled using four nodes. The cold leg
condensation model (summarized in Section 4.3.3.1.14 and described in detail in Section 5.2 of
Reference 5) is used in the intact cold legs.
To get acceptable liquid entrainment out of the steam generator inlet plenum, the following input
modeling recommended from the UPTF Tests 10 and 29 benchmarks (Section 4.3.1.11.3) was
used.
The CCTF tests, input model, and assessment results are discussed in detail in Section 3.11 of
Reference 5. During the reflood phase of a LBLOCA, some of the important reflood phenomena
are core heat transfer, void generation/distribution and entrainment/ deentrainment in the core,
entrainment/deentrainment in the upper plenum and in the hot legs, and steam binding in the
steam generator. All of these reflood phenomena were calculated reasonably well by
S-RELAP5. Selected key parameters are discussed below.
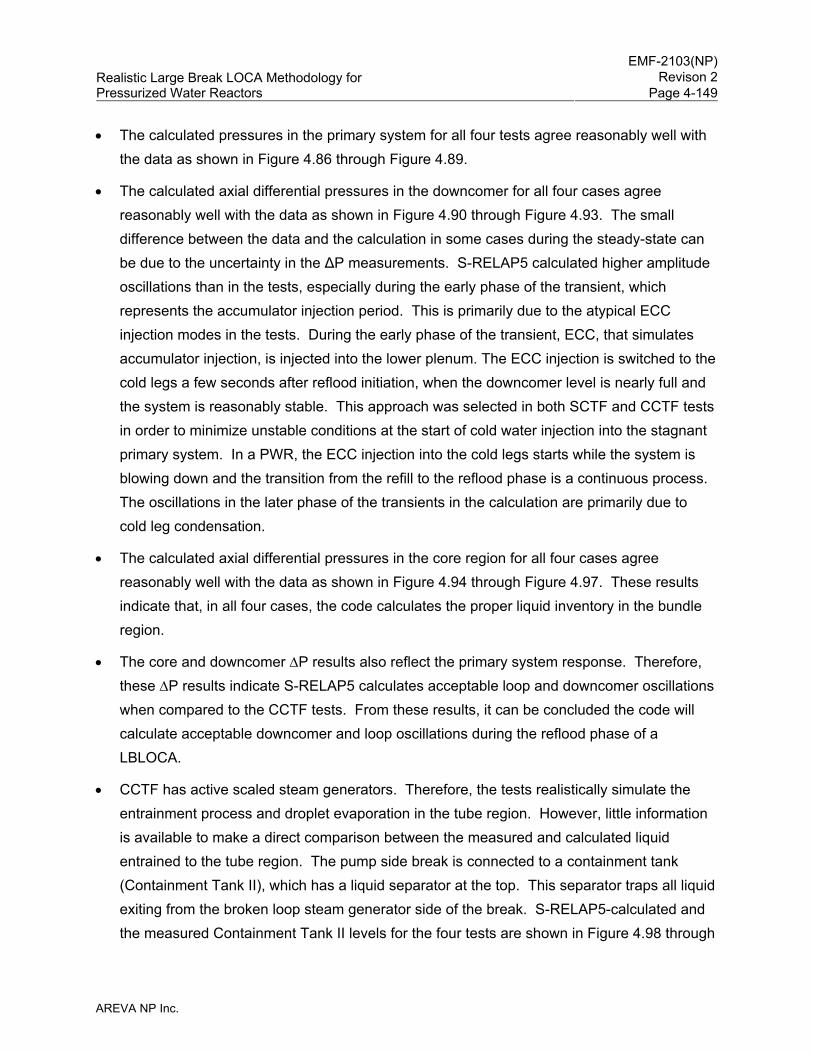
EMF-2103(NP)
Revison 2Realistic Large Break LOCA Methodology for Pressurized Water Reactors Page 4-149
AREVA NP Inc.
• The calculated pressures in the primary system for all four tests agree reasonably well with the data as shown in Figure 4.86 through Figure 4.89.
• The calculated axial differential pressures in the downcomer for all four cases agree reasonably well with the data as shown in Figure 4.90 through Figure 4.93. The small difference between the data and the calculation in some cases during the steady-state can be due to the uncertainty in the ΔP measurements. S-RELAP5 calculated higher amplitude oscillations than in the tests, especially during the early phase of the transient, which represents the accumulator injection period. This is primarily due to the atypical ECC injection modes in the tests. During the early phase of the transient, ECC, that simulates accumulator injection, is injected into the lower plenum. The ECC injection is switched to the cold legs a few seconds after reflood initiation, when the downcomer level is nearly full and the system is reasonably stable. This approach was selected in both SCTF and CCTF tests in order to minimize unstable conditions at the start of cold water injection into the stagnant primary system. In a PWR, the ECC injection into the cold legs starts while the system is blowing down and the transition from the refill to the reflood phase is a continuous process. The oscillations in the later phase of the transients in the calculation are primarily due to cold leg condensation.
• The calculated axial differential pressures in the core region for all four cases agree reasonably well with the data as shown in Figure 4.94 through Figure 4.97. These results indicate that, in all four cases, the code calculates the proper liquid inventory in the bundle region.
• The core and downcomer ΔP results also reflect the primary system response. Therefore, these ΔP results indicate S-RELAP5 calculates acceptable loop and downcomer oscillations when compared to the CCTF tests. From these results, it can be concluded the code will calculate acceptable downcomer and loop oscillations during the reflood phase of a LBLOCA.
• CCTF has active scaled steam generators. Therefore, the tests realistically simulate the entrainment process and droplet evaporation in the tube region. However, little information is available to make a direct comparison between the measured and calculated liquid entrained to the tube region. The pump side break is connected to a containment tank (Containment Tank II), which has a liquid separator at the top. This separator traps all liquid exiting from the broken loop steam generator side of the break. S-RELAP5-calculated and the measured Containment Tank II levels for the four tests are shown in Figure 4.98 through
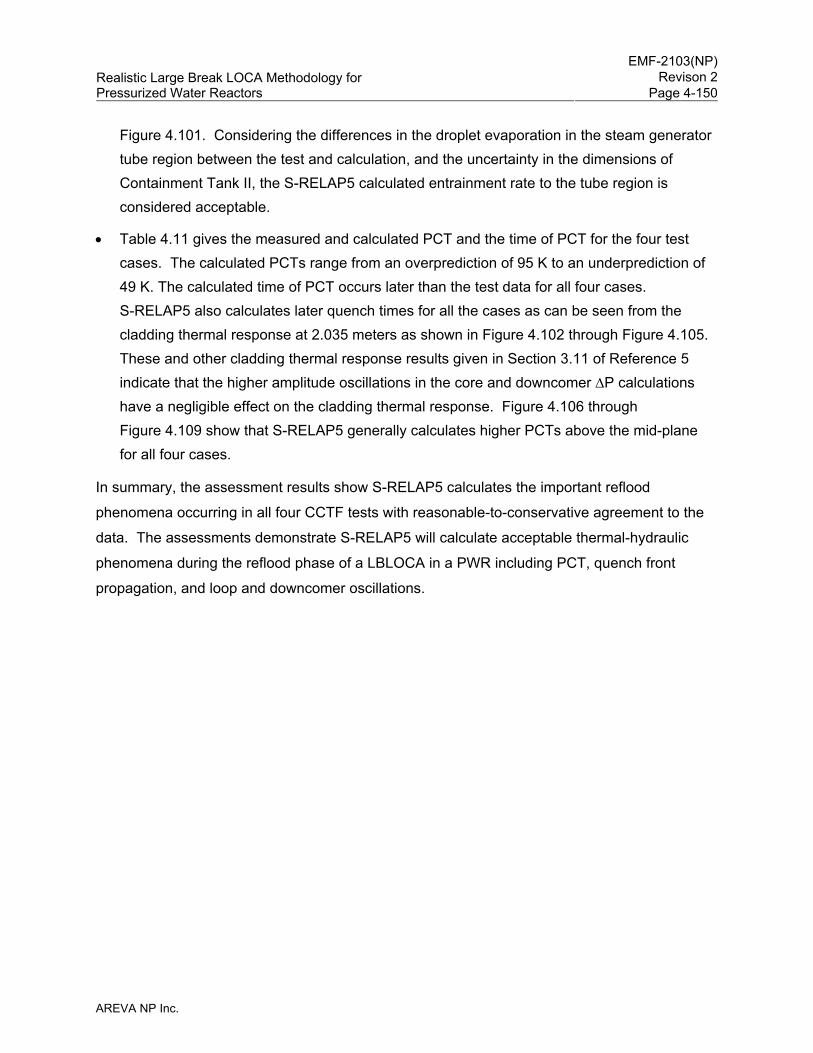
EMF-2103(NP)
Revison 2Realistic Large Break LOCA Methodology for Pressurized Water Reactors Page 4-150
AREVA NP Inc.
Figure 4.101. Considering the differences in the droplet evaporation in the steam generator tube region between the test and calculation, and the uncertainty in the dimensions of Containment Tank II, the S-RELAP5 calculated entrainment rate to the tube region is considered acceptable.
• Table 4.11 gives the measured and calculated PCT and the time of PCT for the four test cases. The calculated PCTs range from an overprediction of 95 K to an underprediction of 49 K. The calculated time of PCT occurs later than the test data for all four cases. S-RELAP5 also calculates later quench times for all the cases as can be seen from the cladding thermal response at 2.035 meters as shown in Figure 4.102 through Figure 4.105. These and other cladding thermal response results given in Section 3.11 of Reference 5 indicate that the higher amplitude oscillations in the core and downcomer ΔP calculations have a negligible effect on the cladding thermal response. Figure 4.106 through Figure 4.109 show that S-RELAP5 generally calculates higher PCTs above the mid-plane for all four cases.
In summary, the assessment results show S-RELAP5 calculates the important reflood
phenomena occurring in all four CCTF tests with reasonable-to-conservative agreement to the
data. The assessments demonstrate S-RELAP5 will calculate acceptable thermal-hydraulic
phenomena during the reflood phase of a LBLOCA in a PWR including PCT, quench front
propagation, and loop and downcomer oscillations.
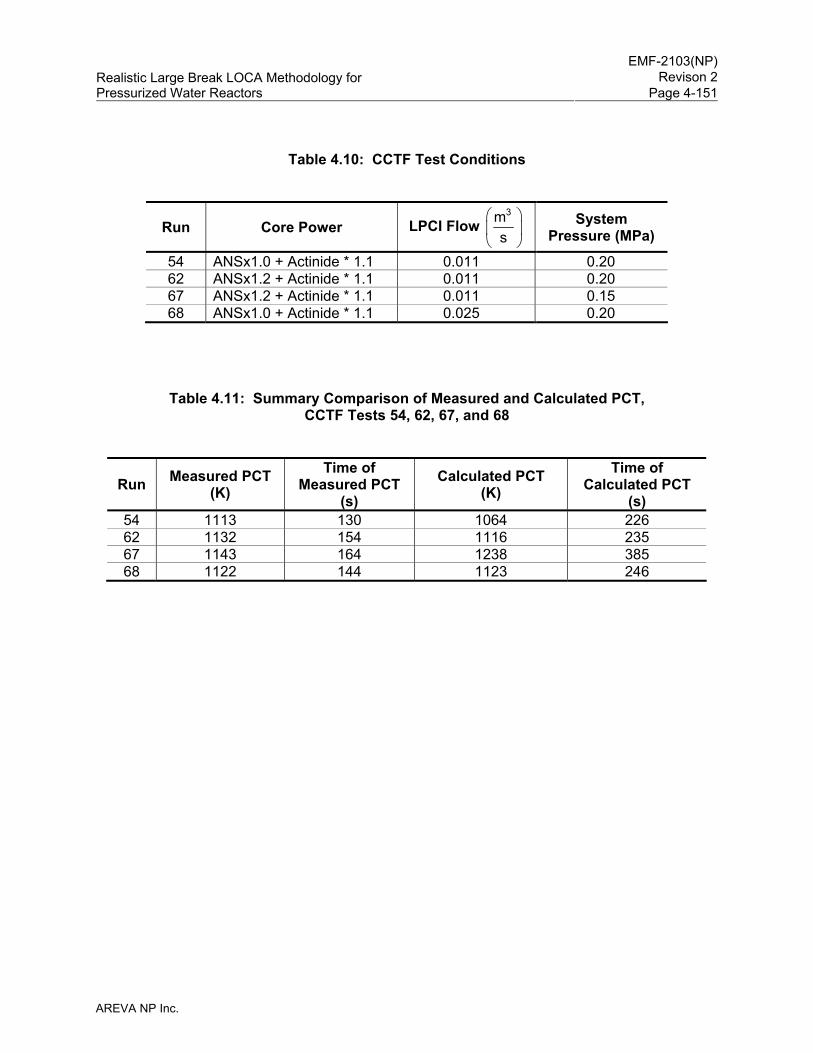
EMF-2103(NP)
Revison 2Realistic Large Break LOCA Methodology for Pressurized Water Reactors Page 4-151
AREVA NP Inc.
Table 4.10: CCTF Test Conditions
Run Core Power LPCI Flow 3m
s⎛ ⎞⎜ ⎟⎝ ⎠
System Pressure (MPa)
54 ANSx1.0 + Actinide * 1.1 0.011 0.20 62 ANSx1.2 + Actinide * 1.1 0.011 0.20 67 ANSx1.2 + Actinide * 1.1 0.011 0.15 68 ANSx1.0 + Actinide * 1.1 0.025 0.20
Table 4.11: Summary Comparison of Measured and Calculated PCT, CCTF Tests 54, 62, 67, and 68
Run Measured PCT (K)
Time of Measured PCT
(s) Calculated PCT
(K) Time of
Calculated PCT (s)
54 1113 130 1064 226 62 1132 154 1116 235 67 1143 164 1238 385 68 1122 144 1123 246
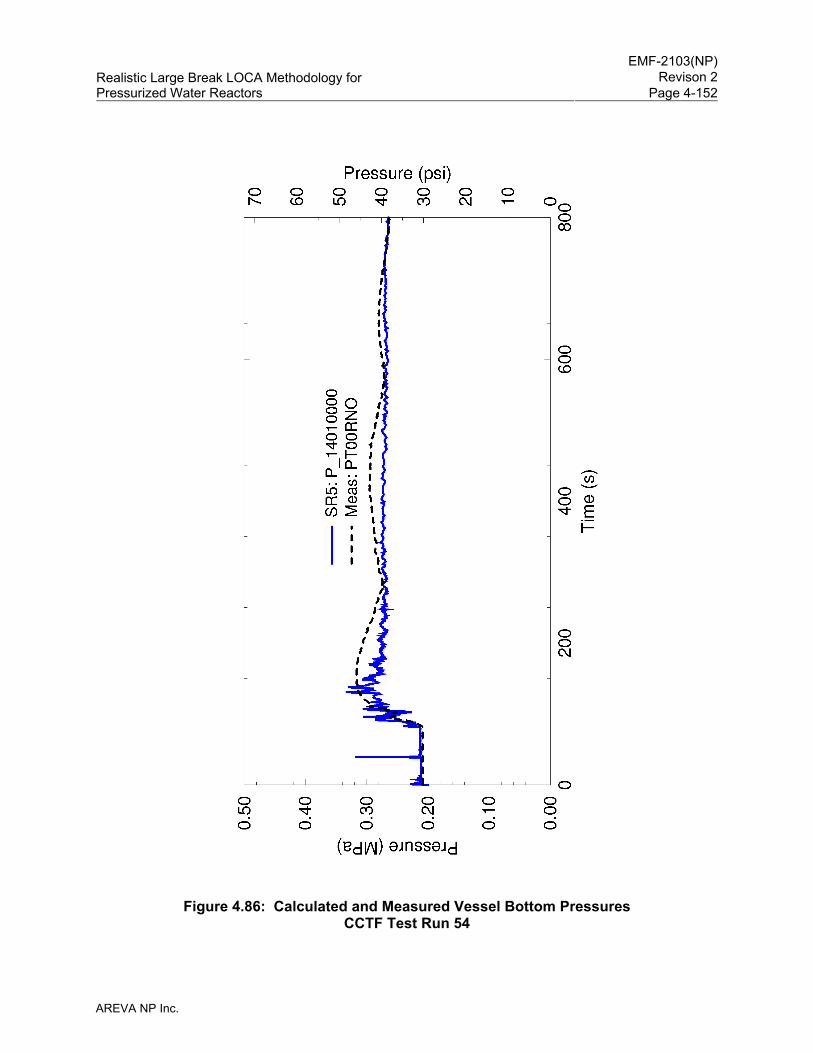
EMF-2103(NP)
Revison 2Realistic Large Break LOCA Methodology for Pressurized Water Reactors Page 4-152
AREVA NP Inc.
Figure 4.86: Calculated and Measured Vessel Bottom Pressures
CCTF Test Run 54
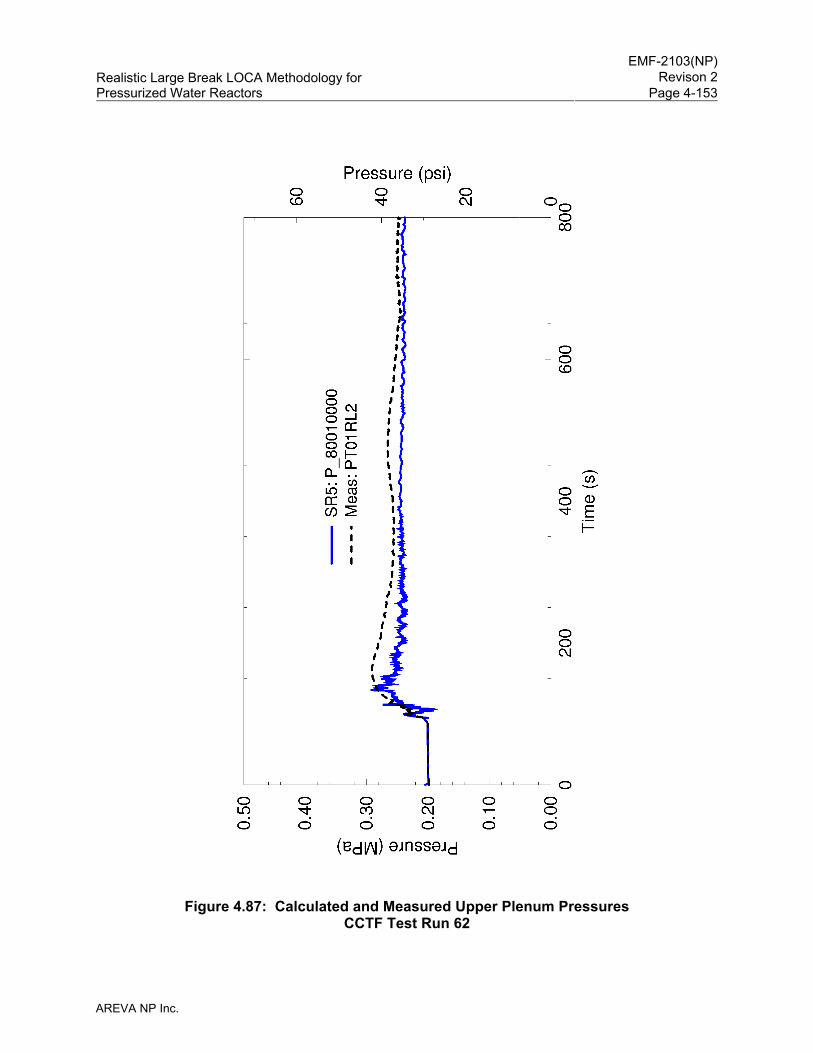
EMF-2103(NP)
Revison 2Realistic Large Break LOCA Methodology for Pressurized Water Reactors Page 4-153
AREVA NP Inc.
Figure 4.87: Calculated and Measured Upper Plenum Pressures
CCTF Test Run 62
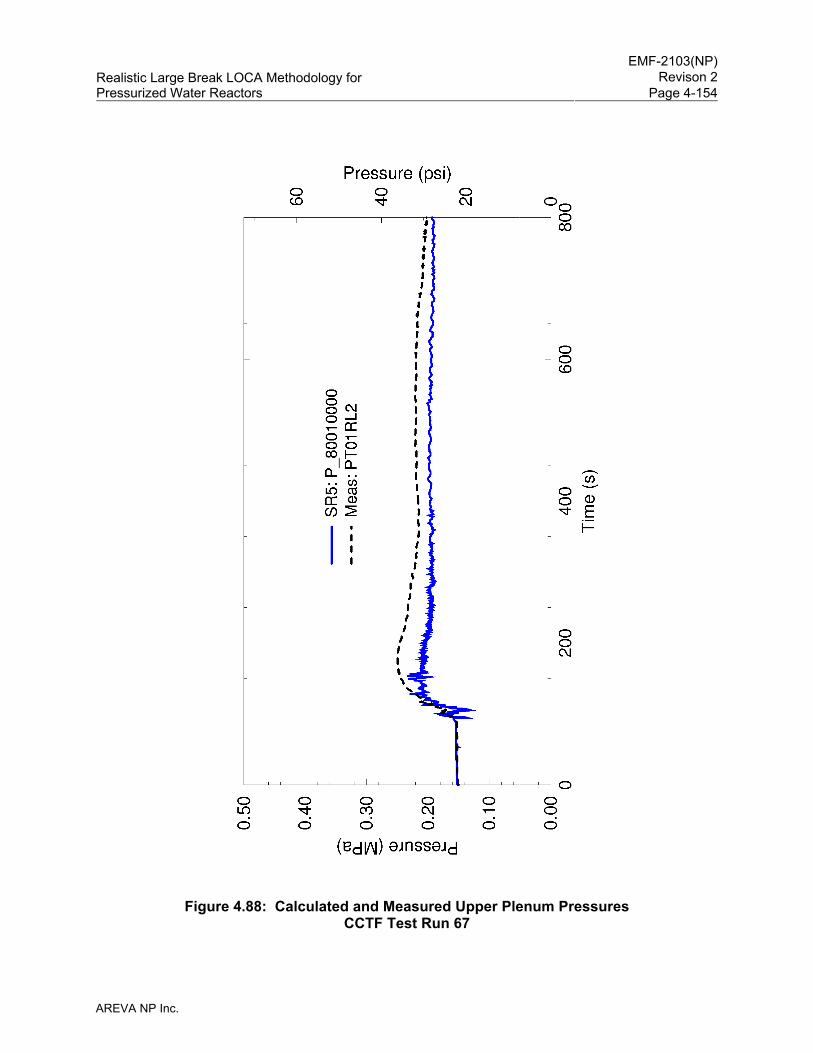
EMF-2103(NP)
Revison 2Realistic Large Break LOCA Methodology for Pressurized Water Reactors Page 4-154
AREVA NP Inc.
Figure 4.88: Calculated and Measured Upper Plenum Pressures
CCTF Test Run 67
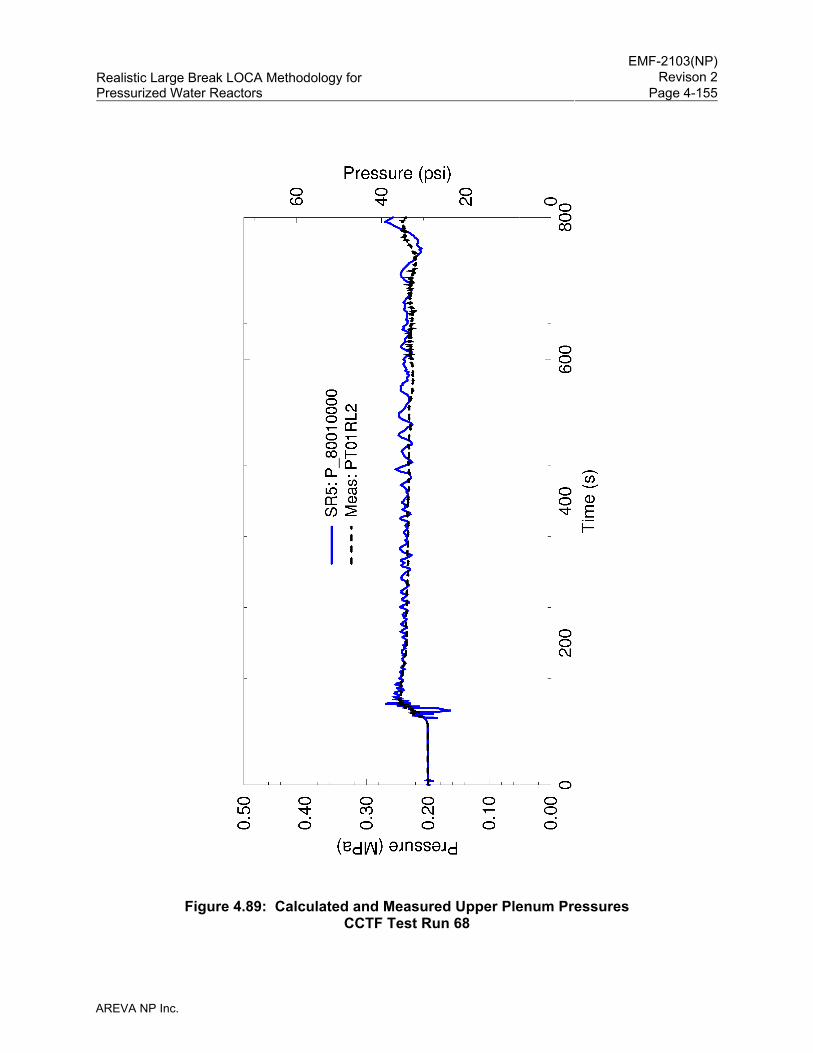
EMF-2103(NP)
Revison 2Realistic Large Break LOCA Methodology for Pressurized Water Reactors Page 4-155
AREVA NP Inc.
Figure 4.89: Calculated and Measured Upper Plenum Pressures
CCTF Test Run 68
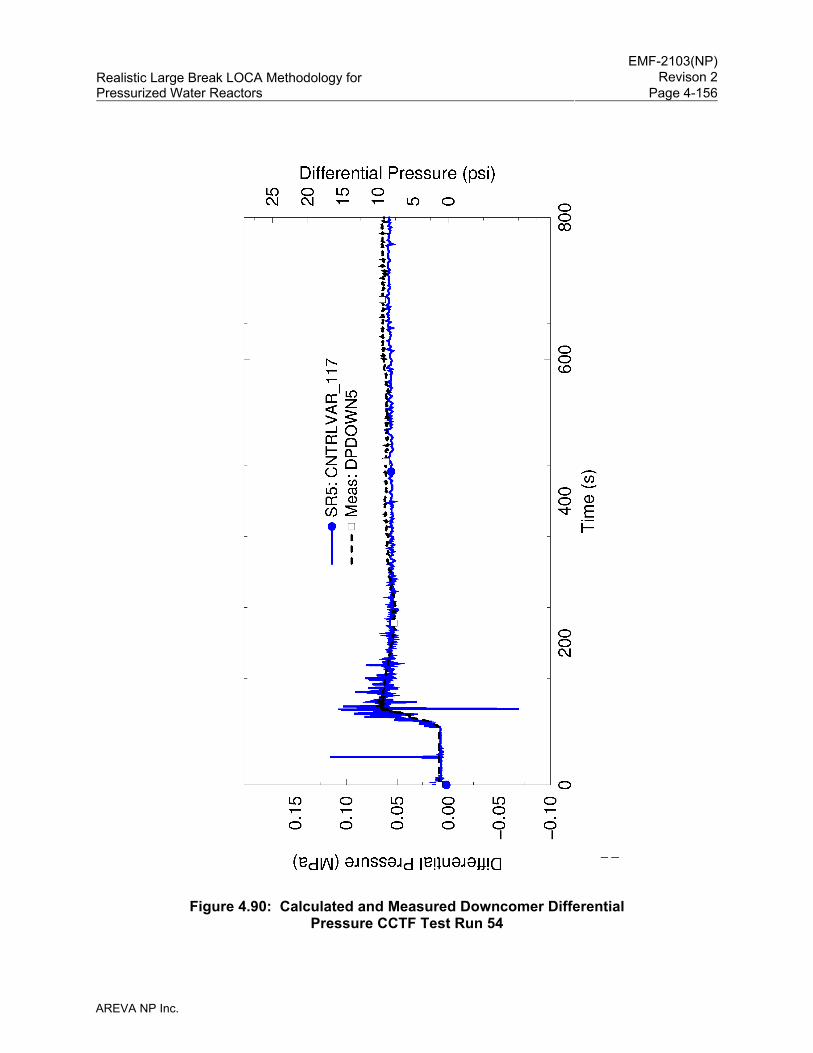
EMF-2103(NP)
Revison 2Realistic Large Break LOCA Methodology for Pressurized Water Reactors Page 4-156
AREVA NP Inc.
Figure 4.90: Calculated and Measured Downcomer Differential
Pressure CCTF Test Run 54
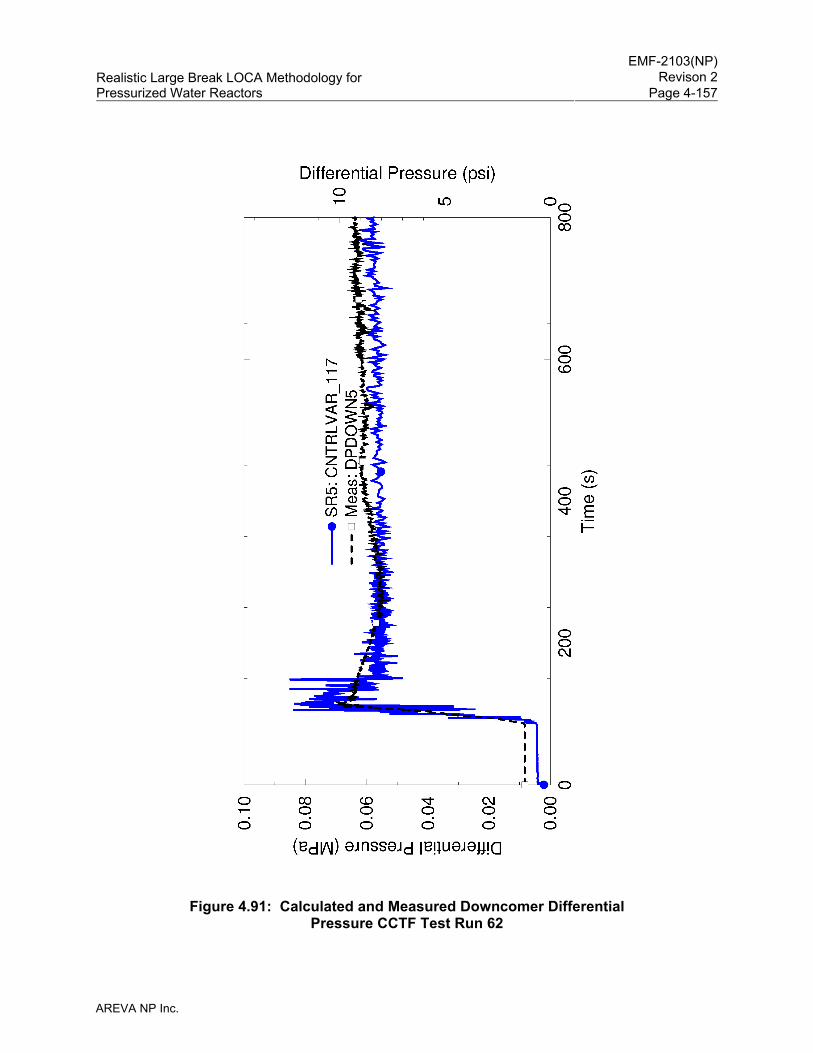
EMF-2103(NP)
Revison 2Realistic Large Break LOCA Methodology for Pressurized Water Reactors Page 4-157
AREVA NP Inc.
Figure 4.91: Calculated and Measured Downcomer Differential
Pressure CCTF Test Run 62
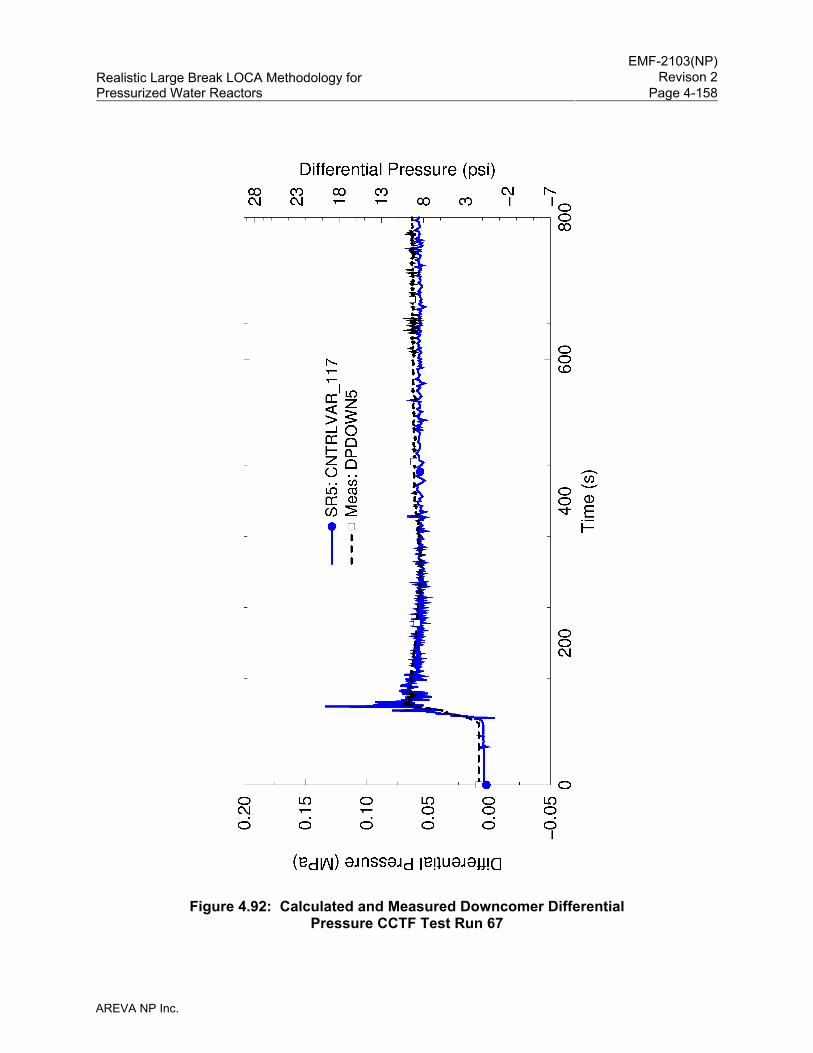
EMF-2103(NP)
Revison 2Realistic Large Break LOCA Methodology for Pressurized Water Reactors Page 4-158
AREVA NP Inc.
Figure 4.92: Calculated and Measured Downcomer Differential
Pressure CCTF Test Run 67
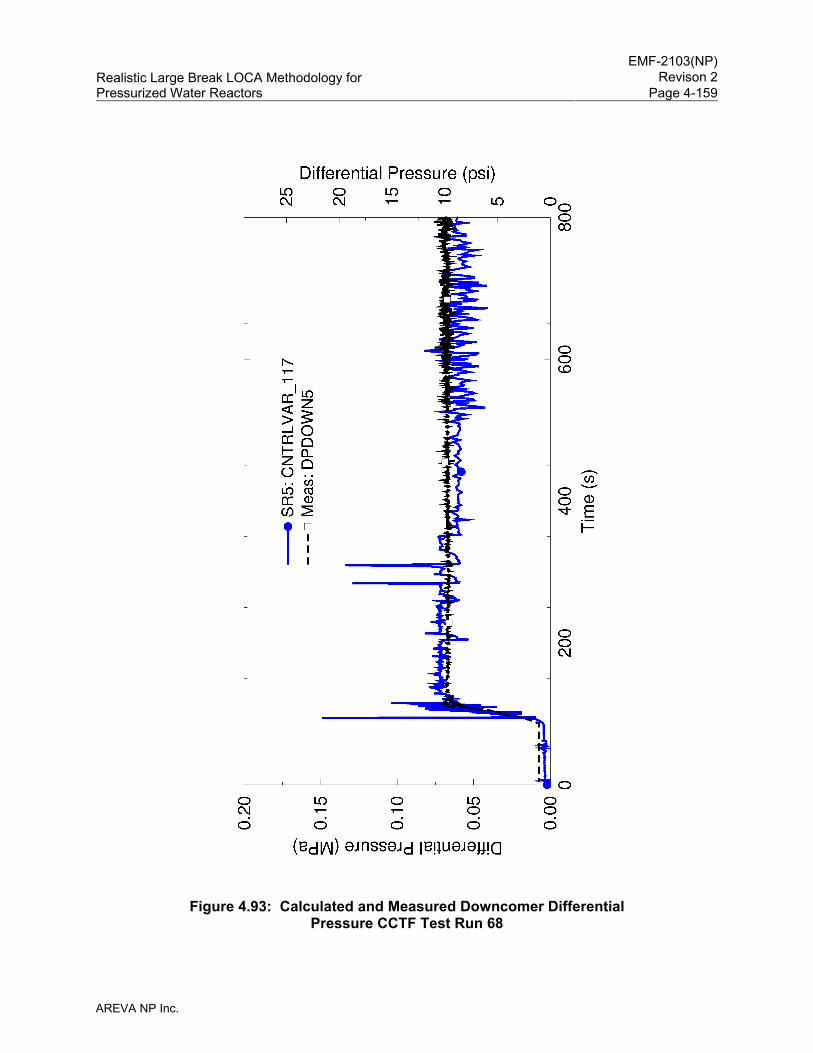
EMF-2103(NP)
Revison 2Realistic Large Break LOCA Methodology for Pressurized Water Reactors Page 4-159
AREVA NP Inc.
Figure 4.93: Calculated and Measured Downcomer Differential
Pressure CCTF Test Run 68
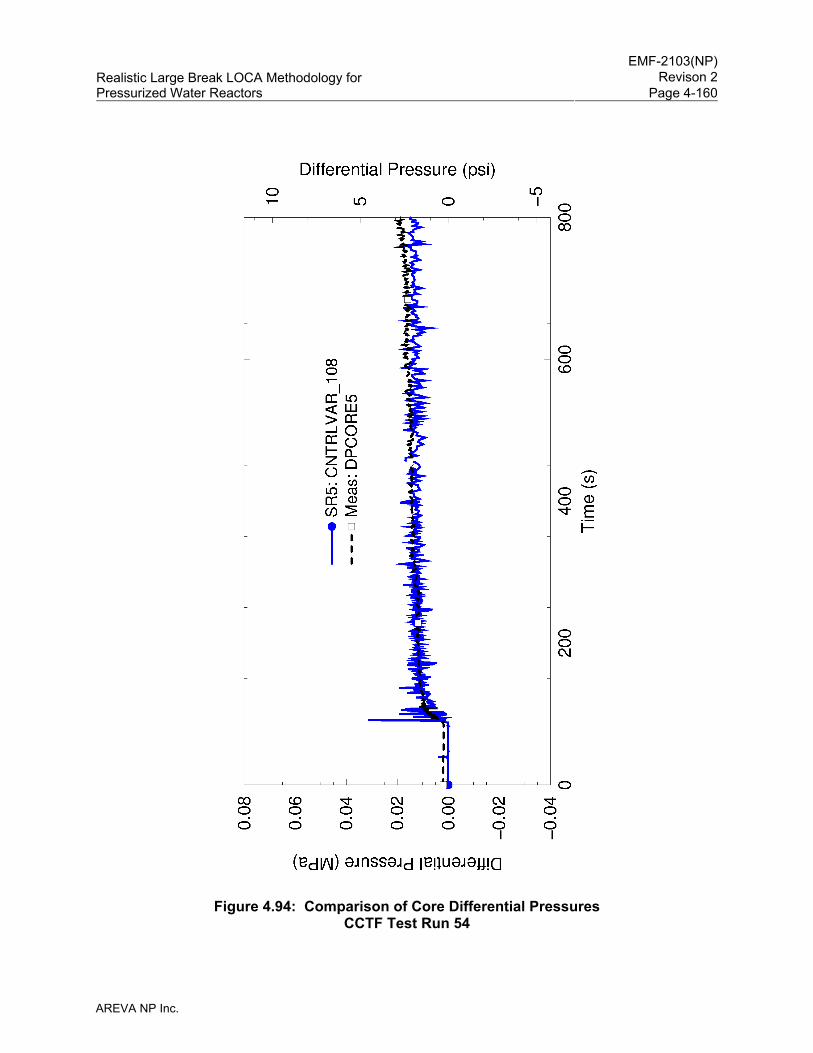
EMF-2103(NP)
Revison 2Realistic Large Break LOCA Methodology for Pressurized Water Reactors Page 4-160
AREVA NP Inc.
Figure 4.94: Comparison of Core Differential Pressures
CCTF Test Run 54
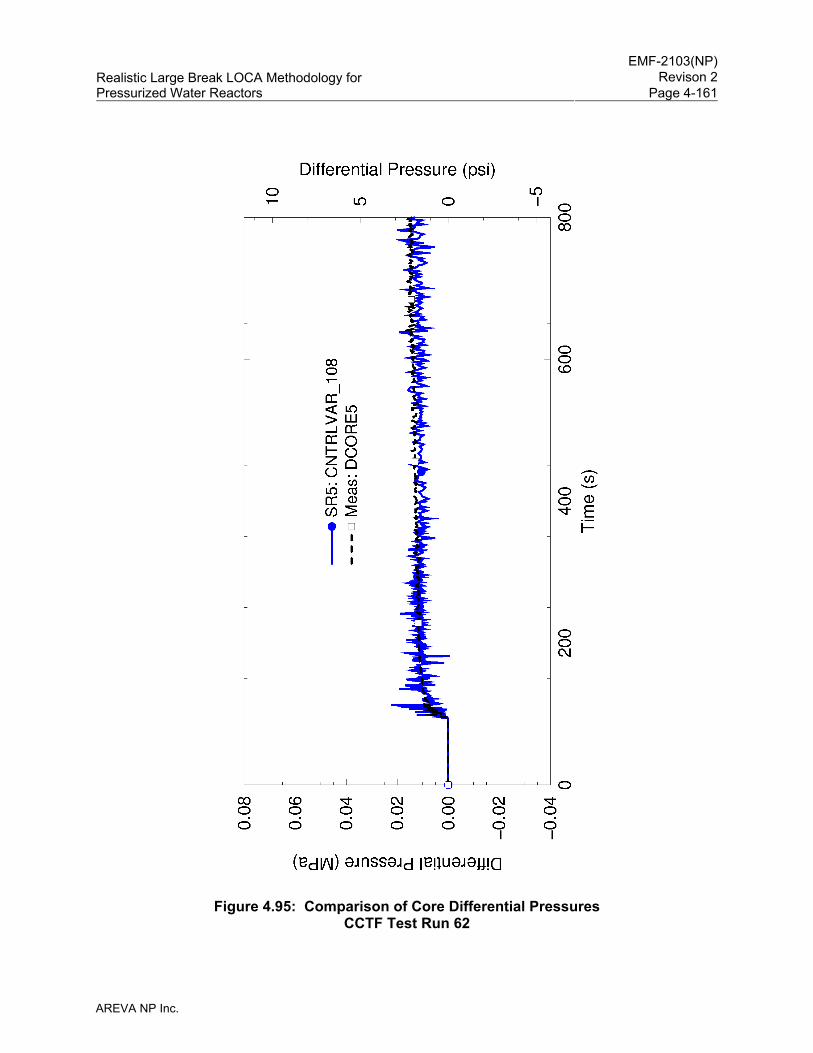
EMF-2103(NP)
Revison 2Realistic Large Break LOCA Methodology for Pressurized Water Reactors Page 4-161
AREVA NP Inc.
Figure 4.95: Comparison of Core Differential Pressures
CCTF Test Run 62
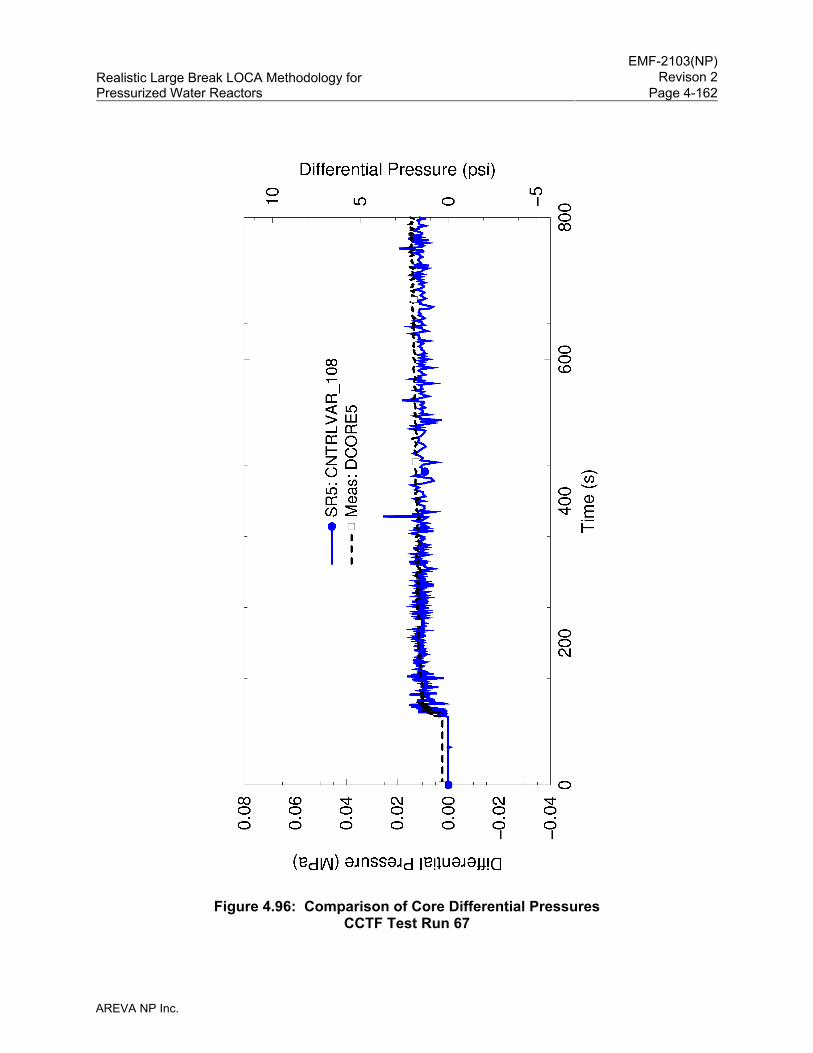
EMF-2103(NP)
Revison 2Realistic Large Break LOCA Methodology for Pressurized Water Reactors Page 4-162
AREVA NP Inc.
Figure 4.96: Comparison of Core Differential Pressures
CCTF Test Run 67
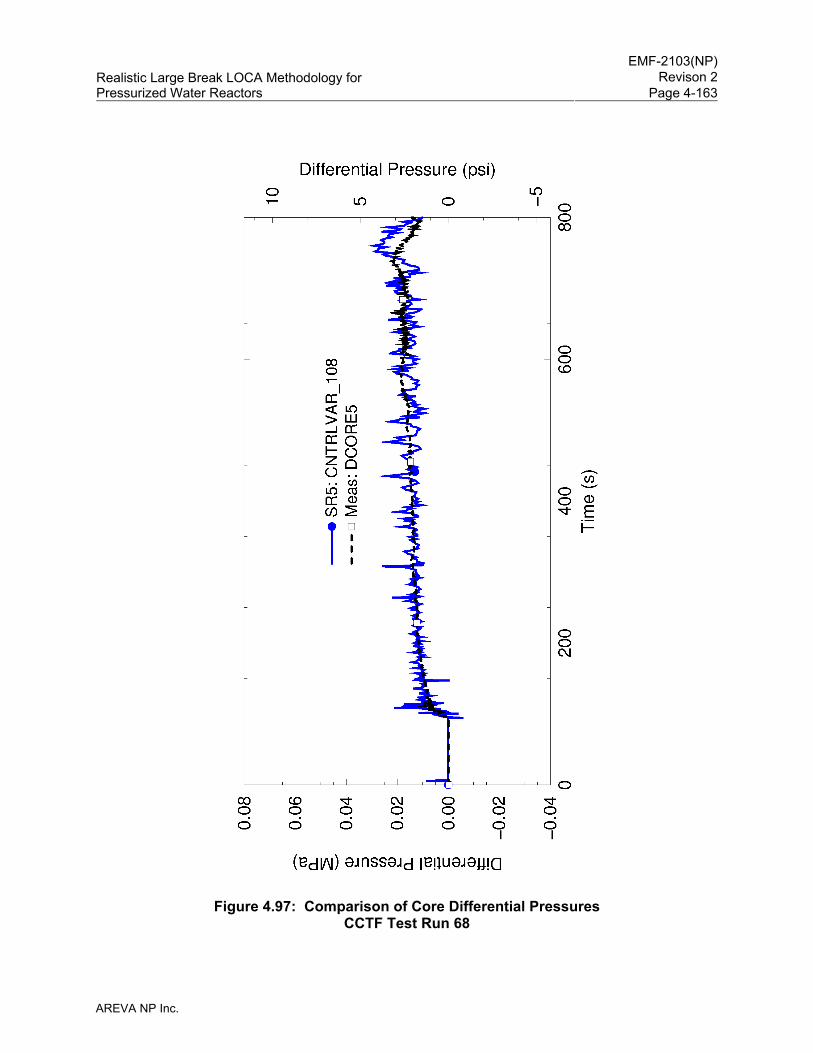
EMF-2103(NP)
Revison 2Realistic Large Break LOCA Methodology for Pressurized Water Reactors Page 4-163
AREVA NP Inc.
Figure 4.97: Comparison of Core Differential Pressures
CCTF Test Run 68
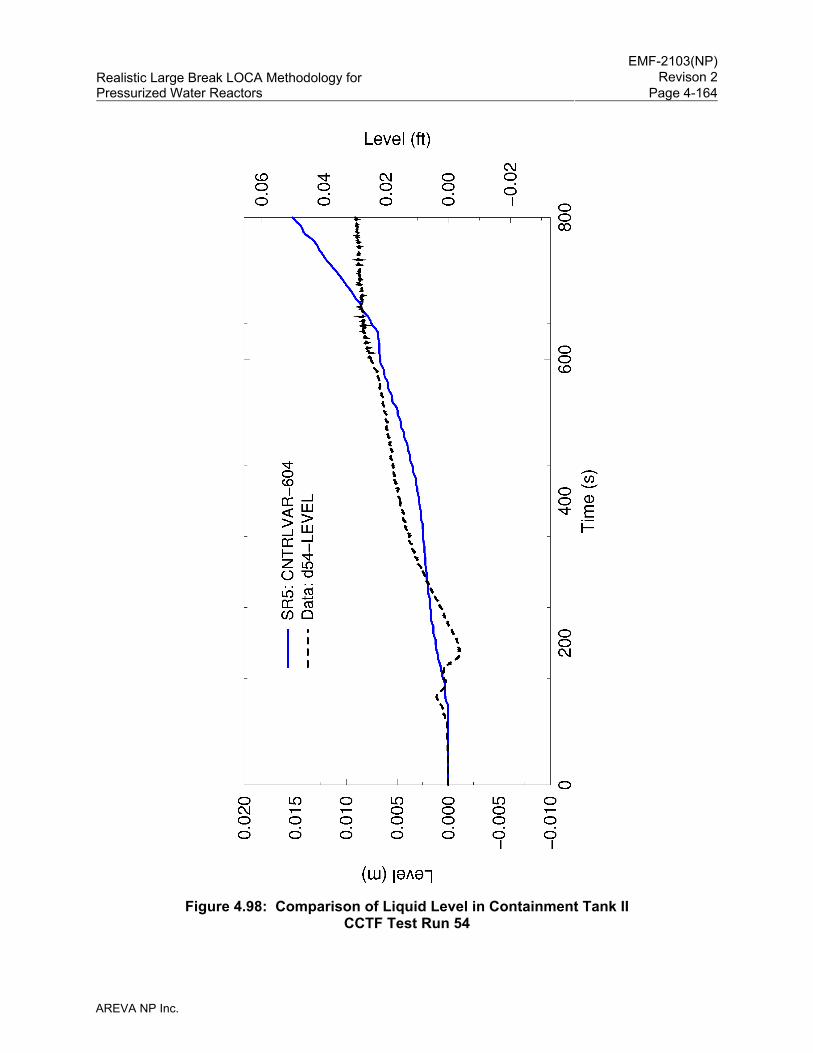
EMF-2103(NP)
Revison 2Realistic Large Break LOCA Methodology for Pressurized Water Reactors Page 4-164
AREVA NP Inc.
Figure 4.98: Comparison of Liquid Level in Containment Tank II
CCTF Test Run 54
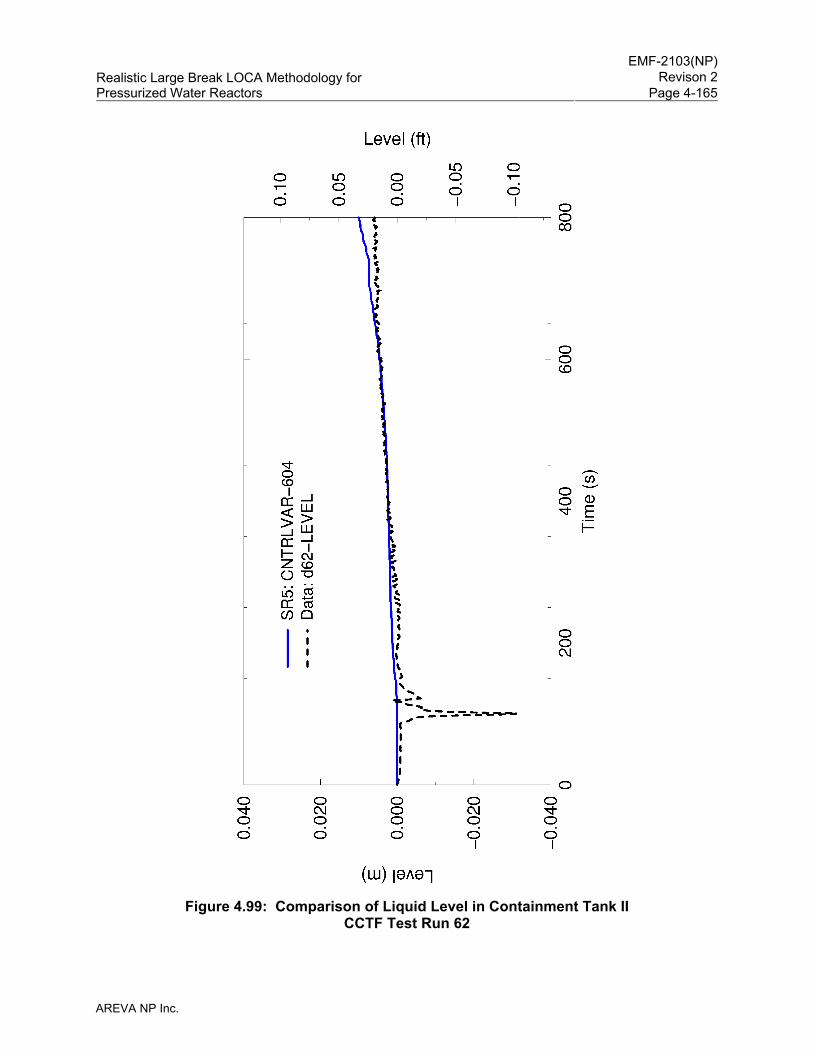
EMF-2103(NP)
Revison 2Realistic Large Break LOCA Methodology for Pressurized Water Reactors Page 4-165
AREVA NP Inc.
Figure 4.99: Comparison of Liquid Level in Containment Tank II
CCTF Test Run 62
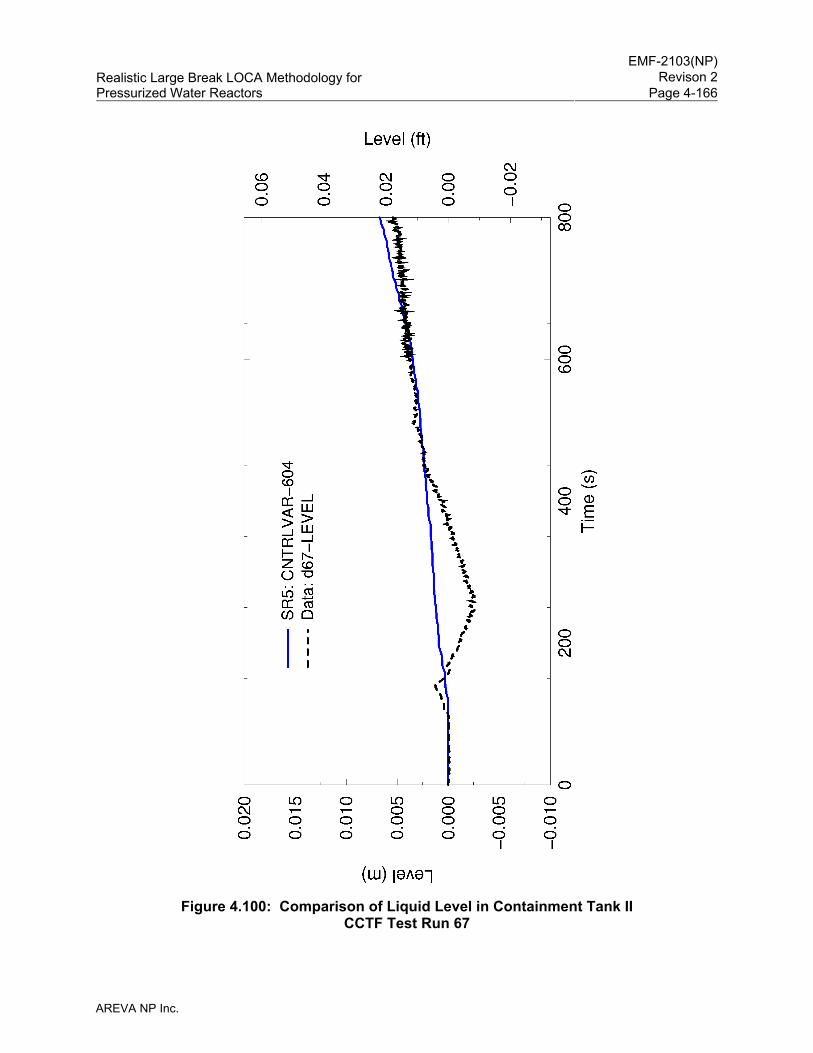
EMF-2103(NP)
Revison 2Realistic Large Break LOCA Methodology for Pressurized Water Reactors Page 4-166
AREVA NP Inc.
Figure 4.100: Comparison of Liquid Level in Containment Tank II
CCTF Test Run 67
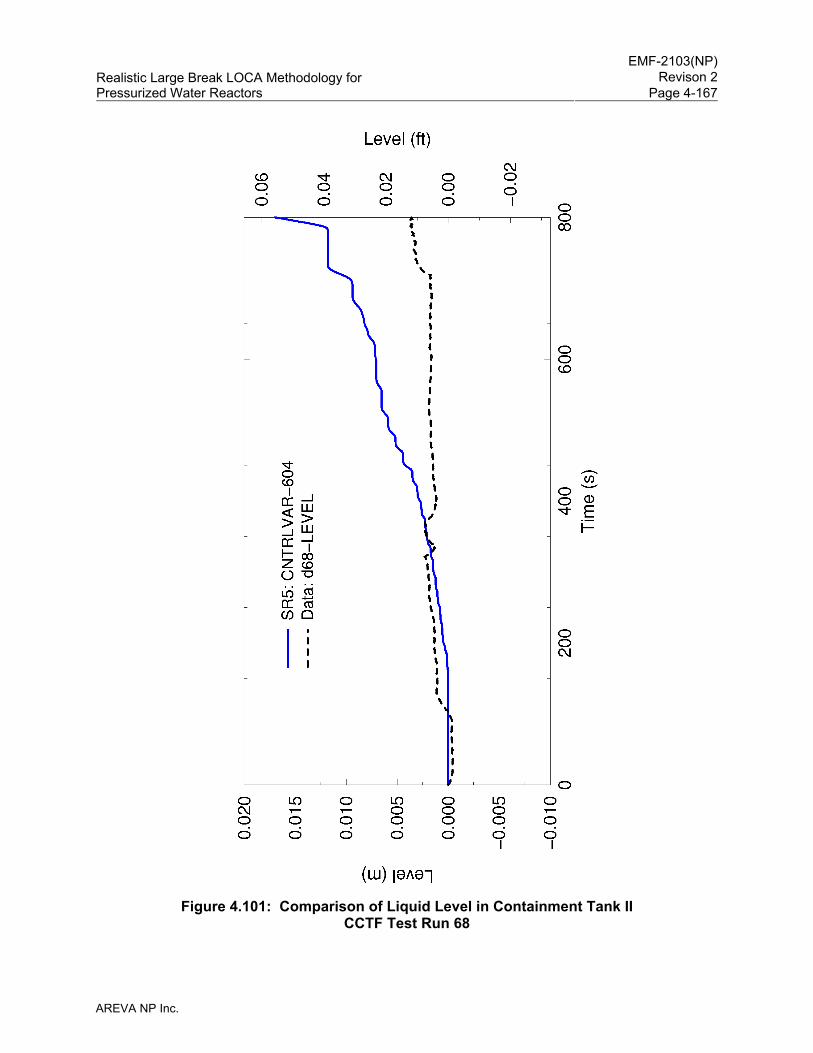
EMF-2103(NP)
Revison 2Realistic Large Break LOCA Methodology for Pressurized Water Reactors Page 4-167
AREVA NP Inc.
Figure 4.101: Comparison of Liquid Level in Containment Tank II
CCTF Test Run 68
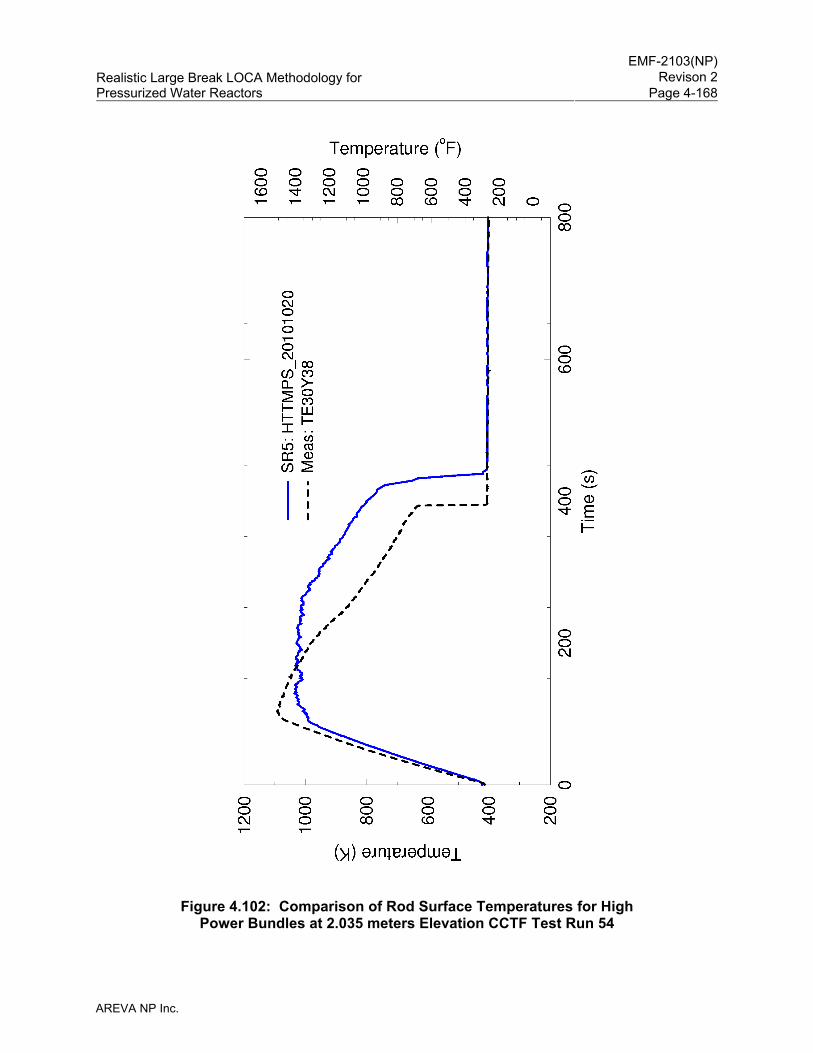
EMF-2103(NP)
Revison 2Realistic Large Break LOCA Methodology for Pressurized Water Reactors Page 4-168
AREVA NP Inc.
Figure 4.102: Comparison of Rod Surface Temperatures for High
Power Bundles at 2.035 meters Elevation CCTF Test Run 54
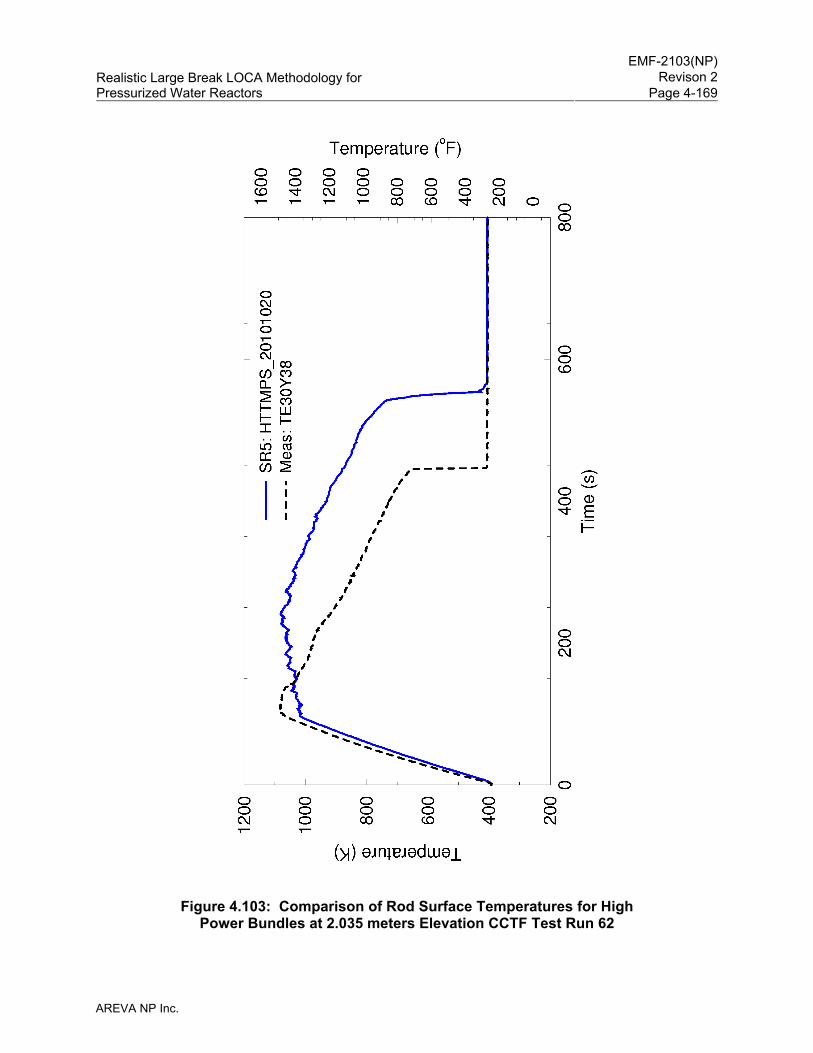
EMF-2103(NP)
Revison 2Realistic Large Break LOCA Methodology for Pressurized Water Reactors Page 4-169
AREVA NP Inc.
Figure 4.103: Comparison of Rod Surface Temperatures for High
Power Bundles at 2.035 meters Elevation CCTF Test Run 62
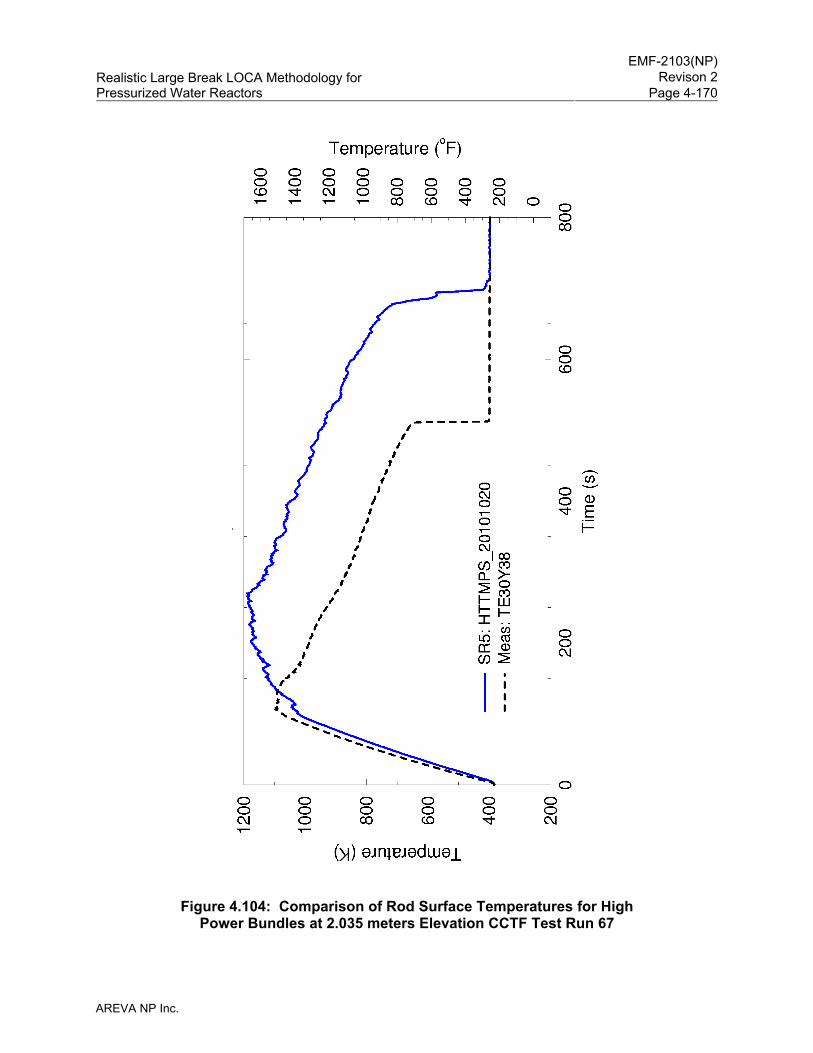
EMF-2103(NP)
Revison 2Realistic Large Break LOCA Methodology for Pressurized Water Reactors Page 4-170
AREVA NP Inc.
Figure 4.104: Comparison of Rod Surface Temperatures for High
Power Bundles at 2.035 meters Elevation CCTF Test Run 67
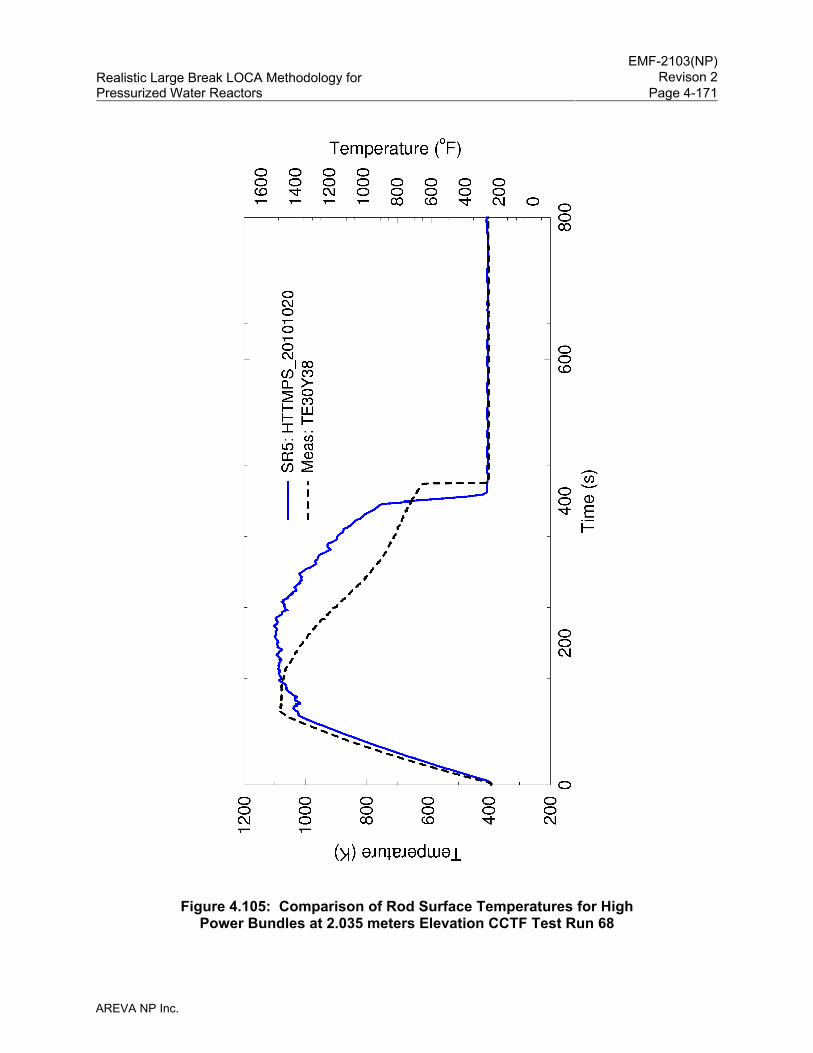
EMF-2103(NP)
Revison 2Realistic Large Break LOCA Methodology for Pressurized Water Reactors Page 4-171
AREVA NP Inc.
Figure 4.105: Comparison of Rod Surface Temperatures for High
Power Bundles at 2.035 meters Elevation CCTF Test Run 68
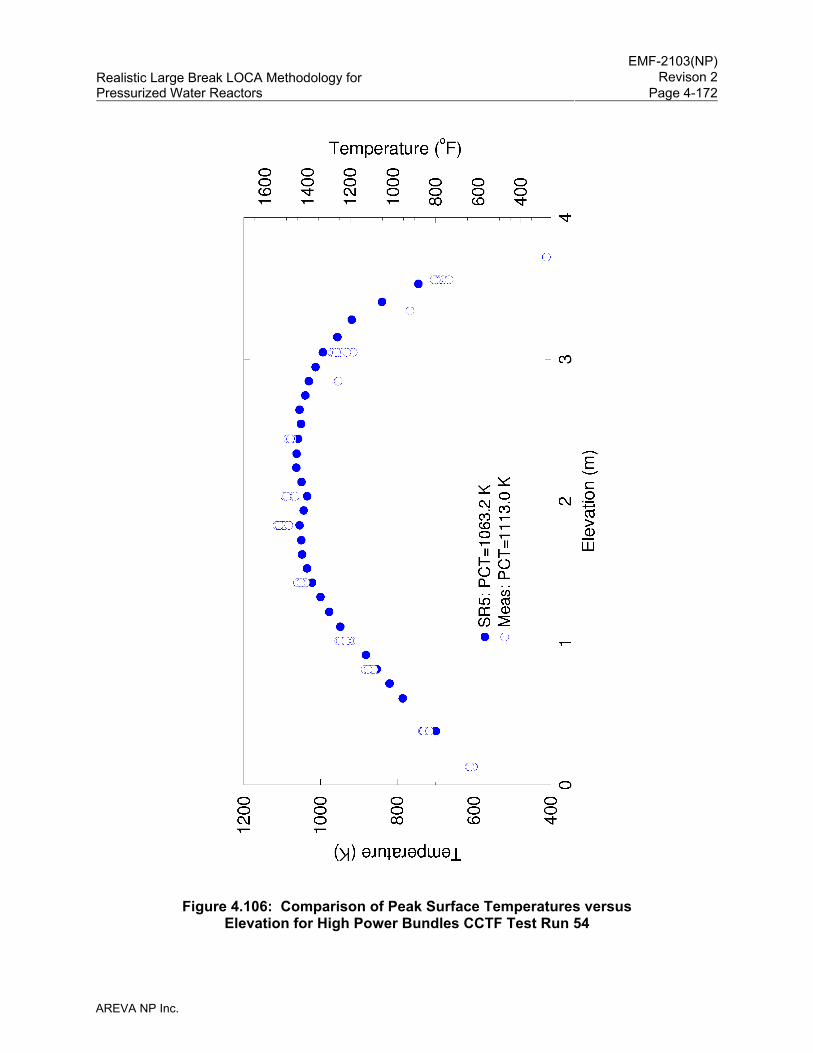
EMF-2103(NP)
Revison 2Realistic Large Break LOCA Methodology for Pressurized Water Reactors Page 4-172
AREVA NP Inc.
Figure 4.106: Comparison of Peak Surface Temperatures versus
Elevation for High Power Bundles CCTF Test Run 54

EMF-2103(NP)
Revison 2Realistic Large Break LOCA Methodology for Pressurized Water Reactors Page 4-173
AREVA NP Inc.
Figure 4.107: Comparison of Peak Surface Temperatures versus
Elevation for High Power Bundles CCTF Test Run 62
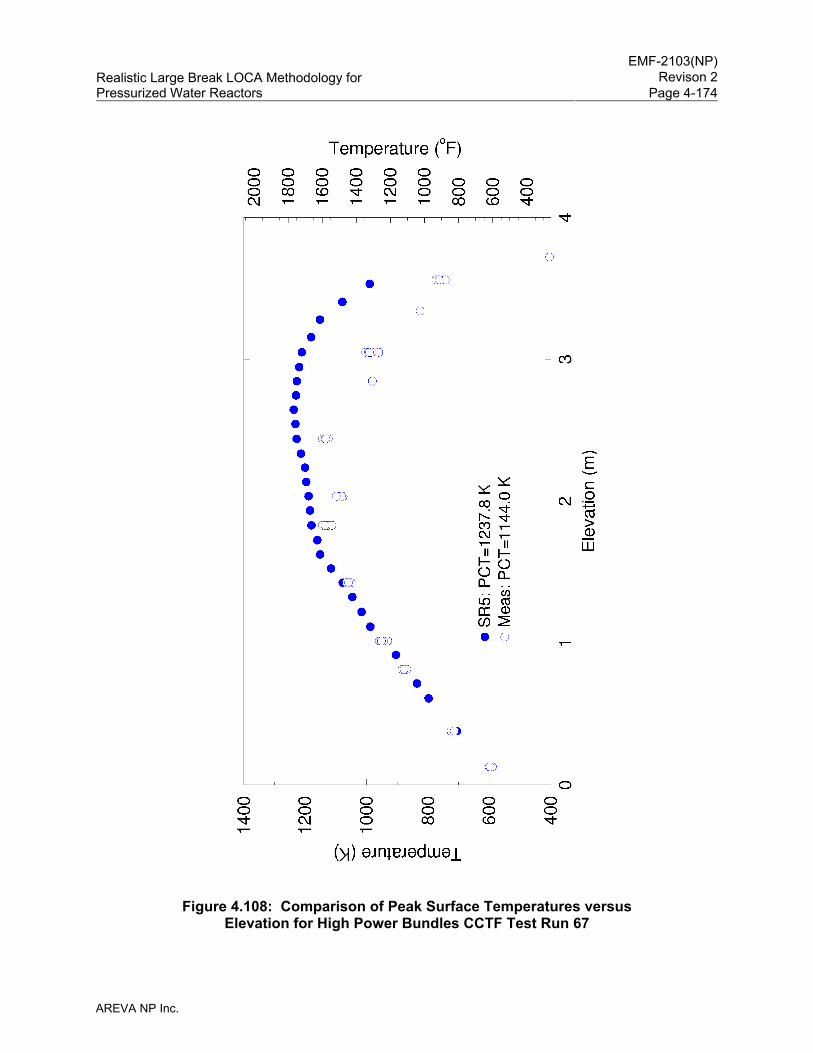
EMF-2103(NP)
Revison 2Realistic Large Break LOCA Methodology for Pressurized Water Reactors Page 4-174
AREVA NP Inc.
Figure 4.108: Comparison of Peak Surface Temperatures versus
Elevation for High Power Bundles CCTF Test Run 67
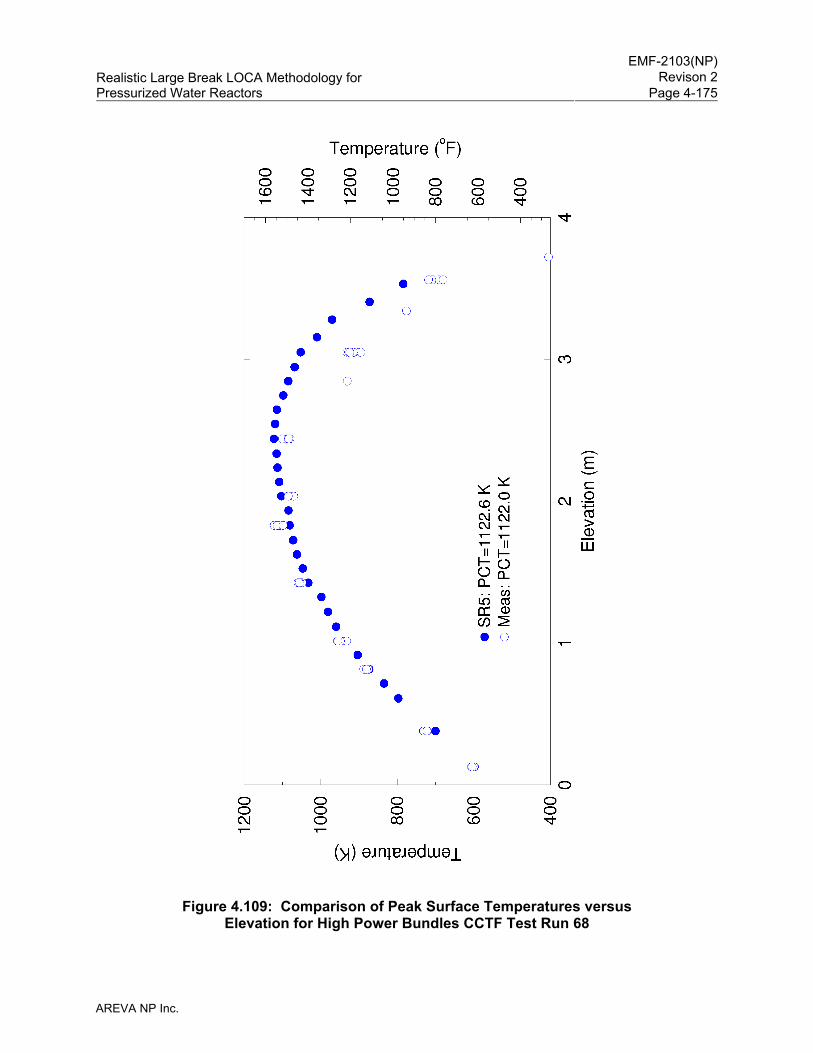
EMF-2103(NP)
Revison 2Realistic Large Break LOCA Methodology for Pressurized Water Reactors Page 4-175
AREVA NP Inc.
Figure 4.109: Comparison of Peak Surface Temperatures versus
Elevation for High Power Bundles CCTF Test Run 68
EMF-2103(NP)
Revison 2Realistic Large Break LOCA Methodology for Pressurized Water Reactors Page 4-176
AREVA NP Inc.
4.3.1.13 SCTF Tests
Two gravity feed and four forced feed SCTF CORE-II tests (from a series of 27 tests) were
chosen as a diverse sample of behaviors to evaluate the ability of S-RELAP5 to predict the core
and the pressure vessel thermal-hydraulic phenomena occurring during the reflooding phase of
a LBLOCA in a PWR. The study has two objectives: (1) to assess the capability of the code to
simulate both forced and gravity reflood transients and (2) to study the effect of radial
nodalization on reflood behavior.
The SCTF Core-II test series was undertaken under the 2D/3D program in part to obtain
information useful in assessing thermal-hydraulic models in best-estimate evaluation models.
The SCTF test facility was designed to investigate two-dimensional thermal-hydraulic behavior
in the pressure vessel during the reflood phase of a PWR LBLOCA. To meet this objective,
SCTF simulated a full-radius slab section of a PWR core with eight bundles arranged in a row.
The heating power for each bundle can be controlled independently.
In the SCTF test series, two test modes were adopted: gravity- and forced feed. In the gravity
feed tests, the valve between the lower downcomer and lower plenum was open so that there
was communication between the downcomer and the bundle region. In these tests, ECC was
initially injected into the lower plenum. After several seconds, ECC injection was switched to
the cold leg. In the force-feed tests, the valve between the lower downcomer and lower plenum
was closed and ECC was injected into the lower plenum only. Although the first mode is
considered to be a better simulation of integral reactor behavior, the boundary conditions at the
core inlet (mass flow rate and subcooling) are affected by changes in various parameters
(change of system pressure and core heating, etc.). Therefore, to investigate the effect of
parameter changes on the 2-D thermal-hydraulic behavior in the pressure vessel, the forced
feed test mode was adopted to obtain accurate boundary conditions at the core inlet.
Two "gravity reflood" tests (Tests S2-SH1 and S2-AC1) and four "forced reflood" tests
(Tests S2-10, S2-11, S2-17, and S2-18) were selected for the S-RELAP5 code assessment.
Test S2-SH1 is a gravity-reflood based test. During Test S2-SH1, the downcomer was not
blocked from the lower plenum (i.e., hydraulic communication existed between the lower plenum
and the downcomer). In the test, ECC was first injected into the lower plenum. After core
reflood started and the downcomer was almost full, ECC injection was switched to the intact
cold leg. Test S2-AC1 differs from Test S2-SH1 in the accumulator injection rate and duration.
EMF-2103(NP)
Revison 2Realistic Large Break LOCA Methodology for Pressurized Water Reactors Page 4-177
AREVA NP Inc.
Test S2-10 is a forced-reflood based test. In Test S2-10, ECC was injected into the lower
plenum only, with no hydraulic communication between the lower plenum and the downcomer.
The ECC injection rate was specified to match the core inlet flow rate achieved in gravity feed
Test S2-SH1. Test S2-11 differs from S2-10 in that a high accumulator flow rate was used to
match the core inlet flow rate achieved in gravity feed Test S2-AC1.
Tests S2-17 and S2-18 are also forced reflood tests with the primary difference between them
being in the radial power distribution. Test S2-17 has a flat power profile and Test S2-18 has a
steep power profile. The assessment of these two tests with their widely different radial power
distributions provides a good test for S-RELAP5.
Table 4.12 shows the test conditions for each of the tests examined. The six SCTF Core-II
reflood experiment tests were selected to assess forced reflood, gravity reflood, and the effect
of core radial nodalization. The assessment matrix is summarized as follows:
• Forced versus Gravity Reflood (Phase I): In this assessment phase, two sets of counterpart tests were chosen to study the differences between forced and gravity reflood. The first set consists of Tests S2-11 and S2-AC1 and the second set consists of Tests S2-10 and S2-SH1. A nominal nodalization of two bundles per core channel was modeled for this study.
• Effect of Radial Nodalization (Phase II): In this assessment phase, two tests were chosen to study the effect of radial nodalization on reflood behavior. These tests are S2-18 and S2-17. Both tests were simulated using the nominal axial nodalization. In addition, Test S2-18 was simulated using a fine-nodalization—one bundle per channel.
Since the primary purpose of the tests was to study the core and vessel thermal-hydraulic
phenomena, the RLBLOCA guidelines are used, wherever possible, to model the test vessel,
hot leg, the steam-water separator inlet plenum, and the cold leg piping from the ECC injection
to the downcomer. A simple modeling approach is used to model the remaining portion of the
test facility. The downcomer is represented by nine axial nodes, and the lower plenum is
divided into two nodes. The core region is modeled using a 25x4 TWODEE component. Axial
Nodes 1 through 24 model the active core, and Node 25 represents the distance between the
top of the active core and the upper core tie plate. As previously explained, for the base model
each radial segment consists of two fuel bundles. The axial nodes are divided such that each
grid spacer is at a node boundary. Bundle heat transfer multipliers, FILMBL and DFFBHTC are
EMF-2103(NP)
Revison 2Realistic Large Break LOCA Methodology for Pressurized Water Reactors Page 4-178
AREVA NP Inc.
set to [ ] Since all the heated rods are
represented by an average rod and the PCTs in all the tests simulated are below 1800 °F, the
rod-to-rod radiation model was not used. The cold leg condensation model (summarized in
Section 4.3.3.1.14 and described in detail in Section 5.2 of Reference 5) is used in the intact
cold leg. To achieve proper liquid entrainment out of the steam-water separator inlet plenum,
the following input modeling recommended from the UPTF Tests 10 and 29 benchmarks
(Section 4.3.1.11.3) was used.
To study the radial power distribution effect, Test S2-18 was also simulated using a fine
nodalization in the fuel bundle and upper plenum regions. In this model, an 8x25 TWODEE
component, with one test bundle per radial segment, is used to model the bundle region and an
8x3 TWODEE component is used to model the upper plenum.
The SCTF tests, S-RELAP5 input model, and simulation results are discussed in detail in
Section 3.10 of Reference 5. During the reflood phase of a LBLOCA, some of the important
reflood phenomena are: core heat transfer, multi-dimensional flow phenomena in the core
region, void generation/distribution, cold leg condensation, entrainment/ deentrainment in the
core, entrainment/deentrainment in the upper plenum and in the hot legs, and steam binding in
the steam generator. Except for steam binding effects in the steam generator, all other
EMF-2103(NP)
Revison 2Realistic Large Break LOCA Methodology for Pressurized Water Reactors Page 4-179
AREVA NP Inc.
important reflooding phenomena were observed in the SCTF tests and were calculated
reasonably well by S-RELAP5. Selected important parameters are discussed below.
• The calculated pressures in the primary system for all six tests agree reasonably well with the data as shown in Figure 4.110 through Figure 4.115.
• The calculated axial differential pressures in the core region for all six cases agree reasonably well with the data as shown in Figure 4.116 through Figure 4.121. These results indicate that, in all six cases, the code calculates proper liquid inventory in the bundle region.
• The calculated differential pressure between the upper plenum and downcomer for all six cases agree reasonably well with the data as shown in Figure 4.122 through Figure 4.127.
• The core and the upper plenum to downcomer ΔP results indicate S-RELAP5 calculates acceptable loop and downcomer oscillations in the SCTF tests. The oscillations in the later phase of the transients are primarily due to cold leg condensation. In some cases, S-RELAP5 calculated higher amplitude oscillations than in the tests during the early phase of the transient, which represents the accumulator injection period. This is primarily due to the atypical ECC injection modes in the tests. During the early phase of the transient, ECC, that simulates accumulator injection, is injected into the lower plenum in all the tests. In the gravity feed tests, the ECC injection is switched to the cold legs a few seconds after reflood initiation, when the downcomer level is nearly full and the system is reasonably stable. This approach was selected in SCTF and CCTF tests in order to minimize unstable conditions at the start of cold water injection into the stagnant primary system. In a PWR, the ECC injection into the cold legs starts while the system is blowing down and the transition from the refill to the reflood phase is a continuous process. Considering these differences, it can be concluded the code will calculate acceptable downcomer and loop oscillations during the reflood phase of a LBLOCA in the plant.
• SCTF hot leg geometry is atypical. The inside geometry is elliptical with height (major axis) close to the inside diameter of a typical 4-loop PWR. The width (minor axis) is narrow to preserve the volume flow area scaling. In the S-RELAP5 model, the oval geometry is approximated as a circular pipe while maintaining the same volume flow area. In SCTF, there is no active steam generator. A steam-water separator is used to simulate the primary side of the steam generator. The inlet chamber represents the inlet plenum of four scaled steam generators. The outlet chamber collects the liquid that is entrained from the inlet chamber. In the tests, the liquid level in the outlet chamber is measured. This collected
EMF-2103(NP)
Revison 2Realistic Large Break LOCA Methodology for Pressurized Water Reactors Page 4-180
AREVA NP Inc.
liquid represents the liquid that would be entrained in the tube region during a LBLOCA in a scaled PWR. The measured and S-RELAP5 calculated liquid levels for the six tests are shown in Figure 4.128 through Figure 4.133. Considering the atypical SCTF hot leg and the approximation used in modeling the hot leg, the S-RELAP5 calculated liquid entrainment to the steam-water separator is acceptable. These results are consistent with the core ΔP results.
• Table 4.13 and Table 4.14, and the cladding thermal responses at 1.905 meters shown in Figure 4.134 through Figure 4.139 indicate that the S-RELAP5 results, including the PCT and quench time for all the six cases, agree reasonably well with the data.
• The results for Test S2-18 shows the core thermal-hydraulic behavior is not sensitive to the radial nodalization.
In summary, the assessment results show that S-RELAP5 calculates the important reflood
phenomena occurring in all six SCTF tests with reasonable agreement to data. The
assessments demonstrate that S-RELAP5 will calculate acceptable thermal-hydraulic
phenomena during the reflood phase of a LBLOCA in a PWR including PCT, quench front
propagation, and loop and downcomer oscillations.

EMF-2103(NP)
Revison 2Realistic Large Break LOCA Methodology for Pressurized Water Reactors Page 4-181
AREVA NP Inc.
Table 4.12: Test Data for SCTF-II Tests Modeled

EMF-2103(NP)
Revison 2Realistic Large Break LOCA Methodology for Pressurized Water Reactors Page 4-182
AREVA NP Inc.
Table 4.12: Test Data for SCTF-II Tests Modeled (continued)
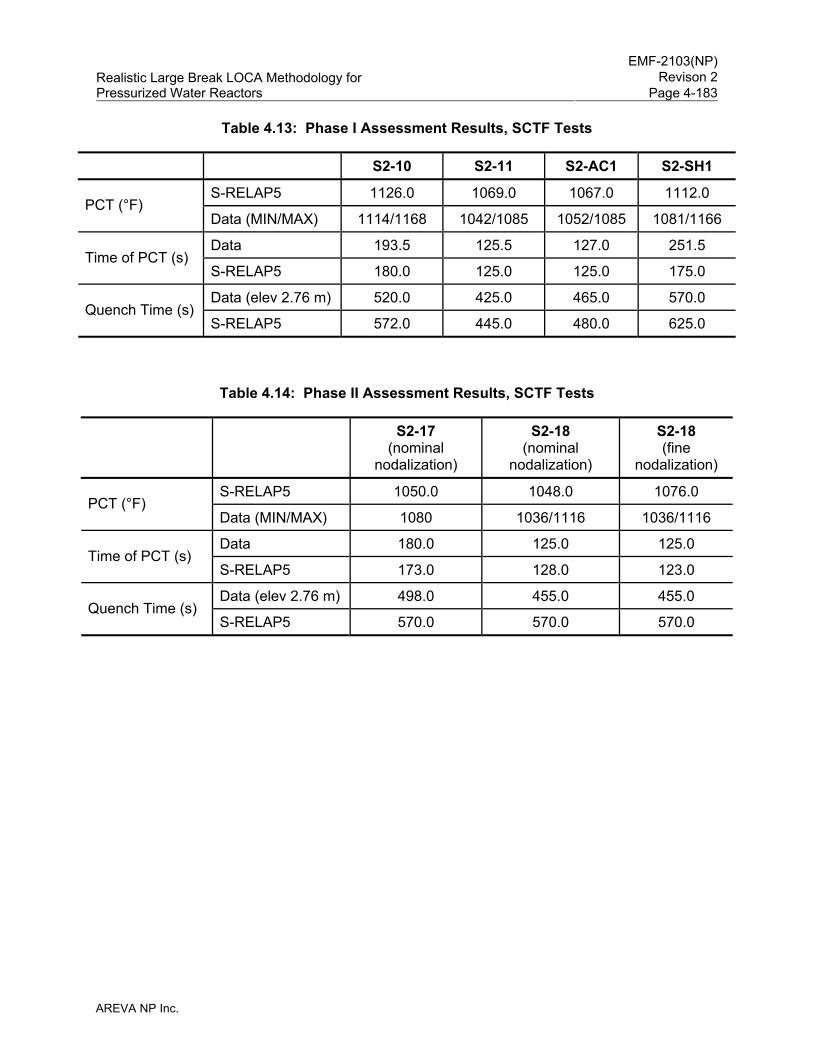
EMF-2103(NP)
Revison 2Realistic Large Break LOCA Methodology for Pressurized Water Reactors Page 4-183
AREVA NP Inc.
Table 4.13: Phase I Assessment Results, SCTF Tests
S2-10 S2-11 S2-AC1 S2-SH1
S-RELAP5 1126.0 1069.0 1067.0 1112.0 PCT (°F)
Data (MIN/MAX) 1114/1168 1042/1085 1052/1085 1081/1166
Data 193.5 125.5 127.0 251.5 Time of PCT (s)
S-RELAP5 180.0 125.0 125.0 175.0
Data (elev 2.76 m) 520.0 425.0 465.0 570.0 Quench Time (s)
S-RELAP5 572.0 445.0 480.0 625.0
Table 4.14: Phase II Assessment Results, SCTF Tests
S2-17 (nominal
nodalization)
S2-18 (nominal
nodalization)
S2-18 (fine
nodalization)
S-RELAP5 1050.0 1048.0 1076.0 PCT (°F)
Data (MIN/MAX) 1080 1036/1116 1036/1116
Data 180.0 125.0 125.0 Time of PCT (s)
S-RELAP5 173.0 128.0 123.0
Data (elev 2.76 m) 498.0 455.0 455.0 Quench Time (s)
S-RELAP5 570.0 570.0 570.0
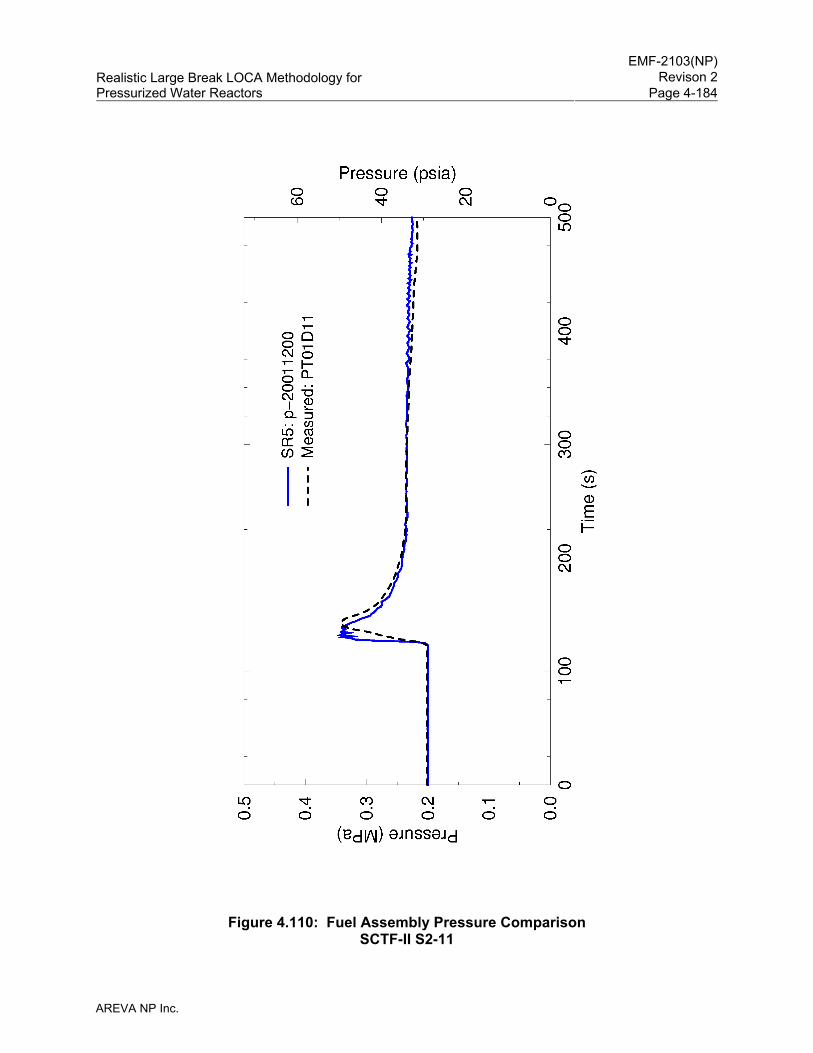
EMF-2103(NP)
Revison 2Realistic Large Break LOCA Methodology for Pressurized Water Reactors Page 4-184
AREVA NP Inc.
Figure 4.110: Fuel Assembly Pressure Comparison SCTF-II S2-11
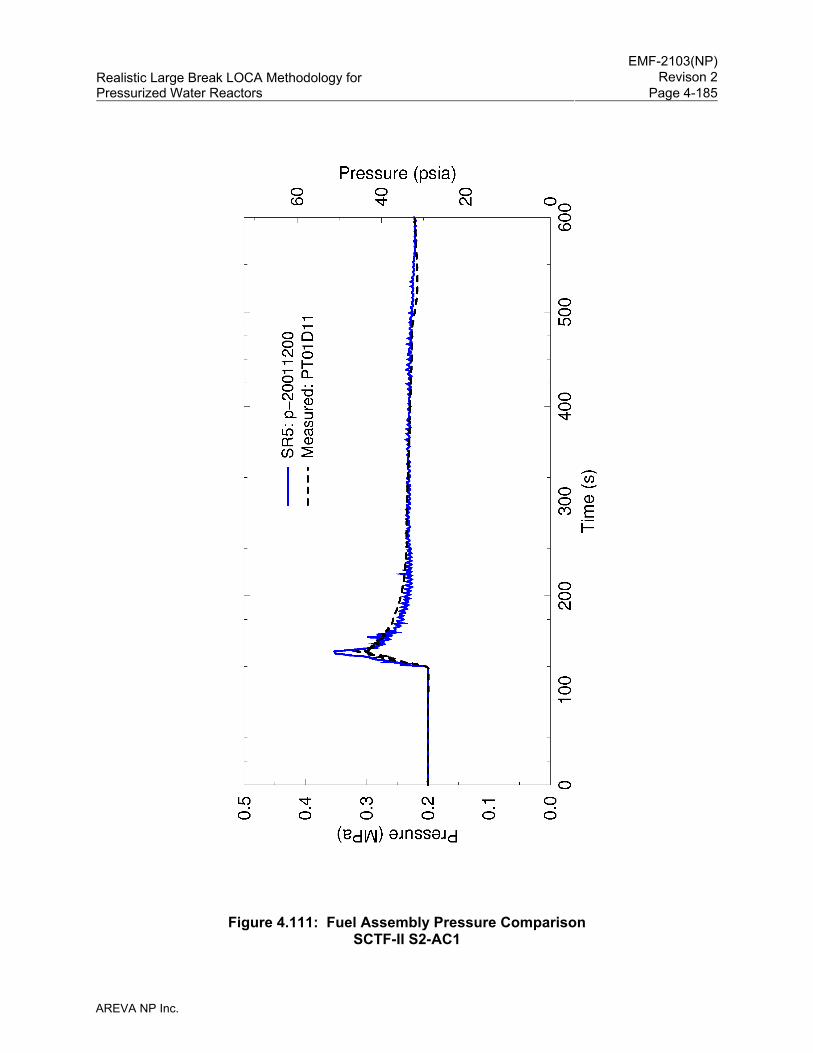
EMF-2103(NP)
Revison 2Realistic Large Break LOCA Methodology for Pressurized Water Reactors Page 4-185
AREVA NP Inc.
Figure 4.111: Fuel Assembly Pressure Comparison SCTF-II S2-AC1
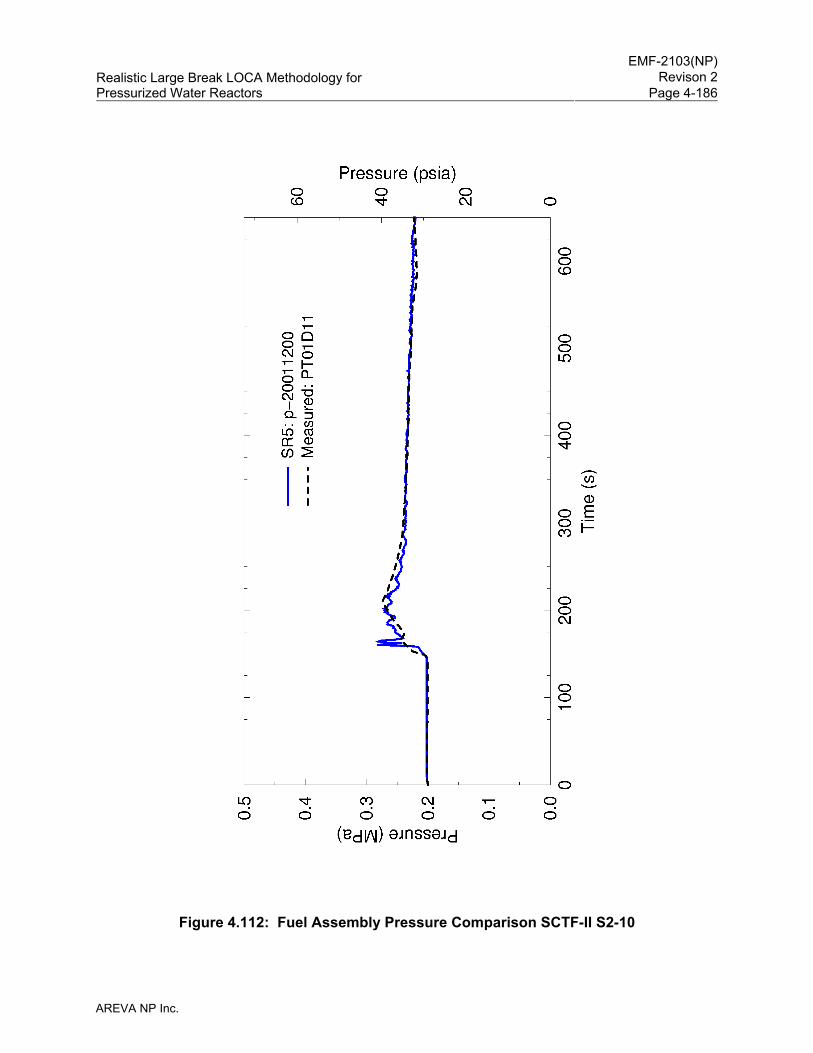
EMF-2103(NP)
Revison 2Realistic Large Break LOCA Methodology for Pressurized Water Reactors Page 4-186
AREVA NP Inc.
Figure 4.112: Fuel Assembly Pressure Comparison SCTF-II S2-10
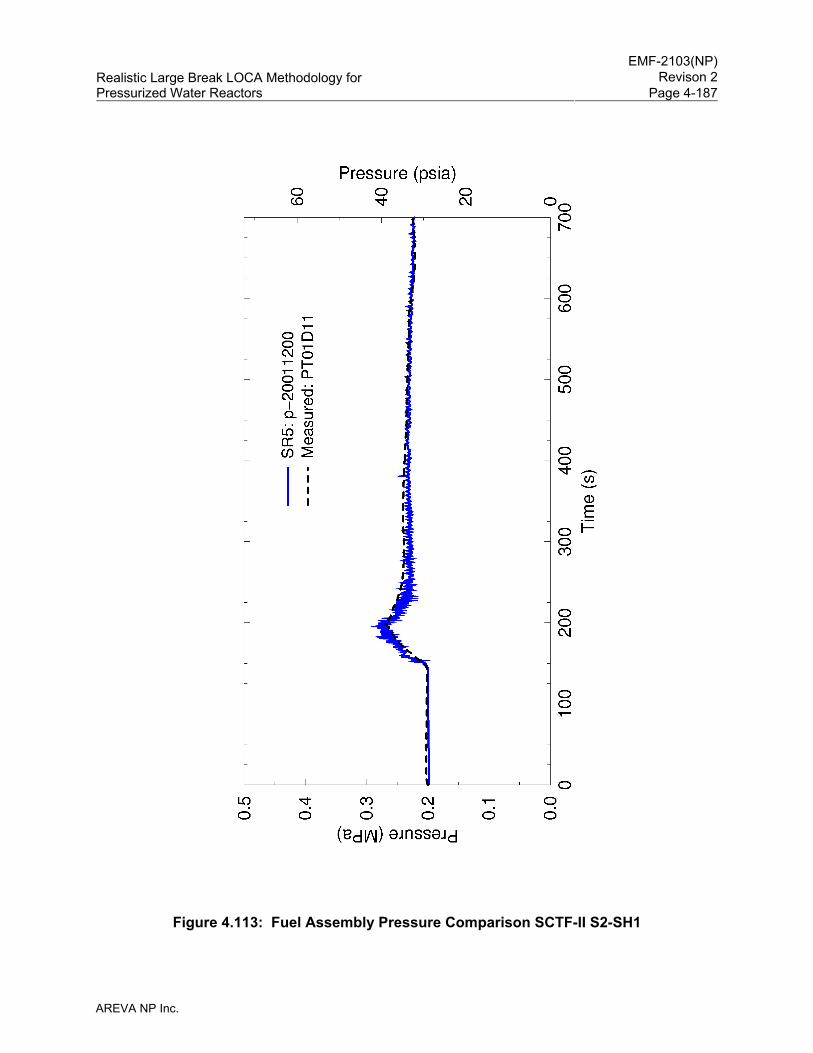
EMF-2103(NP)
Revison 2Realistic Large Break LOCA Methodology for Pressurized Water Reactors Page 4-187
AREVA NP Inc.
Figure 4.113: Fuel Assembly Pressure Comparison SCTF-II S2-SH1
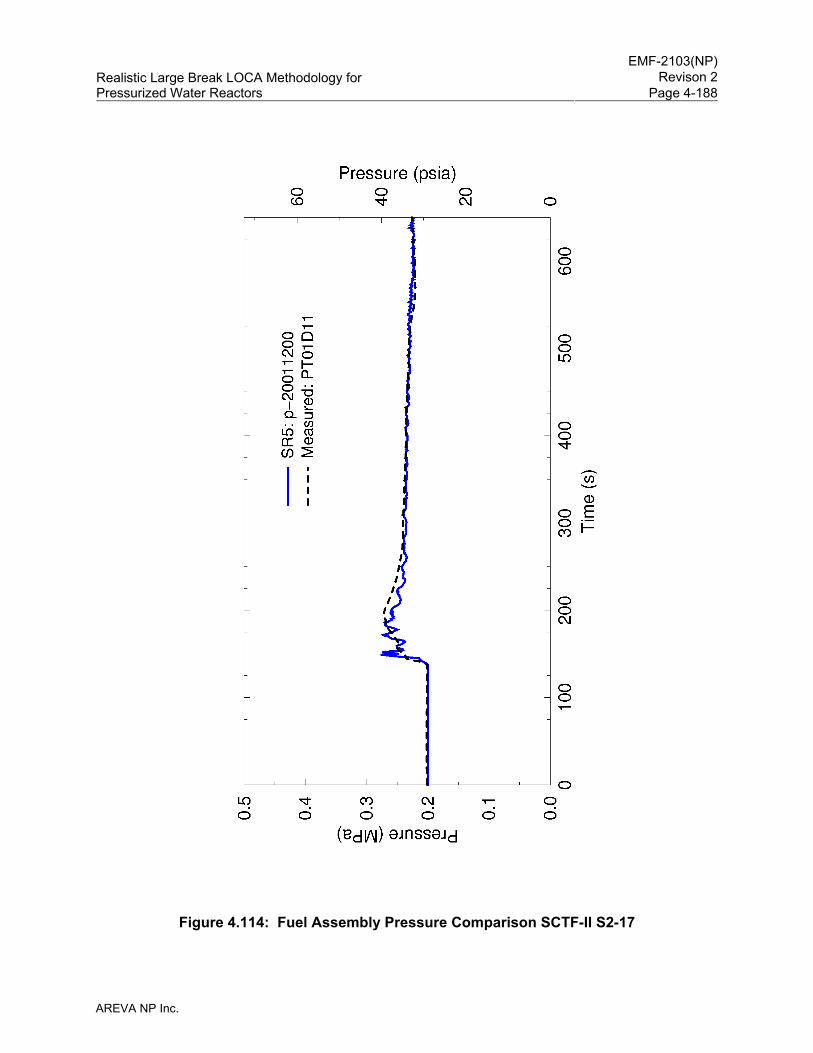
EMF-2103(NP)
Revison 2Realistic Large Break LOCA Methodology for Pressurized Water Reactors Page 4-188
AREVA NP Inc.
Figure 4.114: Fuel Assembly Pressure Comparison SCTF-II S2-17
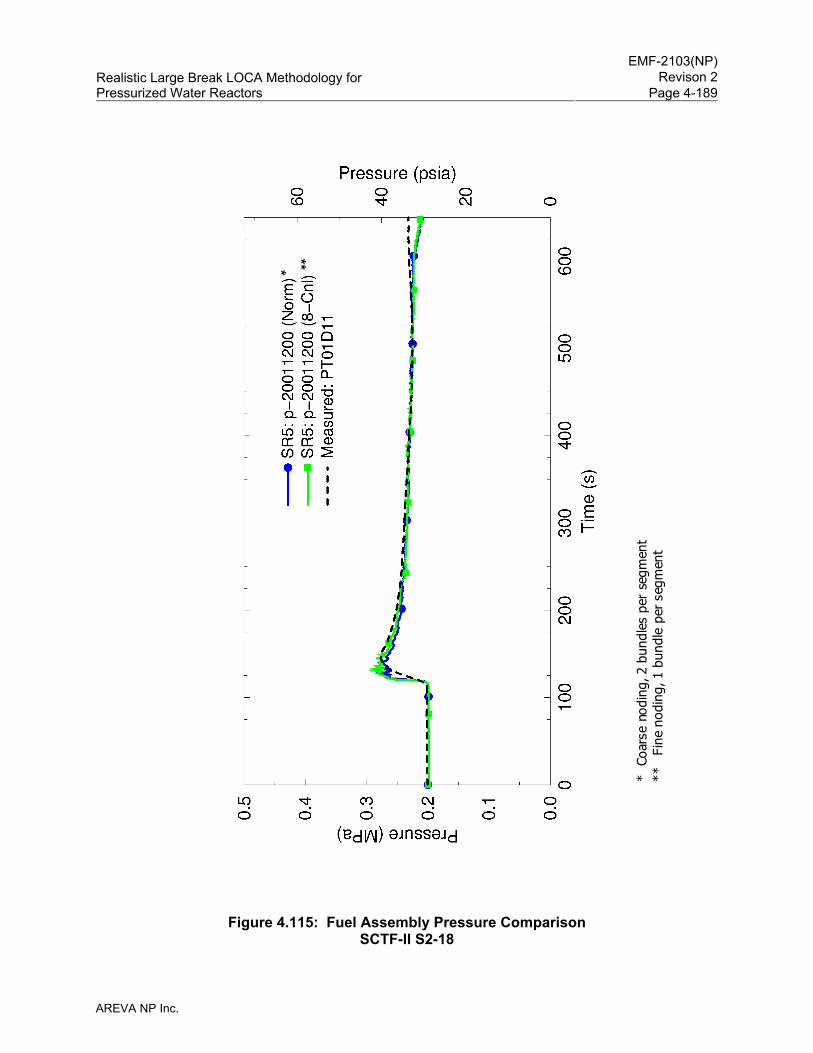
EMF-2103(NP)
Revison 2Realistic Large Break LOCA Methodology for Pressurized Water Reactors Page 4-189
AREVA NP Inc.
Figure 4.115: Fuel Assembly Pressure Comparison SCTF-II S2-18
* **
* C
oars
e no
ding
, 2 b
undl
es p
er s
egm
ent
**
Fin
e no
ding
, 1 b
undl
e pe
r se
gmen
t
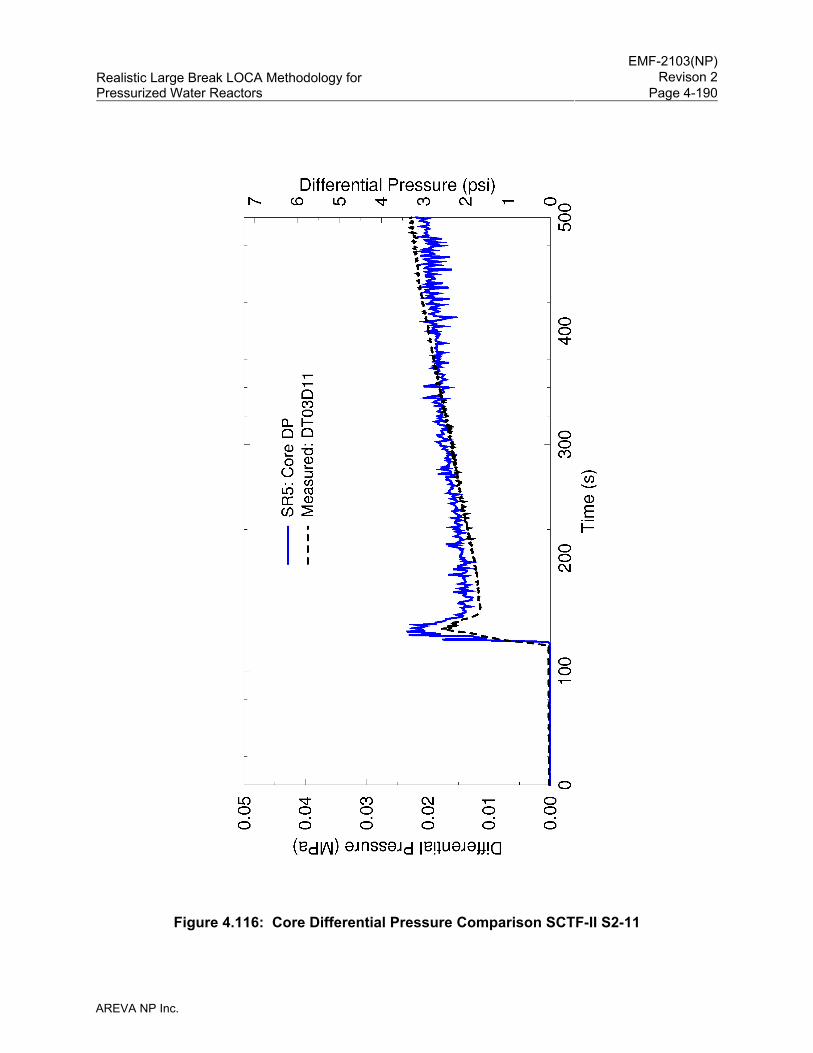
EMF-2103(NP)
Revison 2Realistic Large Break LOCA Methodology for Pressurized Water Reactors Page 4-190
AREVA NP Inc.
Figure 4.116: Core Differential Pressure Comparison SCTF-II S2-11
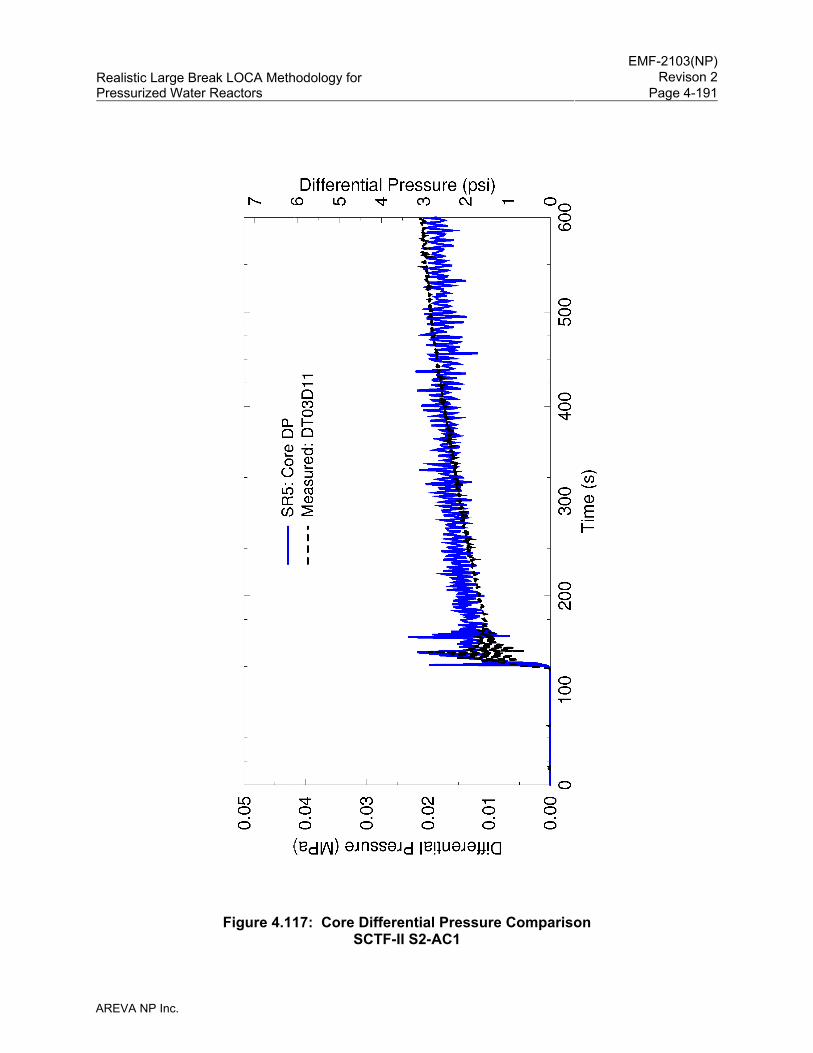
EMF-2103(NP)
Revison 2Realistic Large Break LOCA Methodology for Pressurized Water Reactors Page 4-191
AREVA NP Inc.
Figure 4.117: Core Differential Pressure Comparison SCTF-II S2-AC1
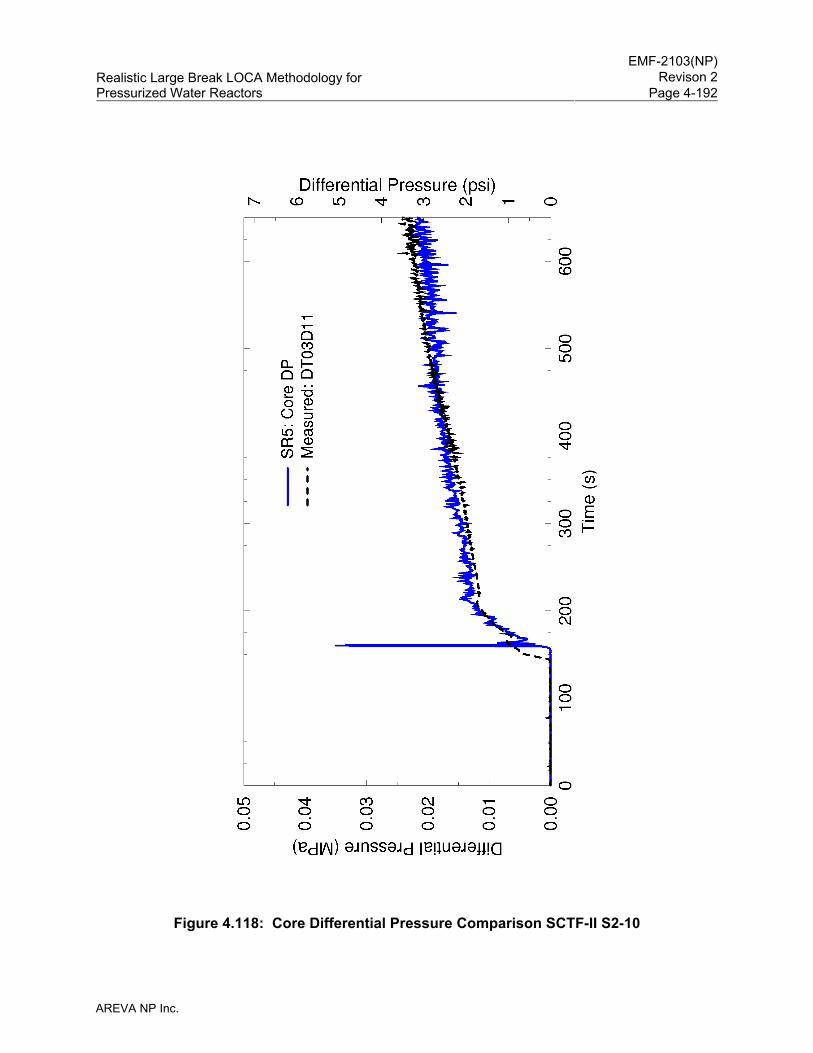
EMF-2103(NP)
Revison 2Realistic Large Break LOCA Methodology for Pressurized Water Reactors Page 4-192
AREVA NP Inc.
Figure 4.118: Core Differential Pressure Comparison SCTF-II S2-10
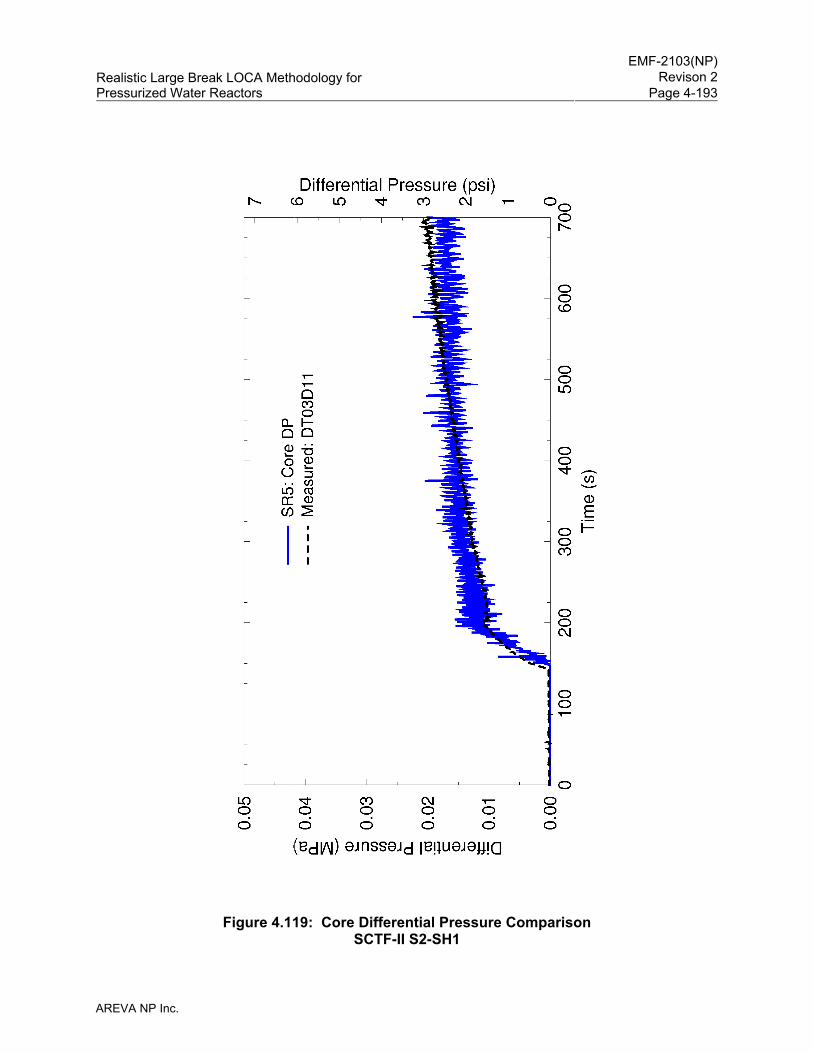
EMF-2103(NP)
Revison 2Realistic Large Break LOCA Methodology for Pressurized Water Reactors Page 4-193
AREVA NP Inc.
Figure 4.119: Core Differential Pressure Comparison SCTF-II S2-SH1
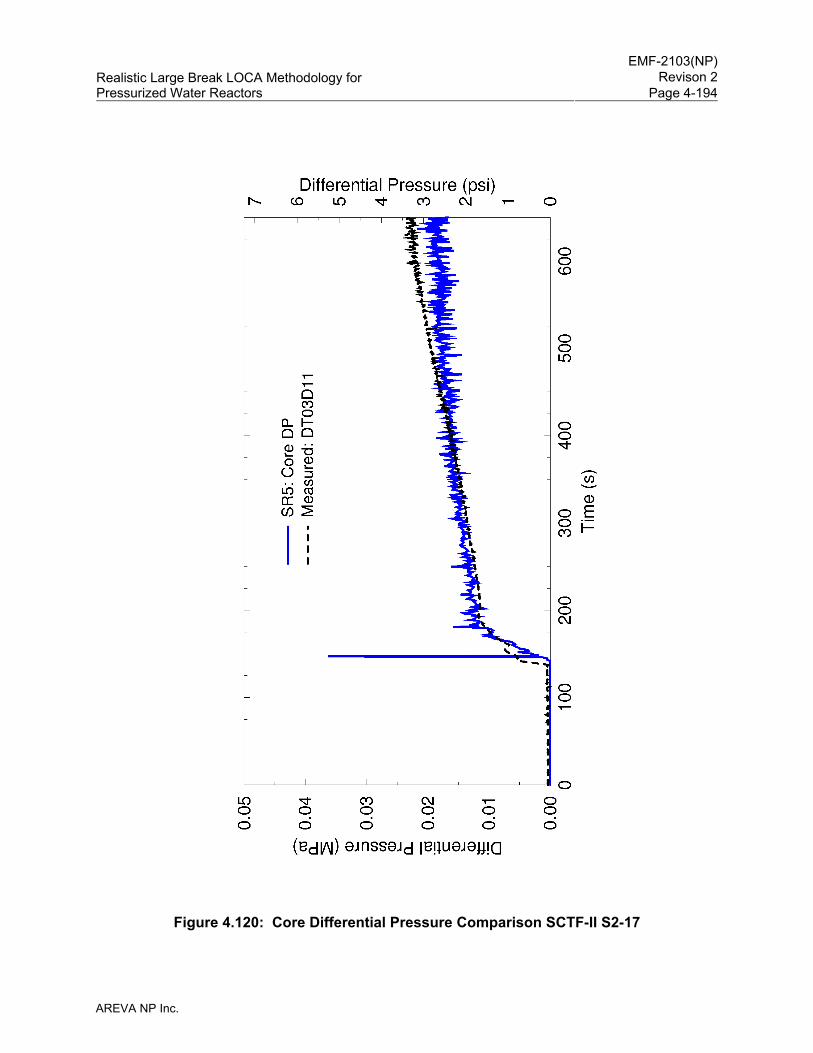
EMF-2103(NP)
Revison 2Realistic Large Break LOCA Methodology for Pressurized Water Reactors Page 4-194
AREVA NP Inc.
Figure 4.120: Core Differential Pressure Comparison SCTF-II S2-17
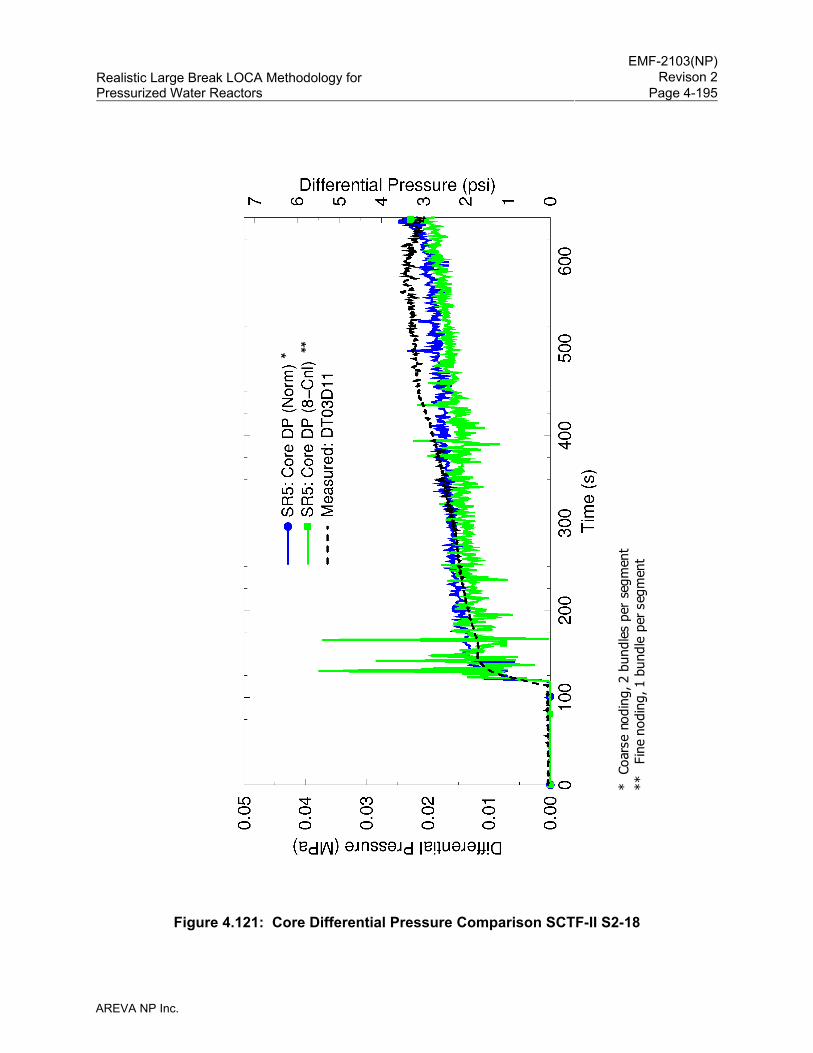
EMF-2103(NP)
Revison 2Realistic Large Break LOCA Methodology for Pressurized Water Reactors Page 4-195
AREVA NP Inc.
Figure 4.121: Core Differential Pressure Comparison SCTF-II S2-18
* **
* C
oars
e no
ding
, 2 b
undl
es p
er s
egm
ent
**
Fin
e no
ding
, 1 b
undl
e pe
r se
gmen
t
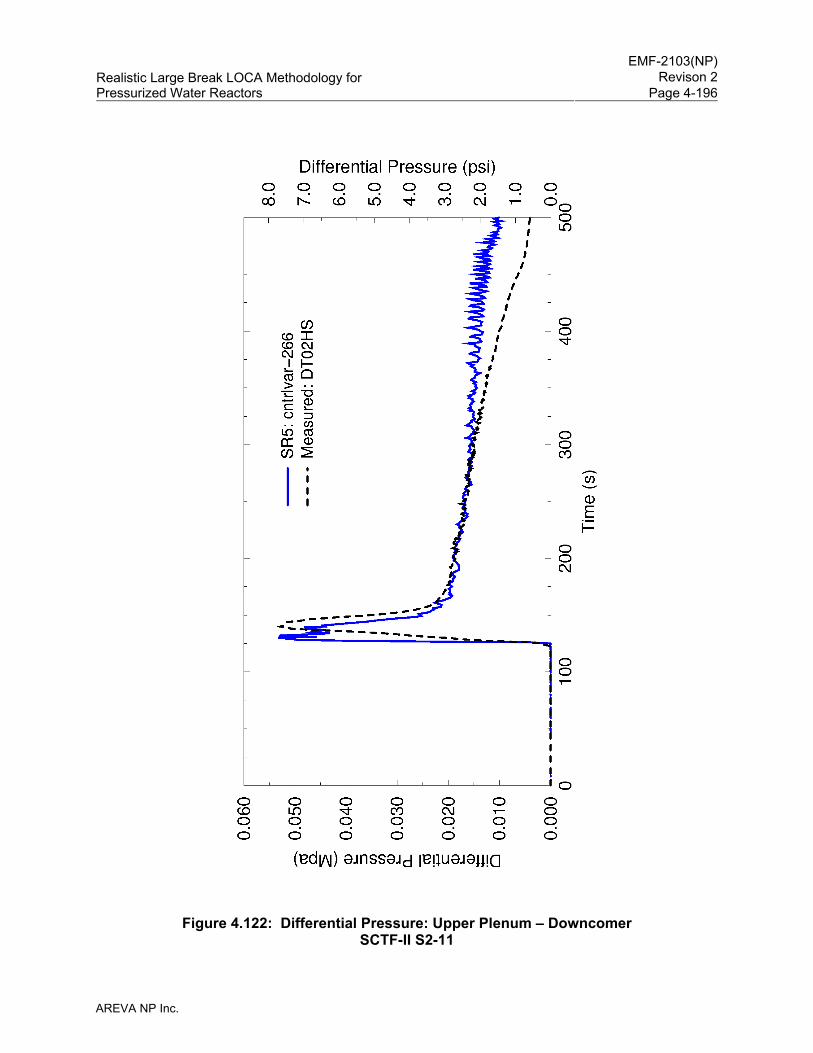
EMF-2103(NP)
Revison 2Realistic Large Break LOCA Methodology for Pressurized Water Reactors Page 4-196
AREVA NP Inc.
Figure 4.122: Differential Pressure: Upper Plenum – Downcomer SCTF-II S2-11
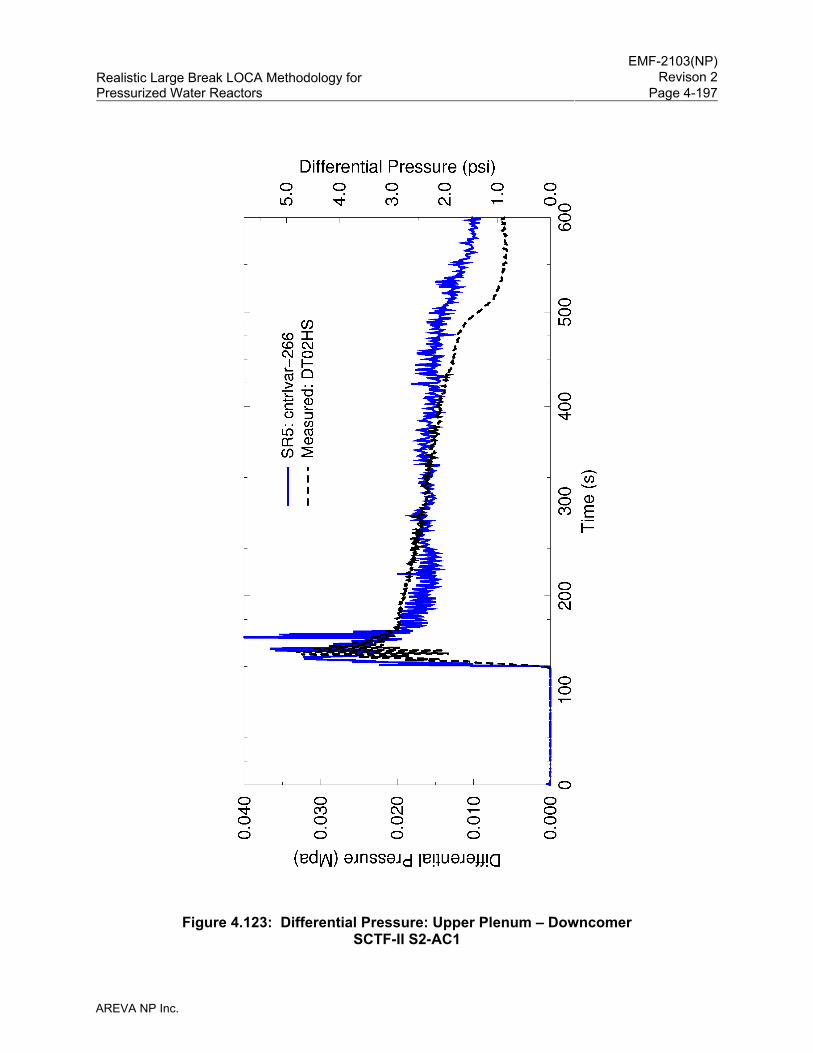
EMF-2103(NP)
Revison 2Realistic Large Break LOCA Methodology for Pressurized Water Reactors Page 4-197
AREVA NP Inc.
Figure 4.123: Differential Pressure: Upper Plenum – Downcomer SCTF-II S2-AC1
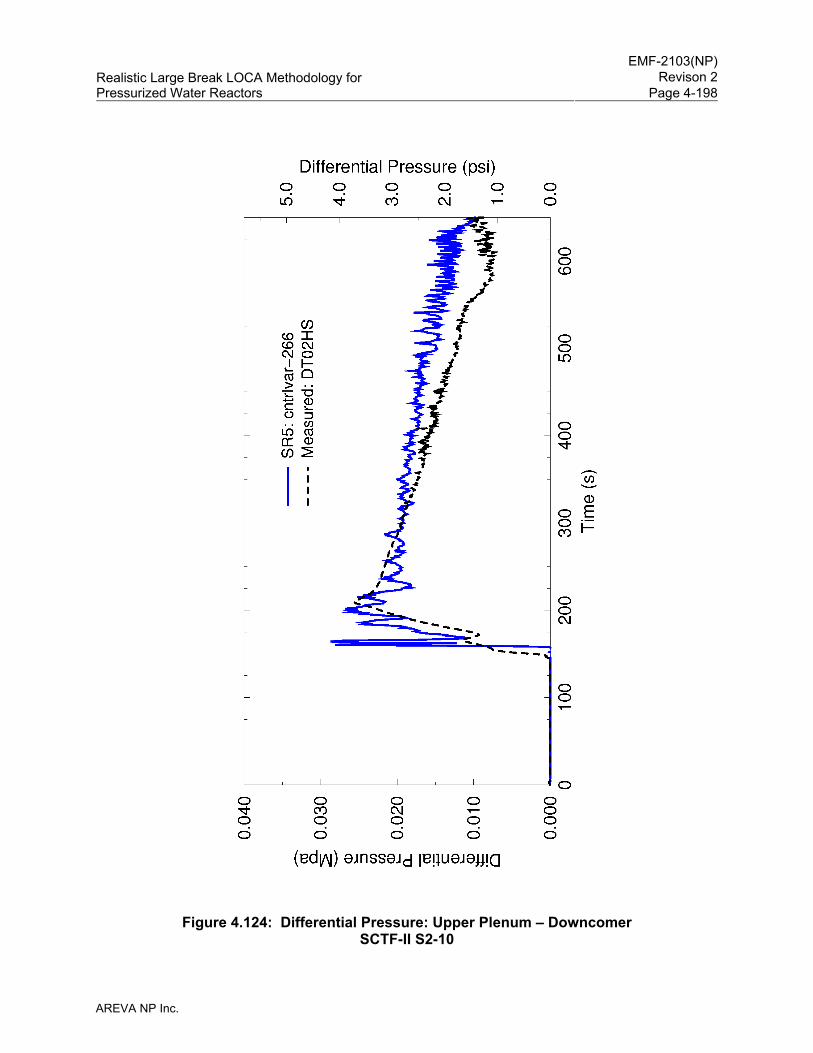
EMF-2103(NP)
Revison 2Realistic Large Break LOCA Methodology for Pressurized Water Reactors Page 4-198
AREVA NP Inc.
Figure 4.124: Differential Pressure: Upper Plenum – Downcomer SCTF-II S2-10
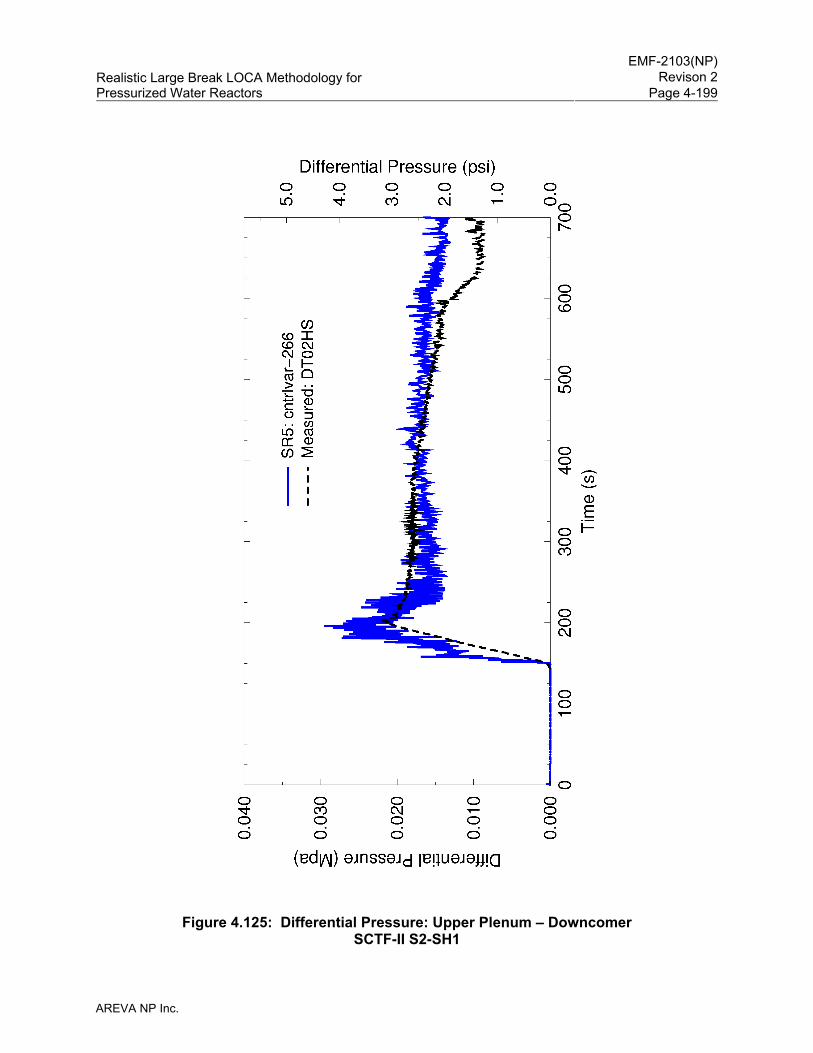
EMF-2103(NP)
Revison 2Realistic Large Break LOCA Methodology for Pressurized Water Reactors Page 4-199
AREVA NP Inc.
Figure 4.125: Differential Pressure: Upper Plenum – Downcomer SCTF-II S2-SH1
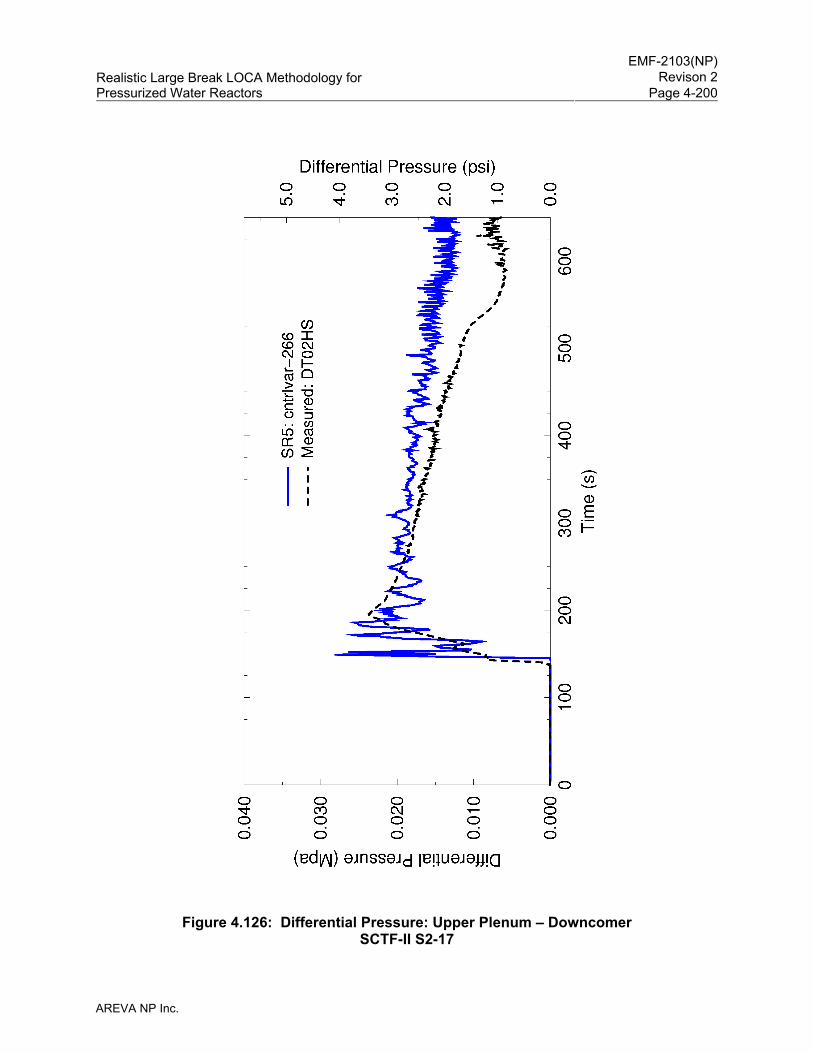
EMF-2103(NP)
Revison 2Realistic Large Break LOCA Methodology for Pressurized Water Reactors Page 4-200
AREVA NP Inc.
Figure 4.126: Differential Pressure: Upper Plenum – Downcomer SCTF-II S2-17
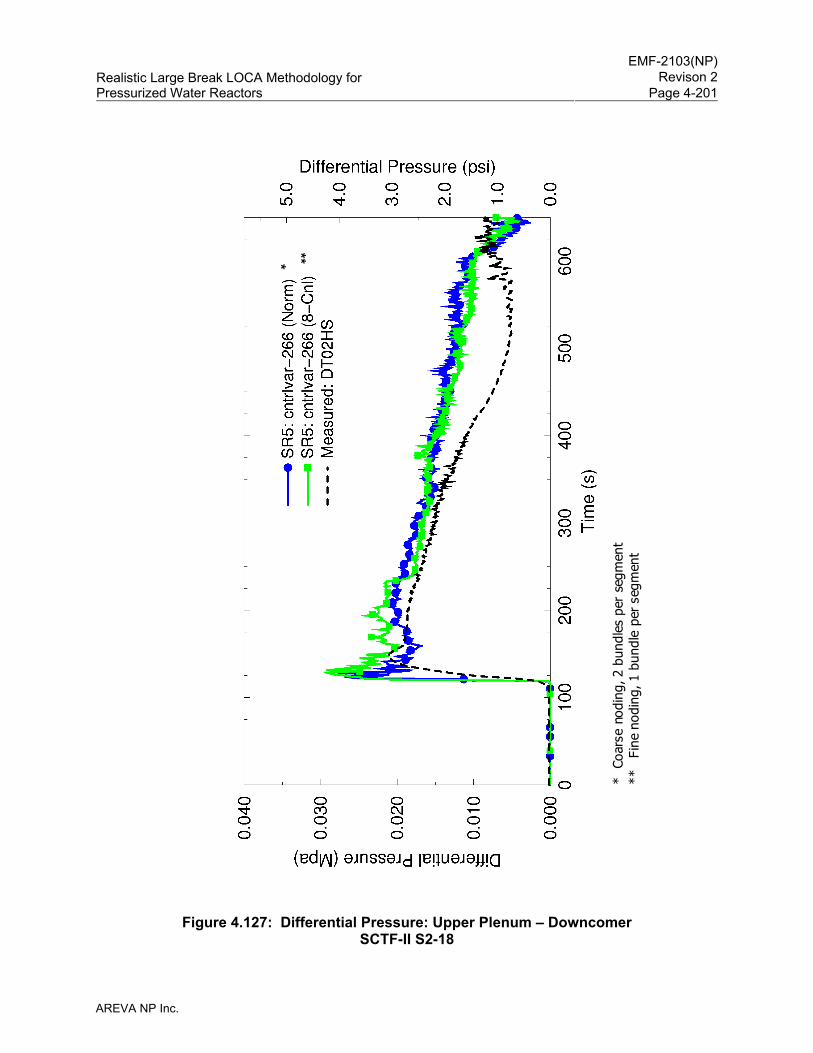
EMF-2103(NP)
Revison 2Realistic Large Break LOCA Methodology for Pressurized Water Reactors Page 4-201
AREVA NP Inc.
Figure 4.127: Differential Pressure: Upper Plenum – Downcomer SCTF-II S2-18
* **
* C
oars
e no
ding
, 2 b
undl
es p
er s
egm
ent
**
Fin
e no
ding
, 1 b
undl
e pe
r se
gmen
t
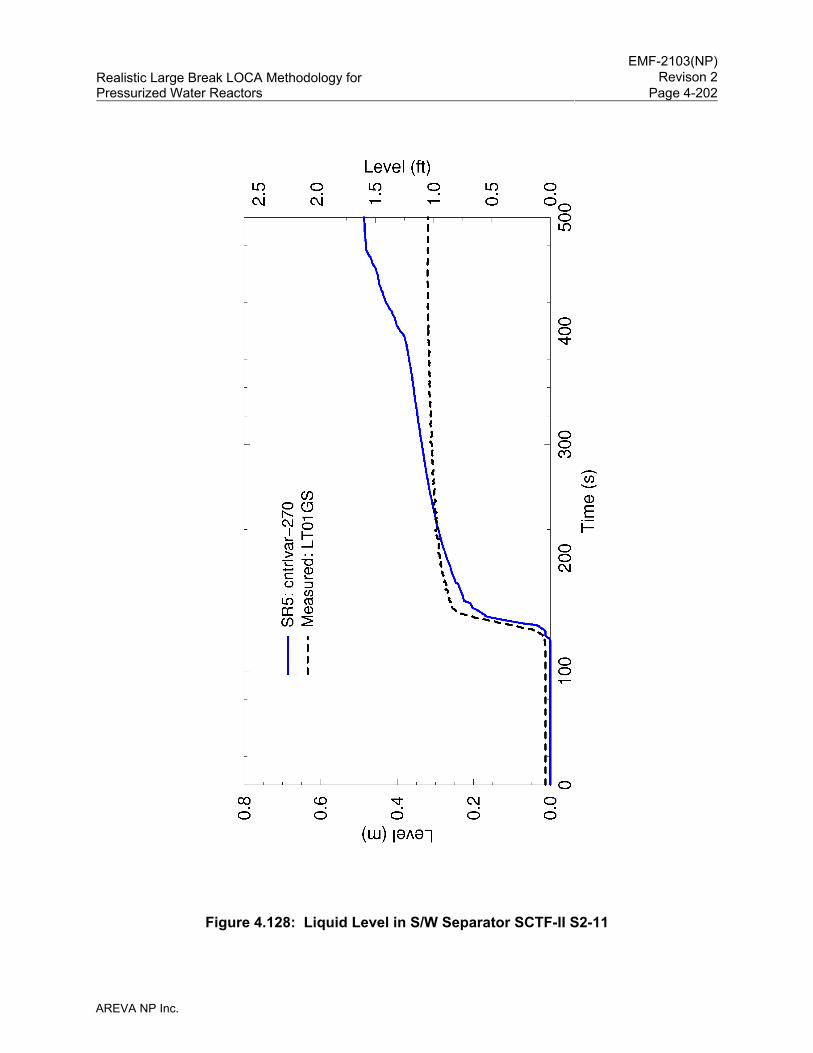
EMF-2103(NP)
Revison 2Realistic Large Break LOCA Methodology for Pressurized Water Reactors Page 4-202
AREVA NP Inc.
Figure 4.128: Liquid Level in S/W Separator SCTF-II S2-11
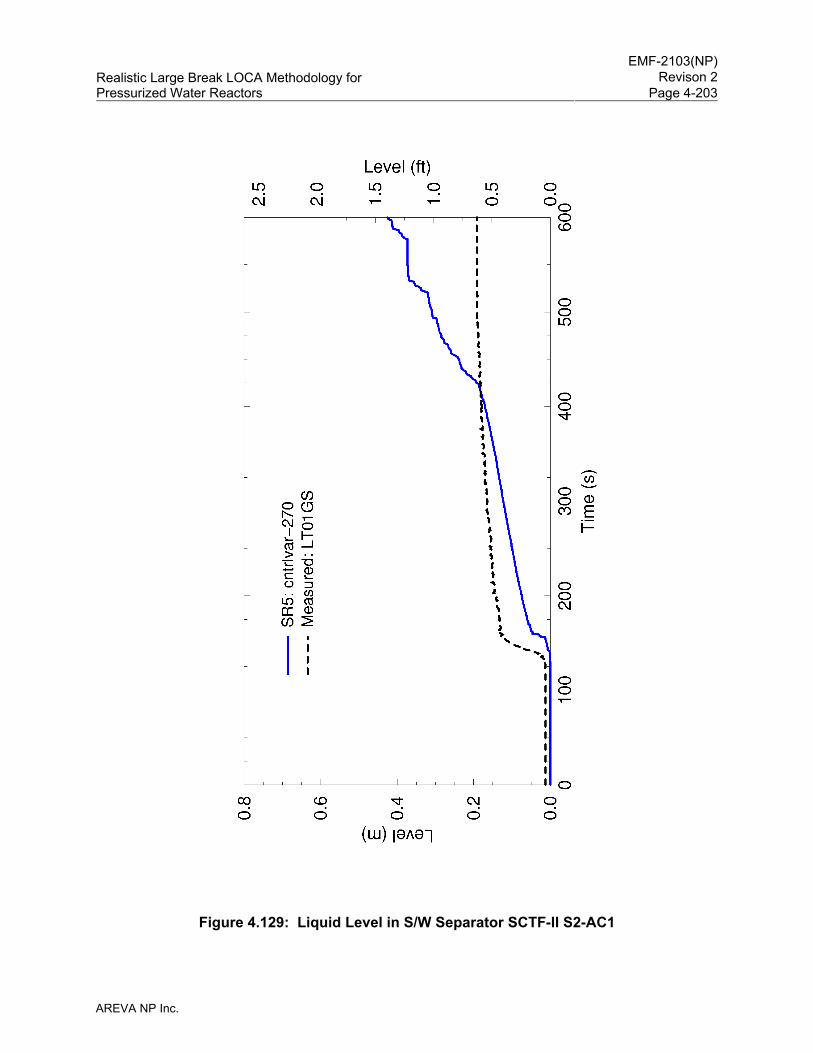
EMF-2103(NP)
Revison 2Realistic Large Break LOCA Methodology for Pressurized Water Reactors Page 4-203
AREVA NP Inc.
Figure 4.129: Liquid Level in S/W Separator SCTF-II S2-AC1
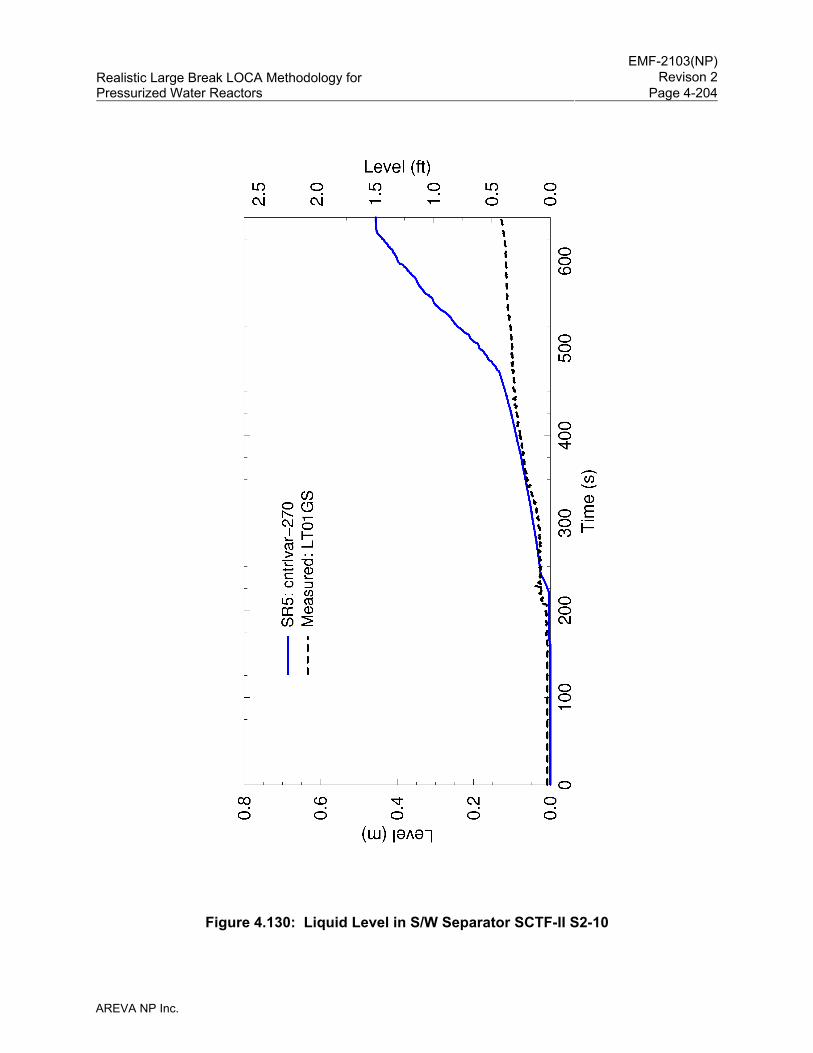
EMF-2103(NP)
Revison 2Realistic Large Break LOCA Methodology for Pressurized Water Reactors Page 4-204
AREVA NP Inc.
Figure 4.130: Liquid Level in S/W Separator SCTF-II S2-10
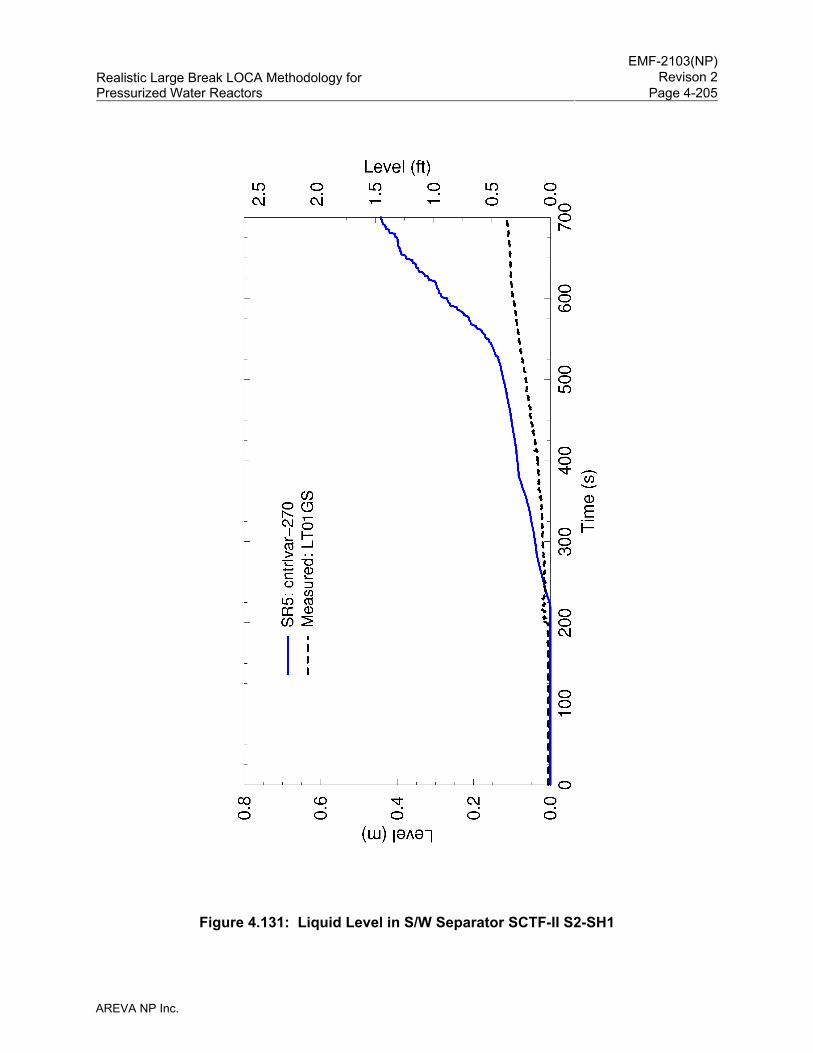
EMF-2103(NP)
Revison 2Realistic Large Break LOCA Methodology for Pressurized Water Reactors Page 4-205
AREVA NP Inc.
Figure 4.131: Liquid Level in S/W Separator SCTF-II S2-SH1

EMF-2103(NP)
Revison 2Realistic Large Break LOCA Methodology for Pressurized Water Reactors Page 4-206
AREVA NP Inc.
Figure 4.132: Liquid Level in S/W Separator SCTF-II S2-17
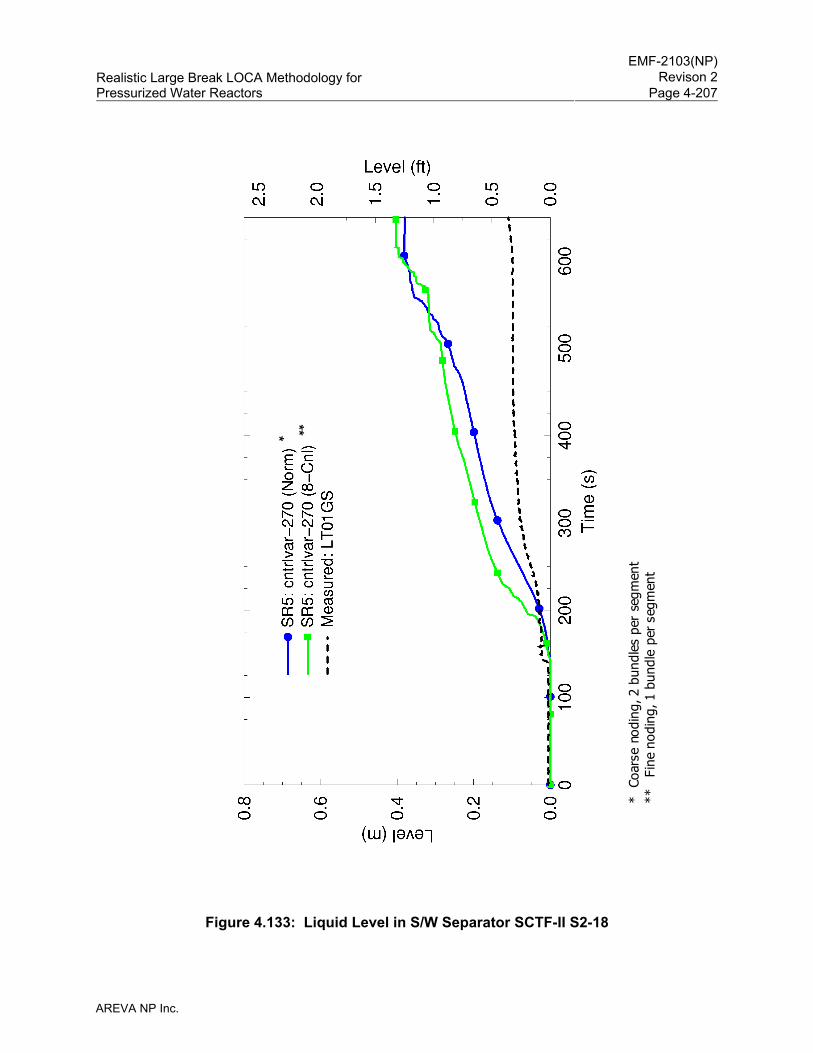
EMF-2103(NP)
Revison 2Realistic Large Break LOCA Methodology for Pressurized Water Reactors Page 4-207
AREVA NP Inc.
Figure 4.133: Liquid Level in S/W Separator SCTF-II S2-18
* **
* C
oars
e no
ding
, 2 b
undl
es p
er s
egm
ent
**
Fin
e no
ding
, 1 b
undl
e pe
r se
gmen
t
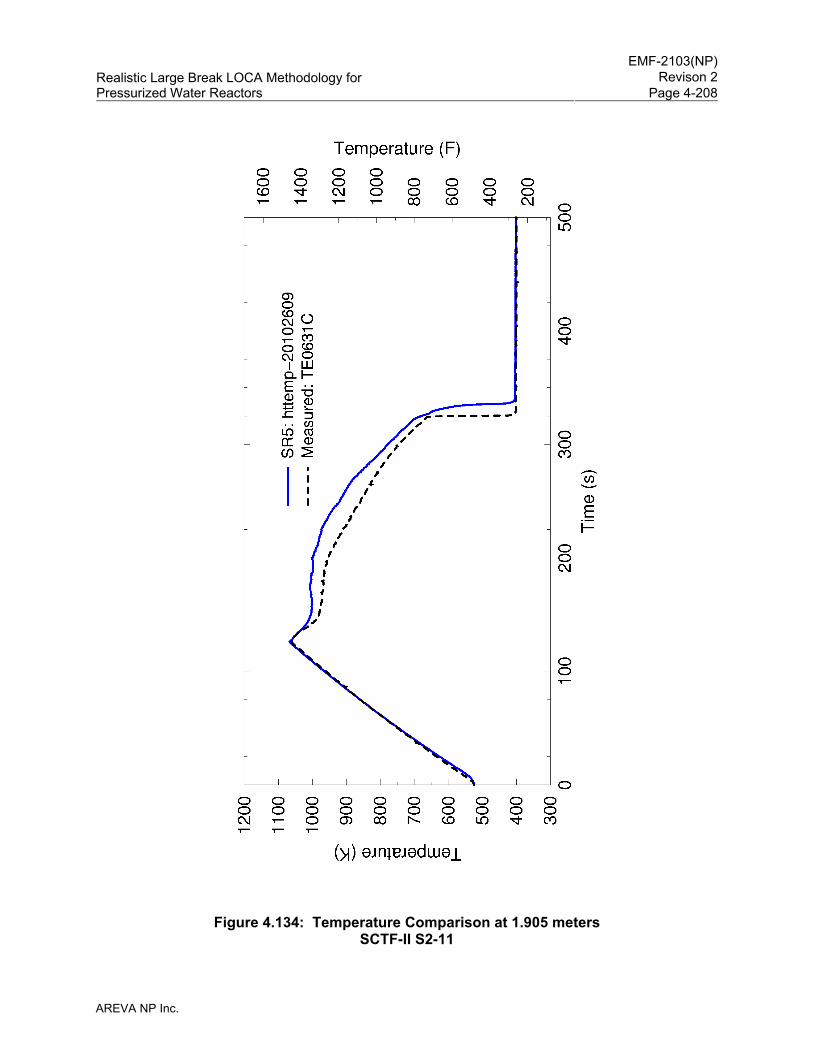
EMF-2103(NP)
Revison 2Realistic Large Break LOCA Methodology for Pressurized Water Reactors Page 4-208
AREVA NP Inc.
Figure 4.134: Temperature Comparison at 1.905 meters SCTF-II S2-11
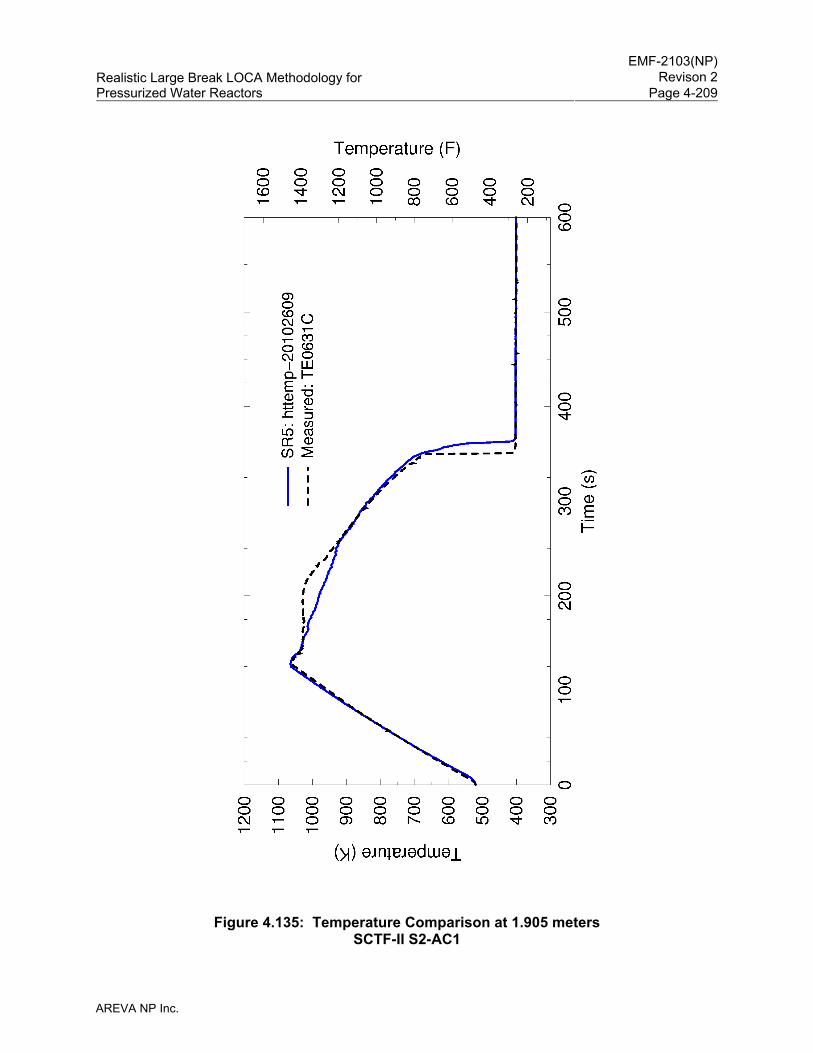
EMF-2103(NP)
Revison 2Realistic Large Break LOCA Methodology for Pressurized Water Reactors Page 4-209
AREVA NP Inc.
Figure 4.135: Temperature Comparison at 1.905 meters SCTF-II S2-AC1
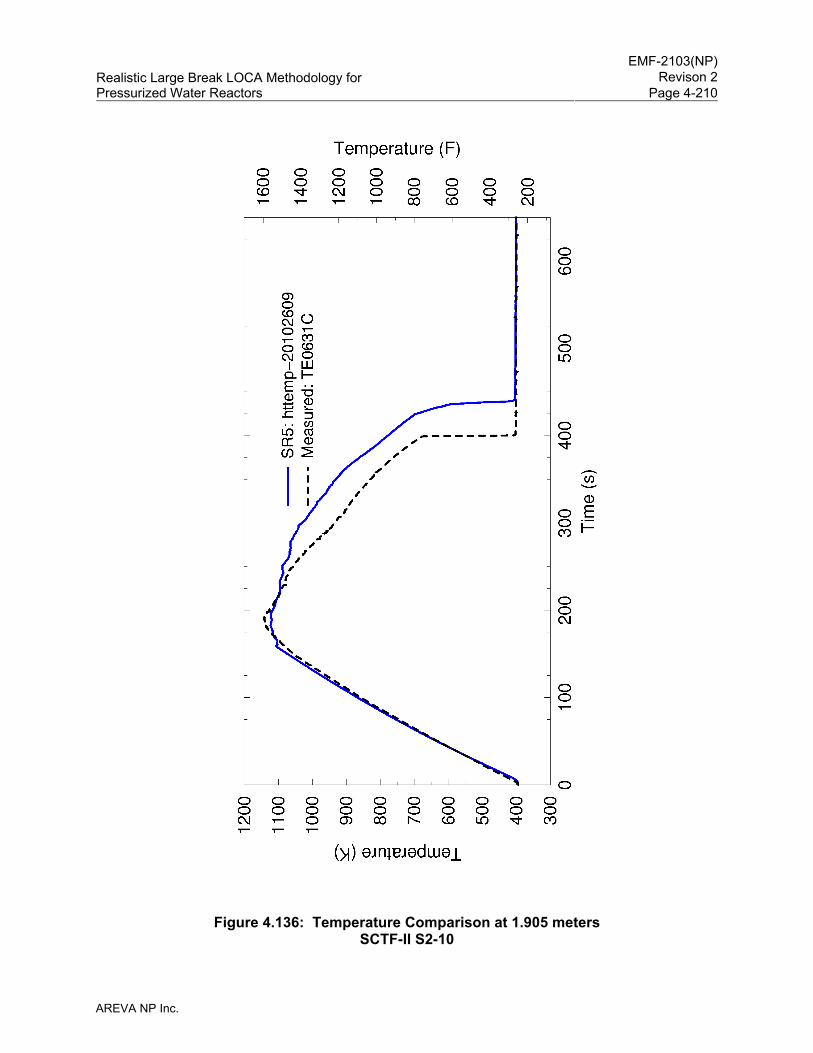
EMF-2103(NP)
Revison 2Realistic Large Break LOCA Methodology for Pressurized Water Reactors Page 4-210
AREVA NP Inc.
Figure 4.136: Temperature Comparison at 1.905 meters SCTF-II S2-10
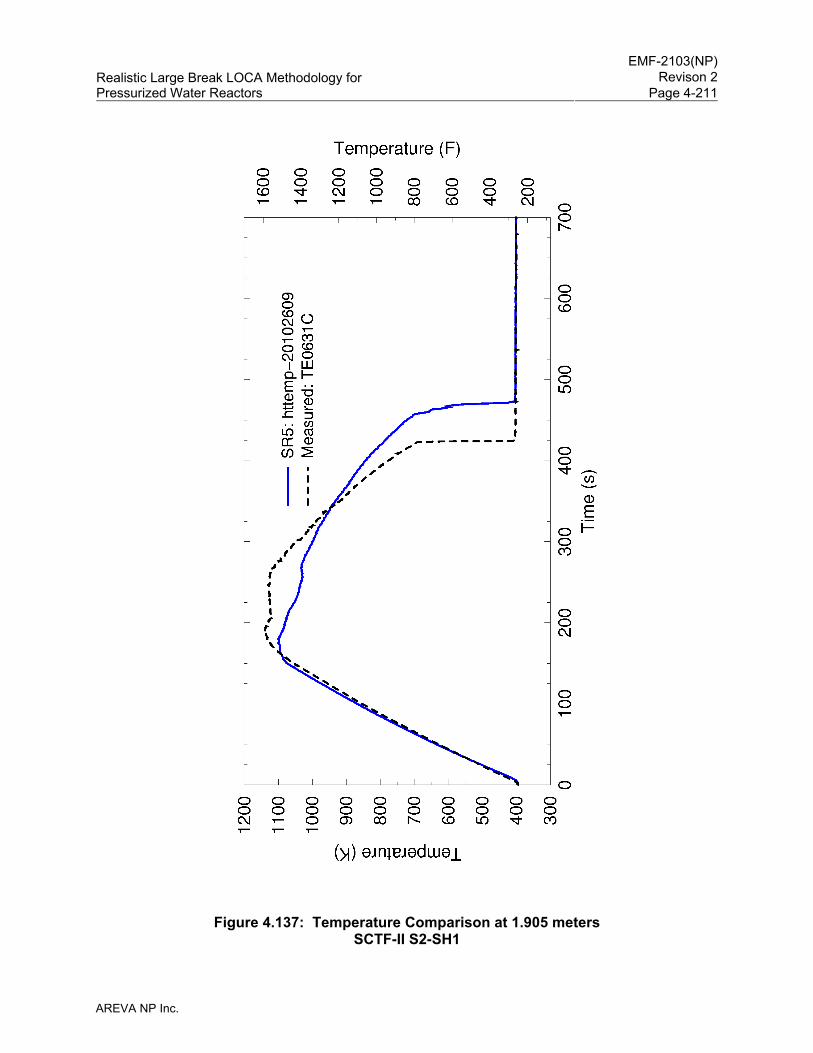
EMF-2103(NP)
Revison 2Realistic Large Break LOCA Methodology for Pressurized Water Reactors Page 4-211
AREVA NP Inc.
Figure 4.137: Temperature Comparison at 1.905 meters SCTF-II S2-SH1
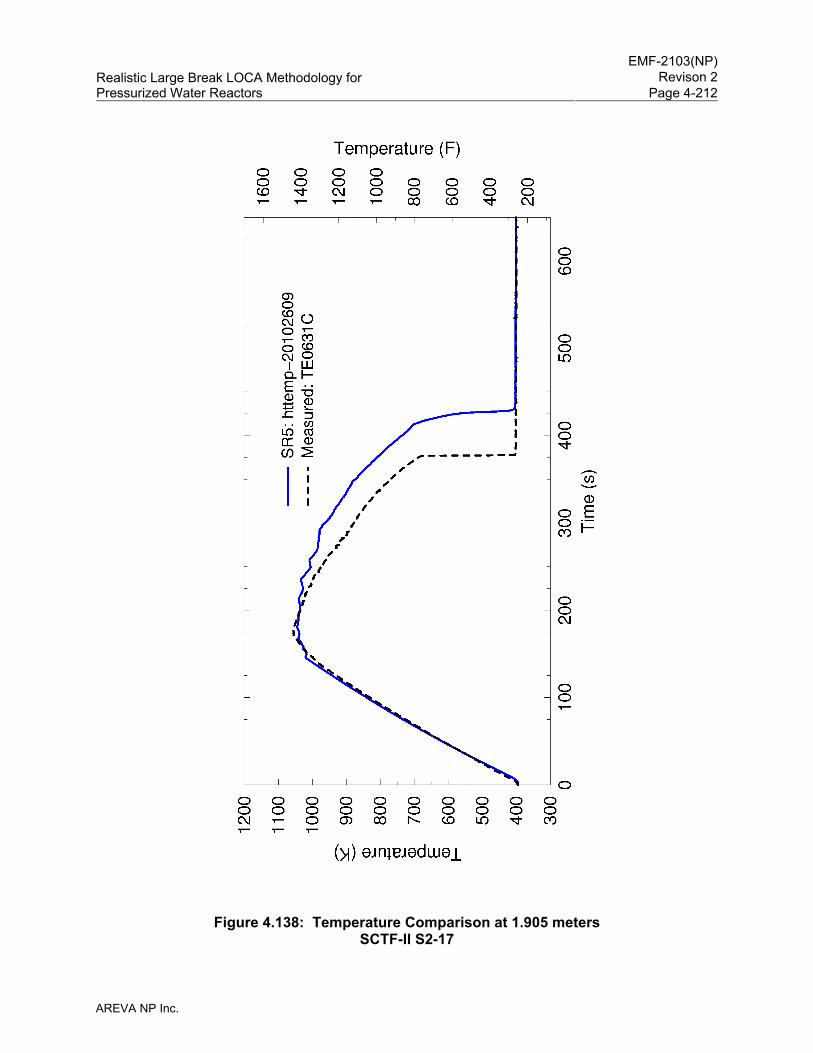
EMF-2103(NP)
Revison 2Realistic Large Break LOCA Methodology for Pressurized Water Reactors Page 4-212
AREVA NP Inc.
Figure 4.138: Temperature Comparison at 1.905 meters SCTF-II S2-17
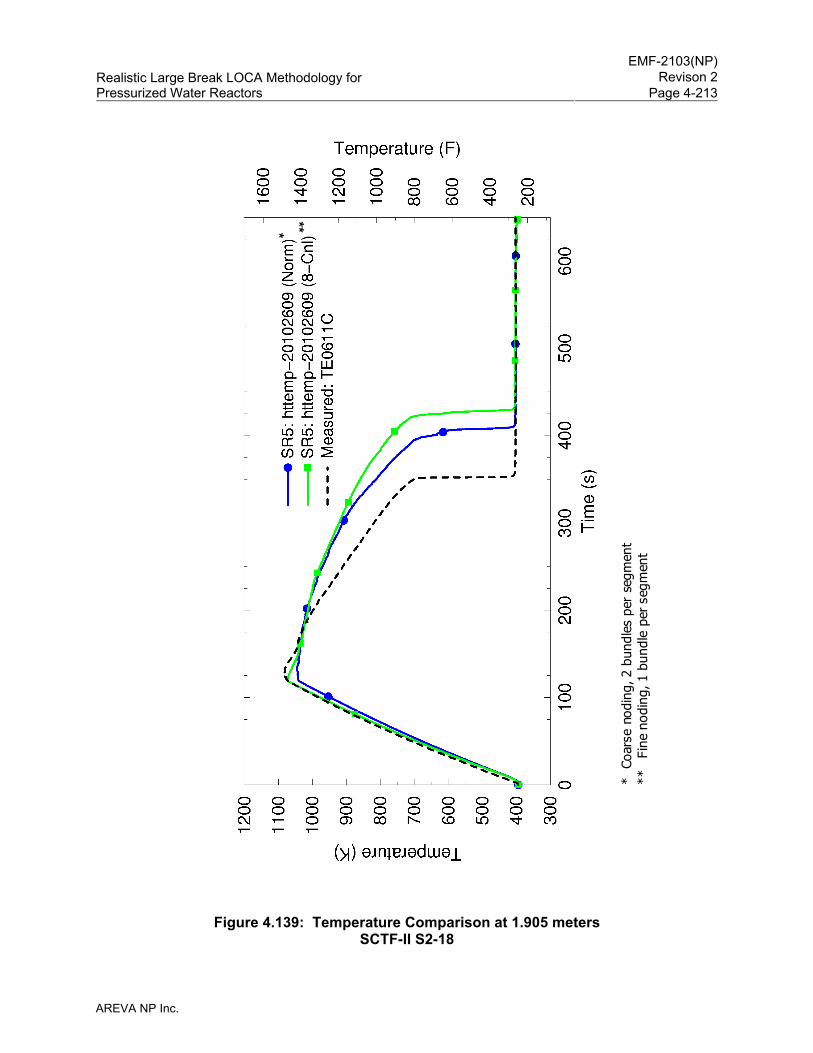
EMF-2103(NP)
Revison 2Realistic Large Break LOCA Methodology for Pressurized Water Reactors Page 4-213
AREVA NP Inc.
Figure 4.139: Temperature Comparison at 1.905 meters SCTF-II S2-18
* **
* C
oars
e no
ding
, 2 b
undl
es p
er s
egm
ent
**
Fin
e no
ding
, 1 b
undl
e pe
r se
gmen
t

EMF-2103(NP)
Revison 2Realistic Large Break LOCA Methodology for Pressurized Water Reactors Page 4-214
AREVA NP Inc.
4.3.1.14 ACHILLES Tests
An ACHILLES test, identified as International Standard Problem Number 25 (ISP 25), was
simulated using S-RELAP5 to evaluate the ability of the code to predict pressure vessel
thermal-hydraulic behavior due to the accumulator cover gas nitrogen release during a LBLOCA
in a PWR. The ACHILLES test simulated the latter phase of accumulator injection during a
LBLOCA.
The accumulator release of nitrogen into the primary system during a LBLOCA in a PWR
creates a complicated pressure vessel thermal-hydraulic behavior for several seconds after the
nitrogen release. When the accumulators empty of liquid, the nitrogen cover gas enters the
RCS where it flows to the upper part of the downcomer, causing the pressure to increase. The
pressure increases due to two primary reasons: (1) the loss of condensation in the cold legs and
(2) the vessel side break will not be able to remove the cover gas released and the
un-condensed steam flowing through the intact loops. The increased pressure depresses the
liquid level in the downcomer, resulting in a surge of water into the core. The surge of water in
the core momentarily increases core heat transfer resulting in an increase steam binding, which
causes an outsurge of water from the core back to the downcomer. The insurge back into the
downcomer has the potential to increase the liquid flow out of the vessel side break, which can
adversely affect the core heat-up later in the transient. Thus, the impact of nitrogen release
from the accumulators on core thermal response is difficult to evaluate.
The ACHILLES test facility is designed to simulate the latter stages of accumulator injection in a
LBLOCA. The test bundle had 69 electrically heated rods with geometry similar to that of a
Westinghouse 17x17 fuel assembly design. The rods were held together using eight spacer
grids and housed within a pipe. The exit region has a centrifugal separator to collect carryover
water. The steam then joins the nitrogen bypass flow and exits. The downcomer is a simple
pipe connected to the bottom of the core. A valve, located between the downcomer and the
bundle region, is closed before nitrogen injection begins, holding the water in the downcomer
until injection occurs. Another valve (bypass valve) is open before injection begins. It provides
a flow path for the pumped water so that it does not enter the core. This valve closes on
initiation of nitrogen injection.
The nitrogen tank is connected to the top of the simulated downcomer and a valve, which is
initially closed, opens to initiate the nitrogen flow. Nitrogen forces flow through the core by
EMF-2103(NP)
Revison 2Realistic Large Break LOCA Methodology for Pressurized Water Reactors Page 4-215
AREVA NP Inc.
increasing the pressure on the downcomer. Nitrogen also flows through a bypass path to join
the steam that is produced in the bundle region, and then exits through the break valve. A flow
meter measures the nitrogen flow from the tank and another flow meter measures the bypass
flow.
Each simulated fuel rod has multiple thermocouples on the surface of the rod. The PCT level
(2.13 meters) is heavily instrumented with 66 thermocouples.
As the appropriate valves are operated to initiate the event, an immediate pressure transient
occurs at the top of the downcomer. The initial pressurization of the downcomer causes a rapid
surge of liquid into the simulated core. As the nitrogen leaves the system via the bypass, the
pressure drops at the top of the downcomer, the levels in the core and downcomer recover, and
the core reflooding now depends on the pumped water flow, which is entering both the
downcomer and the core.
ACHILLES ISP 25 was analyzed using S-RELAP5 modeling consistent in the bundle region with
the modeling guidelines. Since the remaining test facility piping is atypical to the RLBLOCA
evaluation model, a simplified, but logical, modeling approach is selected in developing the input
model.
Figure 4.140 presents the range of variation in the thermocouples at the PCT elevation
(2.13 meters). The wide variation shown is not a consequence of power variations because the
rods are all at the same power. Three rods set the lower bound and all three of these rods are
located next to the shroud in the test assembly. The early quench indicates that the flow field
near the shroud is far different from that in the interior.
The remaining fuel rods can be divided into a group that tracks the maximum fairly well and a
group that falls well below the maximum, but not as dramatically as the three rods setting the
lower limit. Thus, the test data shows that a multi-dimensional analysis is required to get a
reasonable prediction of core temperatures.
The radial and azimuthal inhomogeneity is greater than would be experienced in the interior
region of a typical PWR. Thus, predicting the thermal-hydraulic behavior for this test assembly
is significantly more challenging than for a typical PWR core. One of the main reasons for this
is that there is a relatively large flow area between the rod bundle and the test vessel, which
EMF-2103(NP)
Revison 2Realistic Large Break LOCA Methodology for Pressurized Water Reactors Page 4-216
AREVA NP Inc.
resulted in a large degree of radial and azimuthal inhomogeneity in the fuel rod flow areas. The
ISP-25 summary report (Reference 28) concluded that “none of the codes produced a
completely satisfactory prediction,” which further indicates the atypicality of the ACHILLES test.
The bundle region is modeled as a two radial region TWODEE component because of the
inhomogeneity in the bundle region. The central 21 rods in the test assembly were modeled as
one channel and the remaining 48 rods and the shroud were modeled as the other channel
using a TWODEE component. [
] Since a hot
pin is not modeled separately, the rod-to-rod-radiation heat transfer option is not used in the
bundle region. The CCFL model is not applied at the bundle exit since in the test facility there is
a steam/water separator in the upper plenum, which is modeled in the S-RELAP5 input model.
The test facility, S-RELAP5 input model, and simulation results are discussed in detail in
Section 3.13 of Reference 5.
The calculated nitrogen flow rate agreed well with the data until frost was formed in the throat of
the venturi at about 7 seconds. Thereafter, the gas release data and the S-RELAP5
comparison are of questionable value. The calculated liquid carryover and the steaming rate at
the core exit show reasonable agreement with the data.
The downcomer ΔP measurements indicate an insurge of water in the core as soon as the
nitrogen injection starts. The core ΔP measurements indicate an increase in the core level.
The data indicate that most of the insurge of water was pushed out of the core within 5 seconds.
This is not completely reflected in the downcomer ΔP measurements. Insufficient information is
available to understand this difference. The calculated results show less insurge into the core
and as a result the downcomer level increased during this early phase of the transient. Once
the cover gas effect subsides, the calculated downcomer and core levels agreed reasonably
well with the data. The results indicate that S-RELAP5 will underpredict the liquid insurge into
the core, resulting in less core cooling after the accumulator tanks empty and the cover gas
from the tanks enters the primary system.
Calculated temperatures for the central region were compared to measured temperatures for
the 21 rods in the middle of the assembly. The maximum, minimum, and average temperatures
were compared with the calculated temperature for elevations from 1.08 to 3.18 meters. The
calculated values are mostly in good agreement with the measured values. The PCT elevation
EMF-2103(NP)
Revison 2Realistic Large Break LOCA Methodology for Pressurized Water Reactors Page 4-217
AREVA NP Inc.
is at 2.13 meters and, at this elevation, the calculated PCT is about 50 K lower than the data. At
all other elevations, the calculated peak temperature exceeds the measured values, except for
the 2.65 meter elevation where the prediction is about 50 K lower than the data. As discussed
earlier, there is a considerable amount of inhomogeneity in the bundle, which may not be
completely captured by the S-RELAP5 two-region simulation. Considering the observed
atypicality in the bundle flow behavior, the differences in results are considered acceptable.
The impact of the nitrogen injection, which is the focus of this assessment, can be seen in the
first 25 seconds of the transient. Figure 4.141 through Figure 4.146 show the effect of nitrogen
on temperature. The rod thermocouples all show a transient temperature reduction at the
beginning of the event, which is consistent with the downcomer and core ΔP measurements.
This initial cool-down is caused by the initial nitrogen insurge. S-RELAP5 calculates a
conservatively small cool-down compared to the data. In all cases, the calculated downward
temperature transient accompanying the nitrogen injection is smaller than the measured
temperature decrease. This indicates that S-RELAP5 underpredicts the cool-down due to the
nitrogen injection. The smaller decrease in the calculated cladding temperature results in lower
core steam production, resulting in a lower system pressure increase compared to the data as
shown in Figure 4.147. These results support the conclusions drawn earlier from the core and
downcomer ΔP results.
In summary, S-RELAP5 predicted a lower pressure increase and less insurge of water into the
core region compared to the ACHILLES data, resulting in less clad cooling following nitrogen
injection. From these results, it can be concluded that S-RELAP5 will calculate a conservative
cladding thermal response resulting from cover gas release into the primary system when the
accumulator empties following a LBLOCA in a PWR.
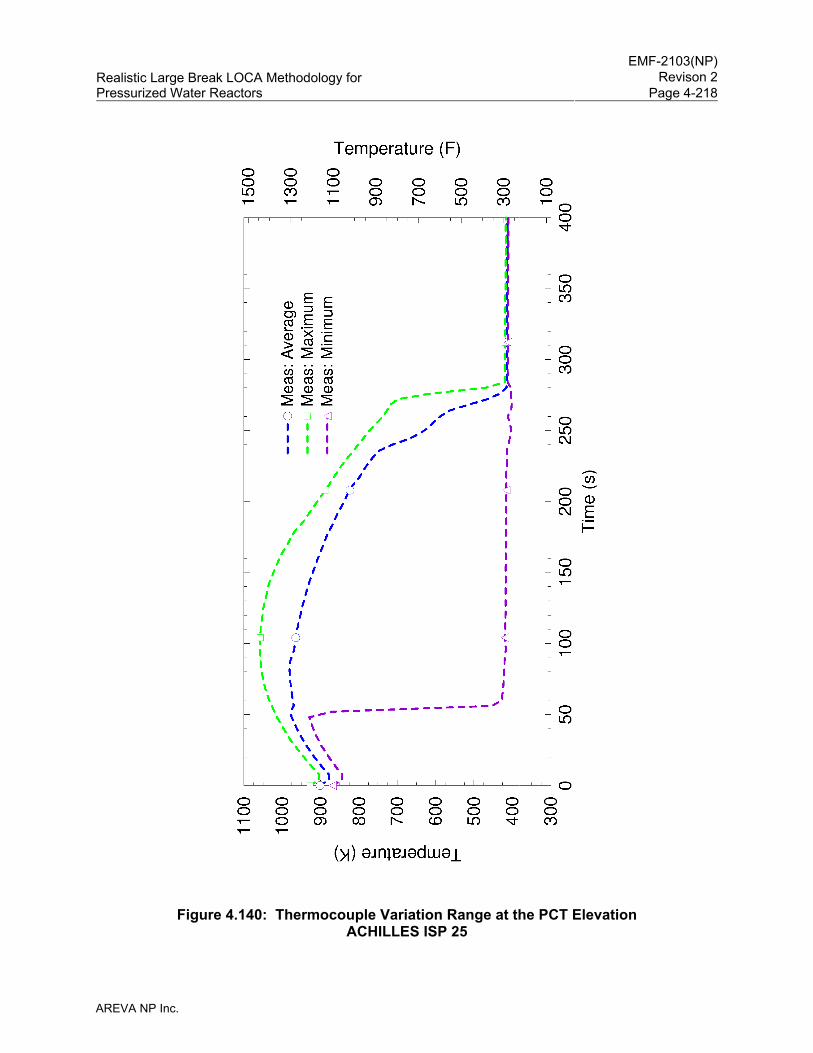
EMF-2103(NP)
Revison 2Realistic Large Break LOCA Methodology for Pressurized Water Reactors Page 4-218
AREVA NP Inc.
Figure 4.140: Thermocouple Variation Range at the PCT Elevation ACHILLES ISP 25
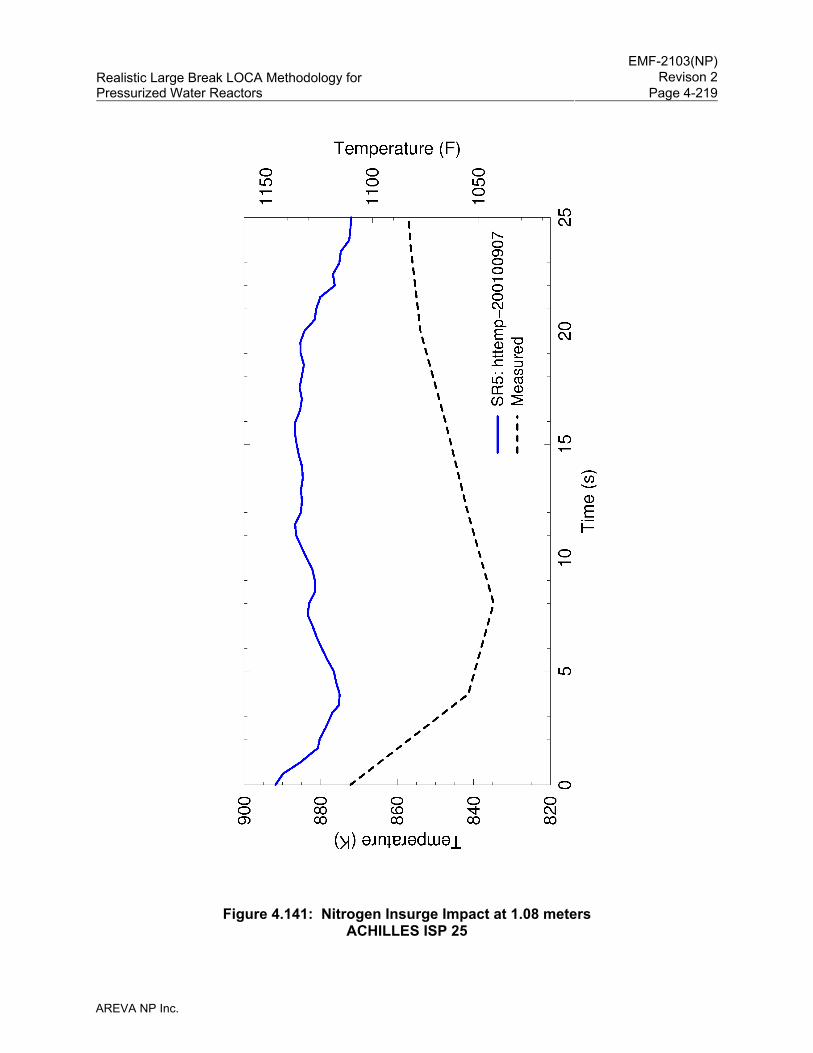
EMF-2103(NP)
Revison 2Realistic Large Break LOCA Methodology for Pressurized Water Reactors Page 4-219
AREVA NP Inc.
Figure 4.141: Nitrogen Insurge Impact at 1.08 meters ACHILLES ISP 25
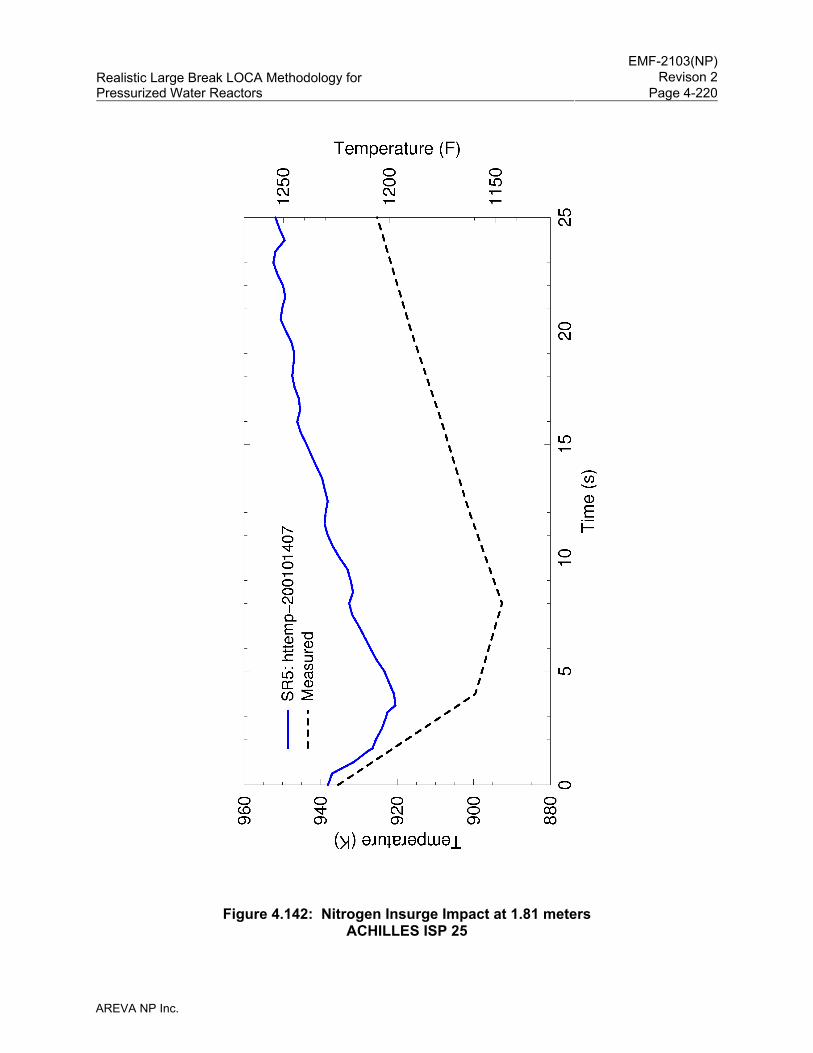
EMF-2103(NP)
Revison 2Realistic Large Break LOCA Methodology for Pressurized Water Reactors Page 4-220
AREVA NP Inc.
Figure 4.142: Nitrogen Insurge Impact at 1.81 meters ACHILLES ISP 25
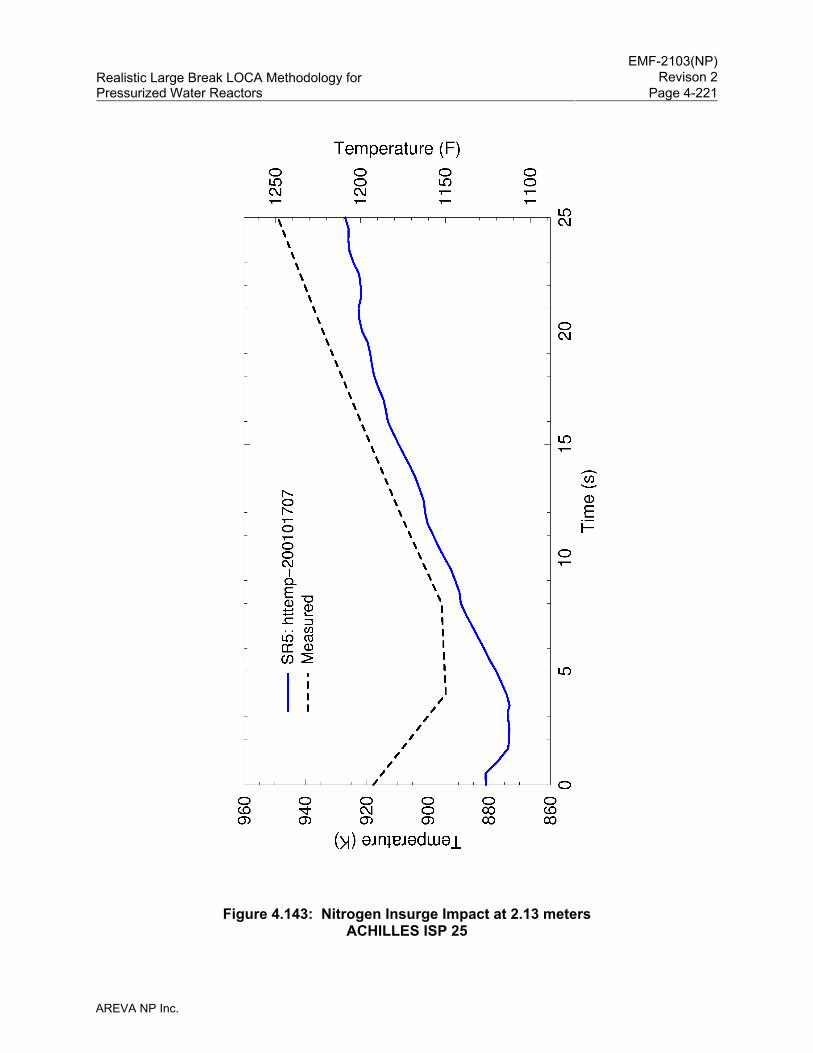
EMF-2103(NP)
Revison 2Realistic Large Break LOCA Methodology for Pressurized Water Reactors Page 4-221
AREVA NP Inc.
Figure 4.143: Nitrogen Insurge Impact at 2.13 meters ACHILLES ISP 25
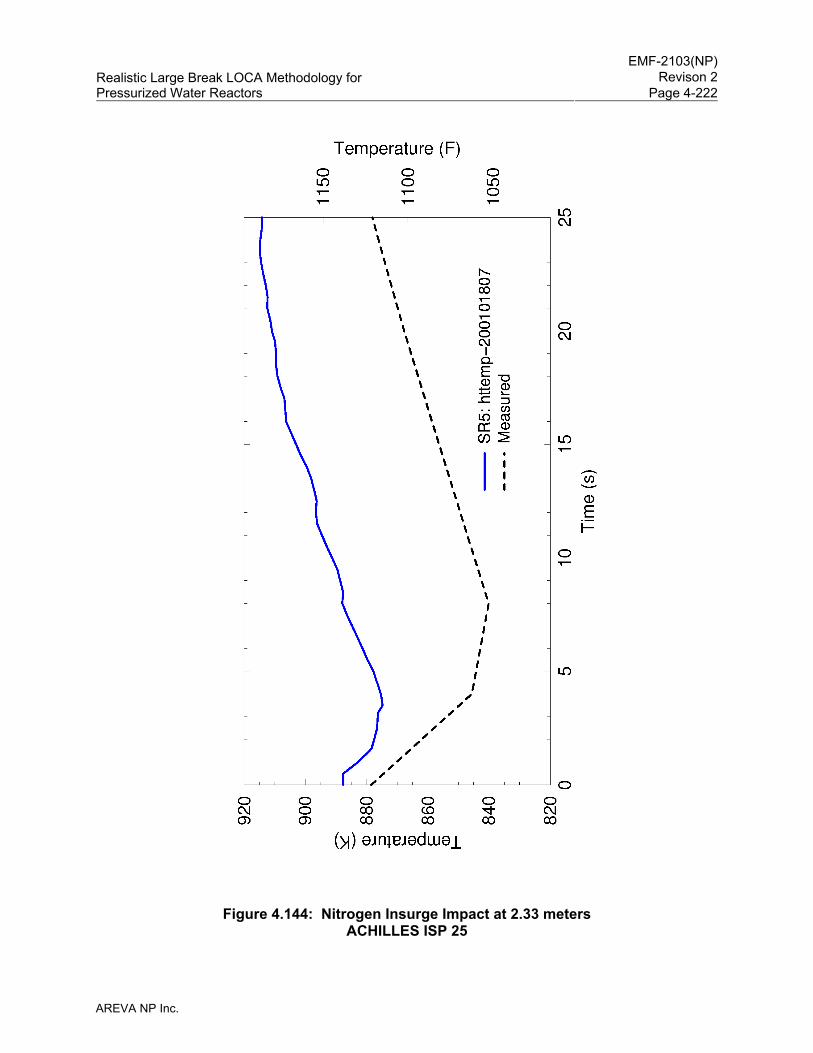
EMF-2103(NP)
Revison 2Realistic Large Break LOCA Methodology for Pressurized Water Reactors Page 4-222
AREVA NP Inc.
Figure 4.144: Nitrogen Insurge Impact at 2.33 meters ACHILLES ISP 25
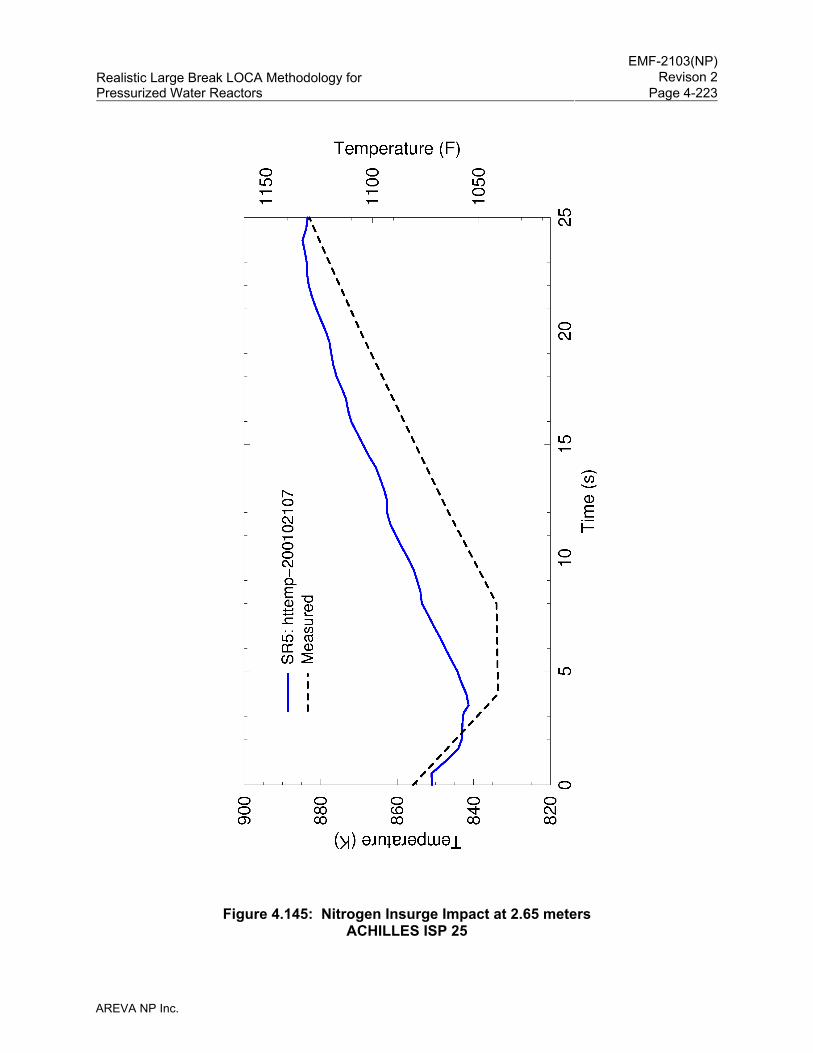
EMF-2103(NP)
Revison 2Realistic Large Break LOCA Methodology for Pressurized Water Reactors Page 4-223
AREVA NP Inc.
Figure 4.145: Nitrogen Insurge Impact at 2.65 meters ACHILLES ISP 25
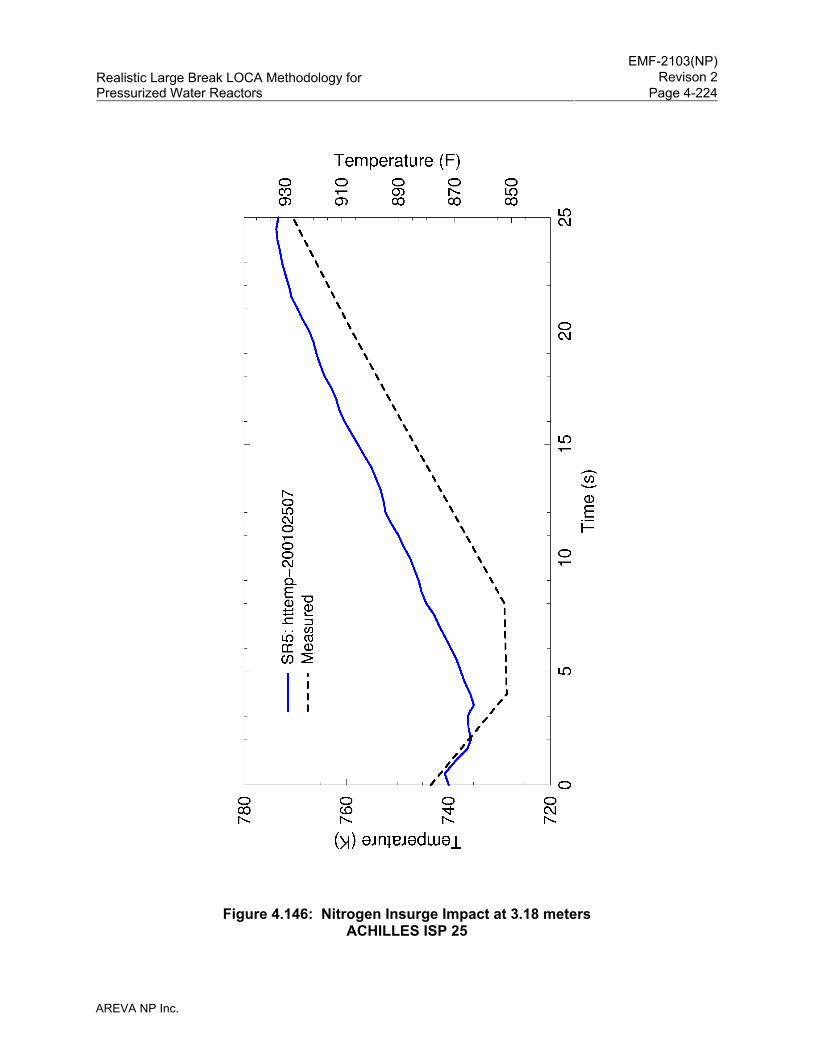
EMF-2103(NP)
Revison 2Realistic Large Break LOCA Methodology for Pressurized Water Reactors Page 4-224
AREVA NP Inc.
Figure 4.146: Nitrogen Insurge Impact at 3.18 meters ACHILLES ISP 25
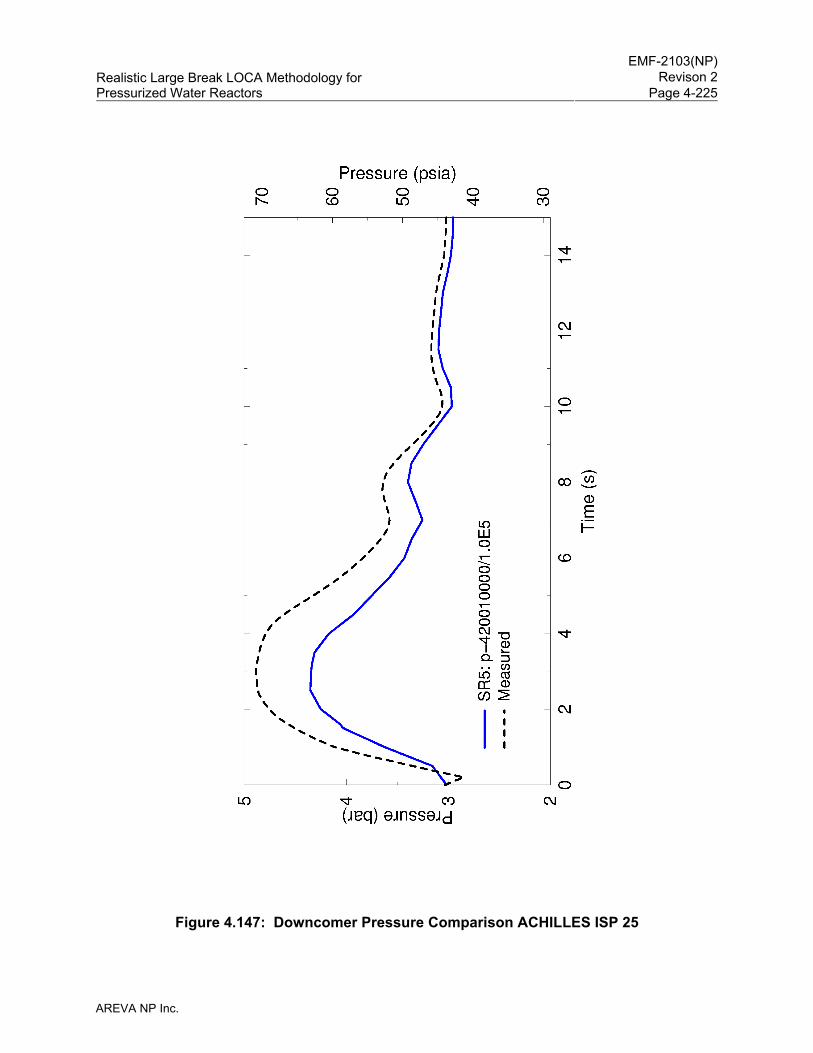
EMF-2103(NP)
Revison 2Realistic Large Break LOCA Methodology for Pressurized Water Reactors Page 4-225
AREVA NP Inc.
Figure 4.147: Downcomer Pressure Comparison ACHILLES ISP 25
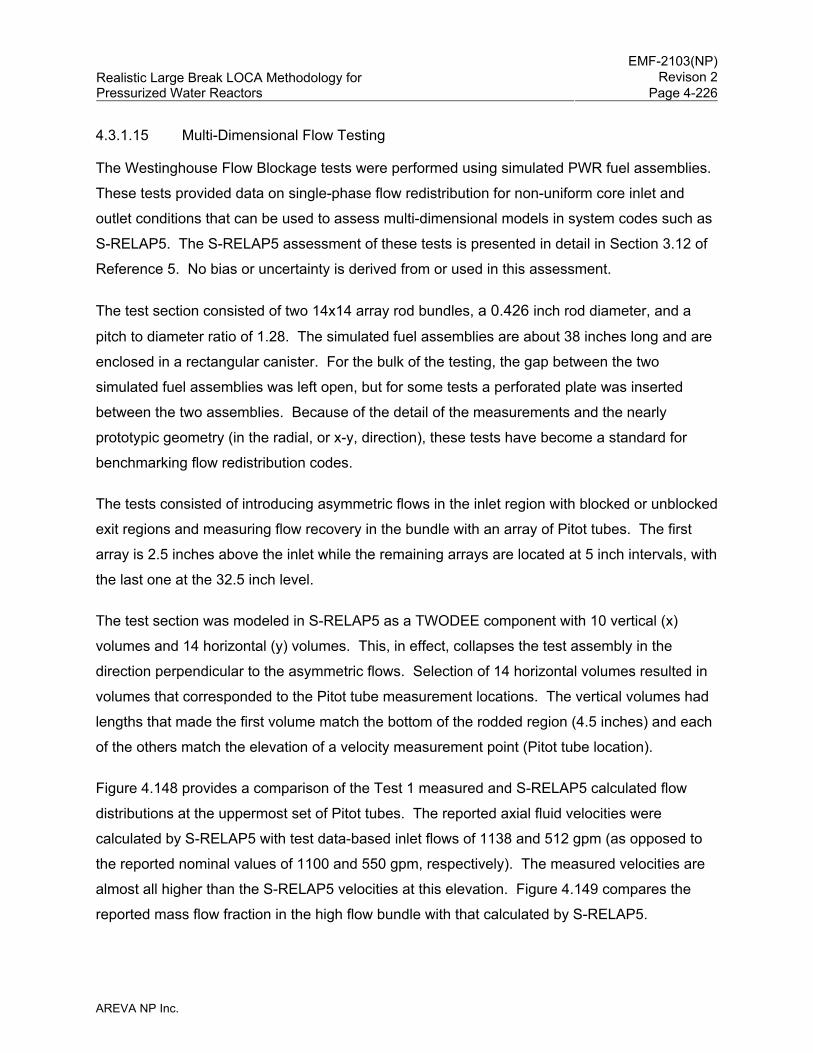
EMF-2103(NP)
Revison 2Realistic Large Break LOCA Methodology for Pressurized Water Reactors Page 4-226
AREVA NP Inc.
4.3.1.15 Multi-Dimensional Flow Testing
The Westinghouse Flow Blockage tests were performed using simulated PWR fuel assemblies.
These tests provided data on single-phase flow redistribution for non-uniform core inlet and
outlet conditions that can be used to assess multi-dimensional models in system codes such as
S-RELAP5. The S-RELAP5 assessment of these tests is presented in detail in Section 3.12 of
Reference 5. No bias or uncertainty is derived from or used in this assessment.
The test section consisted of two 14x14 array rod bundles, a 0.426 inch rod diameter, and a
pitch to diameter ratio of 1.28. The simulated fuel assemblies are about 38 inches long and are
enclosed in a rectangular canister. For the bulk of the testing, the gap between the two
simulated fuel assemblies was left open, but for some tests a perforated plate was inserted
between the two assemblies. Because of the detail of the measurements and the nearly
prototypic geometry (in the radial, or x-y, direction), these tests have become a standard for
benchmarking flow redistribution codes.
The tests consisted of introducing asymmetric flows in the inlet region with blocked or unblocked
exit regions and measuring flow recovery in the bundle with an array of Pitot tubes. The first
array is 2.5 inches above the inlet while the remaining arrays are located at 5 inch intervals, with
the last one at the 32.5 inch level.
The test section was modeled in S-RELAP5 as a TWODEE component with 10 vertical (x)
volumes and 14 horizontal (y) volumes. This, in effect, collapses the test assembly in the
direction perpendicular to the asymmetric flows. Selection of 14 horizontal volumes resulted in
volumes that corresponded to the Pitot tube measurement locations. The vertical volumes had
lengths that made the first volume match the bottom of the rodded region (4.5 inches) and each
of the others match the elevation of a velocity measurement point (Pitot tube location).
Figure 4.148 provides a comparison of the Test 1 measured and S-RELAP5 calculated flow
distributions at the uppermost set of Pitot tubes. The reported axial fluid velocities were
calculated by S-RELAP5 with test data-based inlet flows of 1138 and 512 gpm (as opposed to
the reported nominal values of 1100 and 550 gpm, respectively). The measured velocities are
almost all higher than the S-RELAP5 velocities at this elevation. Figure 4.149 compares the
reported mass flow fraction in the high flow bundle with that calculated by S-RELAP5.
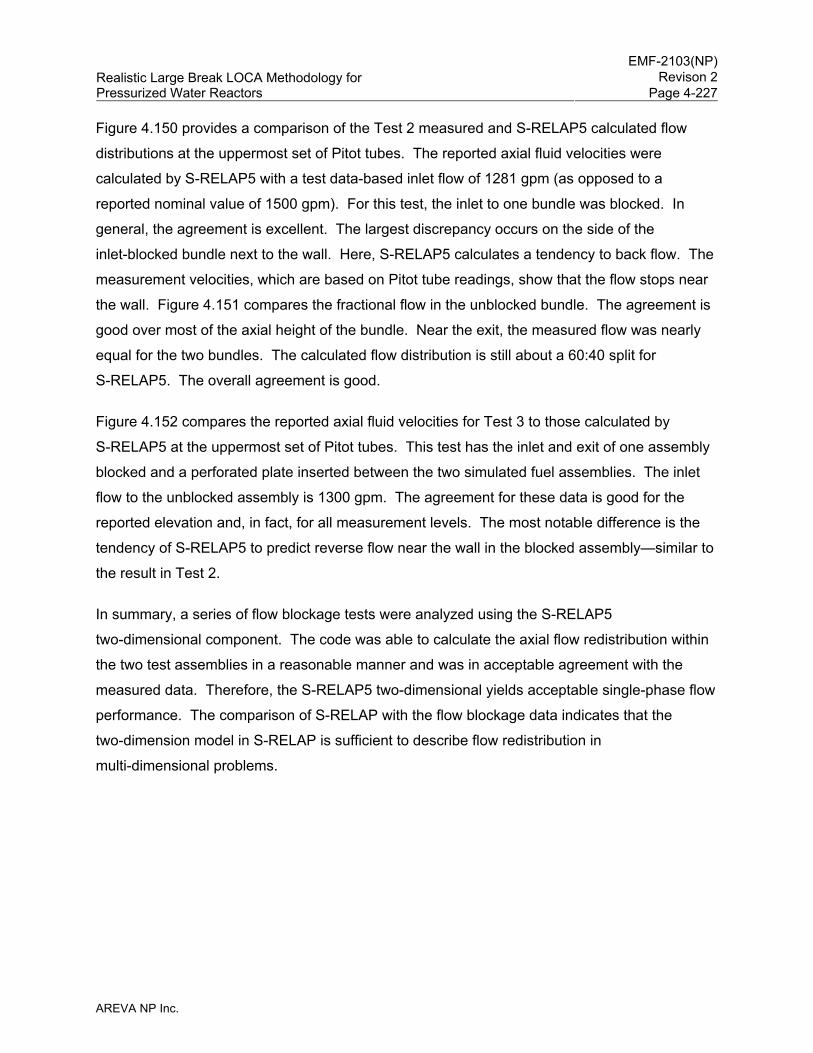
EMF-2103(NP)
Revison 2Realistic Large Break LOCA Methodology for Pressurized Water Reactors Page 4-227
AREVA NP Inc.
Figure 4.150 provides a comparison of the Test 2 measured and S-RELAP5 calculated flow
distributions at the uppermost set of Pitot tubes. The reported axial fluid velocities were
calculated by S-RELAP5 with a test data-based inlet flow of 1281 gpm (as opposed to a
reported nominal value of 1500 gpm). For this test, the inlet to one bundle was blocked. In
general, the agreement is excellent. The largest discrepancy occurs on the side of the
inlet-blocked bundle next to the wall. Here, S-RELAP5 calculates a tendency to back flow. The
measurement velocities, which are based on Pitot tube readings, show that the flow stops near
the wall. Figure 4.151 compares the fractional flow in the unblocked bundle. The agreement is
good over most of the axial height of the bundle. Near the exit, the measured flow was nearly
equal for the two bundles. The calculated flow distribution is still about a 60:40 split for
S-RELAP5. The overall agreement is good.
Figure 4.152 compares the reported axial fluid velocities for Test 3 to those calculated by
S-RELAP5 at the uppermost set of Pitot tubes. This test has the inlet and exit of one assembly
blocked and a perforated plate inserted between the two simulated fuel assemblies. The inlet
flow to the unblocked assembly is 1300 gpm. The agreement for these data is good for the
reported elevation and, in fact, for all measurement levels. The most notable difference is the
tendency of S-RELAP5 to predict reverse flow near the wall in the blocked assembly—similar to
the result in Test 2.
In summary, a series of flow blockage tests were analyzed using the S-RELAP5
two-dimensional component. The code was able to calculate the axial flow redistribution within
the two test assemblies in a reasonable manner and was in acceptable agreement with the
measured data. Therefore, the S-RELAP5 two-dimensional yields acceptable single-phase flow
performance. The comparison of S-RELAP with the flow blockage data indicates that the
two-dimension model in S-RELAP is sufficient to describe flow redistribution in
multi-dimensional problems.
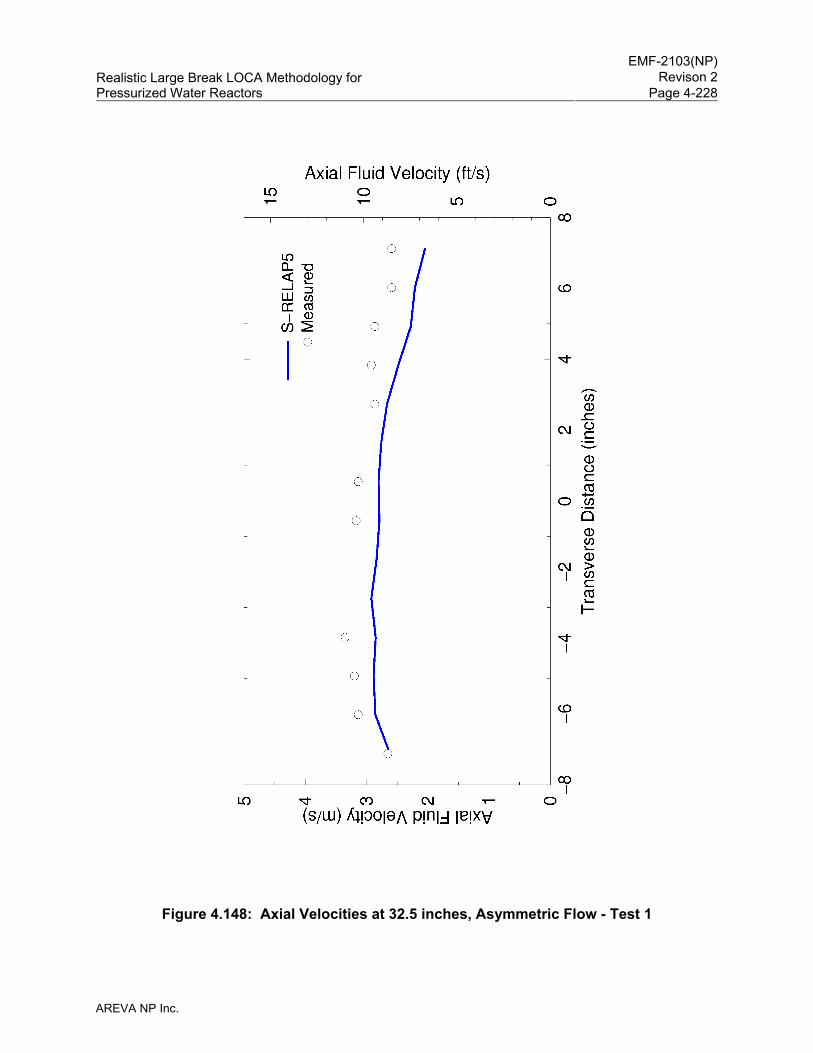
EMF-2103(NP)
Revison 2Realistic Large Break LOCA Methodology for Pressurized Water Reactors Page 4-228
AREVA NP Inc.
Figure 4.148: Axial Velocities at 32.5 inches, Asymmetric Flow - Test 1
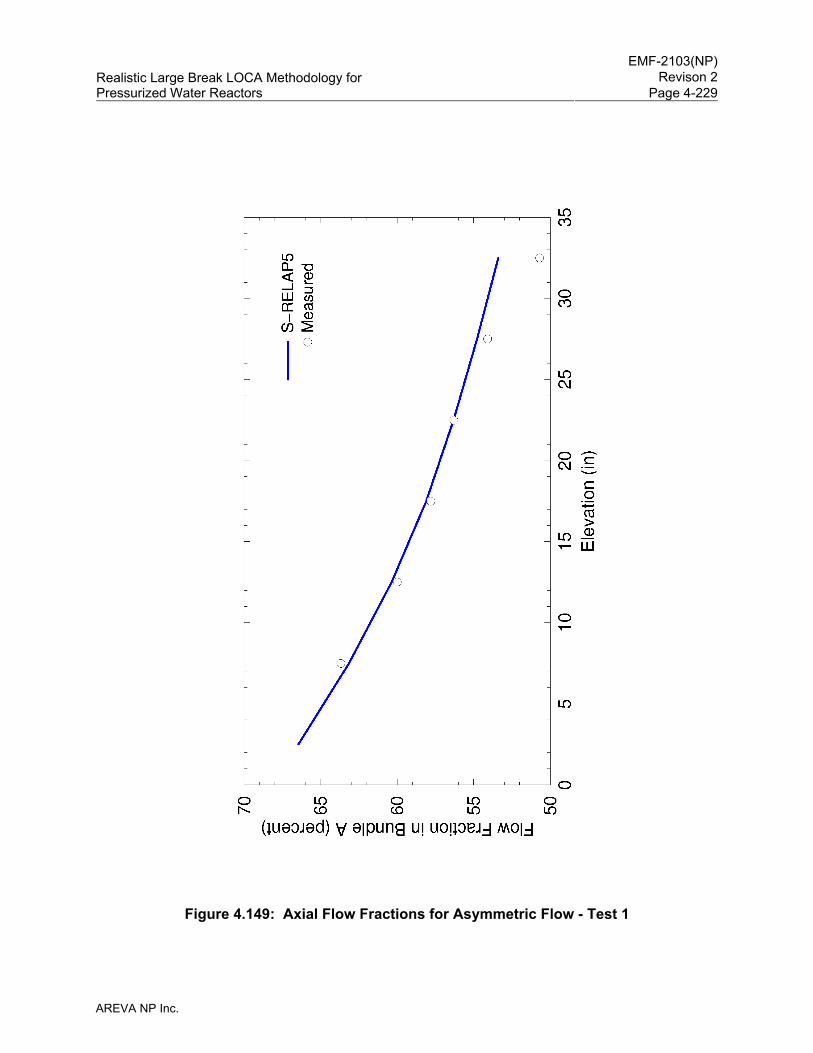
EMF-2103(NP)
Revison 2Realistic Large Break LOCA Methodology for Pressurized Water Reactors Page 4-229
AREVA NP Inc.
Figure 4.149: Axial Flow Fractions for Asymmetric Flow - Test 1
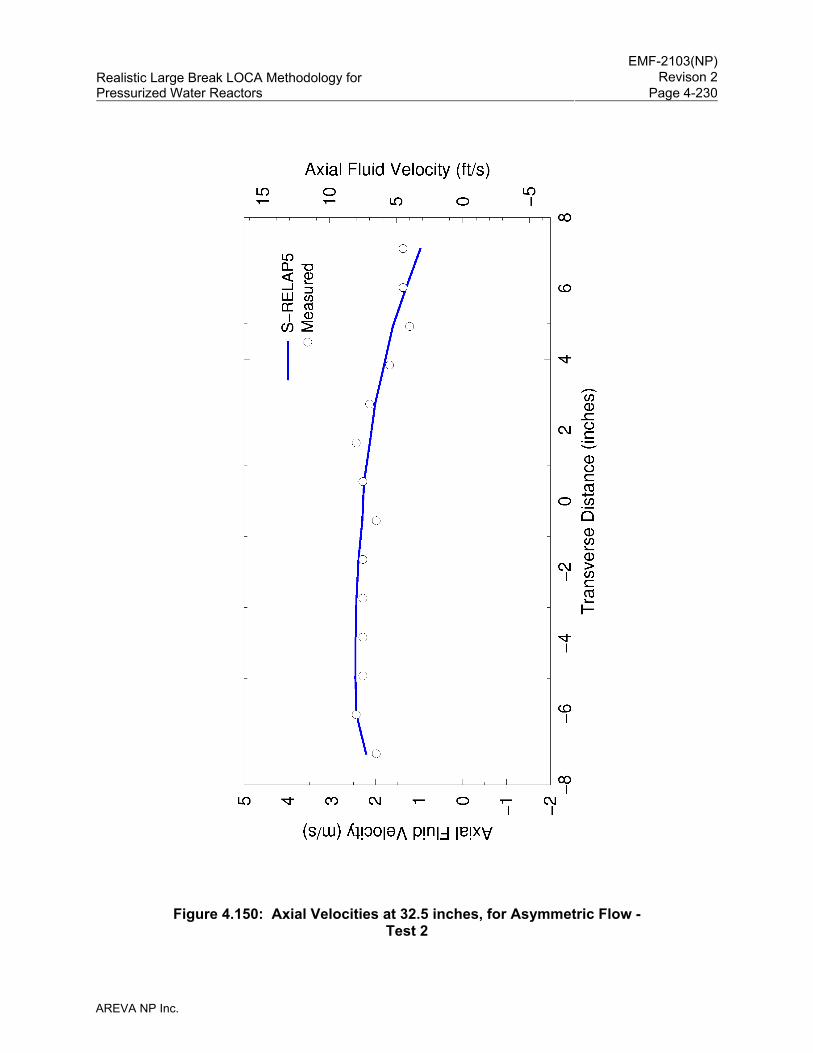
EMF-2103(NP)
Revison 2Realistic Large Break LOCA Methodology for Pressurized Water Reactors Page 4-230
AREVA NP Inc.
Figure 4.150: Axial Velocities at 32.5 inches, for Asymmetric Flow - Test 2
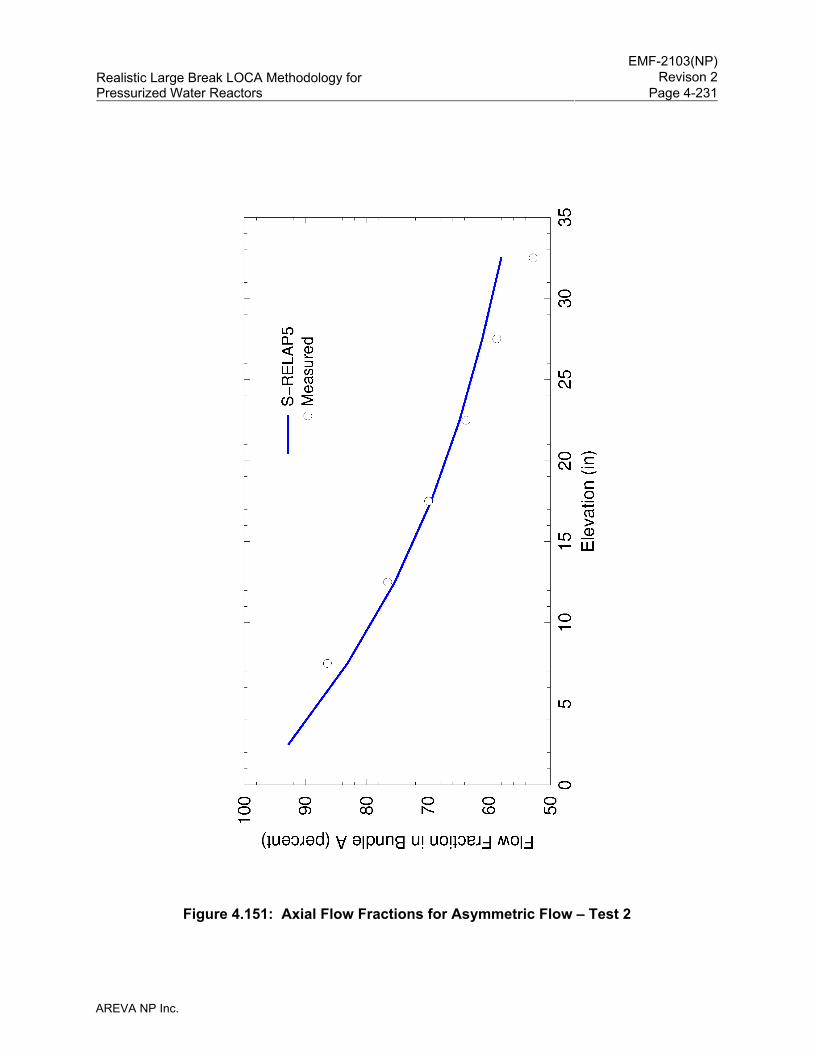
EMF-2103(NP)
Revison 2Realistic Large Break LOCA Methodology for Pressurized Water Reactors Page 4-231
AREVA NP Inc.
Figure 4.151: Axial Flow Fractions for Asymmetric Flow – Test 2
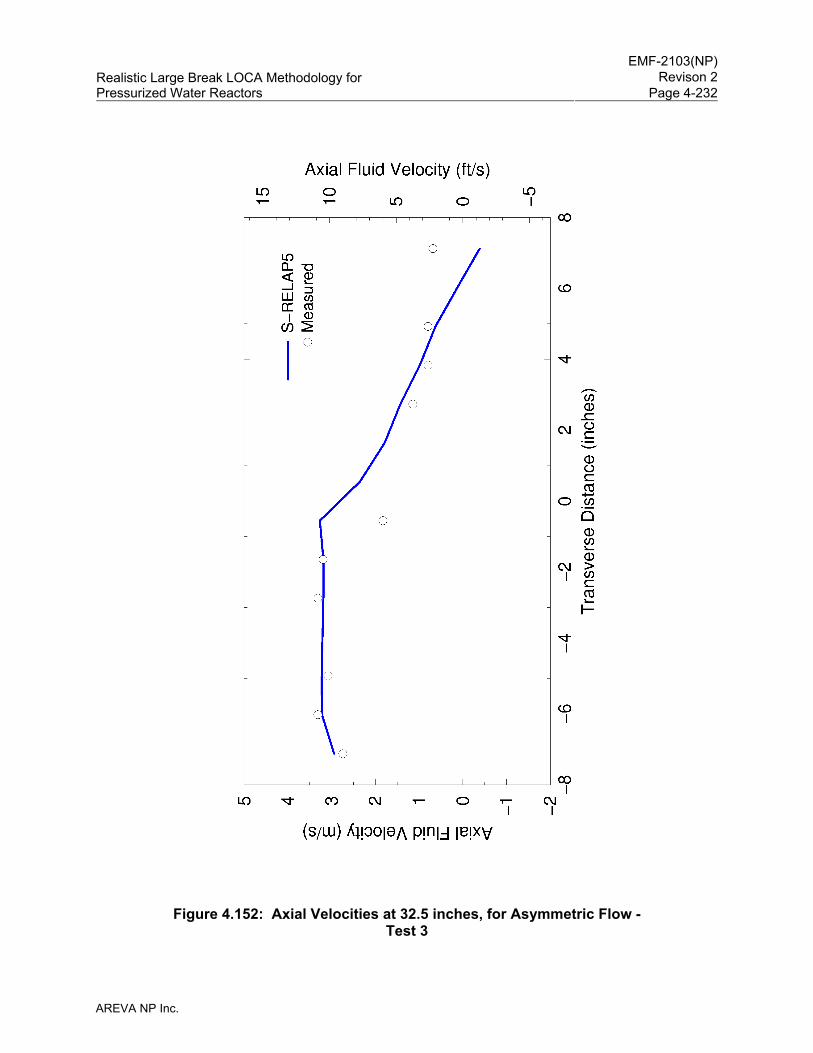
EMF-2103(NP)
Revison 2Realistic Large Break LOCA Methodology for Pressurized Water Reactors Page 4-232
AREVA NP Inc.
Figure 4.152: Axial Velocities at 32.5 inches, for Asymmetric Flow - Test 3
EMF-2103(NP)
Revison 2Realistic Large Break LOCA Methodology for Pressurized Water Reactors Page 4-233
AREVA NP Inc.
4.3.1.16 Moby Dick Test 3141
The calculation of critical flow is an important consideration in the area of nuclear reactor safety.
The fluid velocity at the location of the break, or other restrictions, can exceed the local sound
speed, which causes the fluid flow rate to become insensitive to downstream pressure changes.
Of particular importance are choking conditions at pipe break locations where fluid conditions
are low pressure, subcooled liquid and the vapor space is saturated with nitrogen. These are
the conditions that exist in the cold leg after the accumulator empties and the nitrogen cover gas
escapes from the ECC injection point immediately upstream of the break plane.
For this S-RELAP5 assessment, Moby-Dick Test 3141 is used since this test establishes
choked flow for a two-component (nitrogen/water) flow in a divergent nozzle, similar to the flow
exiting the break during a postulated LBLOCA event. The S-RELAP5 assessment of these
tests is presented in detail in Section 3.15 of Reference 5.
The facility consists of a vertical pipe with the dimensions given in Table 4.15 with piping for the
water and nitrogen sources and a catch tank surrounding the diffuser outlet. The inlet pressure
was 5.619x10⁵ Pa (81.48 psia) and the outlet pressure was 1.03178x10⁵ Pa (14.96 psia). This
pressure drop, along with a nitrogen injection of 6.101x10⁻³ kg/s (1.345x10⁻² lb/s), gave a
choked mass flow rate of 1.222 kg/s (2.694 lb/s).
The S-RELAP5 nodalization mimicked the facility dimensions with the insignificant exception of
having a 0.993 meter (3.26 feet) distance between the nitrogen injection point and diffuser
entrance due to node spacing. The same pressures and nitrogen injection flow were used. The
S-RELAP5 choked flow rate was 1.2769 kg/s (2.813 lb/s). The calculated axial pressures are
shown in Figure 4.153 along with the test data.
The results show S-RELAP5 predicted the pressure gradient in the straight pipe well, before
and after the divergent nozzle. Flashing occurred at the diverging nozzle entrance and choked
flow was calculated by S-RELAP5 using the HEM critical flow model. The calculated choked
flow rate compares well (within 5 percent) to the test steady-state flow rate.
The critical flow model with non-condensables present in S-RELAP5 was examined and was
determined to be performing as intended and the model was behaving in an acceptable manner.
When the injected nitrogen gas causes a pressure increase, choking at the break becomes

EMF-2103(NP)
Revison 2Realistic Large Break LOCA Methodology for Pressurized Water Reactors Page 4-234
AREVA NP Inc.
possible, depending both on the magnitude of the pressure rise and the flow area at the break.
A benchmark of the S-RELAP5 critical flow calculation, with nitrogen surging into the system
and passing out the break, compares well with test data obtained from the Moby Dick Critical
Flow Experiments. Therefore, the critical flow model with non-condensables present is
expected to capture the appropriate phenomena when the nitrogen cover gas surges into the
RLBLOCA plant model as the accumulator empties.
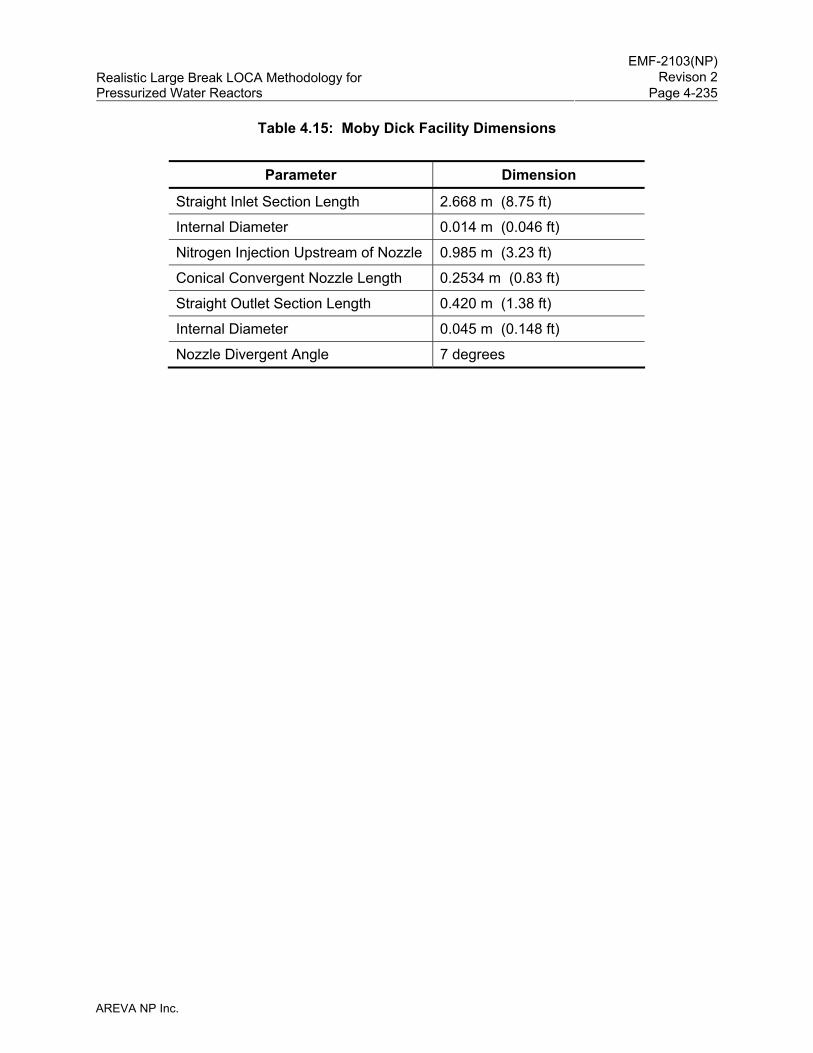
EMF-2103(NP)
Revison 2Realistic Large Break LOCA Methodology for Pressurized Water Reactors Page 4-235
AREVA NP Inc.
Table 4.15: Moby Dick Facility Dimensions
Parameter Dimension
Straight Inlet Section Length 2.668 m (8.75 ft)
Internal Diameter 0.014 m (0.046 ft)
Nitrogen Injection Upstream of Nozzle 0.985 m (3.23 ft)
Conical Convergent Nozzle Length 0.2534 m (0.83 ft)
Straight Outlet Section Length 0.420 m (1.38 ft)
Internal Diameter 0.045 m (0.148 ft)
Nozzle Divergent Angle 7 degrees
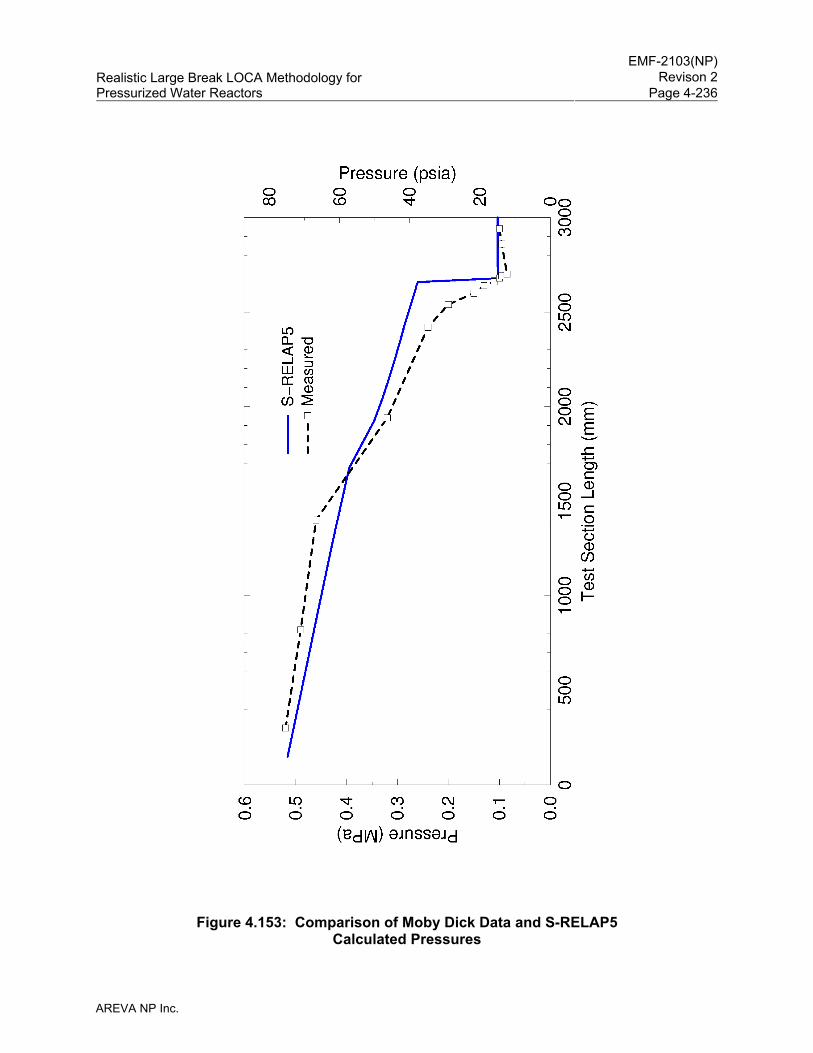
EMF-2103(NP)
Revison 2Realistic Large Break LOCA Methodology for Pressurized Water Reactors Page 4-236
AREVA NP Inc.
Figure 4.153: Comparison of Moby Dick Data and S-RELAP5 Calculated Pressures
EMF-2103(NP)
Revison 2Realistic Large Break LOCA Methodology for Pressurized Water Reactors Page 4-237
AREVA NP Inc.
4.3.1.17 Assessment of Total Heat Transfer in FLECHT-SEASET Test 31504
The post-CHF heat transfer model now includes provisions for thermal radiation between
structures (rod-to-rod). This adds to the current model which already includes thermal radiation
from structures to the fluid (rod-to-droplets and rod-to-steam). The heat transfer uncertainties
developed previously (discussed in Section 5.1.2 of Reference 5), assumed that rod-to-rod
radiation was implicitly included in that development. Consequently, [
] . As a result, the heat transfer uncertainty with rod-to-rod
radiation was determined using the same (Revision 0) FLECHT-SEASET tests as before, but
with modified input to explicitly account for the rod-to-rod radiation contribution. Discussion of
those results is provided in Section 5.1.3 of Reference 5.
The application of the heat transfer uncertainties to the hot rod requires a different strategy than
previously used (i.e., Revision 0). First, a model conducive to including rod-to-rod radiation heat
transfer needs to be developed. Referring to the thermal radiation analysis in Reference 29, the
161-rod FLECHT-SEASET bundle was collapsed into a 5x5 array, including a guide tube, plus a
boundary that surrounds the hot rod. The researchers used test measurements for the
boundary and array elements, steam temperature, and droplet size and distribution to establish
the total radiation contribution to the heat transfer over a span of 100 seconds. Applying this
arrangement to the plant model requires some simplifications since it is not practical to extract
either individual rod temperatures or groups of rod temperatures from a reflood analysis.
By assuming the rods, including guide tubes, in the 5x5 and boundary have the same
temperature, the 5x5 boundary can be collapsed into one structure surrounding the hot rod.
This simplified arrangement can be treated as concentric cylinders. However, assuming a
constant temperature distribution is acceptable only if a bounding temperature is used.
Additional heat structures were added to the otherwise unchanged (except for numbering)
S-RELAP5 input model discussed in Section 3.3.5 of Reference 5. A new ‘hot rod’ structure
was created. It differs from the original (Revision 0) bundle structure by the heat transfer
surface area factors (one rod versus 159 rods) and its power level (adjusted to be suitable for
one rod). A new ‘aux rod’ structure was created which differs from the original bundle structure
by the heat transfer surface area factor (approximately 49 rods versus 159 rods) and the power
level (reduced to be suitable for a 49 rod structure). Additionally, the power level was further
EMF-2103(NP)
Revison 2Realistic Large Break LOCA Methodology for Pressurized Water Reactors Page 4-238
AREVA NP Inc.
reduced until sufficient radiation heat transfer between this structure and the hot rod was
calculated. This amount was determined by comparison with results presented in
Reference 29. A 10 percent reduction in power was required to obtain a total radiation
contribution that was approximately 35 percent of the total heat transfer.
The RLBLOCA heat transfer multipliers [ ] were applied
to the base structure that represented the 161-rod bundle. This arrangement is meant to
achieve a best-estimate response and is also similar in application to the plant model. The hot
rod and auxiliary rod used [ ]. These values represent the
median values from the post-CHF probability distributions given in Section 5.1.3 of Reference 5.
The radiation modeling in S-RELAP5 of the FLECHT-SEASET tests does not include the test
vessel components (guide tubes) other than the test bundle, nor is it possible to supply an
effective rod temperature distribution as found in Test 31504. Consequently, the ratio of
convective heat transfer to total heat transfer at 100 seconds (time of PCT) was determined to
be the figure of merit for comparison. The results from Test 31504 are shown in Figure 4.154.
The data was estimated from Figure 6-12 in Reference 29.
The total heat transfer coefficient is presented in Figure 4.155 and the total convection heat
transfer coefficient is presented in Figure 4.156. Also in Figure 4.155 are the measured heat
transfers coefficients estimated from Figure H-6 on page H-5 from Reference 29. The
measurements are from three separate rods, while the estimates are from the estimated
maximum and minimum heat transfer coefficients from 50 to 200 seconds. A quadratic was
fitted to the calculation over the span of 30 to 300 seconds to give an estimate of the average
magnitude to the computed heat transfer coefficient due to the oscillations present. S-RELAP5
tends to briefly reduce droplet generation immediately after a node quenches and before the
quench front moves up to the next node. This process causes the apparent increased heat
transfer immediately following a severe decrease in heat transfer when the droplet production
ceases momentarily. The regression shows a truer estimate of the average heat transfer
coefficient. The average total heat transfer coefficient at 100 seconds is 9.7 BTU/h-ft2-°F.
A cubic was fitted to the calculated heat transfer coefficient in Figure 4.156. Without the
radiation heat transfer present, the character of the heat transfer coefficient changed slightly so
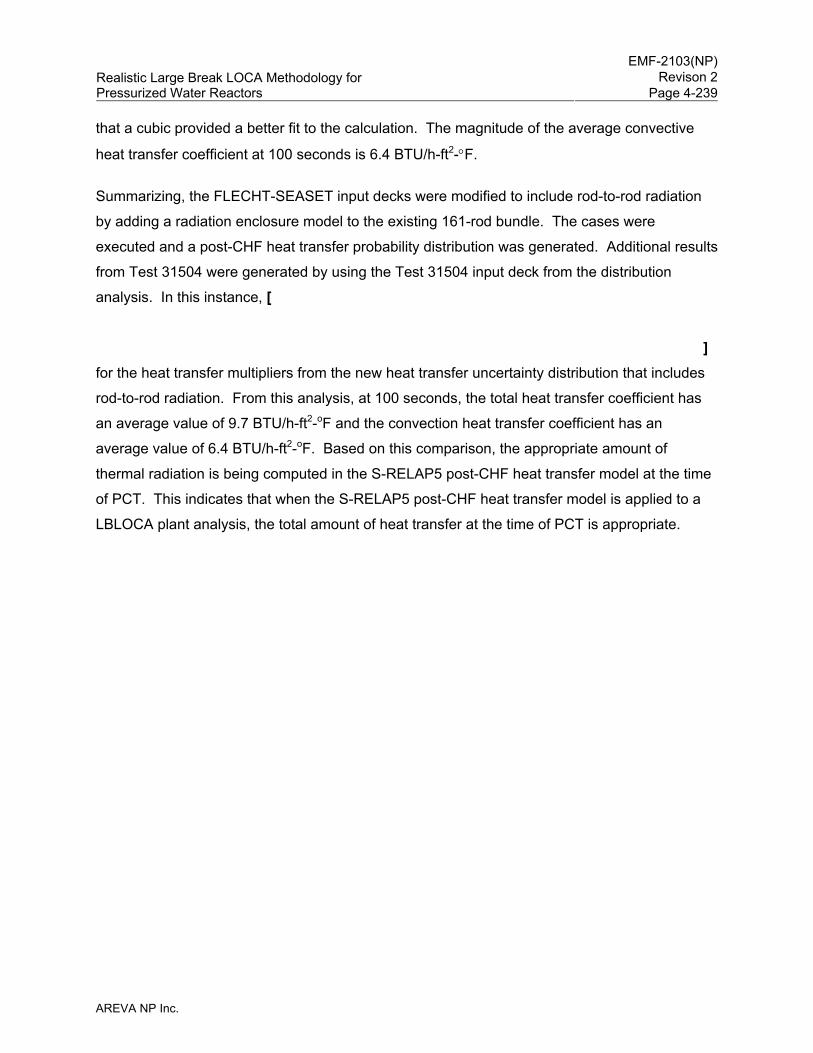
EMF-2103(NP)
Revison 2Realistic Large Break LOCA Methodology for Pressurized Water Reactors Page 4-239
AREVA NP Inc.
that a cubic provided a better fit to the calculation. The magnitude of the average convective
heat transfer coefficient at 100 seconds is 6.4 BTU/h-ft2-°F.
Summarizing, the FLECHT-SEASET input decks were modified to include rod-to-rod radiation
by adding a radiation enclosure model to the existing 161-rod bundle. The cases were
executed and a post-CHF heat transfer probability distribution was generated. Additional results
from Test 31504 were generated by using the Test 31504 input deck from the distribution
analysis. In this instance, [
] for the heat transfer multipliers from the new heat transfer uncertainty distribution that includes
rod-to-rod radiation. From this analysis, at 100 seconds, the total heat transfer coefficient has
an average value of 9.7 BTU/h-ft2-oF and the convection heat transfer coefficient has an
average value of 6.4 BTU/h-ft2-oF. Based on this comparison, the appropriate amount of
thermal radiation is being computed in the S-RELAP5 post-CHF heat transfer model at the time
of PCT. This indicates that when the S-RELAP5 post-CHF heat transfer model is applied to a
LBLOCA plant analysis, the total amount of heat transfer at the time of PCT is appropriate.
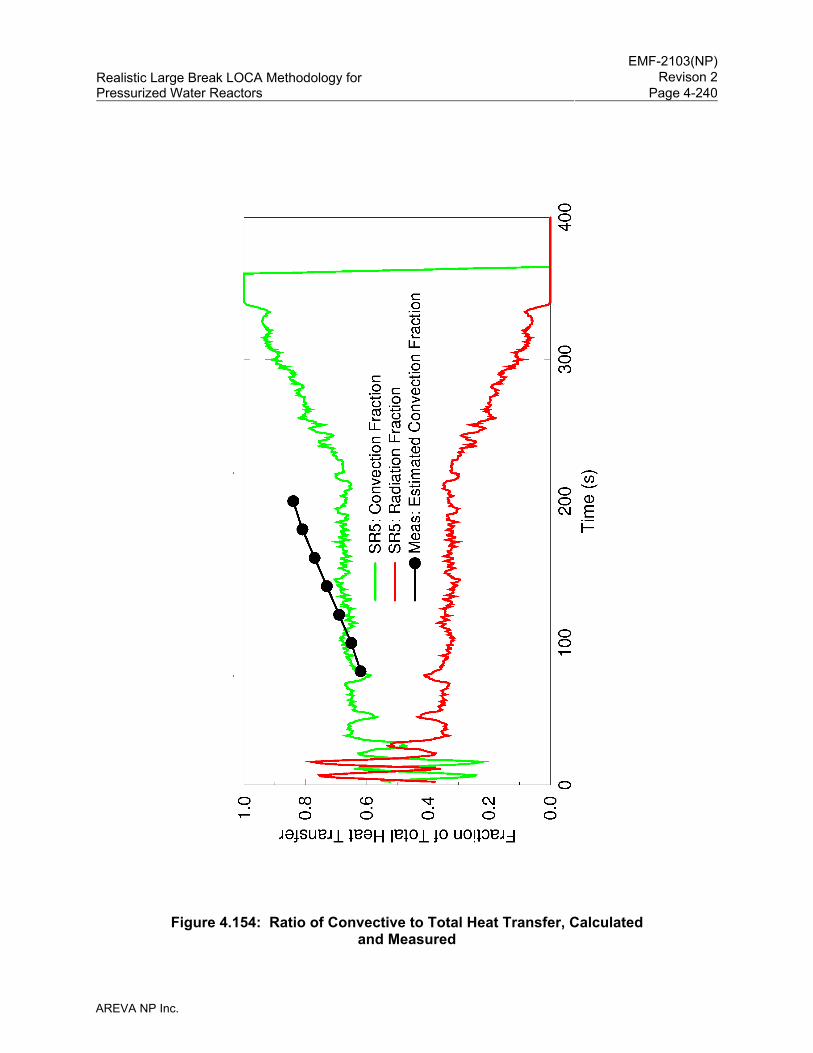
EMF-2103(NP)
Revison 2Realistic Large Break LOCA Methodology for Pressurized Water Reactors Page 4-240
AREVA NP Inc.
Figure 4.154: Ratio of Convective to Total Heat Transfer, Calculated and Measured
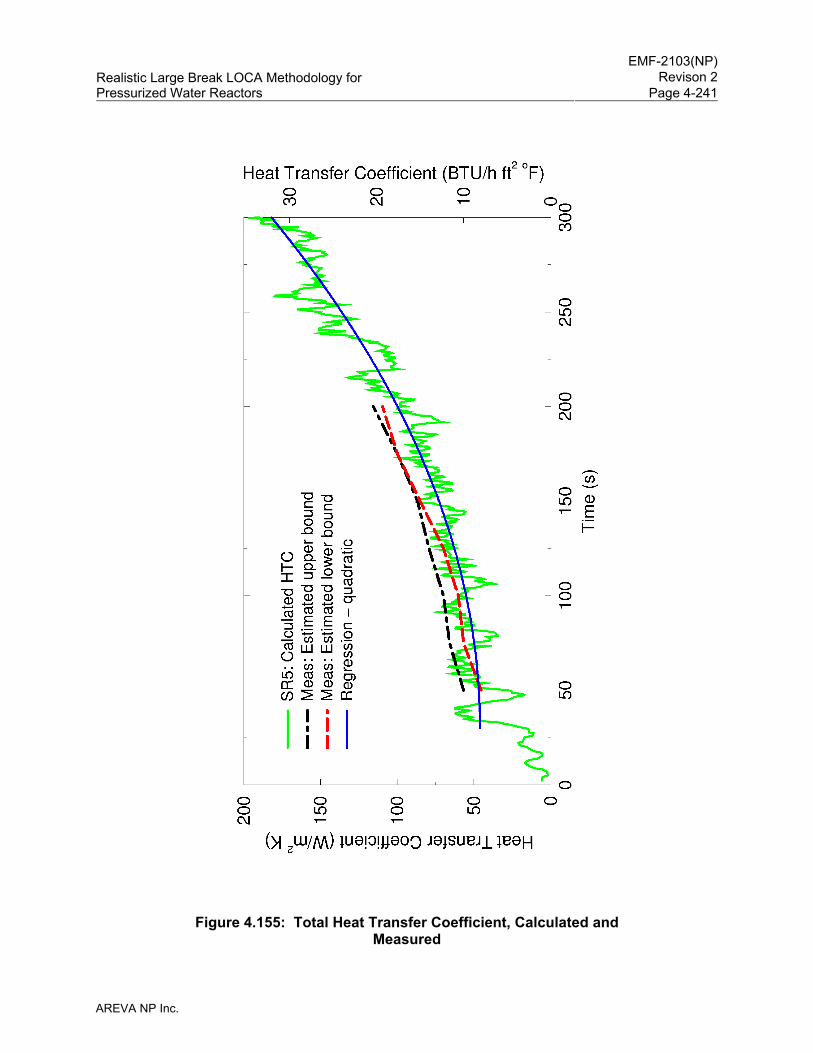
EMF-2103(NP)
Revison 2Realistic Large Break LOCA Methodology for Pressurized Water Reactors Page 4-241
AREVA NP Inc.
Figure 4.155: Total Heat Transfer Coefficient, Calculated and Measured
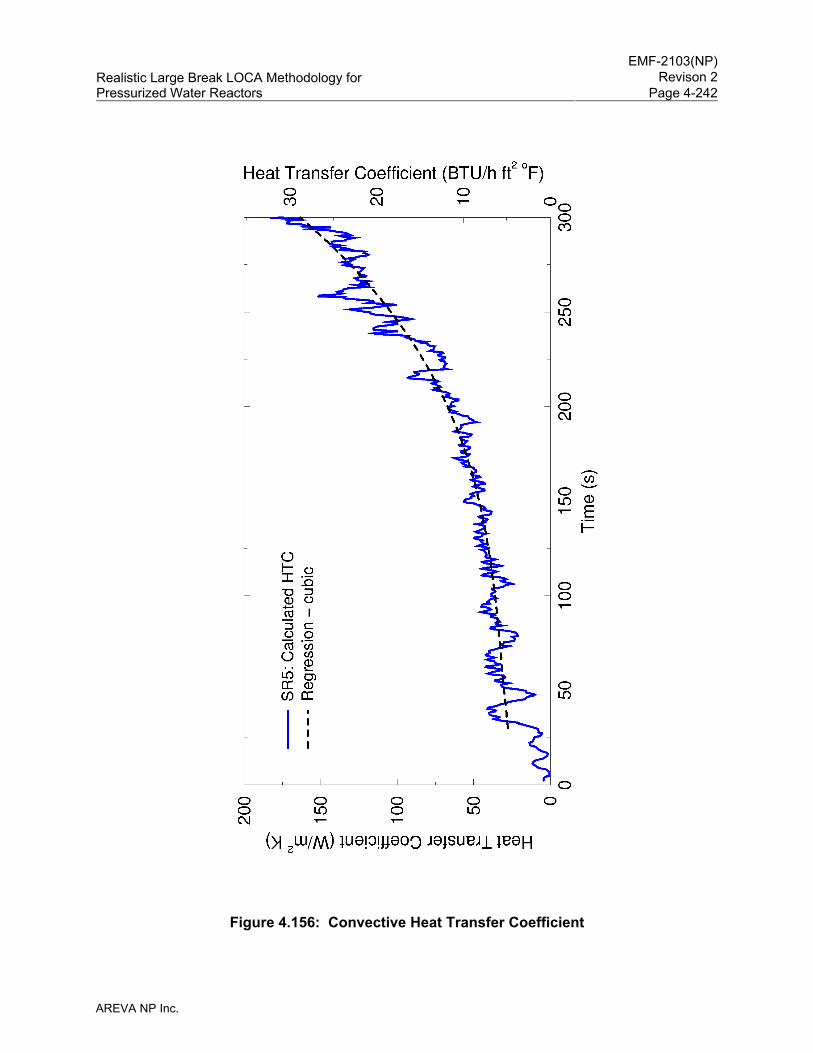
EMF-2103(NP)
Revison 2Realistic Large Break LOCA Methodology for Pressurized Water Reactors Page 4-242
AREVA NP Inc.
Figure 4.156: Convective Heat Transfer Coefficient
EMF-2103(NP)
Revison 2Realistic Large Break LOCA Methodology for Pressurized Water Reactors Page 4-243
AREVA NP Inc.
4.3.2 Integral Effects Tests
The SETs presented in Section 4.3.1 assess the code capability and provide information to
quantify the uncertainty to predict specific phenomena identified by the PIRT. In addition to the
SETs, assessments are performed for IETs to evaluate the overall code capability to predict the
integrated LBLOCA scenario and the interacting phenomena in facilities of differing scale.
Some of the tests conducted using the facilities discussed with the SETs, such as SCTF, CCTF,
and UPTF are large scale and include integral interacting-phenomena effects. However, these
tests are still limited in that only a portion of the RLBLOCA scenario is addressed. For this
reason, AREVA regarded these tests as SETs.
IETs covering the entire RLBLOCA scenario were performed in the LOFT facility and the
smaller scale Semiscale test facility. AREVA assessed tests from both of these facilities [
] These assessments are
reported in detail in Reference 5 and are summarized in the following sections.
4.3.2.1 LOFT Assessments
Assessments of LOFT Tests L2-3, L2-5, LP-02-6, and LP-LB-1 were performed to justify the use
of AREVA's RLBLOCA methodology and the S-RELAP5 code developed by AREVA for realistic
analysis of LBLOCA. The assessment results demonstrate the accuracy of the COPERNIC2,
RODEX3A, and S-RELAP5 codes, and their capability of simulating LBLOCA phenomena
observed during the LOFT tests. The RODEX3A and S-RELAP5 codes were assessed with the
LOFT tests in the previous RLBLOCA methodology, Reference 6. Steady-state exposure
results were compared between the COPERNIC2 and RODEX3A models with differences being
consistent with the different physical models used in the two fuel codes. In this assessment,
COPERNIC2 is used. Although COPERNIC2 is not speficically approved for use with Zircaloy
clad fuel, the physical models in COPERNIC2 do not exclude the use of Zircaloy cladding.
Consequently, the LOFT assessment demonstrates the adequacy of the combined S-RELAP5
and COPERNIC2 codes in the LBLOCA scenario.
EMF-2103(NP)
Revison 2Realistic Large Break LOCA Methodology for Pressurized Water Reactors Page 4-244
AREVA NP Inc.
4.3.2.1.1 LOFT Facility
The LOFT facility was an NRC-sponsored 50 MWt PWR nuclear experimental test facility
designed to simulate the nuclear and thermal-hydraulic phenomena that take place in a
Westinghouse 4-loop PWR during a hypothetical LBLOCA. The LOFT results are widely used
to validate thermal-hydraulic codes that analyze PWR accident and transient phenomena. Key
LOFT LBLOCA tests are included in the CSAU assessment matrix (Reference 4) and
RELAP5/MOD3 developmental assessment matrix. LOFT assessments were performed to
verify RELAP5/MOD2 and MOD3 by various members of the NRC-sponsored International
Code Assessment Program (Reference 30).
The facility included five major subsystems, an intact loop, a broken loop, a reactor vessel, an
emergency core cooling system, and a blowdown suppression system. The LOFT facility was
fully instrumented so that system parameters could be measured during the tests.
The LOFT reactor had a single active intact loop that simulated the combined three intact loops
of a Westinghouse 4-loop PWR. The intact loops included an active steam generator, two
reactor coolant pumps (RCP) in parallel, a pressurizer, a loop seal, and connecting piping.
The broken loop in the LOFT facility was an inactive flow loop during normal operation. The
loop consisted of a hot leg, a steam generator simulator, a pump simulator, and a cold leg. It
became an active flow loop and simulated the broken loop of a 4-loop PWR during LOCA tests.
The broken loop cold leg (BLCL) was divided into two parts: a pump side that connected the
pump simulator to the blowdown suppression system, and a vessel side that connected the
vessel downcomer to the blowdown suppression system. The steam generator and pump
simulators provided flow resistances representative of a PWR during a LOCA. Both sides of the
broken cold legs contained quick-opening blowdown valves that opened to initiate the transient.
The LOFT reactor vessel had an annular downcomer, a lower plenum, below core hardware, a
nuclear core, above core hardware, and an upper plenum. The downcomer was connected to
the intact and broken cold legs and the upper plenum was connected to the hot legs. The core
contained 1300 fuel rods arranged in five square (15x15) and four triangular (corner)
assemblies with an average linear heat generation rate (LHGR) of about 7.0 kW/ft at full power.
The LOFT fuel rods and pitch were typical of a PWR 15x15 fuel rod array, except that the active
length was only 1.68 meters (5.5 feet) compared to a typical value of 3.66 meters (12 feet). For
EMF-2103(NP)
Revison 2Realistic Large Break LOCA Methodology for Pressurized Water Reactors Page 4-245
AREVA NP Inc.
Tests L2-5, LP-02-6, and LP-LB-1, all the fuel rods in the central assembly (except the outside
row) were pressurized with helium to 2.51 MPa (350 psig) and all the fuel rods in the peripheral
assemblies were unpressurized. For Test L2-3, all of the fuel rods were unpressurized.
The LOFT intact loop had two separate ECCSs connected to the cold leg. Each system
contained an accumulator, a HHSI, and a LHSI. Only one set of the pumped injection systems
were used during a LOCA test; the other set was used as backup for plant protection in case of
unplanned emergency situations that might occur during the test. The ECCS was not
connected to the broken loop. For the LBLOCA tests, ECC was injected into the intact loop cold
leg (ILCL). The HHSI and LHSI were connected to the accumulator injection piping. The LOFT
blowdown suppression system consisted of a header and a suppression tank that simulated the
PWR containment pressure and temperature environment expected to occur during a LBLOCA.
The LOFT facility was designed with a primary system volume-to-core power ratio similar to that
of a PWR. The design objective for the LOFT facility was to produce, on a reduced scale, the
significant thermal-hydraulic phenomena with representative conditions and a representative
sequence of events that could occur in a PWR during postulated LOCAs. Volumetric scaling
generally was used for the design of LOFT components. Primary system components (e.g.,
lower plenum, core region, upper plenum, outlet piping, steam generator, and inlet piping) also
were designed with relative volumes equivalent to those in a PWR. LOFT is a reduced-scale
facility that is not uniformly scaled. Therefore, scaling distortions exist that must be considered
when applying the results of the LOFT tests.
The accumulator gas volume is scaled so that the ratio of accumulator gas volume to
accumulator liquid volume injected is made equal to that of a typical 4-loop PWR by adjusting
the standpipe height. The LOFT accumulator liquid volume is scaled to represent three of the
four accumulators of a typical 4-loop PWR, assuming that the liquid in the fourth accumulator is
lost out of the break. The LOFT HHSI flow rate for the LBLOCA tests is volume-ratio scaled
using the ratio of the LOFT to PWR total primary system fluid volume plus the single failure
criterion and the assumption that flow from one of four lines of injection is lost out of the break.
The LHSI flow rate is scaled based on the combined downcomer and core flow areas. The
single failure criterion and the assumption that flow from one of four injection lines is lost out of
the break are also used for LHSI scaling.
EMF-2103(NP)
Revison 2Realistic Large Break LOCA Methodology for Pressurized Water Reactors Page 4-246
AREVA NP Inc.
The major differences between the LOFT and a Westinghouse 4-loop PWR are:
• The LOFT facility has one active operating (intact) loop and a passive blowdown (broken)
loop with only a steam generator simulator and a pump simulator, while the PWR has four
operating loops.
• The LOFT facility has two pumps connected in parallel in the operating loop, while the PWR
has only a single pump in each loop.
• The LOFT core has a 1.68 meter (5.5 feet) active fuel length, while PWR core lengths are
typically 3.66 meter (12 feet). The axial power distribution of the LOFT core is similar to a
beginning-of-life, bottom-skewed power distribution in a PWR core.
• The LOFT facility has a short steam generator relative to a PWR.
• The LOFT cold leg ECC injection location is close to the vessel inlet, while the PWR ECC
injection lines are located near the pump outlet.
• Axial lengths and elevations of hydraulic components are not preserved relative to a PWR.
The LOFT scaling philosophy was to reduce the component coolant volume and flow areas by
the core power ratio. The volume and power scaling was not achieved completely, and vertical
scaling was not preserved. Despite these component differences and scaling distortions, the
LOFT components were functionally similar to those of a PWR and provide sufficient similarity
to permit the LOCA data to be used to validate the ability of the S-RELAP5 code to properly
evaluate PWR LOCA/ECCS performance.
4.3.2.1.2 LOFT Test Descriptions
AREVA selected four LOFT LBLOCA tests (L2-3, L2-5, LP-02-6, and LP-LB-1) for assessment
with S-RELAP5. Key test parameters are provided in Table 4.16. All of the selected tests
simulate cold leg guillotine breaks. The major differences between these tests are: L2-3 and
L2-5 were initiated from about 75 percent power while LP-02-6 and LP-LB-1 were initiated from
nearly full power. The RCP flywheels were not attached during the coastdown of Tests L2-5
and LP-LB-1, but were attached when the pump speed was above 750 rpm (78.54 rad/s) in
Test LP-02-6 and were left running for Test L2-3. These tests were used to validate the
S-RELAP5 code for the blowdown, refill, and reflood phases of a LBLOCA. The tests were
selected for S-RELAP5 assessment for the following reasons:
EMF-2103(NP)
Revison 2Realistic Large Break LOCA Methodology for Pressurized Water Reactors Page 4-247
AREVA NP Inc.
• The boundary conditions and the initial test conditions most closely simulate the "design
basis accident" LOCA conditions for typical Westinghouse 4-loop PWR.
• Test L2-3 provides scaling data when compared to Semiscale Test S–06-3.
• The LOCA phenomenology for Tests L2-5 and LP-LB-1 is similar to that expected for a
Westinghouse 3-Loop PWR, and the LOCA phenomenology for Test LP-02-6 is similar to
that expected for a Westinghouse 4-Loop PWR.
• Test L2-3 was designated as United States Standard Problem 10 for code assessment by
the NRC.
• Test L2-5 was designated as ISP 13 for code assessment by the Organization for Economic
Cooperation and Development.
• Other code assessment calculations of L2-5, LP-02-6, and LP-LB-1 are available for
comparison.
4.3.2.1.3 LOFT Assessment Summary
The LOFT assessment calculations were performed with an input model developed to be
consistent with the nodalization to be applied for PWR plant calculations. For the LOFT
benchmarks a nodalization scheme (in terms of number and distribution of volumes, junctions,
heat structures, and input specifications) corresponding to the RLBLOCA evaluation model was
used to represent corresponding components in the LOFT and plant models. Exceptions are
made only where significant LOFT geometry differences justify a different, but consistent
scheme.
Reference 5 contains detailed comparisons of the results of the LOFT L2-3, L2-5, LP-02-6, and
LP-LB-1 tests with calculated results using the RLBLOCA evaluation model. The LOFT
benchmark results demonstrate the ability of S-RELAP5 to realistically simulate the key system
phenomena relevant to a LBLOCA that were observed in the LOFT LBLOCA tests. These
include: (1) system depressurization, (2) core flow reversal and core dry-out, or CHF, (3) the
fuel cladding temperature excursion and PCT, (4) two-phase pump flow and critical flows at the
breaks, (5) prevention of core bottom-up quench during the early blowdown period, (6) ECC
downcomer penetration and bypass, and (7) core refill, reflood, and final quench.
EMF-2103(NP)
Revison 2Realistic Large Break LOCA Methodology for Pressurized Water Reactors Page 4-248
AREVA NP Inc.
As shown by the results presented in Reference 5, the RLBLOCA evaluation model produced
results in good agreement with the observations for LOFT tests L2-3, L2-5, LP-02-6, and
LP-LB-1. The results are summarized as follows:
• The COPERNIC2-calculated fuel initial centerline fuel temperatures were within 10 percent
of the measured data.
• The S-RELAP5 code results agree with the hydraulic responses of the LOFT tests. That is,
the calculated results were: (1) within measured uncertainties or followed the major trends of
the data, if not within measured uncertainties, or (2) conservative with respect to the data, if
the phenomena were not simulated. The intact loop mass flow rates, broken loop break
flow, and loop volume densities were all well calculated. Coolant temperatures also were
well calculated. Pressurizer draining was overpredicted, but because the pressurizer liquid
tended to flow to the broken loop and was removed from the system, that trend produced
conservative results. Calculated pump speeds were accurately predicted up to the time
where a two-phase mixture appeared, after which the pump speeds were lower than the
measured data and, thus, acceptable.
• The code accurately calculated the thermal response (fuel centerline temperature and
cladding temperature). The centerline temperatures closely match the data. The cladding
temperature results generally were in reasonable agreement with the measured data. The
hot rod PCT is well calculated, considering test measurement uncertainty. The cladding
quench times are significantly delayed with respect to the measured data. The early
bottom-up core quenching found in Tests L2-3 and LP-02-6 was not simulated in the code
calculations. The upper regions of the core showed delayed dry-out with respect to the test
data. However, once the upper regions went through dry-out, the calculated rewet was
much later than measured. In general, the code predicted higher than measured
temperatures in the middle core region, lower than measured temperatures in the upper
core region, and approximately measured temperatures in the lower core region. In all
cases, the calculated PCT was either within or greater than the measured PCT with
analytical uncertainties included. The measured PCT is reported with the fin cooling bias
applied (Reference 70), and shown separately on the PCT versus core elevation plots.
• The calculated ECC injection rates for the low pressure safety injection (LPSI) system and
accumulator tended to underpredict the measured data and, hence, are acceptable.
EMF-2103(NP)
Revison 2Realistic Large Break LOCA Methodology for Pressurized Water Reactors Page 4-249
AREVA NP Inc.
4.3.2.1.4 LOFT Test L2-3 Assessment
Test L2-3 was the second LBLOCA test conducted in the LOFT facility. The test represented a
hypothetical cold leg guillotine break that simulated a double-ended, offset, shear break in a
4-loop PWR. The test was initiated at 75 percent thermal power (36 MWt) and a 12.22 kW/ft
LHGR.
Table 4.17 shows the measured and calculated event times for LOFT Test L2-3, while
Figure 4.157 compares the calculated and measured PCT versus core elevation. This figure
refers to the PCT as a maximum cladding surface temperature, either calculated or measured at
the various locations, during the LOCA transient history. The highest PCT of 942 K (1236 °F)
was measured at the 15 inch elevation while the calculated PCT was 993 K (1328 °F).
4.3.2.1.5 LOFT Test L2-5 Assessment
Test L2-5 was the third LBLOCA test conducted in the LOFT facility. The test represented a
hypothetical cold leg guillotine break that simulated a double-ended, offset, shear break in a
typical 4-loop PWR. The test was initiated at 75 percent thermal power (36 MWt) and a
12.22 kW/ft maximum LHGR.
Table 4.18 shows the measured and calculated event times for LOFT Test L2-5 while
Figure 4.158 depicts the final comparison of the calculated and measured PCT versus core
elevation. The highest LOFT test reportable PCT of 1106 K (1531 °F) was measured at the
24 inch elevation and the calculated PCT of 1088 K (1499 °F) only slightly underpredicts the
measured PCT in the high-power core region and, thereby, the results are considered to be in
reasonable agreement with the data.
4.3.2.1.6 LOFT Test LP-02-6 Assessment
LOFT Test LP-02-6 was the fourth LOFT nuclear powered core LBLOCA test conducted with
pressurized nuclear fuel rods and with a specification of minimum U.S. ECC injection rates. The
maximum LHGR of 14.87 kW/ft was the typical technical specification currently used for
licensing analyses of PWR fuel rods with the same approximate pellet diameter used in a 15x15
fuel pin array. Test LP-02-6 represented an NRC "design basis accident" test and was
supposed to run at 100 percent power, 50 MWt, but because of questions concerning the
integrity of the pressurized fuel rods in the central hot assembly, the power level was reduced to
EMF-2103(NP)
Revison 2Realistic Large Break LOCA Methodology for Pressurized Water Reactors Page 4-250
AREVA NP Inc.
mitigate possible safety problems. Test LP-02-6 is an important LBLOCA test for code
assessment because it addresses the issues relating to safety margins associated with the
response of a PWR to the NRC "design basis accident" scenario, including delayed minimum
ECC safeguards.
Test LP-02-6 simulated a cold leg guillotine break coincident with a loss-of-offsite power. It was
conducted with a delayed and degraded high and low pressure ECC injection. During the test,
the RCPs were tripped and coasted down with their flywheels attached. The result was an early
partial core rewet from the bottom up. When RCP speed dropped below 750 rpm (78.54 rad/s),
the flywheels were uncoupled from the pumps to increase the pump speed deceleration. The
attached flywheels produced pump coast down characteristics typical of a commercial
Westinghouse 4-loop PWR.
Before the initiation of blowdown, the power level in the reactor core was steadily increased and
then held at 46 MWt ± 1.2 MWt to ensure an appropriate decay heat power level would be
obtained once the control rods were inserted into the reactor core. Table 4.19 shows the
measured and calculated event times for LOFT Test LP-02-6 while Figure 4.159 compares the
calculated and measured PCT versus core elevation. The highest PCT of 1105.0 K (1530 °F)
was measured at the 26 inch elevation while the calculated PCT was 1135 K (1584 °F).
4.3.2.1.7 LOFT Test LP-LB-1 Assessment
The fifth LOFT LOCA test, LP-LB-1, simulated a hypothetical double-ended cold leg guillotine
break initiated from conditions representative of a PWR operating near its licensing limits. The
initial core power was near the facility design limit of 50 MWt with maximum LHGR of
15.8 kW/ft. Included in the boundary conditions of the test were loss-of-offsite power coincident
with the LOCA, a rapid RCP coastdown, and a minimum safeguard ECCS injection assumption
from a European PWR. To minimize possible fuel pin damage, all of the fuel rods in the core
were initially unpressurized.
Table 4.20 shows the measured and calculated event times for LOFT Test LP-LB-1 while
Figure 4.160 compares the calculated and measured PCT versus core elevation. The
measured PCT is 1284.0 K (1852 °F) at the 24 inch elevation with a calculated maximum PCT
of 1297 K (1875 °F).
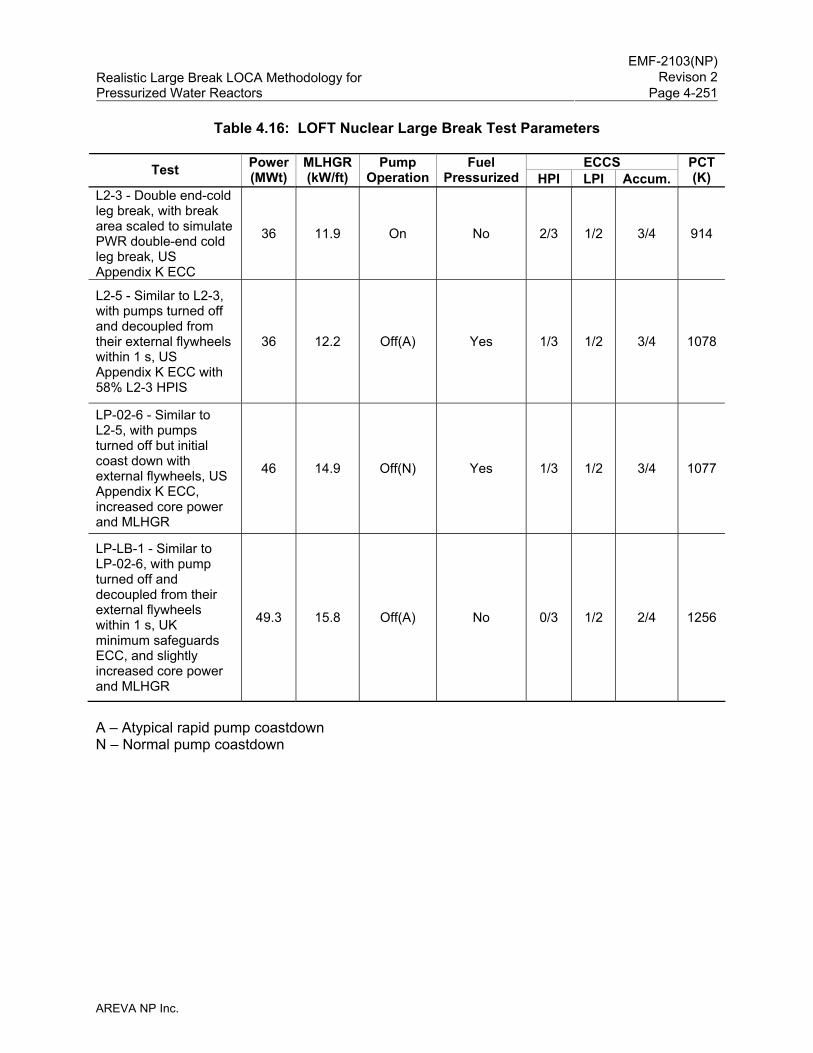
EMF-2103(NP)
Revison 2Realistic Large Break LOCA Methodology for Pressurized Water Reactors Page 4-251
AREVA NP Inc.
Table 4.16: LOFT Nuclear Large Break Test Parameters
ECCS Test Power (MWt)
MLHGR(kW/ft)
Pump Operation
Fuel Pressurized HPI LPI Accum.
PCT(K)
L2-3 - Double end-cold leg break, with break area scaled to simulate PWR double-end cold leg break, US Appendix K ECC
36 11.9 On No 2/3 1/2 3/4 914
L2-5 - Similar to L2-3, with pumps turned off and decoupled from their external flywheels within 1 s, US Appendix K ECC with 58% L2-3 HPIS
36 12.2 Off(A) Yes 1/3 1/2 3/4 1078
LP-02-6 - Similar to L2-5, with pumps turned off but initial coast down with external flywheels, US Appendix K ECC, increased core power and MLHGR
46 14.9 Off(N) Yes 1/3 1/2 3/4 1077
LP-LB-1 - Similar to LP-02-6, with pump turned off and decoupled from their external flywheels within 1 s, UK minimum safeguards ECC, and slightly increased core power and MLHGR
49.3 15.8 Off(A) No 0/3 1/2 2/4 1256
A – Atypical rapid pump coastdown N – Normal pump coastdown
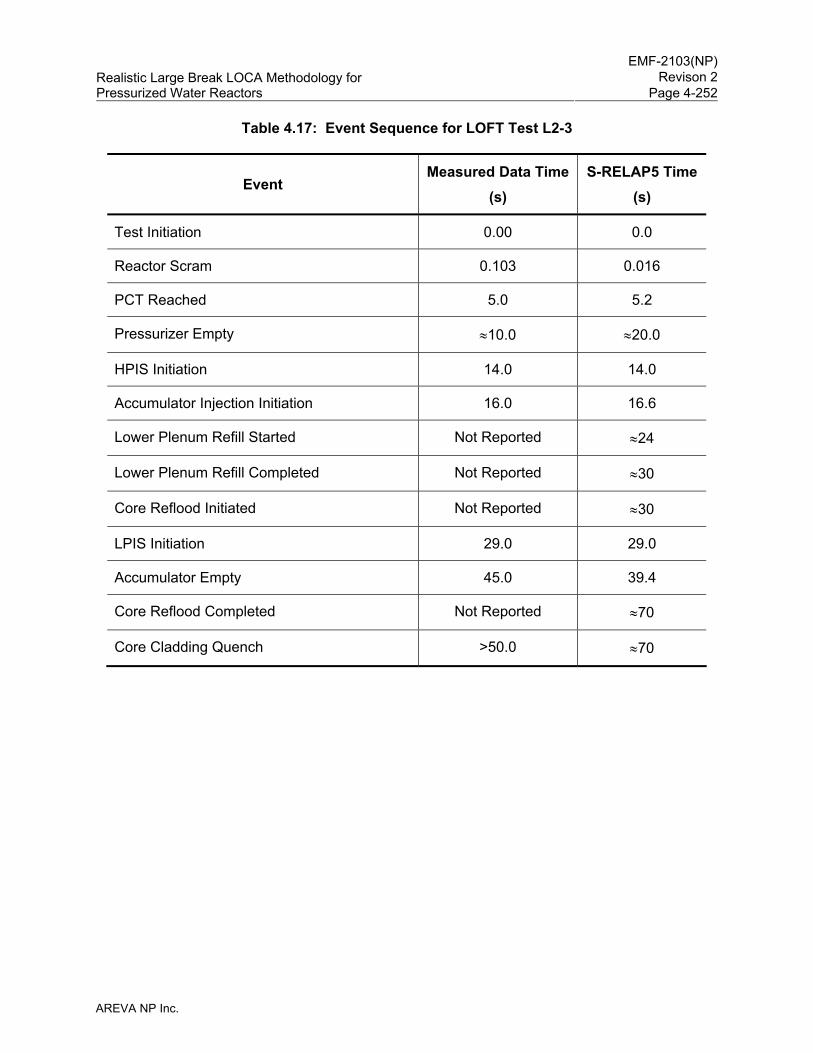
EMF-2103(NP)
Revison 2Realistic Large Break LOCA Methodology for Pressurized Water Reactors Page 4-252
AREVA NP Inc.
Table 4.17: Event Sequence for LOFT Test L2-3
Event Measured Data Time
(s) S-RELAP5 Time
(s)
Test Initiation 0.00 0.0
Reactor Scram 0.103 0.016
PCT Reached 5.0 5.2
Pressurizer Empty ≈10.0 ≈20.0
HPIS Initiation 14.0 14.0
Accumulator Injection Initiation 16.0 16.6
Lower Plenum Refill Started Not Reported ≈24
Lower Plenum Refill Completed Not Reported ≈30
Core Reflood Initiated Not Reported ≈30
LPIS Initiation 29.0 29.0
Accumulator Empty 45.0 39.4
Core Reflood Completed Not Reported ≈70
Core Cladding Quench >50.0 ≈70
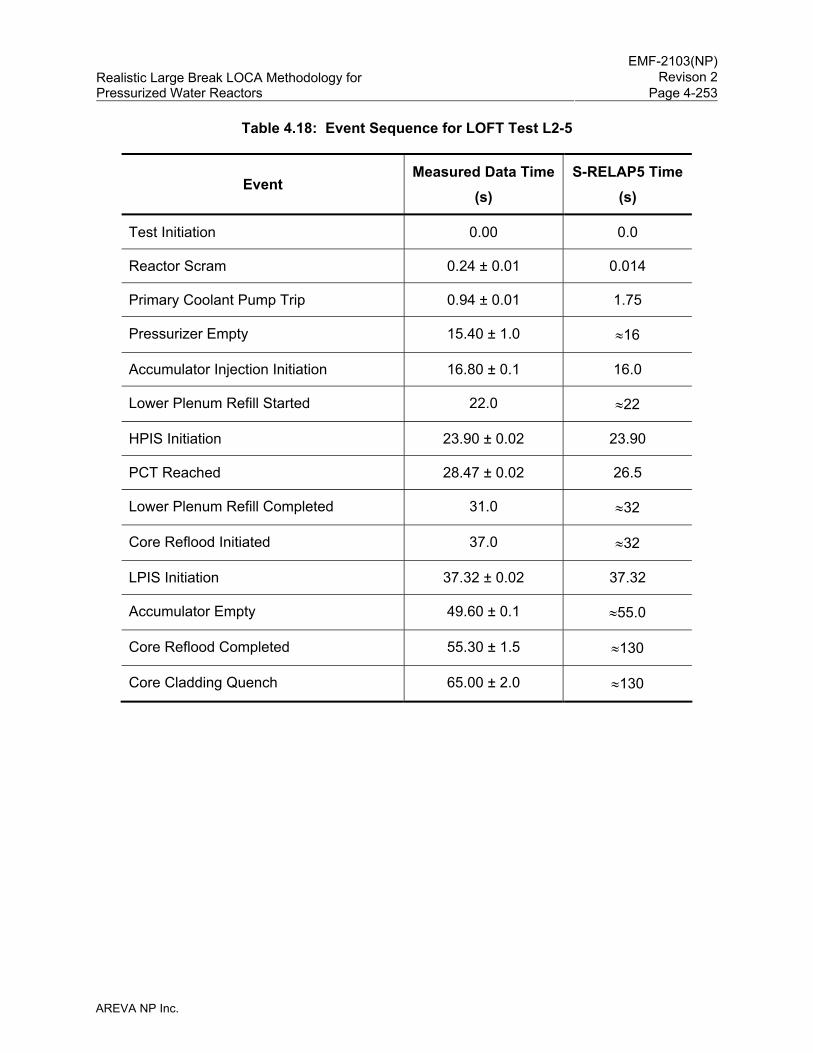
EMF-2103(NP)
Revison 2Realistic Large Break LOCA Methodology for Pressurized Water Reactors Page 4-253
AREVA NP Inc.
Table 4.18: Event Sequence for LOFT Test L2-5
Event Measured Data Time
(s) S-RELAP5 Time
(s)
Test Initiation 0.00 0.0
Reactor Scram 0.24 ± 0.01 0.014
Primary Coolant Pump Trip 0.94 ± 0.01 1.75
Pressurizer Empty 15.40 ± 1.0 ≈16
Accumulator Injection Initiation 16.80 ± 0.1 16.0
Lower Plenum Refill Started 22.0 ≈22
HPIS Initiation 23.90 ± 0.02 23.90
PCT Reached 28.47 ± 0.02 26.5
Lower Plenum Refill Completed 31.0 ≈32
Core Reflood Initiated 37.0 ≈32
LPIS Initiation 37.32 ± 0.02 37.32
Accumulator Empty 49.60 ± 0.1 ≈55.0
Core Reflood Completed 55.30 ± 1.5 ≈130
Core Cladding Quench 65.00 ± 2.0 ≈130
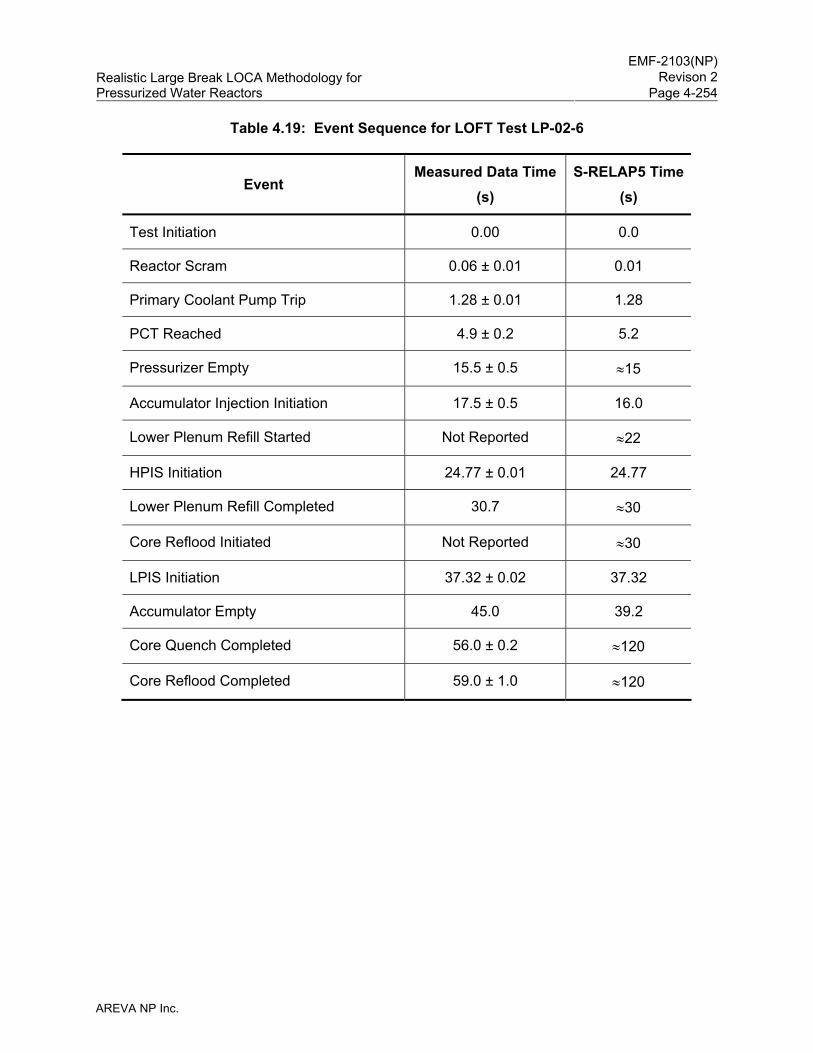
EMF-2103(NP)
Revison 2Realistic Large Break LOCA Methodology for Pressurized Water Reactors Page 4-254
AREVA NP Inc.
Table 4.19: Event Sequence for LOFT Test LP-02-6
Event Measured Data Time
(s) S-RELAP5 Time
(s)
Test Initiation 0.00 0.0
Reactor Scram 0.06 ± 0.01 0.01
Primary Coolant Pump Trip 1.28 ± 0.01 1.28
PCT Reached 4.9 ± 0.2 5.2
Pressurizer Empty 15.5 ± 0.5 ≈15
Accumulator Injection Initiation 17.5 ± 0.5 16.0
Lower Plenum Refill Started Not Reported ≈22
HPIS Initiation 24.77 ± 0.01 24.77
Lower Plenum Refill Completed 30.7 ≈30
Core Reflood Initiated Not Reported ≈30
LPIS Initiation 37.32 ± 0.02 37.32
Accumulator Empty 45.0 39.2
Core Quench Completed 56.0 ± 0.2 ≈120
Core Reflood Completed 59.0 ± 1.0 ≈120
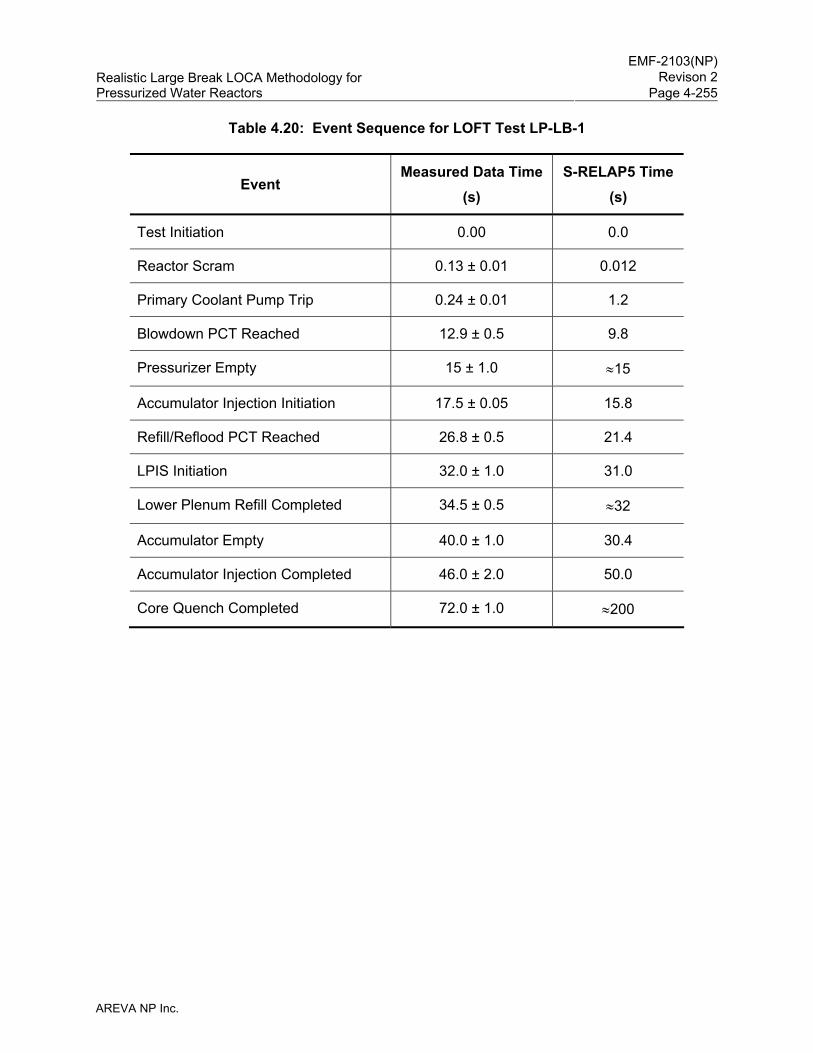
EMF-2103(NP)
Revison 2Realistic Large Break LOCA Methodology for Pressurized Water Reactors Page 4-255
AREVA NP Inc.
Table 4.20: Event Sequence for LOFT Test LP-LB-1
Event Measured Data Time
(s) S-RELAP5 Time
(s)
Test Initiation 0.00 0.0
Reactor Scram 0.13 ± 0.01 0.012
Primary Coolant Pump Trip 0.24 ± 0.01 1.2
Blowdown PCT Reached 12.9 ± 0.5 9.8
Pressurizer Empty 15 ± 1.0 ≈15
Accumulator Injection Initiation 17.5 ± 0.05 15.8
Refill/Reflood PCT Reached 26.8 ± 0.5 21.4
LPIS Initiation 32.0 ± 1.0 31.0
Lower Plenum Refill Completed 34.5 ± 0.5 ≈32
Accumulator Empty 40.0 ± 1.0 30.4
Accumulator Injection Completed 46.0 ± 2.0 50.0
Core Quench Completed 72.0 ± 1.0 ≈200
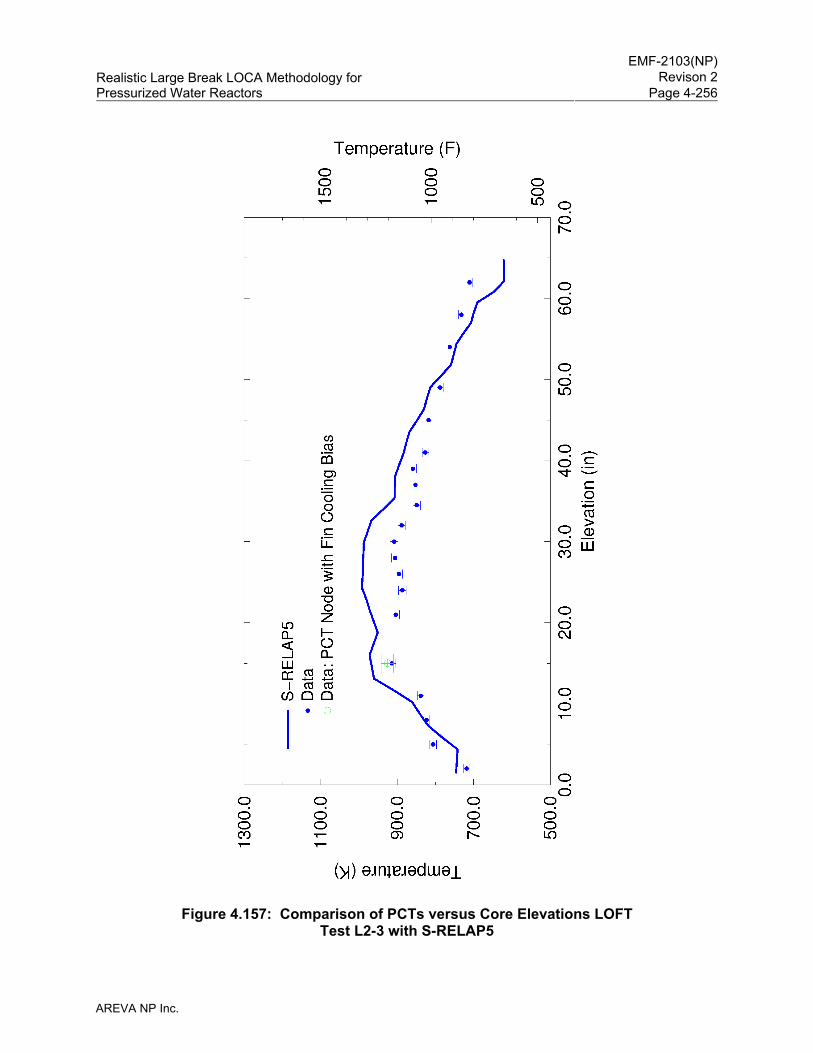
EMF-2103(NP)
Revison 2Realistic Large Break LOCA Methodology for Pressurized Water Reactors Page 4-256
AREVA NP Inc.
Figure 4.157: Comparison of PCTs versus Core Elevations LOFT Test L2-3 with S-RELAP5
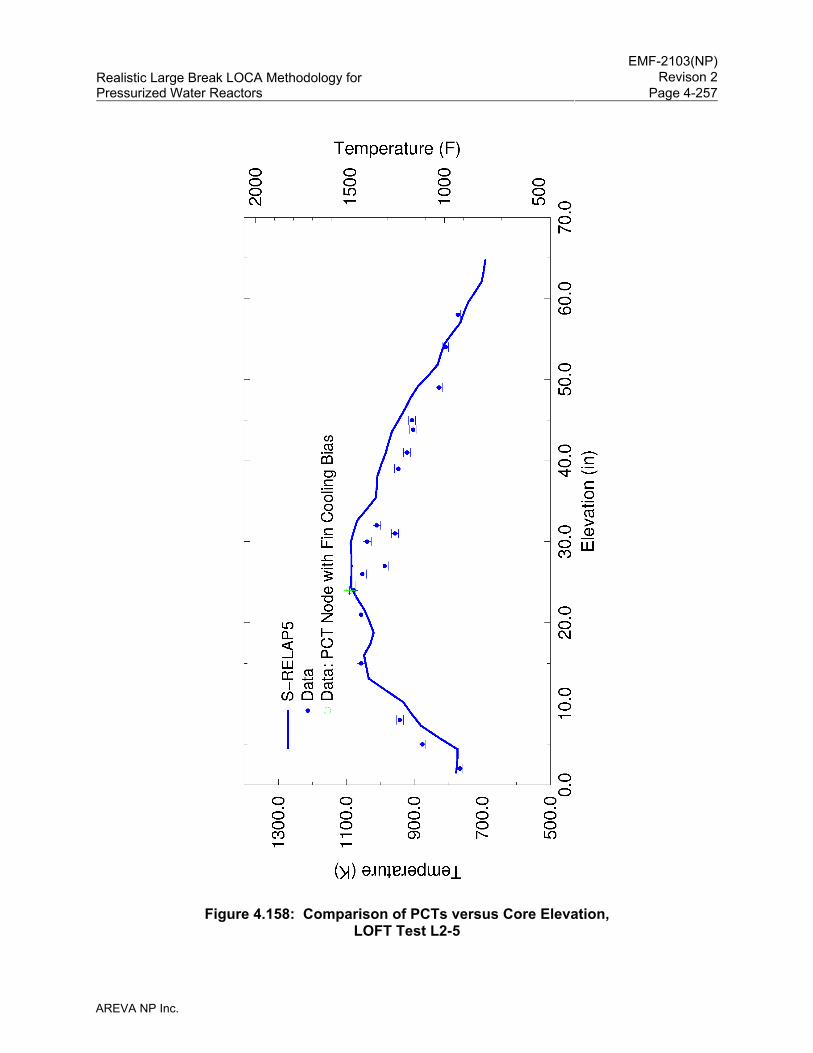
EMF-2103(NP)
Revison 2Realistic Large Break LOCA Methodology for Pressurized Water Reactors Page 4-257
AREVA NP Inc.
Figure 4.158: Comparison of PCTs versus Core Elevation, LOFT Test L2-5
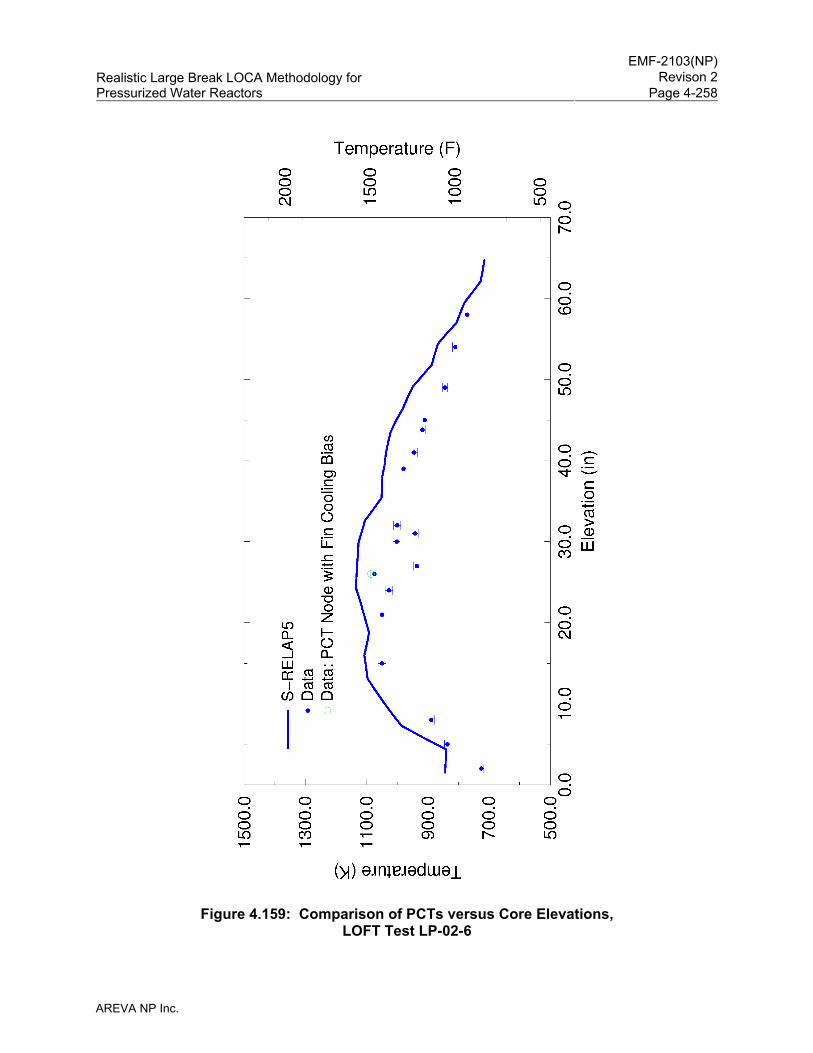
EMF-2103(NP)
Revison 2Realistic Large Break LOCA Methodology for Pressurized Water Reactors Page 4-258
AREVA NP Inc.
Figure 4.159: Comparison of PCTs versus Core Elevations, LOFT Test LP-02-6
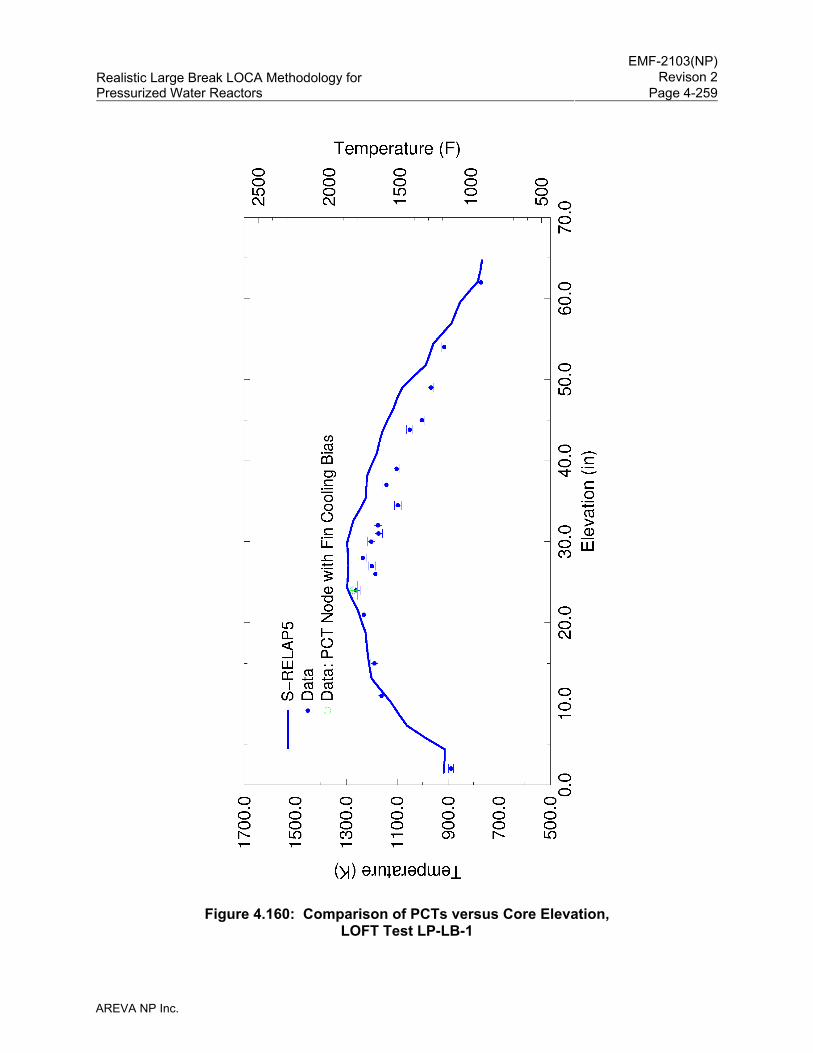
EMF-2103(NP)
Revison 2Realistic Large Break LOCA Methodology for Pressurized Water Reactors Page 4-259
AREVA NP Inc.
Figure 4.160: Comparison of PCTs versus Core Elevation, LOFT Test LP-LB-1
EMF-2103(NP)
Revison 2Realistic Large Break LOCA Methodology for Pressurized Water Reactors Page 4-260
AREVA NP Inc.
4.3.2.2 Semiscale Tests
S-RELAP5 was assessed against Semiscale LBLOCA tests S-06-3 and S-07-1. Test S-06-3
was performed in the Semiscale MOD-1 facility. The MOD-1 facility was scaled from the LOFT
facility. Test S-06-3 was performed as a counterpart to LOFT Test L2-3 and provides
assessment for the blowdown, refill, and reflood phases of a LBLOCA. The results presented
for this assessment are used to verify the capability of the S-RELAP5 code to calculate integral
LOCA phenomena in facilities of different scale.
Semiscale Test S-07-1 is a blowdown test performed in the Semiscale MOD-3 facility with cold
leg ECC injection. The results presented for this assessment are used to verify the capability of
the code to calculate blowdown film boiling heat transfer in the core.
Both assessments are presented in detail in Section 4.2 of Reference 5.
4.3.2.2.1 Semiscale Facilities
MOD-1 Facility
The Semiscale MOD-1, 1½-loop facility was scaled to the LOFT facility, which in turn was
scaled to a 4-loop PWR. It is designated as a 1½-loop system because it is configured with one
active loop and one passive blowdown loop. Subsequent Semiscale facilities have included
components that have made the facility more typical of a PWR. All the other Semiscale facilities
were designed with 1/1600 to 1/2000 volume scaling, with full height, in reference to a 4-loop,
3400 MWt PWR.
The MOD-1 system contains a reactor vessel with internals, including a 40-rod electrically
heated core, an active intact loop scaled to represent three loops of a PWR, and a broken loop
scaled to a single loop of a PWR. The intact loop contains an active steam generator, an active
RCP, and a pressurizer. The broken loop contains hydraulic steam generator and pump
simulators, and break simulators or rupture assemblies connected to a blowdown suppression
system. The blowdown suppression system simulates containment pressure.
The 40-rod electrically heated core has a PWR fuel pin pitch of 0.563 inches, a heated length of
5.5 feet, and an outside diameter of 0.42 inches. They are identical to the nuclear fuel rods of
the LOFT core.
EMF-2103(NP)
Revison 2Realistic Large Break LOCA Methodology for Pressurized Water Reactors Page 4-261
AREVA NP Inc.
Semiscale Test Series 6 was performed to assist the LOFT program in planning the first nuclear
test series. Test S-06-3 was performed as a counterpart to LOFT Test L2-3. For this test, the
four central heater rods were operated at approximately 39.4 kW/m, 32 rods were operated at
approximately 24.9 kW/m, and four rods were unpowered to simulate passive rod locations.
This configuration yielded a peaked power profile that simulates that of the LOFT facility and
provides a total core power of 1.004 MWt.
The safety injection includes the HHSI, LHSI, and accumulators. For Test S-06-3, two HHSI
pumps and two LHSI pumps delivered flow into the intact loop cold leg along with the intact loop
accumulator. The RCP was powered for the entire transient.
MOD-3 Facility
The Semiscale MOD-3 facility is constructed with two fully active coolant loops. The intact loop,
retained from the Semiscale MOD-1 system, was scaled to the LOFT facility, which in turn was
scaled to a 4-loop PWR. The broken loop, on the other hand, was scaled directly to a 4-loop
commercial PWR. The Semiscale MOD-3 facility was designed with 1/1600 to 1/2000 volume
scaling and full height, in reference to a 4-loop, 3400 MWt PWR.
The vessel in the MOD-3 system consists of an upper plenum with internals required to
represent guide and support tubes, an upper head, a 25-rod electrically heated core, and an
external single pipe downcomer. The active intact loop is scaled to represent three loops of a
PWR and the active broken loop is scaled to represent a single loop of a PWR. The intact loop
contains a pump and a short Type I steam generator, and is connected to a pressurizer. The
broken loop contains the taller Type II steam generator, a pump simulator, and break simulators
or rupture assemblies connected to a blowdown suppression system. The blowdown
suppression system simulates containment pressure.
The 25-rod electrically heated core is characterized by fuel pin pitch of 0.563 inches and an
outside diameter of 0.422 inches typical of a PWR. The heated length of the MOD-3 core is
12 feet, identical to a 4-loop PWR core.
Test S-07-1 was performed to establish the baseline performance of the MOD-3 system during
a blowdown with cold leg ECC injection. It was conducted to obtain core heat transfer and
departure from nucleate boiling (DNB) characteristics of the heater rods. The MOD-3 system
EMF-2103(NP)
Revison 2Realistic Large Break LOCA Methodology for Pressurized Water Reactors Page 4-262
AREVA NP Inc.
was initialized in the experiment to a primary pressure of 15.95 MPa, total-loop flow of 9.4 kg/s,
and cold-leg temperatures of 559 K for the intact loop and 557 K for the broken loop at a core
power level of 2.01 MWt nominal. The system was subjected to a double-ended cold-leg break
through a rupture assembly and two non-communicative nozzles.
4.3.2.2.2 Semiscale Test Descriptions
Test S-06-3
In Test S-06-3, the MOD-1 system was initialized to a primary pressure of 15.769 MPa, cold leg
temperature of 563 K, and inlet flow of 6.68 l/s (liters per second) at an initial core power level of
1.004 MWt. The system was subjected to a double-ended cold leg break through two rupture
assemblies and two LOFT facility counterpart nozzles, each having a break area of 0.000243 m2
(0.00262 ft2). The effluent from the primary system was ejected into the pressure suppression
system.
After initiating blowdown, power to the heated core was reduced to simulate the predicted heat
flux response of the nuclear fuel rods during a LOCA. Blowdown was accompanied by ECC
injection into the cold leg piping of the intact loop. Coolant injection from the HHSI began at
blowdown and continued until test termination (300 seconds). Coolant injection from the
accumulator started at approximately 18.5 seconds after rupture and terminated at
approximately 90 seconds. LHSI began at 25.5 seconds after rupture, at a pressure of
1900 kPa, and continued until test termination.
Test S-07-1
The specific test conditions simulated in the S-RELAP5 calculation are:
• The 23 rods in the square matrix of the 25-rod electrically heated core were operated at approximately 36.9 kW/m with a flat radial power profile, resulting in a total core power level of 2.01 MWt nominal. One corner rod was unpowered and another corner rod was replaced by a liquid level probe. The normalized axial power profile is a chopped cosine.
• During the blowdown transient, power to the electrically heated core was automatically controlled to simulate the thermal response of nuclear heated fuel rods. The power history is modeled based on the measured core power decay.
EMF-2103(NP)
Revison 2Realistic Large Break LOCA Methodology for Pressurized Water Reactors Page 4-263
AREVA NP Inc.
• The accumulators for the ILCL and BLCL were pressurized with nitrogen to 4137 kPa (600 psia). Intact loop accumulator injection began at 19 seconds and nitrogen discharge began at 72 seconds. BLCL accumulator injection began at 12.5 seconds and nitrogen discharge began at 35 seconds. The ILCL and BLCL accumulator injected flows are modeled based on the measured date. The accumulators are actuated in the calculation on time, not pressure, to match the injection timing of the experiment.
• The simulation extended from the time of pipe rupture until the time before nitrogen injection. The earliest nitrogen was injected at 35 seconds, originating from the BLCL accumulator. Therefore, the simulated transient is 35 seconds long.
• The initial containment pressure is 246 kPa nominal. The transient containment pressure is modeled based on the measured data.
• The maximum break area which is modeled, corresponding to a double-ended break is 0.849 in2 (5.48 cm2). This implies that each of the two blowdown nozzles had a break area of 0.424 in2 (0.849/2) (2.74 cm2). This maximum break area was determined from the ratio of the maximum break area to the primary liquid volume of a PWR system applied to the primary liquid volume of the Semiscale MOD-3 system.
• The intact and broken loop RCPs coast down during the test. The ILCL and BLCL pumps are modeled based on the measured date.
• HHSI flow into the intact and broken loops started at 3.5 seconds at a pressure of 12,410 kPa (1800 psia) and continued until test termination. The ILCL and BLCL HHSI injected flows are modeled based on the measured data. The HHSI pumps are actuated in the calculation on time, not pressure, to match the injection timing of the experiment.
• The LHSI started into the ILCL and BLCL at 27 seconds at a pressure of 2000 kPa (290 psia) and continued until test termination. The ILCL and BLCL LPIS injected flows are modeled based on the measured data. The LPIS pumps are actuated in the calculation on time, not pressure, to match the injection timing of the experiment.
• The measured fluid temperature in the intact loop and broken loop ECCS injection lines indicate that the ECCS (HHSI, LHSI, and accumulator) water temperature is approximately 300 K (80.6 °F). Therefore, the ILCL and BLCL ECCS water are both modeled at a temperature of 300 K.
• The broken loop pump speed was increased by a factor of about 2.5 to match the steady-state flow in the broken loop.
EMF-2103(NP)
Revison 2Realistic Large Break LOCA Methodology for Pressurized Water Reactors Page 4-264
AREVA NP Inc.
• Based on scoping analyses performed for Revision 0 of the RLBLOCA methodology, the discharge coefficients were determined to be (0.80, 1.5) at the pump side and (0.85, 0.7) at the vessel side, where the first value refers to the subcooled discharge coefficient and the second value refers to the two-phase discharge coefficient.
4.3.2.2.3 Test S-06-3 Assessment
The discharge coefficients were set to 1.0 for both the vessel side and pump side break
junctions for both the subcooled and two-phase flows to obtain initial break flow agreement with
the data. Otherwise, the nodalization of the input model was developed to be as consistent as
possible with the RLBLOCA analysis guidelines.
The S-RELAP5 initial condition results match reasonably well with the Semiscale Test S-06-3
data. The detailed comparisons of predicted versus measured results for the important
transient phenomena are shown in Reference 5, and are not repeated here. The calculation
results were compared to test data for the three test phases (blowdown, refill, and reflood).
While reasonable agreement is obtained between code results and data for the major
thermal-hydraulic variables, the MOD-1 Test S-06-3 experienced apparent ECC bypass that
could not be well predicted by the RLBLOCA methodology. This was caused by the small scale
and the proximity of the ECC injection to the break, resulting in earlier refill being calculated and
consequently earlier reflood and quenching of the heater rods. The PCT of 1152 K in the test
occurs at an elevation of 21 inches above the bottom of the heated length at 20.7 seconds after
pipe rupture. The calculated PCT of 1236 K occurs during blowdown at an elevation of
32.3 inches above the bottom of the heated length at 26.8 seconds after pipe rupture.
Figure 4.161 shows the calculated versus measured maximum temperatures as a function of
elevation in the simulated core for Semiscale Test S-06-3.
4.3.2.2.4 Test S-07-1 Assessment
S-RELAP5 was assessed against Semiscale Test S-07-1. The calculation results were
compared to test data. Reasonable to good agreement is obtained between code results and
data for the major thermal-hydraulic variables including upper plenum pressure, break flow
rates, coolant temperatures, and rod temperatures. The comparison demonstrates that
S-RELAP5 is capable of simulating the blowdown film boiling heat transfer phenomena
expected of a PWR LBLOCA transient. In particular, the code conservatively predicted the
EMF-2103(NP)
Revison 2Realistic Large Break LOCA Methodology for Pressurized Water Reactors Page 4-265
AREVA NP Inc.
average of the measured PCTs at all elevations. For instance, the calculated maximum
temperature at an elevation of 72.4 inches is 1118 K compared to the average measured PCT
of 1056 K at this elevation (based on eight thermocouple readings). In addition, the highest
calculated PCT is 1120 K, compared to the highest measured (not average) PCT of 1101 K.
Figure 4.162 shows the calculated versus measured maximum temperatures as a function of
elevation in the simulated core for Semiscale Test S-07-1.
Overall, these assessments show the S-RELAP5 models and correlations are valid for the
prediction of core blowdown and reflooding conditions, and can be used in RLBLOCA
applications.
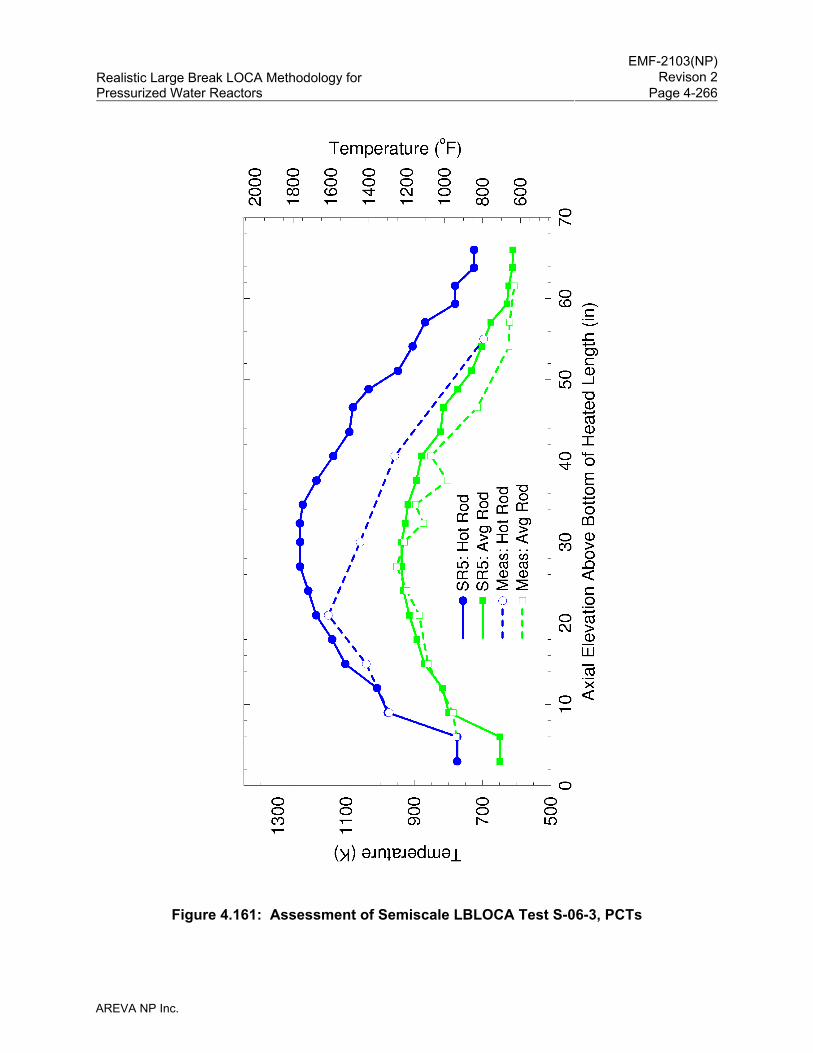
EMF-2103(NP)
Revison 2Realistic Large Break LOCA Methodology for Pressurized Water Reactors Page 4-266
AREVA NP Inc.
Figure 4.161: Assessment of Semiscale LBLOCA Test S-06-3, PCTs
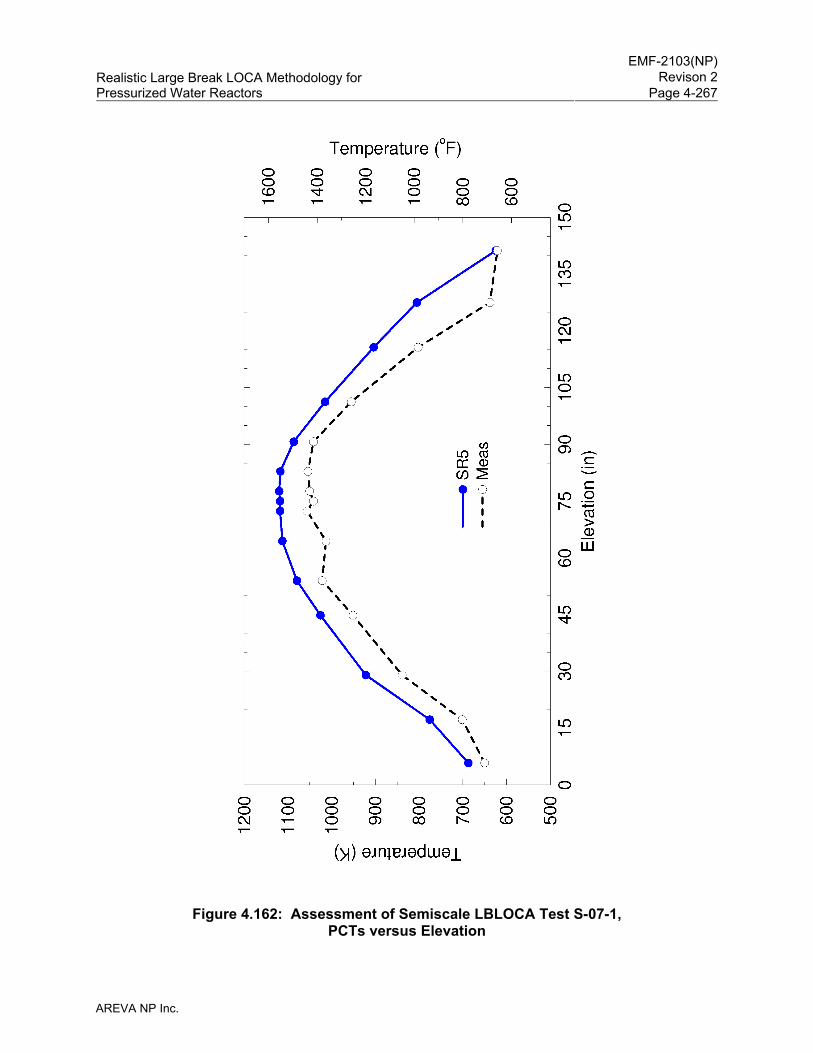
EMF-2103(NP)
Revison 2Realistic Large Break LOCA Methodology for Pressurized Water Reactors Page 4-267
AREVA NP Inc.
Figure 4.162: Assessment of Semiscale LBLOCA Test S-07-1, PCTs versus Elevation
EMF-2103(NP)
Revison 2Realistic Large Break LOCA Methodology for Pressurized Water Reactors Page 4-268
AREVA NP Inc.
4.3.3 Methodology Treatment of PIRT Phenomena
Sections 4.3.1 and 4.3.2 reviewed the extensive assessment of the S-RELAP5 code with regard
to its capability to predict the important phenomena identified in the LBLOCA PIRT. In some
cases statistical information was determined with regard to the mean values and uncertainties
for predicting a specific phenomenon. Much of this information is also contained in Section 5 of
Reference 5. In other cases, S-RELAP5 was shown to calculate the phenomenon
conservatively and no evaluation of a bias or uncertainty was performed. In these situations,
the conservatism associated with these phenomena was simply accepted as unquantified
conservatism in the methodology. Table 4.21 summarizes the important PIRT phenomena and
how those phenomena are being addressed in the methodology.
4.3.3.1 Important PIRT Phenomena Not Treated Statistically
From the comparison of the S-RELAP5 predictions and data for both the SET and IET
assessments, a number of important PIRT phenomena were found to be predicted
conservatively by the code. The conservative predictions were either because of a conservative
model in S-RELAP5 or the use of conservative input. These phenomena are indicated in
Table 4.21 as being treated in the methodology as an "inherent conservatism" or an "input
conservatism." By "inherent conservatism," it is meant that a code model or combination of
models was demonstrated to conservatively predict these phenomena. By "input
conservatism," it is meant that the input being provided to the code was demonstrated to be
conservative and will be used in NPP analyses. These conservatisms are accepted in the
methodology as an unquantified conservatism above that indicated by the statistical analysis.
These phenomena are discussed individually in the following sections.
4.3.3.1.1 Core Multi-Dimensional Flow and Void Distributions
The core flow distribution and void distribution are determined by the initial power distributions
and [
] In
effect this will result in a wide variation of calculated flow and void distributions in the core.
EMF-2103(NP)
Revison 2Realistic Large Break LOCA Methodology for Pressurized Water Reactors Page 4-269
AREVA NP Inc.
The ability of S-RELAP5 to calculate void distributions has been demonstrated in the SET
assessments performed for the THTF Level Swell, the GE Level Swell, the FRIGG-2, the
FLECHT-SEASET and the FLECHT Skewed tests. For all these assessments, the agreement
between code prediction and measured void fractions was good to excellent (Section 4.3.1 and
Reference 5). The THTF and FRIGG-2 tests are high pressure tests and the GE Level Swell
test is a transient depressurization test from high pressure. The FLECHT-SEASET and
FLECHT Skewed test facilities are instrumented to measure ΔPs in the bundle at 12 inch
intervals. At low flow conditions, which typically occur during the reflood phase of a LOCA, the
ΔPs directly give the void distribution in the bundle. The assessments of several
FLECHT-SEASET and FLECHT Skewed tests, discussed in Section 4.3.1 and in Reference 5,
show the code calculated ΔPs agree with the data reasonably well. These assessments
indicate S-RELAP5 is capable of calculating acceptable void distributions in the core at high and
low pressure conditions.
The FLECHT-SEASET tests were also used to calculate the heat transfer biases and
uncertainties. The prediction of flow and void distributions is an integral part of determining the
code heat transfer biases and uncertainties. [
]
The ability of S-RELAP5 to calculate flow distributions in the core was demonstrated in the SET
assessments (Section 4.3.1 and Reference 5) performed for the multi-dimensional flow tests,
CCTF, and SCTF. The multi-dimensional flow tests demonstrated S-RELAP5 was capable of
modeling and predicting the measured flows in these tests. The SCTF tests were conducted
specifically to study the two-dimensional flow behavior in the core region during the reflood
phase of the LOCA. The overall bundle ΔPs and PCTs are good indications of the core flow
distribution. The assessments of several of the SCTF tests show that S-RELAP5 calculated hot
bundle ΔPs and PCTs agree with the data reasonably well. In addition, the calculated void
fraction in the upper region of the hot bundle is somewhat higher than the data. These
assessments demonstrated that the combined code and core nodalization was capable of
predicting the effects of changes in radial power distribution and associated flows during the
reflood period of a LBLOCA.
EMF-2103(NP)
Revison 2Realistic Large Break LOCA Methodology for Pressurized Water Reactors Page 4-270
AREVA NP Inc.
The CCTF assessments further demonstrated that the combined code and core nodalization
were able to predict the core flows, hot bundle ΔPs, and resulting PCTs in a cylindrical facility.
The cylindrical bundle region modeling used is consistent with the input modeling used in the
methodology NPP nodalization.
Based on the information in the previous paragraph, the combination of these assessments
clearly demonstrates S-RELAP5 is capable of realistically predicting the core flows and void
distributions as the statistical parameters are being varied in the statistical analysis of a
LBLOCA.
4.3.3.1.2 Liquid Entrainment in the Core
The liquid entrainment in the core has been demonstrated to be conservatively calculated by
S-RELAP5 and the methodology nodalization. This is shown in the assessments performed for
CCTF, UPTF, and FLECHT-SEASET, and reported in Section 5.6 of Reference 5. In the CCTF
tests examined (Tests 54, 62, 67, and 68), the conclusion was that the liquid entrained from the
core into the upper plenum was overpredicted by S-RELAP5 during the early part of the test.
This overprediction occurred until about 400 to 500 seconds into the test. After that, the code
underpredicted the amount of liquid in the upper plenum. Only after quenching occurred in the
test did the data indicate higher levels. Both the measured and calculated time of PCT occurred
before the calculation began to underpredict the liquid in the upper plenum.
For the FLECHT-SEASET tests, as shown in Figures 3.3.89 through 3.3.97 in Reference 5, the
mass of water in the test section is underpredicted by S-RELAP5 and the methodology
nodalization. This is consistent with the results provided in Figures 3.3.98 through 3.3.103 in
Reference 5, which show that S-RELAP5 is overpredicting the water carryover from the test
assembly.
In conclusion, S-RELAP5 predicted liquid carryout from the core to the upper plenum was
examined in three different test facilities. In all three test facilities, the amount of liquid carryout
of the core into the upper plenum was overpredicted. Given these results from three different
test facilities, it is concluded that the code and methodology prediction of core entrainment is
conservative and no bias or uncertainty was developed to take credit for this conservatism.
EMF-2103(NP)
Revison 2Realistic Large Break LOCA Methodology for Pressurized Water Reactors Page 4-271
AREVA NP Inc.
4.3.3.1.3 Core Flow Reversal/Stagnation
The reversal and stagnation of flow in the core is the result of the size of the break and the rate
of coolant loss versus the rate of coolant injection from the ECC systems. Generally, a
combination of other phenomena occur to determine the limiting set of conditions that result in
the worse situation where the flow in the core is essentially stagnant or has a low reflood rate for
the longest period of time. This condition is addressed by the random variation of the other
dominant phenomena. [
]
4.3.3.1.4 Upper Plenum Liquid Entrainment/Deentrainment
When liquid droplets are entrained in the core and carried up into the upper plenum, they can
remain there, fall back into the core (deentrainment), or be carried out into the hot leg
(entrainment). The major modeling concern for a LBLOCA is that allowing too much liquid to fall
back into the core would result in a top-down quench and a significant underprediction of the
PCT. It would also reduce steam binding. Several SCTF, CCTF, and UPTF tests were used to
demonstrate S-RELAP5 will carry over an acceptable amount of liquid to the steam generator
tube region, thus limiting the liquid accumulation in the upper plenum to an acceptable amount.
Several input options were developed to make sure S-RELAP5 will entrain an acceptable
amount of liquid to the steam generator tube region during the reflood phase of a LOCA in a
PWR plant. The simulation of UPTF Test 10, Run 080 and Test 12, Run 014, demonstrate that
by using a Kutateladze-type CCFL correlation, S-RELAP5 will conservatively calculate liquid
down flow from the upper plenum. A Wallis-type CCFL correlation developed by MPR using
UPTF Test 11 is applied at the hot leg-to-steam generator inlet plenum junction to limit the liquid
drain back to the upper plenum. UPTF Test 10, Run 081 and Test 29, Runs 211 and 212, were
simulated to develop upper plenum, hot leg, and steam generator inlet plenum input options to
ensure acceptable liquid entrainment to the tube region. These benchmarks are discussed in
Section 4.3.1.11.
EMF-2103(NP)
Revison 2Realistic Large Break LOCA Methodology for Pressurized Water Reactors Page 4-272
AREVA NP Inc.
In the simulation of several CCTF and SCTF tests, all the above discussed input options were
used. The SCTF hot leg geometry is atypical due to the inside geometry being elliptical. The
height (major axis) of the hot leg is close to the inside diameter of a typical 4-loop PWR. In
order to preserve the volume flow area scaling of a 4-loop PWR, the width (minor axis) of the
hot leg is very narrow. In the S-RELAP5 model, the oval geometry is approximated by a circular
pipe while preserving the total volume flow area. In SCTF there is no active steam generator; a
steam-water separator is used to simulate the primary side of the steam generator. The inlet
chamber represents the inlet plenum of four scaled steam generators. The outlet chamber
collects the liquid entrained from the inlet chamber. In the tests, the liquid level in the outlet
chamber is measured. This collected liquid represents the liquid entrained in the tube region
during a LOCA in a scaled PWR. Six SCTF Core-II tests were simulated using S-RELAP5. The
results are summarized in Section 4.3.1.13 and discussed in detail in Section 3.10 of
Reference 5. The measured and S-RELAP5 calculated liquid levels for the two gravity feed
(Tests S2-AC1 and S2-SH1) and four forced feed tests (S2-10, S2-11, S2-17, and S2-18) are
shown in Figure 4.128 through Figure 4.133. Considering the atypicality of the SCTF hot leg
and the approximation used in modeling the hot leg in the S-RELAP5 input model, the
calculated liquid entrainment to the steam-water separator is considered acceptable.
Four CCTF tests (Tests 54, 62, 67, and 68) were simulated using S-RELAP5. CCTF has active
scaled steam generators. Therefore, the tests realistically simulate the entrainment process and
droplet evaporation in the tube region. However, there is little information available to make a
direct comparison between measured and calculated liquid entrained to the tube region. In
CCTF, the pump side break is connected to a containment tank (Containment Tank II), which
has a liquid separator at the top. This separator traps all liquid exiting the broken loop steam
generator side of the break. With the assumption that the calculated droplet evaporation in the
tube region is comparable to the data, a comparison between the measured and calculated
liquid collected in Containment Tank II provides a reasonable comparison to the measured and
calculated liquid entrainment to the tube region of the broken loop steam generator. The results
are summarized in Section 4.3.1.12 and discussed in detail in Section 3.11 of Reference 5.
S-RELAP5 calculated and measured Containment Tank II levels for the four tests are shown in
Figure 4.98 through Figure 4.101. Considering the differences in the broken loop steam
generator tube region heat transfer between the test and the S-RELAP5 prediction, the
uncertainty in the extent to which the piping is adiabatic (as it is modeled in S-RELAP5), and the
EMF-2103(NP)
Revison 2Realistic Large Break LOCA Methodology for Pressurized Water Reactors Page 4-273
AREVA NP Inc.
uncertainty in the dimensions of Containment Tank II (dimensioned drawings were not available
at the time of the analysis), the S-RELAP5 calculated entrainment rate to the tube region is
considered acceptable.
In summary, several input options are developed to make sure an acceptable amount of liquid is
entrained into the upper plenum and carried over to the steam generator tube region during the
reflood phase of a LOCA in a PWR. This approach will also limit the liquid accumulation in the
upper plenum to an acceptable level during the reflood phase of a LOCA.
4.3.3.1.5 Countercurrent Flow Limit
The CCFL correlations with specific CCFL parameters are applied [
] These models are applied in all the appropriate
benchmarks and are used in the plant models.
Therefore, the conservative set of parameters used in the assessments is also used in the NPP
analysis so that the CSAU requirement that the assessments use the same model as the NPP
analysis is satisfied.
4.3.3.1.6 Hot Leg Entrainment/Deentrainment
As discussed in Section 4.3.3.1.4, several input options are developed to make sure an
acceptable amount of liquid is entrained into the upper plenum and carried over to the steam
generator tube region during the reflood phase of a LOCA in a PWR. This approach also limits
liquid accumulation in the hot leg to an acceptable level during the reflood phase.
4.3.3.1.7 Two-Phase Pump Degradation
Two-phase pump degradation is addressed in the methodology as a best-estimate input. Based
on the sensitivity study described in Reference 6 for a limiting break on both a 3-loop and a
4-loop plant, it is shown that two-phase pump degradation is not an important phenomenon for
the limiting LBLOCA case. The use of the Semiscale two-phase degradation model, instead of
the CE/EPRI two-phase degradation model, produced essentially no impact on the 3-loop
EMF-2103(NP)
Revison 2Realistic Large Break LOCA Methodology for Pressurized Water Reactors Page 4-274
AREVA NP Inc.
results and only an 18 °F (10 K) change in PCT for the 4-loop plant. Therefore, the
best-estimate CE/EPRI model is used in the RLBLOCA methodology.
4.3.3.1.8 Pump Differential Pressure Loss
The pump differential pressure loss is addressed in the methodology strictly as a best-estimate
model. The S-RELAP5 code has the ability to input the pump-specific homologous curves for
the NPP being analyzed and this option is used. The homologous curves for the specific NPP
pumps are obtained from the utility and, if plant data are available, a pump coast down
benchmark is performed to ensure the behavior is consistent with plant data.
4.3.3.1.9 Noncondensible Transport
The treatment of noncondensibles in the S-RELAP5 code was demonstrated to be conservative
through the assessment of the ACHILLES ISP 25. The rod thermocouples in the test all clearly
showed a reduction in temperature following the introduction of nitrogen into the system. The
S-RELAP5 code conservatively underpredicted this cooldown, as shown in Figure 4.141
through Figure 4.146. Figure 4.147 shows the calculated increase in system pressure is lower
than the data, which also potentially reduces the core cooling because of the effect of system
pressure on steam binding. Thus, the impact of the nitrogen injection following the accumulator
emptying of water will be conservatively predicted in the NPP analysis.
4.3.3.1.10 Downcomer Entrainment
The S-RELAP5 code prediction of the ECC bypass during the refill phase of a LOCA was
demonstrated to be conservative through the assessment of UPTF Tests 6 and 7
(Section 4.3.1.11.1 and Reference 5). In addition, a CCFL correlation developed by MPR
Associates is used in the sample plant cases given in Appendix B to demonstrate S-RELAP5
conservatively calculates the bottom of core recovery (or beginning of core reflood) time. The
MPR correlation is described in Section 4.4.2.2.7. Acceptable downcomer entrainment during
the reflood phase was demonstrated for the CCTF benchmarks discussed in Section 4.3.1.12
and also in Reference 5.
Based on these results, it is concluded that S-RELAP5 will appropriately calculate the ECC
bypass, the core recovery time, and will calculate realistic downcomer entrainment during the
EMF-2103(NP)
Revison 2Realistic Large Break LOCA Methodology for Pressurized Water Reactors Page 4-275
AREVA NP Inc.
reflood phase of a LBLOCA in PWRs where the ECCS delivery to the reactor vessel is not
limited to locations adjacent to the broken cold leg.
4.3.3.1.11 Downcomer Liquid Level Oscillations
Downcomer liquid level oscillation is another phenomenon that is controlled primarily by other
important phenomena such as steam-ECC water mixing in the cold legs. A special cold leg
condensation model (summarized in Section 4.3.3.1.14 and discussed in detail in Section 5.2 of
Reference 5) was developed using UPTF Test 8, UPTF Test 25, and the EPRI 1/3-scaled tests.
The cold leg condensation model is used in all the benchmarks discussed in Sections 4.3.1 and
4.3.2 where there is ECC injection into the cold legs. The simulation results for UPTF Test 8,
discussed in Section 4.3.1.11.2, shows S-RELAP5 predicted the observed flow regimes
reasonably well which indicates the code is capable of calculating the appropriate phenomena
associated with steam-ECC mixing in the cold leg in the plant. However, since the complete
UPTF primary system was not modeled using S-RELAP5, the system oscillations were not
calculated by the code. The CCTF, SCTF and LOFT benchmarks (Sections 4.3.1.12, 4.3.1.13,
4.3.2.1, respectively) compared the calculated and measured differential pressures. These
results show the code calculated acceptable oscillations during the refill and reflood phases of
the transients.
In summary, from the simulation of the above tests, it can be concluded S-RELAP5 will
calculate the acceptable primary system and downcomer oscillations during a LBLOCA in a
PWR.
4.3.3.1.12 Lower Plenum Sweepout
The conservatism of the S-RELAP5 lower plenum sweepout is demonstrated in the essentially
full-scale UPTF Test 6 and 7 assessments. Again, these tests were performed with a constant
ECC injection rate and with various steam flow rates up the downcomer. The measured versus
code prediction of the lower plenum level is provided in Figure 4.63 through Figure 4.67 for
Test 6 and Figure 4.68 for Test 7.
The large sweepout events predicted in the UPTF Test 6 and 7 assessments, but not seen in
the measured data, are a direct result of the 1-D nodalization used in the lower plenum to
simulate a highly multi-dimensional flow phenomenon during the refill phase.
EMF-2103(NP)
Revison 2Realistic Large Break LOCA Methodology for Pressurized Water Reactors Page 4-276
AREVA NP Inc.
4.3.3.1.13 Steam Binding
Steam generator liquid entrainment was examined in the code assessments for CCTF and
UPTF. As discussed in Section 4.3.3.1.4 and Section 4.3.3.1.6, several input options are
developed using UPTF 10B and 29B (Section 4.3.1.11.3) to assure an acceptable amount of
liquid is entrained into the upper plenum and carried over into the steam generator tube region
during the reflood phase of a LBLOCA. One of the input options is the interphase drag bias
which is applied at the tube inlet junctions. These input options are used in the SCTF and
CCTF tests assessments. From the tests assessments, it can be concluded that S-RELAP5
entrains an acceptable amount of liquid into the steam generator tube region during the reflood
phase of a LBLOCA.
4.3.3.1.14 Cold Leg Condensation
A cold leg condensation model was developed using several Westinghouse/EPRI 1/3-scaled
Tests, UPTF Test 8 (Phase A, Run 111 and Phase B, Run 112) and Test 25, to calculate a
proper cold leg condensation rate during the accumulator and pumped injection period. The
tests selected for this development generally cover both periods and the input models used are
similar to those used in the benchmarks discussed in Section 4.3.1. The condensation model
consists of biases (multipliers) on the liquid and vapor side heat transfer coefficients that
determine the condensation due to steam–water mixing. The condensation model is described
in detail in Section 5.2 of Reference 5. A summary of the model is described below.
During cold leg condensation, due to ECC mixing with steam in the cold leg, the vapor side heat
transfer primarily affects desuperheating of the steam. It was determined that [
] . The condensation is primarily determined by the liquid side heat transfer and a
void dependent multiplier, CONMAS, as shown in Figure 4.163. CONMAS is used to calculate
the liquid temperature as it enters the downcomer. The ECC injection node void fraction is used
to determine the value of CONMAS. It is applied to the intact cold leg piping, from the pump
discharge location to the downcomer, and to the pump discharge side of the broken cold leg. In
addition, since the flow regime in the ECC injection location is highly complex, the non-stratified
flow regime option is selected in the ECC injection node. During the accumulator injection
period, the flow regime in the cold leg piping downstream from the injection location is generally
slug (plug) flow and the void fraction is generally below 50 percent. During the pumped injection
EMF-2103(NP)
Revison 2Realistic Large Break LOCA Methodology for Pressurized Water Reactors Page 4-277
AREVA NP Inc.
period, especially with the consideration of a single failure, the steam energy available will
generally exceed the ECC condensation potential, the flow regime in the cold leg will generally
be stratified and the void fraction is high (80 to 95 percent). During this period, the liquid side
heat transfer [
] With these input options, S-RELAP5 is
found to calculate acceptable cold leg condensation for the selected UPTF and EPRI tests.
These results are discussed in detail in Section 5.2 of Reference 5.
Additional EPRI tests were simulated using S-RELAP5 and the results are discussed in
Section 4.3.1.9. These input modeling options are used in all the benchmarks discussed in
Section 4.3 where there is cold leg ECC injection and are summarized in Table 4.25. This
option will be used to model cold leg condensation in plant application cases.
In summary, S-RELAP5 calculates acceptable cold leg condensation during both the
accumulator and pumped injection periods of a LBLOCA in a PWR.
4.3.3.1.15 Fuel Rod, Stored Energy, Gap Conductivity
The gap conductivity from the fuel performance code (COPERNIC2 or RODEX3A) under the
fuel and system conditions calculated by S-RELAP5 is used throughout the transient evaluation.
The fuel codes are considered best-estimate solutions to the thermal performance of the fuel
rods. They were benchmarked against experimental data, Reference 5, to determine any
appropriate bias and uncertainty. Uncertainty in the prediction of gap conductivity is accounted
for by the adjustment of the thermal conductivity of the fuel pellet. This adjustment is comprised
of a burnup dependent bias and a sampled uncertainty, implemented at the beginning of the
steady-state initialization for each case calculation and maintained throughout the transient.
The adjustment controls the primary factor of the initial energy within the fuel pellet and also
responds to the ability to transport energy to the coolant during the transient. As such, the
approach is considered acceptable for a best-estimate methodology and no further assessment
is required.
EMF-2103(NP)
Revison 2Realistic Large Break LOCA Methodology for Pressurized Water Reactors Page 4-278
AREVA NP Inc.
4.3.3.1.16 Fuel Rod, Stored Energy, Axial and Radial Peaking
The axial and radial peaking is set conservatively for each case of the sample set. Radial
peaking for the hot assembly and hot rod is set in accordance with plant technical specification
maximums. Axial peaking is sampled, with a flat distribution, between that expected at normal
operation for the hot rod and that which would provide a peak local heating rate equal to the Fq
limit for the plant at the case burnup. The local power peak is a dominant factor in determining
cladding temperature and oxidation responses. Off normal values for the local power result
from plant maneuvering; they are time wise random occurrences and are rare. Thus, a realistic
probability distribution would be exponential in nature and the assumed flat distribution used in
the RLBLOCA methodology is conservative. No further assessment is required.
4.3.3.1.17 Fuel Rod, Decay Heat, Ballooning, Rupture and Post-Rupture Fuel Relocation
Decay heat, post-shutdown specific energy generation, is treated statistically in the RLBLOCA
evaluation model and discussed in Section 4.3.3.2.3. This section documents the treatment of
the potential for an increase in cladding heat load due to possible clad ballooning and rupture
followed by fuel relocation. The phenomenon is referred to as fuel relocation and the scenario
proceeds as: during a LOCA, fuel pins are placed under a condition of stress tending to strain
the cladding outward away from the fuel pellet; at relatively moderate LOCA cladding
temperatures, 1500 to 1700 °F, the clad will balloon outward and rupture; cracked pellet
material from the region just above the ballooned region may separate from the pellet and fall
into the cup of the ballooned region; the heat load on the cladding at this location is now
increased because more heat producing material is located there.
The importance, or effect, of fuel relocation is dependant on when it occurs during the accident.
Provided there is a reasonably constant supply of coolant at qualities somewhat below 1.0,
cooling mechanisms are induced by ballooning and rupture that act to decrease the cladding
temperature below that experienced at unruptured locations on the fuel rod. However, if the
flow should degrade to steam only for a period of more than several seconds, some of these
cooling mechanisms will become ineffective and a rapid clad temperature excursion may occur.
During reflood, core flow is upward, relatively constant, and forced by significant driving heads.
This results in continuous coolant conditions conducive to providing effective cooling for the
ballooned and ruptured locations. Prior to the reflood phase, during blowdown and refill, the
core flow is erratic—changing from upward to downward and possibly stagnating—and periods
EMF-2103(NP)
Revison 2Realistic Large Break LOCA Methodology for Pressurized Water Reactors Page 4-279
AREVA NP Inc.
of steam only coolant can not be prevented with any assurance. The occurrence of ballooning
and rupture during the blowdown and refill phases may lead to uncontrollable cladding
temperature excursions. Thus, if that condition is to be allowed, an explicit modeling of clad
ballooning, rupture and fuel relocation must be provided to assure that the condition can be
controlled.
Pre-Reflood Clad Ballooning and Rupture
[
]
Reflood Clad Ballooning and Rupture
[
]
Support for this position is provided by consideration of the phenomena involved, analysis of the
effects, and experimental results. The impact of rupture and ballooning on clad cooling occurs
through several rupture or ballooning-induced cooling mechanisms and three detrimental
heating effects:
Cooling effects:
1. Increased heat transfer surface area at the ballooned elevation 2. Increased velocities within the ballooned and ruptured regions
EMF-2103(NP)
Revison 2Realistic Large Break LOCA Methodology for Pressurized Water Reactors Page 4-280
AREVA NP Inc.
3. Increased turbulence within the ballooned and ruptured regions 4. Droplet shattering resulting in increased interphase heat transfer and steam
desuperheating 5. Decrease in gap heat transfer if the fuel does not strongly relocate 6. Decrease in pellet thermal conductivity if the fuel relocates 7. Potential formation of local quench-fronts in ballooned and ruptured regions
Heating effects:
8. Diversion of flow around ballooned and ruptured regions 9. Cladding heat load increased due to fuel relocation 10. Cladding heat load increased due to interior oxidation
Experience with Appendix K methodologies has shown that the aggregate of these effects acts
to decrease the cladding temperatures when no fuel relocation occurs. This was demonstrated
in Appendix B, Section B.2 of Revision 0 (Reference 6) and the response to RAI 28 on
Revision 0 (page 79 of Amendment 1 to Reference 6) with sensitivity studies on both 3- and
4-loop PWRs with 15x15 and 17x17 fuel designs. The studies included increased heat transfer
surface area, increased local coolant velocities, a decrease in gap heat transfer, flow diversion,
and interior cladding oxidation. The effects of increased turbulence, droplet shattering, and
potential local quenching were not included within the modeling. Decrease in pellet thermal
conductivity and a clad heat load increase were not included because these studies did not
address fuel relocation. Even without half of the cooling mechanisms, the cladding
temperatures and local oxidations were reduced when reasonable accounting for the cooling
mechanisms was made. This effect has also been observed in the Flooding Experiments with
Blocked Arrays (FEBA) and FLECHT test series.
Under a condition of fuel relocation, wherein the fuel above the ballooned region drops into the
ballooned region, it has been postulated that increased decay heat generation will lead to an
increase in cladding heat flux resulting in higher cladding temperatures. Various presentations
(Reference 69 Articles 1 and 12, for example) purport to show the effect. However, these
studies have uniformly incorporated extreme assumptions on the conditions of relocation and
the resultant heat transfer processes. Few include provisions for rupture-induced cooling
mechanisms. Most assume that the cladding expands circularly without being encumbered by
the remainder of the fuel assembly. In fact, a free expansion of the fuel rod is only possible up
to pin strains in the mid-30 percents, for higher strains the local gap volume no longer increases
EMF-2103(NP)
Revison 2Realistic Large Break LOCA Methodology for Pressurized Water Reactors Page 4-281
AREVA NP Inc.
faster than the clad surface area. Finally, the packing factor of the rubble filling the ballooned
region is overpredicted. If reasonable, yet conservative, assumptions had been made, the
results would lead to the expectation that fuel relocation, which is real, does not pose a
condition by which the ruptured or ballooned regions will exceed the consequence of the
non-ballooned regions of the hot pin.
This was observed experimentally in the KfK experiments as reported in RAI 131 on Revision 0
(page 120 of Amendment 1 to Reference 6). In the KfK in Pile Tests, fuel relocation into the
ballooned area of the fuel rod occurred, but did not adversely affect the subsequent clad
temperature behavior. To determine when the fuel relocates, two tests were performed with
thermocouples located at the top of the pellet stack. One test comprised low burnup fuel which
maintained its pellet geometry after rupture. The other test was of higher burnup fuel which
relocated. The traces from the upper thermocouples, for the test that relocated, showed the
temperature at the top of the pellet stack displayed a significant drop at the time of fuel rod
rupture. For this test, following the rupture, the heatup rate at the rupture elevation was reduced
relative to the heatup rate prior to the rupture. This reduction in heatup rate would indicate that
the PCT at the time of turnover would be less than would be reached if rupture had not
occurred, even with the increase in localized decay heat from the pellet rubble residing at the
ruptured region. Thus, the KfK experiments demonstrate that analyses which ignore the
beneficial effects of swelling and rupture provide unduly high clad temperature estimates for the
ruptured region during reflood, even when fuel relocation occurs.
Conclusions
The RLBLOCA evaluation model does not incorporate a clad ballooning, rupture and fuel
relocation model. To support this modeling, the cladding temperature and pin stress evolution
for individual cases in the case set will be assessed against rupture criteria appropriate for the
cladding being evaluated. [
] when comparing it to the 10 CFR 50.46 criterion.
EMF-2103(NP)
Revison 2Realistic Large Break LOCA Methodology for Pressurized Water Reactors Page 4-282
AREVA NP Inc.
4.3.3.1.18 Downcomer, Flow Pattern, CCFL, Slug Flow, and Non-Equilibrium
The downcomer LBLOCA phenomena of multidimensional flow patterns, CCFL and
non-equilibrium flow primarily affect the refill period by influencing the duration of ECCS bypass.
UPTF Test 6 (Runs 131, 132, 133, 135, and 136) and Test 7 (Run 203) were designed
specifically to examine downcomer countercurrent flow behavior during blowdown, ECC bypass,
and lower plenum refill with cold leg ECC injection. The ECC injection is activated in a PWR
during the end-of-blowdown and refill phases of a cold leg break LBLOCA transient. These
interactions play a key role in determining the rate at which ECC water is able to refill the lower
plenum.
The tests were analyzed to demonstrate the ability of S-RELAP5 to self-limit countercurrent flow
in the downcomer and predict reasonable refill behavior including ECC bypass compared to
experimental data. For these runs, the UPTF system was configured to simulate the late
blowdown and refill phases of a cold leg break PWR LBLOCA. These tests all were initiated
with no water inventory in the lower plenum. Steam injected in the core region traveled
downward to the lower plenum, and then exited the vessel via the downcomer and broken cold
leg. An identical pattern of ECC injection was used for all the runs analyzed, with a constant
injection rate into each of the three intact cold legs. A wide range of steam flow rates was used
for the various runs and, depending on the downcomer steam flow rate, the ECC water entering
the downcomer either bypassed to the broken cold leg or penetrated downward to fill the lower
plenum.
The following general observations regarding UPTF Tests 6 and 7 were found to be true of both
the experiments and their corresponding S-RELAP5 simulations.
• Little water was delivered to the downcomer and lower plenum during the period that the
intact cold legs were filling with ECC water. Only after the cold legs were filled did a
significant amount of ECC penetration to the downcomer and lower plenum begin.
• When ECC penetration to the lower plenum did occur, the rate of that penetration tended to
vary inversely with the rate of steam flow in the downcomer.
• During the period of ECC penetration, ECC water from the two cold legs opposite the
broken cold leg tended to penetrate directly downward to the lower plenum. ECC water
EMF-2103(NP)
Revison 2Realistic Large Break LOCA Methodology for Pressurized Water Reactors Page 4-283
AREVA NP Inc.
from the cold leg immediately adjacent to the broken cold leg tended to be bypassed to the
broken cold leg.
• Highly unstable flow conditions were observed in the downcomer during the entire period of
ECC injection.
The specific LBLOCA refill phenomena addressed by the analyses of Tests 6 and 7 include the
following:
• Downcomer multi-dimensional effects - Both calculated steam flow and calculated ECC
water flow are shown to distribute themselves azimuthally in multidimensional patterns that
were consistent with test results.
• Downcomer countercurrent and slug flow - The various runs were performed with a wide
range of downcomer steam flow rates and with two-phase flow conditions including
countercurrent and slug flow. In all cases, the code was demonstrated to conservatively
(adequate to reasonable agreement with data) predict downcomer penetration of ECC water
with the RLBLOCA lower plenum plant nodalization.
• Downcomer condensation and non-equilibrium flow - The various runs were performed with
a wide range of ECC subcoolings (and downcomer condensation rates) and in all cases, the
code was demonstrated to conservatively predict downcomer penetration of ECC water with
the RLBLOCA plant lower plenum nodalization.
In summary, from the simulation results of UPTF Tests 6 and 7, it can be concluded that
S-RELAP5 will conservatively calculate lower plenum sweep-out, lower plenum refill, and ECC
bypass rates. This results in a conservative beginning of core recovery time during LBLOCA in
a PWR. S-RELAP5 also calculates acceptable downcomer condensation rates due to
steam-ECC water interaction.
4.3.3.1.19 Downcomer, Multi-D Phenomena
As discussed in the previous section, simulations of UPTF Tests 6 and 7 were used in part to
verify the refill and ECC bypass flow behavior compared to experimental data. The
comparisons showed that the multidimensional flow patterns of both steam and ECC liquid were
consistent with test results. This indicates that the multidimensional phenomena in the
downcomer are being properly included in the methodology.
EMF-2103(NP)
Revison 2Realistic Large Break LOCA Methodology for Pressurized Water Reactors Page 4-284
AREVA NP Inc.
4.3.3.1.20 Downcomer, Downcomer Boiling, Noding
Although boiling in the downcomer occurs during blowdown, the biggest potential for impact on
clad temperatures is during late reflood following the end of accumulator injection. The impact of
downcomer boiling is primarily dependent on the wall heat release rate and on the ability to slip
steam up the downcomer and out of the break. The higher the downcomer wall heat release,
the more steam is generated within the downcomer and the larger the impact on core
reflooding. Similarly, the quicker the passage of steam up the downcomer, the less resident
volume within the downcomer is occupied by steam and the lower the impact on the downcomer
average density. Therefore, the ability to properly simulate downcomer boiling depends on both
the heat release (boiling) model and on the ability to track steam rising through the downcomer.
The S-RELAP5 heat release modeling was validated by a sensitivity study on wall mesh point
spacing and a benchmark against a closed form solution (see Figure 4.166). Steam tracking
was validated through both an axial and an azimuthal fluid control volume sensitivity study done
at low pressures. The axial noding study was based on an ice condenser plant that is near
atmospheric pressure during reflood. These studies demonstrated that S-RELAP5 delivers
energy to the downcomer liquid volumes at an appropriate rate and that the downcomer noding
detail is sufficient to track the distribution of any steam formed. The results indicated that the
modeling accuracy within the RLBLOCA methodology is sufficient to resolve the effects of
downcomer boiling and that, to the extent that boiling occurs, the methodology properly resolves
the impact on the cladding temperature and cladding oxidation rates. Thus, the required
methodology for the prediction of downcomer boiling at system pressures approximating those
achieved in plants with pressures as low as ice condenser containments was demonstrated.
4.3.3.1.21 Loop, Flow Oscillation
Loop flow oscillations arise when steam in the cold leg (post-blowdown) is condensed by cold
ECC water and forms a liquid plug. The flow rate decreases and the cold leg flow transitions to
the stratified flow regime, allowing the steam flow to increase again. This sweeps the liquid out
again.
UPTF Test 8 was used to verify the S-RELAP5 cold leg condensation model. The model is
applied to the ECC injection node and all downstream nodes in the intact loop cold legs. This
EMF-2103(NP)
Revison 2Realistic Large Break LOCA Methodology for Pressurized Water Reactors Page 4-285
AREVA NP Inc.
includes the selection of the non-stratified option in the ECC injection nodes. The cold leg
condensation model is summarized in Section 4.3.3.1.14.
The primary results from the comparisons of S-RELAP5 to the UPTF data for Test 8 Run 111
and Run 112 are:
• The primary objective of the test simulation was to validate the adequacy of the prediction of
the water temperature entering the downcomer, due to its effect on downcomer boiling
during the post-accumulator injection period of a postulated LBLOCA. S-RELAP5 correctly
predicted the cold leg liquid temperature for both runs.
• The S-RELAP5 calculated flow regimes are in general agreement with the thermocouple
data from the tests.
In summary, it can be concluded that the S-RELAP5 cold leg condensation model correctly
calculates the temperature of the water entering the downcomer during the reflood phase of a
postulated LBLOCA. This will result in realistic calculation of loop flow oscillations.
EMF-2103(NP)
Revison 2Realistic Large Break LOCA Methodology for Pressurized Water Reactors Page 4-286
AREVA NP Inc.
Table 4.21: Methodology Treatment of Important PIRT Phenomena

EMF-2103(NP)
Revison 2Realistic Large Break LOCA Methodology for Pressurized Water Reactors Page 4-287
AREVA NP Inc.
Table 4.21: Methodology Treatment of Important PIRT Phenomena (continued)
EMF-2103(NP)
Revison 2Realistic Large Break LOCA Methodology for Pressurized Water Reactors Page 4-288
AREVA NP Inc.
Table 4.21: Methodology Treatment of Important PIRT Phenomena (continued)

EMF-2103(NP)
Revison 2Realistic Large Break LOCA Methodology for Pressurized Water Reactors Page 4-289
AREVA NP Inc.
Table 4.22: Summary of Evaluated Uncertainties of Important PIRT Parameters
EMF-2103(NP)
Revison 2Realistic Large Break LOCA Methodology for Pressurized Water Reactors Page 4-290
AREVA NP Inc.
Figure 4.163: CONMAS Multiplier as a Function of Cold Leg Void Fraction
EMF-2103(NP)
Revison 2Realistic Large Break LOCA Methodology for Pressurized Water Reactors Page 4-291
AREVA NP Inc.
4.3.3.2 Important PIRT Phenomena Treated Statistically
A summary, giving the parameter bias and uncertainty, and how they are to be applied in the
methodology, is provided in this section. The determination of code or physical phenomena
uncertainties is presented in Section 5 of Reference 5. Other parameters treated statistically
are discussed in detail, including background information, justification of the statistical approach
and explanation of the objective of the statistical treatment.
Table 4.22 presents a summary of the key parameters treated statistically in the AREVA
RLBLOCA methodology. The table lists the biases and provides a description of the statistical
treatment of uncertainty for each key parameter.
4.3.3.2.1 Stored Energy
Revision 2 of the RLBLOCA methodology incorporates both RODEX3A and COPERNIC2
(References 9 and 10, respectively) as fuel performance codes from which the initial fuel
conditions and the fuel thermal mechanical correlations are determined. These codes are used
for Uranium oxide fuel pellets with and without Gadolinia. COPERNIC2 will be used for fuel with
M5® cladding, which comprises the vast majority of the applications of this methodology. In
cases requiring an evaluation of Zircaloy cladding, the RODEX3A code will be applied.
The analysis of stored energy uncertainty was performed in Section 5.8 and 5.9 of Reference 5
by assessing COPERNIC2 and RODEX3A predictions for centerline fuel temperature relative to
data (see data discussions in References 7, 8, 9, and 10). The assessment for each code was
established as a bias and an uncertainty in the form of the difference of measured and predicted
temperatures ratioed to the predicted temperatures. For the development in Reference 5, the
form was:
( )edicted
Measurededicted
TTT
Pr
Pr −.
This gives an adjustment proportional to the magnitude of the predicted centerline fuel
temperature and is easy to apply within a code structure. The (TPredicted-TMeasured) means the
negative of the adjustment is provided.
EMF-2103(NP)
Revison 2Realistic Large Break LOCA Methodology for Pressurized Water Reactors Page 4-292
AREVA NP Inc.
COPERNIC2
COPERNIC2 is an NRC-approved current generation fuel performance code. The assessment
database used to develop the bias and uncertainty for the RLBLOCA methodology was that
incorporated in the code approval. The approval resulted in the assignment of a zero bias and,
for deterministic evaluations, a 71 C increase in the centerline fuel temperature to achieve a
95/95 prediction. This adjustment is an absolute and not dependent on the magnitude of the
prediction. For RLBLOCA, it is replaced with a proportional adjustment of the form
(TPredicted-TMeasured)/TPredicted. [
]
In line with the realistic treatment of uncertainty, the adjustment is sampled separately for each
member analysis of the case set and is sampled as both a positive and a negative adjustment.
Figure 4.164 gives the uncertainty used in the methodology as a cumulative distribution in
comparison to the actual cumulative distribution of the benchmarked database. Within the
range of negative adjustments to temperature, the adjustment is somewhat less than the data
would justify making the methodology slightly conservative.
The restriction on the use of COPERNIC2 to M5® cladding only is not due to limitations in the
physical models in the code, but is rather based on SER restrictions associated with the current
NRC approval of COPERNIC2. The physical models in COPERNIC2 allow for the use of
Zircaloy cladding, and much of the validation of the code was based on test results using
Zircaloy cladding. Based on the evidence presented in Reference 10, COPERNIC2 is capable
of accurately analyzing fuel with Zircaloy cladding.
RODEX3A
RODEX3A was approved for use in the RLBLOCA methodology with the approval of
EMF-2103(P)(A)Revision 0 (Reference 6). However, the benchmark database was limited to
fuel rod burnups of 30 GWd/mtU. For Revision 2, the database was expanded to include fuel
rod burnup data over 100 GWd/mtU.
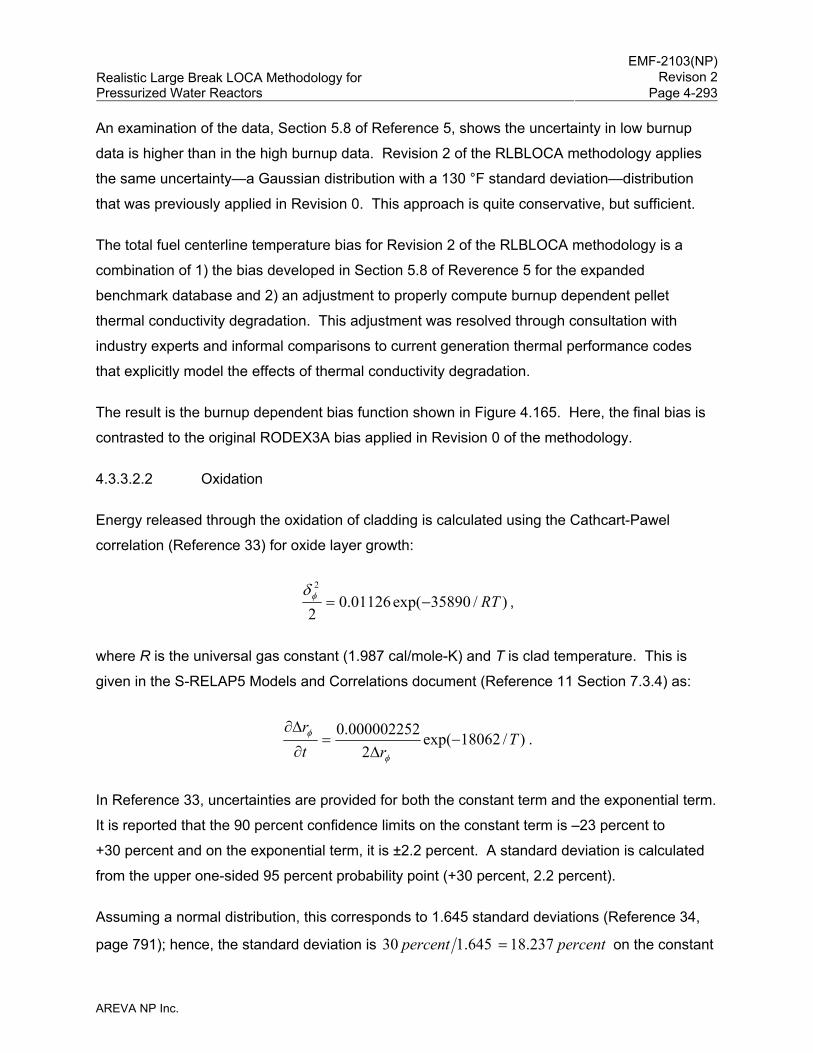
EMF-2103(NP)
Revison 2Realistic Large Break LOCA Methodology for Pressurized Water Reactors Page 4-293
AREVA NP Inc.
An examination of the data, Section 5.8 of Reference 5, shows the uncertainty in low burnup
data is higher than in the high burnup data. Revision 2 of the RLBLOCA methodology applies
the same uncertainty—a Gaussian distribution with a 130 °F standard deviation—distribution
that was previously applied in Revision 0. This approach is quite conservative, but sufficient.
The total fuel centerline temperature bias for Revision 2 of the RLBLOCA methodology is a
combination of 1) the bias developed in Section 5.8 of Reverence 5 for the expanded
benchmark database and 2) an adjustment to properly compute burnup dependent pellet
thermal conductivity degradation. This adjustment was resolved through consultation with
industry experts and informal comparisons to current generation thermal performance codes
that explicitly model the effects of thermal conductivity degradation.
The result is the burnup dependent bias function shown in Figure 4.165. Here, the final bias is
contrasted to the original RODEX3A bias applied in Revision 0 of the methodology.
4.3.3.2.2 Oxidation
Energy released through the oxidation of cladding is calculated using the Cathcart-Pawel
correlation (Reference 33) for oxide layer growth:
)/35890exp(01126.02
2
RT−=φδ,
where R is the universal gas constant (1.987 cal/mole-K) and T is clad temperature. This is
given in the S-RELAP5 Models and Correlations document (Reference 11 Section 7.3.4) as:
)/18062exp(2
000002252.0 Trt
r−
Δ=
∂
Δ∂
φ
φ .
In Reference 33, uncertainties are provided for both the constant term and the exponential term.
It is reported that the 90 percent confidence limits on the constant term is –23 percent to
+30 percent and on the exponential term, it is ±2.2 percent. A standard deviation is calculated
from the upper one-sided 95 percent probability point (+30 percent, 2.2 percent).
Assuming a normal distribution, this corresponds to 1.645 standard deviations (Reference 34,
page 791); hence, the standard deviation is percentpercent 237.18645.130 = on the constant
EMF-2103(NP)
Revison 2Realistic Large Break LOCA Methodology for Pressurized Water Reactors Page 4-294
AREVA NP Inc.
term and percentpercent 337.1645.12.2 = on the exponential term. Both terms are sampled
within the methodology employing Gaussian distributions with the above standard deviations
and no bias (Reference 33).
When calculating the total oxidation of the cladding, a best-estimate steady-state corrosion
value is added to the predicted maximum transient oxidation. The sum of the steady-state and
transient oxidation is then compared to the total cladding maximum oxidation limit.
4.3.3.2.3 Decay Heat
Decay heat calculations are based on the 1979 ANSI/ANS standard (ANSI/ANS-5.1-1979,
Reference 35). This standard is applicable to light water reactors containing low enriched
uranium as the initial fissile material. The treatment of fission product decay and actinide decay
are separated in the methodology with differing approaches used to assure representative yet
conservative treatment.
Fission Product Decay
The RLBLOCA methodology utilizes the decay curve of the standard for fully saturated decay
chains and infinite operation, with the total fission energy coming from U-235 and the energy per
fission being 200 Mev (Reference 35).
No bias is assigned to this phenomenon, but an uncertainty derived from the U-235 fission
product decay of the standard is incorporated and sampled. The uncertainty for the decay of
U-235 fission products has an initial standard deviation of about 3 percent, which drops to
around 2 percent by 2 seconds and is below 2 percent by 8 seconds. The uncertainty remains
near, but below, 2 percent for over 400 seconds. Because peak cladding temperatures occur
prior to 400 seconds, and in general sooner than 200 seconds, the uncertainty is characterized
by a standard deviation of approximately 2 percent. The RLBLOCA methodology utilizes a
random sampling of a Gaussian distribution based on a 2 percent standard deviation for the
fission product decay energy uncertainty. The sampling is two-sided and done at the beginning
of each transient.
There are five principle applications of the fission product decay model within a RLBLOCA
simulation:
EMF-2103(NP)
Revison 2Realistic Large Break LOCA Methodology for Pressurized Water Reactors Page 4-295
AREVA NP Inc.
• Fresh fuel – hot pin,
• Once-burned fuel – hot pin,
• Fresh fuel assemblies,
• Once-burned fuel assemblies, and
• Twice-burned fuel assemblies.
For once- and twice-burned fuel, substantial plutonium accumulates such that the ratio of
plutonium-to-uranium fission-energy production rate is substantial and increasing. Because the
decay energy resulting from plutonium fissions is less than that from uranium, the decay energy,
for infinite operation, is reduced as the fuel is burned. Thus, as burnup increases, the
RLBLOCA decay heat modeling, U-235 only, accrues conservatism. The conservatism applies
to all regions of the core according to the mix of burnup represented within each region.
The fresh fuel hot pin and assembly begin operation with no plutonium. Therefore, the
reduction in decay heat due to plutonium build-up is not applicable to these regions for the initial
period of the cycle. However, there will not be any long decay term fission products to build in.
The lack of long decay term sources comprises a reduction in decay heat rate of several
percent over the first several months of operation, making the infinite operation assumption
conservative for the period that plutonium is accumulating.
In conclusion, the choice of infinite operation with pure U-235 decay heat provides a base model
that is conservative. Sampling this model based on the uncertainty of the U-235 decay chain
provides something of the realistic treatment subject to the conservatism imbedded in the
approach.
Actinide Decay
In addition to fission product decay heat, actinide capture product decay power is computed
using the ANS standard equations and added to the fission product decay heat. In this
calculation, a conservative conversion ratio, appropriate for the time in cycle analyzed, is
obtained from core neutronic calculations. The ANS standard also provides equations to
calculate the addition of decay heat from neutron capture in fission products. These equations
are included in S-RELAP5 and the contribution to the total decay heat from this source is
included in the methodology.
EMF-2103(NP)
Revison 2Realistic Large Break LOCA Methodology for Pressurized Water Reactors Page 4-296
AREVA NP Inc.
4.3.3.2.4 Departure from Nucleate Boiling
Results from the THTF Heat Transfer SETs contributed to identifying a bias in the Biasi CHF
correlation (Reference 5). [
] The CHF scaling is applied for RLBLOCA calculations, and
the statistical information on heat transfer is used along with other test data (Section 4.3.3.2.5)
to derive the uncertainty parameters on film boiling and dispersed flow film boiling heat transfer
(Section 4.3.3.2.5).
4.3.3.2.5 Core Post-CHF Heat Transfer
The post-CHF heat transfer model now includes provisions for thermal radiation between
structures (rod-to-rod). This adds to the current model which already includes thermal radiation
from structures to the fluid (rod-to-droplets and rod-to-steam). The rod-to-rod radiation model is
only applied to the hot rod since its power level is elevated compared to it surroundings.
Applying rod-to-rod radiation exclusively to the hot rod logically leads to the development of
separate heat transfer uncertainties for the hot rod and the rest of the core.
The core wide heat transfer uncertainty was developed from code comparisons using the
FLECHT-SEASET reflood test data as discussed in Section 5.1 of Reference 5. These
comparisons were used to derive the heat transfer multipliers that are applied to film boiling
(FILMBL) heat transfer and dispersed flow film boiling heat transfer (DFFBHTC). [
]

EMF-2103(NP)
Revison 2Realistic Large Break LOCA Methodology for Pressurized Water Reactors Page 4-297
AREVA NP Inc.
[
] The
distribution was integrated to form the cumulative probability, which compared favorably with a
EMF-2103(NP)
Revison 2Realistic Large Break LOCA Methodology for Pressurized Water Reactors Page 4-298
AREVA NP Inc.
[ ] . However, the
uncertainties from the low pressure reflood multipliers FILMBL and DFFBHTC conservatively
bound the 2σ interval from the high pressure multiplier. Therefore, the low pressure reflood
multipliers and biases will be applied to the post-CHF heat transfer for the entire LBLOCA event.
The single-phase vapor heat transfer was assessed in Reference 5 (Section 3.16) and [
] in the FLECHT-SEASET, FLECHT Skewed and THTF assessments. The
results from those assessments did not show adverse or unrealistic behavior or temperatures.
Based on this analysis, the single-phase vapor heat transfer is unbiased.
The assessments that were used in the bias and uncertainty determinations previous discussed
used [
]
4.3.3.2.6 Tmin
A set of seven FLECHT-SEASET tests was used to evaluate the trends in Tmin at low pressure.
Quench temperatures improve at higher pressures; hence, a Tmin uncertainty based on low
pressure data was expected to bound high pressure data. This was validated in the
Reference 6 methodology with data from ROSA/TPTF, the ORNL/THTF and the Westinghouse
G1/G2 tests. Examination of FLECHT-SEASET data showed that, based on observable
conservatisms, only the 3 in/s reflood rate test (Test Number 31302) was necessary to evaluate
a bounding Tmin uncertainty (Reference 5).
From the FLECHT-SEASET data and from an evaluation of code uncertainty with regard to how
the LBLOCA multiplier relates to Tmin, [
] . The uncertainty evaluation was demonstrated to
be a conservative bounding distribution relative to other datasets.
EMF-2103(NP)
Revison 2Realistic Large Break LOCA Methodology for Pressurized Water Reactors Page 4-299
AREVA NP Inc.
4.3.3.2.7 Break Flow
Break flow is a function of break area and critical flow uncertainty. [
] The S-RELAP5 HEM critical flow model applied in this
methodology was assessed by comparison to full-scale critical flow tests at the Marviken facility,
Section 4.3.1.8. From these assessments, [
]
4.3.3.2.8 Accumulator Discharge
Accumulator discharge can be influenced by piping flow resistances and pressure. Most plants
provide best-estimate data that maybe used to accurately model flow resistance; hence, the
largest uncertainty to accumulator discharge is accumulator pressure. To support the technical
specification of a plant for accumulator pressure and liquid inventory ranges, these parameters
are sampled over the technical specification ranges, using a uniform probability distribution.
4.3.3.2.9 Reactor Vessel Hot Walls
The heat release from the reactor vessel walls affects the ECC bypass during the early refill
phase of a LBLOCA when the primary system is depressurizing. During the reflood phase, the
heat release from the downcomer walls affects downcomer boiling. The results from UPTF
EMF-2103(NP)
Revison 2Realistic Large Break LOCA Methodology for Pressurized Water Reactors Page 4-300
AREVA NP Inc.
Tests 6 and 7 demonstrated that S-RELAP5 will overpredict ECC bypass; however, the
downcomer wall temperature was much lower than would be expected in an actual operating
plant. Therefore, the hot wall effects can only be partially evaluated using these tests. The hot
wall effect can be separated out since it is expected that there is a direct relationship with the
degree of nucleate boiling in the downcomer and ECC bypass. To maximize the hot wall effect,
heat transfer in the downcomer can be locked into nucleate boiling during the refill phase by
raising the CHF point to a high value. In the AREVA methodology, the hot wall effect during the
refill phase [
] .
During the reflood phase, the downcomer vessel wall heat release is conduction limited and
depends on the mesh spacing used in the S-RELAP5 input model. The mesh spacing used to
model the downcomer vessel was verified by using a simple benchmark having a closed form
solution. The results, shown in Figure 4.166, show that S-RELAP5 will adequately calculate the
heat release from the downcomer vessel wall during the reflood phase of a LBLOCA in a PWR.
4.3.3.2.10 Containment Pressure
Containment pressure is ranged [
] . A conservative
containment pressure for the post-blowdown portion of a LOCA implies a low containment
pressure. A low containment pressure is conservative since it results in an increase in steam
binding, and thus reduces reflood rates to the core. Reduced reflood rates means a longer
transient, and thus, higher cladding temperatures. [
]
4.3.3.2.11 Upper Head Temperature, Initial Coolant Temperature
This is the initial temperature in the upper head of the reactor vessel. Plant data are examined
to determine an average operating temperature and uncertainty range. During the case runs,
the temperature is adjusted over the uncertainty range by adjusting the flows into and out of the
upper head region of the reactor vessel. As such the value for the upper head temperature

EMF-2103(NP)
Revison 2Realistic Large Break LOCA Methodology for Pressurized Water Reactors Page 4-301
AREVA NP Inc.
corresponds to the expected operating conditions of the plant and requires no further
assessment.
EMF-2103(NP)
Revison 2Realistic Large Break LOCA Methodology for Pressurized Water Reactors Page 4-302
AREVA NP Inc.
Table 4.23: Film Boiling Multiplier
Table 4.24: Dispersed Flow Film Boiling Multiplier
EMF-2103(NP)
Revison 2Realistic Large Break LOCA Methodology for Pressurized Water Reactors Page 4-303
AREVA NP Inc.
Figure 4.164: COPERNIC2 Cumulative Centerline Fuel Temperature Error Distribution
Realistic Large Break LOCA Methodology forPressurized Water Reactors
Figure 4.165: RODEX3A Bias as a Function of Fuel Pin Burnup
AREVA NP Inc.
EMF-2103(NP)Revison 2
Page 4-304
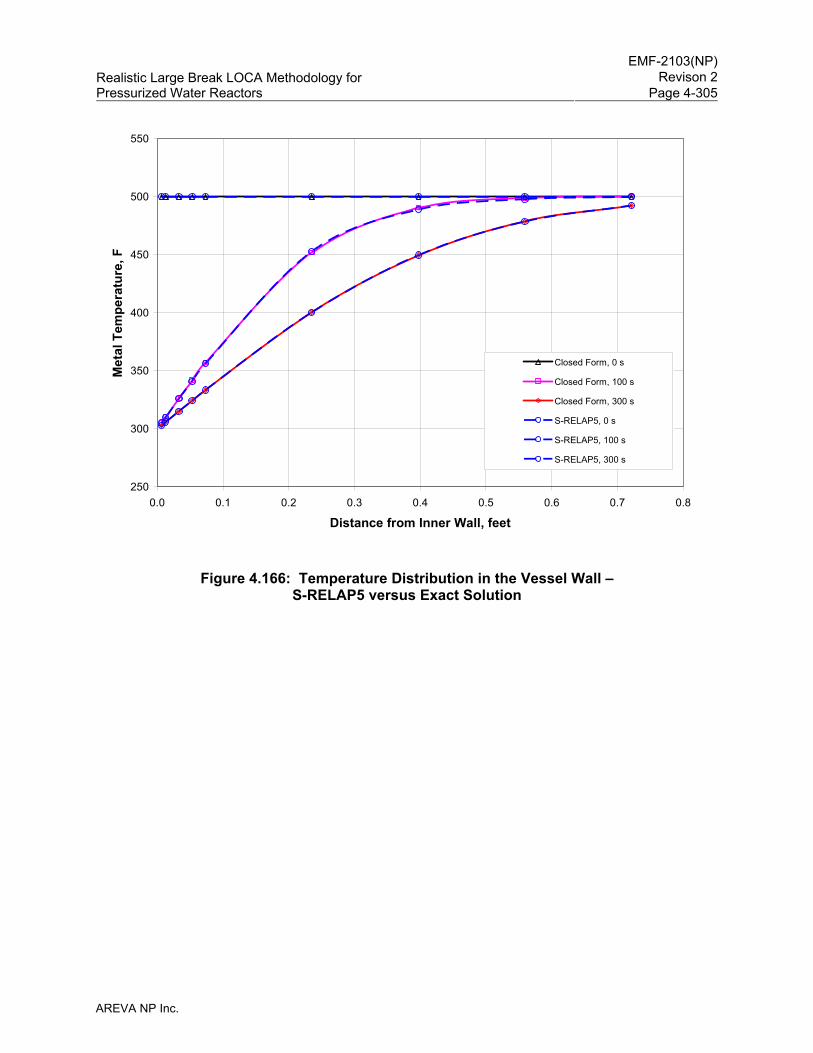
EMF-2103(NP)
Revison 2Realistic Large Break LOCA Methodology for Pressurized Water Reactors Page 4-305
AREVA NP Inc.
250
300
350
400
450
500
550
0.0 0.1 0.2 0.3 0.4 0.5 0.6 0.7 0.8
Distance from Inner Wall, feet
Met
al T
empe
ratu
re, F
Closed Form, 0 s
Closed Form, 100 s
Closed Form, 300 s
S-RELAP5, 0 s
S-RELAP5, 100 s
S-RELAP5, 300 s
Figure 4.166: Temperature Distribution in the Vessel Wall – S-RELAP5 versus Exact Solution
EMF-2103(NP)
Revison 2Realistic Large Break LOCA Methodology for Pressurized Water Reactors Page 4-306
AREVA NP Inc.
4.3.4 Application of Code Biases
This section summarizes the biases applied to the assessments presented in the previous
sections. The biases were developed from uncertainty analyses performed on the SETs. In
most instances, each bias developed has an uncertainty associated with it, but the uncertainties
were not included in the assessments.
The biases listed below were taken from Table 4.22:
Listed in Table 4.25 are the assessments and the biases used in those assessments. [
]

EMF-2103(NP)
Revison 2Realistic Large Break LOCA Methodology for Pressurized Water Reactors Page 4-307
AREVA NP Inc.
Table 4.25: Biases Used in Assessments
EMF-2103(NP)
Revison 2Realistic Large Break LOCA Methodology for Pressurized Water Reactors Page 4-308
AREVA NP Inc.
4.4 Determine Effect of Scale (CSAU Step 10)
The basis for the analysis of a LBLOCA is the entire methodology being used, not just the base
code, S-RELAP5. When S-RELAP5 is referenced in this section, it means the combination of
the code and the associated methodology. As noted in Appendix C of Reference 4, there are
two premises upon which the scalability of the methodology is based. The first premise is that
the tests are scalable to a LBLOCA and the second is that the models in S-RELAP5 and the
implementation result in scalability of the code predictions. For the first premise to be true, the
selection of tests needs to be such that all of the important phenomena in a PWR LBLOCA are
captured by one or more appropriately scaled tests. For the second premise to be true, the
phenomenological models in S-RELAP5 should apply to both the PWR LBLOCA and the scaled
test.
Throughout the assessment program (Reference 5), S-RELAP5 was used to simulate a variety
of tests. These tests are a significant portion of the basis for the RLBLOCA methodology,
having been used to demonstrate the ability of S-RELAP5 to predict the test outcomes.
Because of the cataclysmic nature of a design-basis LBLOCA, no tests exist that fully replicate
a LOCA at full-scale. All of the IETs and some of the SETs are scaled. One exception is the
UPTF, which is full-scale, but has no core and no steam generators. The ability of the scaled
tests to capture the phenomena of a LBLOCA is then pivotal to the applicability of the
assessments for S-RELAP5.
4.4.1 Test Scaling
Tests are scaled to preserve certain features of the full-scale phenomena. For this reason, tests
with different scaling are used to address different phases or aspects of a LBLOCA. If a test is
considered appropriately scaled for the phenomena of interest, then assessment conclusions to
that data is considered applicable to the full-scale NPP. A common scaling approach,
power-to-volume ratio, was shown (Reference 36) to preserve system response results as
substantially the same under most circumstances. Its application and other approaches are
discussed in reference to specific portions of the methodology in the following subsections.
EMF-2103(NP)
Revison 2Realistic Large Break LOCA Methodology for Pressurized Water Reactors Page 4-309
AREVA NP Inc.
4.4.1.1 Blowdown
Power-to-volume scaling for the blowdown period was demonstrated in Reference 4. Five
system tests with powers from 1/48th of a typical PWR to 1/30,000th were used as a basis for the
comparison. Each of these facilities was scaled such that the ratio of power to volume was
preserved. The peak temperature during blowdown was plotted as a function of linear power for
each of these test facilities. The measured peak temperatures all fell within 350 °F of a linear
regression line (temperature versus LHGR). The data scatter for a single facility was as great
as, or greater than, any differences between facilities. As a result, it is concluded that tests
which preserve the power-to-volume ratio of a PWR will scale properly for the blowdown phase
of the LBLOCA.
4.4.1.2 Refill
During refill and early reflood, scale dependent multi-dimensional flow behavior has been
observed in the downcomer for facilities using power-to-volume scaling. The Semiscale and
LOFT facilities were compared for analogous tests in Reference 36. Under ideal scaling, the
two tests should have shown the same behavior. However, during the refill portion of the
simulation, the downcomer flow was observed to be generally upward for the Semiscale test
before the pressure increase accompanying the emptying of the accumulator. For the
analogous test in the LOFT facility, the flow was asymmetric; downward for the regions near the
intact loop and upward for the region near the broken loop. This was attributed to differences in
the downcomer gap and the distance between the cold leg penetrations. This allows
multi-dimensional flow effects to dominate the flow in the LOFT facility, whereas they do not
occur to the same extent in the Semiscale facility. The downcomer gap, volume and surface
area-to-fluid volume ratios do not scale between these two facilities in such a manner as to
preserve the transit time and the heat transfer to the fluid from the walls.
The UPTF facility (Reference 37) was designed to simulate a four-loop 3900 MWt PWR primary
system and to provide a full-scale simulation of thermal-hydraulic behavior in the primary
system during the end of blowdown and refill phases of a PWR LBLOCA. The reactor vessel,
the core barrel, and the greater part of the vessel internals are full-sized representations of the
reference PWR, as are the four hot and cold legs that simulate three intact loops and one
broken loop. The dimensions of the test vessel are those of the reactor pressure vessel of the
reference PWR, with the exception that the vessel wall is thinner. The downcomer annulus,
EMF-2103(NP)
Revison 2Realistic Large Break LOCA Methodology for Pressurized Water Reactors Page 4-310
AREVA NP Inc.
which is formed by the vessel wall and the core barrel, has a gap width that varies from
0.25 meters (0.82 feet) in the lower part to 0.21 meters (0.69 feet) in the upper part. The loop
geometry and flow areas correspond to the 4-loop PWR.
With the exception of the wall thickness, the UPTF is full-scale. The hot-wall effect should be
slightly under-estimated, because of the slight reduction in vessel mass and stored energy.
However, there is an ample amount of metal in the vessel so that the UPTF tests are applicable
to the refill portion of a LBLOCA.
4.4.1.3 Reflood
Scaling issues associated with reflood were addressed in Reference 4, where the effects of refill
scaling were removed from the data by comparing the temperature rise to reflood rates. The
temperature rise considered is the change from the beginning of reflood to the PCT.
Temperature rise data were collected for eight facilities with volumes scaled from 1/21st to
1/1700th, all of which were power-to-volume scaled. Figure 34 of Reference 4 compares the
temperature rise for all eight facilities to the reflood rate. The data were fit with a regression
relation and the tolerance bands added. As with the blowdown data, the spread in the data for a
single facility was as great as or greater than the difference between the facilities. Tests which
scale by maintaining the power-to-volume are applicable to the reflood phase of a LBLOCA.
4.4.2 Code Scaling
The issue of code scaling is primarily determined by the ability of the correlations and closure
relations used to describe complicated thermal-hydraulic phenomena that are not treated from a
mechanistic, theoretical approach. Generally, phase transitions, heat transfer, phasic
interactions and CHF fall in this category. The models, correlations, and closure relations used
in S-RELAP5 are described in Reference 11. To a lesser extent, the numerical implementation
may be subject to scaling issues. Generally, issues of numerics are treated by addressing the
converged nature of the nodalization and time step criteria. This demonstrates that the
computer code can solve the mathematical model correctly over the applicable range for the
tests and a LBLOCA. This leaves the issue of scaling of the correlations and the closure
relations employed in LBLOCA analysis.
EMF-2103(NP)
Revison 2Realistic Large Break LOCA Methodology for Pressurized Water Reactors Page 4-311
AREVA NP Inc.
Code scaling evaluation will focus on those items identified by the sensitivity studies of PIRT
phenomena as having the greatest impact on LBLOCA. Table 4.1 shows the results of
sensitivity studies on the PIRT phenomena in a PWR LBLOCA. The models, related to these
phenomena and the scalability of each of these models, are discussed in the following
paragraphs.
Items related to fuel rod performance are not affected by scaling, because the basis for the
fuel-stored energy and dynamic response are based on COPERNIC2 (Reference 10) and
RODEX3A (Reference 8), each of which was benchmarked to data from actual fuel rods.
4.4.2.1 Post-CHF and Reflood Heat Transfer
When heat flux from the fuel rods and any other metal masses exceeds the CHF, the heat
transfer is calculated using correlations specific to the heat transfer regimes. The single-phase
vapor, transition boiling and film boiling regimes constitute the post-CHF heat transfer regimes.
For each of these regimes, the effects of radiation heat transfer also are considered.
Single-phase vapor heat transfer is the maximum of the Wong-Hochreiter correlation
(Reference 38) for forced flow regimes (turbulent and laminar) and the turbulent natural
convection heat transfer recommended by Holman (Reference 39). In general, the
Wong-Hochreiter correlation determines the heat transfer.
The natural convection heat transfer model is based on data from the flow between vertical
plates. If the boundary layer is small compared to the diameter of the rod, then heat transfer
through this layer would be very similar to that through the boundary layer on a plate. With the
Prandtl number near unity and the rod diameter large compared to the boundary layer, the
Holman formulation for natural convection heat transfer used in S-RELAP5 applies
(Reference 40) as long as
( ) 25.035 −⋅≥ GrLD ,
where D is the rod diameter, L is the length used in calculating the Grashof number and Gr is
the Grashof number. When these conditions are met, the flat plate solution does not differ by
more than 5 percent from the solution for the cylinder. In the turbulent flow regime, this implies
0.02 ≤ D/L ≤ 0.2. For a 17x17 fuel design, with a pin diameter of 0.376 inches, the length can
be as low as 1.9 inches and as large as 19 inches. Within the RLBLOCA methodology, normal
EMF-2103(NP)
Revison 2Realistic Large Break LOCA Methodology for Pressurized Water Reactors Page 4-312
AREVA NP Inc.
heat transfer lengths in the core [
] . These fall well within the range of applicability of the natural convection heat transfer
correlation.
The Wong-Hochreiter correlation was developed from steam cooling tests performed on the
FLECHT-SEASET test facility; consequently it is scaled to the desired geometry. The steam
temperature data was taken at low pressure and temperature for Reynolds numbers ranging
from 3,000 to 20,000 with provisions for lower Reynolds numbers. The Reynolds and Prandtl
numbers are functions of thermodynamic and transport properties and scale appropriately with
pressure and temperature. Figure 4.167 shows the data from Figure 4-10 of Reference 38
along with the Wong-Hochreiter fit. In this figure, the Dittus-Boelter correlation (Reference 41) is
shown for comparison to demonstrate its inadequacy when applied to tube bundle geometries.
In conclusion, the model for single-phase vapor heat transfer used in S-RELAP5 can be applied
to a full-scale PWR LBLOCA.
Transition boiling is not really a heat transfer regime in the sense that it can be characterized by
a homogeneous, steady, heat transfer mechanism. It is a combination of dynamically varying
heat transfer mechanisms, including nucleate boiling, film boiling and vapor heat transfer. The
amount of time a region spends in one of these heat transfer modes determines the effective
heat transfer rate. Few measurements are available for transition boiling heat transfer and they
do not cover a wide range. In addition, the unsteady nature of the process makes modeling the
process physically challenging.
Despite the complexity of this regime, exact modeling of the transition boiling heat transfer is not
particularly important for a LBLOCA because most volumes in the core move through this heat
transfer regime rather quickly and are not sensitive to the details of the modeling. The main
requirement for simulating a LBLOCA is that the point at which the code predicts the beginning
and end of the transition region be reliable. In addition, the heat transfer in the transition region
should be significantly better than the vapor heat transfer and it should remain below the CHF.
The value of CHF in this region is computed using the modified Zuber CHF correlation
(Reference 11).
The major assumption in modeling this regime is that it can be modeled by a combination of
steady-state boiling heat transfer to liquid and convective heat transfer to vapor. In this model,
EMF-2103(NP)
Revison 2Realistic Large Break LOCA Methodology for Pressurized Water Reactors Page 4-313
AREVA NP Inc.
the heat flux is bounded by the CHF at the lowest wall temperatures and it approaches the flux
based on single-phase vapor heat transfer as the wall temperature rises. The heat transfer is
based on a modified Chen correlation for transition heat transfer (Reference 17 and 42). This
model makes a smooth transition from the CHF to the single-phase vapor heat transfer, with the
calculated fraction of liquid heat transfer based on the wall temperature. The Chen correlation
was tested against data and behaves adequately, which is sufficient for LBLOCA transition
boiling.
Film boiling occurs when the wall temperature exceeds the minimum temperature for stable film
boiling and the void fraction lies in the appropriate range. The coolant consists of vapor and
water droplets in this mode. The heat transfer mechanisms consist of boiling heat transfer to
liquid droplets, convective heat transfer to vapor, and radiative heat transfer to droplets and
vapor.
[
]
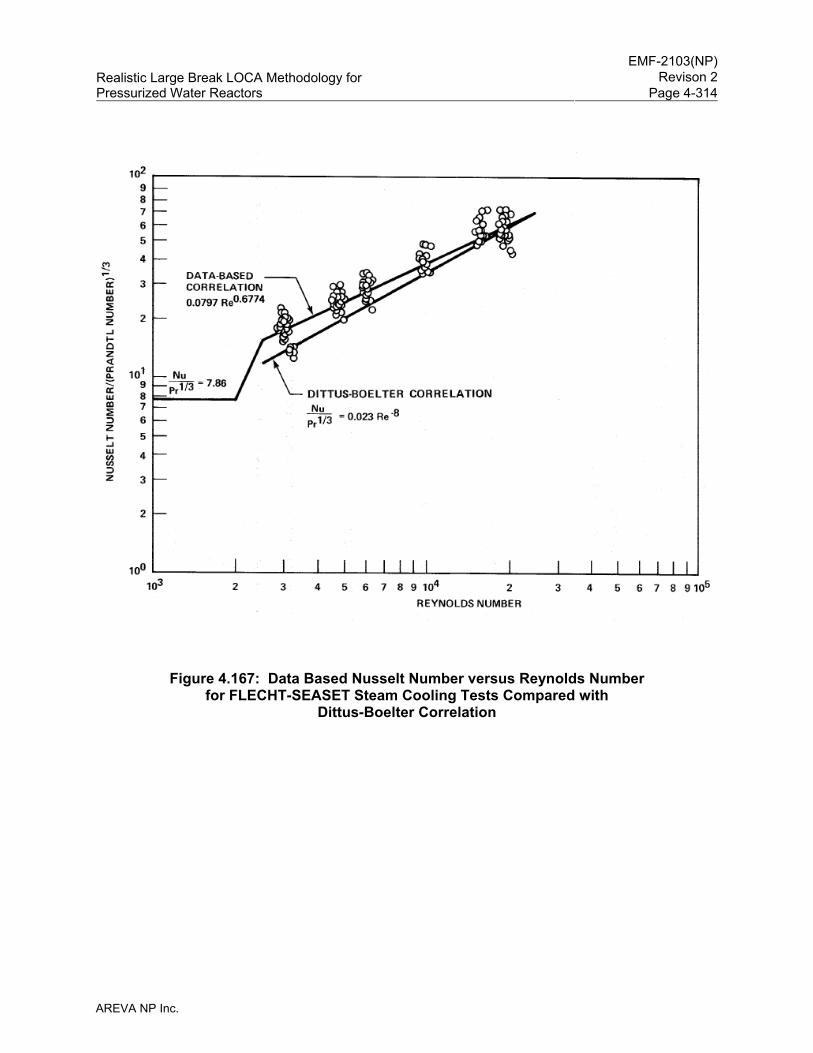
EMF-2103(NP)
Revison 2Realistic Large Break LOCA Methodology for Pressurized Water Reactors Page 4-314
AREVA NP Inc.
Figure 4.167: Data Based Nusselt Number versus Reynolds Number for FLECHT-SEASET Steam Cooling Tests Compared with
Dittus-Boelter Correlation
EMF-2103(NP)
Revison 2Realistic Large Break LOCA Methodology for Pressurized Water Reactors Page 4-315
AREVA NP Inc.
4.4.2.2 Scaling from Tests
While analytical arguments (see prior section) can provide a basis for code scaling for selected
cases, often the issue of scaling needs to be addressed by a comparison to test data. Code
scaling and the tests making up the basis are discussed in the following paragraphs.
4.4.2.2.1 Film Boiling Heat Transfer
A series of tests was performed in the THTF at Oak Ridge National Laboratory to measure heat
transfer at higher pressures and flows. These included 22 steady-state dry-out tests
(Reference 50), three transient boil-off tests (Reference 51) and two sets of transient reflood
tests (References 52 and 53). The reactor core was simulated by an 8x8 array of heated rods
with dimensions corresponding to those of a Westinghouse 17x17 fuel assembly. The axial
power shape was uniform. The FLECHT-SEASET used 161 full-length simulated fuel rods and
axially-dependent power shapes (Reference 23). Based on rod count, these two test facilities
differ by a scaling factor of 2.5.
These tests were used to evaluate the film boiling heat transfer. Table 4.26 compares the
ranges for LBLOCA calculations for parameters that affect heat transfer with the ranges covered
by the THTF tests and FLECHT-SEASET. Given the near prototypic nature of the fuel rod
simulators and the extent to which the tests span the applicable ranges for LBLOCA, it is
concluded that the heat transfer models, including correlations and closure relations, in
S-RELAP5 are sufficient to allow direct application to a PWR LBLOCA and that the uncertainties
obtained from these tests are applicable.
4.4.2.2.2 Core Entrainment
Entrainment of water droplets by the steam flow in the core can affect the predicted core cooling
flow. The primary determinant of entrainment is the drag exerted on the liquid droplets by the
steam flowing up out of the core. This drag, in turn, depends on the vertical flow regime in the
core model. The determinants of the model applicability to a PWR LBLOCA are primarily local
and, in the core, principally related to the conditions within the flow channel between the fuel
rods. The axial effects predominate in this phenomenon. Radial redistribution is a
second-order effect, in that it makes fluid available in a channel or removes it. The RLBLOCA

EMF-2103(NP)
Revison 2Realistic Large Break LOCA Methodology for Pressurized Water Reactors Page 4-316
AREVA NP Inc.
methodology makes use of the TWODEE component in S-RELAP5 to model the radial behavior
in the core.
The tests used in the assessments, CCTF (Reference 31), FLECHT-SEASET (Reference 23),
and THTF (References 50, 51, 52, and 53), use bundles of full-length fuel rods. ACHILLES
(Reference 28) also used full-length rods, but the gaps between the rods and the piping
containing the rods caused some radial flow redistributions which made it less suitable for
confirming scaling of core entrainment. The LOFT and Semiscale Test S-06-03 cores were too
short for entrainment scaling. Based on the comparisons to CCTF, FLECHT-SEASET and
THTF, the core entrainment model in S-RELAP5 is conservative and will scale suitably to a
full-scale PWR LBLOCA.
4.4.2.2.3 Critical Flow at Break
The choked flow model used for AREVA RLBLOCA analyses is the homogeneous equilibrium
model (HEM). Choking for break flow occurs when the flow velocity reaches the speed of sound
at the break. The critical flow model is not scale dependent; however, the Marviken Full-Scale
Critical Flow Test data were used to determine the S-RELAP5 critical flow multipliers and
uncertainties as discussed in Section 4.3. The Marviken test facility and S-RELAP5 results are
discussed in detail in Section 3.5 of Reference 5.
The test facility consists of four major components: a full-scale BWR vessel, a discharge pipe
attached to the bottom of the vessel, a test nozzle connecting to the downstream end of the
discharge pipe, and a rupture disk assembly attached to the downstream end of the nozzle.
Nozzles of various length-to-diameter ratios are used in the tests. The Marviken test data are
widely used in assessing critical flow models of various system codes over a range of flows to
confirm the scalability. The Marviken tests provide a suitable basis for code scaling verification
and the determination of uncertainties.
4.4.2.2.4 Carry-over to Steam Generator
Steam binding during the reflood phase of a LBLOCA in a PWR occurs as a result of steam
production in the steam generator. This steam production occurs when water carried over from
the core enters the hot steam generator. The resulting vaporization expansion increases the
EMF-2103(NP)
Revison 2Realistic Large Break LOCA Methodology for Pressurized Water Reactors Page 4-317
AREVA NP Inc.
pressure drop through the steam generator and produces steam binding that reduces the core
reflood rate.
Several UPTF, SCTF and CCTF tests were used to benchmark and verify the RLBLOCA
methodology and S-RELAP5. The UPTF is a full-scale simulation of a German PWR.
However, the geometry of UPTF is also close to a Westinghouse 4-loop PWR. In UPTF, the
steam generators are replaced with steam separators and the pumps are simulated with
mechanical resistance. The CCTF and SCTF are scaled such that they are prototypic of a
Westinghouse PWR in the dimension parallel to flow and scaled down (~0.2) in the orthogonal
directions.
The UPTF has no core per se, and reflood is simulated with steam and water injection in the
core simulator region. The CCTF and SCTF have electrically heated rods in the core. The
upper plenum region was tested at full-scale in the UPTF, as were the hot legs and the steam
generator inlet plenum. The steam generator tubing geometry is prototypical in the CCTF
(although the number of tubes is smaller). In SCTF, a steam-water separator is used instead of
an active steam generator. As discussed in Section 4.3.3.1.4 and 4.3.3.1.6, several input
options are developed to make sure that an acceptable amount of liquid that is entrained to the
upper plenum during the reflood phase of a large break LOCA is carried over to the steam
generator tube region. One of the input options is the [
] . These input options are used in the UPTF, SCTF, and
CCTF tests assessments. In all the assessments, S-RELAP5 entrained an acceptable amount
of liquid into the steam generator tube (or tube simulator) region. While each test by itself has
some deficiencies in terms of simulating a PWR and in terms of scale, the combination of the
simulation of tests from these three different test facilities provides a substantial basis to justify
the ability of the code to calculate an acceptable amount of liquid entrainment into the steam
generator tube region during the reflood phase of a large break LOCA in a PWR.
4.4.2.2.5 Pump Scaling
The S-RELAP5 code uses normalized single-phase homologous curves for a full-scale reactor
coolant pump as code input. The use of full-scale data for the pump makes code scaling moot
for the pump. These homologous curves are set to applicable values by entering plant-specific
values for rated head, torque, moment of inertia, etc. The coastdown of the pump is driven by
the torque and moment of inertia of the rotating mass. The torque includes the effects of friction
EMF-2103(NP)
Revison 2Realistic Large Break LOCA Methodology for Pressurized Water Reactors Page 4-318
AREVA NP Inc.
and back EMF (pump torque) and of the loop pressure losses (hydraulic torque). Although the
two-phase degradation of RCP performance is not considered a phenomenon of significance
(Table 3.1), the single-phase pump head and torque curves are adjusted for two-phase effects
based on the EPRI two-phase degradation data (Reference 54). The pumps in the EPRI test
program are similar to PWR coolant pumps and the data represents a best estimate
approximation of both the single phase and two phase performance.
4.4.2.2.6 Cold Leg Condensation
As discussed in Section 4.3.3.2, several EPRI 1/3 scale tests, in combination with UPTF Test 8
Phase A (Run 111) and Phase B (Run 112) and Test 25, were simulated using S-RELAP5. The
simulation results were used to develop the biases (multipliers) on the liquid-side (CONMAS)
and vapor-side (CONMSG) interphase heat transfer coefficients. The tests selected generally
cover both the accumulator and pumped injection period of the LOCA transient. In addition,
additional EPRI tests were simulated using S-RELAP5 and the results are discussed in
Section 4.3.1.9. The UPTF is close to a full-scale facility and the EPRI test facility is a 1/3rd
scaled facility.
Correlations based on the Stanton numbers are used to calculate the interphase condensation.
These correlations are generally insensitive to geometry as demonstrated by the EPRI and
UPTF benchmark results. The interphase heat transfer correlations used in S-RELAP5 are
discussed in detail in Section 3.4 of Reference 11.
In summary, with the biases determined from the tests conducted in these facilities, S-RELAP5
will calculate acceptable condensation in the cold legs during a large break LOCA in a PWR.
4.4.2.2.7 ECC Water Bypass of Downcomer during Refill and Lower Plenum Sweep-Out
The S-RELAP5 code prediction of the ECC bypass during the refill phase of a LOCA was
demonstrated to be conservative through the assessment of UPTF Tests 6 and 7
(Section 4.3.1.11.1 and Reference 5). In addition, a CCFL correlation developed by MPR
Associates is used in the sample plant cases given in Appendix B to demonstrate S-RELAP5
conservatively calculates the bottom of core recovery (or beginning of core reflood) time.
As discussed in Section 4.3.1.11.1, UPTF Tests 6 and 7 were steady-state downcomer counter
current flow tests. UPTF Tests 6 and 7 were specifically designed under the 2D/3D program to
EMF-2103(NP)
Revison 2Realistic Large Break LOCA Methodology for Pressurized Water Reactors Page 4-319
AREVA NP Inc.
examine downcomer countercurrent flow behavior, ECC bypass, and lower plenum refill during
the refill phase in plants with cold leg ECC injection. In these tests the lower plenum fill rate
was measured as a function of time. The comparison of the lower plenum liquid level for UPTF
Test 6 is provided in Figure 4.63 through Figure 4.67 and for UPTF Test 7 in Figure 4.68. The
liquid level comparisons show S-RELAP5 underpredicts the lower plenum level which indicates
the code is overpredicting ECC bypass. Since UPTF is a full scale test facility, results from the
Tests 6 and 7 simulations demonstrate S-RELAP5 will conservatively calculate ECC bypass,
lower plenum fill, and the core recovery time during the LOCA in a PWR.
Under the 2D/3D program, MPR Associates developed a Wallis-type CCFL correlation using
UPTF data from the steady-state countercurrent flow tests (which included UPTF Test 5,
Phase B, and UPTF Tests 6 and 7) to calculate the liquid downflow into the lower plenum during
the refill phase:
The details of this CCFL correlation are given in Reference 26. In this correlation, *,effgJ is the
net steam flow rate available to entrain the ECC liquid to the break and its value determines the
potential for ECC bypass. If *,effgJ is zero, or negative, the steam flow is insufficient to entrain
liquid, and bypass will not occur (complete end-of-bypass). If *,effgJ is positive, then partial or
full bypass occurs.
Since the correlation is normalized using the downcomer flow area and circumference, it is
directly applicable to calculate the ECC bypass in the plant during the refill phase. This
correlation has already been approved by the NRC to calculate the complete end-of- bypass
time ( *,effgJ < 0.0) as part of AREVA’s Appendix K-based Recirculating Steam Generator
Evaluation Model (Reference 55).
The correlation is used in the sample plant cases discussed in Appendix B to estimate the
beginning of core reflood time in order to demonstrate S-RELAP5 will calculate the beginning of
core reflood time appropriately. To estimate the beginning of core reflood time, the correlation
is used to calculate the complete end-of-bypass time. At this time the liquid volume in the lower
EMF-2103(NP)
Revison 2Realistic Large Break LOCA Methodology for Pressurized Water Reactors Page 4-320
AREVA NP Inc.
head, lower plenum, and downcomer below the active core region is determined. Knowing this
time, the ECC injection rates in the intact cold legs and the remaining fluid volume below the
active core region that need to be filled with water, the beginning of core reflood time can be
estimated. The results for the sample cases (Figure B.18, Figure B.36, Figure B.53, and
Figure B.71) demonstrate S-RELAP5 calculates the beginning of core reflood time
appropriately.
The highly separated flow behavior observed in the full-scale UPTF tests (see Figure 4.1-3 in
Reference 56) were not observed in scaled facilities like LOFT and Semiscale. Therefore, the
tests conducted in these scaled facilities cannot be used to determine code scalability of ECC
bypass, and the multi-dimensional flow phenomena that will occur in the downcomer and lower
plenum during the refill phase.
In summary, it is demonstrated that S-RELAP5 will appropriately calculate the ECC bypass
during refill and the beginning of core reflood time during the large break LOCA in a PWR.
4.4.2.2.8 Loop Oscillations
UPTF Test 8 (References 57 and 58) investigated the behavior during the end-of-blowdown,
refill, and reflood phases of a postulated LOCA with cold leg ECC injection. The focus of the
test was the pressure and fluid oscillations in the cold legs. These oscillations arise when the
steam is condensed by the ECC water and forms a liquid plug in the cold leg. The ECC flow
rate was varied from typical accumulator flows down to pumped injection flows. The test results
show the flow regimes switching from the slug (plug) flow during the accumulator injection
period to stratified flow during the pumped injection period. Test 8, Runs 111 and 112, were
performed by isolating one intact loop at the pump simulator, opening a second intact loop to
stabilize the pressure drop between the upper plenum and the downcomer, opening the break
valves on the broken loop, injecting steam into the test vessel, and varying ECC water injection
into the third intact loop cold leg downstream from the pump simulator. The S-RELAP5
simulation of the Test 8 modeled the cold leg piping for the third loop from the steam generator
simulator to the pump simulator (including loop seal), the pump simulator, and the cold leg
piping from the pump simulator to the vessel downcomer; all of which are full-scale.
The simulation is discussed in Section 4.3.1.11.2. S-RELAP5 predicted the observed flow
regimes reasonably well which indicate the code is capable of calculating the appropriate

EMF-2103(NP)
Revison 2Realistic Large Break LOCA Methodology for Pressurized Water Reactors Page 4-321
AREVA NP Inc.
phenomena associated with steam-ECC mixing in the cold leg in the plant. However, since the
complete UPTF primary system was not modeled using S-RELAP5, the system oscillations
were not calculated by the code.
The CCTF, SCTF and LOFT benchmarks (Sections 4.3.1.12, 4.3.1.13, and 4.3.2.1,
respectively) compared the calculated and measured differential pressures. The results show
the code calculated acceptable oscillations during the refill and reflood phases.
In summary, from the simulation of the above tests, it can be concluded that S-RELAP5 will
calculate the acceptable loop oscillations during a large break LOCA in a PWR.
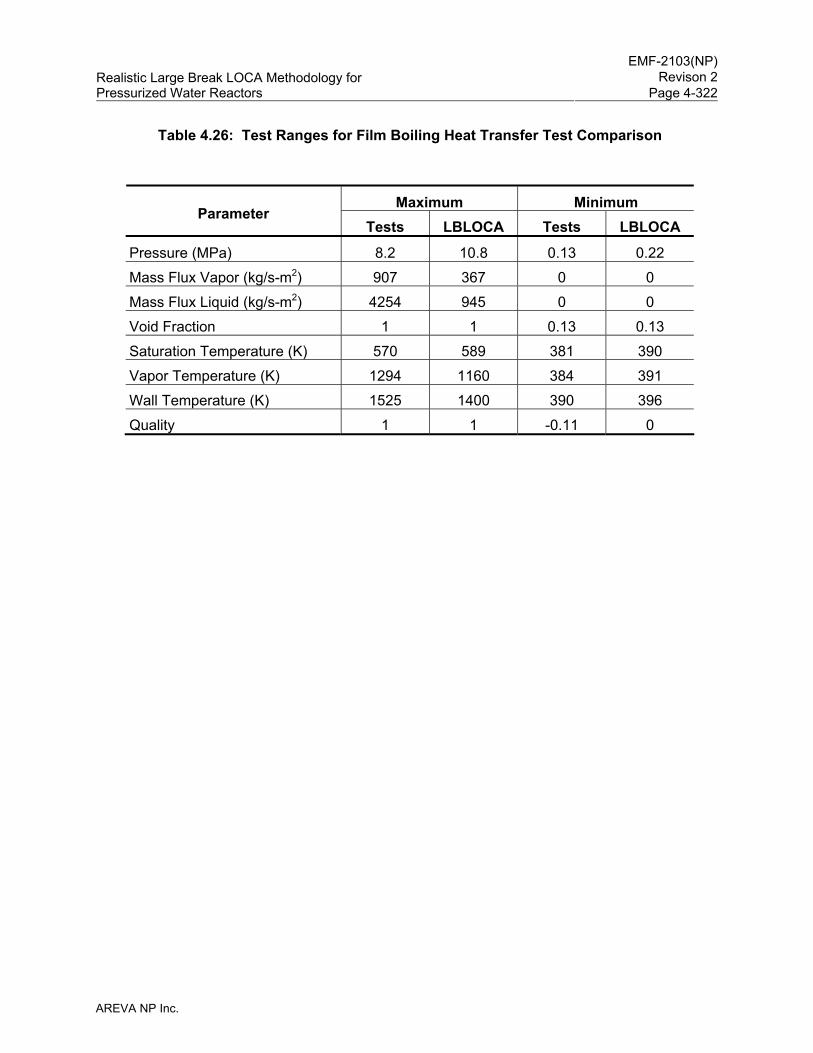
EMF-2103(NP)
Revison 2Realistic Large Break LOCA Methodology for Pressurized Water Reactors Page 4-322
AREVA NP Inc.
Table 4.26: Test Ranges for Film Boiling Heat Transfer Test Comparison
Maximum Minimum Parameter
Tests LBLOCA Tests LBLOCA
Pressure (MPa) 8.2 10.8 0.13 0.22
Mass Flux Vapor (kg/s-m2) 907 367 0 0
Mass Flux Liquid (kg/s-m2) 4254 945 0 0
Void Fraction 1 1 0.13 0.13
Saturation Temperature (K) 570 589 381 390
Vapor Temperature (K) 1294 1160 384 391
Wall Temperature (K) 1525 1400 390 396
Quality 1 1 -0.11 0
EMF-2103(NP)
Revison 2Realistic Large Break LOCA Methodology for Pressurized Water Reactors Page 5-1
AREVA NP Inc.
5.0 Sensitivity and Uncertainty Analysis
The objective of this section is to describe how plant compliance to the criteria of 10 CFR 50.46
with high probability is demonstrated. For the AREVA RLBLOCA evaluation model, high
probability was defined as having 95 percent confidence that 95 percent of LBLOCAs will meet
the acceptance criteria of 10 CFR 50.46. This is accomplished by applying non-parametric
statistical techniques to the calculation results of the evaluation. The key premise is that the
RLBLOCA evaluation tool, S-RELAP5 and the attendant codes, is accurate in representing the
possible LBLOCAs and the frequency with which specific LBLOCA results will occur. Thus,
S-RELAP5 contains the domain of all possible LBLOCA results within the scenario defined in
Section 3.1. Extracting information about this domain is done by random sampling (running
individual LOCA calculations referred to as cases or events) with random values for the initial
conditions and the parameter values, including those that alter the simulation of important
phenomena and deducing from those samples the content of the domain. To accomplish this
entails two requirements: 1) the calculation evaluation tool, S-RELAP5 and COPERNIC2 or
RODEX3A, must be established as sufficiently accurate or conservatively biased such that any
calculation provides a result that is accurate or conservative for the sampled choices and 2) a
method of evaluating the results sampled from the domain be established to provide accurate
probability and confidence. Section 5.1 presents the establishment and evaluation of the first
requirement, and Sections 5.2 and 5.3 present the second. Sample RLBLOCA evaluations
illustrating the analysis steps described below are provided for representative Westinghouse 3-
and 4-loop and CE 2x4 plants in Appendix B.
5.1 Determination of the Effect of Reactor Input Parameters and State (CSAU Step 11)
The uncertainties associated with the prediction of LOCA results can be categorized into three
groups:
1. Fixed design factors (e.g., system geometry, etc.) that do not change, but that can still only be rendered in approximation,
2. Operational processes (e.g., core power peaking, etc.), which do not change during the transient, but vary across the spectrum of conditions at which a LOCA may occur, and
EMF-2103(NP)
Revison 2Realistic Large Break LOCA Methodology for Pressurized Water Reactors Page 5-2
AREVA NP Inc.
3. Phenomena, which evolve during the transient (e.g., core heat transfer coefficients, etc.), and may take on differing normalized performance across the spectrum of LOCAs within the domain.
The treatment of fixed design factors and operational processes are discussed in Section 5.1.1
and Section 5.1.2, respectively. The treatment and development of uncertainty distributions for
phenomena is presented in Section 4.3 and Section 4.4.
5.1.1 Fixed Design Factors
Uncertainties associated with fixed design parameters are addressed by maintaining adherence
to nodalization guidelines and identifying phenomenological uncertainties from code
assessment studies applying those guidelines. Within the development of the methodology the
guidelines for fixed structure or condition are applied, contingent on experimental restrictions, to
a wide variety of experiments and benchmark evaluations, Section 4.0. The benchmarks serve
to develop the uncertainties of correlations or phenomena modeling and to establish the ability
of the modeling guidelines to produce fixed design models capable of allowing replication of the
LOCA physical phenomena. This is the subject of the entire Section 4.0 and discussed
specifically in Sections 4.2 and 4.3, which describe CSAU Steps 8 and 9.
5.1.2 Operational Process
In contrast to phenomenological or fixed design factors, process parameters characterize the
state of operation of the plant and are, to various degrees, controllable by plant operators such
that realistic variations can be expected. The importance of these parameters must be
established and, for those of significance, the ability of the model to predict appropriate results
must be validated and an appropriate uncertainty distribution established.
5.1.2.1 Determining Important Process Parameters
From an operational standpoint, the NPP operating state is a function of the time in cycle
(burnup and power distribution) and the actual conditions present in the various NPP
components. Treating these process parameters statistically accounts for higher order behavior
by including all possible combinations in the domain of possible LOCAs.
EMF-2103(NP)
Revison 2Realistic Large Break LOCA Methodology for Pressurized Water Reactors Page 5-3
AREVA NP Inc.
As part of the AREVA RLBLOCA methodology development, a review was performed to identify
the NPP parameters that are to be addressed in the performance of a LBLOCA analysis. The
identified parameters are provided in Table 5.1. The basis for inclusion in this list comes from
three sources: PIRT, plant-specific technical specifications, and utility requests.
Determination of which process parameters to treat statistically begins with identifying the
relationship a particular parameter has to any PIRT phenomenon. Table 5.2 lists process
parameters determined to be important based on their potential influence to the
moderate-to-high ranked phenomena given in the PIRT, Table 3.1.
A refinement of the conclusions presented in Table 5.1 and Table 5.2 based on sensitivity
studies is within the precepts of the methodology. Such studies can be employed to adopt a
bias over an uncertainty distribution for process parameters or to assist in the quantification of
an uncertainty range or distribution.
Other process parameters are considered of lower importance and are generally treated on a
nominal basis. As with any parameter, there is no prohibition to treating these parameters on a
statistical basis.
5.1.2.2 Quantifying Uncertainty for Process Parameters
To treat a parameter statistically, the parameter uncertainty must be quantified in terms of
biases and distributions. Quantifying this uncertainty with plant data is the best approach. At
most plants, histories of parameters values such as RCS flow rate, core inlet temperature,
pressurizer condition, accumulator parameters, and containment temperature are maintained
and useable for quantifying RLBLOCA analysis uncertainties. Operational uncertainty is defined
as the true fluctuation of a parameter during normal operation. Setting the uncertainty
distribution for a process parameter requires addressing the impact of measurement uncertainty
for the parameter.
The choice of distribution may be influenced by how a utility manages a given process
parameter. For example, using a uniform distribution may properly reflect the control provided
for a parameter, if that control is random within a range. A uniform distribution is also
considered a conservative approach in that equal likelihood is given for values at the limits of
the distribution where the strongest influence is expected. However, if the there is an
EMF-2103(NP)
Revison 2Realistic Large Break LOCA Methodology for Pressurized Water Reactors Page 5-4
AREVA NP Inc.
expectation that the true distribution is substantially non-uniform, the actual distribution can be
used.
As shown in Table 5.1, some parameters lack explicit definition (technical specifications or
data). For parameters for which no plant data are available, ranges may be established based
on physical constraints or by analytical methods. An example of a physical limit is ranging the
reactor vessel upper head temperature to a maximum value of the hot leg temperature. It may
also be demonstrated that a particular parameter has a limited range of influence based on a
set of sensitivity studies.
5.1.2.3 Treatment of Time in Cycle
The time in cycle establishes the fuel rod properties and the lower bound for the global power
peaking factor, Fq. Power history calculations are performed using an NRC-approved
methodology (References 59 and 60). Typically, fuel rod data for 20 to 40 burnup steps are
explicitly written from a cycle power history calculation. The methodology examines potential
limiting fuel conditions during both the first and second cycle of fuel rod operation. Fuel rod data
are, therefore, provided for the first and second cycle of fuel rod operation. Third cycle fuel is
sufficiently depleted that it can not rise to the possibility of being the limiting fuel within the core
and is not evaluated by the methodology.
In contrast to a traditional safety analysis, which assumes conservative fuel rod models
consistent with Appendix K requirements, [
]
EMF-2103(NP)
Revison 2Realistic Large Break LOCA Methodology for Pressurized Water Reactors Page 5-5
AREVA NP Inc.
4. [ ]
The data produced by this method are used primarily to develop input for the RODEX3A or
COPERNIC2 fuel rod sub-codes within S-RELAP5. [
]
5.1.2.4 Treatment of Axial and Radial Power Shapes
Once the fuel rod histories for the fuel rod sub-code are found as described above, the axial and
radial power shapes for the S-RELAP5 core model are selected as follows. To support plant
Technical Specification for the core peaking factor, Fq, the axial power shape must be adjusted
from the nominal axial power shape extracted for the limiting fuel rod. During normal operation,
Fq will likely occur relatively near the nominal Fq represented in the power history files. [
] The resultant normalized axial power distribution is used for fresh fuel in
all core radial regions and the supplemental hot rods representing fresh fuel. Similar
calculations are performed to select an axial profile for once-burned fuel using a different table
of shapes generated at applicable burnups.
EMF-2103(NP)
Revison 2Realistic Large Break LOCA Methodology for Pressurized Water Reactors Page 5-6
AREVA NP Inc.
5.1.2.5 Treatment of GDC-35 Criteria
GDC-35 states that the plant shall be able to mitigate design basis accidents with or without off
site power available. The methodology does this by determining the most severe condition
between these two configurations and then performing the RLBLOCA statistical analysis for the
plant with off site power availability set to the most severe condition. Further details are
provided in Appendix B, Section B.1.3.
5.2 Performance of NPP Sensitivity Calculations and Determination of Combined Bias
and Uncertainty (CSAU Steps 12 and 13)
As previously discussed, the evaluation applies non-parametric statistical techniques. To do
this, the calculation of several individual LOCA possibilities must be conducted. Each of these
possibilities must have the performance of key parameters or conditions determined randomly.
This is accomplished by assigning an individual PDF to each of the parameters to be varied or
sampled by the methodology. The PDFs are then seeded, using standard techniques, with
independent random numbers to specify the performance of each parameter for a given case.
After the accumulation of the results for several possible LOCAs, the group of results is
evaluated to determine the probability of compliance to LOCA criteria.
5.2.1 Statistical Approach

Realistic Large Break LOCA Methodology forPressurized Water Reactors
AREVA NP Inc.
EMF-2103(NP)Revison 2Page 5-7
Realistic Large Break LOCA Methodology forPressurized Water Reactors
• First step: Defining the partition function
AREVA NP Inc.
EMF-2103(NP)Revison 2Page 5-8

EMF-2103(NP)
Revison 2Realistic Large Break LOCA Methodology for Pressurized Water Reactors Page 5-9
AREVA NP Inc.
• Second step : sorting the samples
.
• Third step : constructing the blocks
• Fourth step: Constructing the tolerance region

EMF-2103(NP)
Revison 2Realistic Large Break LOCA Methodology for Pressurized Water Reactors Page 5-10
AREVA NP Inc.

EMF-2103(NP)
Revison 2Realistic Large Break LOCA Methodology for Pressurized Water Reactors Page 5-11
AREVA NP Inc.

EMF-2103(NP)
Revison 2Realistic Large Break LOCA Methodology for Pressurized Water Reactors Page 5-12
AREVA NP Inc.
EMF-2103(NP)
Revison 2Realistic Large Break LOCA Methodology for Pressurized Water Reactors Page 5-13
AREVA NP Inc.
5.2.2 Application of Methodology
The AREVA RLBLOCA methodology is a statistics-based methodology; therefore, the
application does not involve the evaluation of different deterministic calculations. Instead, a
minimum set of LOCA calculations, consistent with the previous table, are performed with the
EMF-2103(NP)
Revison 2Realistic Large Break LOCA Methodology for Pressurized Water Reactors Page 5-14
AREVA NP Inc.
values of key parameters randomly varied over identified uncertainty ranges. As previously
explained, the methodology has the advantage of being able to treat a large number of
parameters by randomly varying each parameter in each single calculation. This random
selection process is repeated to define a large number of RLBLOCA calculations, all of which
are then run. [
]
5.3 Determination of Combined Bias and Uncertainty and Determination of Total
Uncertainty (CSAU Steps 13 and 14)
CSAU Step 13 provides for the determination of the combined bias and uncertainty for the NPP.
This is basically the application of the process described in Section 5.2. The procedure is
executed for each of three sample problems in Appendix B.
The total uncertainty for the evaluation is determined by comparing the bounding parameter
value for the limiting parameter to the 50/50 probability value for that parameter within the
domain defining the high probability of compliance. Examples of this value are also reported for
each of the sample problem in Appendix B.

EMF-2103(NP)
Revison 2Realistic Large Break LOCA Methodology for Pressurized Water Reactors Page 5-15
AREVA NP Inc.
Table 5.1: NPP Parameters for Consideration in the Performance of a RLBLOCA Analysis
EMF-2103(NP)
Revison 2Realistic Large Break LOCA Methodology for Pressurized Water Reactors Page 5-16
AREVA NP Inc.
Table 5.2: Relationship of PIRT to Operational Parameters
EMF-2103(NP)
Revison 2Realistic Large Break LOCA Methodology for Pressurized Water Reactors Page 6-1
AREVA NP Inc.
6.0 References
1. Emergency Core Cooling Systems; Revisions to Acceptance Criteria, Federal Register, Vol. 53, No. 180, September 16, 1988, 10 CFR Part 50.
2. NUREG/1230, Compendium of ECCS Research for Realistic LOCA Analysis, December 1988.
3. Best-Estimate Calculations of Emergency Core Cooling System Performance, Regulatory Guide 1.157, May 1989.
4. NUREG/CR-5249, Quantifying Reactor Safety Margins, Application of Code Scaling, Applicability, and Uncertainty Evaluation Methodology to a Large Break, Loss-of-Coolant Accident, December 1989.
5. EMF-2102(P) Revision 2, S-RELAP5 Code Verification and Validation, November 2010.
6. EMF-2103(P)(A) Revision 0, Realistic Large Break LOCA Methodology, Framatome ANP Richland, Inc., April 2003.
7. ANF-90-145(P)(A), RODEX3 Fuel Rod Thermal-Mechanical Response Evaluation Model, Volume 1, "Theoretical Manual," and Volume 2, Thermal and Gas Release Assessments, April 1996.
8. EMF-1557(P) Revision 8, RODEX3A: Theory and User's Manual, May 2007.
9. EMF-2417(P) Revision 0, RODEX3A Code Verification and Programmers Guide for Version USEP98, July 2000.
10. BAW-10231P-A Revision 1, COPERNIC Fuel Rod Design Computer Code, AREVA NP Inc., January 2004.
11. EMF-2100(P) Revision 14, S-RELAP5 Models and Correlations Code Manual, December 2009.
12. EMF-2101(P) Revision 3, S-RELAP5 Programmers Guide, May 2004.
13. EMF-CC-097(P) Revision 23, S-RELAP5 Input Data Requirements, October 2009.
14. EMF-CC-039(P) Revision 4, ICECON Code User's Manual: A Computer Program Used to Calculate Containment Back Pressure for LOCA Analysis (Including Ice Condenser Plants), December 2007.
15. EMF-CC-039(P) Supplement 1 Revision 5, ICECON Code User's Manual: A Computer Program Used to Calculate Containment Back Pressure for LOCA Analysis (Including Ice Condenser Plants), July 2007.
16. NUREG-0800, U.S. Nuclear Regulatory Commission Standard Review Plan.
EMF-2103(NP)
Revison 2Realistic Large Break LOCA Methodology for Pressurized Water Reactors Page 6-2
AREVA NP Inc.
17. NUREG/CR-4312, EGG-2396, Revision 1, RELAP5/MOD2 code Manual, Volume 1: Code Structure, Systems Models, and Solution Methods, March 1987.
18. NUREG/CR-5535, INEL-95/0174, RELAP5/MOD3 Code Manual, August 1995.
19. TID-4500, ANCR-1219, CONTEMPT-LT – A computer Program for Predicting Containment Pressure-Temperature Response to a Loss-Of-Coolant Accident, June 1975.
20. NUREG/CR-5535, S. Shieh, V. H. Ransom, R. Krishnamurthy, RELAP5/MOD3 Code Manual, Validation of Numerical Techniques in RELAP5/MOD3, Volume 6, August 1994.
21. R. R. Schultz, RELAP5-3D Code Manual, User's Guidelines, INEEL-EXT-98-00834, February 2001.
22. O. Nylund, et al., Hydrodynamic and Heat Transfer Measurements on a Full-Scale Simulated 36-Rod Marviken Fuel Element with Uniform Heat Flux Distribution, R4-447/RTL-1007, ASEA and AB Atomenergi, 1968.
23. Loftus, M. J. et al, PWR FLECHT-SEASET Unblocked Bundle, Forced and Gravity Reflood Task Data Report, NUREG/CR-1532, Volumes 1 and 2, June 1980.
24. NUREG/CR-2671 MXC-301, The Marviken Full Scale Critical Flow Tests, May 1982.
25. EMF-2102(P) Revision 0, S-RELAP5 Code Verification and Validation Document, Framatome ANP Richland, Inc., April 2003.
26. MPR Report, Summary of Results from the UPTF Downcomer Separate Effects Tests, Comparisons to Previous Scaled Tests, and Application to U.S. Pressurized Water Reactors, MPR-1163, July 1190.
27. MPR Report, Summary of Results from the UPTF Cold Leg Flow Regime Separate Effects Tests, Comparison to Previous Scaled Tests, and Application to U.S. Pressurized Water Reactors, MPR-1208, October 1992.
28. Holmes, B. J, I25 Comparison Report, NEA/CSNI/R(91)1, AEA-TRS-1043, February 1991.
29. NUREG/CR-2256, EPRI NP-2013, WCAP-8891, FLECHT-SEASET Program, PWR FLECHT SEASET Unblocked Bundle, Forced and Gravity Reflood Task Data Evaluation and Analysis Report, November 1981.
30. NUREG/IA-0128, International Code Assessment and Application Program: Summary of Code Assessment Studies Concerning RELAP5/MOD2, RELAP5/MOD3, and TRAC-B, December 1993.
31. Data Report on Large Scale Reflood Test-43 – CCTF CORE-II Shakedown Test C2-SH2 (Run 054), JAERI-memo 58-155, Japan Atomic Energy Research Institute, May 1983.
EMF-2103(NP)
Revison 2Realistic Large Break LOCA Methodology for Pressurized Water Reactors Page 6-3
AREVA NP Inc.
32. E. H. Karb et al., KfK In Pile Tests on LWR Fuel Rod Behavior During the Heatup Phase of a LOCA, KfK 3028, Kemforschunzsgentrum Karlsruhe GmbH, Karlsruhe.
33. J. V. Cathcart and R.E. Pawel, Zirconium Metal-Water Oxidation Kinetics: IV. Reaction Rate Studies, ORNL/NUREG-17, August 1977.
34. Kreyszig, E., Advanced Engineering Mathematics, Second Edition, John Wiley & Sons, Inc., 1967.
35. ANSI/ANS-5.1-1979, American National Standard for Decay Heat Power in Light Water Reactors, approved August 29, 1979.
36. NURGE/CR-0410, Comparisons of Thermal-Hydraulic Phenomena During Isothermal Loss-Of-Coolant Experiments and Effect of Scale in LOFT and SEMISCALE MOD-1, December 1978.
37. UPTF: Program and System Description, U9 414/88/023, Siemens AG, KWU Group (Erlangen), November 1988.
38. Wong, S., Hochreiter, L. E., Analysis of the FLECHT SEASET Unblocked Bundle Steam Cooling and Boiloff Tests, NUREG/CR 1533, EPRI NP 1460, WCAP-9729, January 1981.
39. Holman, J. P., Heat Transfer, 5th Edition, McGraw-Hill, New York, 1981.
40. Gebhart, B., Heat Transfer, 2nd Edition, McGraw-Hill, New York, 1971.
41. Dittus, F. W. and L. M. K. Boelter, Heat Transfer in Automobile Radiators of the Tubular Type, Publications in Engineering, Volume 2, pp. 443-461. University of California, Berkeley, 1930.
42. Chen, J. C., R. K. Sundaram, F. T. Ozkaynak, A Phenomenological Correlation for Post-CHF Heat Transfer, NUREG-0237, June 1977.
43. Bromley, L.A., Heat Transfer in Stable Film Boiling, Chemical Engineering Progress, Volume 46, pp. 221-227, 1950.
44. Berenson, P. J., Film Boiling Heat Transfer from a Horizontal Surface, Journal of Heat Transfer, pp. 351-358, 1961.
45. Drucker, M., Dhir, V. K., Studies of Single and Two Phase Heat Transfer in a Blocked Four Rod Bundle, EPRI-NP 3485, Electric Power Research Institute (1984).
46. M. J. Meholic, L. E. Hochreiter, J. H. Mahaffy, J. Spring, Increased Convective Heat Transfer Caused by Spacer Grids in Laminar High Void Fraction Flows, 2008 ANS Winter Meeting, Reno.
47. S. C. Yao, L. E. Hochreiter and W. J. Leech, Heat Transfer Augmentation in Rod Bundles Near Grid Spacers, Trans. ASME, 104, pp. 76-81, February 1982.
EMF-2103(NP)
Revison 2Realistic Large Break LOCA Methodology for Pressurized Water Reactors Page 6-4
AREVA NP Inc.
48. Sun, K.H., J.M. Gonzales-Santalo and C.L. Tien, Calculations of Combined Radiation and Convection Heat Transfer in Rod Bundles Under Emergency Cooling Conditions, Journal of Heat Transfer, pp. 414-420, 1976.
49. Taylor, D. D. et al., TRAC-BD1/MOD1: An Advanced Best Estimate Computer Program for Boiling Water Reactor Transient Analysis, Volume 1: Model Description, NUREG/CR-3633, EGG-2294, April 1984.
50. NUREG/CR-2435, ORNL-5822, Dispersed Flow Film Boiling in Rod Bundle Geometry – Steady State Heat Transfer Data and Correlation Comparisons, Oak Ridge National Laboratory, March 1982.
51. NUREG/CR-2469, ORNL/NUREG-85, An Analysis of Transient Film Boiling of High-Pressure Water in a Rod Bundle, Oak Ridge National Laboratory, March 1982.
52. NUREG/CR-2455, ORNL-5846, Experimental Investigations of Bundle Boiloff and Reflood Under High-Pressure Low Heat Flux Conditions, Oak Ridge National Laboratory, April 1982.
53. NUREG/CR-2114, ORNL/NUREG/TM-446, ORNL Small-Break LOCA Heat Transfer Test Series I: High-Pressure Reflood Analysis, Oak Ridge National Laboratory, August 1981.
54. Pump Two-Phase Performance Program, EPRI NP-1556, Volumes 1 through 8, September 1980.
55. BAW-10168-A, Revision 3, RSG LOCA – BWNT Loss-of-Coolant Accident Evaluation Model for Recirculating Steam Generator Plants, Volume I – Large Break, December 1996.
56. Damerell, P. S., Simsons, J. W., Reactor Safety Issues Resolved by the 2D/3D Program, NUREG/IA-0127, July 1993.
57. Upper Plenum Test Facility, Test No. 8 Cold/Hot Leg Flow Pattern Test Experimental Data Report, U9 316/88/12, Siemens AG, Erlangen Germany, September 1988.
58. Upper Plenum Test Facility, Test No. 8 Cold/Hot Leg Flow Pattern Test Quick Look Report, U9 316/88/11, Siemens AG, Erlangen Germany, September 1988.
59. XN-75-27(A), Exxon Nuclear Neutronic Design Methods for Pressurized Water Reactors, Exxon Nuclear Company, April 1977.
60. EMF-96-029(P)(A), Reactor Analysis System for PWRs, January 1997.
61. Wilks, S. S., Determination of Sample Sizes for Setting Tolerance Limits, Ann. Math. Stat., Vol. 12, pp. 91-96, 1941.
62. Somerville, P. N., Tables for Obtaining Non-Parametric Tolerance Limits, Ann. Math. Stat., Vol. 29, No. 2, pp 599-601, June 1958.
EMF-2103(NP)
Revison 2Realistic Large Break LOCA Methodology for Pressurized Water Reactors Page 6-5
AREVA NP Inc.
63. An Acceptable Model and Related Statistical Methods for the Analysis of Fuel Densification, Regulatory Guide 1.126, Revision 1, U.S. Nuclear Regulatory Commission, March 1978.
64. A. Wald, An Extension of Wilk’s Method for Setting Tolerance Limits, Annals of Mathematical Statistics, Volume 14 (1943), 45-55.
65. J. W. Tukey, Non-Parametric Estimation. II. Statistically Equivalent Blocks and Tolerance Regions – The Continuous Case, Annals of Mathematical Statistics, Volume 18 (1947), 529-539.
66. A. Guba, M. Makai and L. Pal, Statistical Aspects of Best Estimate Method—I, Reliability Engineering and System Safety 80 (2003), 217–232.
67. Abramowitz, M. and I. Stegun, Handbook of Mathematical Functions with Formulas, Graphs, and Mathematical Tables, National Bureau of Standards, Applied Mathematics Series 55, 1966.
68. NAI 8907-09, Revision 10, Version 7.2b(QA), GOTHIC Containment Analysis Package Qualification Report, EPRI, Palo Alto, California, March 2009.
69. NEA/CSNI/R(2004)19, SEGFSM Topical Meeting on LOCA Fuel Issues, Argonne National Laboratory, May 25-26 2004, Published by Organization for Economic Cooperation and Development Nuclear Energy Agency, Isy-les-Moulineaux, France, November 2004.
70. V. T. Breta, et al., Determination of the Bias in LOFT Fuel Peak Cladding Temperature Data from the Blowdown Phase of Large-Break LOCA Experiments, NUREG/CR-6061, May 1993.
EMF-2103(NP)
Revison 2Realistic Large Break LOCA Methodology for Pressurized Water Reactors Page A-1
AREVA NP Inc.
Appendix A Time Step Sensitivity
For the AREVA RLBLOCA methodology, solution convergence is demonstrated by performing
sensitivity studies in which the calculation time step was varied for three appropriate plant
designs. This is an accepted approach to demonstrate solution convergence while recognizing
that a certain degree of variability is to be expected.
This sensitivity study was performed by first regenerating steady-state plant analysis decks for
three types of plants appropriate for this methodology, i.e., 3- and 4-loop Westinghouse
designs, and a CE design. These decks were then brought to typical steady-state conditions,
and a transient initiated with a DEG break with nominal parameters, other than decay heat.
Each transient used 120 percent of nominal decay heat to drive the temperatures sufficiently
high that code models would be challenged.
The recommended time step selection strategy is to set a single maximum time step during the
portions of the transient of most significance to safety, that is, the blowdown, refill, and early
reflood phases. The requested time step should then be increased during late reflood when the
flooding phenomena are reasonably stable. This approach was found to provide a reasonable
compromise between optimal numerical stability and run time. It should be noted that the time
step requested by the user is actually the maximum time step allowed by the code for that time
period, and that in fact the code will reduce the requested time step should instability be
detected. The nominal or base case used a requested time step of 0.002 seconds from 0 to
400 seconds, and then 0.004 seconds from 400 to 600 seconds, 0.008 seconds from 600 to
800 seconds and 0.010 seconds beyond 800 seconds. Code convergence and stability at the
nominal time step of 0.002 seconds were demonstrated by incrementally varying the time step
from 0 to 400 seconds over a range from the nominal time step to an order of magnitude
smaller.
[
]
EMF-2103(NP)
Revison 2Realistic Large Break LOCA Methodology for Pressurized Water Reactors Page A-2
AREVA NP Inc.
The nominal case for each of the designs noted in the time step sensitivity study was repeated
with this new time step and it was determined that the code continued to proceed through the
analysis with the requested time steps, indicating code stability, with a minor deviation at the
time of quench at the core hot spot.
Figure A.1, Figure A.3, and Figure A.5 show the calculated PCTs from the 3-loop, 4-loop, and
CE studies, respectively. S-RELAP5 shows stability and convergence for all design types
during the blowdown period. During refill and early reflood, there is some noticeable divergence
in the results; however this has little impact on the PCT. Figure A.2, Figure A.4, and Figure A.6
show the variability about the mean PCT from the 3-loop, 4-loop, and CE studies, respectively.
The data for these figures were generated by averaging the calculated PCTs for each design,
and then calculating the maximum deviation, whether it is above or below the mean. As shown
in these figures, the nominal variability for the 3-loop design is approximately 15 K (27 °F), the
4-loop design is approximately 12 K (21 °F), and the CE design is approximately 15 K (27 °F).
[
]
EMF-2103(NP)
Revison 2Realistic Large Break LOCA Methodology for Pressurized Water Reactors Page A-3
AREVA NP Inc.
Figure A.1: Time Step Sensitivity of Westinghouse 3-Loop Analysis
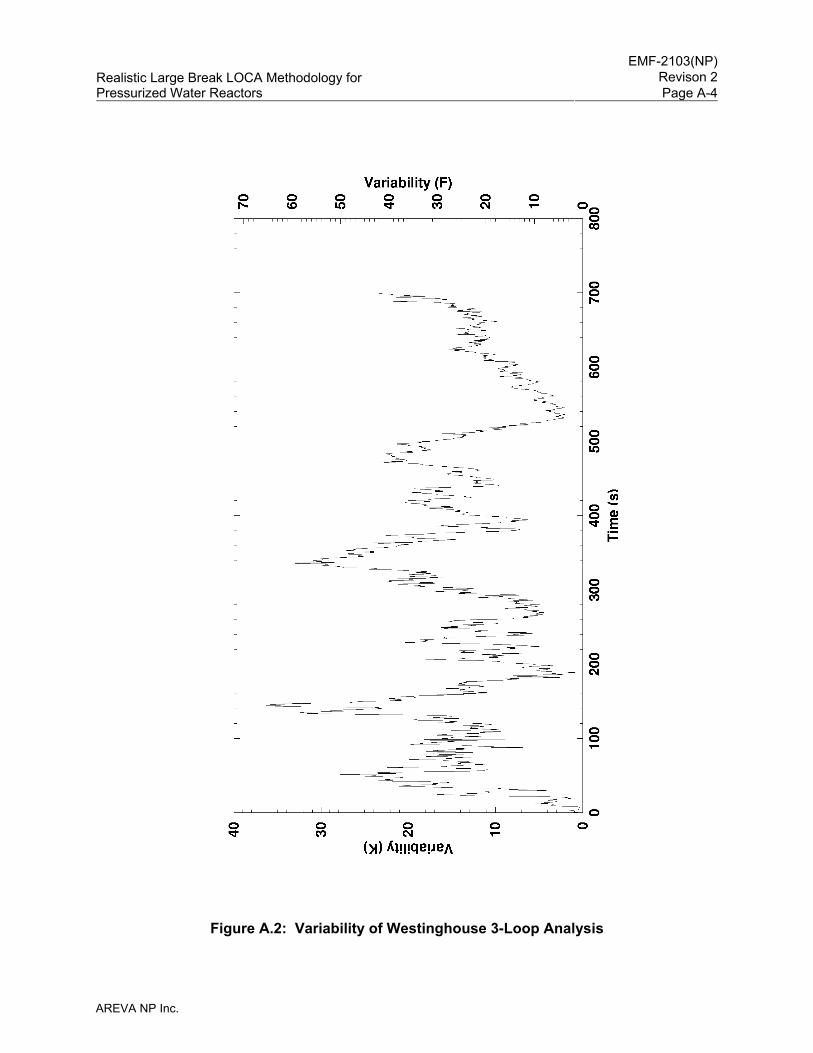
EMF-2103(NP)
Revison 2Realistic Large Break LOCA Methodology for Pressurized Water Reactors Page A-4
AREVA NP Inc.
Figure A.2: Variability of Westinghouse 3-Loop Analysis
EMF-2103(NP)
Revison 2Realistic Large Break LOCA Methodology for Pressurized Water Reactors Page A-5
AREVA NP Inc.
Figure A.3: Time Step Sensitivity of Westinghouse 4-Loop Analysis
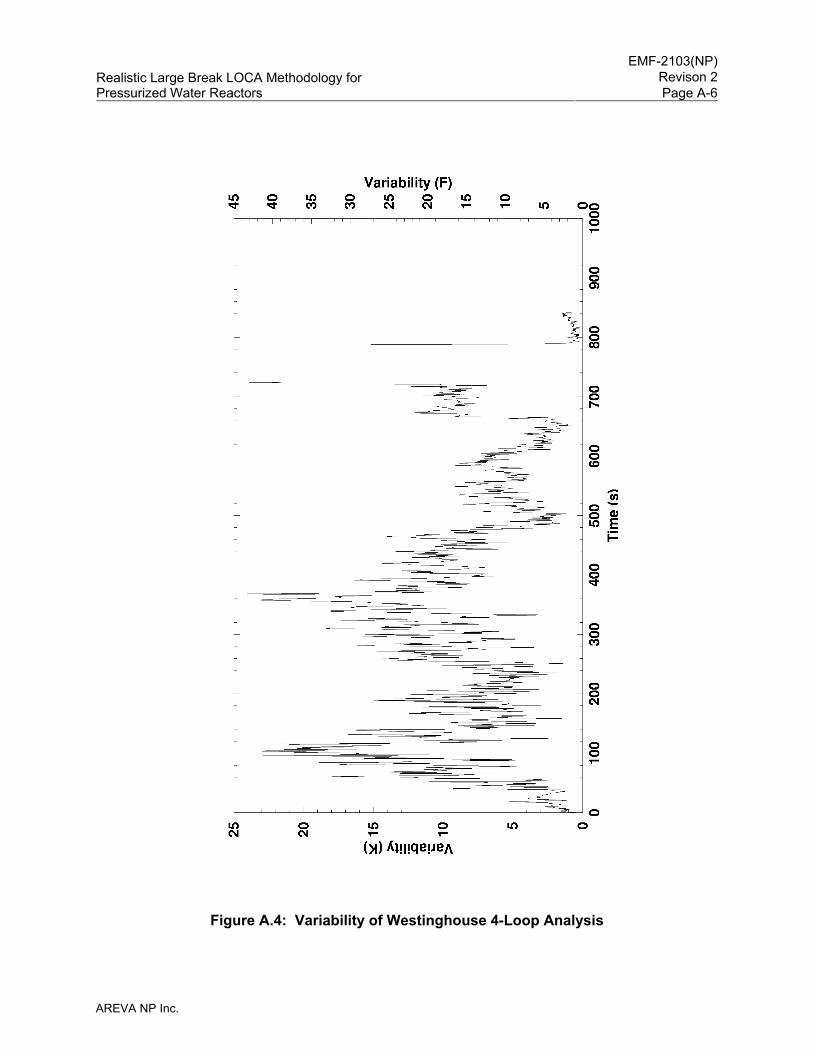
EMF-2103(NP)
Revison 2Realistic Large Break LOCA Methodology for Pressurized Water Reactors Page A-6
AREVA NP Inc.
Figure A.4: Variability of Westinghouse 4-Loop Analysis
EMF-2103(NP)
Revison 2Realistic Large Break LOCA Methodology for Pressurized Water Reactors Page A-7
AREVA NP Inc.
Figure A.5: Time Step Sensitivity of CE Analysis
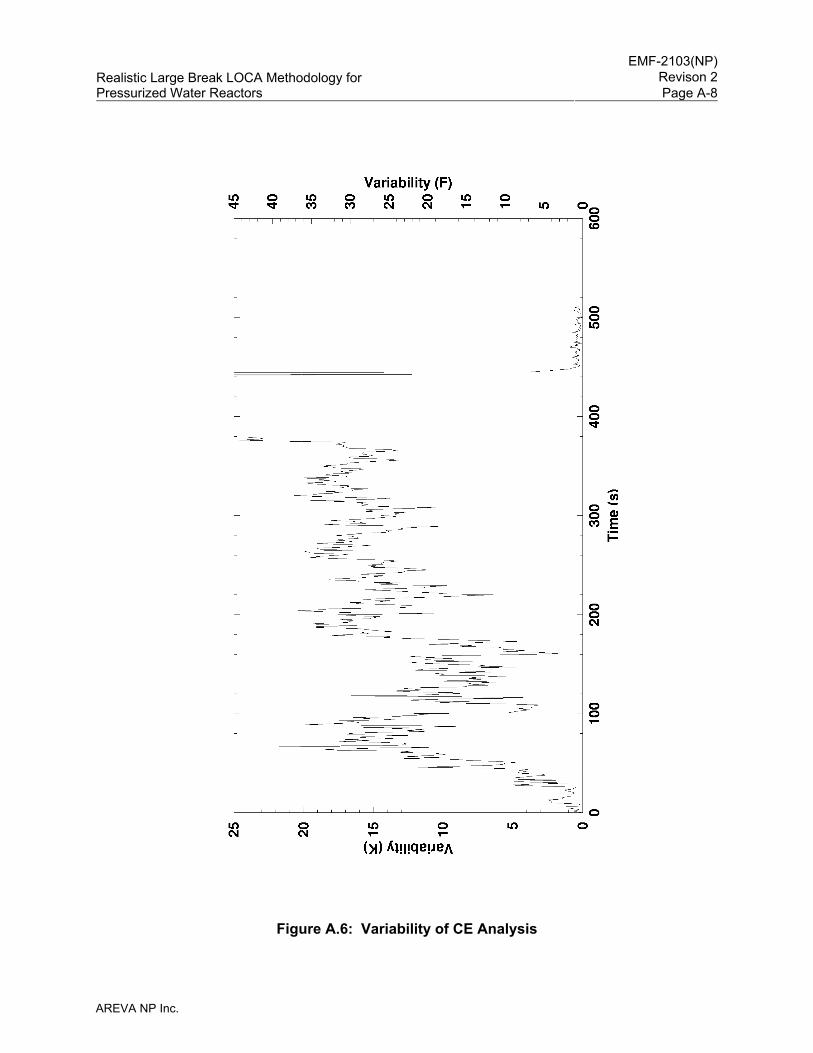
EMF-2103(NP)
Revison 2Realistic Large Break LOCA Methodology for Pressurized Water Reactors Page A-8
AREVA NP Inc.
Figure A.6: Variability of CE Analysis
EMF-2103(NP)
Revison 2Realistic Large Break LOCA Methodology for Pressurized Water Reactors Page B-1
AREVA NP Inc.
Appendix B Sample PWR Licensing Analyses
B.1 Introduction
This appendix provides sample RLBLOCA analyses for a Westinghouse 3- and 4-loop PWR
and a Combustion Engineering 2x4 PWR. These sample analyses are presented to provide
representative solutions to the RLBLOCA evaluation and the reporting or recording of such
analyses. None of the sample problems are fully representative of any specific plant. The
analyses contain inconsistencies relative to nominal core designs but each has been reviewed
to assure that it offers an accurate representation of the RLBLOCA evaluation model findings
and conclusions. The first three sample analyses have AREVA fuel with M5® cladding and
utilize the COPERNIC2 code for fuel calculations within S-RELAP5. The fourth sample analysis
has AREVA fuel with Zirc-4 cladding and utilizes the RODEX3A code for fuel calculations within
S-RELAP5.
RLBLOCA analyses, as illustrated by the sample analyses, are designed to support operation
for a typical reload cycle. It also applies to subsequent cycles, unless changes in the Technical
Specifications, Core Operating Limits Report, fuel design, plant hardware, or plant operation
cause model input revisions.
The non-parametric statistical methods inherent in the AREVA RLBLOCA methodology
considers a full spectrum of break sizes, break configurations (guillotine or split break), axial
shapes, and plant operational parameters. A conservative single failure assumption is applied
in which the negative effects of both the loss of a low pressure safety injection pump and the
loss of a diesel generator are simulated. The effects of Gadolinia bearing fuel rods and peak
fuel rod exposures are also considered.
Section B.1.1 describes the criteria that the RLBLOCA analyses will analyze. Section B.1.2 of
this report describes the models used in the analysis. Section B.1.3 describes the GDC-35
limiting condition. Section B.1.4 describes the statistical compliance to the acceptance criteria.
Section B.1.5 discusses the application of heat transfer correlations. Section B.2 describes the
3-loop PWR plant analysis, Section B.3 describes the 4-loop PWR plant analysis, and
Section B.4 describes the CE 2x4 PWR plant analyses.
EMF-2103(NP)
Revison 2Realistic Large Break LOCA Methodology for Pressurized Water Reactors Page B-2
AREVA NP Inc.
B.1.1 Analysis
The purpose of the analysis is to verify typical technical specification peaking factor limits and
the adequacy of the ECCS by demonstrating that the following 10 CFR 50.46(b) criteria are met:
• The calculated maximum fuel element cladding temperature shall not exceed 2200 °F.
• The calculated total oxidation of the cladding shall nowhere exceed 0.17 times the total cladding thickness before oxidation.
• The calculated total amount of hydrogen generated from the chemical reaction of the cladding with water or steam shall not exceed 0.01 times the hypothetical amount that would be generated if all of the metal in the cladding cylinders surrounding the fuel excluding the cladding surrounding the plenum volume were to react.
As discussed in Section 2.1, the two remaining 10 CFR 50.46(b) criteria require evaluations
beyond the capability of this methodology and are treated separately during plant evaluations.
B.1.2 Description of Analytical Models
The modeling of plant components is performed by following guidelines developed to ensure
accurate accounting for physical dimensions and that the dominant phenomenon expected
during a LBLOCA event are captured. The basic building block for modeling is the hydraulic
volume for fluid paths and the heat structure for a heat transfer surface. In addition, special
purpose components exist to represent specific components such as the pumps or the steam
generator separators. All geometries are modeled at the resolution necessary to best resolve
the flow field and the phenomena being modeled within practical computational limitations.
A typical calculation using S-RELAP5 begins with the establishment of a steady-state, initial
condition with all loops intact. The input parameters and initial conditions for this steady-state
calculation are chosen to reflect plant technical specifications or to match measured data.
Specific parameters are discussed in Sections B.2.2, B.3.2, and B.4.2.
Following the establishment of an acceptable steady-state condition, the transient calculation is
initiated by introducing a break into one of the loops. The evolution of the transient through
blowdown, refill, and reflood is computed continuously using S-RELAP5. Containment pressure
is calculated by the ICECON module within S-RELAP5.
EMF-2103(NP)
Revison 2Realistic Large Break LOCA Methodology for Pressurized Water Reactors Page B-3
AREVA NP Inc.
A detailed assessment of the S-RELAP5 computer code was made through comparisons to
experimental data. These assessments were used to develop quantitative estimates of the
ability of the code to predict key physical phenomena in a PWR LBLOCA. The final step of the
best-estimate methodology is to combine all the uncertainties related to the code and plant
parameters and estimate the PCT at 95 percent probability and 95 percent confidence. The
steps taken to derive the PCT uncertainty estimate are summarized below:
1. Base Plant Input File Development
First, base COPERNIC2 (or RODEX3A) and S-RELAP5 input files for the plant (including the
containment input file) are developed. Code input development guidelines are applied to ensure
that the model nodalization is consistent with the model nodalization used in the code validation.
2. Sampled Case Development
The non-parametric statistical approach requires that many “sampled” cases be created and
processed. For every set of input created, each “key LOCA parameter” is randomly sampled
over a range established through code uncertainty assessment or expected operating limits
(provided by plant technical specifications or data). Those parameters considered "key LOCA
parameters" are listed in Table B.1. This list includes both parameters related to LOCA
phenomena (based on the PIRT provided in Section 3.3) and to plant operating parameters.
3. Determination of Adequacy of ECCS
The RLBLOCA methodology uses a non-parametric statistical approach to determine that the
first three criteria of 10 CFR 50.46 (PCT < 2200 °F, local oxidation < 17 %, and core-wide
oxidation < 1 %) are met with a probability higher than 95 percent with 95 percent confidence.
B.1.3 GDC-35 Limiting Condition Determination
GDC-35 states that the plant shall be able to mitigate design basis accidents with or without off
site power available. The methodology does this by determining the most severe condition
between these two configurations and then performing the RLBLOCA statistical analysis for the
plant with off site power availability set to the most severe condition.
EMF-2103(NP)
Revison 2Realistic Large Break LOCA Methodology for Pressurized Water Reactors Page B-4
AREVA NP Inc.
To determine the limiting assumption, a sensitivity study of two LBLOCA cases is performed
with and without offsite power available. The plant conditions incorporated in this study are set
to those expected to challenge the ECCS capability, such that the validity of the result is
established for conditions expected to be representative of those that will eventually determine
the LBLOCA results which will be compared to the 10 CFR 50.46 criteria.
An examination of the PIRT (Table 3.1) for high ranking items resulted in the selection of the
following parameters (where appropriate, representative values used in the sensitivity studies
are also provided):
• Core Power (set to nominal power plus uncertainty)
• Decay Heat (1.02 multiplier)
• Initial Stored Energy (set to upper value of the standard deviation)
• Fq (Set to Technical Specification maximum)
• Time in Cycle – Fresh Fuel (time of peak assembly power)
• Time in Cycle – Burned Fuel (time of peak assembly power)
• Axial Skew (Only requirement is to have positive ASI)
• Break (double-ended guillotine, 2 x cold leg pipe area)
• Break Discharge Loss Coefficients (set to 0.9917)
• BIASI Critical Heat Flux (set to 0.86)
• Film Boiling (randomly selected value of FILMBL reduced by 75 percent)
• Dispersed Flow Film Boiling HTC (set to 0.75)
• Tmin (set to the median value, 636.0 K)
• Condensation Interphase HTC (set to 75.0 for vapor side, void dependent multiplier for liquid side)
• Accumulator Cover Gas Pressure (set to the lower bound)
• Accumulator Volume (set to average of lower and upper bound)
The study is performed with and without off site power available. As mentioned previously, the
conditions assumed will be based on those considered to be representative of the LBLOCA
results that be compared to the 10 CFR 50.46 criteria. The statistical case set, set of LBLOCA
sample events, is then run under the assumption that off site power is always either available or
unavailable according to the study result.
EMF-2103(NP)
Revison 2Realistic Large Break LOCA Methodology for Pressurized Water Reactors Page B-5
AREVA NP Inc.
B.1.4 Overall Statistical Compliance to Criteria
For the RLBLOCA analyses the determination of compliance to the criteria is treated as a
[ ] with all three of the first three criteria of 10 CFR 50.46 using
non-parametric statistics. The approach is outlined in detail in Section 5.2 of this report. [
] Generally, the
minimum margins for each of the three parameters of interest will be established by different
cases. For the sample evaluations presented in this appendix, a case set size of 208 was
selected. At this size, the 95/95 metric value is provided by the [ ] for the
criterion of interest.
B.1.5 Application of Heat Transfer Correlations
During a transient simulation, different heat transfer correlations may be applied at any given
time. The best way to demonstrate how the S-RELAP5 simulation of a LBLOCA is supported by
correlation development and validation studies is to first identify (or map) the “simulation-space”
and compare it to the “assessment-space.” The assessment-space represents the combination
of the applicability range from separate-effects investigation (i.e., correlation development or
derivation), the expanded applicability range from uncertainty analysis, and validation from
integral-effects benchmark calculations. The simulation-space is evaluated through the
examination of the limiting calculations (in terms of PCT) for the 3- and 4-loop and CE sample
problems for key correlation dependent parameters. The key parameters are defined as those
engineered parameters that can be designed into a thermal-hydraulic test matrix. The most
common engineered parameters used in thermal-hydraulic testing and correlation development
are pressure, power (in terms of LHGR, or heat flux), and mass flux (may also be given as
Reynolds number or mass flow).
The comparison of the simulation-space and the assessment-space provides quantitative
support to CSAU Step 6, Determination of Code Applicability (Reference B.1). As stated in
Reference B.1, “if inadequacies are noted, they should be fully documented and, if possible,
quantified.” Ideally, the assessment-space will span the simulation-space; however,
EMF-2103(NP)
Revison 2Realistic Large Break LOCA Methodology for Pressurized Water Reactors Page B-6
AREVA NP Inc.
realistically, there will likely be holes in the assessment-space. To prioritize the effort in
demonstrating adequate coverage, AREVA presented a PIRT for the LBLOCA in Section 3.3.
This PIRT identified and ranked the relevant phenomena of importance for a LBLOCA. The
important heat transfer regimes are nucleate boiling, CHF (DNB), transition boiling, and film
boiling. It was the conclusion of the AREVA PIRT team that the other heat transfer regimes
were either not present or had negligible impact on peak clad temperatures. In fact, it was
concluded that nucleate boiling has a relatively low ranking during a LBLOCA event.
The best resource for information about the heat transfer regimes and their application can be
found in Section 4 of Reference B.2. The selection logic for each heat transfer regime is
presented in Figure 4.1 of that document. As a summary, Table B.2 highlights the heat transfer
correlations used in S-RELAP5. Table B.15, Table B.24, Table B.34, and Table B.35
summarize the different heat transfer regimes, the heat transfer correlations used, and the
approximate parameter ranges for the 3- and 4-loop and CE sample problems.
Time Period: Early Blowdown
Immediately following the postulated LBLOCA, portions of the core will, for a brief time, be in the
nucleate boiling heat transfer regime until CHF is achieved. The duration of this period depends
on the size of the break; however, for the typical limiting PCT break, this period will last only
several seconds, at most. This period is more influenced by the CHF correlation, rather than
the nucleate boiling heat transfer correlation, because CHF triggers the time of transition to the
low heat transfer regimes (post-CHF). Table B.3 provides a comparison of the simulation-space
(taken from Table B.15, Table B.24, Table B.34, and Table B.35) and the range of applicability
evaluated for the assessment-space for the CHF correlation.
S-RELAP5 Implementation of CHF
Early in the transient, heat transfer in the core rapidly advances to post-CHF conditions.
Nonetheless, the Biasi correlation was assessed against the tests performed on the THTF at
Oak Ridge National Laboratory and a bounding bias was determined for application in the
RLBLOCA methodology. This study is presented in Section 4.3.1.1. Further discussion is
provided in Section 4.13 of EMF-2100 (Reference B.2).
EMF-2103(NP)
Revison 2Realistic Large Break LOCA Methodology for Pressurized Water Reactors Page B-7
AREVA NP Inc.
Table B.3 provides a comparison of the simulation-space (taken from Table B.15, Table B.24,
Table B.34, and Table B.35) and the range of applicability evaluated for the assessment-space
for the Biasi CHF correlation. Note that the assessment-space includes three components as
previously described: (1) the test conditions used in correlation development, (2) relevant
uncertainty analysis, and (3) integral-effects validation.
Time Period: Blowdown
As the RCS depressurizes and CHF is reached in the core, vapor generation is rapid and the
steam quality increases. This post-CHF period is characterized by film boiling, single-phase
steam convection, and radiation (although radiation is not expected to be significant; hence, it
does not appear in the PIRT). As long as the steam maintains some wetness, the total heat
transfer includes all three heat transfer mechanisms; however, single-phase steam convection
dominants heat transfer when void fractions are above about 0.90. Post-CHF heat transfer
includes uncertainty not only from the application of the correlations, but also from contributions
of interfacial drag and heat transfer phenomena. For this reason, total post-CHF heat transfer,
rather than the individual correlations, is a statistically treated parameter. Table B.4 provides a
comparison of the simulation-space (taken from Table B.15, Table B.24, Table B.34, and
Table B.35) and the range of applicability evaluated for the assessment-space for the film
boiling correlation.
S-RELAP5 Implementation of Film Boiling Heat Transfer
Within S-RELAP5 both the modified Bromley and the Wong-Hochreiter correlation are used
outside their derived range of applicability; however, applied statistical uncertainty on the total
heat transfer provides the means for expanding the range of applicability. The primary
deviations from the original range of applicability are:
• The modified Bromley correlation is limited to the condition where vapor void fraction is less than 0.9, rather than 0.4.
• Both correlations are used for the full range of pressure from 2250 psia to atmospheric.
• Wong-Hochreiter is used at Reynolds numbers lower than 2500.
A discussion of the statistical treatment of total heat transfer is presented in S-RELAP5
Verification and Validation document, EMF-2102 (Reference B.3). The uncertainty analysis
applies data from the FLECHT-SEASET tests. The applicability of these tests was evaluated by
EMF-2103(NP)
Revison 2Realistic Large Break LOCA Methodology for Pressurized Water Reactors Page B-8
AREVA NP Inc.
analysis of the breadth of the data in terms of key correlation parameters and the density of the
data in terms of the parameters for which the correlation is most sensitive, pressure and void
fraction. [
] The IETs were initiated from full pressure conditions.
S-RELAP5 Implementation of Single-Phase Vapor Convection
Single-phase vapor heat transfer was assessed using the 161-rod bundle FLECHT-SEASET
steam cooling tests (Reference B.3). The LOFT and Semiscale integral tests during the refill
period and the separate effect assessments, including FLECHT-SEASET, CCTF and SCTF,
during the early period of adiabatic heat-up were used to validate single-phase heat transfer at
low flows.
Low flows that directionally oscillate are characteristic during refill in both the tests and the
calculations. In LBLOCA calculations during vessel refill, vapor flow rates decelerate and
directionally oscillate as a result of the transition to refill. This will last until the beginning of core
reflood, which is a period typically less than 15 seconds. During this unsettled period, core flow
will likely remain turbulent; however, vapor Reynolds numbers will be low.
In general, the S-RELAP5 results conservatively bound the measured results (higher clad
temperatures). While the results of the assessments demonstrated that the Wong-Hochreiter
correlation is adequate for post-blowdown periods during a LOCA (and lower Reynolds
numbers), single-phase vapor heat transfer is treated implicitly in the evaluation of uncertainty in
the total post-CHF heat transfer (see previous section).
S-RELAP5 Implementation of Radiation
Thermal radiation [ ] provides a
significant contribution to the total heat transfer. The wall-to-fluid radiation is intrinsic to the heat
transfer model and is implicitly validated in all post-CHF assessments. The wall-to-structure
component is activated through input and required a separate assessment of the performance
of the model and a separate assessment of the rod-to-rod radiation model’s implementation into
the plant model.
EMF-2103(NP)
Revison 2Realistic Large Break LOCA Methodology for Pressurized Water Reactors Page B-9
AREVA NP Inc.
[
]
Time Period: Refill
During the refill period, the RCS has nearly depressurized and the core region is devoid of
coolant. Heat transfer in the core is almost all from single-phase vapor. As previously stated,
single-phase vapor heat transfer is predicted using the Wong-Hochreiter correlation. The core
conditions during this time are consistent with both the derived range of applicability and the
FLECHT-SEASET steam cooling tests. While post-CHF total heat transfer is a statistically
treated parameter, there is no bias or uncertainty applied when void fraction equals 1.0. As
assessed from the FLECHT-SEASET steam cooling tests, the Wong-Hochreiter correlation is
slightly conservative relative to the data. Analysis of the integral tests assessment cases
support this finding.
Since the single-phase vapor heat transfer is a component of film boiling, refer to Table B.4 for a
comparison of the simulation-space (taken from Table B.15, Table B.24, Table B.34, and
Table B.35) and the range of applicability evaluated for the assessment-space for the
single-phase vapor heat transfer correlation.
EMF-2103(NP)
Revison 2Realistic Large Break LOCA Methodology for Pressurized Water Reactors Page B-10
AREVA NP Inc.
Time Period: Reflood
By this time, the RCS pressure has established some equilibrium with the relative low pressure
containment. ECCS coolant from the accumulator begins to reach the lower portions of the core
and a definite two-phase mixture is present throughout the core region. With the constant
supply of coolant, a quench front is established at the bottom of the core that slowly moves
upward. At some point the coolant supply from the accumulator ends and core heat removal
relies solely on that provided by the pumped injection safety systems. This may result in a late
reflood heat up. Nonetheless, in time, this supply of coolant will be able to completely quench
all the fuel rods in the core.
For the duration of this period, the heat structure nodes with the highest temperatures are
removing heat by film boiling. Table B.4 provides a comparison of the simulation-space (taken
from Table B.15, Table B.24, Table B.34, and Table B.35) and the range of applicability
evaluated for the film boiling assessment-space. This period ends with the fuel rod quenched,
which will occur shortly after meeting the conditions for transition boiling.
S-RELAP5 Implementation of Reflood Heat Transfer
When core reflood is enabled in S-RELAP5 (provided in the input model), a heat transfer regime
profile covering the entire boiling curve is established along the modeled heat structure.
Proceeding from the bottom of the core, this will be single-phase liquid and/or nucleate boiling,
transition boiling, and single-phase vapor and/or film boiling. The same heat transfer
correlations apply that would apply otherwise; the only major difference is the forced mapping of
the heat transfer profile that keys on the calculation of CHF wall temperature from the Modified
Zuber CHF correlation.
The uncertainty and bias for the total post-CHF heat transfer includes data from
FLECHT-SEASET simulations that modeled reflood heat transfer. The range of applicability
was presented previously in the discussion of film boiling.
S-RELAP5 Implementation of Transition Boiling
In general, the application of the modified Chen correlation is within its range of applicability;
however, system pressures will likely be lower than the 61 psia used in the derived range of
applicability. In limiting RLBLOCA simulations (high clad temperatures), the PCT sensitivity to
EMF-2103(NP)
Revison 2Realistic Large Break LOCA Methodology for Pressurized Water Reactors Page B-11
AREVA NP Inc.
transition boiling is minimal. This is because the location of PCT in these limiting cases is well
above the quench plane. Once heat transfer moves into the transition boiling regime, the
feedback from the cooler cladding temperature enhances heat transfer rapidly and within
seconds the heat transfer moves into the nucleate boiling regime. Considering the distance
between the quench location and the PCT location, heat transfer below the quench front has
little direct influence on PCT when there is no bulk boiling.
The results of several test validation problems including LOFT, CCTF and Semiscale, presented
in Section 4.3 (also Sections 3 and 4 in Reference B.3), show that the quenching of the cladding
occurs soon after the heat transfer regime is switched from film boiling to transition boiling.
Therefore, the determination of the transition point is more important than the transition boiling
heat transfer. For this reason, a Tmin model defining the transition from film boiling to transition
boiling is used in S-RELAP5.
Table B.5 provides a comparison of the simulation-space (taken from Table B.15, Table B.24,
Table B.34, and Table B.35) and the range of applicability evaluated for the assessment-space
for the Modified Chen transition boiling correlation. [
]
Time Period: Long-Term Cooling
This period is characterized by single-phase liquid or nucleate boiling heat transfer. Peak clad
temperatures are not influenced by this condition. Calculations are terminated after whole-core
quench.
S-RELAP5 Implementation of Nucleate Boiling Heat Transfer
Since nucleate boiling is not considered to have a significant influence on clad temperatures, no
formal assessment was performed. S-RELAP5 was assessed for the few high pressure boil-off
tests presented in Reference B.3; however, the focus of these tests is the more dominant film
boiling phenomena.
Table B.6 provides a comparison of the simulation-space (taken from Table B.15, Table B.24,
Table B.34, and Table B.35) and the range of applicability evaluated for the assessment-space
for the Chen nucleate boiling correlation. Note: the assessment-space includes three
EMF-2103(NP)
Revison 2Realistic Large Break LOCA Methodology for Pressurized Water Reactors Page B-12
AREVA NP Inc.
components as previously described—the test conditions used in correlation development,
relevant uncertainty analysis, and integral-effects validation.
Summary
As has been presented, individual correlations have been programmed into S-RELAP5;
however, during a LBLOCA calculation multiple correlations will be employed simultaneously to
calculate a total heat transfer during post-CHF conditions. In addition, correlations for interfacial
phenomena will also influence this calculation. For this reason, it is the superposition of these
individual correlations that becomes the post-CHF heat transfer correlation in S-RELAP5. The
pedigree of this “correlation” relies on the range of applicability of the individual correlations, the
range of applicability provided by the uncertainty analysis using FLECHT-SEASET datasets and
the RLBLOCA analysis methodology, and the various benchmarks.
Table B.7 presents a collective summary of the coverage of the assessment-space provided in
the discussion of the heat transfer regimes (including data provided in Table B.3 through
Table B.6). This includes the derived range of applicability, the expanded range of applicability
based on statistical treatment (the uncertainty analysis), and code-to-data comparisons. In
general, the FLECHT-SEASET test-spaces, used to expand the range of applicability,
encompass the original derived range of applicability. In addition, a number of integral test
simulations were performed and are presented in Section 4.3.2 and in Reference B.3. The
integral tests, including LOFT, CCTF, SCTF, and Semiscale, provide the largest coverage of the
assessment-space; that is, they were performed at typical LBLOCA conditions. The
demonstration of acceptable agreement among these validation cases sufficiently completes the
assessment-space and the assessment-space provides sufficient coverage over the
simulation-space.
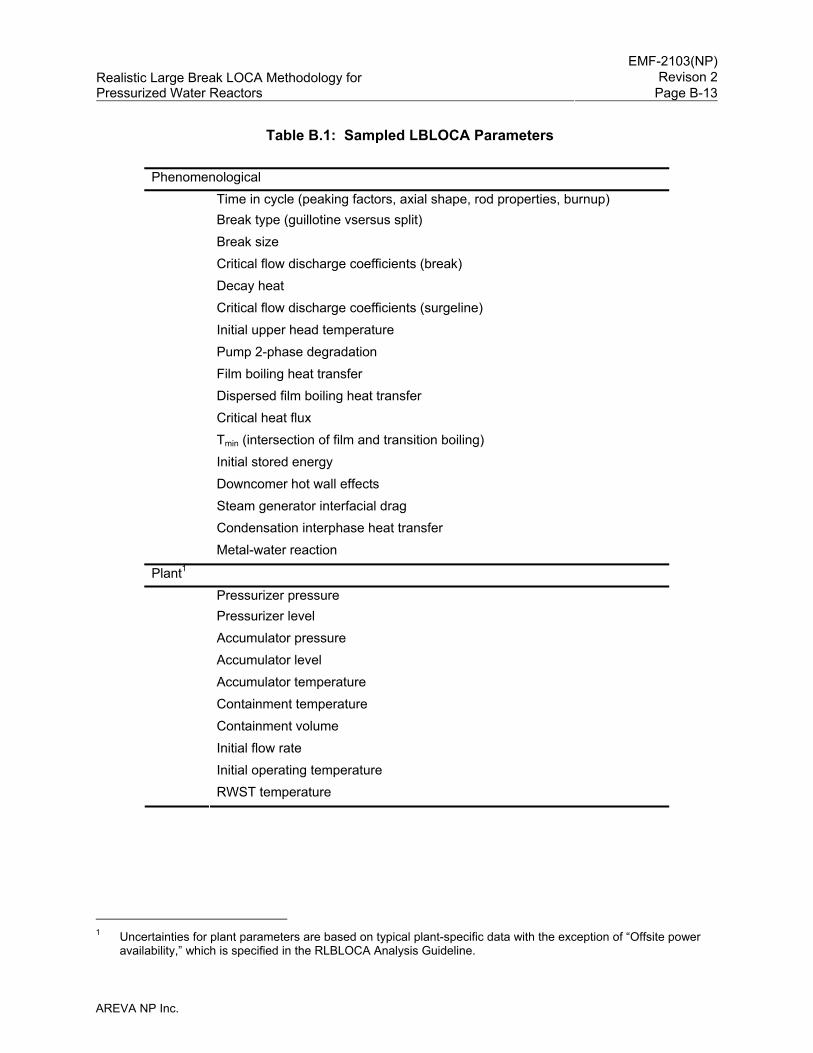
EMF-2103(NP)
Revison 2Realistic Large Break LOCA Methodology for Pressurized Water Reactors Page B-13
AREVA NP Inc.
Table B.1: Sampled LBLOCA Parameters
Phenomenological Time in cycle (peaking factors, axial shape, rod properties, burnup) Break type (guillotine vsersus split) Break size Critical flow discharge coefficients (break) Decay heat Critical flow discharge coefficients (surgeline) Initial upper head temperature Pump 2-phase degradation Film boiling heat transfer Dispersed film boiling heat transfer Critical heat flux Tmin (intersection of film and transition boiling) Initial stored energy Downcomer hot wall effects Steam generator interfacial drag Condensation interphase heat transfer
Metal-water reaction
Plant1 Pressurizer pressure Pressurizer level Accumulator pressure Accumulator level Accumulator temperature Containment temperature Containment volume Initial flow rate Initial operating temperature
RWST temperature
1 Uncertainties for plant parameters are based on typical plant-specific data with the exception of “Offsite power
availability,” which is specified in the RLBLOCA Analysis Guideline.
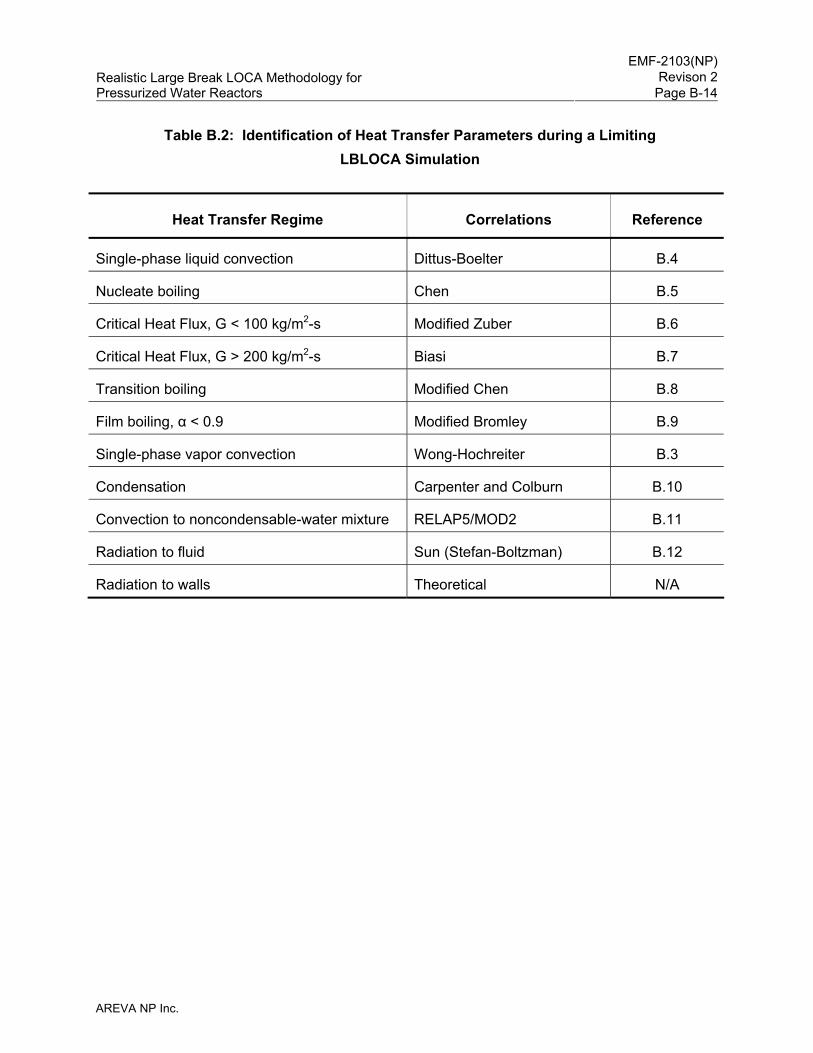
EMF-2103(NP)
Revison 2Realistic Large Break LOCA Methodology for Pressurized Water Reactors Page B-14
AREVA NP Inc.
Table B.2: Identification of Heat Transfer Parameters during a Limiting LBLOCA Simulation
Heat Transfer Regime Correlations Reference
Single-phase liquid convection Dittus-Boelter B.4
Nucleate boiling Chen B.5
Critical Heat Flux, G < 100 kg/m2-s Modified Zuber B.6
Critical Heat Flux, G > 200 kg/m2-s Biasi B.7
Transition boiling Modified Chen B.8
Film boiling, α < 0.9 Modified Bromley B.9
Single-phase vapor convection Wong-Hochreiter B.3
Condensation Carpenter and Colburn B.10
Convection to noncondensable-water mixture RELAP5/MOD2 B.11
Radiation to fluid Sun (Stefan-Boltzman) B.12
Radiation to walls Theoretical N/A
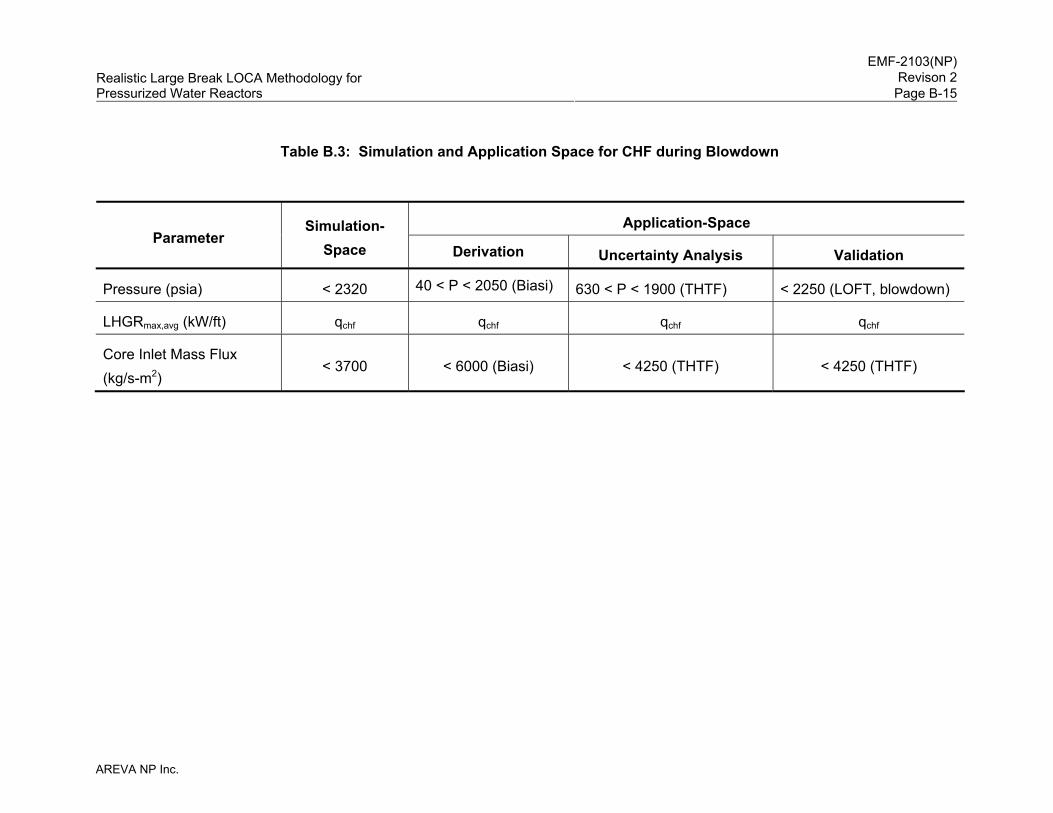
EMF-2103(NP)
Revison 2Realistic Large Break LOCA Methodology for Pressurized Water Reactors Page B-15
AREVA NP Inc.
Table B.3: Simulation and Application Space for CHF during Blowdown
Application-Space Parameter
Simulation-Space Derivation Uncertainty Analysis Validation
Pressure (psia) < 2320 40 < P < 2050 (Biasi) 630 < P < 1900 (THTF) < 2250 (LOFT, blowdown)
LHGRmax,avg (kW/ft) qchf qchf qchf qchf
Core Inlet Mass Flux (kg/s-m2)
< 3700 < 6000 (Biasi) < 4250 (THTF) < 4250 (THTF)
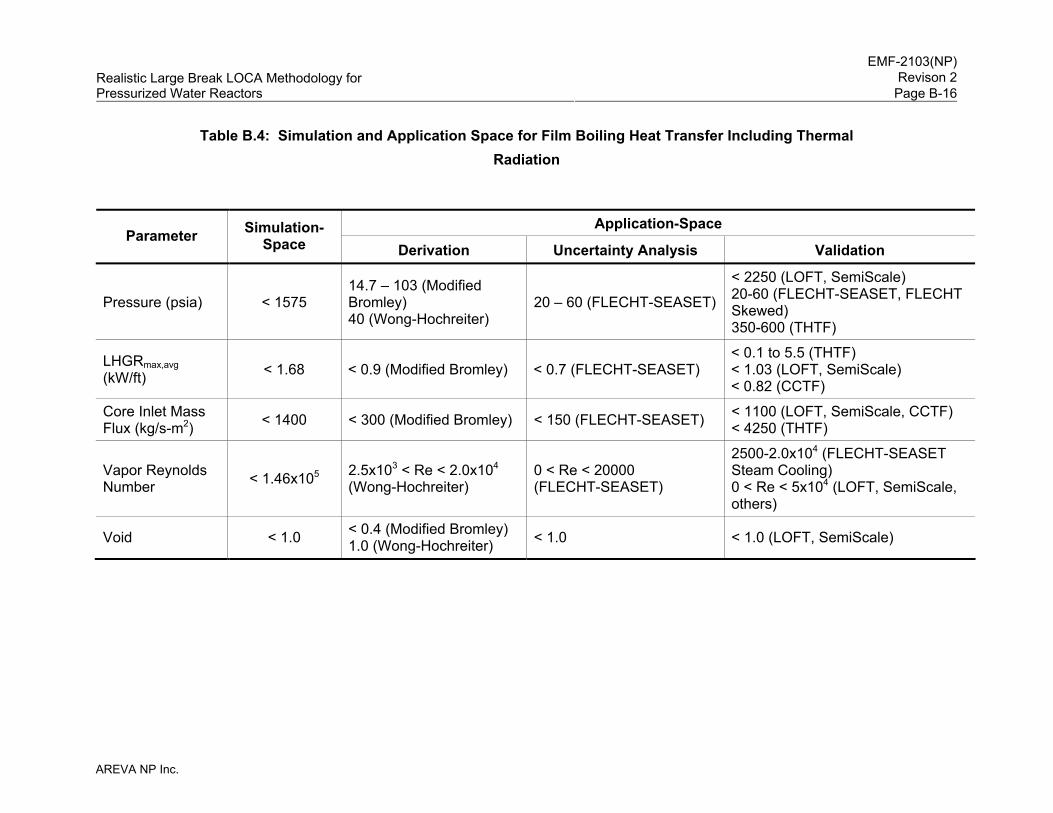
EMF-2103(NP)
Revison 2Realistic Large Break LOCA Methodology for Pressurized Water Reactors Page B-16
AREVA NP Inc.
Table B.4: Simulation and Application Space for Film Boiling Heat Transfer Including Thermal Radiation
Application-Space Parameter Simulation-
Space Derivation Uncertainty Analysis Validation
Pressure (psia) < 1575 14.7 – 103 (Modified Bromley) 40 (Wong-Hochreiter)
20 – 60 (FLECHT-SEASET)
< 2250 (LOFT, SemiScale) 20-60 (FLECHT-SEASET, FLECHT Skewed) 350-600 (THTF)
LHGRmax,avg (kW/ft) < 1.68 < 0.9 (Modified Bromley) < 0.7 (FLECHT-SEASET)
< 0.1 to 5.5 (THTF) < 1.03 (LOFT, SemiScale) < 0.82 (CCTF)
Core Inlet Mass Flux (kg/s-m2) < 1400 < 300 (Modified Bromley) < 150 (FLECHT-SEASET) < 1100 (LOFT, SemiScale, CCTF)
< 4250 (THTF)
Vapor Reynolds Number < 1.46x10⁵ 2.5x10³ < Re < 2.0x10⁴
(Wong-Hochreiter) 0 < Re < 20000 (FLECHT-SEASET)
2500-2.0x10⁴ (FLECHT-SEASET Steam Cooling) 0 < Re < 5x10⁴ (LOFT, SemiScale, others)
Void < 1.0 < 0.4 (Modified Bromley) 1.0 (Wong-Hochreiter) < 1.0 < 1.0 (LOFT, SemiScale)
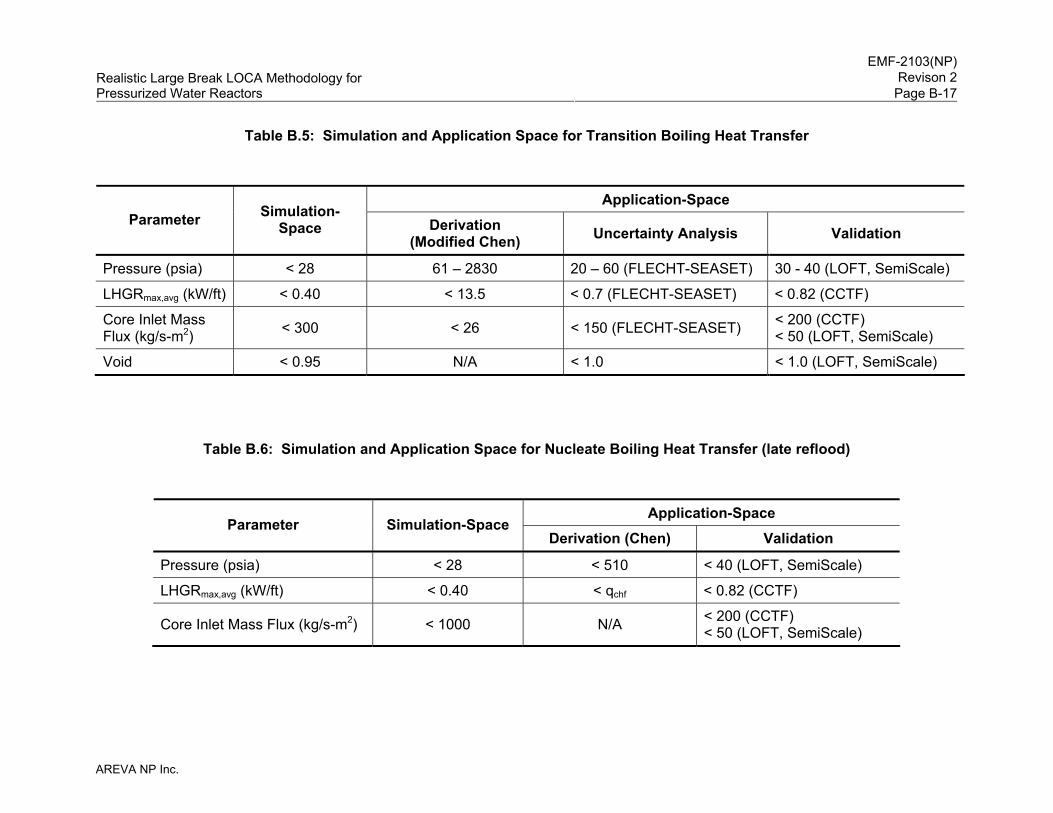
EMF-2103(NP)
Revison 2Realistic Large Break LOCA Methodology for Pressurized Water Reactors Page B-17
AREVA NP Inc.
Table B.5: Simulation and Application Space for Transition Boiling Heat Transfer
Application-Space Parameter Simulation-
Space Derivation (Modified Chen) Uncertainty Analysis Validation
Pressure (psia) < 28 61 – 2830 20 – 60 (FLECHT-SEASET) 30 - 40 (LOFT, SemiScale)
LHGRmax,avg (kW/ft) < 0.40 < 13.5 < 0.7 (FLECHT-SEASET) < 0.82 (CCTF)
Core Inlet Mass Flux (kg/s-m2) < 300 < 26 < 150 (FLECHT-SEASET) < 200 (CCTF)
< 50 (LOFT, SemiScale)
Void < 0.95 N/A < 1.0 < 1.0 (LOFT, SemiScale)
Table B.6: Simulation and Application Space for Nucleate Boiling Heat Transfer (late reflood)
Application-Space Parameter Simulation-Space
Derivation (Chen) Validation
Pressure (psia) < 28 < 510 < 40 (LOFT, SemiScale)
LHGRmax,avg (kW/ft) < 0.40 < qchf < 0.82 (CCTF)
Core Inlet Mass Flux (kg/s-m2) < 1000 N/A < 200 (CCTF) < 50 (LOFT, SemiScale)
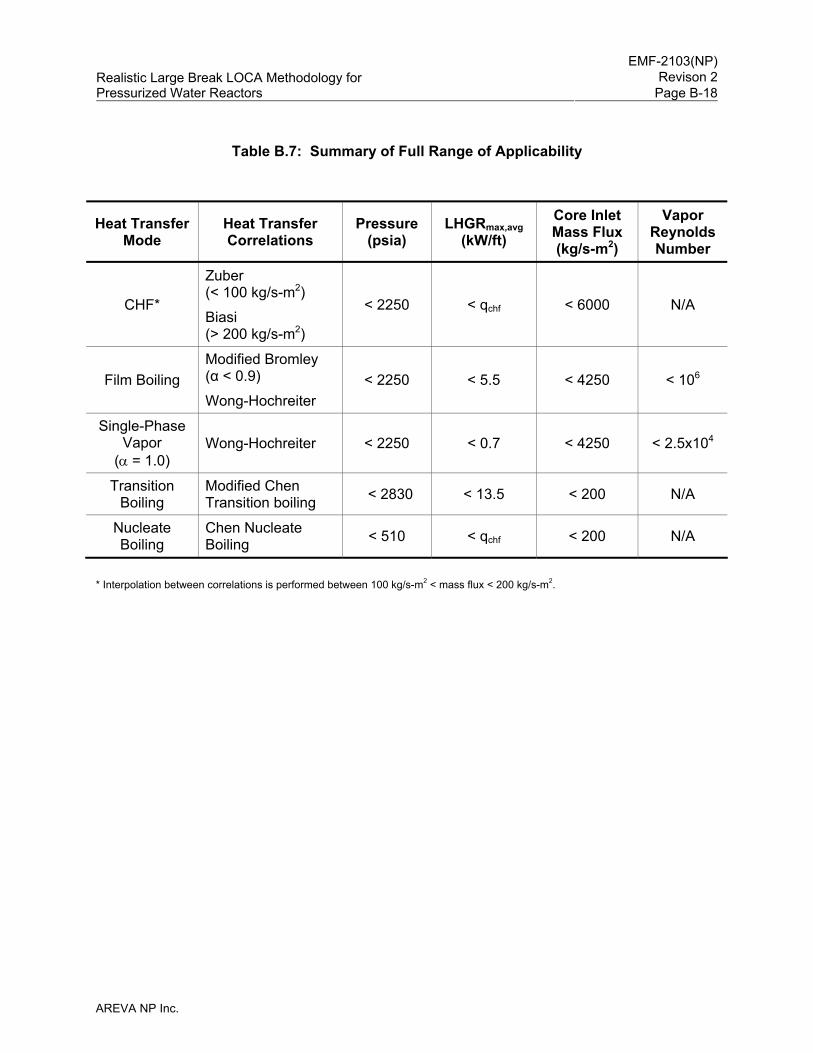
EMF-2103(NP)
Revison 2Realistic Large Break LOCA Methodology for Pressurized Water Reactors Page B-18
AREVA NP Inc.
Table B.7: Summary of Full Range of Applicability
Heat Transfer Mode
Heat Transfer Correlations
Pressure (psia)
LHGRmax,avg (kW/ft)
Core Inlet Mass Flux (kg/s-m2)
Vapor Reynolds Number
CHF*
Zuber (< 100 kg/s-m2)
Biasi (> 200 kg/s-m2)
< 2250 < qchf < 6000 N/A
Film Boiling Modified Bromley (α < 0.9)
Wong-Hochreiter < 2250 < 5.5 < 4250 < 106
Single-Phase Vapor
(α = 1.0) Wong-Hochreiter < 2250 < 0.7 < 4250 < 2.5x10⁴
Transition Boiling
Modified Chen Transition boiling < 2830 < 13.5 < 200 N/A
Nucleate Boiling
Chen Nucleate Boiling < 510 < qchf < 200 N/A
* Interpolation between correlations is performed between 100 kg/s-m2 < mass flux < 200 kg/s-m2.
EMF-2103(NP)
Revison 2Realistic Large Break LOCA Methodology for Pressurized Water Reactors Page B-19
AREVA NP Inc.
B.2 Westinghouse 3-Loop PWR
B.2.1 Summary
The parameter specification for this analysis is provided in Table B.9. The analysis assumes
full-power operation at 3200 MWt, a tube plugging level of up to 3 percent per steam generator,
a total peaking factor (Fq) of 2.44 including uncertainties, and a nuclear enthalpy rise factor (FΔH)
of 1.73 (including a 4 percent uncertainty). The analysis supports operation with AREVA 17x17
HTP design fuel using standard UO2 fuel with 2, 4, 6, and 8 weight percent Gd2O3 for fresh and
standard UO2 fuel with 4, 6, and 8 weight percent Gd2O3 for once-burned assemblies. The
analysis addresses typical operational ranges or technical specification limits (whichever is
applicable) with regard to pressurizer pressure and level; accumulator pressure, temperature
(containment temperature), and level; core inlet temperature; core flow; containment pressure
and temperature; and refueling water storage tank temperature. The analysis explicitly
analyzes fresh and once-burned fuel assemblies. The two GDC 35 cases were run1 and Loss
of Offsite Power produced the limiting PCT; therefore, the 208 case set was run in this
configuration.
The evaluation resulted in meeting the 10 CFR 50.46 criteria with a minimum margin of
11.8 percent with 95 percent coverage and 95 percent confidence. The parameter which set
this margin was the PCT of 1940 °F and occurred in a fresh fuel rod with 17.4 GWd/mtU burnup.
B.2.2 Plant Description and Summary of Analysis Parameters
The plant analysis presented in this section is a Westinghouse designed PWR, having three
loops, each with a hot leg, a U-tube steam generator, and a cold leg with a RCP. The RCS also
includes a pressurizer. The ECCS comprises three accumulators, one per loop, and one full
train of LHSI and HHSI injection (after applying the single failure assumption). The HHSI and
LHSI feed into common headers (cross connected) that are connected to the accumulator lines.
The S-RELAP5 model explicitly describes the RCS, reactor vessel, pressurizer, and ECCS back
to the common LHSI header and accumulators. This model also describes the secondary-side
1 This sample problem exceeded the recommendations provided in Section B.1.3 and was analyzed with a decay
heat multiplier of 1.04.
EMF-2103(NP)
Revison 2Realistic Large Break LOCA Methodology for Pressurized Water Reactors Page B-20
AREVA NP Inc.
steam generator that is instantaneously isolated (closed MSIV and feedwater trip) at the time of
the break.
As described in Section 4.0, many parameters associated with RLBLOCA phenomenological
uncertainties and plant operation ranges are sampled. A summary of those parameters
sampled is given in Table B.1. Values for process or operational parameters, including ranges
of sampled process parameters, and fuel design parameters used in the analysis are given in
Table B.9. Plant data are analyzed to develop uncertainties for the process parameters
sampled in the analyses. Table B.9 summarizes the uncertainties used in the analyses. Two
parameters (RWST temperature and diesel start time) are set at conservative bounding values
for all calculations.
Where applicable, the sampled parameter ranges are based on technical specification limits.
Plant data are used to define range boundaries for loop flow (high end) and containment
temperature (low end).
B.2.3 Realistic Large Break LOCA Results
A case set of 208 cases was performed sampling the parameters listed in Table B.1. The
minimum retained margin to criteria was 11.8 percent at 95 percent coverage with 95 percent
confidence and was associated with case number 104, which resulted in a PCT of 1940 °F. For
the set of cases (LOCA events) that lie within the 95/95 range, the maximum local oxidation was
9.5833 percent (Case 27) and the maximum core-wide oxidation 0.1498 percent (Case 123).
Table B.8 is a summary of the major parameters for the minimum margin case. Table B.9 is the
plant input parameters and operating range supported by the analysis. Table B.10 provides the
containment initial and boundary conditions. Table B.11 describes the passive heat sinks for
the containment input. Table B.12 provides the statistical distribution for the process
parameters. The minimum margin case is characterized in Table B.13 and Table B.14. The
heat transfer parameter range for the limiting margin case is provided in Table B.15. Table B.16
provides the twenty minimum margin cases used to establish the probability evaluation.
The analysis plots for the minimum margin case are shown in Figure B.1 through Figure B.17.
Figure B.1 shows linear scatter plots of the key parameters sampled for the case set.
Parameter labels appear to the left of each individual plot. These figures illustrate the
parameter ranges used in the analysis.
EMF-2103(NP)
Revison 2Realistic Large Break LOCA Methodology for Pressurized Water Reactors Page B-21
AREVA NP Inc.
Figure B.2 and Figure B.3 show PCT scatter plots versus the time of PCT and versus break size
from the set of cases (LOCA events) that lie within the 95/95 range. The scatter plots for the
maximum oxidation and total oxidation are shown in Figure B.4 and B.5, respectively.
Figure B.6 through Figure B.17 show key parameters from the S-RELAP5 calculations for the
minimum margin case. Figure B.6 is the plot of PCT, independent of elevation. Figure B.18
compares the bottom of core recovery times for the set of cases that lie within the 95/95 range
to the BOCR time predicted using the MPR CCFL correlation.
B.2.4 Conclusions
The results of this RLBLOCA analysis show 11.8 percent minimum margin to any of the first
three 10 CFR 50.46 criterion at 95 percent coverage with 95 percent confidence.
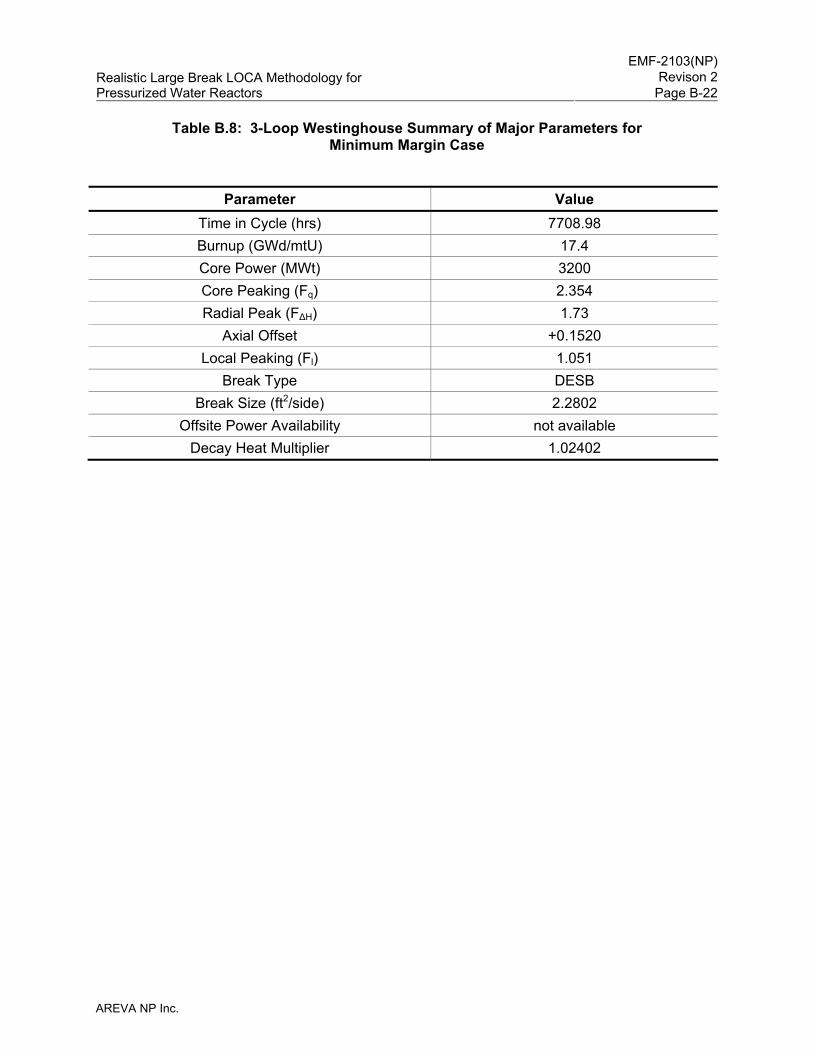
EMF-2103(NP)
Revison 2Realistic Large Break LOCA Methodology for Pressurized Water Reactors Page B-22
AREVA NP Inc.
Table B.8: 3-Loop Westinghouse Summary of Major Parameters for Minimum Margin Case
Parameter Value
Time in Cycle (hrs) 7708.98 Burnup (GWd/mtU) 17.4 Core Power (MWt) 3200 Core Peaking (Fq) 2.354 Radial Peak (FΔH) 1.73
Axial Offset +0.1520 Local Peaking (Fl) 1.051
Break Type DESB Break Size (ft2/side) 2.2802
Offsite Power Availability not available Decay Heat Multiplier 1.02402
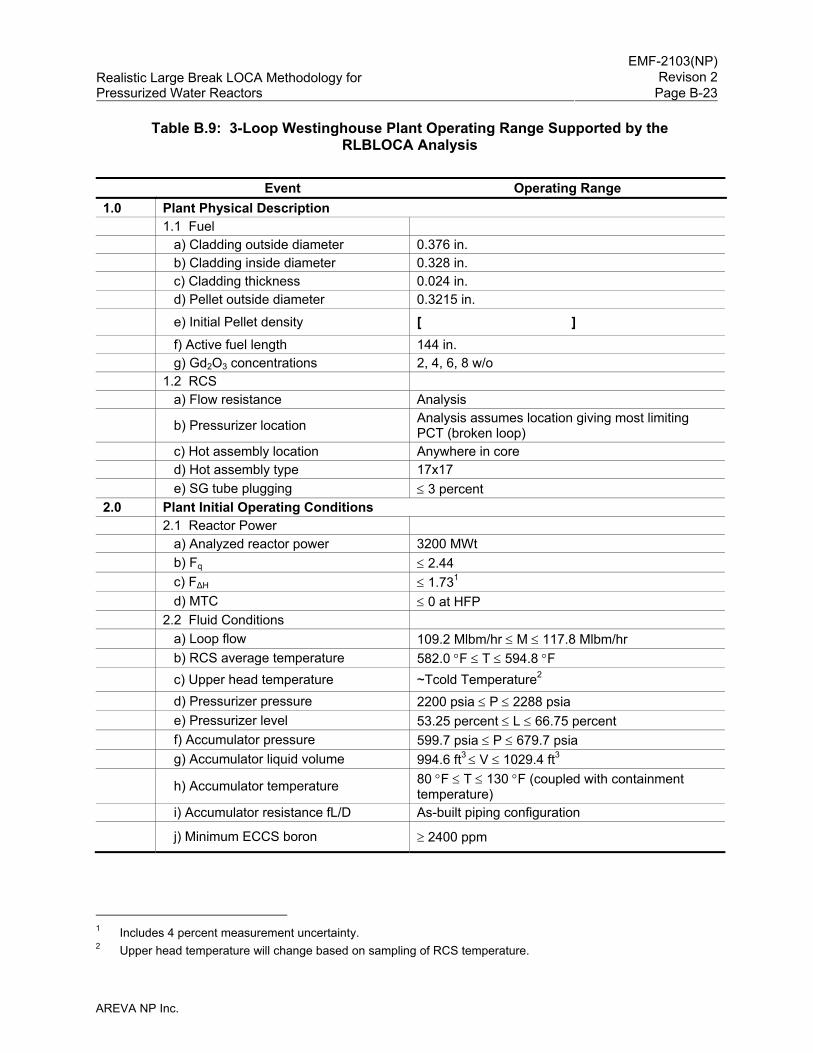
EMF-2103(NP)
Revison 2Realistic Large Break LOCA Methodology for Pressurized Water Reactors Page B-23
AREVA NP Inc.
Table B.9: 3-Loop Westinghouse Plant Operating Range Supported by the RLBLOCA Analysis
Event Operating Range
1.0 Plant Physical Description 1.1 Fuel a) Cladding outside diameter 0.376 in. b) Cladding inside diameter 0.328 in. c) Cladding thickness 0.024 in. d) Pellet outside diameter 0.3215 in.
e) Initial Pellet density [ ] f) Active fuel length 144 in. g) Gd2O3 concentrations 2, 4, 6, 8 w/o 1.2 RCS a) Flow resistance Analysis
b) Pressurizer location Analysis assumes location giving most limiting PCT (broken loop)
c) Hot assembly location Anywhere in core d) Hot assembly type 17x17 e) SG tube plugging ≤ 3 percent 2.0 Plant Initial Operating Conditions 2.1 Reactor Power a) Analyzed reactor power 3200 MWt b) Fq ≤ 2.44 c) FΔH ≤ 1.731 d) MTC ≤ 0 at HFP 2.2 Fluid Conditions a) Loop flow 109.2 Mlbm/hr ≤ M ≤ 117.8 Mlbm/hr b) RCS average temperature 582.0 °F ≤ T ≤ 594.8 °F c) Upper head temperature ~Tcold Temperature2 d) Pressurizer pressure 2200 psia ≤ P ≤ 2288 psia e) Pressurizer level 53.25 percent ≤ L ≤ 66.75 percent f) Accumulator pressure 599.7 psia ≤ P ≤ 679.7 psia g) Accumulator liquid volume 994.6 ft3 ≤ V ≤ 1029.4 ft3
h) Accumulator temperature 80 °F ≤ T ≤ 130 °F (coupled with containment temperature)
i) Accumulator resistance fL/D As-built piping configuration
j) Minimum ECCS boron ≥ 2400 ppm
1 Includes 4 percent measurement uncertainty. 2 Upper head temperature will change based on sampling of RCS temperature.
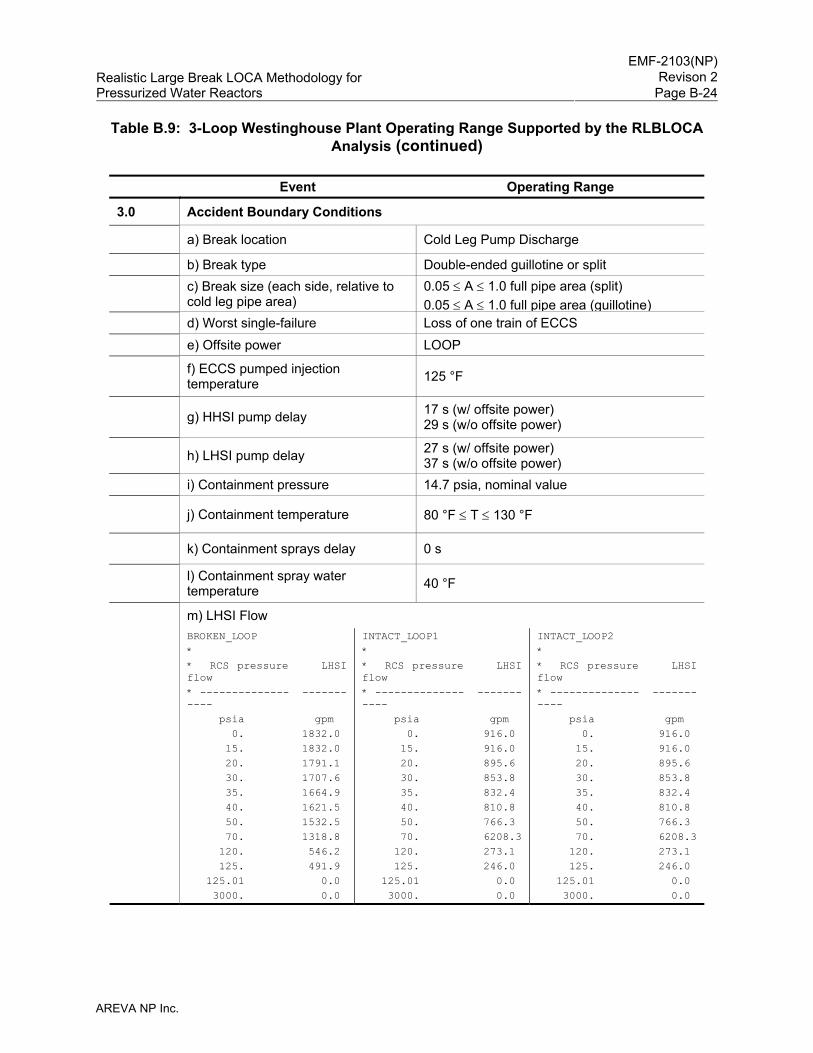
EMF-2103(NP)
Revison 2Realistic Large Break LOCA Methodology for Pressurized Water Reactors Page B-24
AREVA NP Inc.
Table B.9: 3-Loop Westinghouse Plant Operating Range Supported by the RLBLOCA Analysis (continued)
Event Operating Range
3.0 Accident Boundary Conditions
a) Break location Cold Leg Pump Discharge
b) Break type Double-ended guillotine or split
c) Break size (each side, relative to cold leg pipe area)
0.05 ≤ A ≤ 1.0 full pipe area (split) 0.05 ≤ A ≤ 1.0 full pipe area (guillotine)
d) Worst single-failure Loss of one train of ECCS e) Offsite power LOOP
f) ECCS pumped injection temperature 125 °F
g) HHSI pump delay 17 s (w/ offsite power) 29 s (w/o offsite power)
h) LHSI pump delay 27 s (w/ offsite power) 37 s (w/o offsite power)
i) Containment pressure 14.7 psia, nominal value
j) Containment temperature 80 °F ≤ T ≤ 130 °F
k) Containment sprays delay 0 s
l) Containment spray water temperature 40 °F
m) LHSI Flow
BROKEN_LOOP * * RCS pressure LHSI flow * -------------- ----------- psia gpm 0. 1832.0 15. 1832.0 20. 1791.1 30. 1707.6 35. 1664.9 40. 1621.5 50. 1532.5 70. 1318.8 120. 546.2 125. 491.9 125.01 0.0 3000. 0.0
INTACT_LOOP1 * * RCS pressure LHSI flow * -------------- ----------- psia gpm 0. 916.0 15. 916.0 20. 895.6 30. 853.8 35. 832.4 40. 810.8 50. 766.3 70. 6208.3 120. 273.1 125. 246.0 125.01 0.0 3000. 0.0
INTACT_LOOP2 * * RCS pressure LHSI flow * -------------- ----------- psia gpm 0. 916.0 15. 916.0 20. 895.6 30. 853.8 35. 832.4 40. 810.8 50. 766.3 70. 6208.3 120. 273.1 125. 246.0 125.01 0.0 3000. 0.0
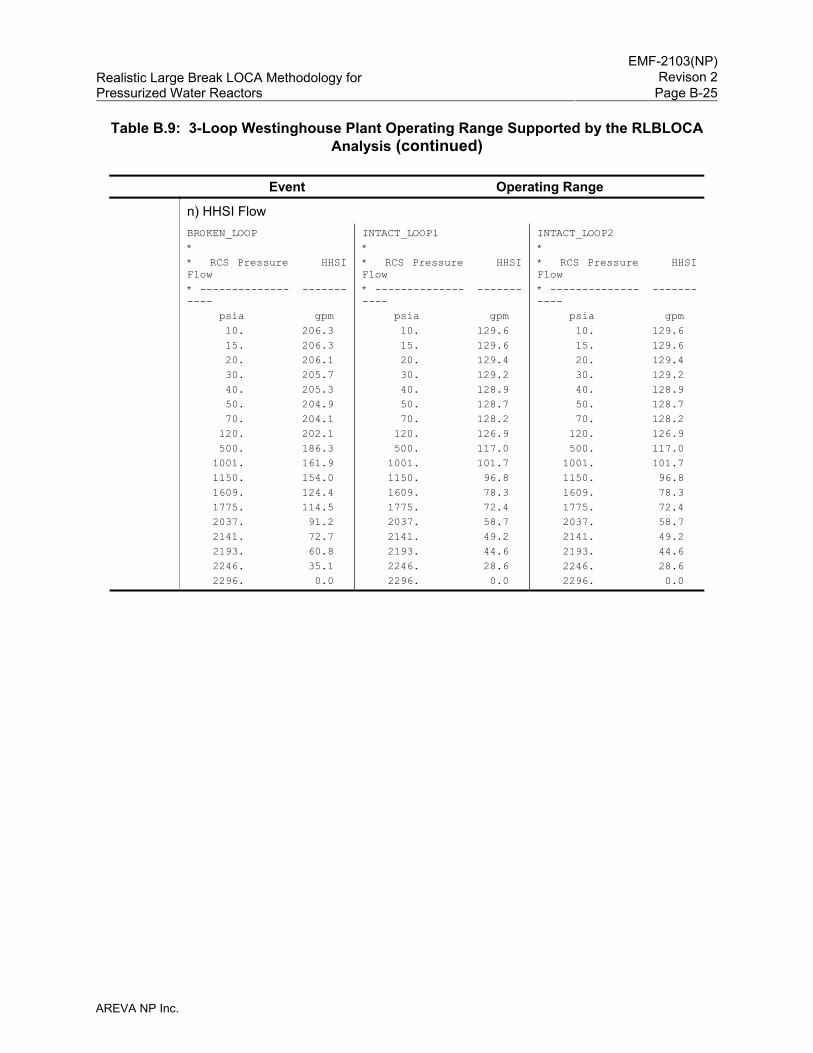
EMF-2103(NP)
Revison 2Realistic Large Break LOCA Methodology for Pressurized Water Reactors Page B-25
AREVA NP Inc.
Table B.9: 3-Loop Westinghouse Plant Operating Range Supported by the RLBLOCA Analysis (continued)
Event Operating Range
n) HHSI Flow
BROKEN_LOOP * * RCS Pressure HHSI Flow * -------------- ----------- psia gpm 10. 206.3 15. 206.3 20. 206.1 30. 205.7 40. 205.3 50. 204.9 70. 204.1 120. 202.1 500. 186.3 1001. 161.9 1150. 154.0 1609. 124.4 1775. 114.5 2037. 91.2 2141. 72.7 2193. 60.8 2246. 35.1 2296. 0.0
INTACT_LOOP1 * * RCS Pressure HHSI Flow * -------------- ----------- psia gpm 10. 129.6 15. 129.6 20. 129.4 30. 129.2 40. 128.9 50. 128.7 70. 128.2 120. 126.9 500. 117.0 1001. 101.7 1150. 96.8 1609. 78.3 1775. 72.4 2037. 58.7 2141. 49.2 2193. 44.6 2246. 28.6 2296. 0.0
INTACT_LOOP2 * * RCS Pressure HHSI Flow * -------------- ----------- psia gpm 10. 129.6 15. 129.6 20. 129.4 30. 129.2 40. 128.9 50. 128.7 70. 128.2 120. 126.9 500. 117.0 1001. 101.7 1150. 96.8 1609. 78.3 1775. 72.4 2037. 58.7 2141. 49.2 2193. 44.6 2246. 28.6 2296. 0.0
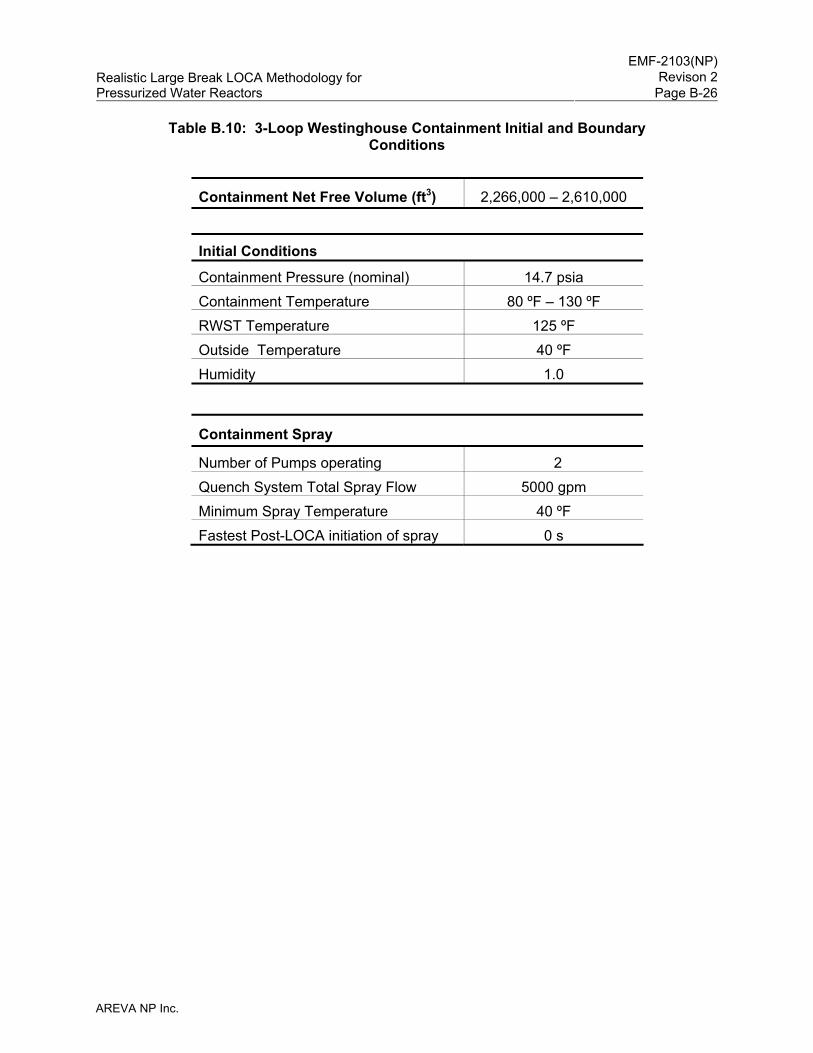
EMF-2103(NP)
Revison 2Realistic Large Break LOCA Methodology for Pressurized Water Reactors Page B-26
AREVA NP Inc.
Table B.10: 3-Loop Westinghouse Containment Initial and Boundary Conditions
Containment Net Free Volume (ft3) 2,266,000 – 2,610,000
Initial Conditions
Containment Pressure (nominal) 14.7 psia Containment Temperature 80 ºF – 130 ºF RWST Temperature 125 ºF Outside Temperature 40 ºF Humidity 1.0
Containment Spray
Number of Pumps operating 2 Quench System Total Spray Flow 5000 gpm Minimum Spray Temperature 40 ºF Fastest Post-LOCA initiation of spray 0 s
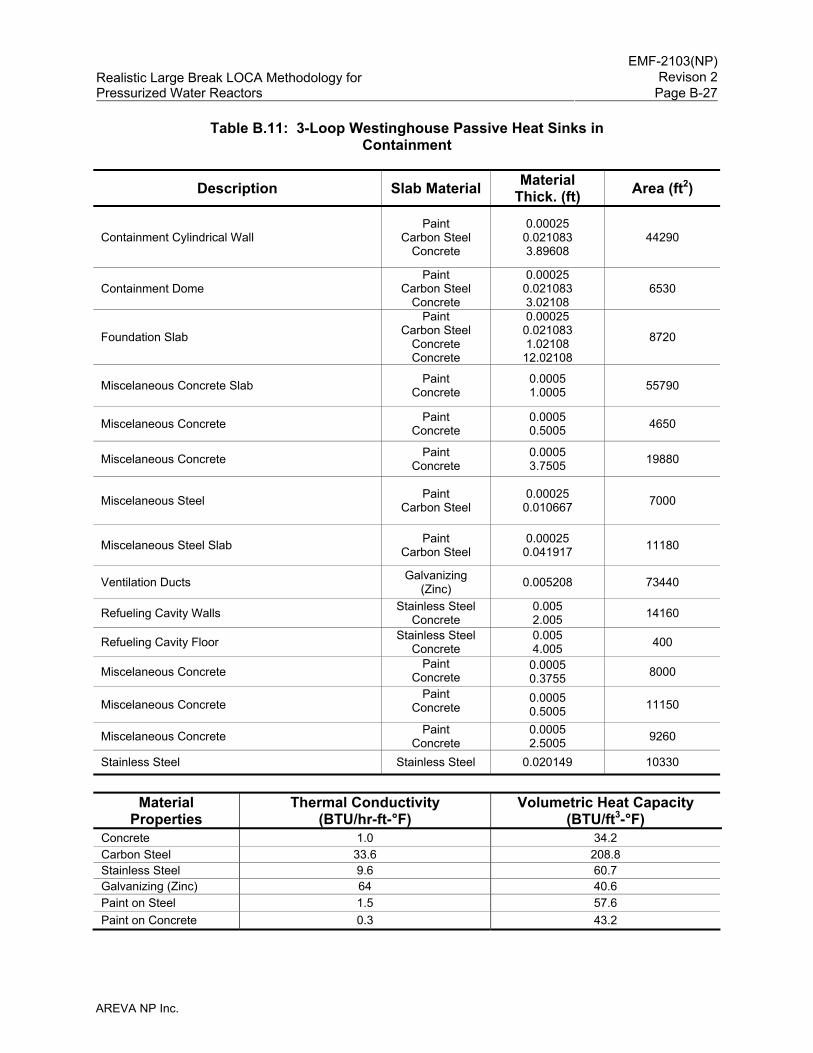
EMF-2103(NP)
Revison 2Realistic Large Break LOCA Methodology for Pressurized Water Reactors Page B-27
AREVA NP Inc.
Table B.11: 3-Loop Westinghouse Passive Heat Sinks in Containment
Description Slab Material Material Thick. (ft) Area (ft2)
Containment Cylindrical Wall Paint
Carbon Steel Concrete
0.00025 0.021083 3.89608
44290
Containment Dome Paint
Carbon Steel Concrete
0.00025 0.021083 3.02108
6530
Foundation Slab
Paint Carbon Steel
Concrete Concrete
0.00025 0.021083 1.02108
12.02108
8720
Miscelaneous Concrete Slab Paint Concrete
0.0005 1.0005 55790
Miscelaneous Concrete Paint Concrete
0.0005 0.5005 4650
Miscelaneous Concrete Paint Concrete
0.0005 3.7505 19880
Miscelaneous Steel Paint Carbon Steel
0.00025 0.010667 7000
Miscelaneous Steel Slab Paint Carbon Steel
0.00025 0.041917 11180
Ventilation Ducts Galvanizing (Zinc) 0.005208 73440
Refueling Cavity Walls Stainless Steel Concrete
0.005 2.005 14160
Refueling Cavity Floor Stainless Steel Concrete
0.005 4.005 400
Miscelaneous Concrete Paint
Concrete 0.0005 0.3755 8000
Miscelaneous Concrete Paint
Concrete 0.0005 0.5005 11150
Miscelaneous Concrete Paint Concrete
0.0005 2.5005 9260
Stainless Steel Stainless Steel 0.020149 10330
Material
Properties Thermal Conductivity
(BTU/hr-ft-°F) Volumetric Heat Capacity
(BTU/ft3-°F) Concrete 1.0 34.2 Carbon Steel 33.6 208.8 Stainless Steel 9.6 60.7 Galvanizing (Zinc) 64 40.6 Paint on Steel 1.5 57.6 Paint on Concrete 0.3 43.2
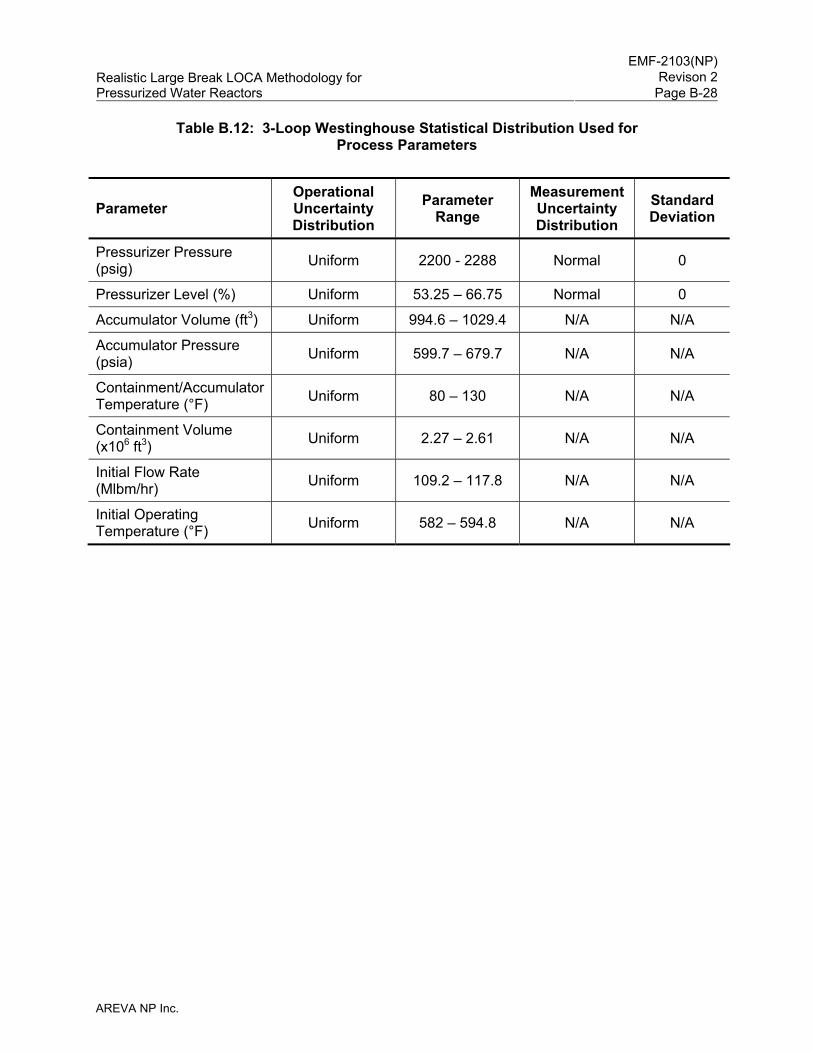
EMF-2103(NP)
Revison 2Realistic Large Break LOCA Methodology for Pressurized Water Reactors Page B-28
AREVA NP Inc.
Table B.12: 3-Loop Westinghouse Statistical Distribution Used for Process Parameters
Parameter Operational Uncertainty Distribution
Parameter Range
Measurement Uncertainty Distribution
Standard Deviation
Pressurizer Pressure (psig) Uniform 2200 - 2288 Normal 0
Pressurizer Level (%) Uniform 53.25 – 66.75 Normal 0
Accumulator Volume (ft3) Uniform 994.6 – 1029.4 N/A N/A
Accumulator Pressure (psia) Uniform 599.7 – 679.7 N/A N/A
Containment/Accumulator Temperature (°F) Uniform 80 – 130 N/A N/A
Containment Volume (x106 ft3) Uniform 2.27 – 2.61 N/A N/A
Initial Flow Rate (Mlbm/hr) Uniform 109.2 – 117.8 N/A N/A
Initial Operating Temperature (°F) Uniform 582 – 594.8 N/A N/A
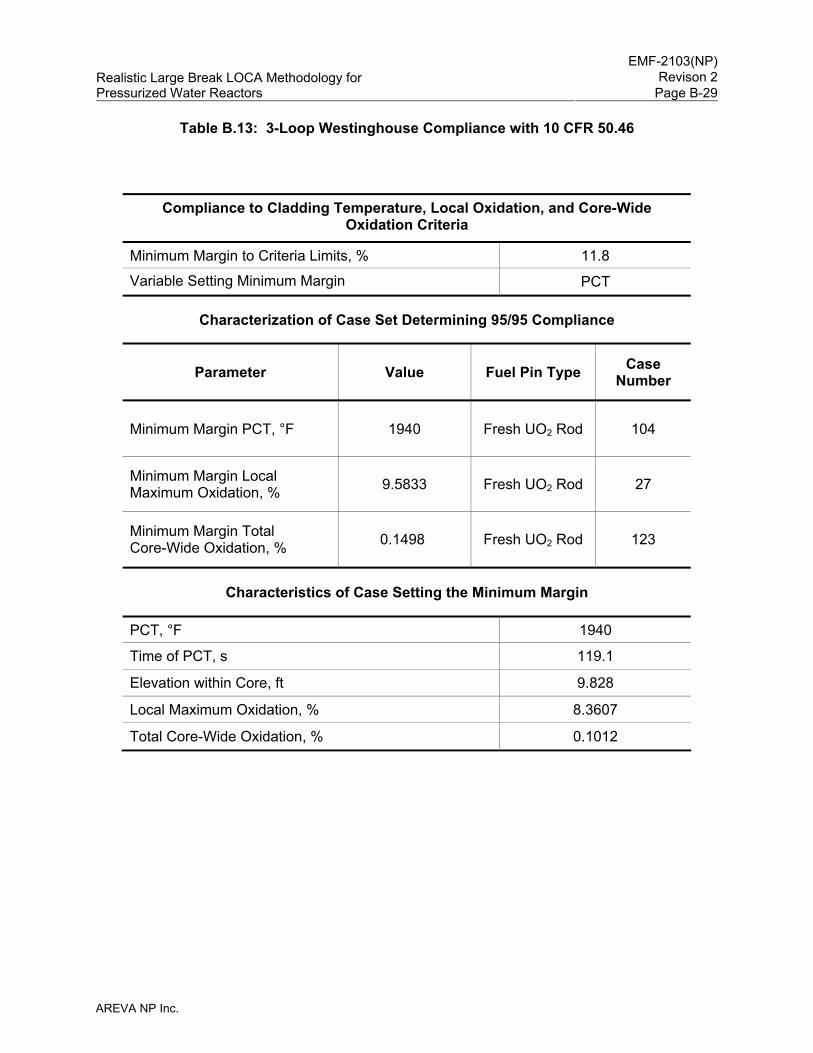
EMF-2103(NP)
Revison 2Realistic Large Break LOCA Methodology for Pressurized Water Reactors Page B-29
AREVA NP Inc.
Table B.13: 3-Loop Westinghouse Compliance with 10 CFR 50.46
Compliance to Cladding Temperature, Local Oxidation, and Core-Wide Oxidation Criteria
Minimum Margin to Criteria Limits, % 11.8
Variable Setting Minimum Margin PCT
Characterization of Case Set Determining 95/95 Compliance
Parameter Value Fuel Pin Type Case Number
Minimum Margin PCT, °F 1940 Fresh UO2 Rod 104
Minimum Margin Local Maximum Oxidation, % 9.5833 Fresh UO2 Rod 27
Minimum Margin Total Core-Wide Oxidation, % 0.1498 Fresh UO2 Rod 123
Characteristics of Case Setting the Minimum Margin
PCT, °F 1940
Time of PCT, s 119.1
Elevation within Core, ft 9.828
Local Maximum Oxidation, % 8.3607
Total Core-Wide Oxidation, % 0.1012
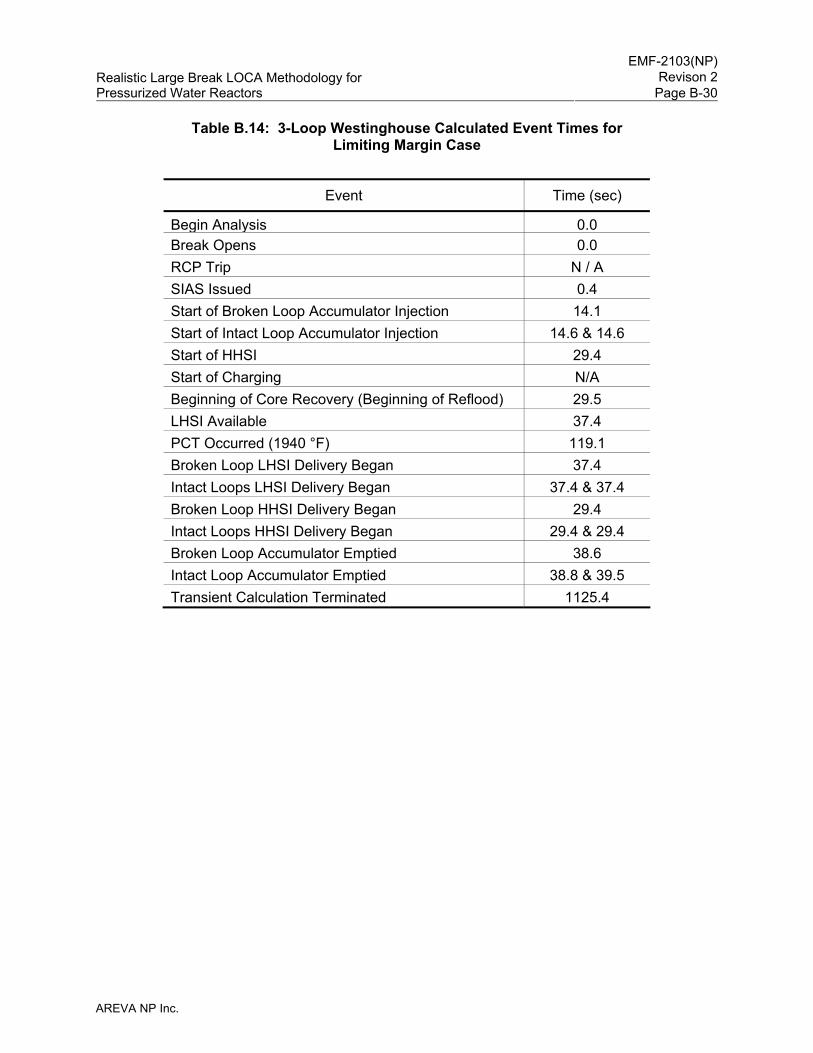
EMF-2103(NP)
Revison 2Realistic Large Break LOCA Methodology for Pressurized Water Reactors Page B-30
AREVA NP Inc.
Table B.14: 3-Loop Westinghouse Calculated Event Times for Limiting Margin Case
Event Time (sec)
Begin Analysis 0.0 Break Opens 0.0 RCP Trip N / A SIAS Issued 0.4 Start of Broken Loop Accumulator Injection 14.1 Start of Intact Loop Accumulator Injection 14.6 & 14.6 Start of HHSI 29.4 Start of Charging N/A Beginning of Core Recovery (Beginning of Reflood) 29.5 LHSI Available 37.4 PCT Occurred (1940 °F) 119.1 Broken Loop LHSI Delivery Began 37.4 Intact Loops LHSI Delivery Began 37.4 & 37.4 Broken Loop HHSI Delivery Began 29.4 Intact Loops HHSI Delivery Began 29.4 & 29.4 Broken Loop Accumulator Emptied 38.6 Intact Loop Accumulator Emptied 38.8 & 39.5 Transient Calculation Terminated 1125.4
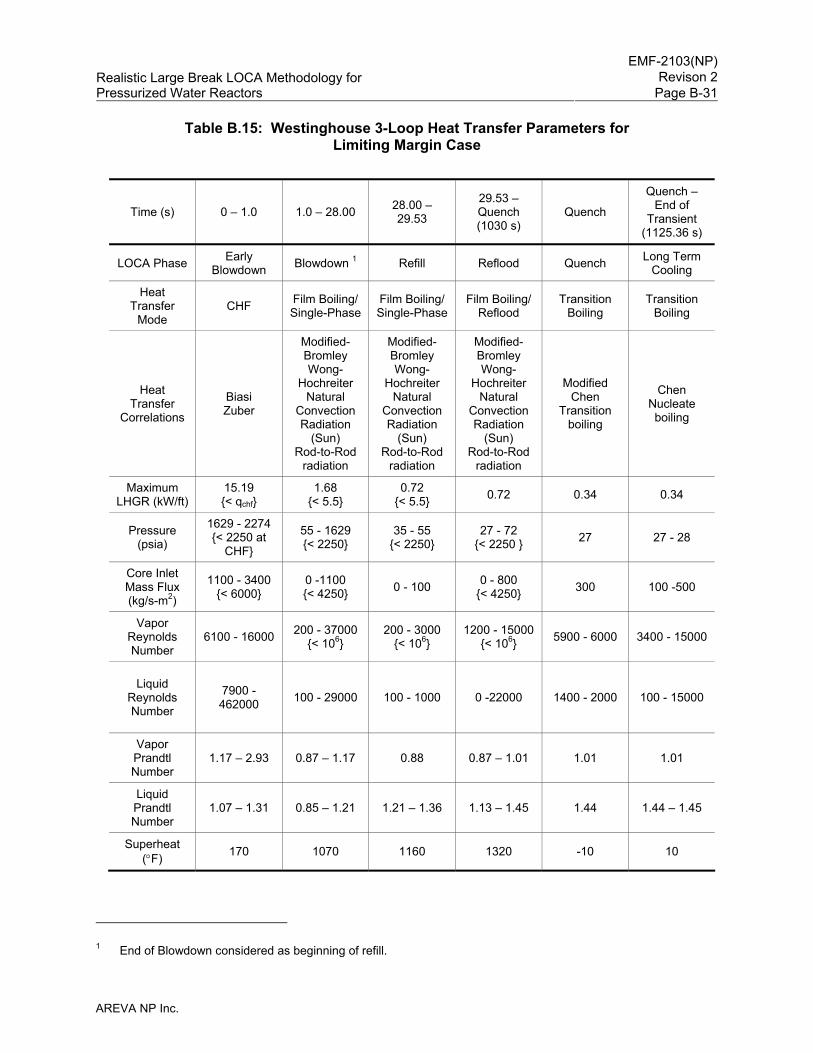
EMF-2103(NP)
Revison 2Realistic Large Break LOCA Methodology for Pressurized Water Reactors Page B-31
AREVA NP Inc.
Table B.15: Westinghouse 3-Loop Heat Transfer Parameters for Limiting Margin Case
Time (s) 0 – 1.0 1.0 – 28.00 28.00 – 29.53
29.53 – Quench (1030 s)
Quench
Quench – End of
Transient (1125.36 s)
LOCA Phase Early Blowdown Blowdown 1 Refill Reflood Quench Long Term
Cooling
Heat Transfer
Mode CHF Film Boiling/
Single-Phase Film Boiling/Single-Phase
Film Boiling/Reflood
Transition Boiling
Transition Boiling
Heat Transfer
Correlations
Biasi Zuber
Modified-Bromley Wong-
Hochreiter Natural
Convection Radiation
(Sun) Rod-to-Rod
radiation
Modified-Bromley Wong-
Hochreiter Natural
Convection Radiation
(Sun) Rod-to-Rod
radiation
Modified-Bromley Wong-
Hochreiter Natural
Convection Radiation
(Sun) Rod-to-Rod
radiation
Modified Chen
Transition boiling
Chen Nucleate boiling
Maximum LHGR (kW/ft)
15.19 {< qchf}
1.68 {< 5.5}
0.72 {< 5.5} 0.72 0.34 0.34
Pressure (psia)
1629 - 2274 {< 2250 at
CHF}
55 - 1629 {< 2250}
35 - 55 {< 2250}
27 - 72 {< 2250 } 27 27 - 28
Core Inlet Mass Flux (kg/s-m2)
1100 - 3400 {< 6000}
0 -1100 {< 4250} 0 - 100 0 - 800
{< 4250} 300 100 -500
Vapor Reynolds Number
6100 - 16000 200 - 37000{< 106}
200 - 3000 {< 106}
1200 - 15000{< 106} 5900 - 6000 3400 - 15000
Liquid Reynolds Number
7900 - 462000 100 - 29000 100 - 1000 0 -22000 1400 - 2000 100 - 15000
Vapor Prandtl Number
1.17 – 2.93 0.87 – 1.17 0.88 0.87 – 1.01 1.01 1.01
Liquid Prandtl Number
1.07 – 1.31 0.85 – 1.21 1.21 – 1.36 1.13 – 1.45 1.44 1.44 – 1.45
Superheat (°F) 170 1070 1160 1320 -10 10
1 End of Blowdown considered as beginning of refill.
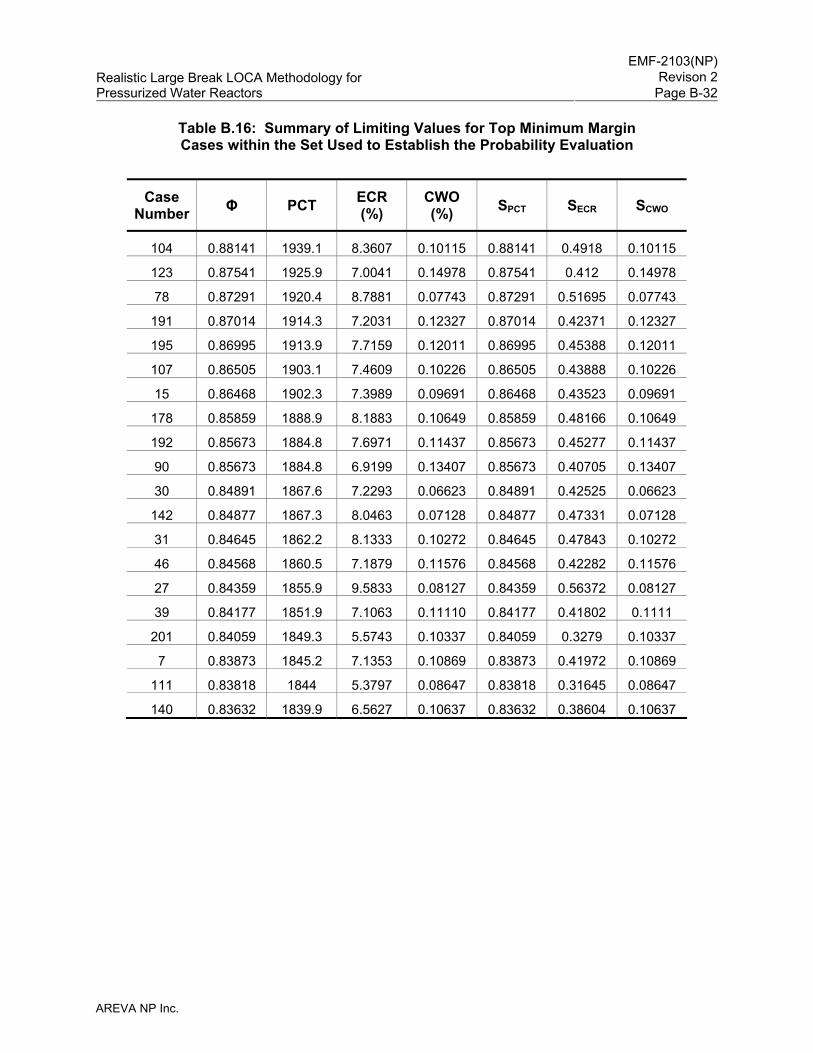
EMF-2103(NP)
Revison 2Realistic Large Break LOCA Methodology for Pressurized Water Reactors Page B-32
AREVA NP Inc.
Table B.16: Summary of Limiting Values for Top Minimum Margin Cases within the Set Used to Establish the Probability Evaluation
Case Number Φ PCT ECR
(%) CWO (%) SPCT SECR SCWO
104 0.88141 1939.1 8.3607 0.10115 0.88141 0.4918 0.10115 123 0.87541 1925.9 7.0041 0.14978 0.87541 0.412 0.14978 78 0.87291 1920.4 8.7881 0.07743 0.87291 0.51695 0.07743
191 0.87014 1914.3 7.2031 0.12327 0.87014 0.42371 0.12327 195 0.86995 1913.9 7.7159 0.12011 0.86995 0.45388 0.12011 107 0.86505 1903.1 7.4609 0.10226 0.86505 0.43888 0.10226 15 0.86468 1902.3 7.3989 0.09691 0.86468 0.43523 0.09691
178 0.85859 1888.9 8.1883 0.10649 0.85859 0.48166 0.10649 192 0.85673 1884.8 7.6971 0.11437 0.85673 0.45277 0.11437 90 0.85673 1884.8 6.9199 0.13407 0.85673 0.40705 0.13407 30 0.84891 1867.6 7.2293 0.06623 0.84891 0.42525 0.06623
142 0.84877 1867.3 8.0463 0.07128 0.84877 0.47331 0.07128 31 0.84645 1862.2 8.1333 0.10272 0.84645 0.47843 0.10272 46 0.84568 1860.5 7.1879 0.11576 0.84568 0.42282 0.11576 27 0.84359 1855.9 9.5833 0.08127 0.84359 0.56372 0.08127 39 0.84177 1851.9 7.1063 0.11110 0.84177 0.41802 0.1111
201 0.84059 1849.3 5.5743 0.10337 0.84059 0.3279 0.10337 7 0.83873 1845.2 7.1353 0.10869 0.83873 0.41972 0.10869
111 0.83818 1844 5.3797 0.08647 0.83818 0.31645 0.08647 140 0.83632 1839.9 6.5627 0.10637 0.83632 0.38604 0.10637
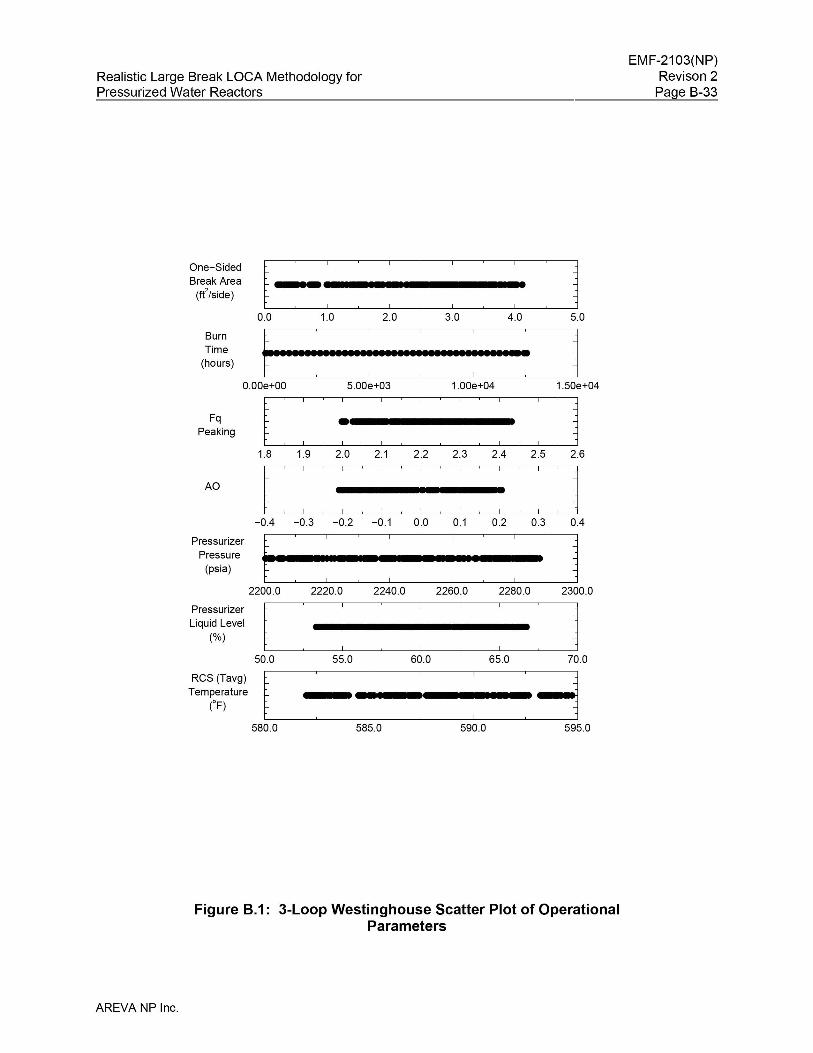
Realistic Large Break LOCA Methodology forPressurized Water Reactors
EMF-2103(NP)Revison 2
Page B-33
One-Sided
Break Area(ft
2/side)
PressurizerPressure
(psia)
PressurizerLiquid Level
(%)
Res (Tavg)Temperature
(oF)
595.0590.0580.0
0.0 1.0 2.0 3.0 4.0 5.0
1' : : : : 1O.OOe+OO 5.00e+03 1.00e+04 1.50e+04
t , : .. , : ' , , , , : : : j1.8 1.9 2.0 2.1 2.2 2.3 2.4 2.5 2.6
l ,:::' ,::.: ,,: :,j-0.4 -0.3 -0.2 -0.1 0.0 0.1 0.2 0.3 0.4
f&: : : ' '_:000. , , : •2200.0 2220.0 2240.0 2260.0 2280.0 2300.0
t ' " :: 150.0 55.0 60.0 65.0 70.0
t : -:: .. :::3585.0
AO
BurnTime
(hours)
FqPeaking
Figure B.1: 3-Loop Westinghouse Scatter Plot of OperationalParameters
AREVA NP Inc.
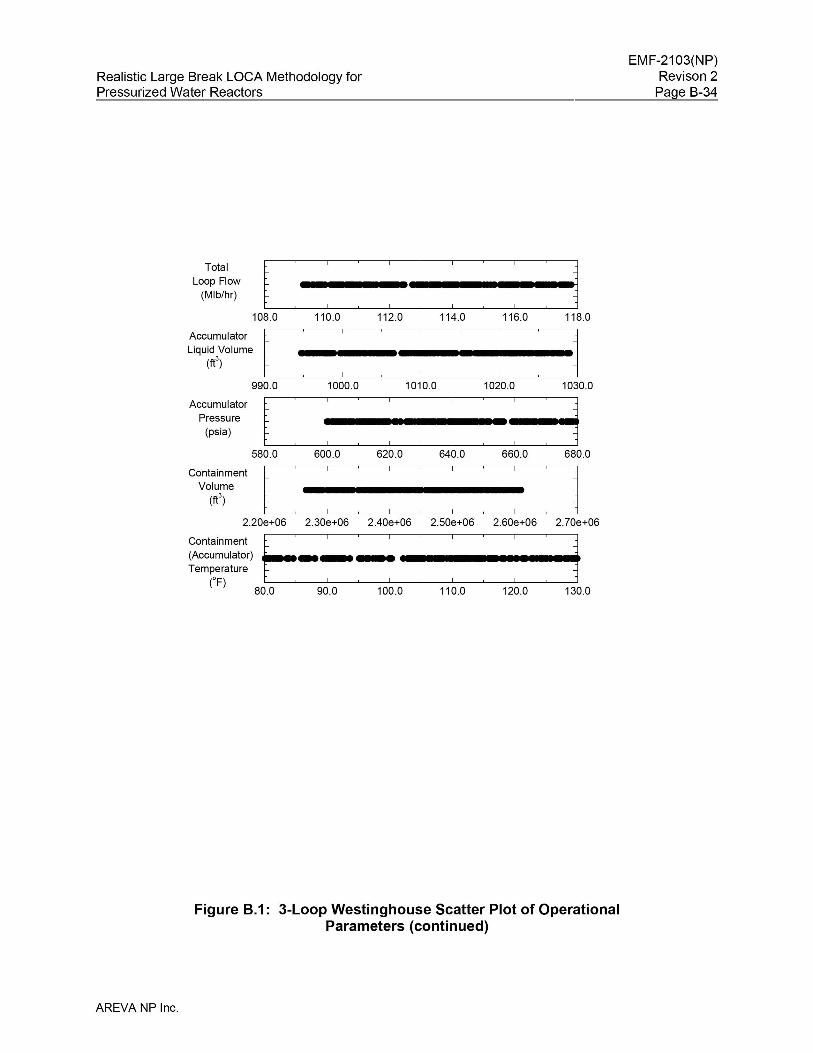
TotalLoop Flow
(Mlb/hr)
AccumulatorPressure
(psia)
ContainmentVolume
(fl3)
Realistic Large Break LOCA Methodology forPressurized Water Reactors
t. : ~ ~ ~ ~ ~ ~ ~~108.0 110.0 112.0 114.0 116.0 118.0
~~~7~::,t ~ : ! ~ :.: ~ J990.0 1000.0 1010.0 1020.0 1030.0
t • ~ ~ ~. ~ ~ ~ - ~ ~..,580.0 600.0 620.0 640.0 660.0 680.0
l ~ ~ ~ ~ ~ ~ ~ j2.20e+06 2.30e+06 2.40e+06 2.50e+06 2.60e+06 2.70e+06
~~~f~;) E--__ -~-~--~_._.:-._~-j80.0 90.0 100.0 110.0 120.0 130.0
Figure B.1: 3-Loop Westinghouse Scatter Plot of OperationalParameters (continued)
AREVA NP Inc.
EMF-2103(NP)Revison 2
Page B-34
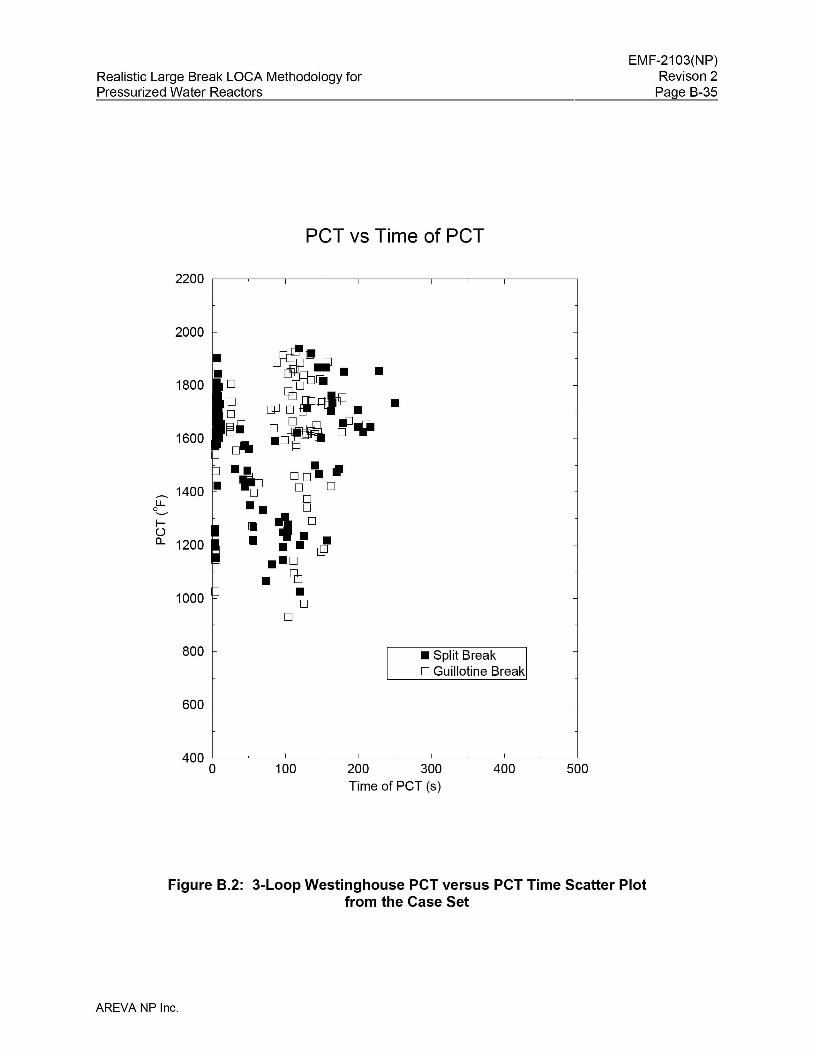
Realistic Large Break LOCA Methodology forPressurized Water Reactors
EMF-2103(NP)Revison 2
Page B-35
PCT vs Time of PCT
2200 ,----~-,----~--,-----~--,------~----,----~---,
2000
• ~-..1800 0 o lilI
0rnJ~~~. •0
1600§i i~~YuIII
·10 00' •0 0- 0
0l.L •• 00......-
~ [II t 0() • ••a.. 1200 •• @••0• CfJ
1000 •00
800 • Split Breako Guillotine Break
600
500400200 300Time of PCT (s)
100400 L--_~_-'-----_~_-'-----_~_--'-----_~_---'-----_~_---.J
o
Figure B.2: 3-Loop Westinghouse PCT versus PCT Time Scatter Plotfrom the Case Set
AREVA NP Inc.
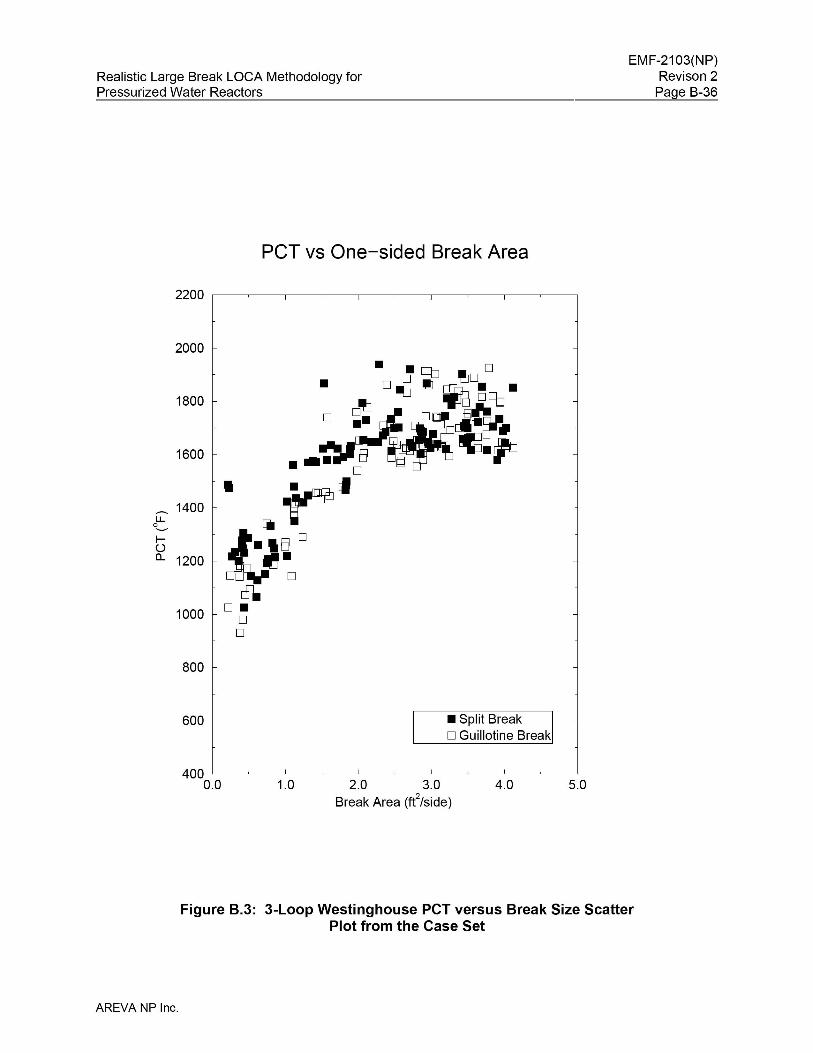
Realistic Large Break LOCA Methodology forPressurized Water Reactors
EMF-2103(NP)Revison 2
Page B-36
peT vs One-sided Break Area
2200 ,----~--,------~--,------~---,-----~----,----~----;
2000
• • lOb DD ~D• DIItJ~~·.
1800 !!J DCb
n ~ n", ~il"l~~ .1600 ••~... § ~ .p
D
•'iI rrl- 1400
u...0........
~ I:JIEJ C()a.. 1200 .,.
D D
~1000 D •
DD
800
600 • Split BreakD Guillotine Break
5.04.02.0 3.0Break Area (fe/side)
1.0400 L-_~_-'-----_~_-'-----_~_--'-----_~_---'-----_~_---.J
0.0
Figure B.3: 3-Loop Westinghouse PCT versus Break Size ScatterPlot from the Case Set
AREVA NP Inc.
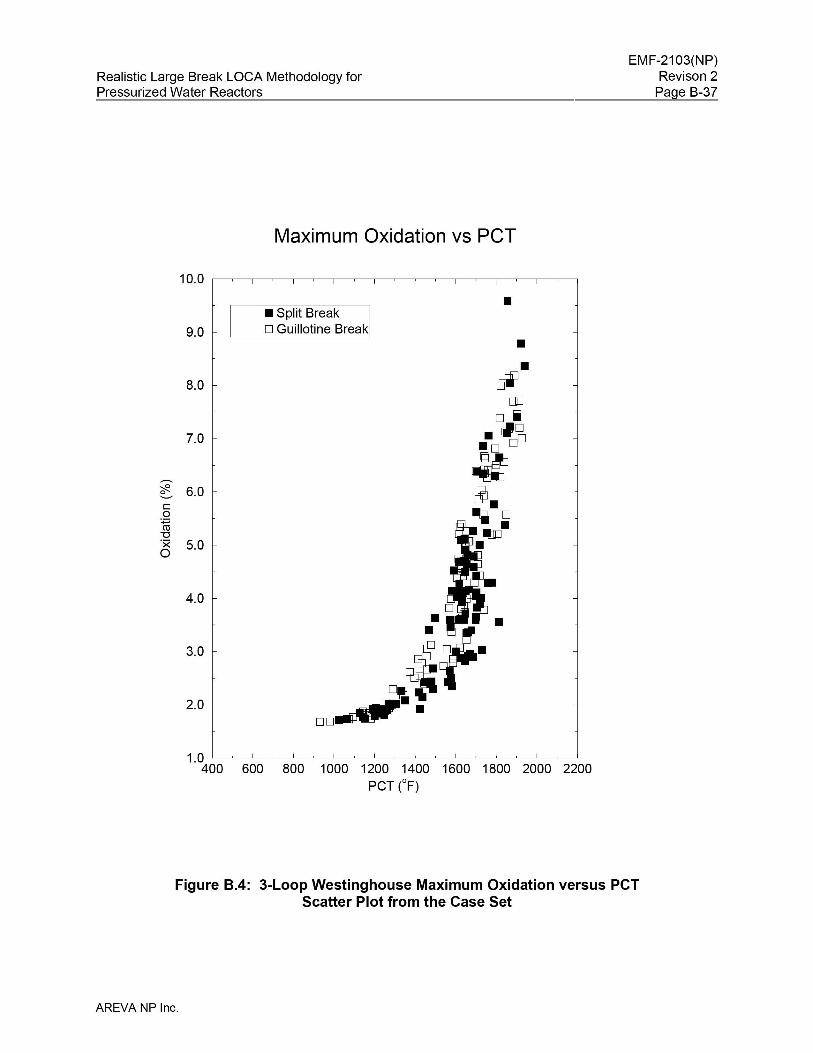
Realistic Large Break LOCA Methodology forPressurized Water Reactors
Maximum Oxidation vs peT
-
EMF-2103(NP)Revison 2
Page B-37
_ Split Break
9.0 0 Guillotine Break
8.0
7.0
~
::f2.. 6.00-c0
~"'0·x 5.00
4.0
3.0
2.0
--~[[]
o i_ rI~
-0 0a@~ 0
1IbJ-
--
1.0 L--~--'-----~----'---~-----'-~_L--~---'-----~-----'---~-----l._~-'-----~---.J
400 600 800 1000 1200 1400 1600 1800 2000 2200PCT CF)
Figure 8.4: 3-Loop Westinghouse Maximum Oxidation versus PCTScatter Plot from the Case Set
AREVA NP Inc.
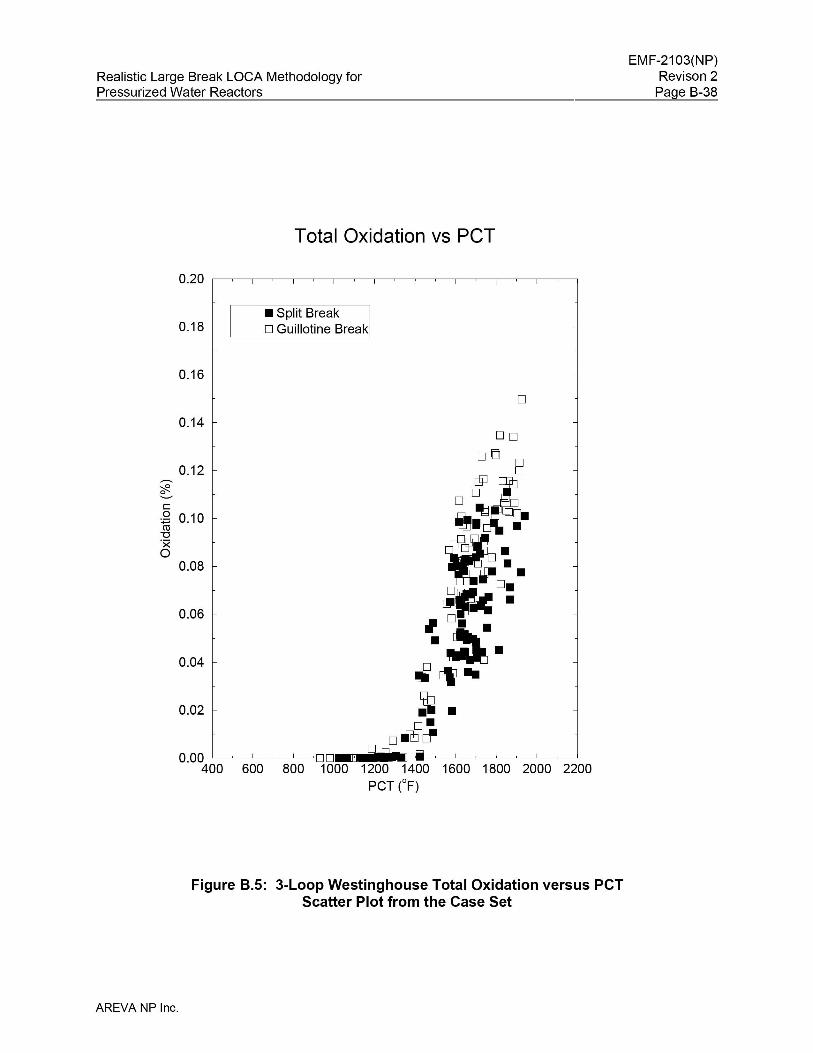
Realistic Large Break LOCA Methodology forPressurized Water Reactors
Total Oxidation vs peT
• Split Break0.18 D Guillotine Break
0.16
D
0.14
EMF-2103(NP)Revison 2
Page B-38
0.12
c~ 0.10"'0·xo
0.08
0.06
0.04
0.02
D0.00 ~~=-=--'-----::-=-=-~~IHI!~~~~=~~=-=--,"---==-=-~400 600 800 1000 1200 1400 1600 1800 2000 2200
PCT CF)
Figure 8.5: 3-Loop Westinghouse Total Oxidation versus PCTScatter Plot from the Case Set
AREVA NP Inc.
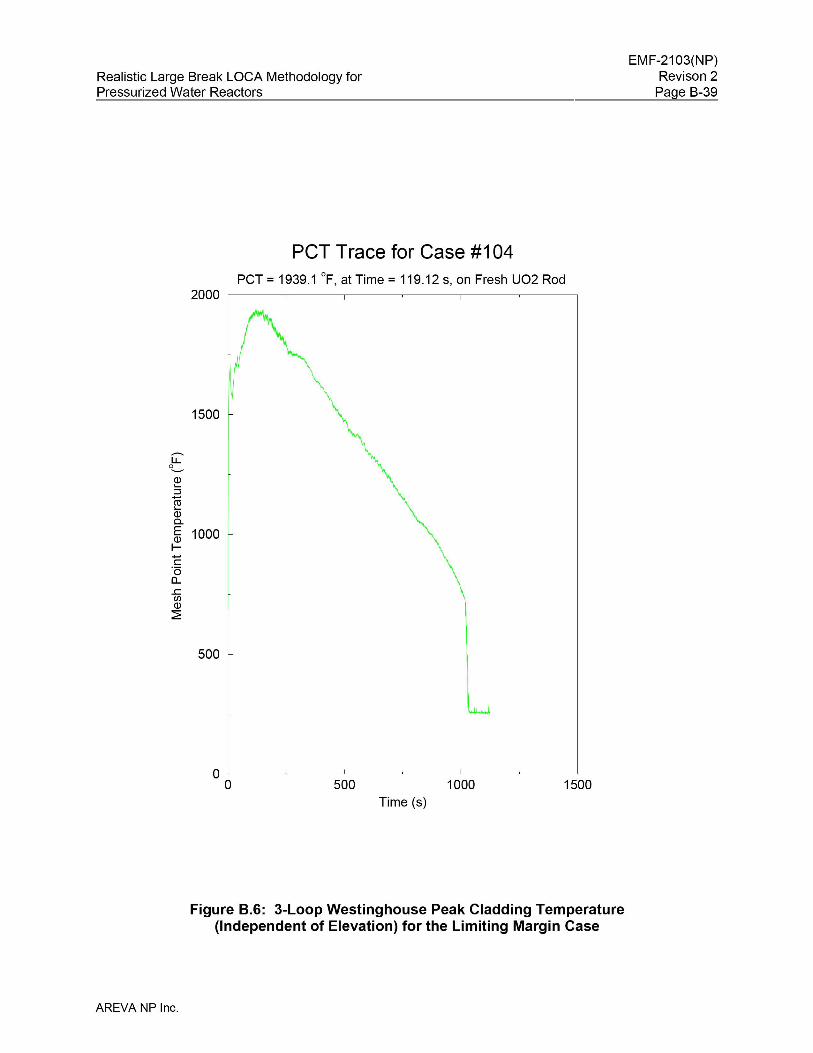
Realistic Large Break LOCA Methodology forPressurized Water Reactors
EMF-2103(NP)Revison 2
Page B-39
PCT Trace for Case #104PCT = 1939.1 of, at Time = 119.12 s, on Fresh U02 Rod
15001000500OL---~------l.---~---L----~-----.J
o
2000 ,-----~------,----~---,-------~------;
1500
-l.L0.......
Q).....::::l
ro.....Q)0..E 1000Q)l-e"0a....c:UlQ)
~
500
Time (s)
Figure B.6: 3-Loop Westinghouse Peak Cladding Temperature(Independent of Elevation) for the Limiting Margin Case
AREVA NP Inc.
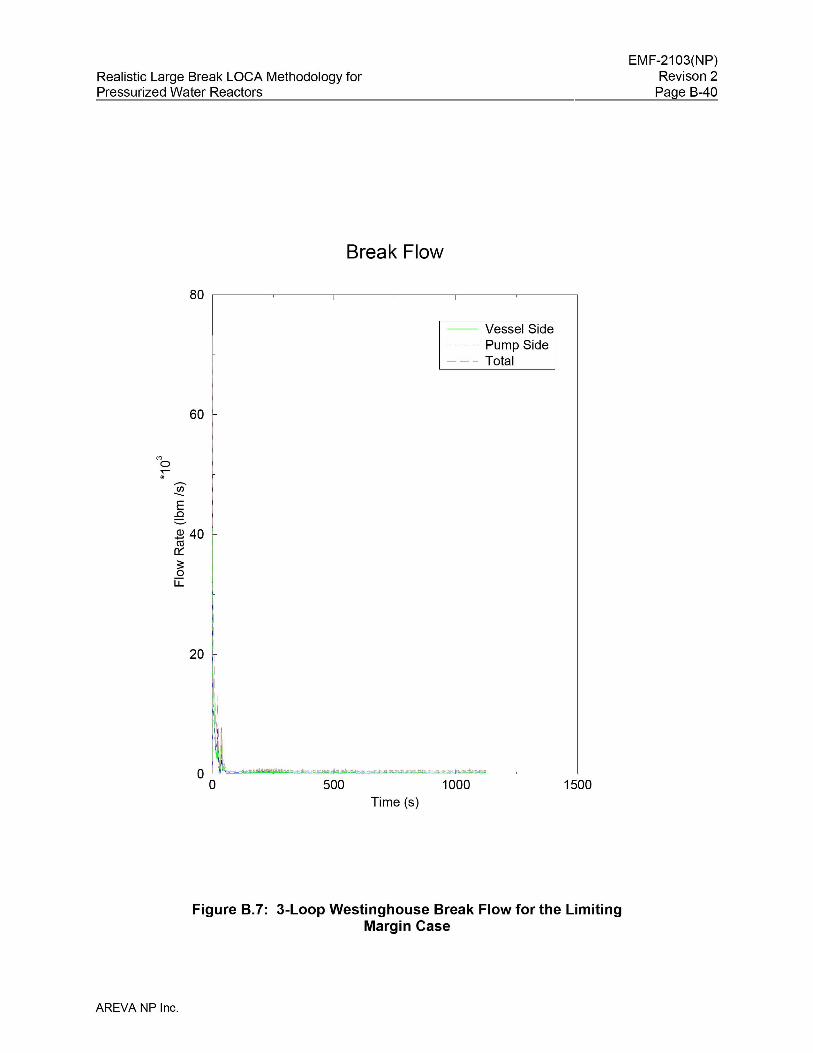
Realistic Large Break LOCA Methodology forPressurized Water Reactors
Break Flow
80 ,-------~---,-------~----,-----~---------;
-- Vessel Side- - - - Pump Side--- Total
60
E.0
.$ 40ro
0::3:o
u:::
Time (s)
Figure B.7: 3-Loop Westinghouse Break Flow for the LimitingMargin Case
AREVA NP Inc.
EMF-2103(NP)Revison 2
Page B-40
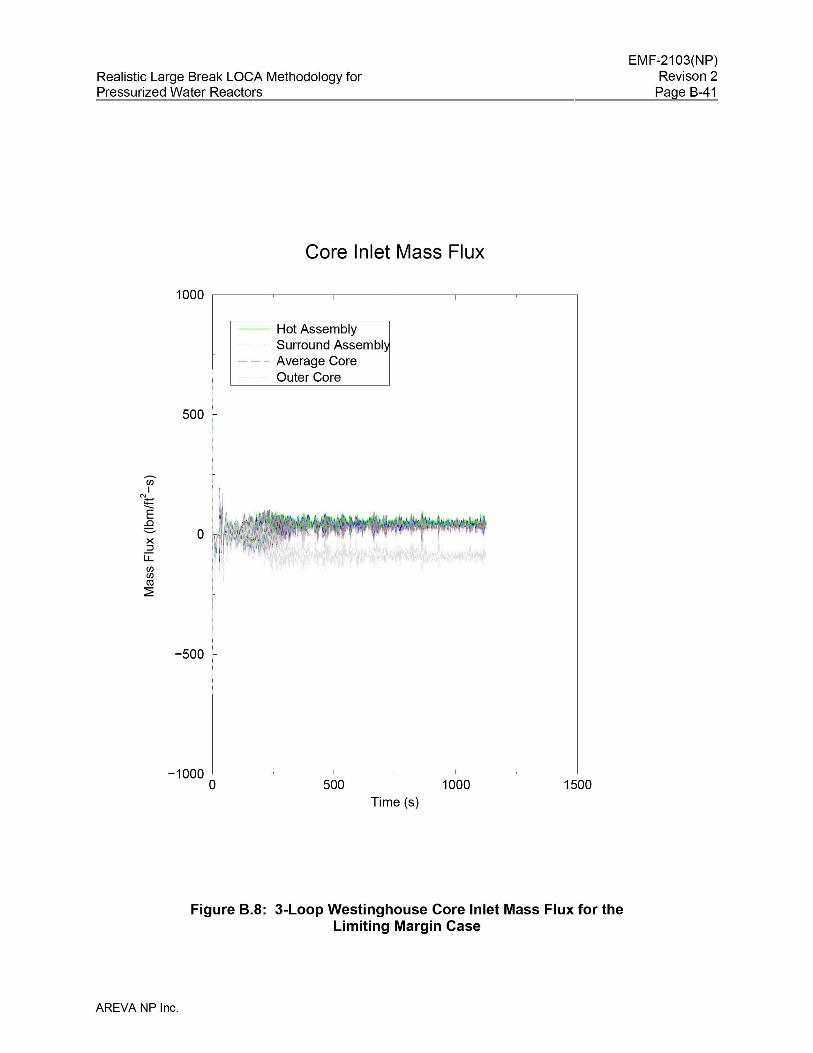
Realistic Large Break LOCA Methodology forPressurized Water Reactors
EMF-2103(NP)Revison 2
Page B-41
Core Inlet Mass Flux
1000 ,-----~-------,----~-------,----~-----;
-- Hot Assembly- - - - Surround Assembly- - - Average Core
Outer Core
500
UlI
N~
E..Cl::::;..X::::l
u::UlUlco
:2:
,
-500 '-,,
15001000500-1000 L-__~__-----'- ~__-----'--- ~__---.J
oTime (s)
Figure B.8: 3-Loop Westinghouse Core Inlet Mass Flux for theLimiting Margin Case
AREVA NP Inc.
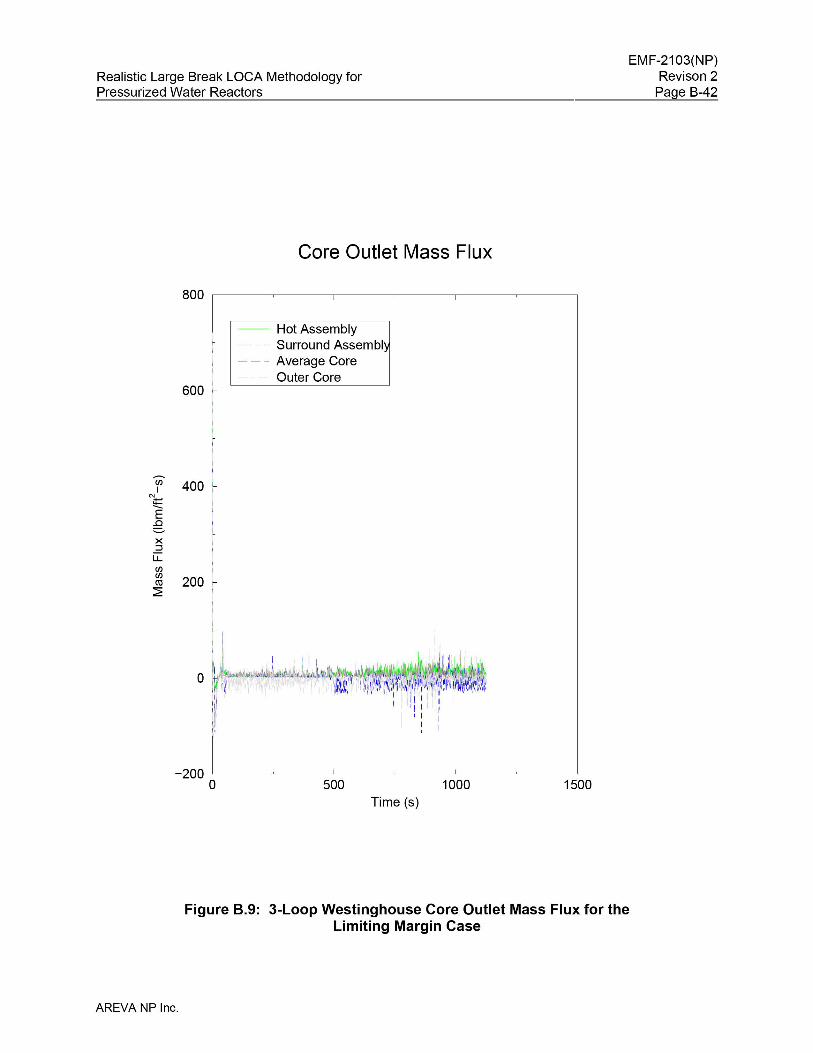
Realistic Large Break LOCA Methodology forPressurized Water Reactors
EMF-2103(NP)Revison 2
Page B-42
Core Outlet Mass Flux
800 ,-------~---,-------~----,-----~---------;
-- Hot Assemblyr - - - - Surround Assemblyi - - - Average CoreI Outer Core
600
Ul 400IN;t=-..E
..Cl:::::-x::::l
u::UlUl
200co:2:
15001000500-200 L-__~__-----'- ~__-----'--- ~__---.J
oTime (s)
Figure B.9: 3-Loop Westinghouse Core Outlet Mass Flux for theLimiting Margin Case
AREVA NP Inc.
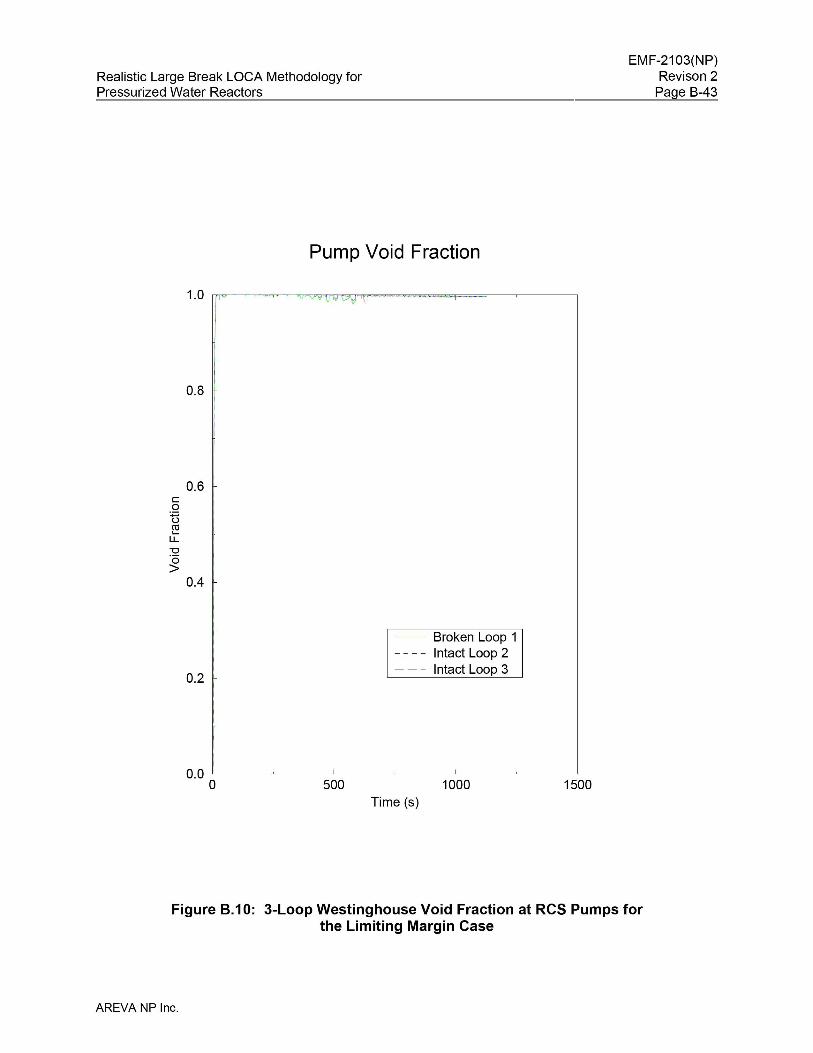
Realistic Large Break LOCA Methodology forPressurized Water Reactors
EMF-2103(NP)Revison 2
Page B-43
Pump Void Fraction
0.8
0.6con~
l.L"0·0>
0.4
0.2
-- Broken Loop 1- - - - Intact Loop 2- - - Intact Loop 3
150010005000.0 L--__~_______'_ ~_______'___ ~_____.J
oTime (s)
Figure B.1 0: 3-Loop Westinghouse Void Fraction at RCS Pumps forthe Limiting Margin Case
AREVA NP Inc.

Realistic Large Break LOCA Methodology forPressurized Water Reactors
EMF-2103(NP)Revison 2
Page B-44
ECCS Flows
4000 ,-----~------,----~-------,----~----,
-- Loop 1 (broken)- - - - Loop 2--- Loop 3
3000
r;;--E.0
Q) 2000-Cil0::3:0
u::
1000
I.-. _
15001000500o LL-__~_______'_ ~_______'___ ~_____.J
oTime (s)
Figure 8.11: 3-Loop Westinghouse ECCS Flows (IncludesAccumulator, Charging, 51 and RHR) for the Limiting Margin Case
AREVA NP Inc.

Realistic Large Break LOCA Methodology forPressurized Water Reactors
EMF-2103(NP)Revison 2
Page B-45
Upper Plenum Pressure
3000 ,-----~-------,----~-------,----~-----;
2000
Cil·UiD..
----Q)'-:::JenenQ)'-a..
1000
15001000500
1\
O~==============---~-~oTime (s)
Figure 8.12: 3-Loop Westinghouse Upper Plenum Pressure for theLimiting Margin Case
AREVA NP Inc.
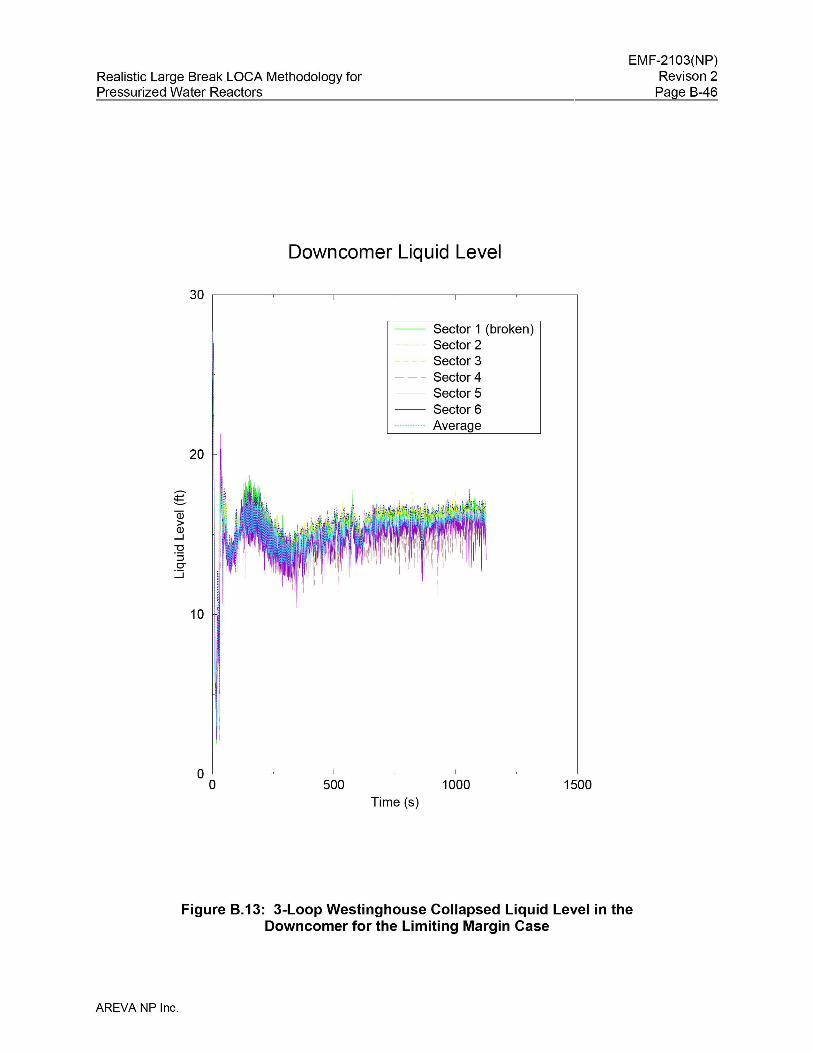
Realistic Large Break LOCA Methodology forPressurized Water Reactors
EMF-2103(NP)Revison 2
Page B-46
Downcomer Liquid Level
30 ,-------~---,-------~----,-----~---------;
-- Sector 1 (broken)Sector 2Sector 3
- - - Sector 4Sector 5
-- Sector 6............ Average
20
-~Q3>Q)
....J
~:::JCJ
:.::::i
10
15001000500O'-------~---l----~---.l.----~--------.J
oTime (s)
Figure 8.13: 3-Loop Westinghouse Collapsed Liquid Level in theDowncomer for the Limiting Margin Case
AREVA NP Inc.
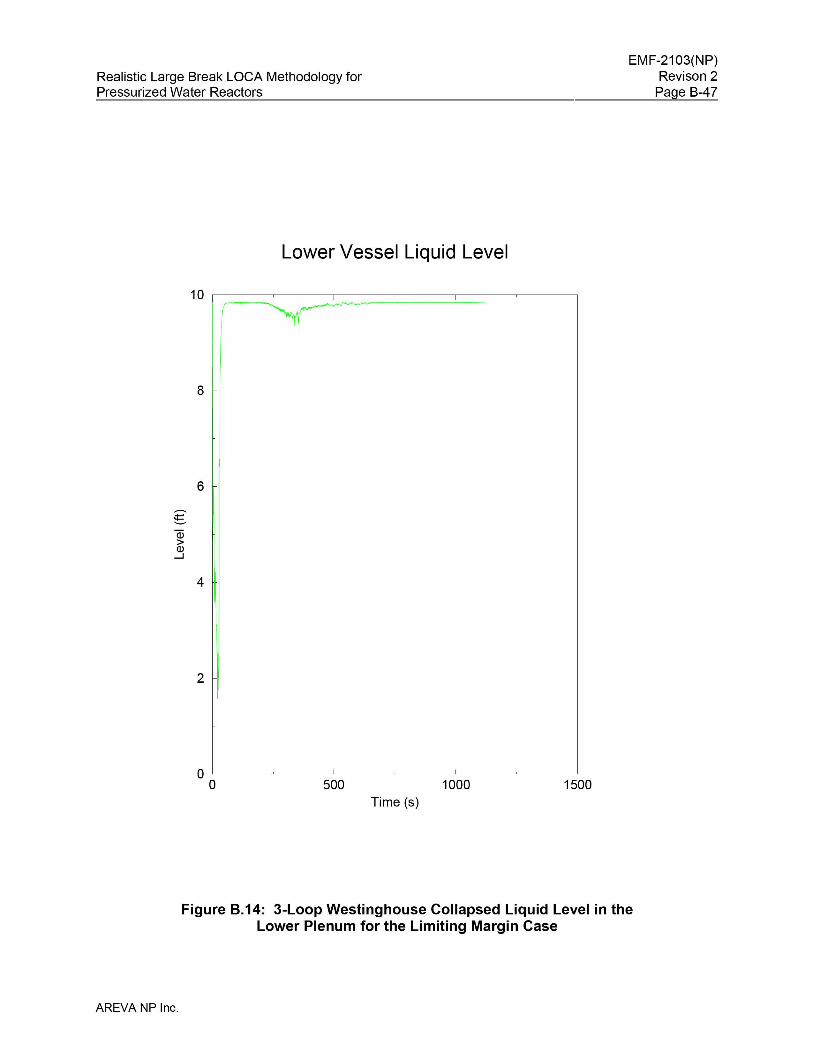
Realistic Large Break LOCA Methodology forPressurized Water Reactors
EMF-2103(NP)Revison 2
Page B-47
Lower Vessel Liquid Level
10 ,-----~-------,----~-------,----~-----;
8
6
Q)
>Q)
....J
4
2
15001000500o L-__~__-----'- ~__-----'--- ~__---.J
oTime (s)
Figure 8.14: 3-Loop Westinghouse Collapsed Liquid Level in theLower Plenum for the Limiting Margin Case
AREVA NP Inc.
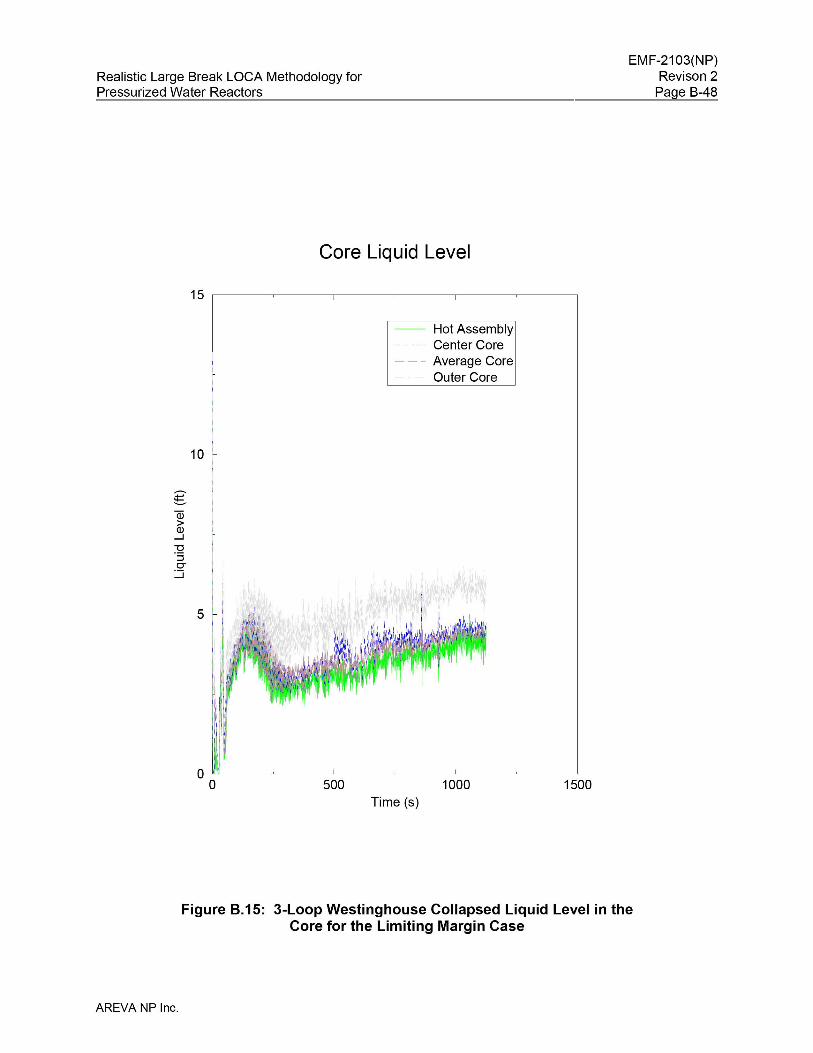
Realistic Large Break LOCA Methodology forPressurized Water Reactors
EMF-2103(NP)Revison 2
Page B-48
Core Liquid Level
15 ,-------~---,-------~----,-----~---------;
-- Hot Assembly- - - - Center Core- - - Average Core
Outer Core
15001000500lO""'------~---l----~---"-------~-------.Jo
10
-~Q3>Q)
....J
~:::JCJ
:.::::i
5
Time (s)
Figure 8.15: 3-Loop Westinghouse Collapsed Liquid Level in theCore for the Limiting Margin Case
AREVA NP Inc.
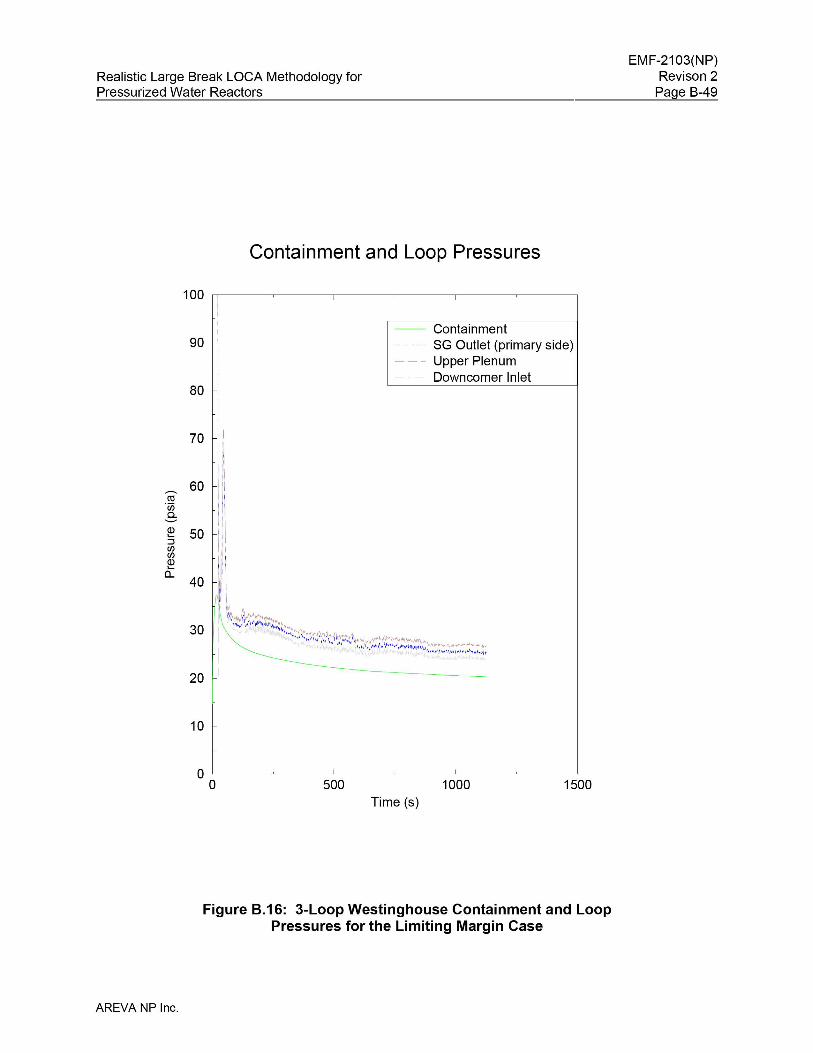
Realistic Large Break LOCA Methodology forPressurized Water Reactors
Containment and Loop Pressures
EMF-2103(NP)Revison 2
Page B-49
100
90
80
70
60co·en0..
Q) 50......::JrnrnQ)......
0..40
30
20
10
I
II -- ContainmentI
I- - -- SG Outlet (primary side)--- Upper Plenum
IDowncomer Inlet
IIII'I1 1\
IiiIII
IiI~I'llA! 'I ~ I
\\\*Jt'I""~""I '..~ 1/,.1~~'N\~1o'"'j·~~~f\~I:r,. ... J'I:-""I~ .. J. ..,.. 11
,. '"JIo/ ," f.~I~"I~~~.~J""I""''''/''''(''''''''''''''''''''j'l'''''" 1\.\t\_l'l41\_~'~,·.j ,~"~ljll\""\'I. \,..,..,\0..,. ....... ,... "" .......... "",_
1"',\1 M~\\~\'J'.~\'li~II'
oo 500Time (s)
1000 1500
Figure 8.16: 3-Loop Westinghouse Containment and LoopPressures for the Limiting Margin Case
AREVA NP Inc.
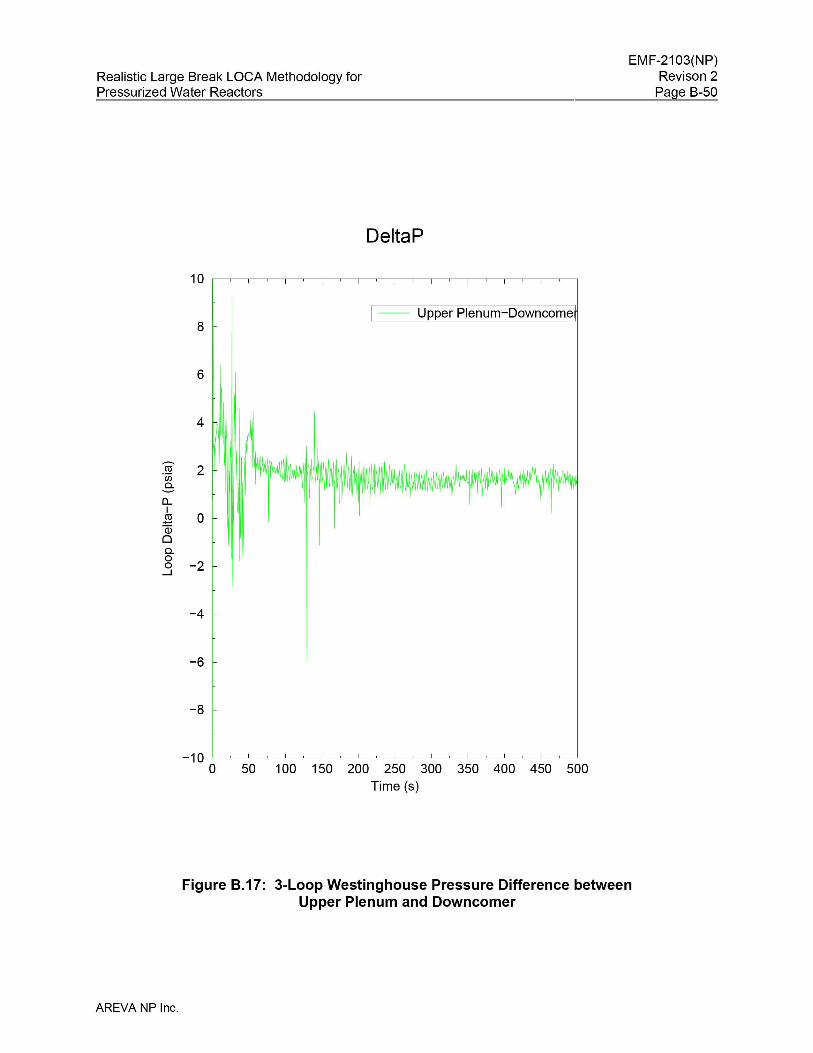
Realistic Large Break LOCA Methodology forPressurized Water Reactors
DeltaP
EMF-2103(NP)Revison 2
Page B-50
10
8
6
4 I
ro 2·000--0...I
2 0Qj00-0
-20...J
-4
-6
-8
-- Upper Plenum-Downcome
-1 0 L--~-'-----~--'-----~---'-----~---'----~-----'---~-----'--~-----'-~-----l_~L---'------..J
o 50 100 150 200 250 300 350 400 450 500Time (s)
Figure B.17: 3-Loop Westinghouse Pressure Difference betweenUpper Plenum and Downcomer
AREVA NP Inc.
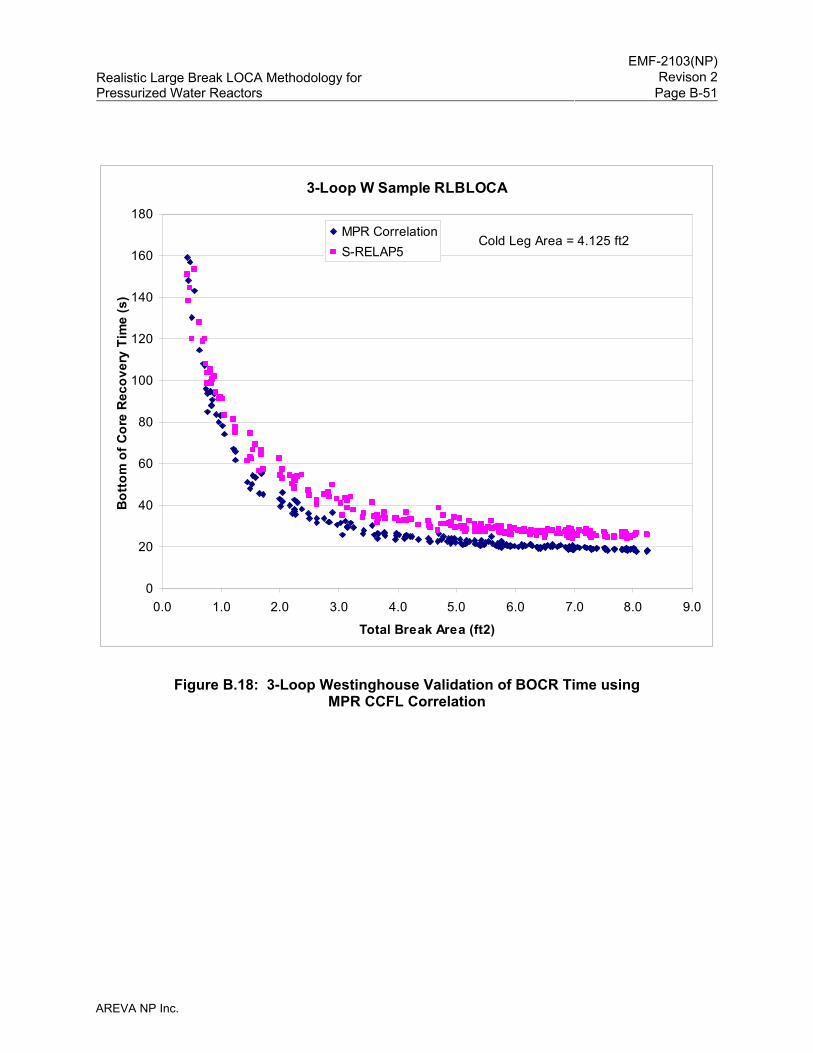
EMF-2103(NP)
Revison 2Realistic Large Break LOCA Methodology for Pressurized Water Reactors Page B-51
AREVA NP Inc.
3-Loop W Sample RLBLOCA
0
20
40
60
80
100
120
140
160
180
0.0 1.0 2.0 3.0 4.0 5.0 6.0 7.0 8.0 9.0
Total Break Area (ft2)
Bot
tom
of C
ore
Rec
over
y Ti
me
(s)
MPR CorrelationS-RELAP5
Cold Leg Area = 4.125 ft2
Figure B.18: 3-Loop Westinghouse Validation of BOCR Time using MPR CCFL Correlation
EMF-2103(NP)
Revison 2Realistic Large Break LOCA Methodology for Pressurized Water Reactors Page B-52
AREVA NP Inc.
B.3 Westinghouse 4-Loop PWR
B.3.1 Summary
The parameter specification for this analysis is provided in Table B.18. The analysis assumes
full-power operation at 3800 MWt, a steam generator tube plugging level of up to 15 percent in
any generator, a total peaking factor (Fq) of 2.335 including uncertainties, and a nuclear
enthalpy rise factor (FΔH) of 1.579 (including 5 percent uncertainty). The analysis supports
operation with AREVA 17x17 Mark-BW design fuel using standard UO2 fuel with 2, 4, 6, and
8 weight percent Gd2O3 for fresh and once burned assemblies. This analysis also addresses
typical operational ranges or technical specification limits (which ever is applicable) with regard
to pressurizer pressure and level; accumulator pressure, temperature (containment
temperature), and level; core inlet temperature; core flow; containment pressure and
temperature; and refueling water storage tank temperature. The analysis explicitly analyzes
fresh and once-burned fuel assemblies. The two GDC 35 cases were run and Loss of Offisite
Power produced the limiting PCT; therefore, the 208 case set will be run in this configuration.
The evaluation resulted in meeting the 10 CFR 50.46 criteria with a minimum margin of
13.1 percent with 95 percent coverage and 95 percent confidence. The parameter which set
this margin was the PCT of 1912 °F and occurred in a fresh fuel rod with 21.8 GWd/mtU burnup.
B.3.2 Plant Description and Summary of Analysis Parameters
The plant analysis presented in this appendix is a Westinghouse designed pressurized water
reactor (PWR), which has four loops, each with a hot leg, a U-tube steam generator, and a cold
leg with a RCP. The RCS also includes one pressurizer. The ECCS includes one charging and
one accumulator/SI/RHR injection path per RCS loop (after applying the single failure
assumption). The SI and RHR feed into common headers which are connected to the
accumulator lines. The charging pumps are also cross-connected.
The S-RELAP5 model explicitly describes the RCS, reactor vessel, pressurizer, and
accumulator lines. The charging injection flows are connected to the RCS, and the SI and RHR
injection flows are connected to the accumulator lines. This model also describes the
secondary-side steam generator that is instantaneously isolated (closed MSIV and feedwater
trip) at the time of the break.
EMF-2103(NP)
Revison 2Realistic Large Break LOCA Methodology for Pressurized Water Reactors Page B-53
AREVA NP Inc.
As described in the RLBLOCA methodology, many parameters associated with LBLOCA
phenomenological uncertainties and plant operation ranges are sampled. A summary of those
parameters sampled is given in Table B.1. Values for process or operational parameters,
including ranges of sampled process parameters, and fuel design parameters used in the
analysis are given in Table B.18. Plant data is analyzed to develop uncertainties for the process
parameters sampled in the analyses. Table B.21 presents a summary of the uncertainties used
in the analyses. Two parameters (RWST temperature and diesel start time) are set at
conservative bounding values for all calculations.
Where applicable, the sampled parameter ranges are based on technical specification limits.
Plant data are used to define range boundaries for loop flow (high end) and containment
temperature (low end).
B.3.3 Realistic Large Break LOCA Results
A set of two-hundred eight calculations were performed sampling the parameters listed in
Table B.1. The minimum retained margin to criteria was 13.1 percent at 95 percent coverage
with 95 percent confidence and was associated with case number 61 which resulted in a PCT of
1912 °F. For the set of cases (LOCA events) that lie within the 95/95 range, the maximum local
oxidation was 9.2261 percent (Case 107) and the maximum core wide oxidation was
0.2408 percent (Case 107). Table B.17 is a summary of the major parameters for the minimum
margin case. Table B.18 is the plant input parameters and operating range supported by the
analysis. Table B.19 provides the containment initial and boundary conditions. Table B.20
describes the passive heat sinks for the containment input. Table B.21 provides the statistical
distribution for the process parameters. The minimum margin case is characterized in
Table B.22 and Table B.23. The heat transfer parameter range for the limiting margin case is
provided in Table B.24. Table B.25 provides the twenty minimum margin cases used to
establish the probability evaluation.
The analysis plots for the minimum margin case are shown in Figure B.24 through Figure B.35.
Figure B.19 shows linear scatter plots of the key parameters sampled for the 208 calculations.
Parameter labels appear to the left of each individual plot. These figures illustrate the
parameter ranges used in the analysis. Figure B.20 and Figure B.21 show PCT scatter plots
versus the time of PCT and versus break size from the set of cases (LOCA events) that lie
within the 95/95 range. The scatter plots for the maximum oxidation and total oxidation are
EMF-2103(NP)
Revison 2Realistic Large Break LOCA Methodology for Pressurized Water Reactors Page B-54
AREVA NP Inc.
shown in Figure B.22 and Figure B.23, respectively. Figure B.24 through Figure B.35 show key
parameters from the S-RELAP5 calculations for the minimum margin case. Figure B.24 is the
plot of PCT, independent of elevation. Figure B.36 compares the bottom of core recovery times
for the set of cases that lie within the 95/95 range to the BOCR time predicted using the MPR
CCFL correlation.
B.3.4 Conclusions
The results of this RLBLOCA analysis show 13.1 percent minimum margin to any of the first
three 10 CFR 50.46 criterion at 95 percent coverage with 95 percent confidence.
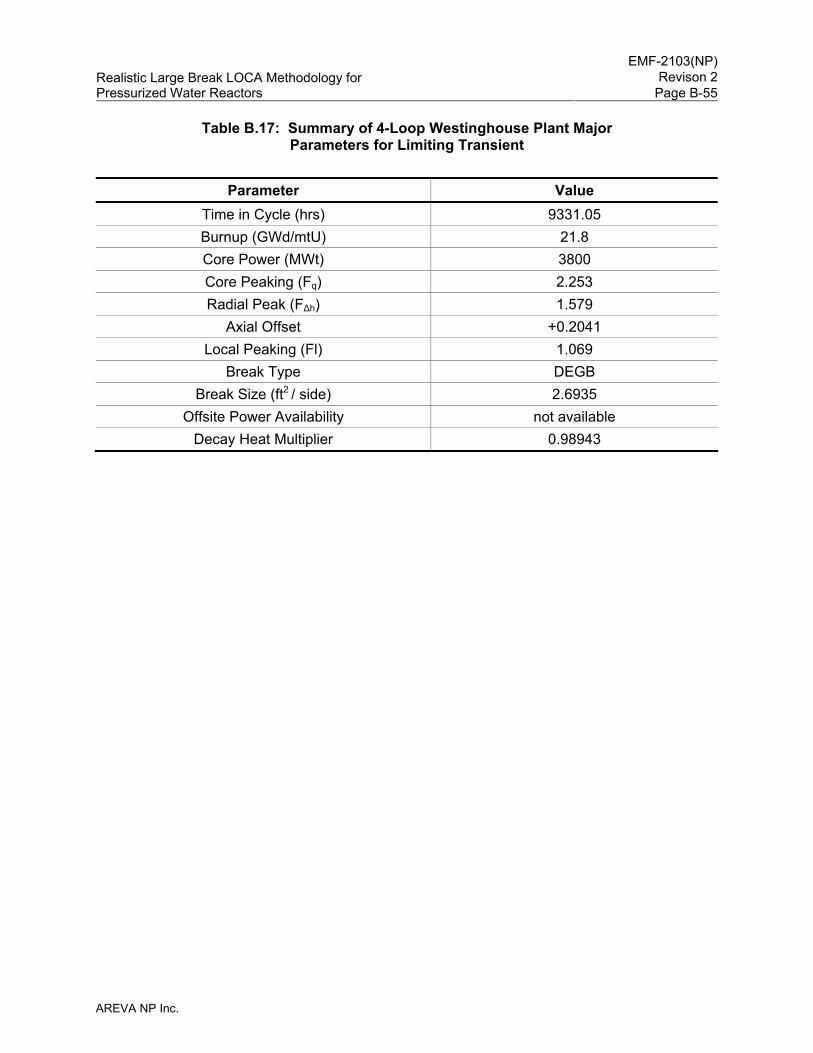
EMF-2103(NP)
Revison 2Realistic Large Break LOCA Methodology for Pressurized Water Reactors Page B-55
AREVA NP Inc.
Table B.17: Summary of 4-Loop Westinghouse Plant Major Parameters for Limiting Transient
Parameter Value
Time in Cycle (hrs) 9331.05 Burnup (GWd/mtU) 21.8 Core Power (MWt) 3800 Core Peaking (Fq) 2.253 Radial Peak (FΔh) 1.579
Axial Offset +0.2041 Local Peaking (Fl) 1.069
Break Type DEGB Break Size (ft2 / side) 2.6935
Offsite Power Availability not available Decay Heat Multiplier 0.98943
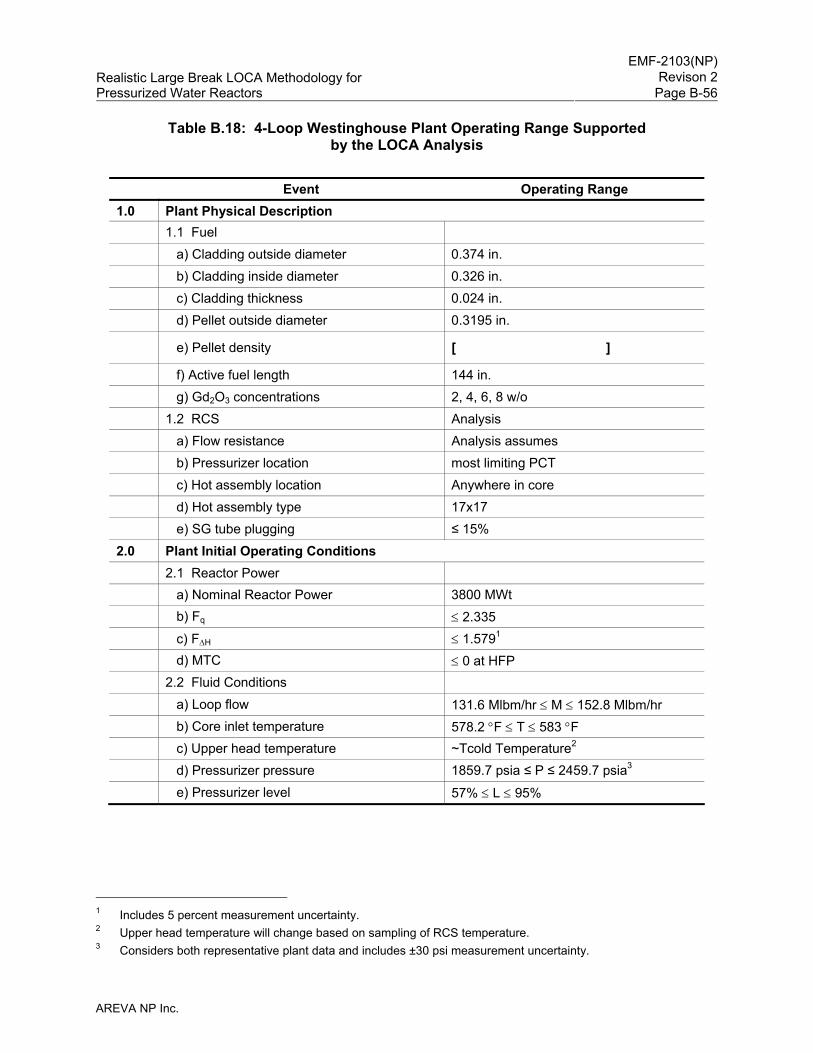
EMF-2103(NP)
Revison 2Realistic Large Break LOCA Methodology for Pressurized Water Reactors Page B-56
AREVA NP Inc.
Table B.18: 4-Loop Westinghouse Plant Operating Range Supported by the LOCA Analysis
Event Operating Range
1.0 Plant Physical Description 1.1 Fuel
a) Cladding outside diameter 0.374 in. b) Cladding inside diameter 0.326 in. c) Cladding thickness 0.024 in. d) Pellet outside diameter 0.3195 in.
e) Pellet density [ ]
f) Active fuel length 144 in. g) Gd2O3 concentrations 2, 4, 6, 8 w/o
1.2 RCS Analysis a) Flow resistance Analysis assumes b) Pressurizer location most limiting PCT c) Hot assembly location Anywhere in core d) Hot assembly type 17x17 e) SG tube plugging ≤ 15% 2.0 Plant Initial Operating Conditions 2.1 Reactor Power a) Nominal Reactor Power 3800 MWt b) Fq ≤ 2.335 c) FΔH ≤ 1.5791 d) MTC ≤ 0 at HFP 2.2 Fluid Conditions
a) Loop flow 131.6 Mlbm/hr ≤ M ≤ 152.8 Mlbm/hr b) Core inlet temperature 578.2 °F ≤ T ≤ 583 °F c) Upper head temperature ~Tcold Temperature2
d) Pressurizer pressure 1859.7 psia ≤ P ≤ 2459.7 psia3 e) Pressurizer level 57% ≤ L ≤ 95%
1 Includes 5 percent measurement uncertainty. 2 Upper head temperature will change based on sampling of RCS temperature. 3 Considers both representative plant data and includes ±30 psi measurement uncertainty.
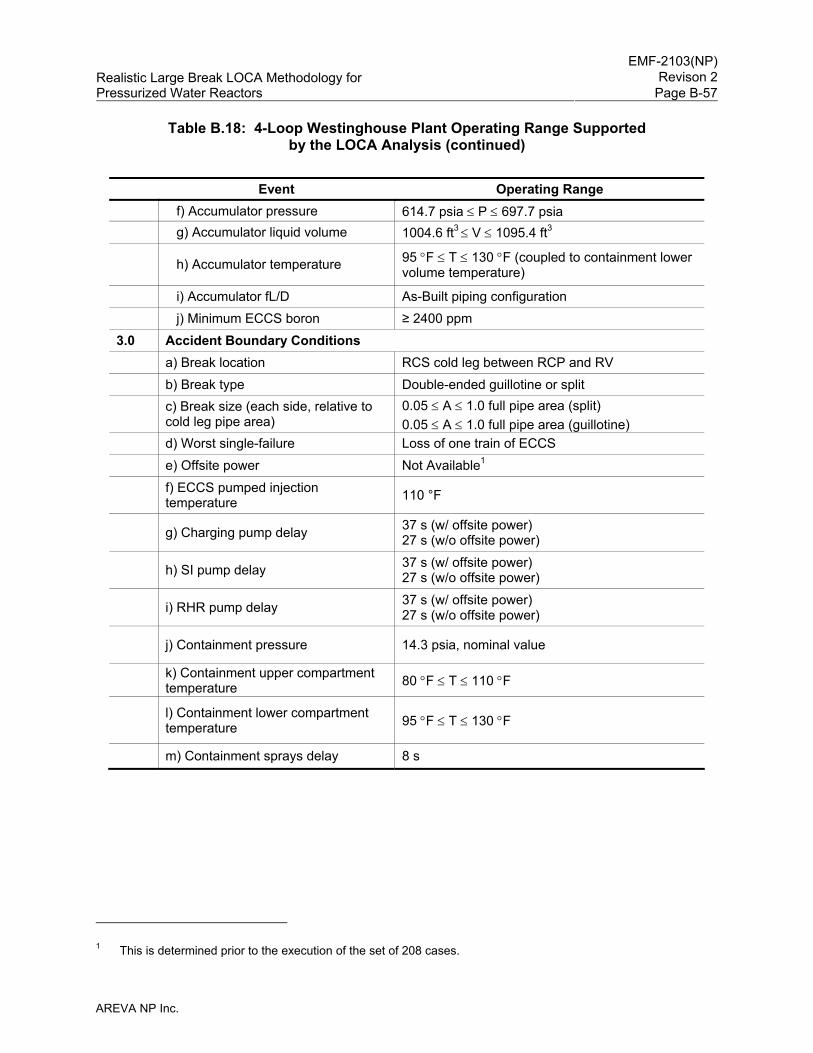
EMF-2103(NP)
Revison 2Realistic Large Break LOCA Methodology for Pressurized Water Reactors Page B-57
AREVA NP Inc.
Table B.18: 4-Loop Westinghouse Plant Operating Range Supported by the LOCA Analysis (continued)
Event Operating Range
f) Accumulator pressure 614.7 psia ≤ P ≤ 697.7 psia g) Accumulator liquid volume 1004.6 ft3 ≤ V ≤ 1095.4 ft3
h) Accumulator temperature 95 °F ≤ T ≤ 130 °F (coupled to containment lower volume temperature)
i) Accumulator fL/D As-Built piping configuration j) Minimum ECCS boron ≥ 2400 ppm 3.0 Accident Boundary Conditions
a) Break location RCS cold leg between RCP and RV b) Break type Double-ended guillotine or split c) Break size (each side, relative to cold leg pipe area)
0.05 ≤ A ≤ 1.0 full pipe area (split) 0.05 ≤ A ≤ 1.0 full pipe area (guillotine)
d) Worst single-failure Loss of one train of ECCS e) Offsite power Not Available1
f) ECCS pumped injection temperature 110 °F
g) Charging pump delay 37 s (w/ offsite power) 27 s (w/o offsite power)
h) SI pump delay 37 s (w/ offsite power) 27 s (w/o offsite power)
i) RHR pump delay 37 s (w/ offsite power) 27 s (w/o offsite power)
j) Containment pressure 14.3 psia, nominal value
k) Containment upper compartment temperature 80 °F ≤ T ≤ 110 °F
l) Containment lower compartment temperature 95 °F ≤ T ≤ 130 °F
m) Containment sprays delay 8 s
1 This is determined prior to the execution of the set of 208 cases.
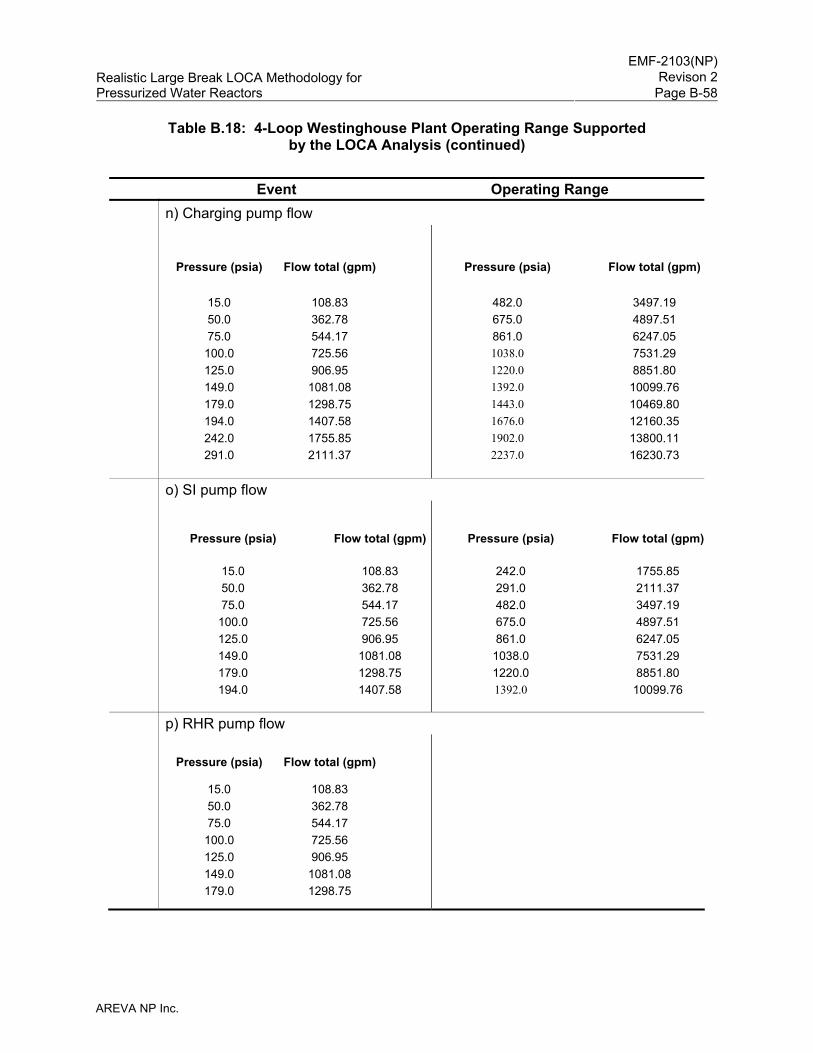
EMF-2103(NP)
Revison 2Realistic Large Break LOCA Methodology for Pressurized Water Reactors Page B-58
AREVA NP Inc.
Table B.18: 4-Loop Westinghouse Plant Operating Range Supported by the LOCA Analysis (continued)
Event Operating Range
n) Charging pump flow
Pressure (psia) Flow total (gpm)
15.0 108.83 50.0 362.78 75.0 544.17 100.0 725.56 125.0 906.95 149.0 1081.08 179.0 1298.75 194.0 1407.58 242.0 1755.85 291.0 2111.37
Pressure (psia) Flow total (gpm)
482.0 3497.19 675.0 4897.51 861.0 6247.05 1038.0 7531.29 1220.0 8851.80 1392.0 10099.76 1443.0 10469.80 1676.0 12160.35 1902.0 13800.11 2237.0 16230.73
o) SI pump flow
Pressure (psia) Flow total (gpm)
15.0 108.83 50.0 362.78 75.0 544.17
100.0 725.56 125.0 906.95 149.0 1081.08 179.0 1298.75 194.0 1407.58
Pressure (psia) Flow total (gpm)
242.0 1755.85 291.0 2111.37 482.0 3497.19 675.0 4897.51 861.0 6247.05
1038.0 7531.29 1220.0 8851.80 1392.0 10099.76
p) RHR pump flow
Pressure (psia) Flow total (gpm)
15.0 108.83 50.0 362.78 75.0 544.17 100.0 725.56 125.0 906.95 149.0 1081.08 179.0 1298.75
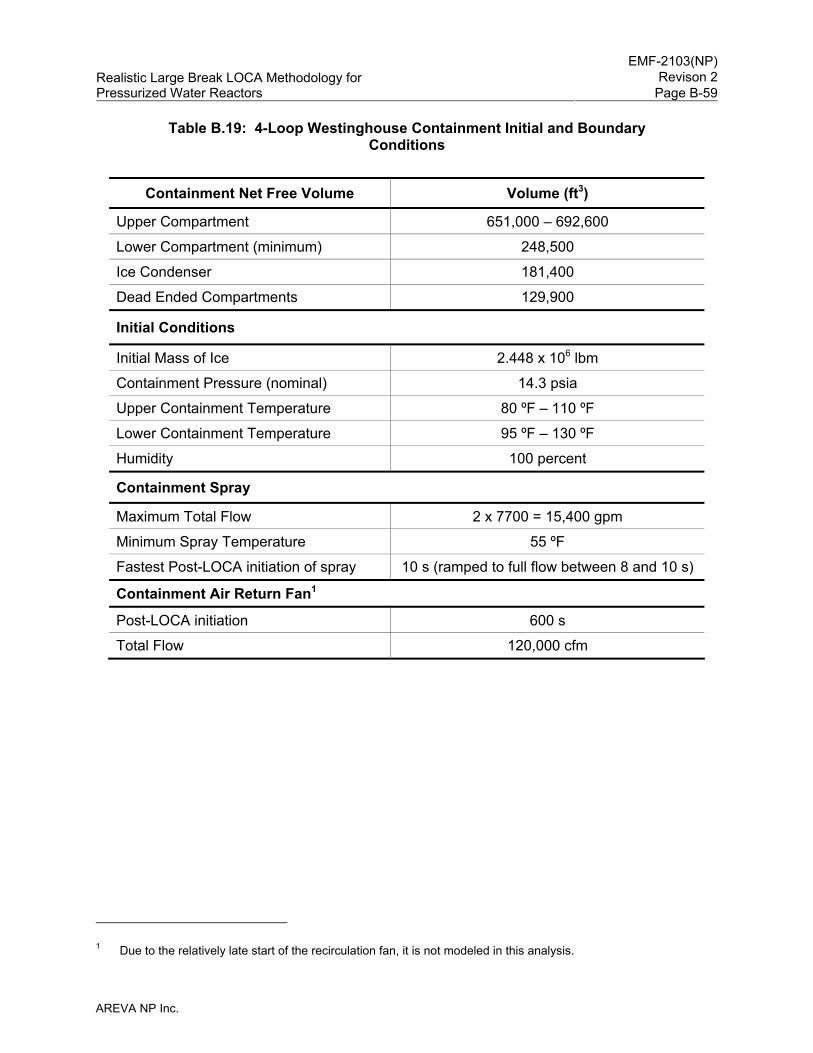
EMF-2103(NP)
Revison 2Realistic Large Break LOCA Methodology for Pressurized Water Reactors Page B-59
AREVA NP Inc.
Table B.19: 4-Loop Westinghouse Containment Initial and Boundary Conditions
Containment Net Free Volume Volume (ft3)
Upper Compartment 651,000 – 692,600
Lower Compartment (minimum) 248,500
Ice Condenser 181,400
Dead Ended Compartments 129,900
Initial Conditions
Initial Mass of Ice 2.448 x 10⁶ lbm
Containment Pressure (nominal) 14.3 psia
Upper Containment Temperature 80 ºF – 110 ºF
Lower Containment Temperature 95 ºF – 130 ºF
Humidity 100 percent
Containment Spray
Maximum Total Flow 2 x 7700 = 15,400 gpm
Minimum Spray Temperature 55 ºF
Fastest Post-LOCA initiation of spray 10 s (ramped to full flow between 8 and 10 s)
Containment Air Return Fan1
Post-LOCA initiation 600 s
Total Flow 120,000 cfm
1 Due to the relatively late start of the recirculation fan, it is not modeled in this analysis.
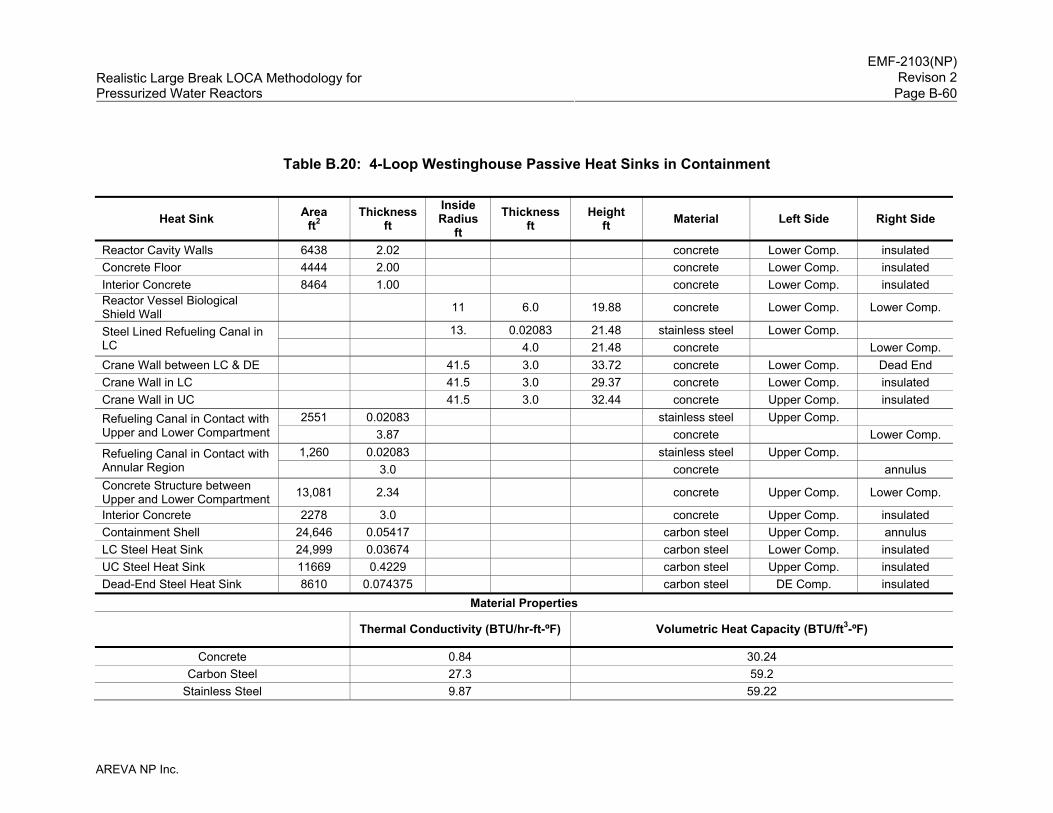
EMF-2103(NP)
Revison 2Realistic Large Break LOCA Methodology for Pressurized Water Reactors Page B-60
AREVA NP Inc.
Table B.20: 4-Loop Westinghouse Passive Heat Sinks in Containment
Heat Sink Area ft2
Thickness ft
Inside Radius
ft Thickness
ft Height
ft Material Left Side Right Side
Reactor Cavity Walls 6438 2.02 concrete Lower Comp. insulated Concrete Floor 4444 2.00 concrete Lower Comp. insulated Interior Concrete 8464 1.00 concrete Lower Comp. insulated Reactor Vessel Biological Shield Wall 11 6.0 19.88 concrete Lower Comp. Lower Comp.
13. 0.02083 21.48 stainless steel Lower Comp. Steel Lined Refueling Canal in LC 4.0 21.48 concrete Lower Comp. Crane Wall between LC & DE 41.5 3.0 33.72 concrete Lower Comp. Dead End Crane Wall in LC 41.5 3.0 29.37 concrete Lower Comp. insulated Crane Wall in UC 41.5 3.0 32.44 concrete Upper Comp. insulated
2551 0.02083 stainless steel Upper Comp. Refueling Canal in Contact with Upper and Lower Compartment 3.87 concrete Lower Comp.
1,260 0.02083 stainless steel Upper Comp. Refueling Canal in Contact with Annular Region 3.0 concrete annulus Concrete Structure between Upper and Lower Compartment 13,081 2.34 concrete Upper Comp. Lower Comp.
Interior Concrete 2278 3.0 concrete Upper Comp. insulated Containment Shell 24,646 0.05417 carbon steel Upper Comp. annulus LC Steel Heat Sink 24,999 0.03674 carbon steel Lower Comp. insulated UC Steel Heat Sink 11669 0.4229 carbon steel Upper Comp. insulated Dead-End Steel Heat Sink 8610 0.074375 carbon steel DE Comp. insulated
Material Properties
Thermal Conductivity (BTU/hr-ft-ºF) Volumetric Heat Capacity (BTU/ft3-ºF)
Concrete 0.84 30.24 Carbon Steel 27.3 59.2
Stainless Steel 9.87 59.22
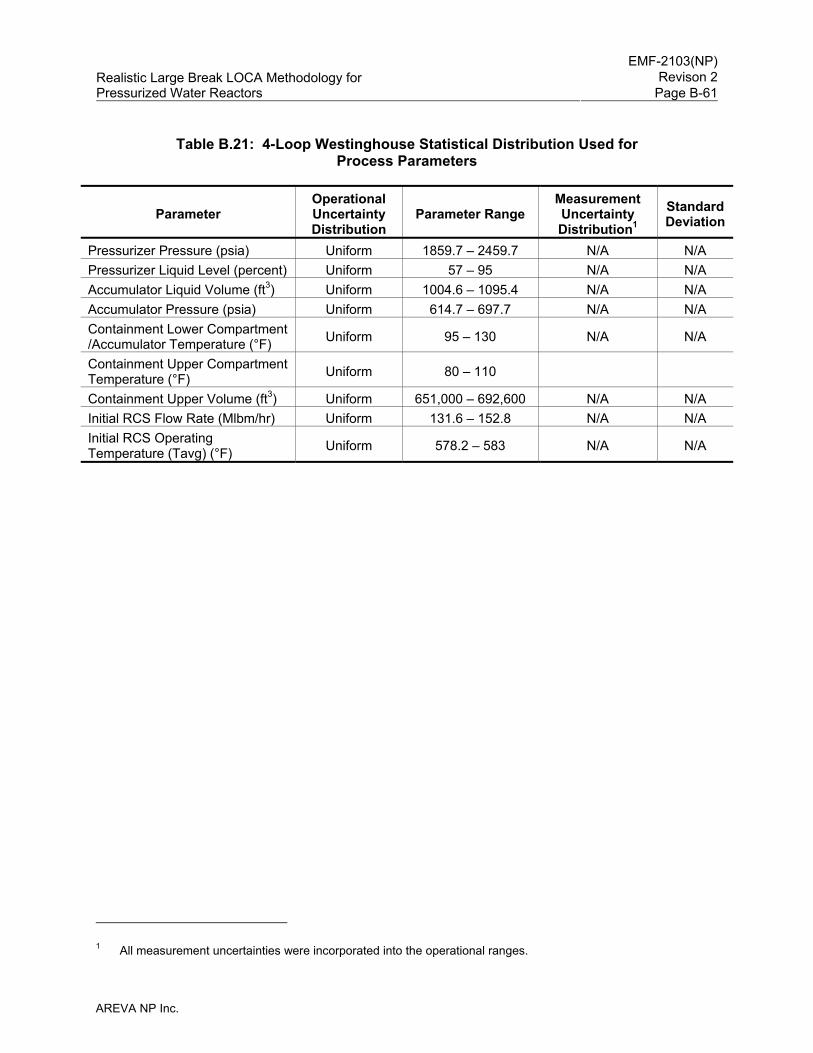
EMF-2103(NP)
Revison 2Realistic Large Break LOCA Methodology for Pressurized Water Reactors Page B-61
AREVA NP Inc.
Table B.21: 4-Loop Westinghouse Statistical Distribution Used for Process Parameters
Parameter Operational Uncertainty Distribution
Parameter Range Measurement Uncertainty Distribution1
Standard Deviation
Pressurizer Pressure (psia) Uniform 1859.7 – 2459.7 N/A N/A Pressurizer Liquid Level (percent) Uniform 57 – 95 N/A N/A Accumulator Liquid Volume (ft3) Uniform 1004.6 – 1095.4 N/A N/A Accumulator Pressure (psia) Uniform 614.7 – 697.7 N/A N/A Containment Lower Compartment /Accumulator Temperature (°F) Uniform 95 – 130 N/A N/A
Containment Upper Compartment Temperature (°F) Uniform 80 – 110
Containment Upper Volume (ft3) Uniform 651,000 – 692,600 N/A N/A Initial RCS Flow Rate (Mlbm/hr) Uniform 131.6 – 152.8 N/A N/A Initial RCS Operating Temperature (Tavg) (°F) Uniform 578.2 – 583 N/A N/A
1 All measurement uncertainties were incorporated into the operational ranges.
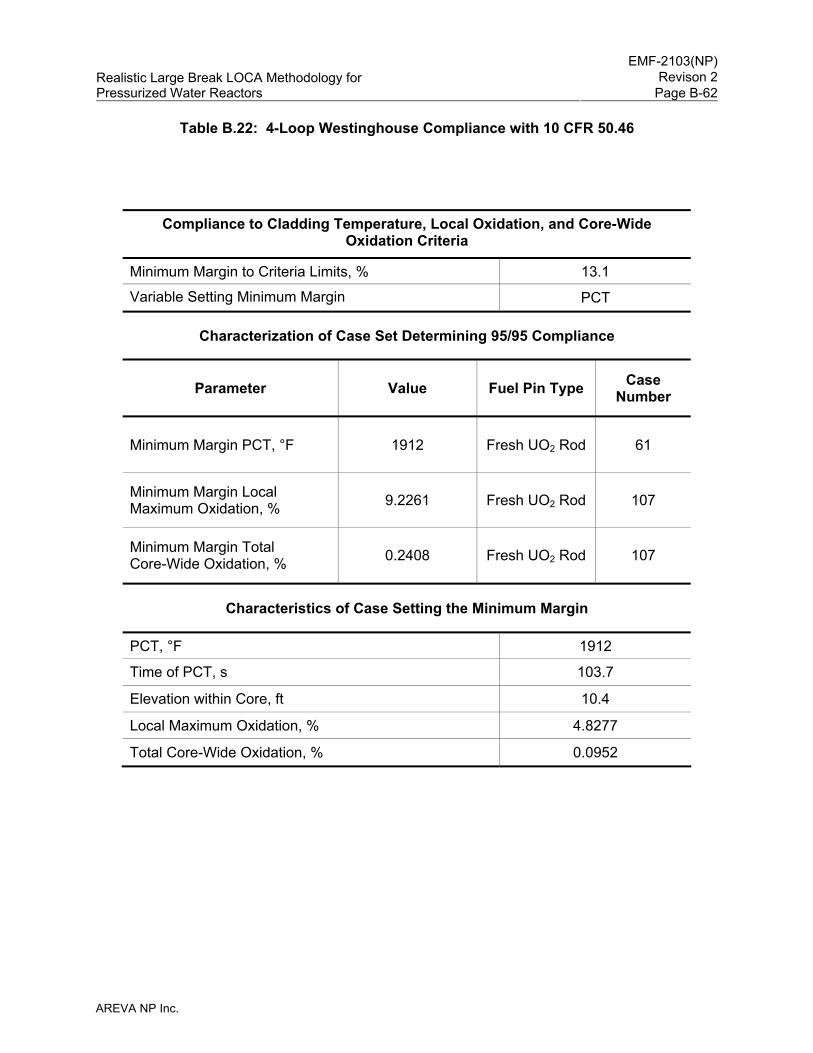
EMF-2103(NP)
Revison 2Realistic Large Break LOCA Methodology for Pressurized Water Reactors Page B-62
AREVA NP Inc.
Table B.22: 4-Loop Westinghouse Compliance with 10 CFR 50.46
Compliance to Cladding Temperature, Local Oxidation, and Core-Wide Oxidation Criteria
Minimum Margin to Criteria Limits, % 13.1
Variable Setting Minimum Margin PCT
Characterization of Case Set Determining 95/95 Compliance
Parameter Value Fuel Pin Type Case Number
Minimum Margin PCT, °F 1912 Fresh UO2 Rod 61
Minimum Margin Local Maximum Oxidation, % 9.2261 Fresh UO2 Rod 107
Minimum Margin Total Core-Wide Oxidation, % 0.2408 Fresh UO2 Rod 107
Characteristics of Case Setting the Minimum Margin
PCT, °F 1912
Time of PCT, s 103.7
Elevation within Core, ft 10.4
Local Maximum Oxidation, % 4.8277
Total Core-Wide Oxidation, % 0.0952
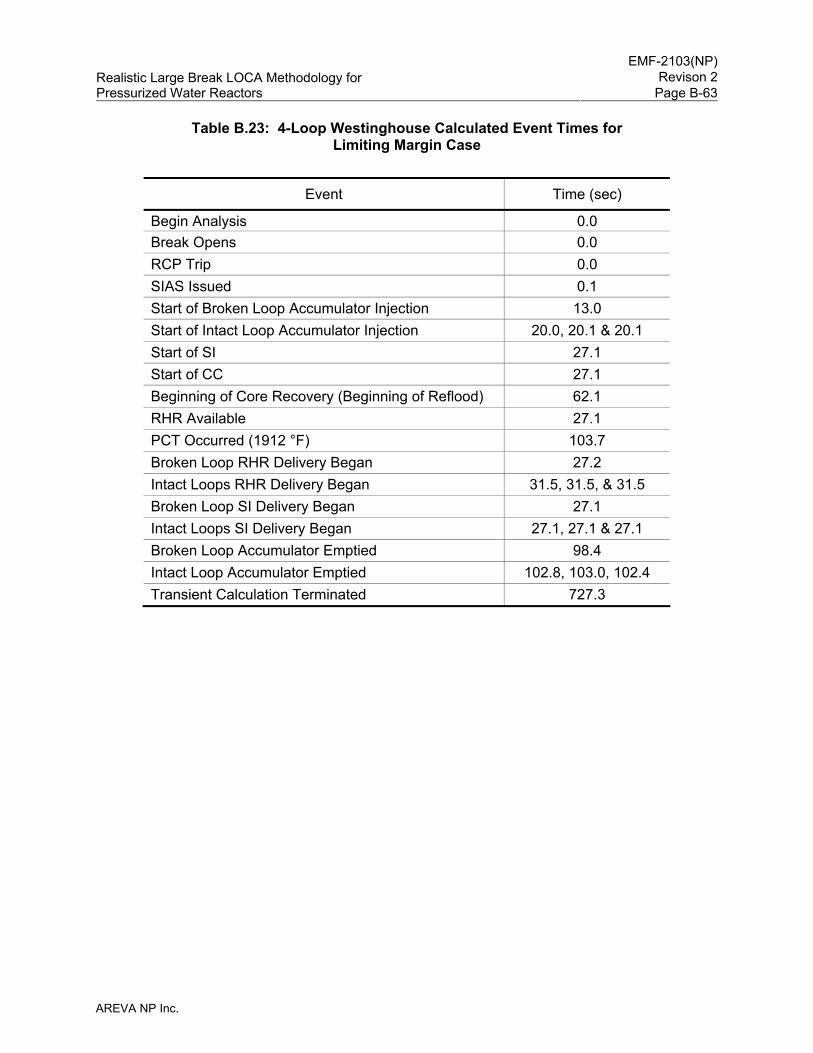
EMF-2103(NP)
Revison 2Realistic Large Break LOCA Methodology for Pressurized Water Reactors Page B-63
AREVA NP Inc.
Table B.23: 4-Loop Westinghouse Calculated Event Times for Limiting Margin Case
Event Time (sec)
Begin Analysis 0.0 Break Opens 0.0 RCP Trip 0.0 SIAS Issued 0.1 Start of Broken Loop Accumulator Injection 13.0 Start of Intact Loop Accumulator Injection 20.0, 20.1 & 20.1 Start of SI 27.1 Start of CC 27.1 Beginning of Core Recovery (Beginning of Reflood) 62.1 RHR Available 27.1 PCT Occurred (1912 °F) 103.7 Broken Loop RHR Delivery Began 27.2 Intact Loops RHR Delivery Began 31.5, 31.5, & 31.5 Broken Loop SI Delivery Began 27.1 Intact Loops SI Delivery Began 27.1, 27.1 & 27.1 Broken Loop Accumulator Emptied 98.4 Intact Loop Accumulator Emptied 102.8, 103.0, 102.4 Transient Calculation Terminated 727.3

EMF-2103(NP)
Revison 2Realistic Large Break LOCA Methodology for Pressurized Water Reactors Page B-64
AREVA NP Inc.
Table B.24: Westinghouse 4-Loop Heat Transfer Parameters for Limiting Margin Case
Time (s) 0 – 1.5 1.5 – 20.02 20.02 – 62.12
62.12 – Quench (575 s)
Quench
Quench – End of
Transient (727.33 s)
LOCA Phase Early Blowdown Blowdown 1 Refill Reflood Quench Long Term
Cooling
Heat Transfer
Mode CHF Film Boiling/
Single-Phase Film Boiling/Single-Phase
Film Boiling/Reflood
Transition Boiling
Transition Boiling
Heat Transfer
Correlations
Biasi Zuber
Modified-Bromley Wong-
Hochreiter Natural
Convection Radiation
(Sun) Rod-to-Rod
radiation
Modified-Bromley Wong-
Hochreiter Natural
Convection Radiation
(Sun) Rod-to-Rod
radiation
Modified-Bromley Wong-
Hochreiter Natural
Convection Radiation
(Sun) Rod-to-Rod
radiation
Modified Chen
Transition boiling
Chen Nucleate boiling
Maximum LHGR (kW/ft)
14.05 {< qchf}
1.33 {< 5.5}
0.70 {< 5.5} 0.54 0.35 0.35
Pressure (psia)
1575 - 2038 {< 2250 at
CHF}
717 - 1575 {< 2250}
23 - 717 {< 2250}
22 - 63 {< 2250 } 28 24 - 28
Core Inlet Mass Flux (kg/s-m2)
300 - 3300 {< 6000}
0 - 1000 {< 4250}
0 - 1000
0 - 900 {< 4250} 200 0 - 800
Vapor Reynolds Number
31700 - 168000
14500 - 146000 {< 106}
900 - 20000{< 106}
1200 - 12000{< 106} 7400 - 8000 3100 - 17000
Liquid Reynolds Number
9000 - 418000 400 - 67000 0 - 1000 0 – 23000 15000 100 - 27000
Vapor Prandtl Number
1.47 – 2.36 0.92 – 1.47 0.88 - 0.92 0.88 – 1.00 0.99 0.99 - 1.01
Liquid Prandtl Number
1.05 – 1.24 0.85 – 1.05 0.85 – 1.51 1.16 – 1.53 1.43 1.43 – 1.49
Superheat (°F) 60 480 1270 1420 90 110
1 End of Blowdown considered as beginning of refill.
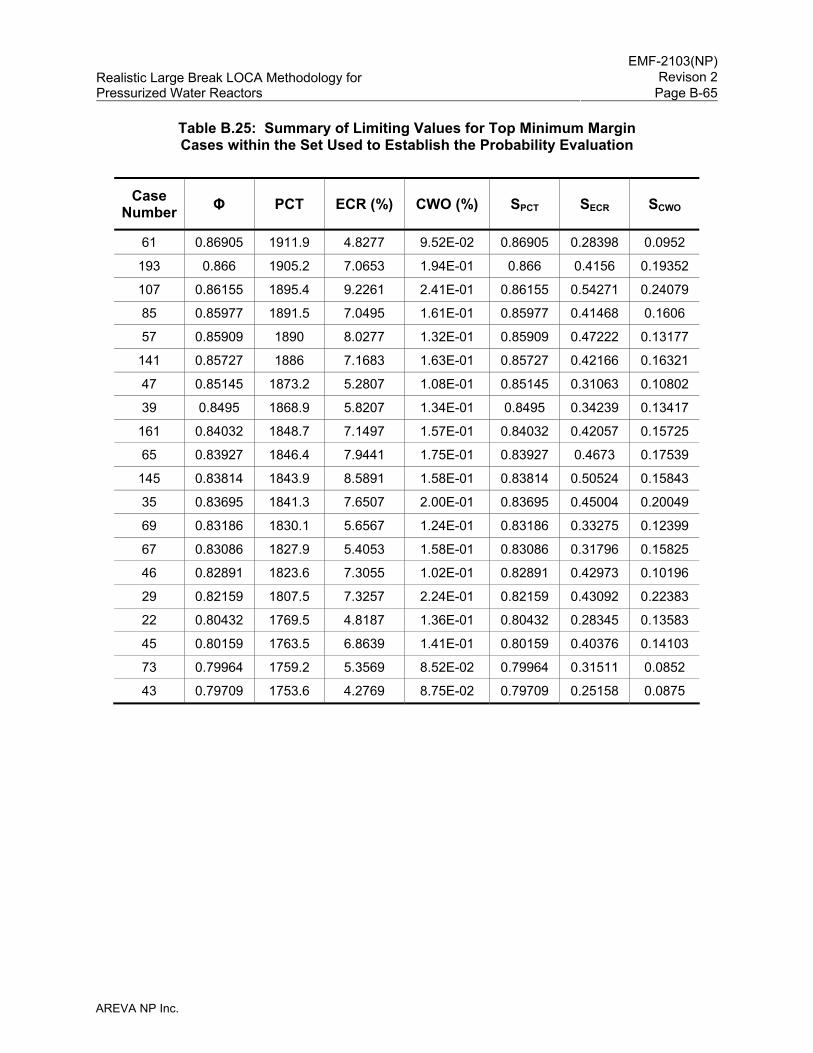
EMF-2103(NP)
Revison 2Realistic Large Break LOCA Methodology for Pressurized Water Reactors Page B-65
AREVA NP Inc.
Table B.25: Summary of Limiting Values for Top Minimum Margin Cases within the Set Used to Establish the Probability Evaluation
Case Number Φ PCT ECR (%) CWO (%) SPCT SECR SCWO
61 0.86905 1911.9 4.8277 9.52E-02 0.86905 0.28398 0.0952
193 0.866 1905.2 7.0653 1.94E-01 0.866 0.4156 0.19352
107 0.86155 1895.4 9.2261 2.41E-01 0.86155 0.54271 0.24079
85 0.85977 1891.5 7.0495 1.61E-01 0.85977 0.41468 0.1606
57 0.85909 1890 8.0277 1.32E-01 0.85909 0.47222 0.13177
141 0.85727 1886 7.1683 1.63E-01 0.85727 0.42166 0.16321
47 0.85145 1873.2 5.2807 1.08E-01 0.85145 0.31063 0.10802
39 0.8495 1868.9 5.8207 1.34E-01 0.8495 0.34239 0.13417
161 0.84032 1848.7 7.1497 1.57E-01 0.84032 0.42057 0.15725
65 0.83927 1846.4 7.9441 1.75E-01 0.83927 0.4673 0.17539
145 0.83814 1843.9 8.5891 1.58E-01 0.83814 0.50524 0.15843
35 0.83695 1841.3 7.6507 2.00E-01 0.83695 0.45004 0.20049
69 0.83186 1830.1 5.6567 1.24E-01 0.83186 0.33275 0.12399
67 0.83086 1827.9 5.4053 1.58E-01 0.83086 0.31796 0.15825
46 0.82891 1823.6 7.3055 1.02E-01 0.82891 0.42973 0.10196
29 0.82159 1807.5 7.3257 2.24E-01 0.82159 0.43092 0.22383
22 0.80432 1769.5 4.8187 1.36E-01 0.80432 0.28345 0.13583
45 0.80159 1763.5 6.8639 1.41E-01 0.80159 0.40376 0.14103
73 0.79964 1759.2 5.3569 8.52E-02 0.79964 0.31511 0.0852
43 0.79709 1753.6 4.2769 8.75E-02 0.79709 0.25158 0.0875
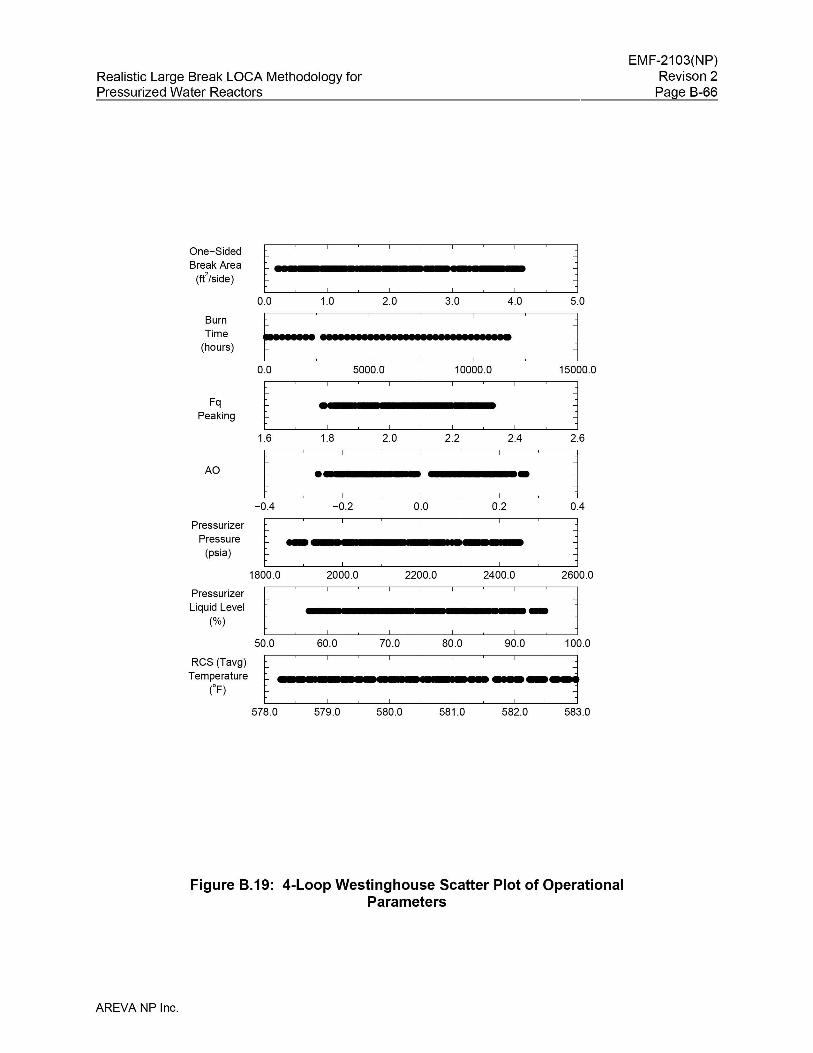
Realistic Large Break LOCA Methodology forPressurized Water Reactors
One-Sided
Break Area(ft
2/side)
EMF-2103(NP)Revison 2
Page B-66
0.0 1.0 2.0 3.0 4.0
BurnTime
(hours)
FqPeaking
AO
PressurizerPressure
(psia)
PressurizerLiquid Level
(%)
Res (Tavg)Temperature
(oF)
!- : : : : .0.0 5000.0 10000.0
578.0 579.0 580.0 581.0 582.0 583.0
Figure 8.19: 4-Loop Westinghouse Scatter Plot of OperationalParameters
AREVA NP Inc.
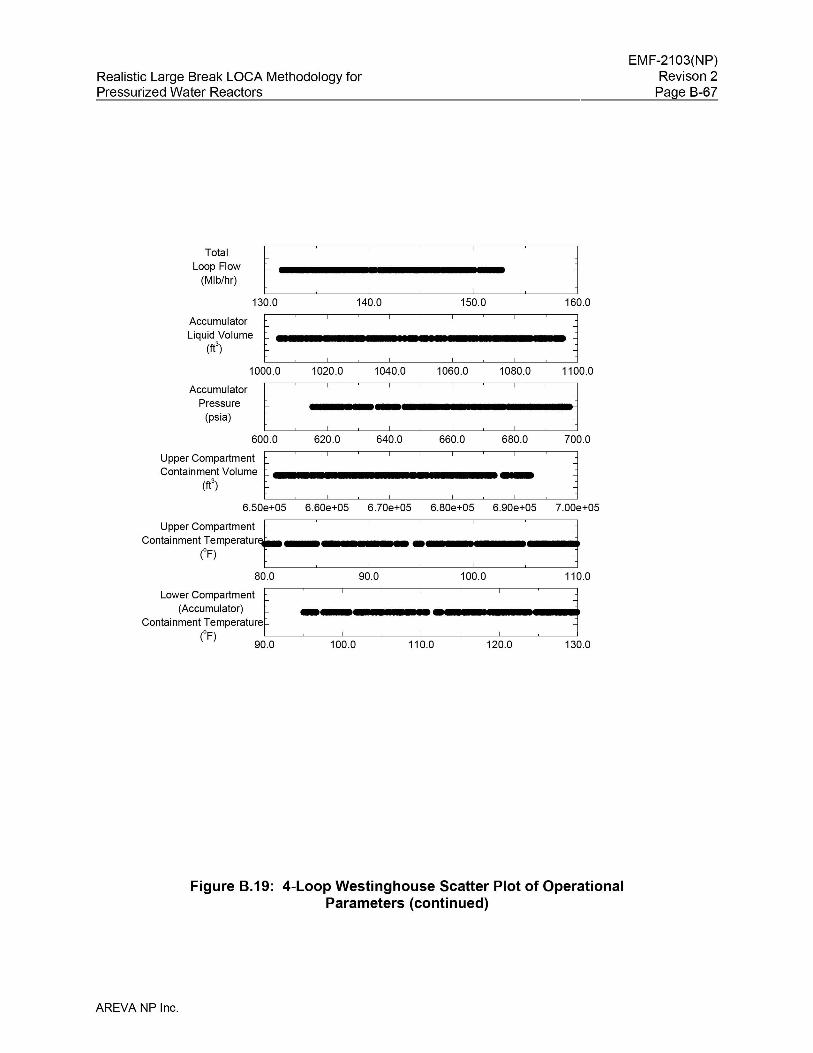
150.0
Realistic Large Break LOCA Methodology forPressurized Water Reactors
TotalLoop Flow
(Mlb/hr)
130.0 140.0
~~~7~;:' t : : ! i!2Z Z222 :
1000.0 1020.0 1040.0 1060.0
AccumulatorPressure
(psia)
600.0
Figure 8.19: 4-Loop Westinghouse Scatter Plot of OperationalParameters (continued)
AREVA NP Inc.
EMF-2103(NP)Revison 2
Page B-67
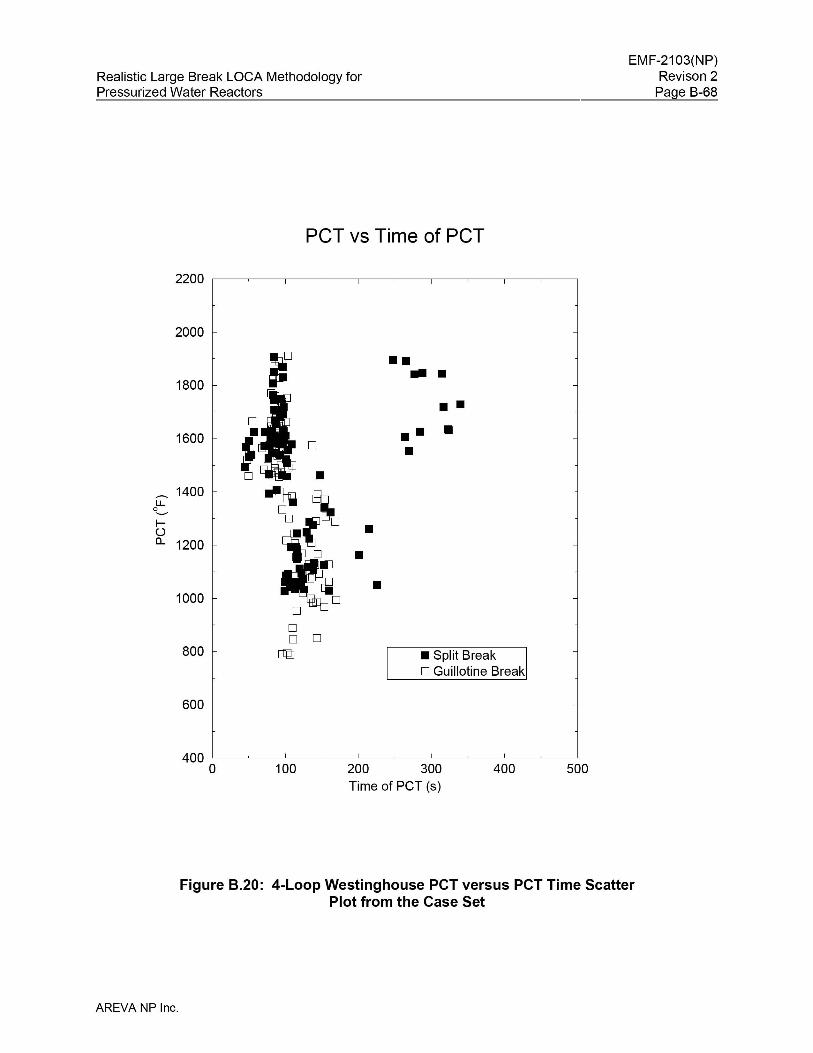
Realistic Large Break LOCA Methodology forPressurized Water Reactors
EMF-2103(NP)Revison 2
Page B-68
PCT vs Time of PCT
2200 ,----~-,----~--,-----~--,------~----,----~---,
2000
Sf ••...1800
••1600 •• •
0 ••
- 1400
~~l.L0......-
~ oro •()a.. 1200
~L•
•1000
00 0
800 []"JJ • Split BreakoGuillotine Break
600
500400200 300Time of PCT (s)
100400 L--_~_-'-----_~_-'-----_~_--'-----_~_---'-----_~_---.J
o
Figure 8.20: 4-Loop Westinghouse PCT versus PCT Time ScatterPlot from the Case Set
AREVA NP Inc.
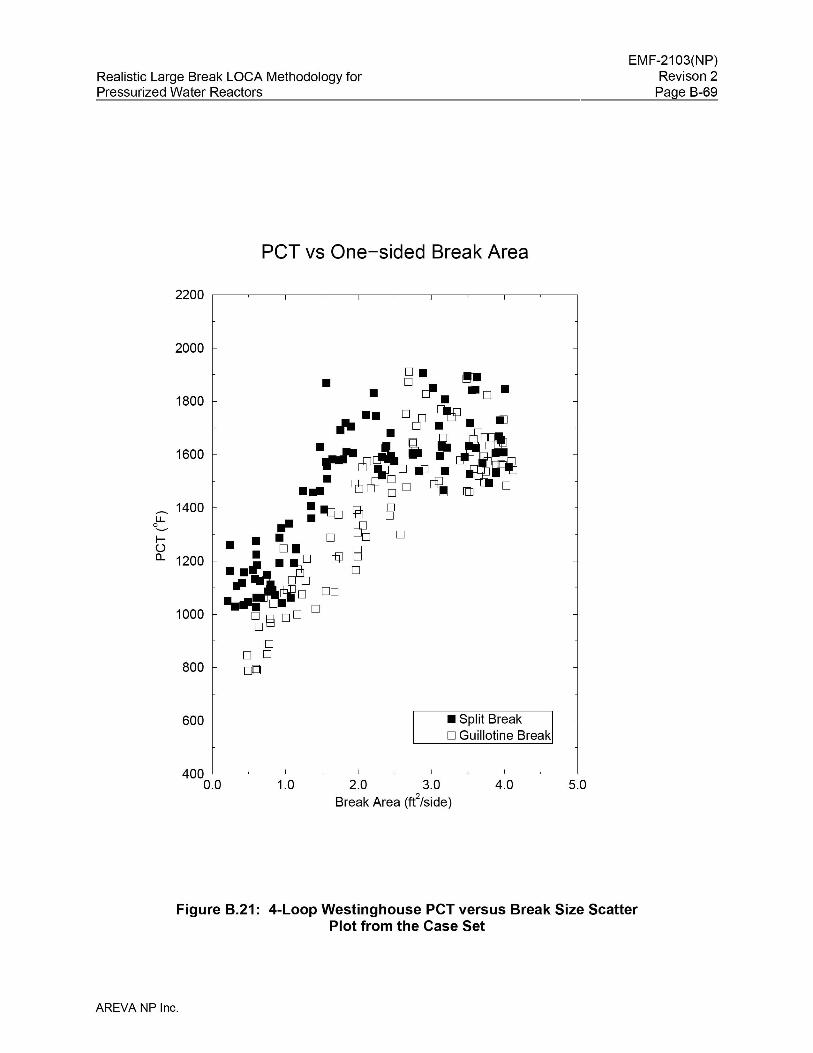
Realistic Large Break LOCA Methodology forPressurized Water Reactors
EMF-2103(NP)Revison 2
Page B-69
peT vs One-sided Break Area
2200 ,----~--,------~--,------~---,-----~----,----~----;
2000
1800
1600
_ 1400u...
0........
~()
a.. 1200
1000
800
• IIttJ lEJ 8.. .• 0 ~ 0· · o.• 0 @ EJ
....~.~ 0
~ ~o 00..... 0 0
~§ 00
oo 0rn
600 • Split Breako Guillotine Break
5.04.02.0 3.0Break Area (fe/side)
1.0400 L-_~_-'-----_~_-'-----_~_--'-----_~_---'-----_~_---.J
0.0
Figure B.21: 4-Loop Westinghouse PCT versus Break Size ScatterPlot from the Case Set
AREVA NP Inc.

Realistic Large Break LOCA Methodology forPressurized Water Reactors
Maximum Oxidation vs peT
EMF-2103(NP)Revison 2
Page B-70
9.0
7.0
co
:;:::;co
"0·x 50o .
3.0
• Split BreakD Guillotine Break
•mu~
••
1.0 L--~--'-----~----'---~-----'-~_L--~---'-----~-----'---~-----l._~-'-----~---.J
400 600 800 1000 1200 1400 1600 1800 2000 2200PCT CF)
Figure 8.22: 4-Loop Westinghouse Maximum Oxidation versus PCTScatter Plot from the Case Set
AREVA NP Inc.
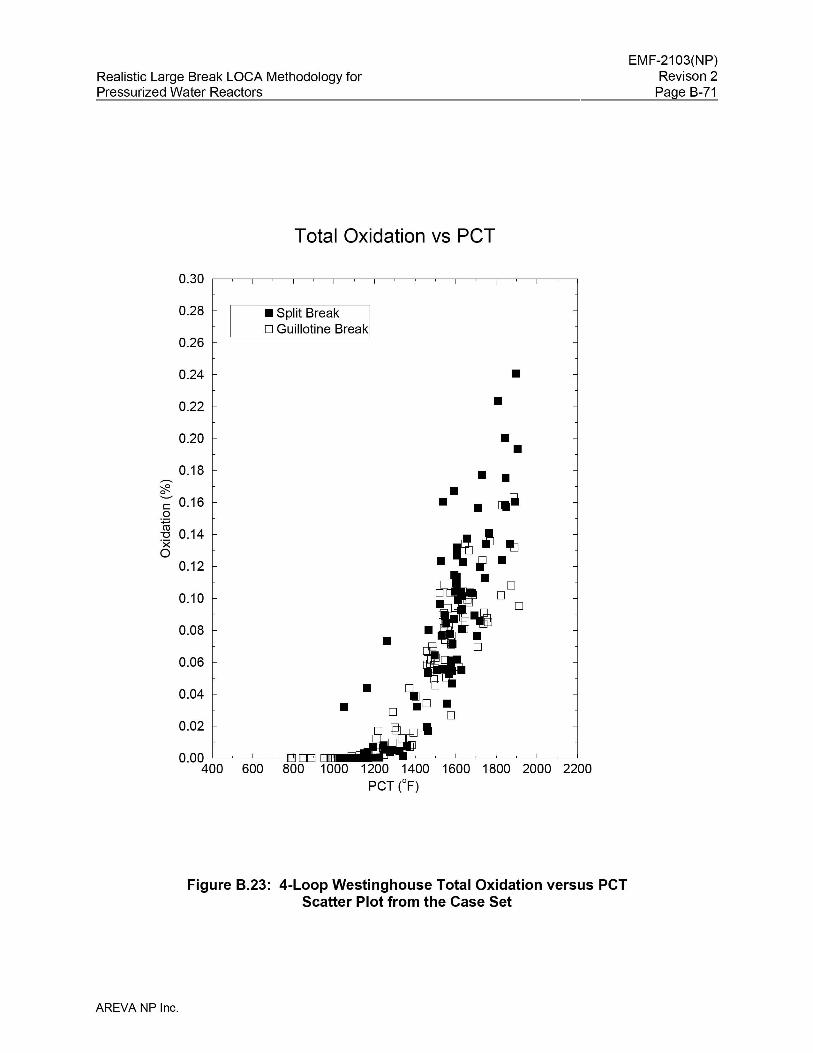
Realistic Large Break LOCA Methodology forPressurized Water Reactors
Total Oxidation vs peT
0.30
0.28 • Split BreakD Guillotine Break
0.26
0.24 •0.22 •0.20 ••0.18 • •~
::f2.. •0
~.~ 0.16 • •0
~0.14 •"'0·x ~ IiJ ~00.12 • ••
~. L0.10 D D
iii D0.08 • •• ./0.06
•0.04 ~D •• D· D0.02 •0.00 ~~=-=--"-----j®B-EjJ~~
400 600 800 1000 1200 1400 1600 1800 2000 2200PCT CF)
Figure 8.23: 4-Loop Westinghouse Total Oxidation versus PCTScatter Plot from the Case Set
AREVA NP Inc.
EMF-2103(NP)Revison 2
Page B-71
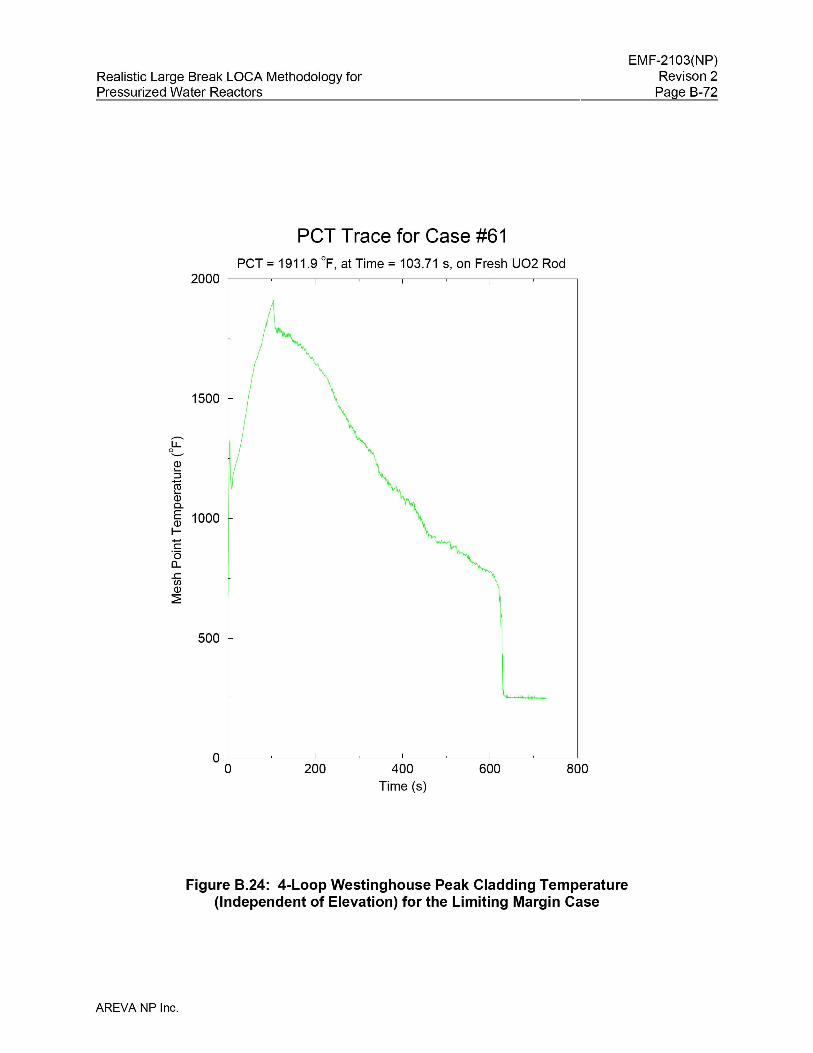
Realistic Large Break LOCA Methodology forPressurized Water Reactors
EMF-2103(NP)Revison 2
Page B-72
PCT Trace for Case #61PCT = 1911.9 of, at Time = 103.71 s, on Fresh U02 Rod
2000 ,----~-----,--~-----,---~------,---~----,
800600400Time (s)
200OL---~------'--~------'----~------'----~----.J
o
1500
-l.L0_
0).....::::l
m.....0)0..E 10000)
l-e"0a....cUl0)
~
500
Figure 8.24: 4-Loop Westinghouse Peak Cladding Temperature(Independent of Elevation) for the Limiting Margin Case
AREVA NP Inc.
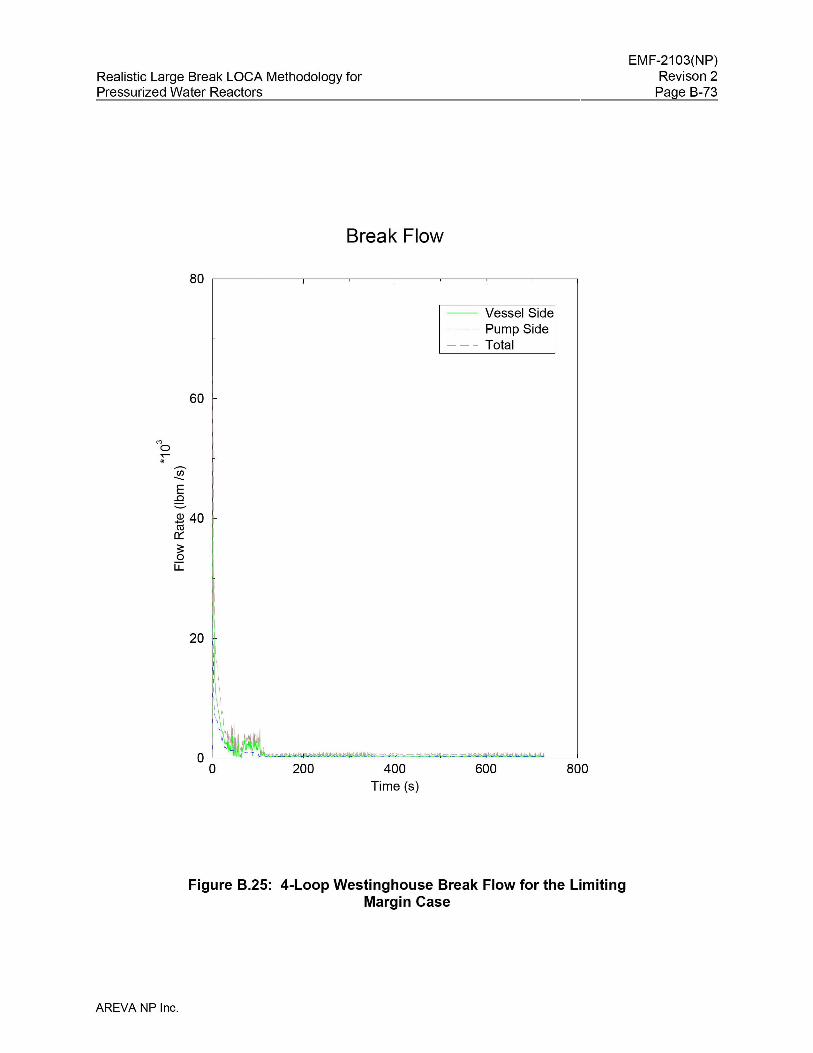
Realistic Large Break LOCA Methodology forPressurized Water Reactors
Break Flow
80 ,----~---,------~-------,----~------,--~-----,
-- Vessel Side- - - - Pump Side--- Total
60
E.0
240ro
0::3:o
u::
20
EMF-2103(NP)Revison 2
Page B-73
200 400Time (s)
600 800
Figure B.25: 4-Loop Westinghouse Break Flow for the LimitingMargin Case
AREVA NP Inc.
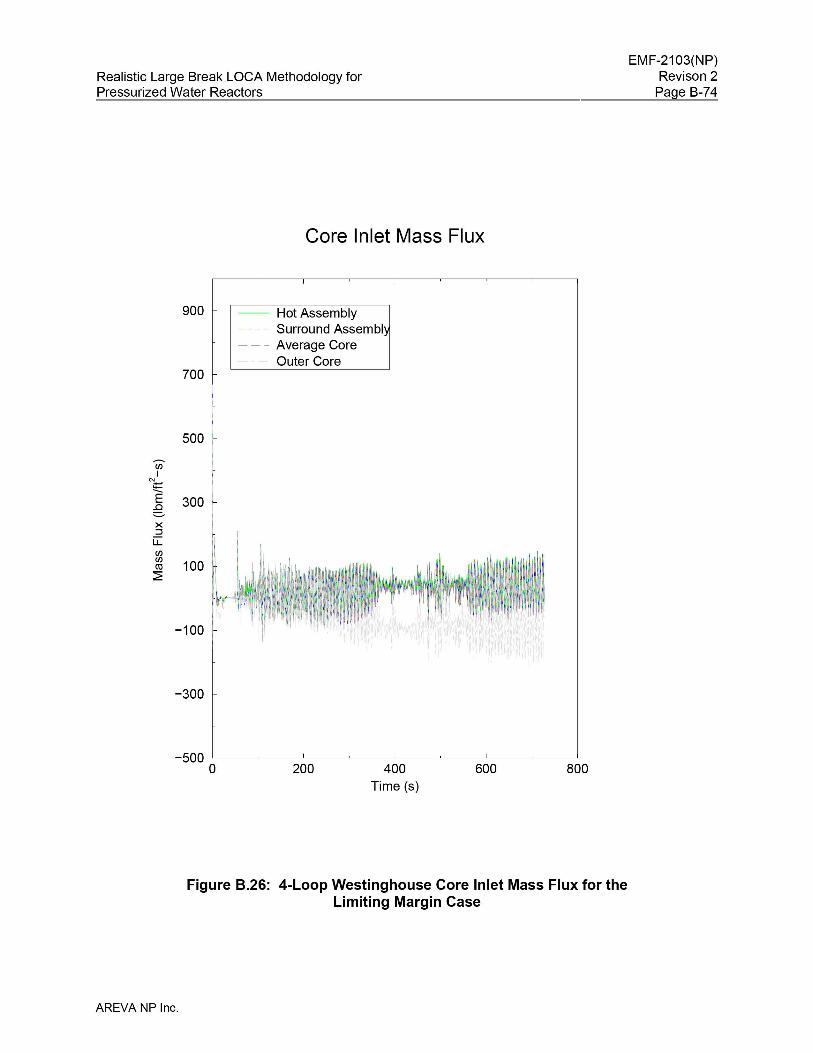
Realistic Large Break LOCA Methodology forPressurized Water Reactors
EMF-2103(NP)Revison 2
Page B-74
Core Inlet Mass Flux
900 -- Hot Assembly- - - - Surround Assembly- - - Average Core
Outer Core700
500
UlI
N;t=-..
300 ~E..Cl:::::;..
X::::l
u::::UlUl
100co~
-100
-300
800600400Time (s)
200-500 L--_~__-'-----_~__--'-----_~__---'-----_~__---.J
o
Figure 8.26: 4-Loop Westinghouse Core Inlet Mass Flux for theLimiting Margin Case
AREVA NP Inc.
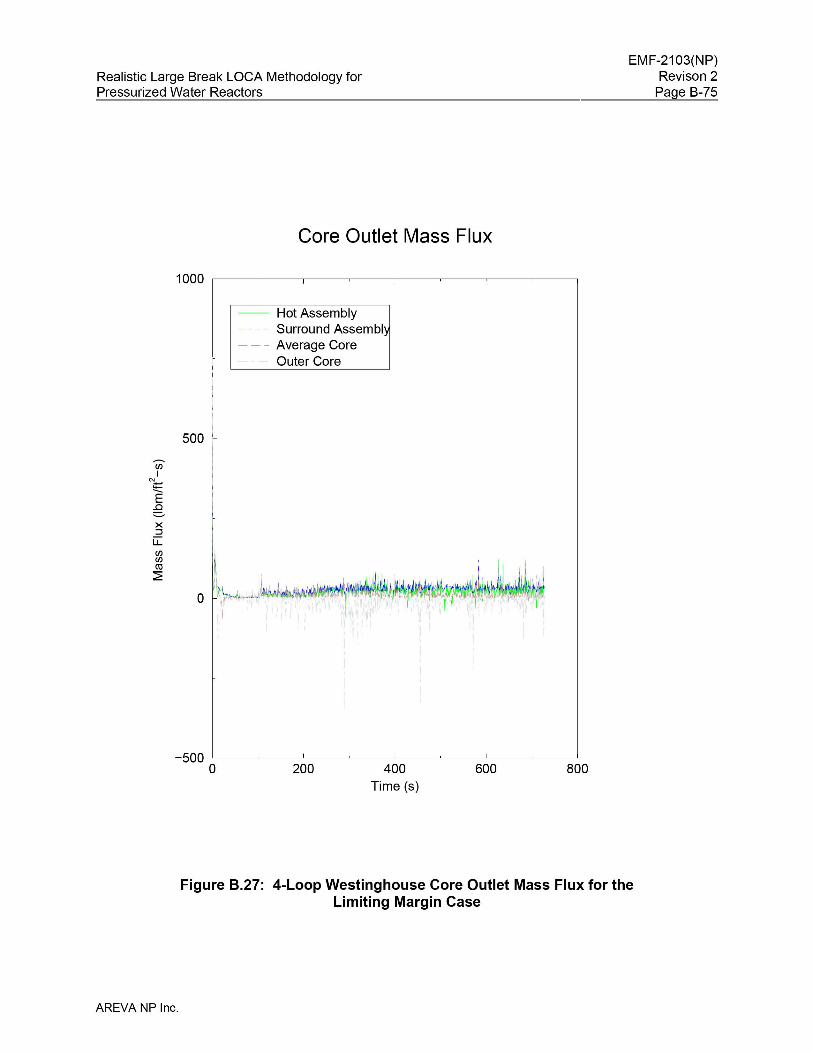
Realistic Large Break LOCA Methodology forPressurized Water Reactors
EMF-2103(NP)Revison 2
Page B-75
Core Outlet Mass Flux
1000 ,----~---,----~---,------~--___r_-~--___,
-- Hot Assembly- - - - Surround Assembly- - - Average Core
Outer Core
IIII
500 '--
UlI
N~
E..Cl:::::;..
X::::l
u::::UlUlco~
o
800600400Time (s)
200-500 L--_~__-'-----_~__--'-----_~__---'-----_~__---.J
o
Figure 8.27: 4-Loop Westinghouse Core Outlet Mass Flux for theLimiting Margin Case
AREVA NP Inc.
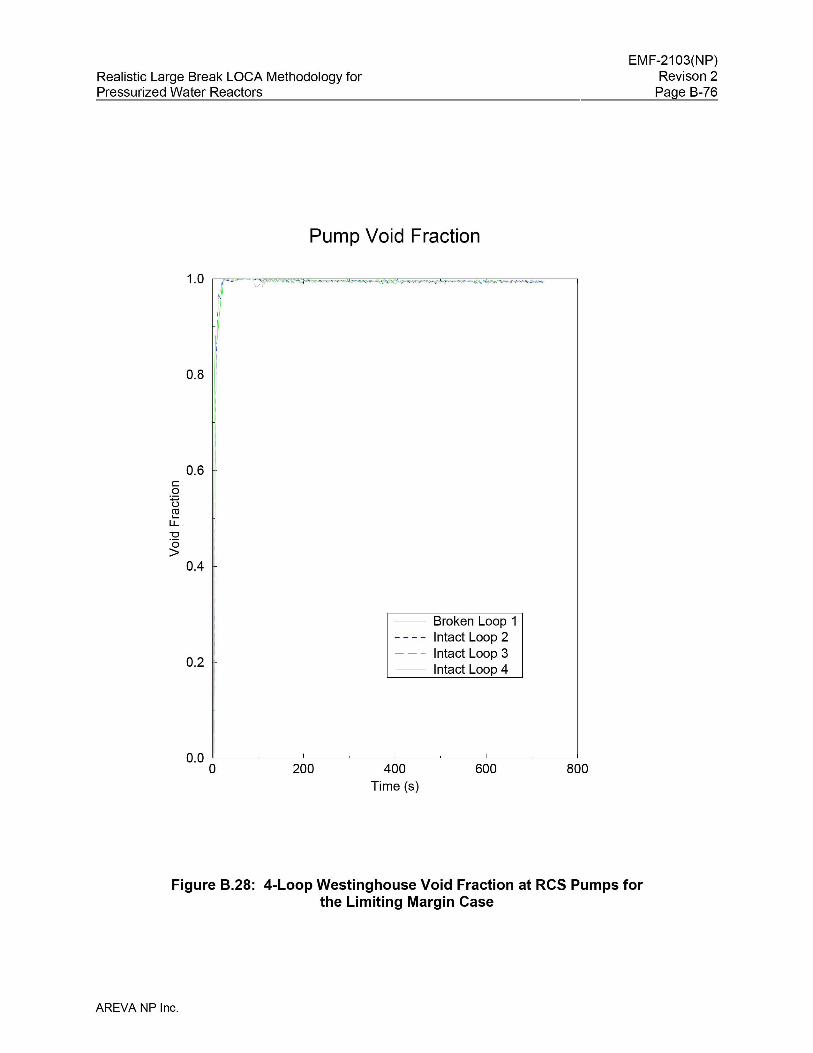
Realistic Large Break LOCA Methodology forPressurized Water Reactors
EMF-2103(NP)Revison 2
Page B-76
Pump Void Fraction
0.8
0.6con~
LL"0·0>
0.4
0.2
-- Broken Loop 1- - - - Intact Loop 2- - - Intact Loop 3
Intact Loop 4
800600400Time (s)
2000.0 "-----_~__-'-----_~__--'-----_~_____'______~_____.J
o
Figure 8.28: 4-Loop Westinghouse Void Fraction at RCS Pumps forthe Limiting Margin Case
AREVA NP Inc.
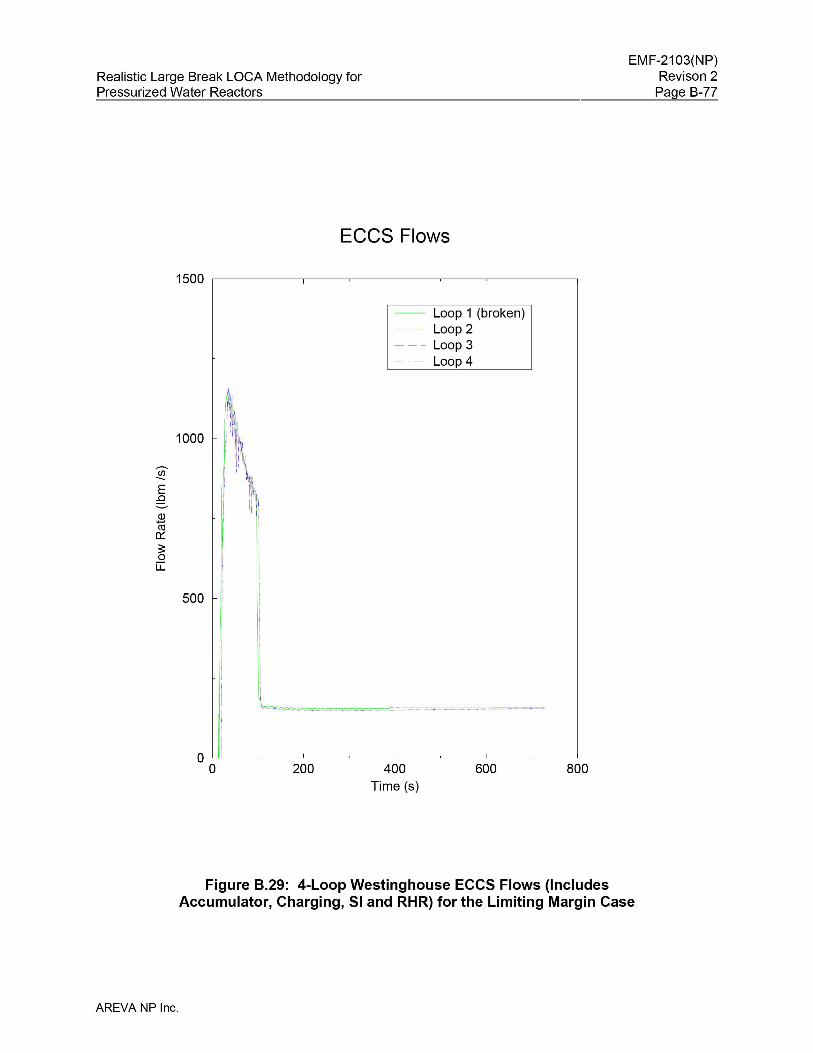
Realistic Large Break LOCA Methodology forPressurized Water Reactors
EMF-2103(NP)Revison 2
Page B-77
ECCS Flows
1500 ,----~-______,--~-----,--~-_____r--~-_____,
-- Loop 1 (broken)- - - - Loop 2--- Loop 3
Loop 4
E.0
Q)-Cil0::3:o
u::
1000
500
J'
I!i~I l~~
II! \, ~
rIIIIIIIIIIIII
800600400Time (s)
200o L.'__~_-----'__~_-----.L__~_-----'--__~_-----'
o
Figure 8.29: 4-Loop Westinghouse ECCS Flows (IncludesAccumulator, Charging, 51 and RHR) for the Limiting Margin Case
AREVA NP Inc.
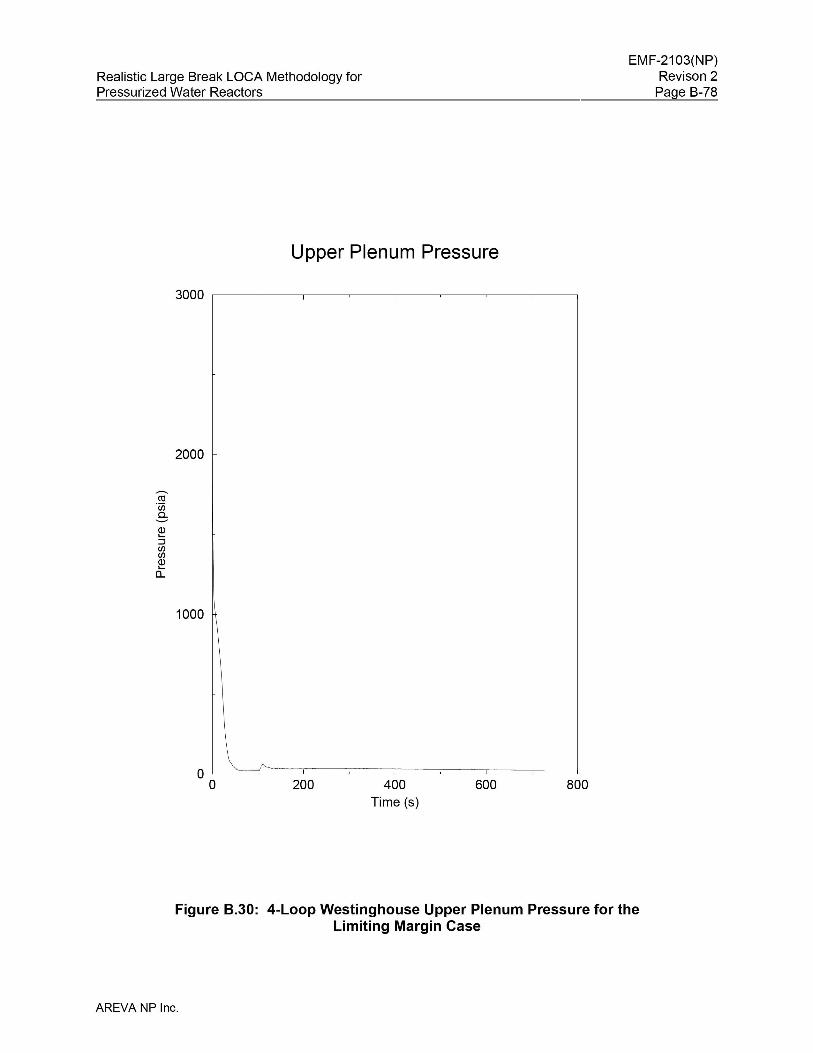
Realistic Large Break LOCA Methodology forPressurized Water Reactors
Upper Plenum Pressure
3000 ,----~---,----~---,------~-----.----~-----,
2000
Cil·UiD..
----Q)'-:::JenenQ)'-a..
1000
EMF-2103(NP)Revison 2
Page B-78
200 400Time (s)
600 800
Figure 8.30: 4-Loop Westinghouse Upper Plenum Pressure for theLimiting Margin Case
AREVA NP Inc.
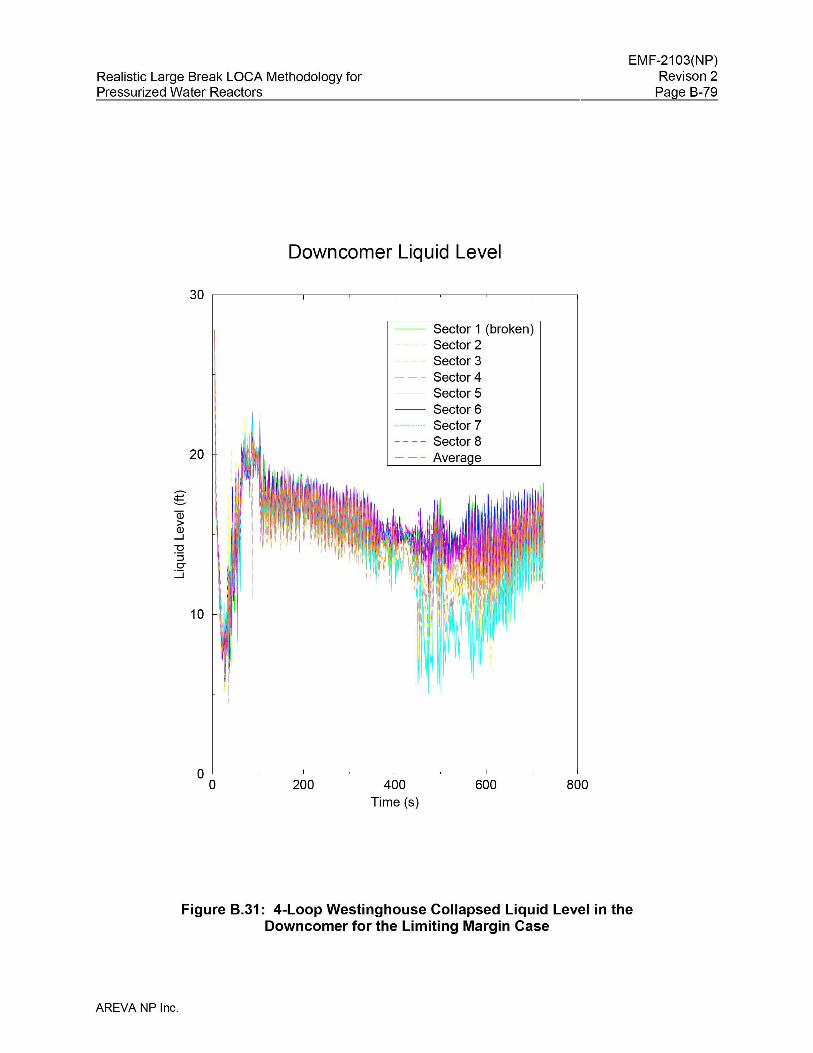
Realistic Large Break LOCA Methodology forPressurized Water Reactors
EMF-2103(NP)Revison 2
Page B-79
Downcomer Liquid Level
30 ,------~----,----~------,---~------.--~-------,
20
-~Q3>Q)
....J
~:::JCJ
:.::::i
10
-- Sector 1 (broken)Sector 2Sector 3
- - - Sector 4Sector 5
-- Sector 6------------ Sector 7- - - - Sector 8- - - Average
800600400Time (s)
200O'------~-----'-------~-------'-----~-------'---~------.J
o
Figure 8.31: 4-Loop Westinghouse Collapsed Liquid Level in theDowncomer for the Limiting Margin Case
AREVA NP Inc.
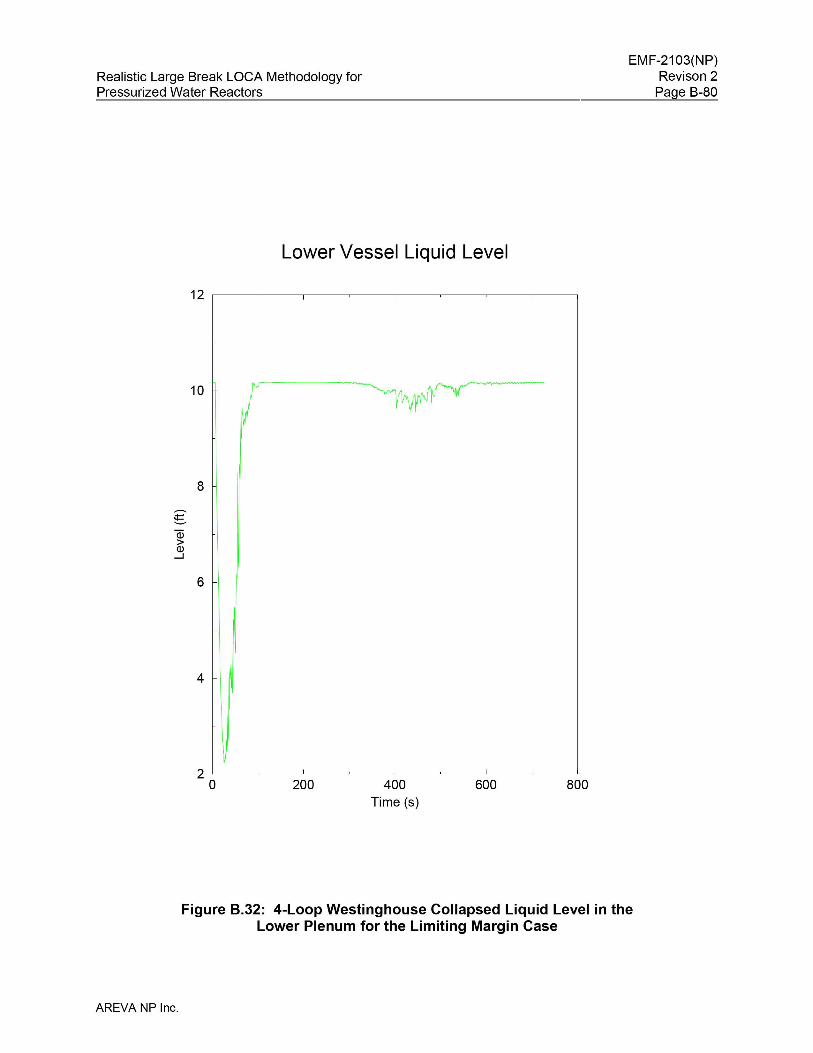
Realistic Large Break LOCA Methodology forPressurized Water Reactors
EMF-2103(NP)Revison 2
Page B-80
Lower Vessel Liquid Level
12 ,----~---,----~---,------~-----.----~-----,
10
8
Q)
>Q)
....J
6
4
800600400Time (s)
2002 L-_~__l.--_~__--'-----_~__---'-----_~__---.J
o
Figure 8.32: 4-Loop Westinghouse Collapsed Liquid Level in theLower Plenum for the Limiting Margin Case
AREVA NP Inc.
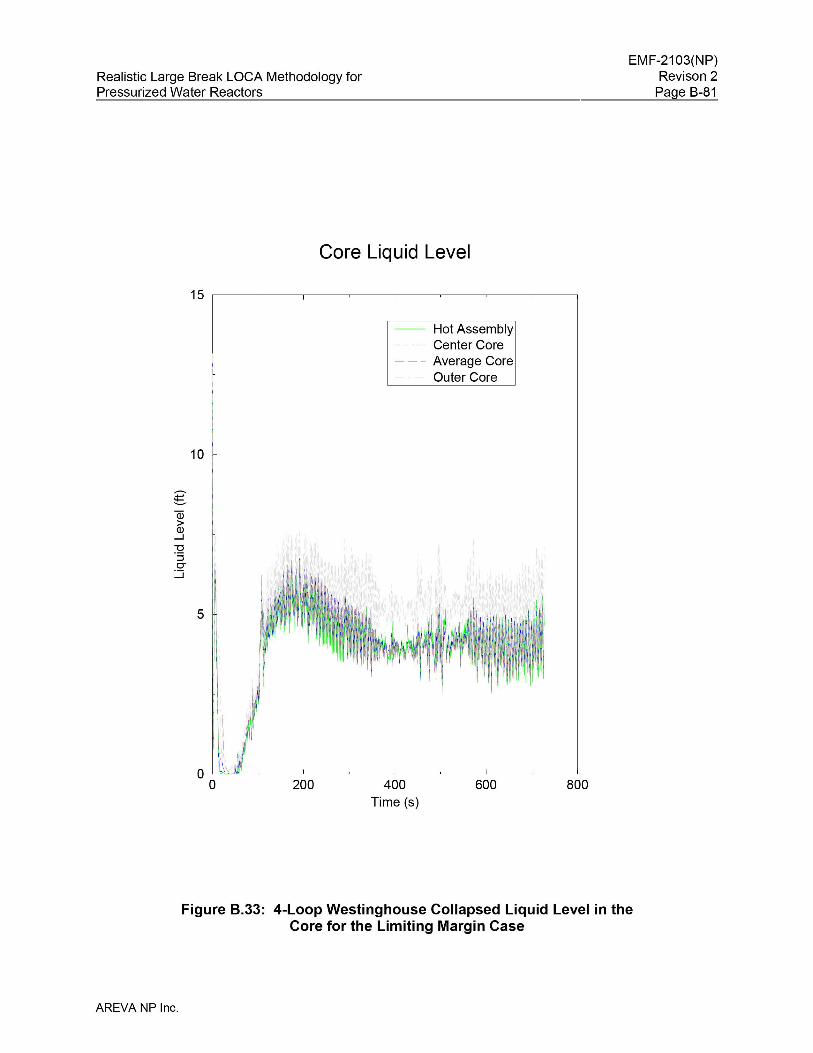
Realistic Large Break LOCA Methodology forPressurized Water Reactors
EMF-2103(NP)Revison 2
Page B-81
Core Liquid Level
15 ,------~----,----~------,---~------.--~-------,
-- Hot Assembly- - - - Center Core- - - Average Core
Outer Core
800600400Time (s)
200O'--"'-'-""'--~----'------~-------'-----~-----'---~-----.J
o
10
-~Q3>Q)
....J
~:::JCJ
:.::::i
5
Figure 8.33: 4-Loop Westinghouse Collapsed Liquid Level in theCore for the Limiting Margin Case
AREVA NP Inc.
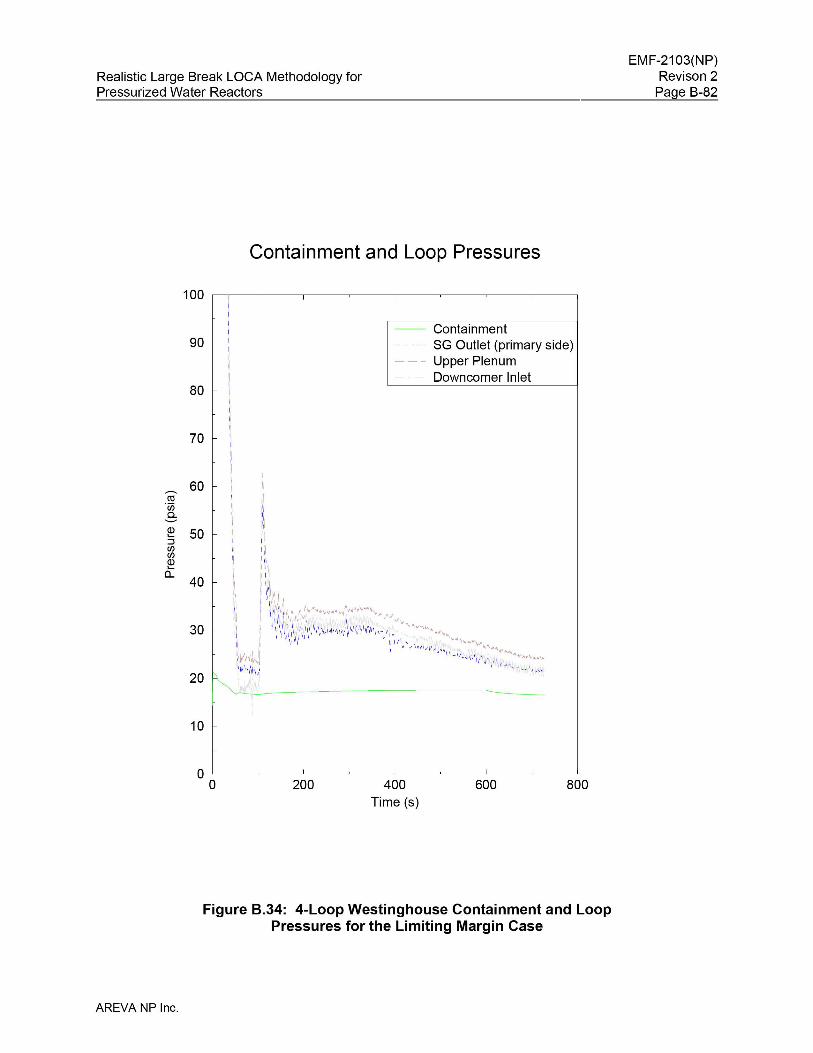
Realistic Large Break LOCA Methodology forPressurized Water Reactors
Containment and Loop Pressures
100II -- Containment
90 - - -- SG Outlet (primary side)
I --- Upper Plenum
~ Downcomer Inlet80 I
l,
EMF-2103(NP)Revison 2
Page B-82
70
60co·en0..
Q) 50......::JrnrnQ)......
0..40
30
20
10
oo 200 400Time (s)
600 800
Figure 8.34: 4-Loop Westinghouse Containment and LoopPressures for the Limiting Margin Case
AREVA NP Inc.
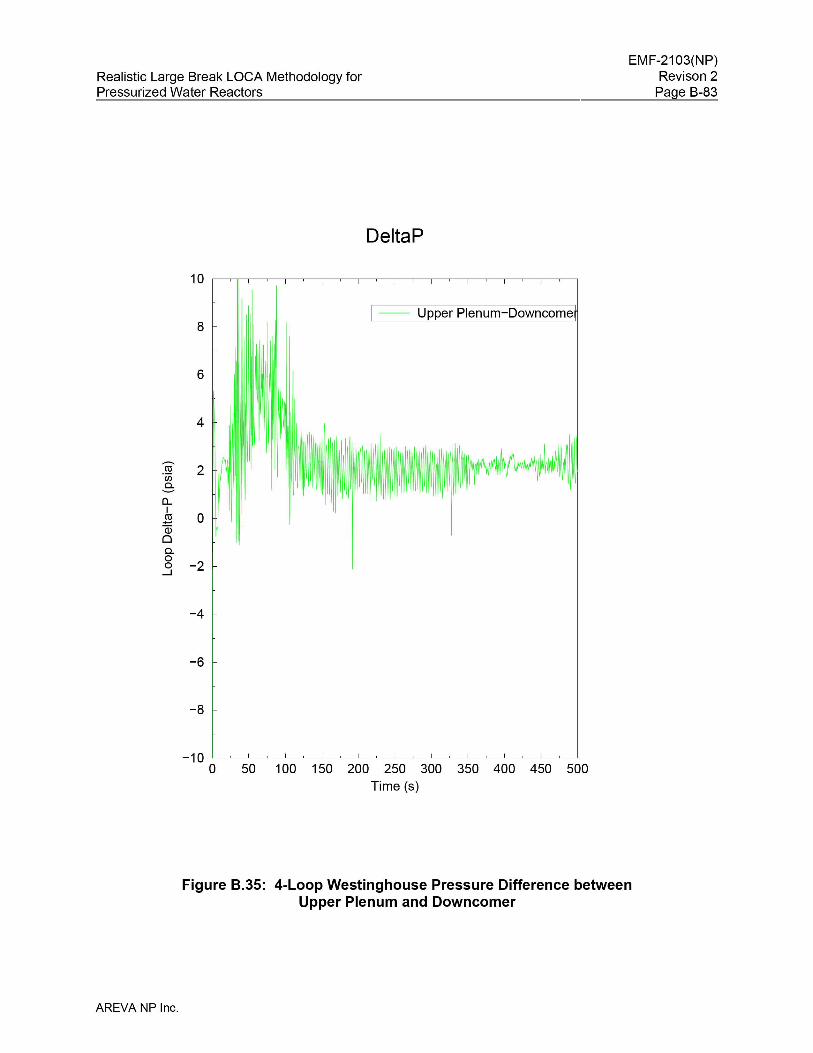
Realistic Large Break LOCA Methodology forPressurized Water Reactors
DeltaP
-- Upper Plenum-Downcome8
6
ro 2·000--0...I
2 0Qj00-0
-20...J
-4
-6
-8
-1 0 '-----~_'_____~--'-----~___'_____~---'----~-----'---~-----'--~-----'-~_____l_~L___'______..J
o 50 100 150 200 250 300 350 400 450 500Time (s)
EMF-2103(NP)Revison 2
Page B-83
Figure 8.35: 4-Loop Westinghouse Pressure Difference betweenUpper Plenum and Downcomer
AREVA NP Inc.
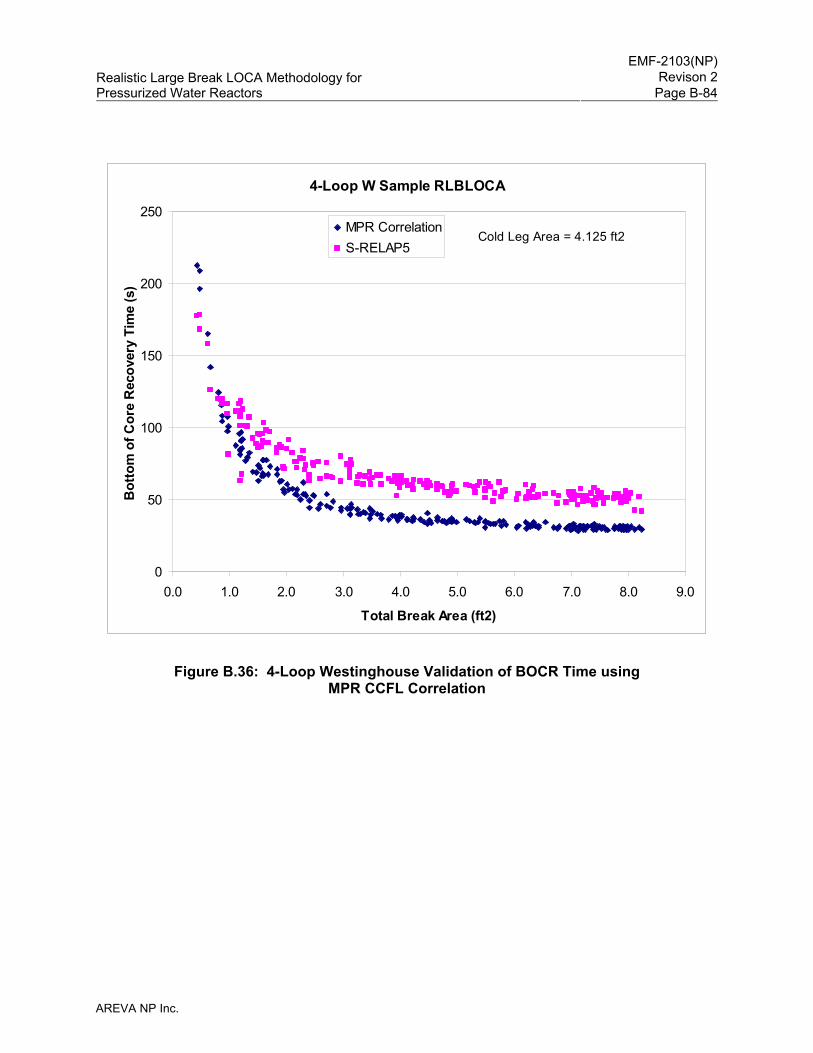
EMF-2103(NP)
Revison 2Realistic Large Break LOCA Methodology for Pressurized Water Reactors Page B-84
AREVA NP Inc.
4-Loop W Sample RLBLOCA
0
50
100
150
200
250
0.0 1.0 2.0 3.0 4.0 5.0 6.0 7.0 8.0 9.0
Total Break Area (ft2)
Bot
tom
of C
ore
Rec
over
y Ti
me
(s)
MPR CorrelationS-RELAP5
Cold Leg Area = 4.125 ft2
Figure B.36: 4-Loop Westinghouse Validation of BOCR Time using MPR CCFL Correlation
EMF-2103(NP)
Revison 2Realistic Large Break LOCA Methodology for Pressurized Water Reactors Page B-85
AREVA NP Inc.
B.4 CE 2x4 PWR
B.4.1 Summary
The parameter specification for this analysis is provided in Table B.26. The analysis assumes
full-power operation at 3300 MWt (plus 0.3 percent uncertainty), a steam generator tube
plugging level of up to 10 percent in either generator, a total peaking factor (Fq) of 2.175
including uncertainties, and a nuclear enthalpy rise factor (FΔH) of 1.81 (including 6 percent
measurement uncertainty and a 3.5 percent control rod insertion effect). The analysis supports
operation with AREVA 14x14 HTP design fuel using standard UO2 fuel with 2, 4, 6, and 8 weight
percent Gd2O3 for fresh and 4, 6, and 8 weight percent Gd2O3 once burned assemblies. This
analysis also addresses typical operational ranges or technical specification limits (which ever is
applicable) with regard to pressurizer pressure and level; SIT pressure, temperature
(containment temperature), and level; core inlet temperature; core flow; containment pressure
and temperature; and refueling water storage tank temperature. The analysis explicitly
analyzes fresh and once burned fuel assemblies. The two GDC 35 cases were run1 and Loss of
Offisite Power produced the limiting PCT, therefore the 208 case set will be run in this
configuration.
For the sample analysis with M5® cladding, the evaluation resulted in meeting the 10 CFR 50.46
criteria with a minimum margin of 21.1 percent with 95 percent coverage and 95 percent
confidence. The parameter which set this margin was the PCT of 1735 °F and occurred in a
once-burned fuel rod with 27.6 GWd/mtU burnup.
For the sample analysis with Zirc-4 cladding, the evaluation resulted in meeting the
10 CFR 50.46 criteria with a minimum margin of 18.6 percent with 95 percent coverage and
95 percent confidence. The parameter which set this margin was the PCT of 1791 °F and
occurred in a fresh fuel rod with 22.6 GWd/mtU burnup.
B.4.2 Plant Description and Summary of Analysis Parameters
The plant analysis presented in this report is for a CE-designed PWR, which has 2X4-loop
arrangement. There are two hot legs each with a U-tube steam generator and four cold legs
1 This sample problem exceeded the recommendations provided in Section B.1.3 and was analyzed with a decay
heat multiplier of 1.04.
EMF-2103(NP)
Revison 2Realistic Large Break LOCA Methodology for Pressurized Water Reactors Page B-86
AREVA NP Inc.
each with a RCP. The RCS includes one Pressurizer connected to a hot leg. The core contains
217 thermal-hydraulic compatible AREVA HTP 14X14 fuel assemblies with 2, 4, 6 and 8 weight
percent gadolinia pins. The ECCS includes one high pressure safety injection (HPSI), one LPSI
and one SIT injection path per RCS loop. The break is modeled in the same loop as the
pressurizer, as directed by the RLBLOCA methodology. The RLBLOCA transients are of
sufficiently short duration that the switchover to sump cooling water (i.e., RAS) for ECCS
pumped injection need not be considered.
The S-RELAP5 model explicitly describes the RCS, reactor vessel, Pressurizer, and ECCS. The
ECCS includes a SIT path and a LPSI/HPSI path per RCS loop. The HPSI and LPSI feed into a
common header that connects to each cold leg pipe downstream of the RCP discharge. The
ECCS pumped injection is modeled as a table of flow versus backpressure. This model also
describes the secondary-side steam generator that is instantaneously isolated (closed MSIV
and feedwater trip) at the time of the break.
As described in the RLBLOCA methodology, many parameters associated with LBLOCA
phenomenological uncertainties and plant operation ranges are sampled. A summary of those
parameters sampled is given in Table B.1. Values for process or operational parameters,
including ranges of sampled process parameters, and fuel design parameters used in the
analysis are given in Table B.27. Plant data are analyzed to develop uncertainties for the
process parameters sampled in the analyses. Table B.30 presents a summary of the
uncertainties used in the analyses. Two parameters (RWST temperature and diesel start time)
are set at conservative bounding values for all calculations.
Where applicable, the sampled parameter ranges are based on technical specification limits.
Plant data are used to define range boundaries for loop flow (high end) and containment
temperature (low end).
B.4.3 Realistic Large Break LOCA Results
The sample analysis with M5® cladding, a set of two-hundred eight calculations, was performed
sampling the parameters listed in Table B.1. The minimum retained margin to criteria was
21.1 percent at 95 percent coverage with 95 percent confidence and was associated with case
number 200 which resulted in a PCT of 1735 °F. For the set of cases (LOCA events) that lie
EMF-2103(NP)
Revison 2Realistic Large Break LOCA Methodology for Pressurized Water Reactors Page B-87
AREVA NP Inc.
within the 95/95 range, the maximum local oxidation was 4.7281 percent (Case 161) and the
maximum core-wide oxidation 0.0998 percent (Case 172).
The sample analysis with Zirc-4 cladding, a set of two-hundred eight calculations, was
performed sampling the parameters listed in Table B.1. The minimum retained margin to
criteria was 18.6 percent at 95 percent coverage with 95 percent confidence and was
associated with case number 145 which resulted in a PCT of 1791 °F. For the set of cases
(LOCA events) that lie within the 95/95 range, the maximum local oxidation was 6.7168 percent
(Case 161) and the maximum core-wide oxidation was 0.1122 percent (Case 162).
Table B.26 is a summary of the major parameters for the minimum margin case. Table B.27 is
the plant input parameters and operating range supported by the analysis. Table B.28 provides
the containment initial and boundary conditions. Table B.29 describes the passive heat sinks
for the containment input. Table B.30 provides the statistical distribution for the process
parameters. The minimum margin cases are characterized in Table B.31 through Table B.33,
for the COPERNIC2 and RODEX3A runs. The heat transfer parameter range for the limiting
margin case is provided in Table B.34 (COPERNIC2) and Table B.35 (RODEX3A). Table B.36
and Table B.37 provides the twenty minimum margin cases used to establish the probability
evaluation.
The analysis plots for the minimum margin case are shown in Figure B.42 through Figure B.53,
and Figure B.60 through Figure B.71. Figure B.37 and Figure B.55 shows linear scatter plots of
the key parameters sampled for each set of 208 calculations. Parameter labels appear to the
left of each individual plot. These figures illustrate the parameter ranges used in the analysis.
Figure B.38 and Figure B.39 (COPERNIC2) and Figure B.56, and Figure B.57 (RODEX3A)
show PCT scatter plots versus the time of PCT and versus break size from the set of cases
(LOCA events) that lie within the 95/95 range. The scatter plots for the maximum oxidation and
total oxidation are shown in Figure B.40 and Figure B.41 (COPERNIC2), and Figure B.58 and
Figure B.59 (RODEX3A), respectively. Figure B.42 through Figure B.52 (COPERNIC2) and
Figure B.60 through Figure B.70 (RODEX3A) show key parameters from the S-RELAP5
calculations for the minimum margin case. Figure B.42 (COPERNIC2) and Figure B.60
(RODEX3A) are plots of PCT, independent of elevation. Figure B.54 (COPERNIC2) and
Figure B.72 (RODEX3A) compare the bottom of core recovery times for the set of cases that lie
within the 95/95 range to the BOCR time predicted using the MPR CCFL correlation.
EMF-2103(NP)
Revison 2Realistic Large Break LOCA Methodology for Pressurized Water Reactors Page B-88
AREVA NP Inc.
B.4.4 Conclusions
For the sample analysis with M5® cladding, the results of this RLBLOCA analysis show
21.1 percent minimum margin to any of the first three 10 CFR 50.46 criterion at 95 percent
coverage with 95 percent confidence. For the sample analysis with Zirc-4 cladding, there is a
18.6 percent minimum margin to any of the first three 10 CFR 50.46 criterion at 95 percent
coverage with 95 percent confidence.
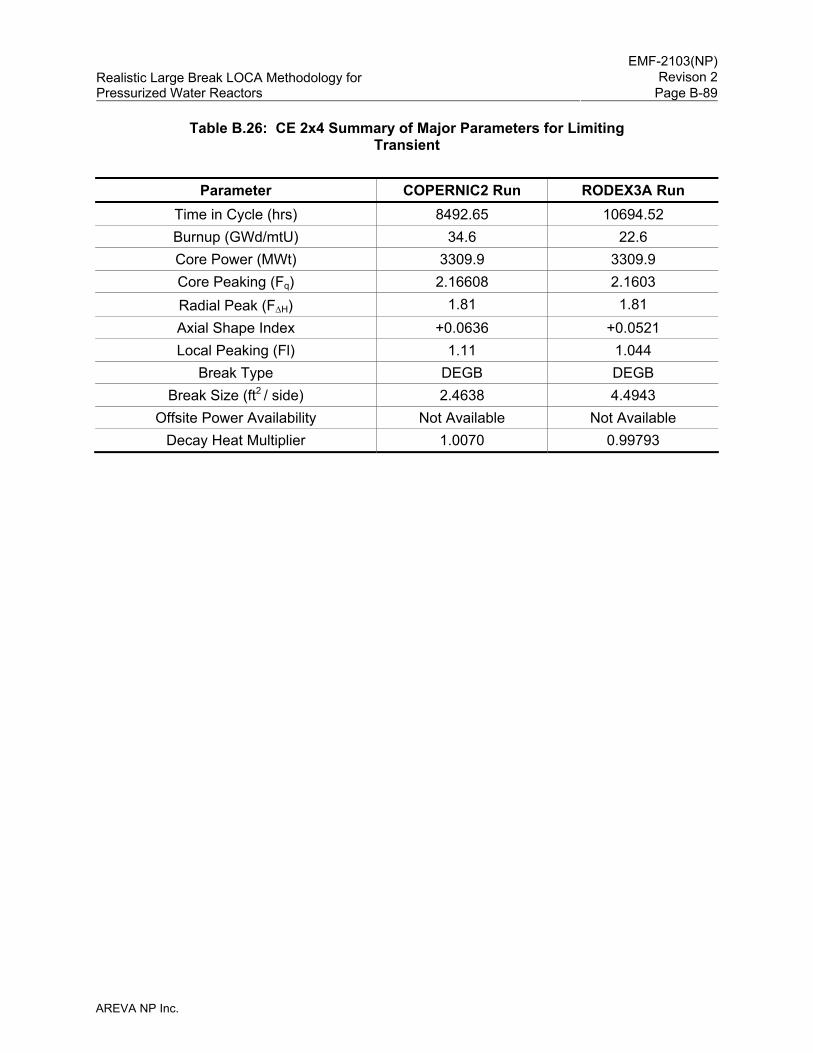
EMF-2103(NP)
Revison 2Realistic Large Break LOCA Methodology for Pressurized Water Reactors Page B-89
AREVA NP Inc.
Table B.26: CE 2x4 Summary of Major Parameters for Limiting Transient
Parameter COPERNIC2 Run RODEX3A Run
Time in Cycle (hrs) 8492.65 10694.52 Burnup (GWd/mtU) 34.6 22.6 Core Power (MWt) 3309.9 3309.9 Core Peaking (Fq) 2.16608 2.1603 Radial Peak (FΔH) 1.81 1.81 Axial Shape Index +0.0636 +0.0521 Local Peaking (Fl) 1.11 1.044
Break Type DEGB DEGB Break Size (ft2 / side) 2.4638 4.4943
Offsite Power Availability Not Available Not Available Decay Heat Multiplier 1.0070 0.99793
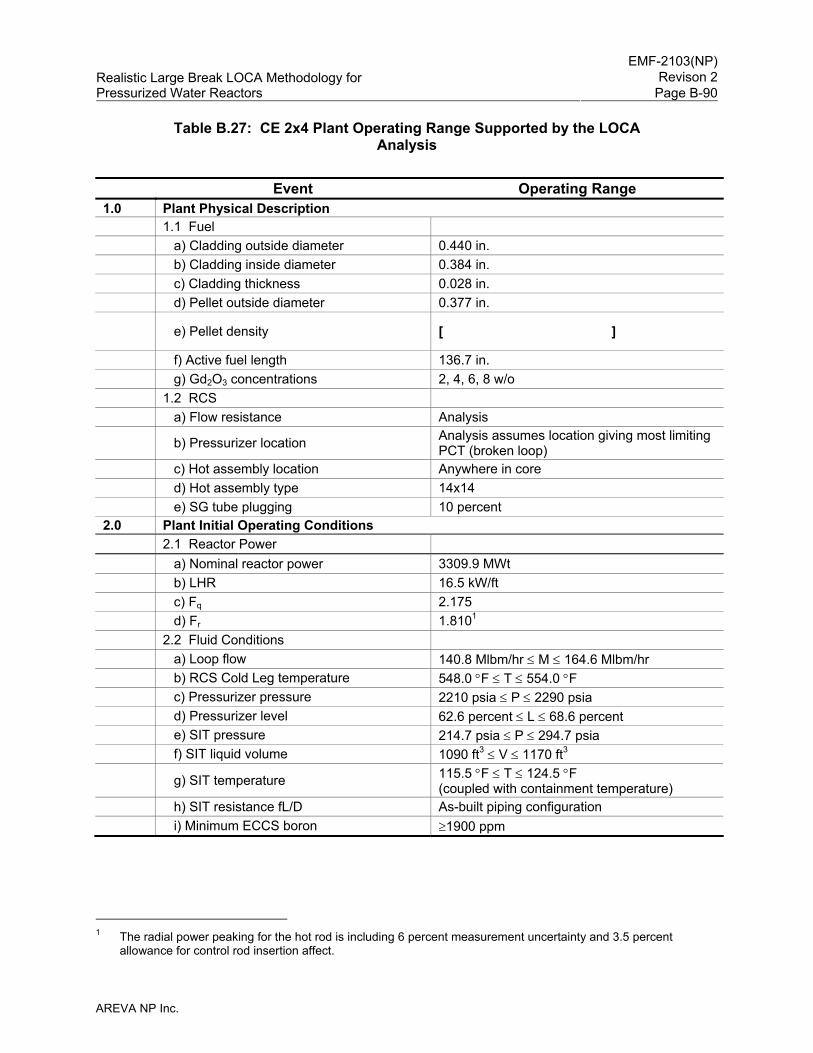
EMF-2103(NP)
Revison 2Realistic Large Break LOCA Methodology for Pressurized Water Reactors Page B-90
AREVA NP Inc.
Table B.27: CE 2x4 Plant Operating Range Supported by the LOCA Analysis
Event Operating Range 1.0 Plant Physical Description 1.1 Fuel a) Cladding outside diameter 0.440 in. b) Cladding inside diameter 0.384 in. c) Cladding thickness 0.028 in. d) Pellet outside diameter 0.377 in.
e) Pellet density [ ]
f) Active fuel length 136.7 in. g) Gd2O3 concentrations 2, 4, 6, 8 w/o 1.2 RCS a) Flow resistance Analysis
b) Pressurizer location Analysis assumes location giving most limiting PCT (broken loop)
c) Hot assembly location Anywhere in core d) Hot assembly type 14x14 e) SG tube plugging 10 percent 2.0 Plant Initial Operating Conditions 2.1 Reactor Power a) Nominal reactor power 3309.9 MWt b) LHR 16.5 kW/ft c) Fq 2.175 d) Fr 1.8101 2.2 Fluid Conditions a) Loop flow 140.8 Mlbm/hr ≤ M ≤ 164.6 Mlbm/hr b) RCS Cold Leg temperature 548.0 °F ≤ T ≤ 554.0 °F c) Pressurizer pressure 2210 psia ≤ P ≤ 2290 psia d) Pressurizer level 62.6 percent ≤ L ≤ 68.6 percent e) SIT pressure 214.7 psia ≤ P ≤ 294.7 psia f) SIT liquid volume 1090 ft3 ≤ V ≤ 1170 ft3
g) SIT temperature 115.5 °F ≤ T ≤ 124.5 °F (coupled with containment temperature)
h) SIT resistance fL/D As-built piping configuration i) Minimum ECCS boron ≥1900 ppm
1 The radial power peaking for the hot rod is including 6 percent measurement uncertainty and 3.5 percent
allowance for control rod insertion affect.
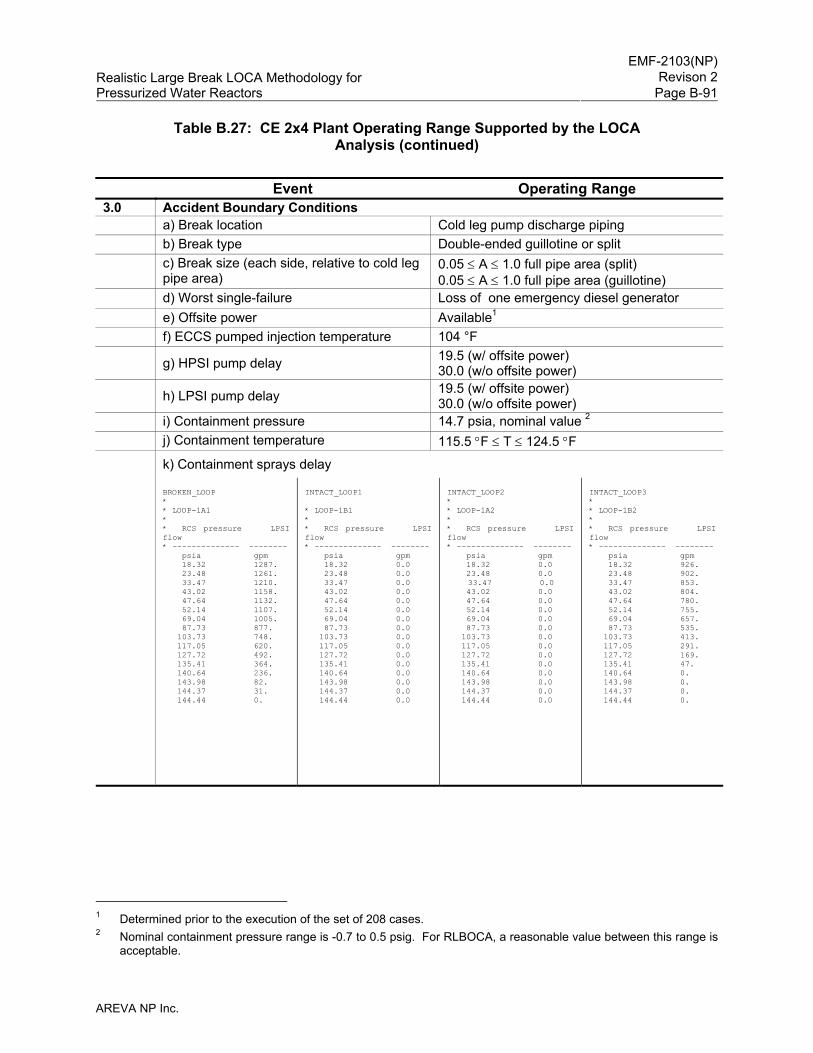
EMF-2103(NP)
Revison 2Realistic Large Break LOCA Methodology for Pressurized Water Reactors Page B-91
AREVA NP Inc.
Table B.27: CE 2x4 Plant Operating Range Supported by the LOCA Analysis (continued)
Event Operating Range
3.0 Accident Boundary Conditions a) Break location Cold leg pump discharge piping b) Break type Double-ended guillotine or split c) Break size (each side, relative to cold leg
pipe area) 0.05 ≤ A ≤ 1.0 full pipe area (split) 0.05 ≤ A ≤ 1.0 full pipe area (guillotine)
d) Worst single-failure Loss of one emergency diesel generator e) Offsite power Available1 f) ECCS pumped injection temperature 104 °F g) HPSI pump delay 19.5 (w/ offsite power)
30.0 (w/o offsite power) h) LPSI pump delay 19.5 (w/ offsite power)
30.0 (w/o offsite power) i) Containment pressure 14.7 psia, nominal value 2 j) Containment temperature 115.5 °F ≤ T ≤ 124.5 °F
k) Containment sprays delay BROKEN_LOOP * * LOOP-1A1 * * RCS pressure LPSI flow * -------------- -------- psia gpm 18.32 1287. 23.48 1261. 33.47 1210. 43.02 1158. 47.64 1132. 52.14 1107. 69.04 1005. 87.73 877. 103.73 748. 117.05 620. 127.72 492. 135.41 364. 140.64 236. 143.98 82. 144.37 31. 144.44 0.
INTACT_LOOP1 * LOOP-1B1 * * RCS pressure LPSI flow * -------------- -------- psia gpm 18.32 0.0 23.48 0.0 33.47 0.0 43.02 0.0 47.64 0.0 52.14 0.0 69.04 0.0 87.73 0.0 103.73 0.0 117.05 0.0 127.72 0.0 135.41 0.0 140.64 0.0 143.98 0.0 144.37 0.0 144.44 0.0
INTACT_LOOP2 * * LOOP-1A2 * * RCS pressure LPSI flow * -------------- -------- psia gpm 18.32 0.0 23.48 0.0
33.47 0.0 43.02 0.0 47.64 0.0 52.14 0.0 69.04 0.0 87.73 0.0 103.73 0.0 117.05 0.0 127.72 0.0 135.41 0.0 140.64 0.0 143.98 0.0 144.37 0.0 144.44 0.0
INTACT_LOOP3 * * LOOP-1B2 * * RCS pressure LPSI flow * -------------- -------- psia gpm 18.32 926. 23.48 902. 33.47 853. 43.02 804. 47.64 780. 52.14 755. 69.04 657. 87.73 535. 103.73 413. 117.05 291. 127.72 169. 135.41 47. 140.64 0. 143.98 0. 144.37 0. 144.44 0.
1 Determined prior to the execution of the set of 208 cases. 2 Nominal containment pressure range is -0.7 to 0.5 psig. For RLBOCA, a reasonable value between this range is
acceptable.
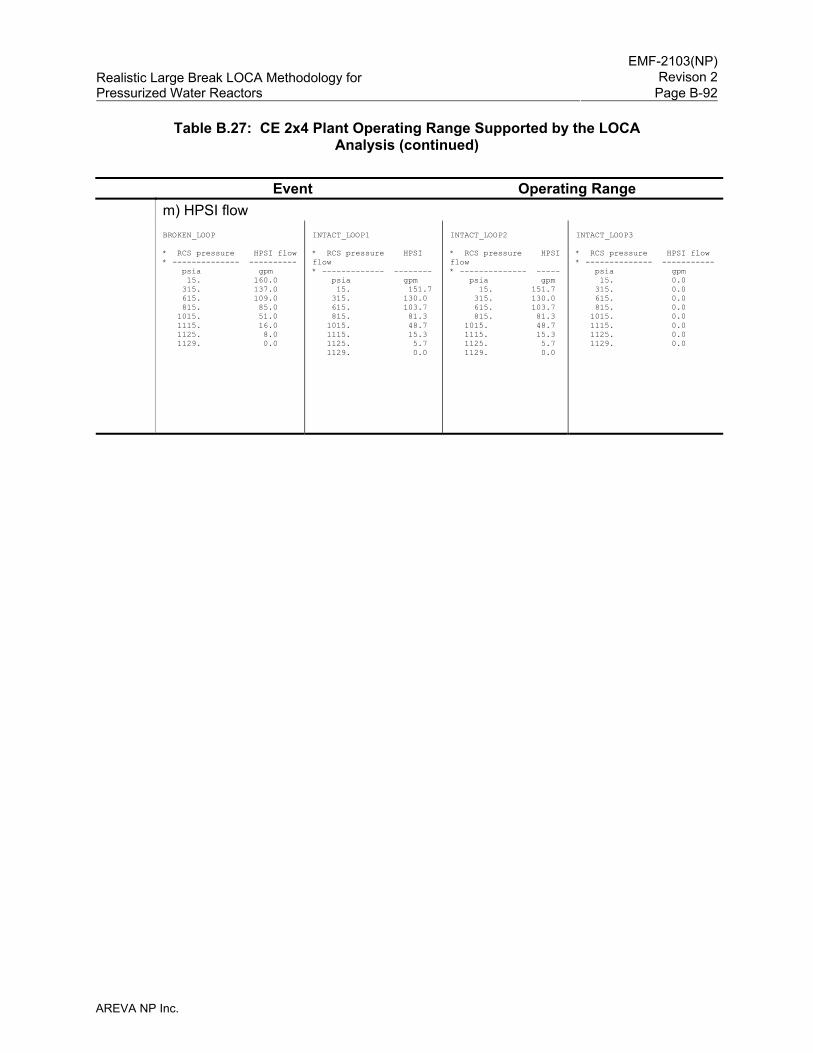
EMF-2103(NP)
Revison 2Realistic Large Break LOCA Methodology for Pressurized Water Reactors Page B-92
AREVA NP Inc.
Table B.27: CE 2x4 Plant Operating Range Supported by the LOCA Analysis (continued)
Event Operating Range
m) HPSI flow BROKEN_LOOP * RCS pressure HPSI flow * -------------- ---------- psia gpm 15. 160.0 315. 137.0 615. 109.0 815. 85.0 1015. 51.0 1115. 16.0 1125. 8.0 1129. 0.0
INTACT_LOOP1 * RCS pressure HPSI flow * ------------- -------- psia gpm 15. 151.7 315. 130.0 615. 103.7 815. 81.3 1015. 48.7 1115. 15.3 1125. 5.7 1129. 0.0
INTACT_LOOP2 * RCS pressure HPSI flow * -------------- ----- psia gpm 15. 151.7 315. 130.0 615. 103.7 815. 81.3 1015. 48.7 1115. 15.3 1125. 5.7 1129. 0.0
INTACT_LOOP3 * RCS pressure HPSI flow * -------------- ----------- psia gpm 15. 0.0 315. 0.0 615. 0.0 815. 0.0 1015. 0.0 1115. 0.0 1125. 0.0 1129. 0.0
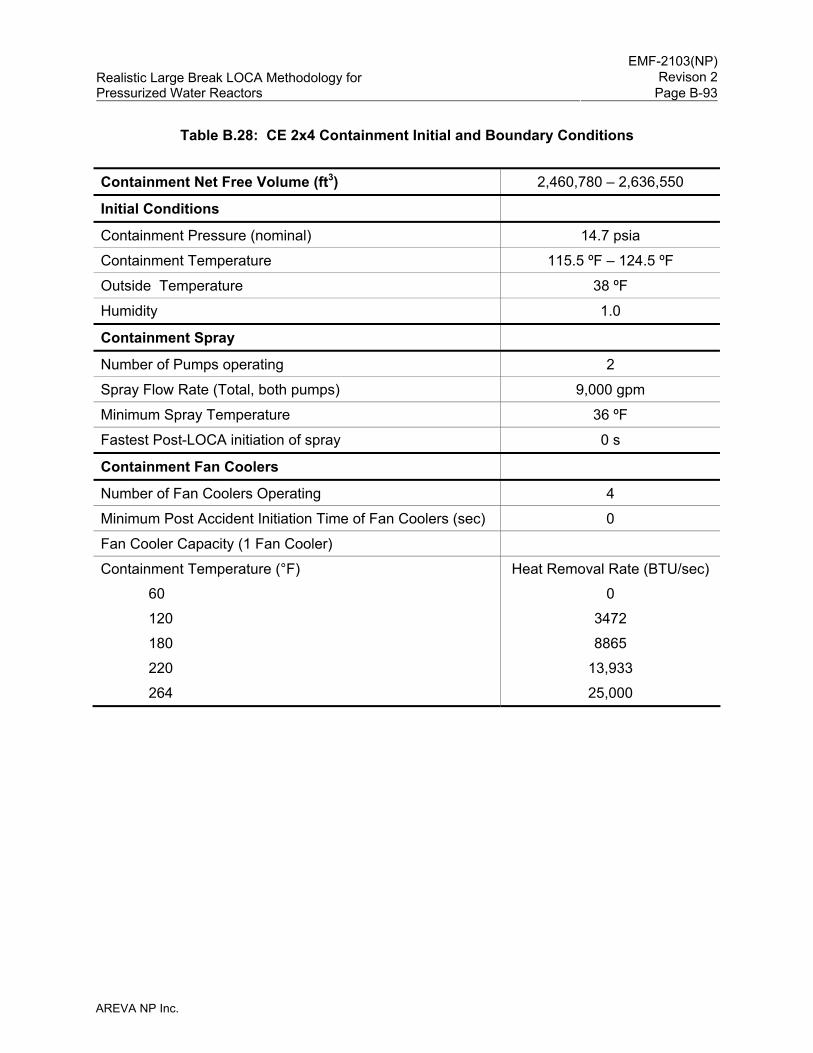
EMF-2103(NP)
Revison 2Realistic Large Break LOCA Methodology for Pressurized Water Reactors Page B-93
AREVA NP Inc.
Table B.28: CE 2x4 Containment Initial and Boundary Conditions Containment Net Free Volume (ft3) 2,460,780 – 2,636,550
Initial Conditions
Containment Pressure (nominal) 14.7 psia
Containment Temperature 115.5 ºF – 124.5 ºF
Outside Temperature 38 ºF
Humidity 1.0
Containment Spray
Number of Pumps operating 2
Spray Flow Rate (Total, both pumps) 9,000 gpm
Minimum Spray Temperature 36 ºF
Fastest Post-LOCA initiation of spray 0 s
Containment Fan Coolers
Number of Fan Coolers Operating 4
Minimum Post Accident Initiation Time of Fan Coolers (sec) 0
Fan Cooler Capacity (1 Fan Cooler)
Containment Temperature (°F)
60
120
180
220
264
Heat Removal Rate (BTU/sec)
0
3472
8865
13,933
25,000
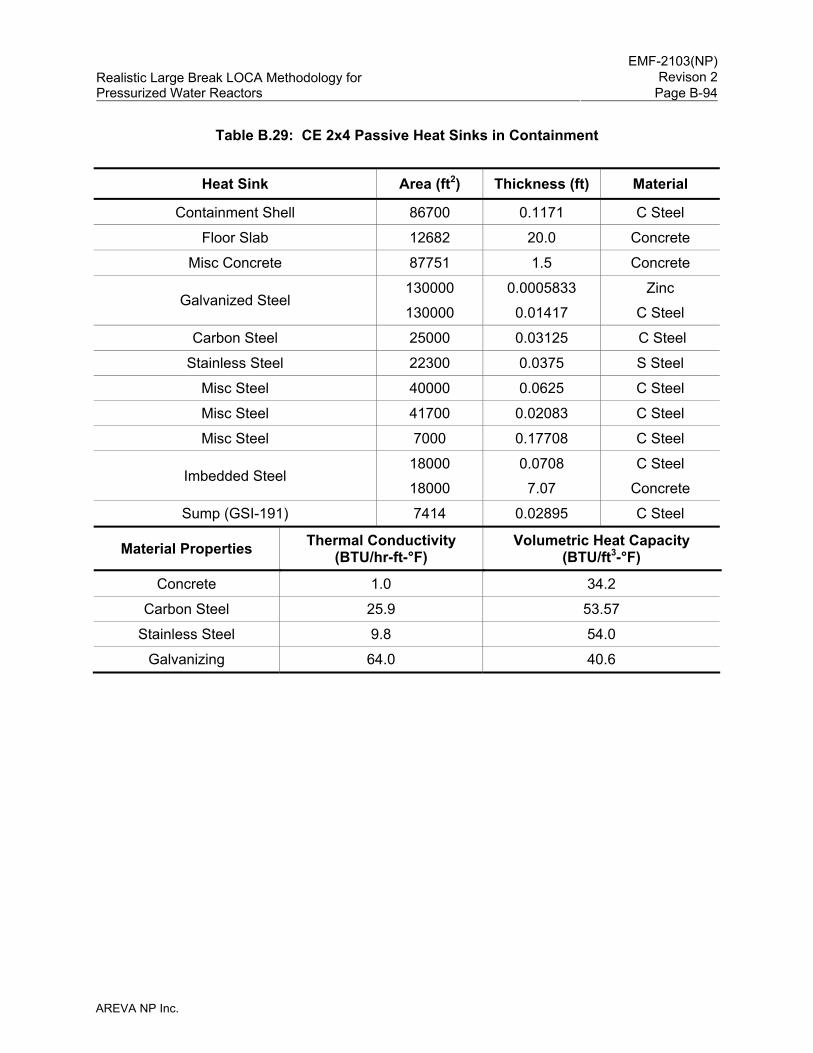
EMF-2103(NP)
Revison 2Realistic Large Break LOCA Methodology for Pressurized Water Reactors Page B-94
AREVA NP Inc.
Table B.29: CE 2x4 Passive Heat Sinks in Containment
Heat Sink Area (ft2) Thickness (ft) Material
Containment Shell 86700 0.1171 C Steel
Floor Slab 12682 20.0 Concrete
Misc Concrete 87751 1.5 Concrete
Galvanized Steel 130000
130000
0.0005833
0.01417
Zinc
C Steel
Carbon Steel 25000 0.03125 C Steel
Stainless Steel 22300 0.0375 S Steel
Misc Steel 40000 0.0625 C Steel
Misc Steel 41700 0.02083 C Steel
Misc Steel 7000 0.17708 C Steel
Imbedded Steel 18000
18000
0.0708
7.07
C Steel
Concrete
Sump (GSI-191) 7414 0.02895 C Steel
Material Properties Thermal Conductivity (BTU/hr-ft-°F)
Volumetric Heat Capacity (BTU/ft3-°F)
Concrete 1.0 34.2
Carbon Steel 25.9 53.57
Stainless Steel 9.8 54.0
Galvanizing 64.0 40.6
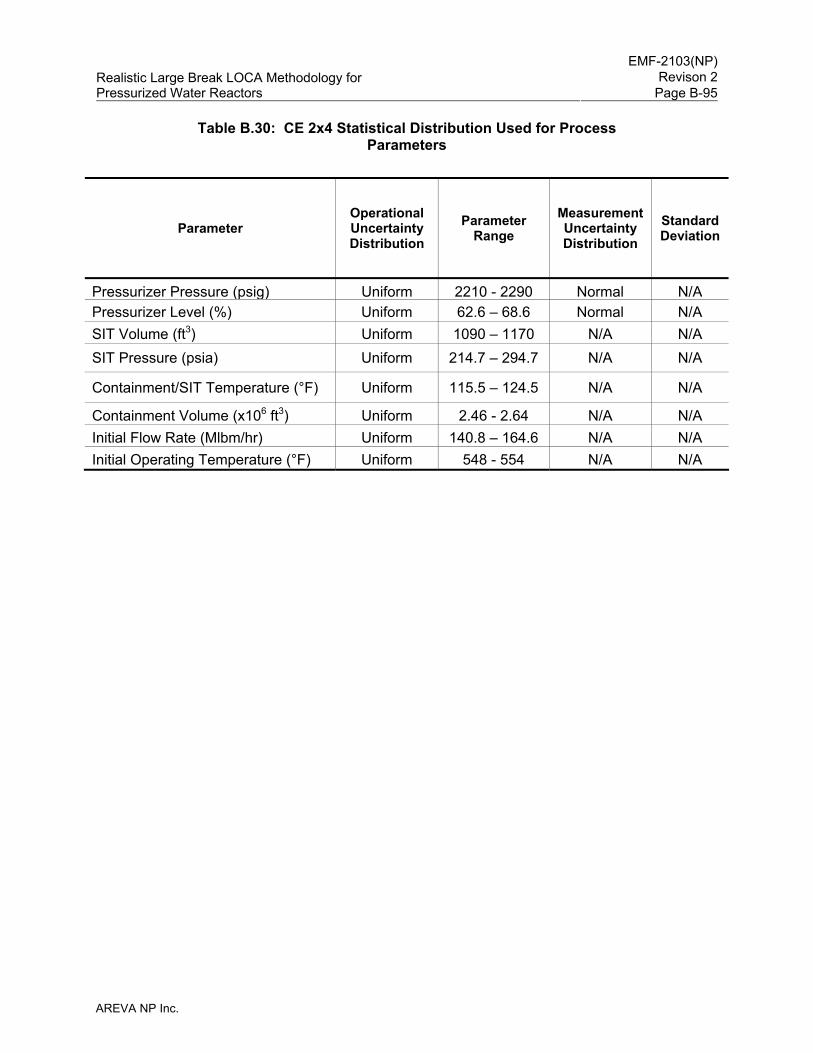
EMF-2103(NP)
Revison 2Realistic Large Break LOCA Methodology for Pressurized Water Reactors Page B-95
AREVA NP Inc.
Table B.30: CE 2x4 Statistical Distribution Used for Process Parameters
Parameter Operational Uncertainty Distribution
Parameter Range
Measurement Uncertainty Distribution
Standard Deviation
Pressurizer Pressure (psig) Uniform 2210 - 2290 Normal N/APressurizer Level (%) Uniform 62.6 – 68.6 Normal N/A SIT Volume (ft3) Uniform 1090 – 1170 N/A N/A SIT Pressure (psia) Uniform 214.7 – 294.7 N/A N/A
Containment/SIT Temperature (°F) Uniform 115.5 – 124.5 N/A N/A
Containment Volume (x106 ft3) Uniform 2.46 - 2.64 N/A N/A Initial Flow Rate (Mlbm/hr) Uniform 140.8 – 164.6 N/A N/A Initial Operating Temperature (°F) Uniform 548 - 554 N/A N/A
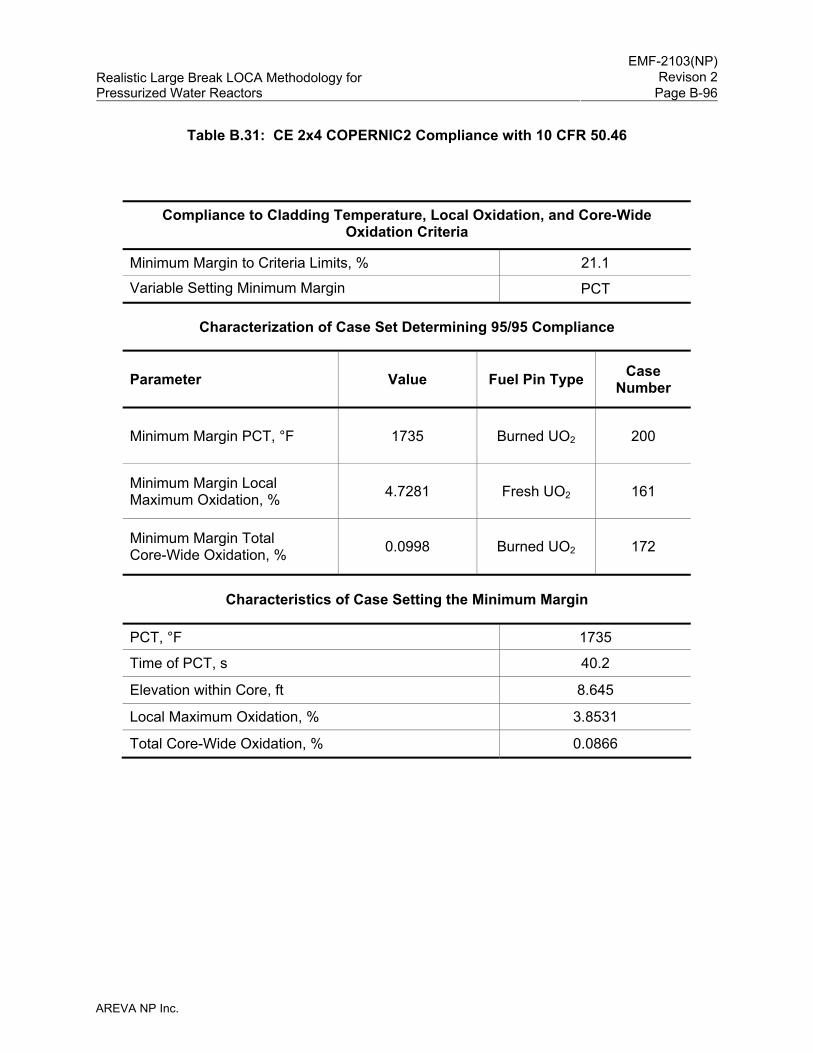
EMF-2103(NP)
Revison 2Realistic Large Break LOCA Methodology for Pressurized Water Reactors Page B-96
AREVA NP Inc.
Table B.31: CE 2x4 COPERNIC2 Compliance with 10 CFR 50.46
Compliance to Cladding Temperature, Local Oxidation, and Core-Wide Oxidation Criteria
Minimum Margin to Criteria Limits, % 21.1
Variable Setting Minimum Margin PCT
Characterization of Case Set Determining 95/95 Compliance
Parameter Value Fuel Pin Type Case Number
Minimum Margin PCT, °F 1735 Burned UO2 200
Minimum Margin Local Maximum Oxidation, % 4.7281 Fresh UO2 161
Minimum Margin Total Core-Wide Oxidation, % 0.0998 Burned UO2 172
Characteristics of Case Setting the Minimum Margin
PCT, °F 1735
Time of PCT, s 40.2
Elevation within Core, ft 8.645
Local Maximum Oxidation, % 3.8531
Total Core-Wide Oxidation, % 0.0866
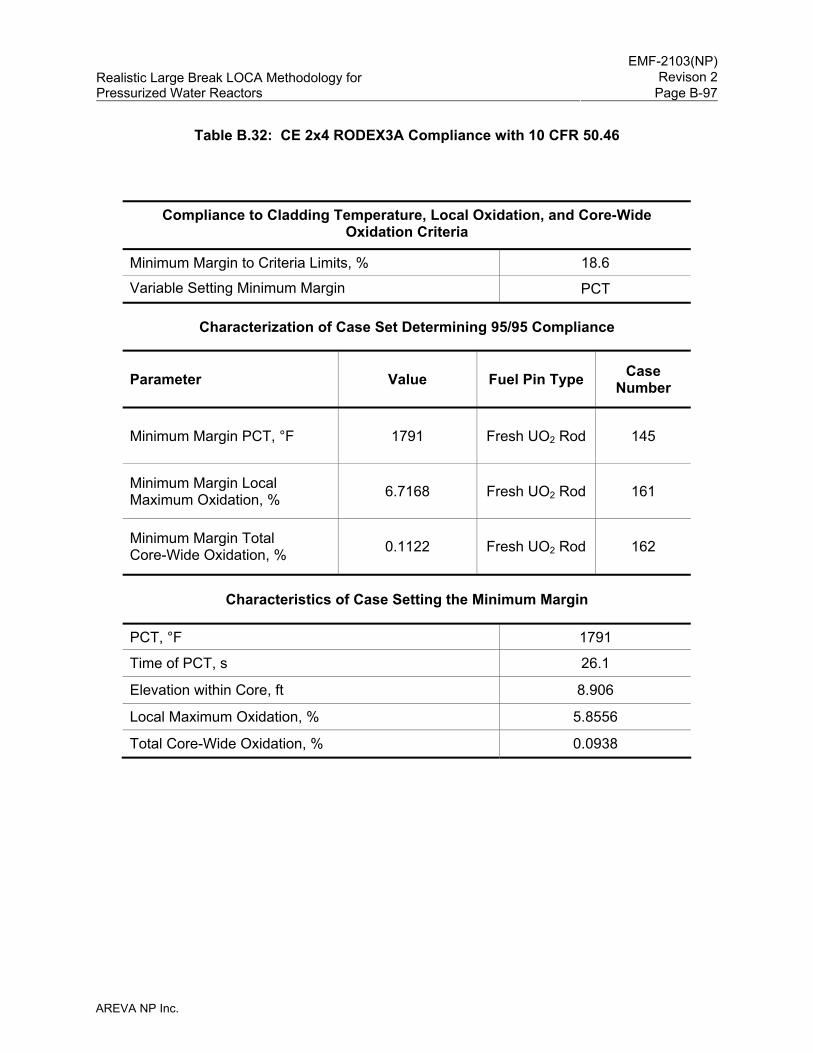
EMF-2103(NP)
Revison 2Realistic Large Break LOCA Methodology for Pressurized Water Reactors Page B-97
AREVA NP Inc.
Table B.32: CE 2x4 RODEX3A Compliance with 10 CFR 50.46
Compliance to Cladding Temperature, Local Oxidation, and Core-Wide Oxidation Criteria
Minimum Margin to Criteria Limits, % 18.6
Variable Setting Minimum Margin PCT
Characterization of Case Set Determining 95/95 Compliance
Parameter Value Fuel Pin Type Case Number
Minimum Margin PCT, °F 1791 Fresh UO2 Rod 145
Minimum Margin Local Maximum Oxidation, % 6.7168 Fresh UO2 Rod 161
Minimum Margin Total Core-Wide Oxidation, % 0.1122 Fresh UO2 Rod 162
Characteristics of Case Setting the Minimum Margin
PCT, °F 1791
Time of PCT, s 26.1
Elevation within Core, ft 8.906
Local Maximum Oxidation, % 5.8556
Total Core-Wide Oxidation, % 0.0938
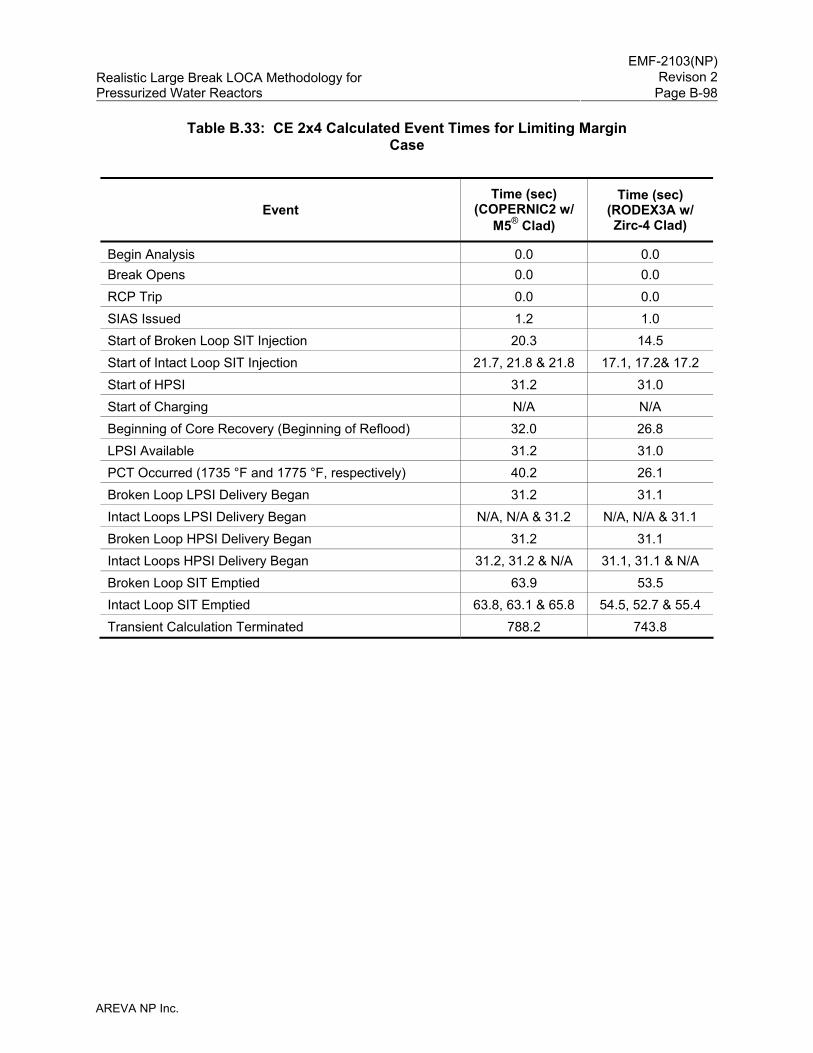
EMF-2103(NP)
Revison 2Realistic Large Break LOCA Methodology for Pressurized Water Reactors Page B-98
AREVA NP Inc.
Table B.33: CE 2x4 Calculated Event Times for Limiting Margin Case
Event Time (sec)
(COPERNIC2 w/ M5® Clad)
Time (sec) (RODEX3A w/ Zirc-4 Clad)
Begin Analysis 0.0 0.0 Break Opens 0.0 0.0 RCP Trip 0.0 0.0 SIAS Issued 1.2 1.0 Start of Broken Loop SIT Injection 20.3 14.5 Start of Intact Loop SIT Injection 21.7, 21.8 & 21.8 17.1, 17.2& 17.2 Start of HPSI 31.2 31.0 Start of Charging N/A N/A Beginning of Core Recovery (Beginning of Reflood) 32.0 26.8 LPSI Available 31.2 31.0 PCT Occurred (1735 °F and 1775 °F, respectively) 40.2 26.1 Broken Loop LPSI Delivery Began 31.2 31.1 Intact Loops LPSI Delivery Began N/A, N/A & 31.2 N/A, N/A & 31.1 Broken Loop HPSI Delivery Began 31.2 31.1 Intact Loops HPSI Delivery Began 31.2, 31.2 & N/A 31.1, 31.1 & N/A Broken Loop SIT Emptied 63.9 53.5 Intact Loop SIT Emptied 63.8, 63.1 & 65.8 54.5, 52.7 & 55.4 Transient Calculation Terminated 788.2 743.8
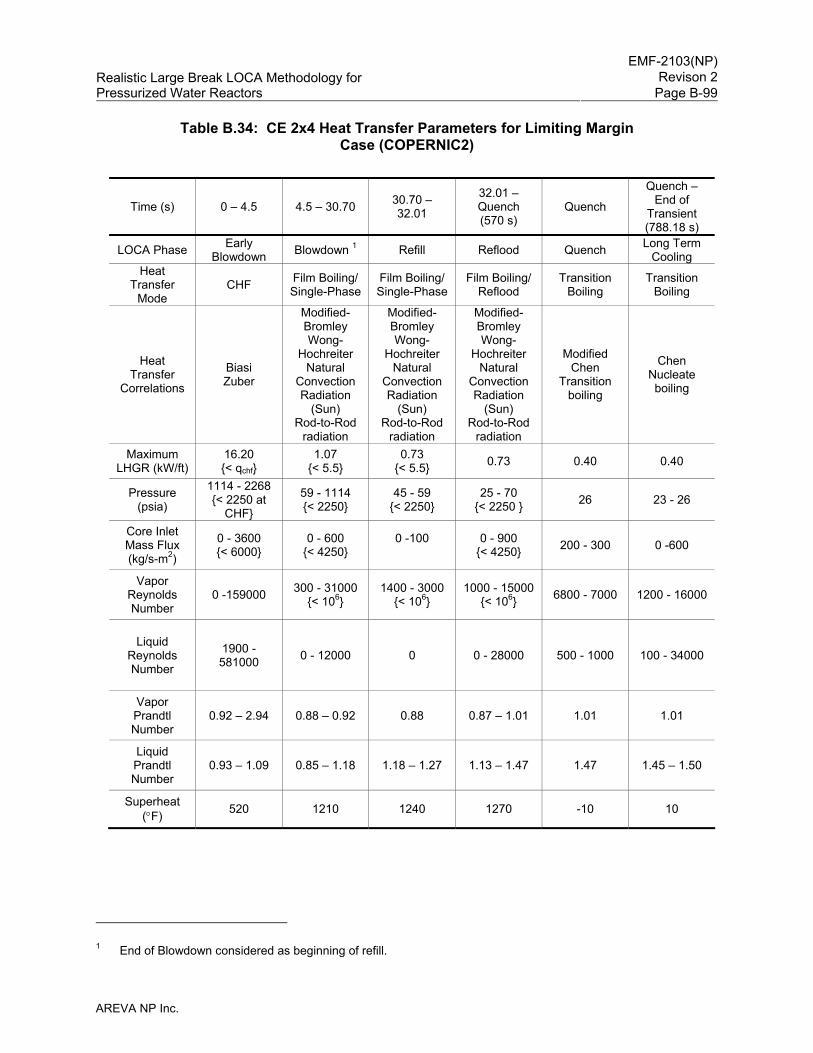
EMF-2103(NP)
Revison 2Realistic Large Break LOCA Methodology for Pressurized Water Reactors Page B-99
AREVA NP Inc.
Table B.34: CE 2x4 Heat Transfer Parameters for Limiting Margin Case (COPERNIC2)
Time (s) 0 – 4.5 4.5 – 30.70 30.70 – 32.01
32.01 – Quench (570 s)
Quench
Quench – End of
Transient (788.18 s)
LOCA Phase Early Blowdown Blowdown 1 Refill Reflood Quench Long Term
Cooling Heat
Transfer Mode
CHF Film Boiling/Single-Phase
Film Boiling/Single-Phase
Film Boiling/Reflood
Transition Boiling
Transition Boiling
Heat Transfer
Correlations
Biasi Zuber
Modified-Bromley Wong-
Hochreiter Natural
Convection Radiation
(Sun) Rod-to-Rod
radiation
Modified-Bromley Wong-
Hochreiter Natural
Convection Radiation
(Sun) Rod-to-Rod
radiation
Modified-Bromley Wong-
Hochreiter Natural
Convection Radiation
(Sun) Rod-to-Rod
radiation
Modified Chen
Transition boiling
Chen Nucleate boiling
Maximum LHGR (kW/ft)
16.20 {< qchf}
1.07 {< 5.5}
0.73 {< 5.5} 0.73 0.40 0.40
Pressure (psia)
1114 - 2268 {< 2250 at
CHF}
59 - 1114 {< 2250}
45 - 59 {< 2250}
25 - 70 {< 2250 } 26 23 - 26
Core Inlet Mass Flux (kg/s-m2)
0 - 3600 {< 6000}
0 - 600 {< 4250}
0 -100
0 - 900 {< 4250} 200 - 300 0 -600
Vapor Reynolds Number
0 -159000 300 - 31000{< 106}
1400 - 3000{< 106}
1000 - 15000{< 106} 6800 - 7000 1200 - 16000
Liquid Reynolds Number
1900 - 581000 0 - 12000 0 0 - 28000 500 - 1000 100 - 34000
Vapor Prandtl Number
0.92 – 2.94 0.88 – 0.92 0.88 0.87 – 1.01 1.01 1.01
Liquid Prandtl Number
0.93 – 1.09 0.85 – 1.18 1.18 – 1.27 1.13 – 1.47 1.47 1.45 – 1.50
Superheat (°F) 520 1210 1240 1270 -10 10
1 End of Blowdown considered as beginning of refill.
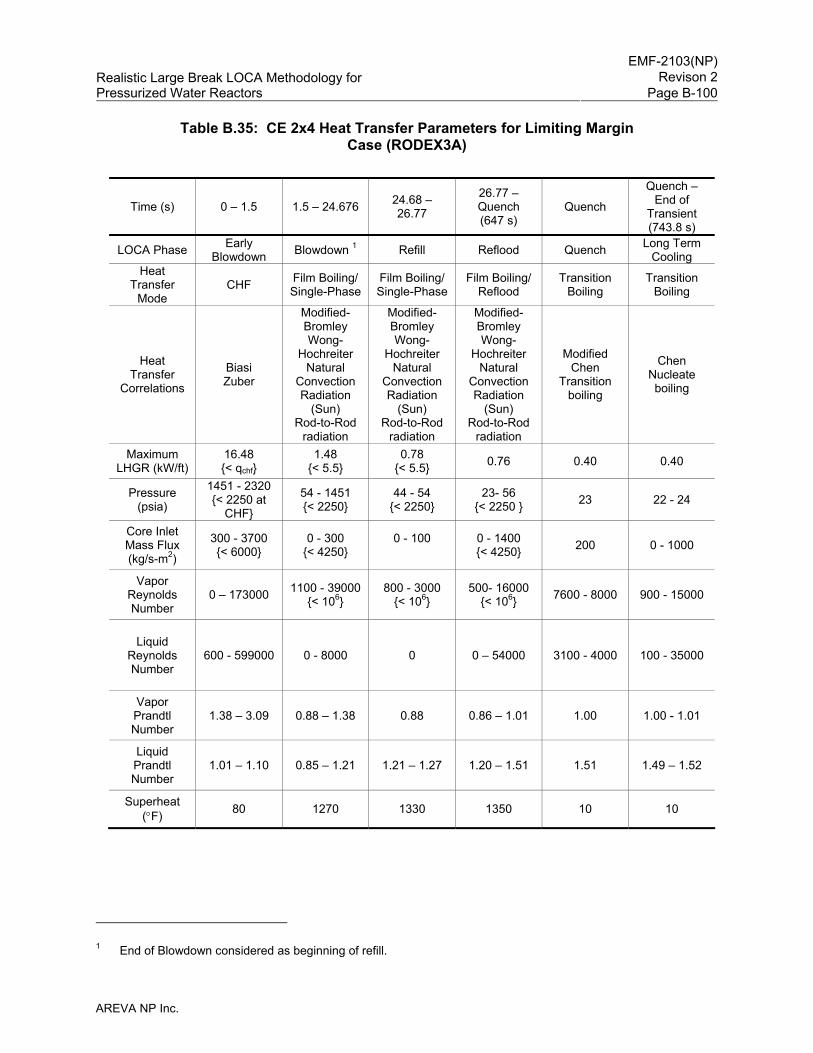
EMF-2103(NP)
Revison 2Realistic Large Break LOCA Methodology for Pressurized Water Reactors Page B-100
AREVA NP Inc.
Table B.35: CE 2x4 Heat Transfer Parameters for Limiting Margin Case (RODEX3A)
Time (s) 0 – 1.5 1.5 – 24.676 24.68 – 26.77
26.77 – Quench (647 s)
Quench
Quench – End of
Transient (743.8 s)
LOCA Phase Early Blowdown Blowdown 1 Refill Reflood Quench Long Term
Cooling Heat
Transfer Mode
CHF Film Boiling/Single-Phase
Film Boiling/Single-Phase
Film Boiling/Reflood
Transition Boiling
Transition Boiling
Heat Transfer
Correlations
Biasi Zuber
Modified-Bromley Wong-
Hochreiter Natural
Convection Radiation
(Sun) Rod-to-Rod
radiation
Modified-Bromley Wong-
Hochreiter Natural
Convection Radiation
(Sun) Rod-to-Rod
radiation
Modified-Bromley Wong-
Hochreiter Natural
Convection Radiation
(Sun) Rod-to-Rod
radiation
Modified Chen
Transition boiling
Chen Nucleate boiling
Maximum LHGR (kW/ft)
16.48 {< qchf}
1.48 {< 5.5}
0.78 {< 5.5} 0.76 0.40 0.40
Pressure (psia)
1451 - 2320 {< 2250 at
CHF}
54 - 1451 {< 2250}
44 - 54 {< 2250}
23- 56 {< 2250 } 23 22 - 24
Core Inlet Mass Flux (kg/s-m2)
300 - 3700 {< 6000}
0 - 300 {< 4250}
0 - 100
0 - 1400 {< 4250} 200 0 - 1000
Vapor Reynolds Number
0 – 173000 1100 - 39000{< 106}
800 - 3000 {< 106}
500- 16000 {< 106} 7600 - 8000 900 - 15000
Liquid Reynolds Number
600 - 599000 0 - 8000 0 0 – 54000 3100 - 4000 100 - 35000
Vapor Prandtl Number
1.38 – 3.09 0.88 – 1.38 0.88 0.86 – 1.01 1.00 1.00 - 1.01
Liquid Prandtl Number
1.01 – 1.10 0.85 – 1.21 1.21 – 1.27 1.20 – 1.51 1.51 1.49 – 1.52
Superheat (°F) 80 1270 1330 1350 10 10
1 End of Blowdown considered as beginning of refill.

EMF-2103(NP)
Revison 2Realistic Large Break LOCA Methodology for Pressurized Water Reactors Page B-101
AREVA NP Inc.
Table B.36: Summary of Limiting Values for Top Minimum Margin Cases within the Set Used to Establish the Probability Evaluation
(COPERNIC2 with M5® Cladding)
Case
Number Φ PCT ECR (%)
CWO (%) SPCT SECR SCWO
200 0.78823 1734.1 3.8531 0.08661 0.78823 0.22665 0.0866 19 0.78291 1722.4 3.5019 0.06637 0.78291 0.206 0.06637
162 0.78095 1718.1 4.3911 0.07933 0.78095 0.2583 0.07933 145 0.77832 1712.3 3.7999 0.06807 0.77832 0.22353 0.06807 62 0.77705 1709.5 3.6167 0.06513 0.77705 0.21275 0.06513 61 0.77505 1705.1 4.7281 0.03429 0.77505 0.27813 0.03429 67 0.77418 1703.2 3.0114 0.06327 0.77418 0.17714 0.06327 92 0.77077 1695.7 3.8483 0.07310 0.77077 0.22637 0.0731 93 0.76977 1693.5 3.9437 0.07698 0.76977 0.23198 0.07698 66 0.76591 1685 3.6373 0.06970 0.76591 0.21396 0.0697
199 0.76186 1676.1 2.8723 0.07096 0.76186 0.16896 0.07096 164 0.75909 1670 3.3862 0.05858 0.75909 0.19919 0.05858
5 0.75882 1669.4 3.8871 0.07612 0.75882 0.22865 0.07612 186 0.758 1667.6 4.4569 0.05989 0.758 0.26217 0.05989 136 0.75718 1665.8 2.4171 0.03470 0.75718 0.14218 0.0347 190 0.75632 1663.9 2.8225 0.07557 0.75632 0.16603 0.07557 74 0.75627 1663.8 3.1048 0.07039 0.75627 0.18263 0.07039
185 0.75382 1658.4 3.9479 0.04760 0.75382 0.23223 0.0476 42 0.75373 1658.2 2.9086 0.06178 0.75373 0.1711 0.06178 54 0.75359 1657.9 2.83 0.04885 0.75359 0.16647 0.04885
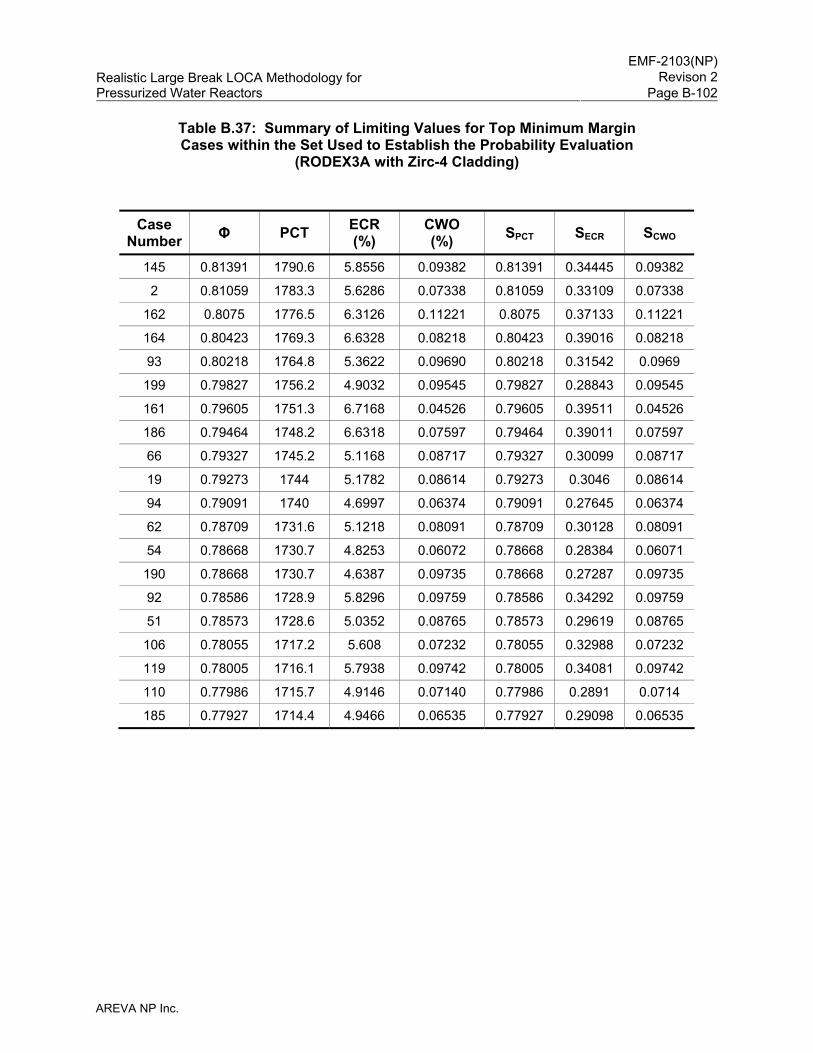
EMF-2103(NP)
Revison 2Realistic Large Break LOCA Methodology for Pressurized Water Reactors Page B-102
AREVA NP Inc.
Table B.37: Summary of Limiting Values for Top Minimum Margin Cases within the Set Used to Establish the Probability Evaluation
(RODEX3A with Zirc-4 Cladding)
Case
Number Φ PCT ECR (%)
CWO (%) SPCT SECR SCWO
145 0.81391 1790.6 5.8556 0.09382 0.81391 0.34445 0.09382 2 0.81059 1783.3 5.6286 0.07338 0.81059 0.33109 0.07338
162 0.8075 1776.5 6.3126 0.11221 0.8075 0.37133 0.11221 164 0.80423 1769.3 6.6328 0.08218 0.80423 0.39016 0.08218 93 0.80218 1764.8 5.3622 0.09690 0.80218 0.31542 0.0969
199 0.79827 1756.2 4.9032 0.09545 0.79827 0.28843 0.09545 161 0.79605 1751.3 6.7168 0.04526 0.79605 0.39511 0.04526 186 0.79464 1748.2 6.6318 0.07597 0.79464 0.39011 0.07597 66 0.79327 1745.2 5.1168 0.08717 0.79327 0.30099 0.08717 19 0.79273 1744 5.1782 0.08614 0.79273 0.3046 0.08614 94 0.79091 1740 4.6997 0.06374 0.79091 0.27645 0.06374 62 0.78709 1731.6 5.1218 0.08091 0.78709 0.30128 0.08091 54 0.78668 1730.7 4.8253 0.06072 0.78668 0.28384 0.06071
190 0.78668 1730.7 4.6387 0.09735 0.78668 0.27287 0.09735 92 0.78586 1728.9 5.8296 0.09759 0.78586 0.34292 0.09759 51 0.78573 1728.6 5.0352 0.08765 0.78573 0.29619 0.08765
106 0.78055 1717.2 5.608 0.07232 0.78055 0.32988 0.07232 119 0.78005 1716.1 5.7938 0.09742 0.78005 0.34081 0.09742 110 0.77986 1715.7 4.9146 0.07140 0.77986 0.2891 0.0714 185 0.77927 1714.4 4.9466 0.06535 0.77927 0.29098 0.06535
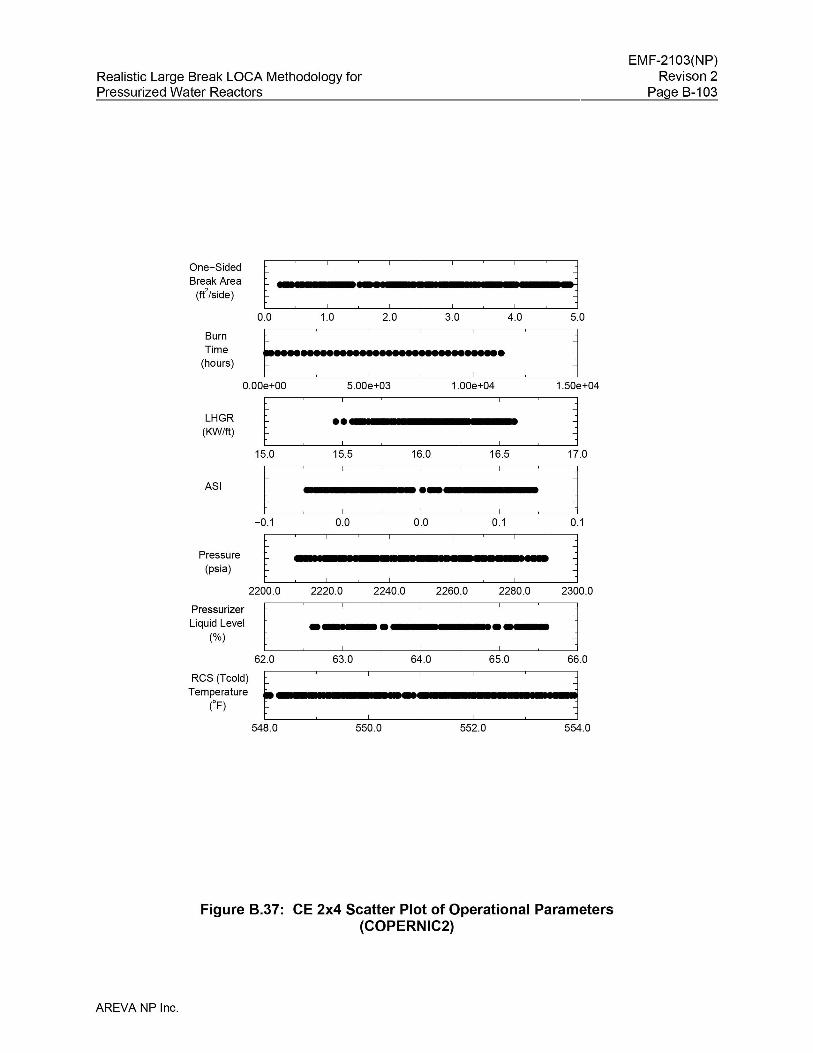
Realistic Large Break LOCA Methodology forPressurized Water Reactors
EMF-2103(NP)Revison 2
Page B-103
554.0
4.0
552.0
3.02.0
550.0
0.0
1.00.0
-0.1
f""-OO-.: : :- : .O.OOe+OO 5.00e+03 1.00e+04
ASI
LHGR(KW/ft)
BurnTime
(hours)
Pressure(psia)
PressurizerLiquid Level
(%)
One-Sided
Break Area(ft
2/side)
t -~ ~ :_L ~ ~ ~ ~ ~ -j5.0
, •1.50e+04
teo: ~ ~ : , j15.0 15.5 16.0 16.5 17.0
[" : ~ "' - ~ : • j0.0 0.1 0.1
t::: : ~ ~ ~ ~ ~ j2200.0 2220.0 2240.0 2260.0 2280.0 2300.0
t --: · ~ J~_ ~ 162.0 63.0 64.0 65.0 66.0
T:~~~?J~~ t-_.~-_.~-"-"------_.j--~----'-------~---'-------~---
548.0
Figure 8.37: CE 2x4 Scatter Plot of Operational Parameters(COPERNIC2)
AREVA NP Inc.
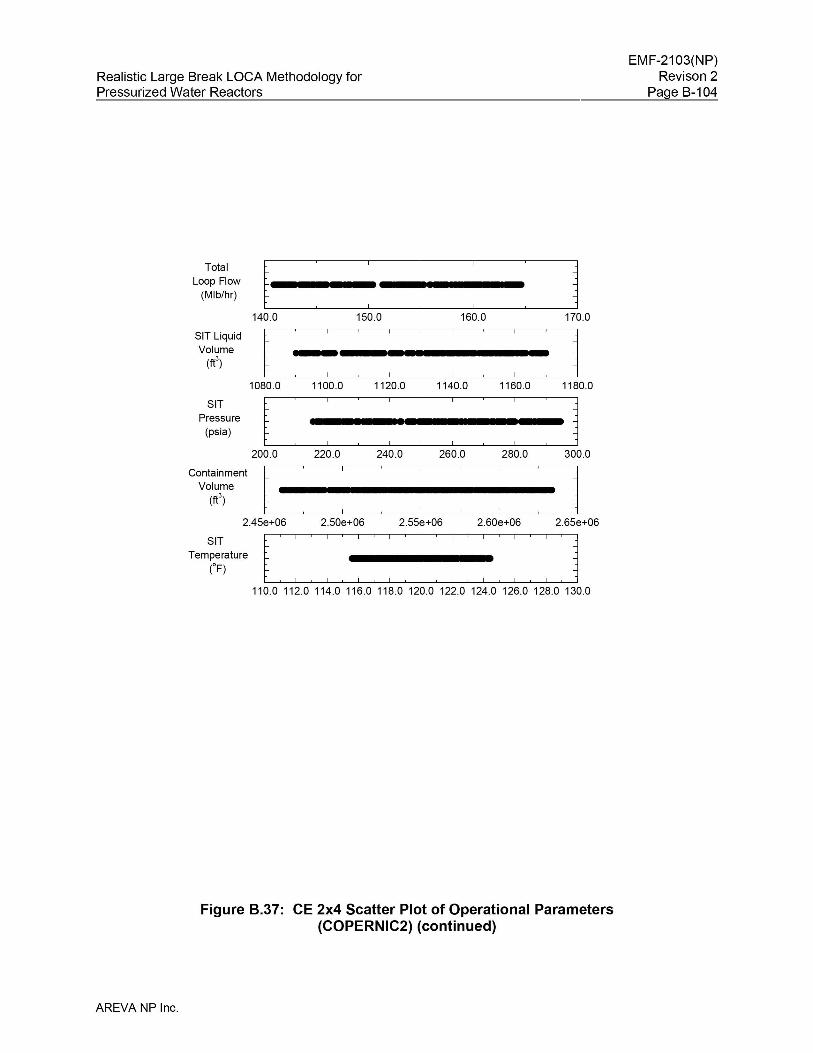
Realistic Large Break LOCA Methodology forPressurized Water Reactors
EMF-2103(NP)Revison 2
Page B-104
ContainmentVolume
(ft3)
SITTemperature
(oF)
140.0
TotalLoop Flow
(Mlb/hr)
SIT LiquidVolume
(ft3)
SITPressure
(psia)
f---~-, •150.0 160.0 170.0
t : :: J :-: ~ ~ ~ -: 11080.0 1100.0 1120.0 1140.0 1160.0 1180.0
f • ~ ~ ~. ~ ~ ~ ~ ~ 1200.0 220.0 240.0 260.0 280.0 300.0
l ~ ~ : ~ ~ ~ : 12.45e+06 2.50e+06 2.55e+06 2.60e+06 2.65e+06
f,:.:. ~: ~: ~: ~: ~,:, :1110.0 112.0 114.0 116.0 118.0 120.0 122.0 124.0 126.0 128.0 130.0
Figure 8.37: CE 2x4 Scatter Plot of Operational Parameters(COPERNIC2) (continued)
AREVA NP Inc.

Realistic Large Break LOCA Methodology forPressurized Water Reactors
EMF-2103(NP)Revison 2
Page B-105
PCT vs Time of PCT
2000 r--~-~-~------r------r-----,------'-------r-~------;
1800
o
1600
1400 ClIO•
- •u... & ~.0
;:- 1200 Ii.l() 0l1li10a.. .~.,..... •1000
°B0
800• Split Breako Guillotine Break
600
500400200 300Time of PCT (s)
100400 L--~_------'_~_-----'-_~_-----"-_~_-----"-_~_-----.J
o
Figure 8.38: CE 2x4 PCT versus PCT Time Scatter Plot from theCase Set (COPERNIC2)
AREVA NP Inc.
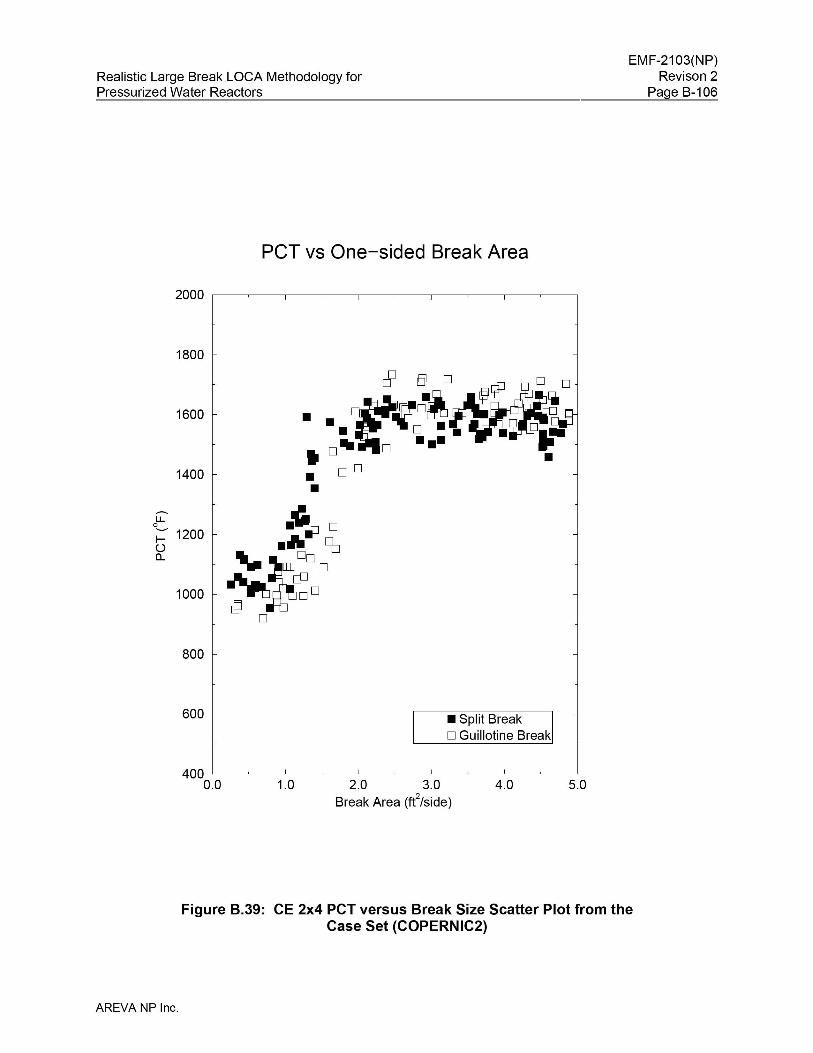
Realistic Large Break LOCA Methodology forPressurized Water Reactors
EMF-2103(NP)Revison 2
Page B-106
peT vs One-sided Break Area
2000 ,----~--,------~--,------~---,-----~----,----~----;
1800
1600 ~~i~f· ·.1;'0 ... .~..ii... ...II 0 0 •
1400 • 0 0
•- ....IIIP 0u...
0........
1200~ .... en()a..
....~ooc1000 ~ ~o
r§J0
800
600 • Split Breako Guillotine Break
5.04.02.0 3.0Break Area (fe/side)
1.0400 L-_~_-'-----_~_-'-----_~_--'-----_~_---'-----_~_---.J
0.0
Figure B.39: CE 2x4 PCT versus Break Size Scatter Plot from theCase Set (COPERNIC2)
AREVA NP Inc.
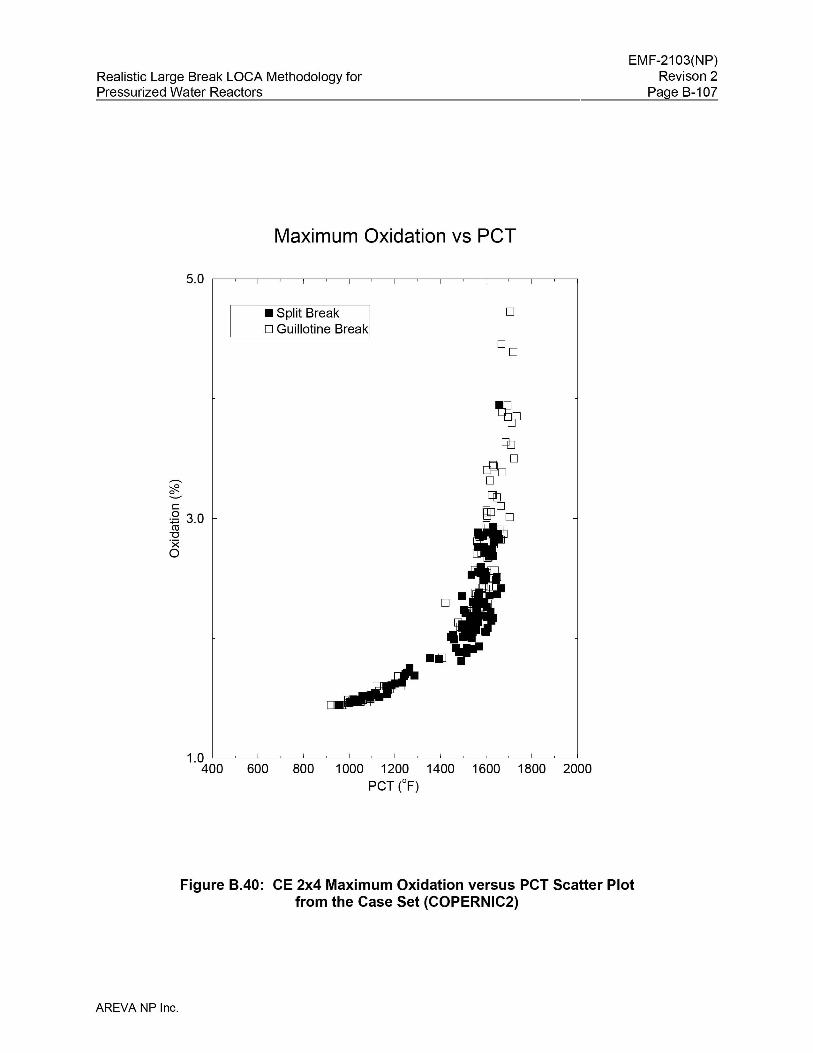
Realistic Large Break LOCA Methodology forPressurized Water Reactors
Maximum Oxidation vs peT
EMF-2103(NP)Revison 2
Page B-107
• Split BreakD Guillotine Break
D
c2 3.0co
"0·xo
1.0 L--~----'---~_-'-----~-----'---~_--'-----~-----'-_~---'-----~-----'-_~---.J
400 600 800 1000 1200 1400 1600 1800 2000PCT CF)
Figure 8.40: CE 2x4 Maximum Oxidation versus PCT Scatter Plotfrom the Case Set (COPERNIC2)
AREVA NP Inc.
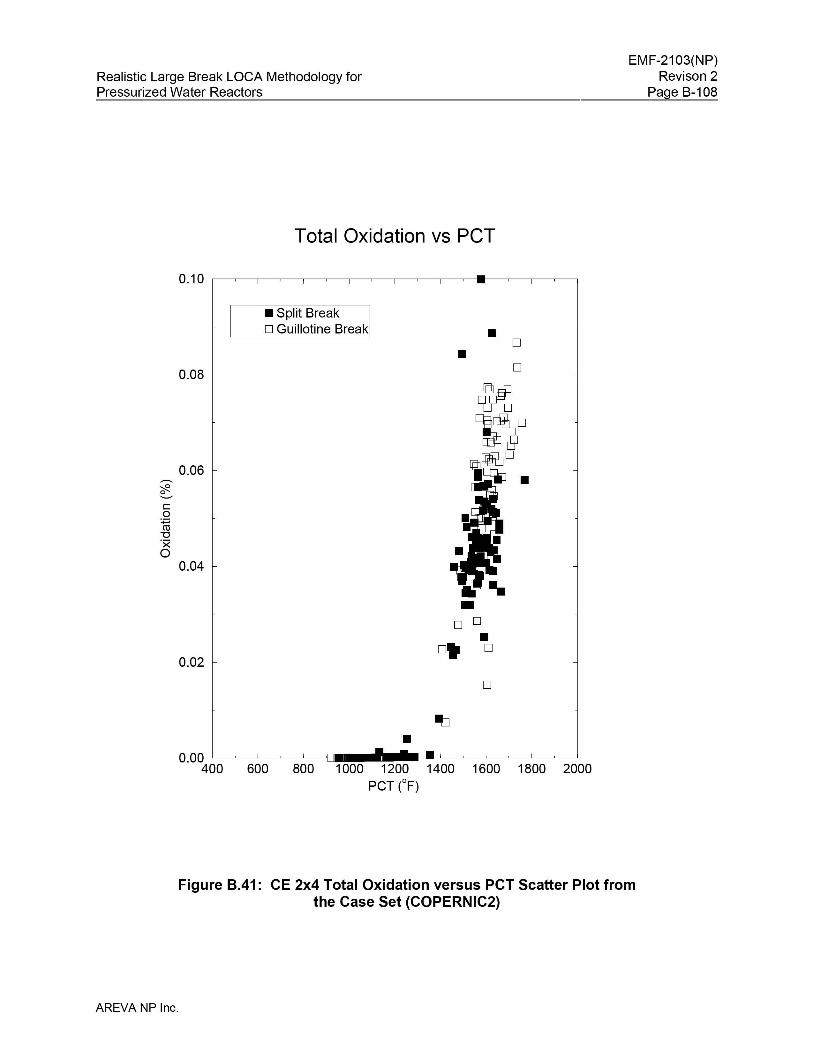
Realistic Large Break LOCA Methodology forPressurized Water Reactors
Total Oxidation vs peT
EMF-2103(NP)Revison 2
Page B-108
0.08
• Split BreakD Guillotine Break
•• D
D
0.06~
::f2..0-c0
~"'0·x0
0.04
D
0.02Dt
D
lib
•0.00
400 600 800 1000 1200 1400 1600 1800 2000PCT CF)
Figure 8.41: CE 2x4 Total Oxidation versus PCT Scatter Plot fromthe Case Set (COPERNIC2)
AREVA NP Inc.
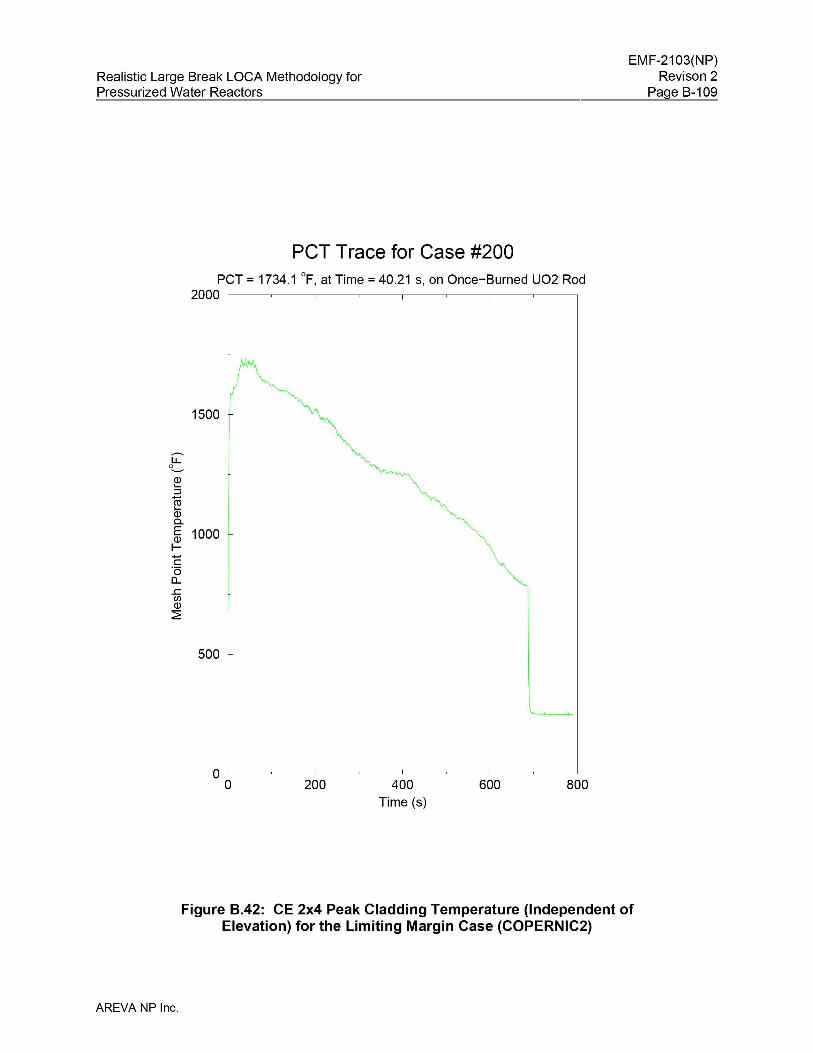
Realistic Large Break LOCA Methodology forPressurized Water Reactors
EMF-2103(NP)Revison 2
Page B-109
PCT Trace for Case #200
800600400Time (s)
200OL--~------'--~------'---~------'----~----.J
o
PCT = 1734.1 of, at Time = 40.21 s, on Once-Burned U02 Rod2000 ,----~------,--~------,---~------,---~-----;
1500
-l.L0.......
Q).....::::l
ro.....Q)0..E 1000Q)l-e"0a....c:UlQ)
~
500
Figure 8.42: CE 2x4 Peak Cladding Temperature (Independent ofElevation) for the Limiting Margin Case (COPERNIC2)
AREVA NP Inc.
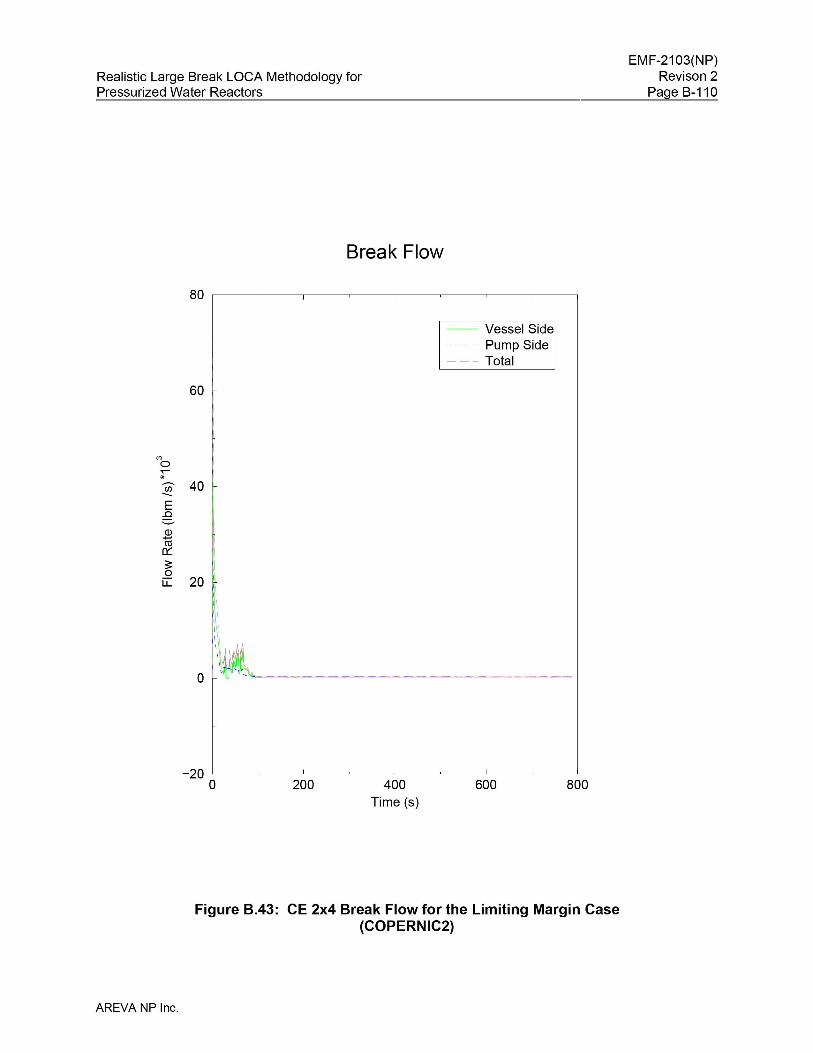
Realistic Large Break LOCA Methodology forPressurized Water Reactors
EMF-2103(NP)Revison 2
Page B-110
Break Flow
80 ,------~----,----~------,---~------.--~-------,
-- Vessel Side- - - - Pump Side--- Total
60
00 40 I--E..Cl
.illctl
0:::3:o
u:::: 20 \
I:1
\II
o \, \~'-=~~~~~~~~~~~~~~~~~~
800600400Time (s)
200-20 L-_~__l.--_~__--'-----_~__---'-----_~__---.J
o
Figure B.43: CE 2x4 Break Flow for the Limiting Margin Case(COPERNIC2)
AREVA NP Inc.
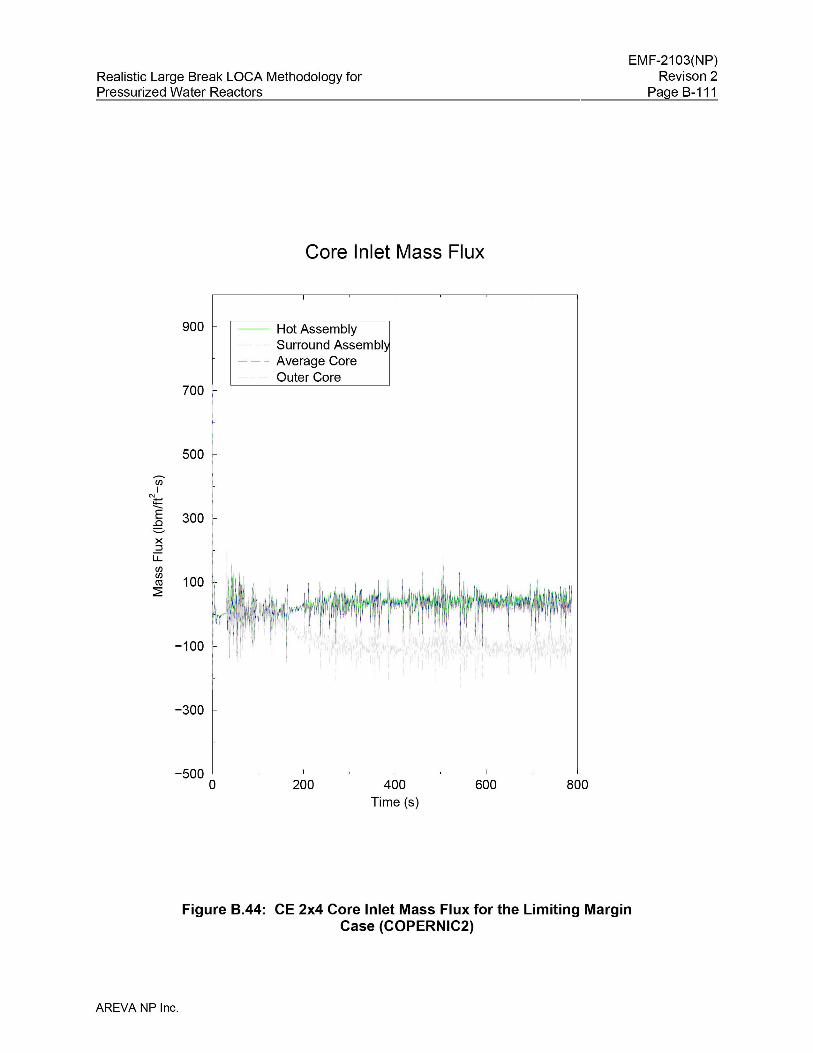
Realistic Large Break LOCA Methodology forPressurized Water Reactors
EMF-2103(NP)Revison 2
Page B-111
Core Inlet Mass Flux
900 -- Hot Assembly- - - - Surround Assembly- - - Average Core
Outer Core700
I
500
UlI
N;t=-..E 300..Cl
:::::-x::::l
u::UlUl
100co:2:
-100
-300
800600400Time (s)
200-500 L-_~__l.--_~__--'-----_~__---'-----_~__---.J
o
Figure 8.44: CE 2x4 Core Inlet Mass Flux for the Limiting MarginCase (COPERNIC2)
AREVA NP Inc.
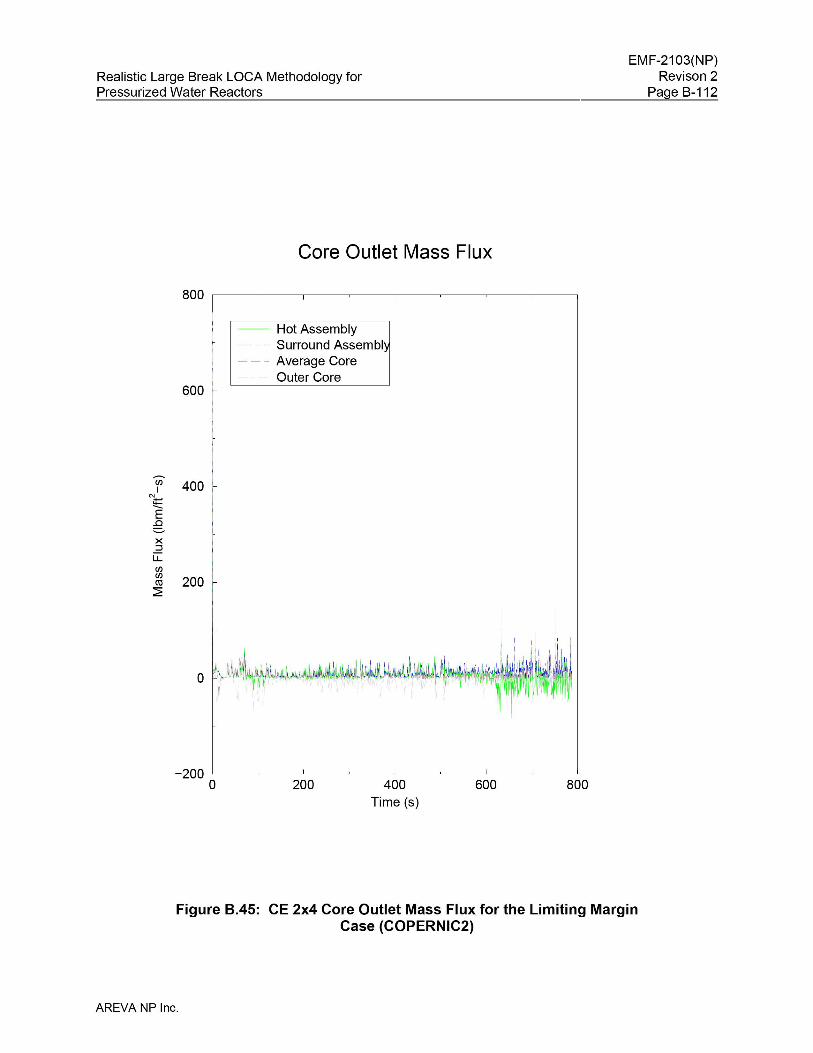
Realistic Large Break LOCA Methodology forPressurized Water Reactors
EMF-2103(NP)Revison 2
Page B-112
Core Outlet Mass Flux
800 r---~-------,--~------r--~------,---~------,
-- Hot Assembly- - - - Surround Assembly- - - Average Core
Outer Core600
Ul 400IN;t=-..E
..Cl:::::-x::::l
u::UlUl
200co:2:
800600400Time (s)
200-200 L--_~_------'__~_-----.l__~_-----'-__~_-----'
o
Figure B.45: CE 2x4 Core Outlet Mass Flux for the Limiting MarginCase (COPERNIC2)
AREVA NP Inc.
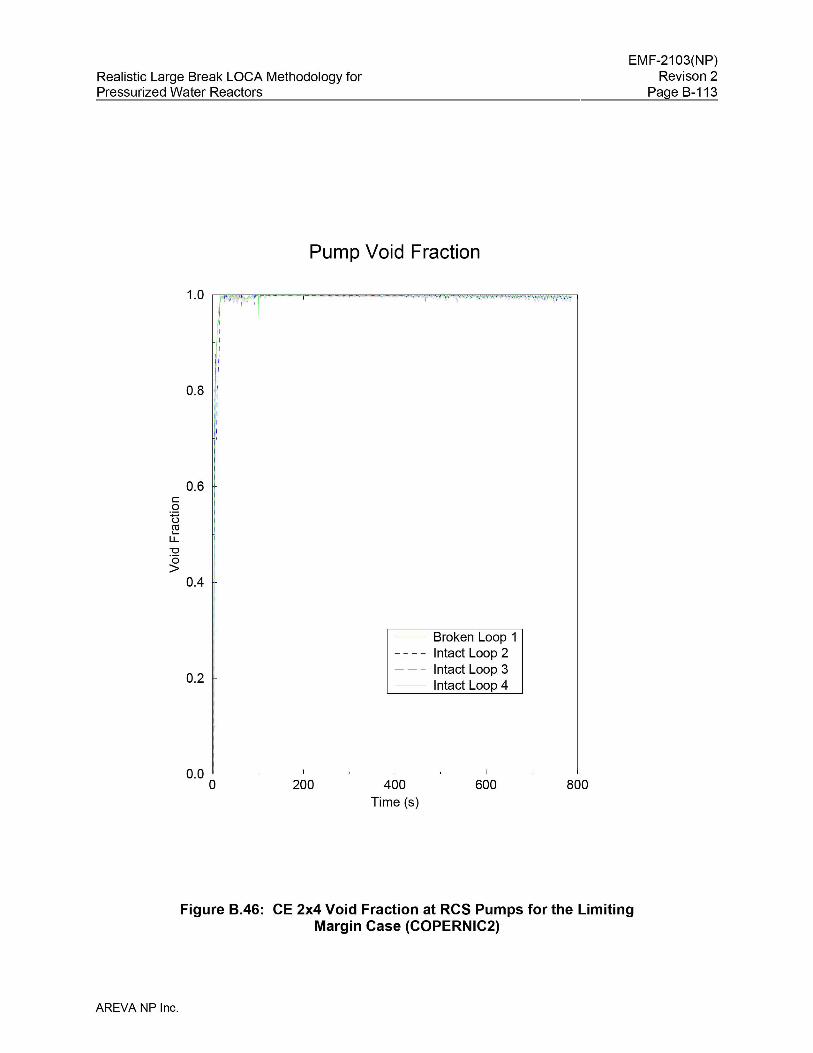
Realistic Large Break LOCA Methodology forPressurized Water Reactors
EMF-2103(NP)Revison 2
Page B-113
Pump Void Fraction
,,
1:I
",
0.8 ~
"III
0.6con~
l.L"0·0>
0.4
0.2 -
-- Broken Loop 1Intact Loop 2Intact Loop 3Intact Loop 4
800600400Time (s)
2000.0 U__~__l.--_~__--'-----_~__---'-----_~__---.J
o
Figure B.46: CE 2x4 Void Fraction at RCS Pumps for the LimitingMargin Case (COPERNIC2)
AREVA NP Inc.
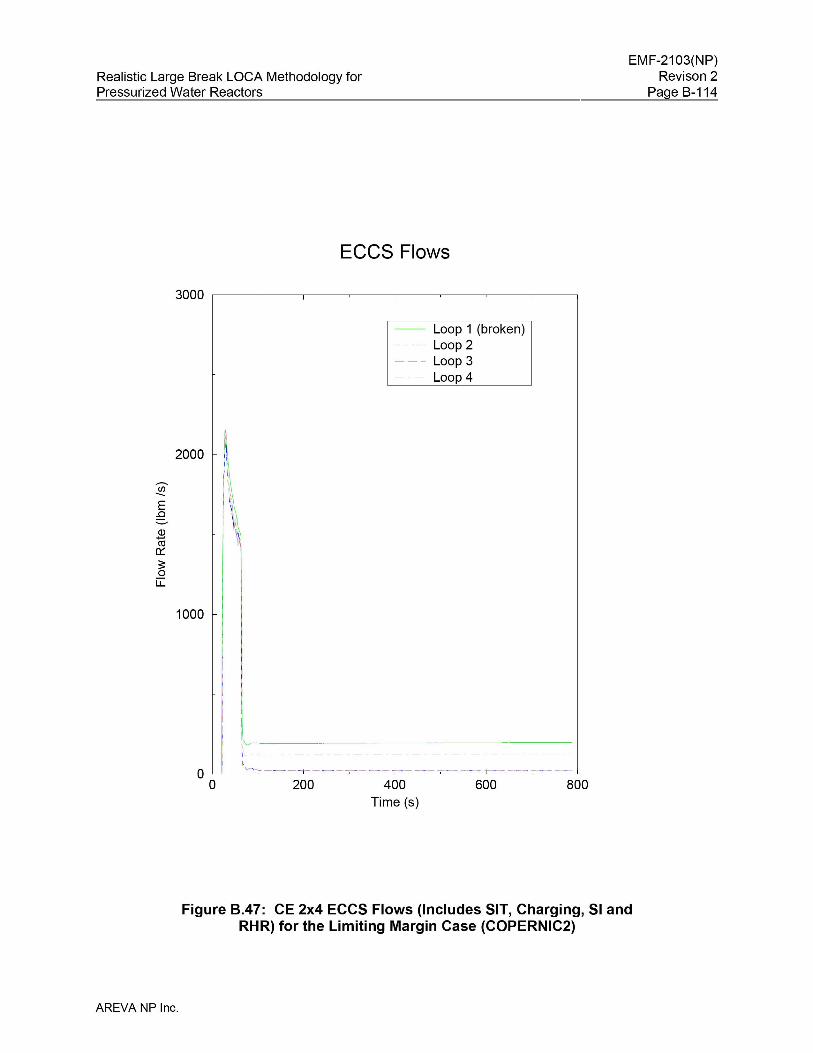
Realistic Large Break LOCA Methodology forPressurized Water Reactors
EMF-2103(NP)Revison 2
Page B-114
ECCS Flows
3000 r---~-------,--~------r--~------,---~------,
-- Loop 1 (broken)- - - - Loop 2--- Loop 3
Loop 4
2000 ,r;; If
-- \E \1.0
\Q)- Iro0:::3:0
u::
1000
800600400Time (s)
200
lo L-'--_v~-",=-=-==-=--=..:-==-=-==-=-==--=-=-=..:-=-==--=:..r-=-=-=--=.J
o
Figure 8.47: CE 2x4 ECCS Flows (Includes SIT, Charging, 51 andRHR) for the Limiting Margin Case (COPERNIC2)
AREVA NP Inc.
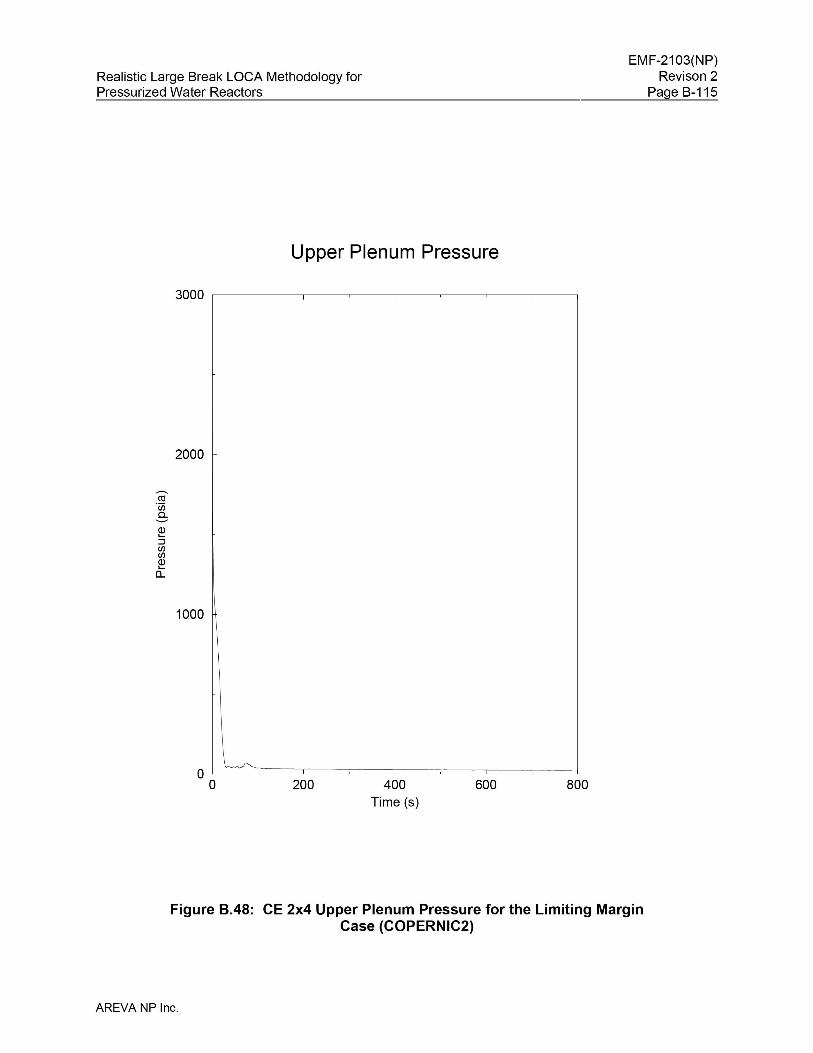
Realistic Large Break LOCA Methodology forPressurized Water Reactors
Upper Plenum Pressure
3000 ,----~---,----~---,------~-----.----~-----,
2000
Cil·UiD..
----Q)'-:::JenenQ)'-a..
1000
EMF-2103(NP)Revison 2
Page B-115
OL-r--o 200 400
Time (s)600 800
Figure B.48: CE 2x4 Upper Plenum Pressure for the Limiting MarginCase (COPERNIC2)
AREVA NP Inc.
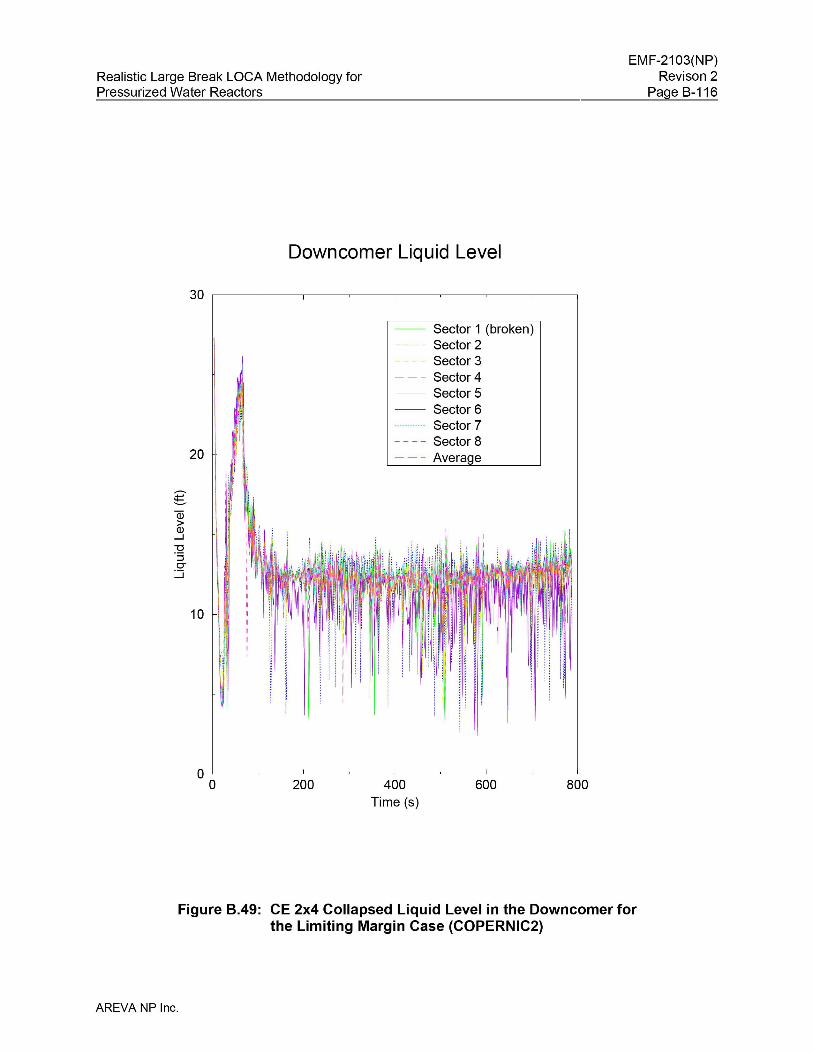
Realistic Large Break LOCA Methodology forPressurized Water Reactors
EMF-2103(NP)Revison 2
Page B-116
Downcomer Liquid Level
30 ,------~----,----~------,---~------.--~-------,
Ii,
20 I
I:I-~
Q3 ,I>Q)
....J
~:::JCJ
:.::::i
10
-- Sector 1 (broken)Sector 2Sector 3
- - - Sector 4Sector 5
-- Sector 6............ Sector 7- - - - Sector 8- - - Average
800600400Time (s)
200O'------~-----'-------~-------'-----~-------'---~------.J
o
Figure 8.49: CE 2x4 Collapsed Liquid Level in the Downcomer forthe Limiting Margin Case (COPERNIC2)
AREVA NP Inc.
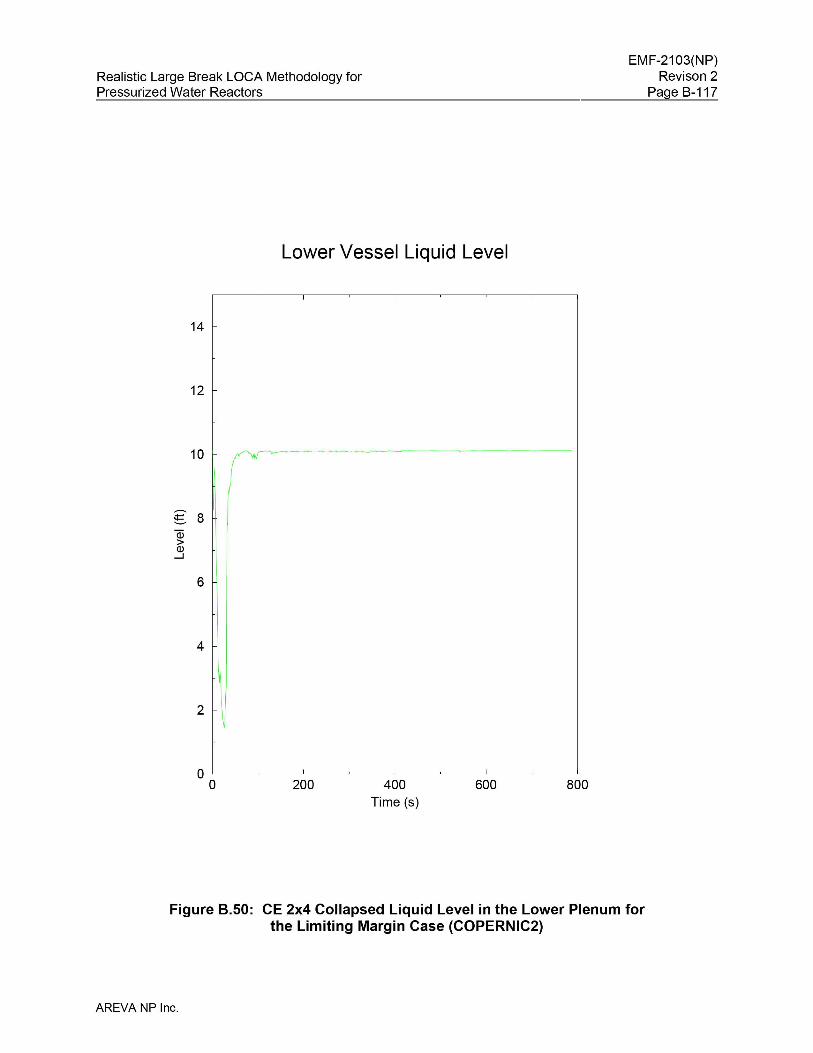
Realistic Large Break LOCA Methodology forPressurized Water Reactors
EMF-2103(NP)Revison 2
Page B-117
Lower Vessel Liquid Level
14
12
10
g 8Q)
>Q)
....J
6
4
2
800600400Time (s)
200OL--_~-------'--~_-----.l_-~------'---~------'
o
Figure B.50: CE 2x4 Collapsed Liquid Level in the Lower Plenum forthe Limiting Margin Case (COPERNIC2)
AREVA NP Inc.
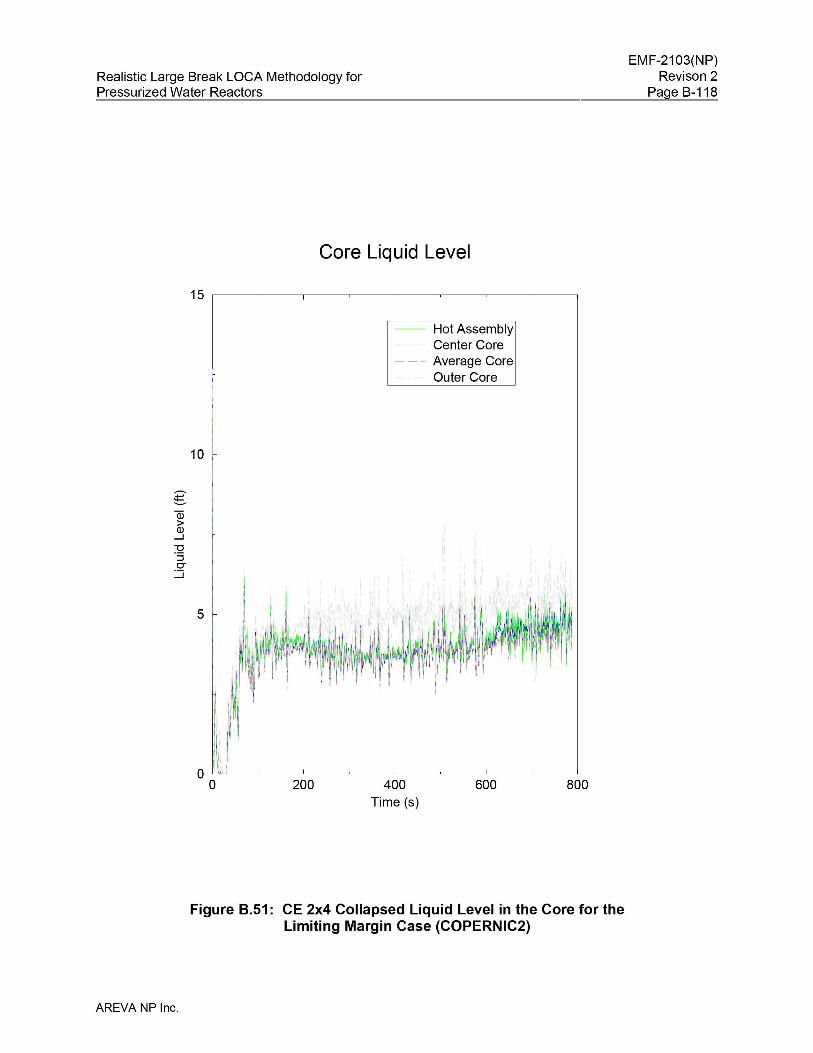
Realistic Large Break LOCA Methodology forPressurized Water Reactors
EMF-2103(NP)Revison 2
Page B-118
Core Liquid Level
15 ,----~---,----~---,------~-----.----~-----,
-- Hot Assembly- - - - Center Core- - - Average Core
Outer Core
10
-~Q3>Q)
....J
~:::JCJ
:.::::i
5
~ll~I
Ii
Jll0 200 400 600 800
Time (s)
Figure 8.51: CE 2x4 Collapsed Liquid Level in the Core for theLimiting Margin Case (COPERNIC2)
AREVA NP Inc.
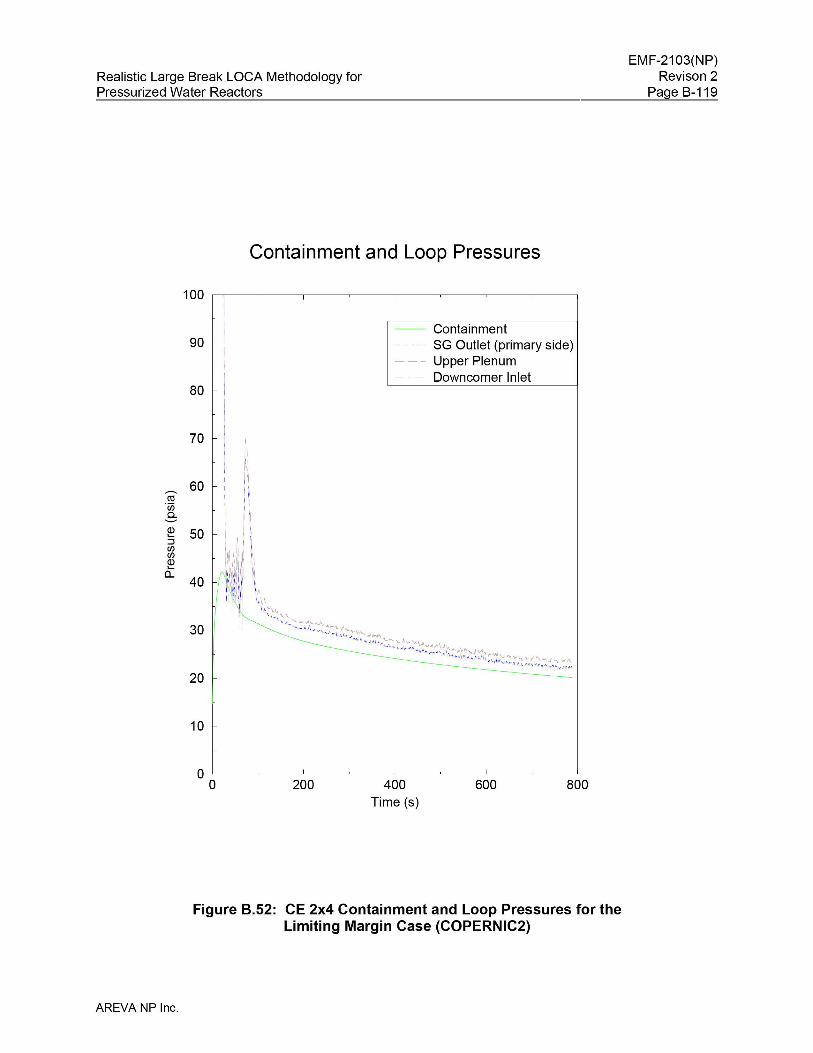
Realistic Large Break LOCA Methodology forPressurized Water Reactors
EMF-2103(NP)Revison 2
Page B-119
Containment and Loop Pressures
-- Containment- - - - SG Outlet (primary side)- - - Upper Plenum
Downcomer Inlet
90
20
100 '------'----1-~-,-----~---,------~----.-----~-------,
II
80
70
60co·en0..
Q) 50......::JrnrnQ)......
0..40
30
10
800600400Time (s)
200o L-_~__l.--_~__--'-----_~__---'-----_~__---.J
o
Figure 8.52: CE 2x4 Containment and Loop Pressures for theLimiting Margin Case (COPERNIC2)
AREVA NP Inc.
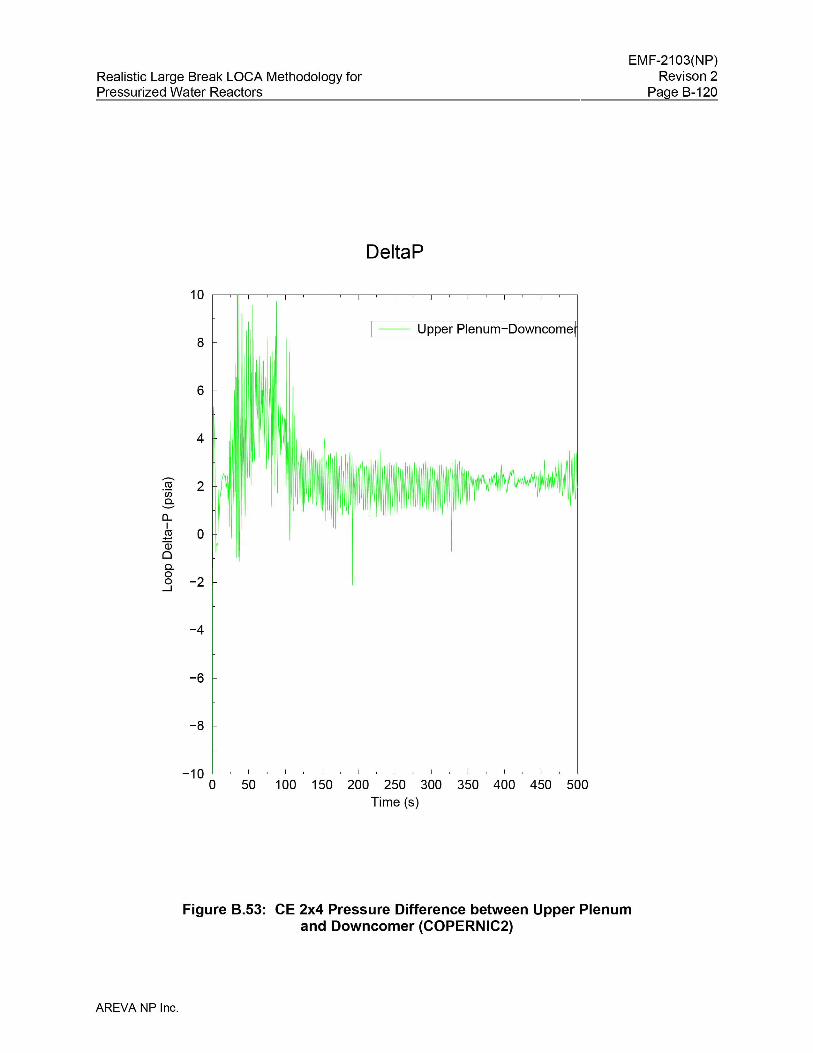
Realistic Large Break LOCA Methodology forPressurized Water Reactors
DeltaP
-- Upper Plenum-Downcome8
6
ro 2·000--0...ICll 0-(ij00-0
-20...J
-4
-6
-8
-1 0 L-~L-~-'-----~-l.--~-'-----~--'-----~--'-----~---'-----~---'-----~---'----~---.J
o 50 100 150 200 250 300 350 400 450 500Time (s)
EMF-2103(NP)Revison 2
Page B-120
Figure 8.53: CE 2x4 Pressure Difference between Upper Plenumand Downcomer (COPERNIC2)
AREVA NP Inc.
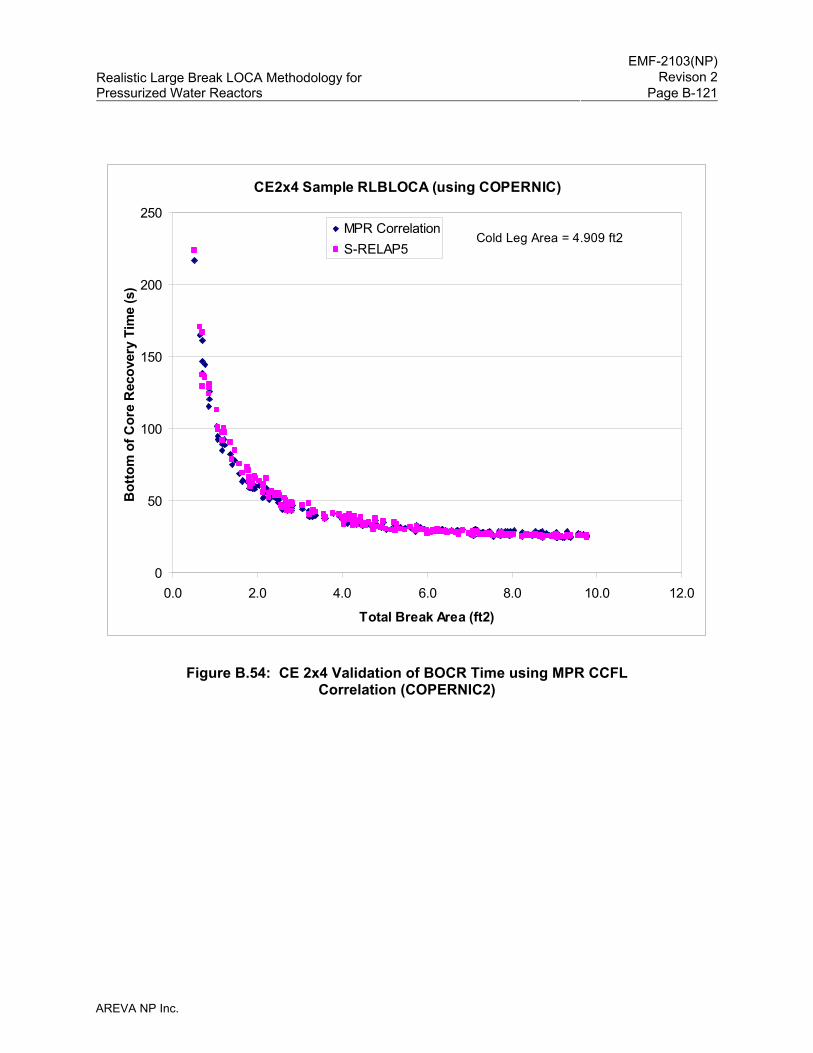
EMF-2103(NP)
Revison 2Realistic Large Break LOCA Methodology for Pressurized Water Reactors Page B-121
AREVA NP Inc.
CE2x4 Sample RLBLOCA (using COPERNIC)
0
50
100
150
200
250
0.0 2.0 4.0 6.0 8.0 10.0 12.0
Total Break Area (ft2)
Bot
tom
of C
ore
Rec
over
y Ti
me
(s)
MPR CorrelationS-RELAP5
Cold Leg Area = 4.909 ft2
Figure B.54: CE 2x4 Validation of BOCR Time using MPR CCFL Correlation (COPERNIC2)
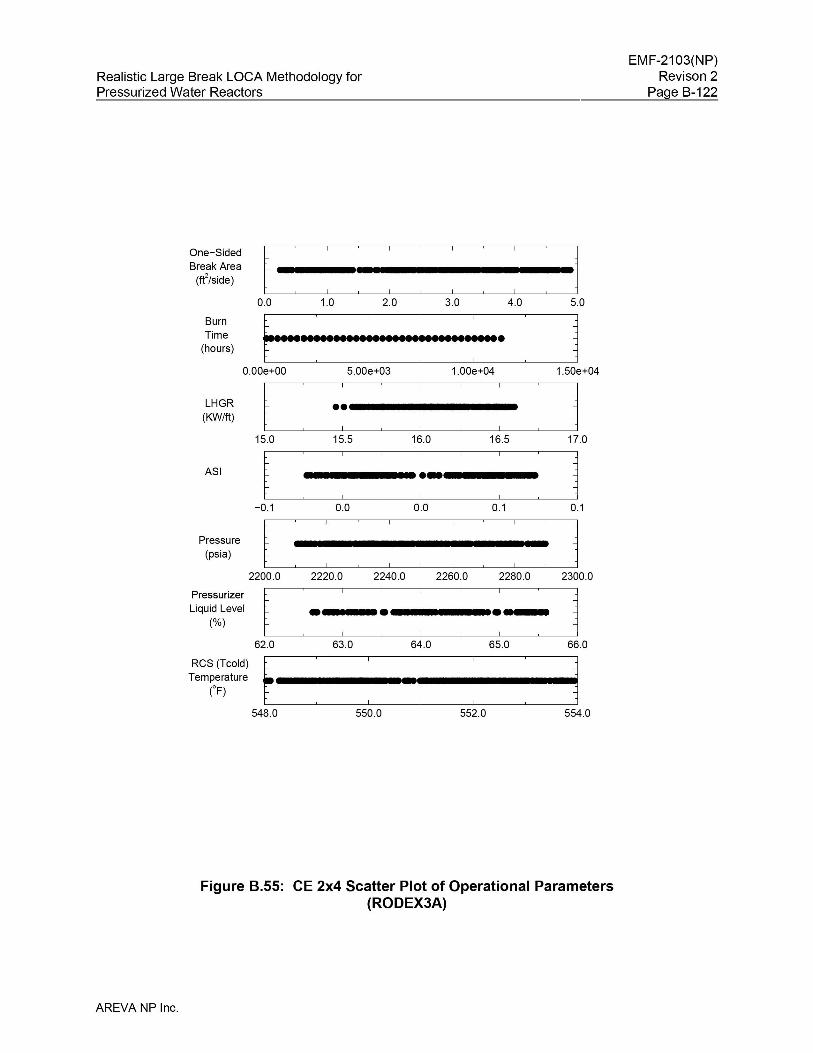
Realistic Large Break LOCA Methodology forPressurized Water Reactors
One-Sided
Break Area(ft
2/side)
EMF-2103(NP)Revison 2
Page B-122
0.0 1.0 2.0 3.0 4.0
BurnTime
(hours)
LHGR(KW/ft)
ASI
f""-OO-.: : :- : .O.OOe+OO 5.00e+03 1.00e+04
Pressure(psia)
PressurizerLiquid Level
(%)
-0.1 0.0
Figure B.55: CE 2x4 Scatter Plot of Operational Parameters(RODEX3A)
AREVA NP Inc.

Realistic Large Break LOCA Methodology forPressurized Water Reactors
EMF-2103(NP)Revison 2
Page B-123
ContainmentVolume
(ft3)
SITTemperature
(oF)
140.0
TotalLoop Flow
(Mlb/hr)
SIT LiquidVolume
(ft3)
SITPressure
(psia)
f---~-, •150.0 160.0 170.0
t : :: J :-: ~ ~ ~ -: 11080.0 1100.0 1120.0 1140.0 1160.0 1180.0
f • ~ ~ ~. ~ ~ ~ ~ ~ 1200.0 220.0 240.0 260.0 280.0 300.0
l ~ ~ : ~ ~ ~ : 12.45e+06 2.50e+06 2.55e+06 2.60e+06 2.65e+06
f,:.:. ~: ~: ~: ~: ~,:, :1110.0 112.0 114.0 116.0 118.0 120.0 122.0 124.0 126.0 128.0 130.0
Figure B.55: CE 2x4 Scatter Plot of Operational Parameters(RODEX3A) (continued)
AREVA NP Inc.
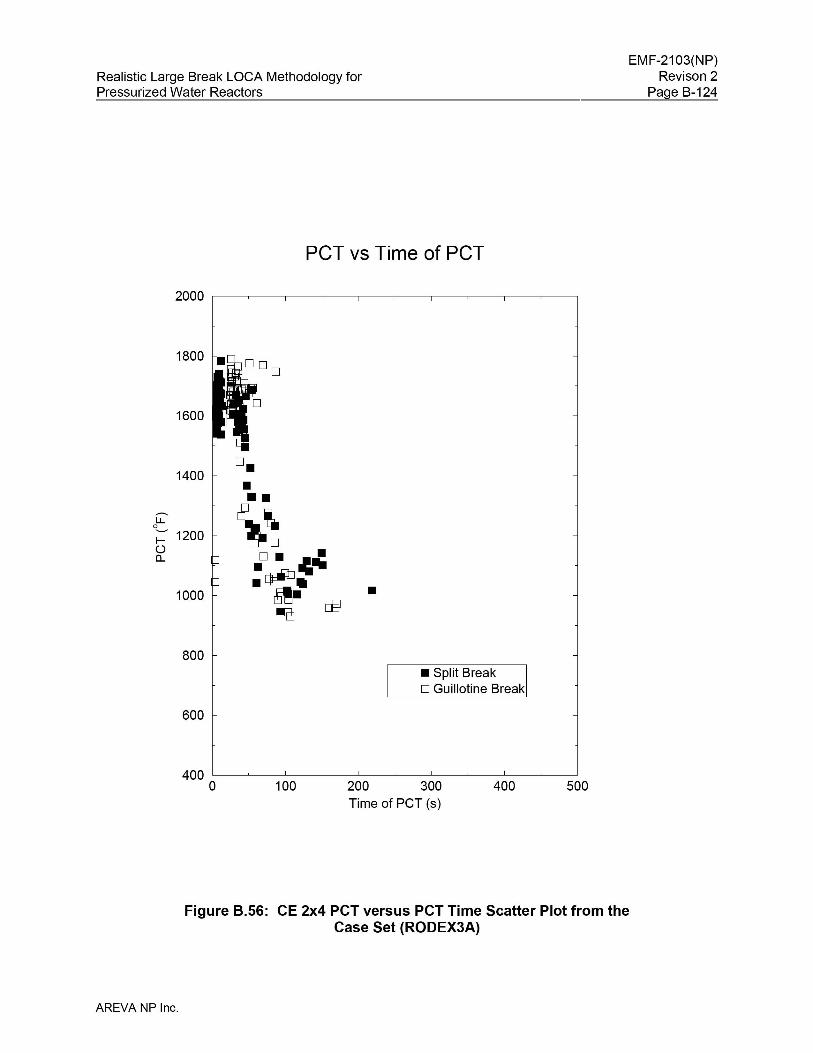
Realistic Large Break LOCA Methodology forPressurized Water Reactors
EMF-2103(NP)Revison 2
Page B-124
PCT vs Time of PCT
2000 r--~-~-~------r------r-----,------'-------r-~------;
1600
1400
-u...0;:- 1200()a..
1000 •
800• Split BreakD Guillotine Break
600
500400200 300Time of PCT (s)
100400 L--~_------'_~_-----'-_~_-----"-_~_-----"-_~_-----.J
o
Figure 8.56: CE 2x4 PCT versus PCT Time Scatter Plot from theCase Set (RODEX3A)
AREVA NP Inc.
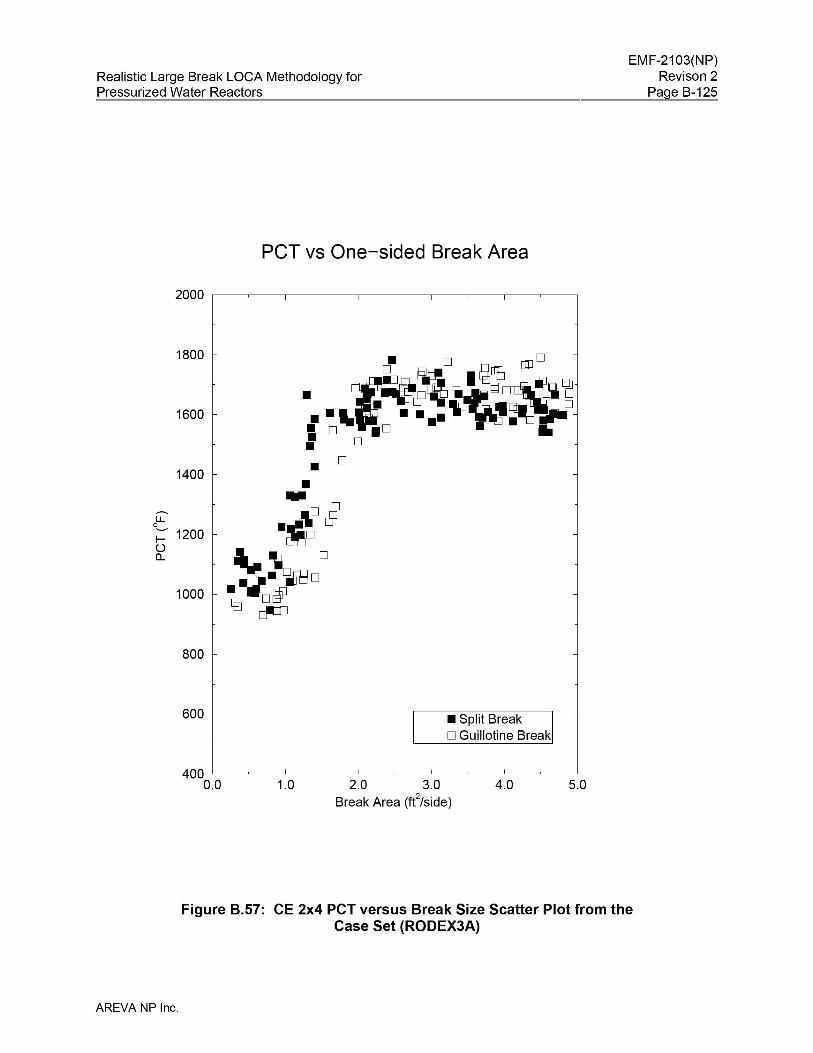
Realistic Large Break LOCA Methodology forPressurized Water Reactors
EMF-2103(NP)Revison 2
Page B-125
peT vs One-sided Break Area
2000 r--~-~-~------r------r-----,--~-~-~------;
1800
1600
1400
-u...0;:- 1200()a..
1000
• D [[JD
~~ I~ IiJ [Q]• Jr~rr-..~CO.,~QI. B.... •••1t"~·D'". D·.·.• D •• D
D
800
600 • Split BreakD Guillotine Break
5.04.02.0 3.0Break Area (fe/side)
1.0400 L--~_------'_~_-----'-_~_-----"-_~_-----"-_~_-----.J
0.0
Figure B.57: CE 2x4 PCT versus Break Size Scatter Plot from theCase Set (RODEX3A)
AREVA NP Inc.
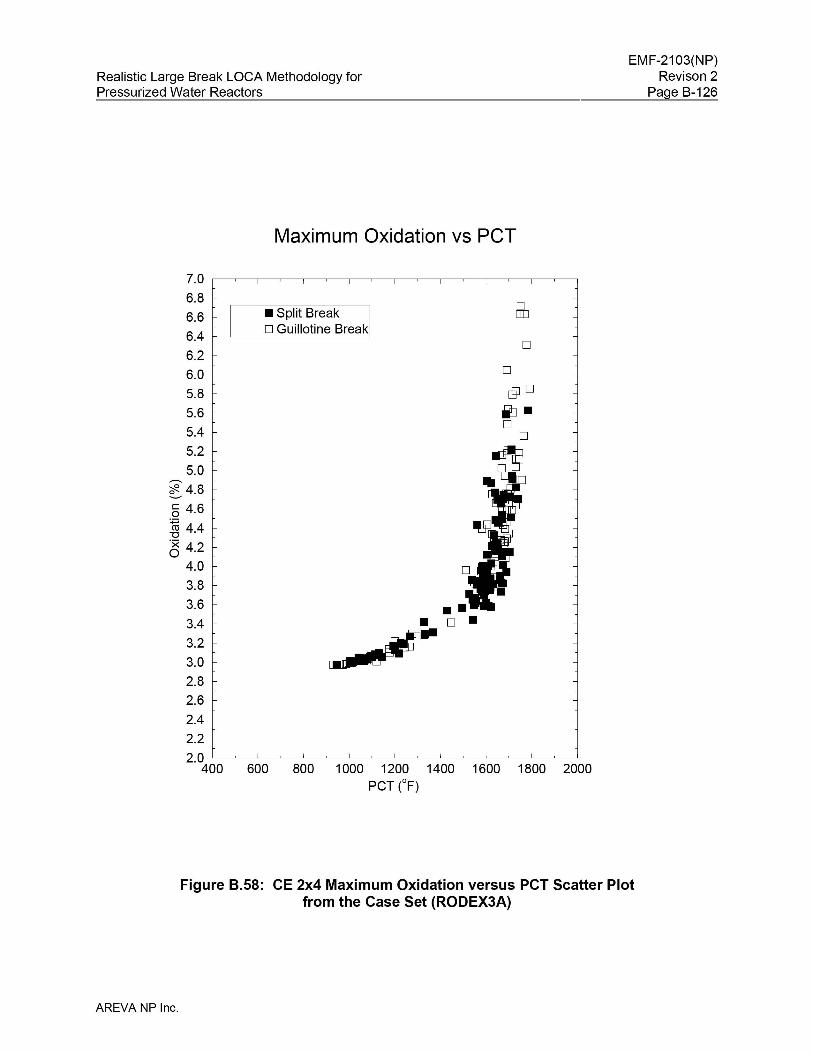
Realistic Large Break LOCA Methodology forPressurized Water Reactors
Maximum Oxidation vs peT
7.0
6.85b6.6 • Split Break
6.4D Guillotine Break
D6.2
6.0 D
5.8 @D
5.6 iJ·5.4
DD
5.2
5.0-~4.8
6 4.6
~ 4.4
6 4.2
4.0
3.8
3.6
3.4 •3.2 ~..3.0
2.8
2.6
2.4
2.2
2.0400 600 800 1000 1200 1400 1600 1800 2000
PCT CF)
EMF-2103(NP)Revison 2
Page B-126
Figure B.58: CE 2x4 Maximum Oxidation versus PCT Scatter Plotfrom the Case Set (RODEX3A)
AREVA NP Inc.
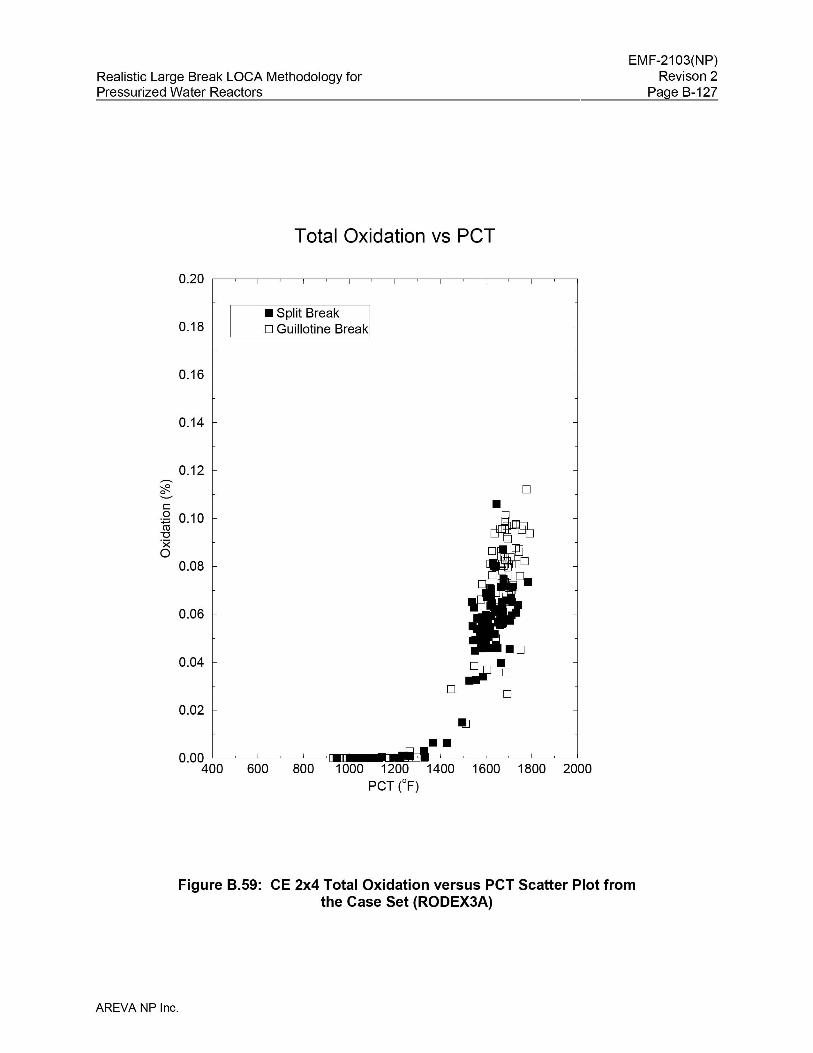
Realistic Large Break LOCA Methodology forPressurized Water Reactors
Total Oxidation vs peT
EMF-2103(NP)Revison 2
Page B-127
0.20
• Split Break0.18 D Guillotine Break
0.16
0.14
0.12~
::f2..0-c0 0.10~"'0·x0
0.08
0.06
0.04
D
0.02
••
D
0.00 ~-,-----:=~~=-----,~~-~!!IfEI~=-=-~~~=~~400 600 800 1000 1200 1400 1600 1800 2000
PCT CF)
Figure 8.59: CE 2x4 Total Oxidation versus PCT Scatter Plot fromthe Case Set (RODEX3A)
AREVA NP Inc.
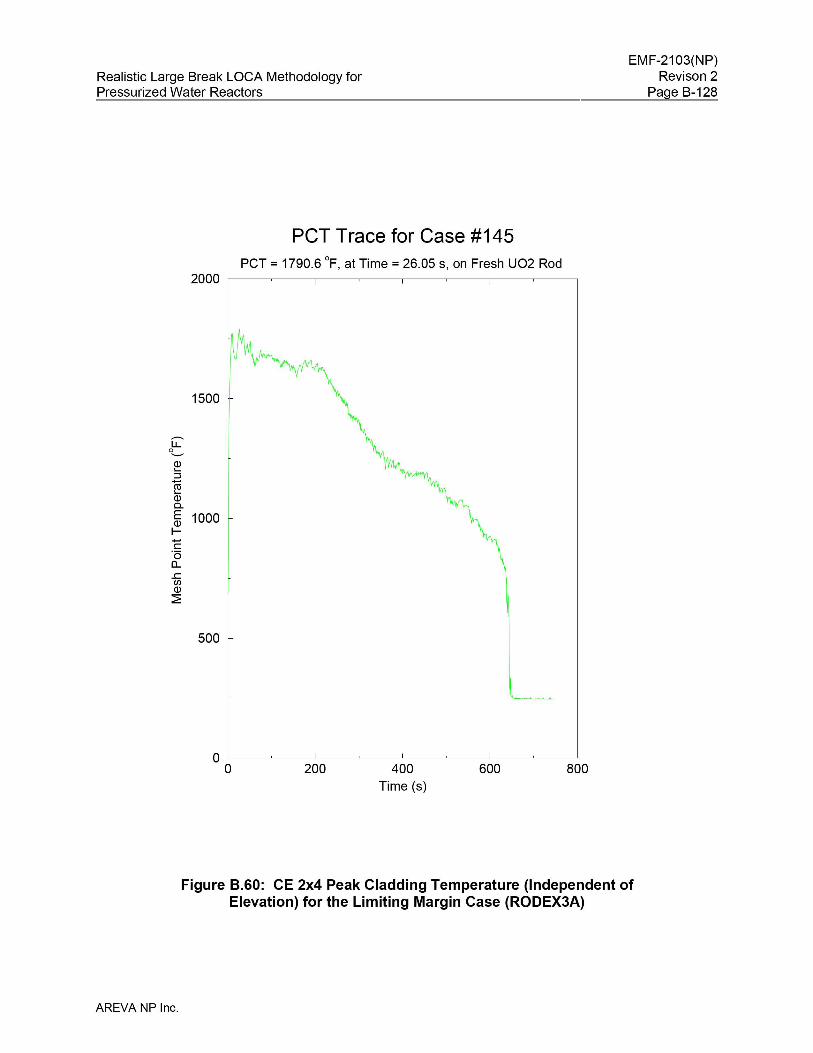
Realistic Large Break LOCA Methodology forPressurized Water Reactors
EMF-2103(NP)Revison 2
Page B-128
PCT Trace for Case #145PCT = 1790.6 of, at Time = 26.05 s, on Fresh U02 Rod
2000 ,----~-----,--~-----,---~------,---~----,
800600400Time (s)
200OL---~------'--~------'----~------'----~----.J
o
1500
-l.L0_
0).....::::l
m.....0)0..E 10000)
l-e"0a....cUl0)
~
500
Figure 8.60: CE 2x4 Peak Cladding Temperature (Independent ofElevation) for the Limiting Margin Case (RODEX3A)
AREVA NP Inc.
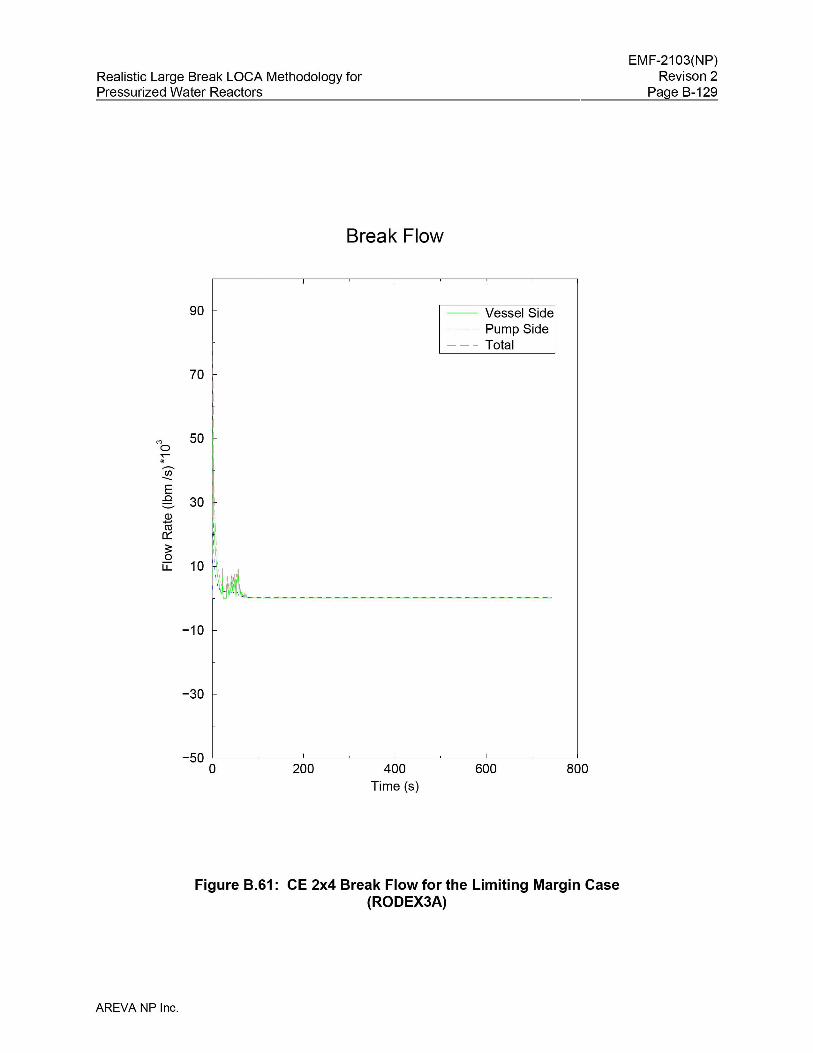
Realistic Large Break LOCA Methodology forPressurized Water Reactors
EMF-2103(NP)Revison 2
Page B-129
Break Flow
90 -- Vessel Side- - - - Pump Side--- Total
70
'" 500.,...-~
00--E..Cl 30(l)-ctl
0:::3:0
u:::: 10
-10
-30
800600400Time (s)
200-50 '-----_~____'______~__-----'---__~_ _____'___~_ ______.J
o
Figure B.61: CE 2x4 Break Flow for the Limiting Margin Case(RODEX3A)
AREVA NP Inc.
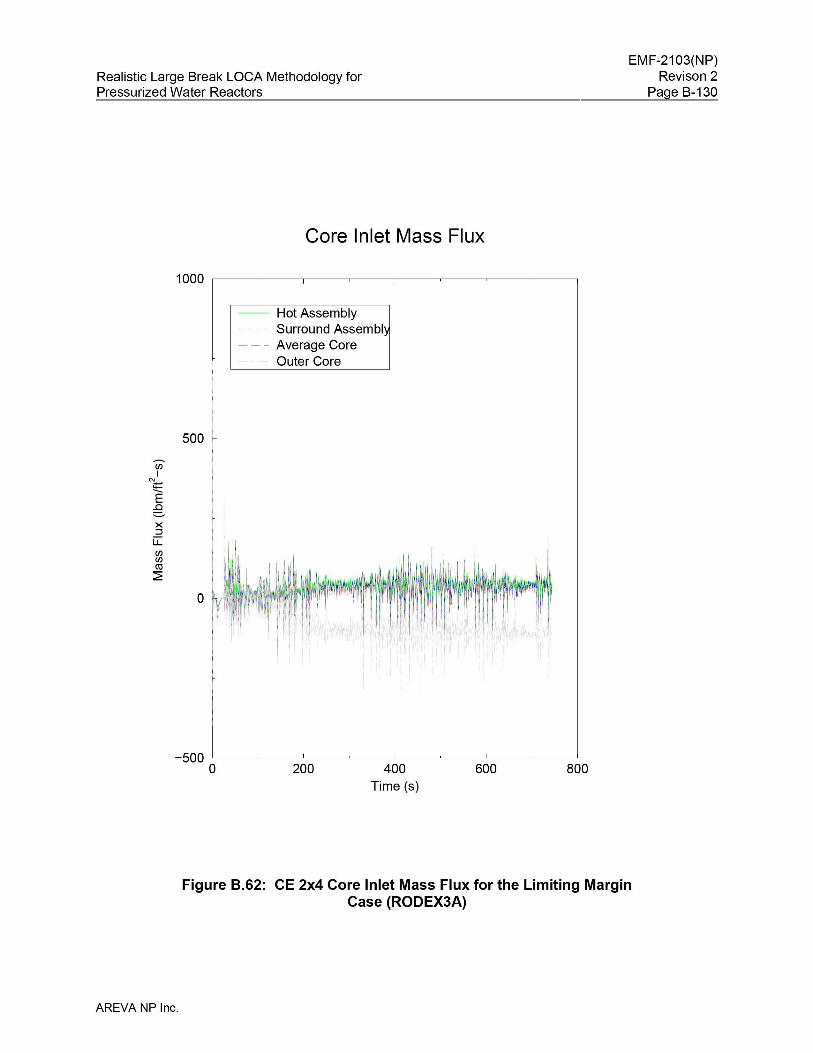
Realistic Large Break LOCA Methodology forPressurized Water Reactors
EMF-2103(NP)Revison 2
Page B-130
Core Inlet Mass Flux
1000 ,----~--_,___-~---,------~--___r_-~--___,
-- Hot Assembly- - - - Surround Assembly- - - Average Core
Outer Core
500
UlI
N~
E..Cl:::::;..
X::::l
u::::UlUlco~
800600400Time (s)
200-500 '-----_~____'______~__-----'---__~_ _____'___~_ ______.J
o
Figure 8.62: CE 2x4 Core Inlet Mass Flux for the Limiting MarginCase (RODEX3A)
AREVA NP Inc.
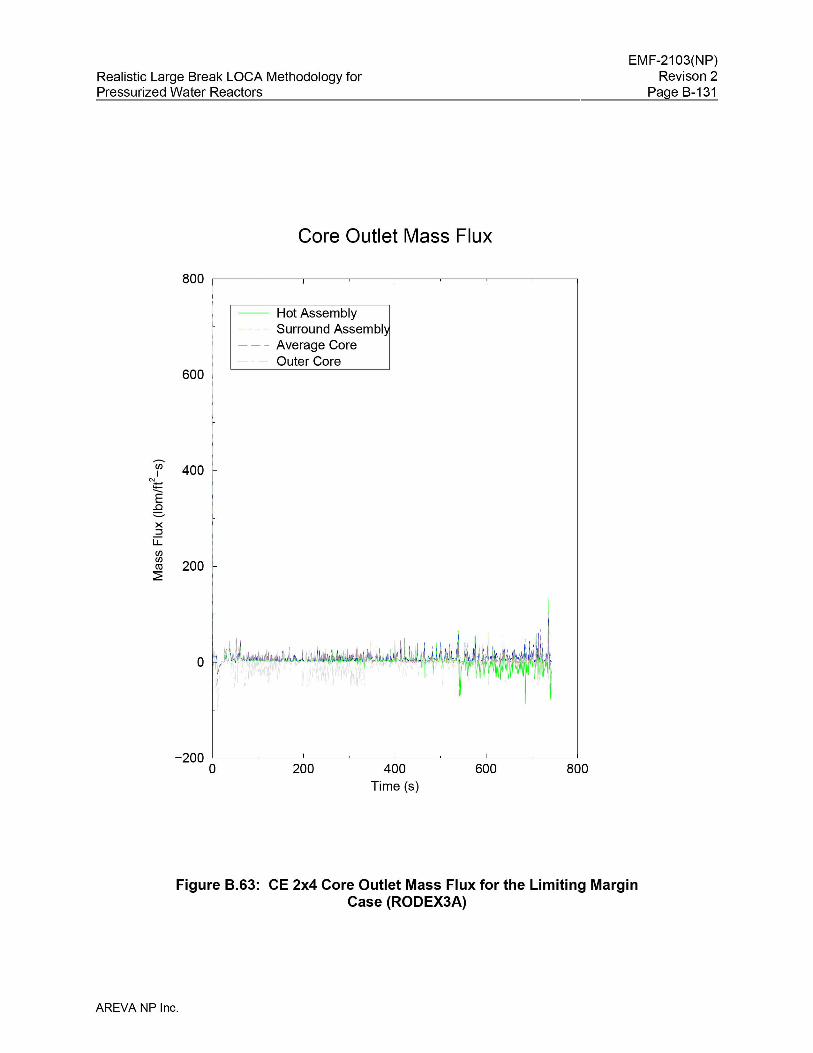
Realistic Large Break LOCA Methodology forPressurized Water Reactors
EMF-2103(NP)Revison 2
Page B-131
Core Outlet Mass Flux
800 ,----~-______,--~-----,--~-_____r--~-_____,
-- Hot Assembly- - - - Surround Assembly- - - Average Core
Outer Core600
Ul 400IN;t=-..E
..Cl:::::;..
X::::l
u::::UlUl
200co~
800600400Time (s)
200-200 L--_~_------'__~_-----.L__~_-----'--__~_-----'
o
Figure 8.63: CE 2x4 Core Outlet Mass Flux for the Limiting MarginCase (RODEX3A)
AREVA NP Inc.
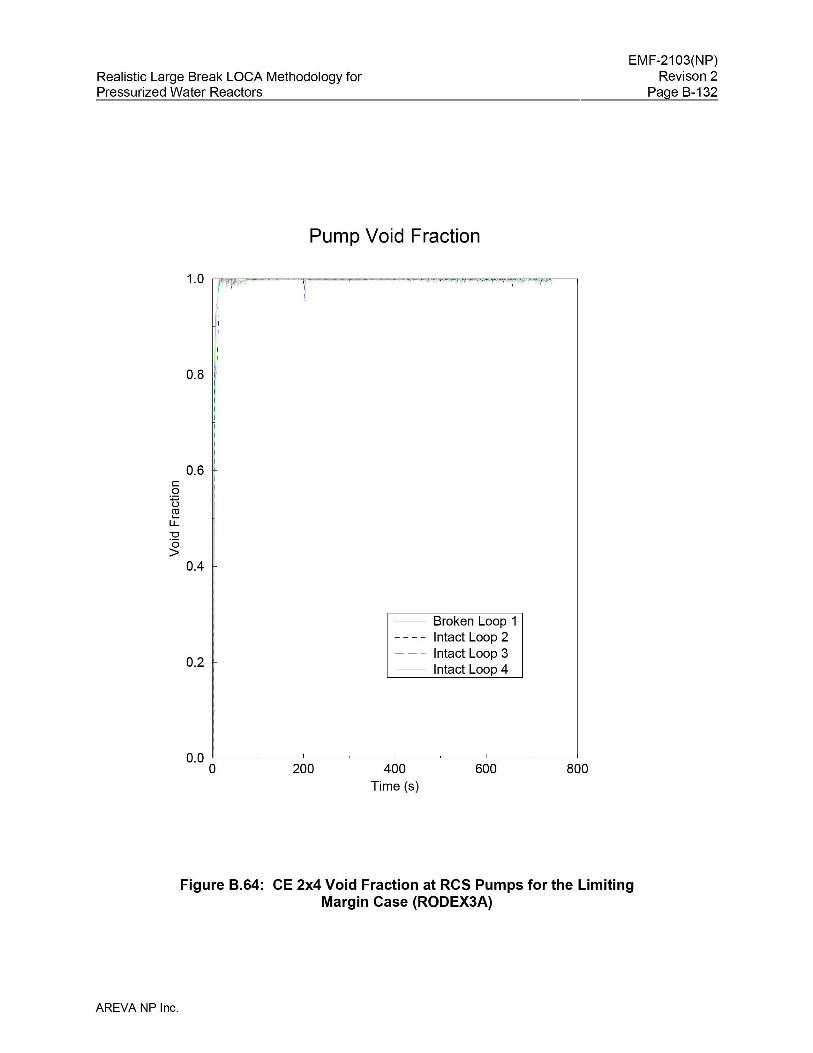
Realistic Large Break LOCA Methodology forPressurized Water Reactors
EMF-2103(NP)Revison 2
Page B-132
Pump Void Fraction
1"'\
0.8
0.6con~
LL"0·0>
0.4
0.2 -
-- Broken Loop 1Intact Loop 2Intact Loop 3Intact Loop 4
800600400Time (s)
2000.0 L--_~__--'-----_~__-----'---__~_-----'-__~_------.J
o
Figure 8.64: CE 2x4 Void Fraction at RCS Pumps for the LimitingMargin Case (RODEX3A)
AREVA NP Inc.
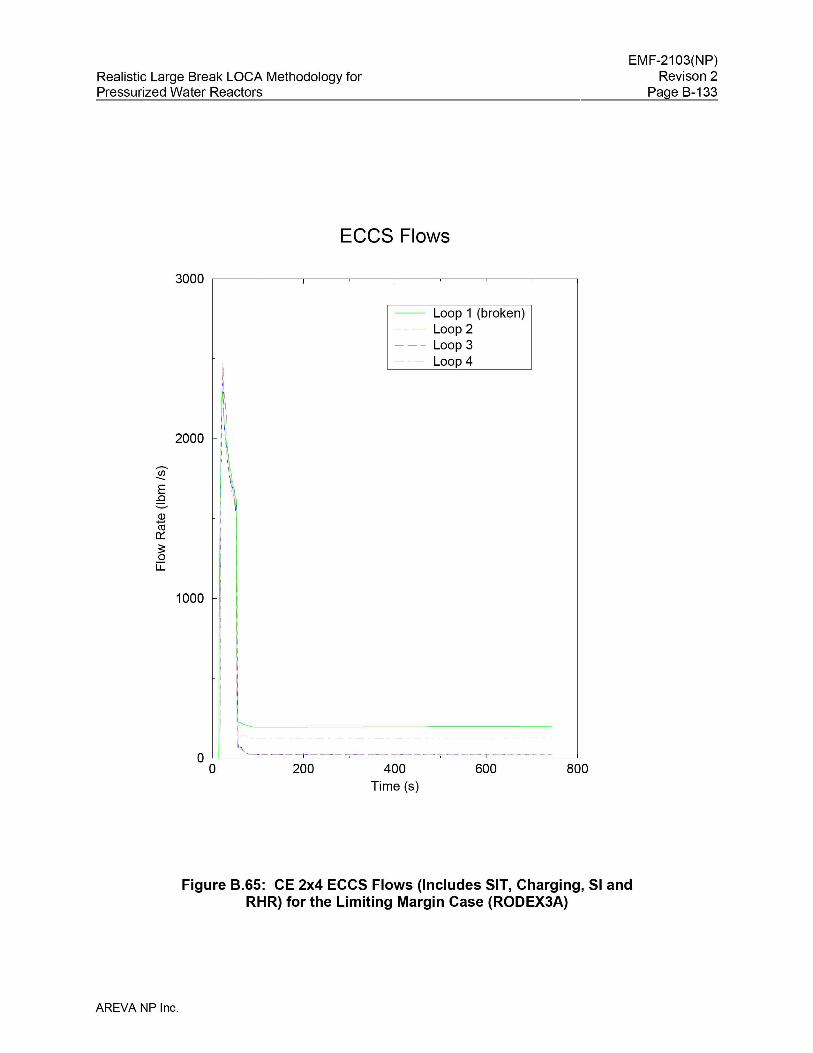
Realistic Large Break LOCA Methodology forPressurized Water Reactors
EMF-2103(NP)Revison 2
Page B-133
ECCS Flows
3000 ,----~--_,___-~---,------~--___r_-~--___,
-- Loop 1 (broken)- - - - Loop 2--- Loop 3
Loop 4
2000
E.0
Q)-Cil0::3:o
u::
1000
800600400Time (s)
200
I
I
: ~o LJ!I_~_'-~------'-----=--_-:L------'-----=---"--=-==--.c-=-=-=--=--==-=-===-==-=-=_---'
o
Figure B.65: CE 2x4 ECCS Flows (Includes SIT, Charging, 51 andRHR) for the Limiting Margin Case (RODEX3A)
AREVA NP Inc.
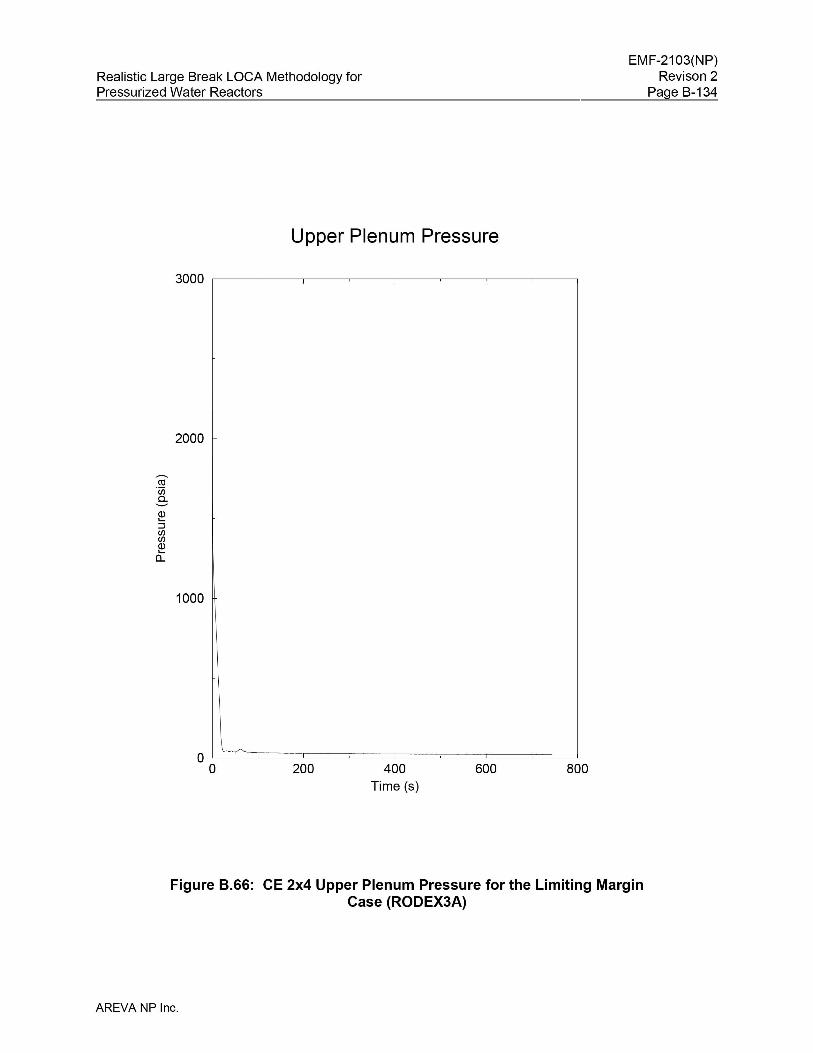
Realistic Large Break LOCA Methodology forPressurized Water Reactors
EMF-2103(NP)Revison 2
Page B-134
Upper Plenum Pressure
3000 ,----~---,----~---,------~--___r_-~--___,
2000
ro·Ui0..
----Q)'-::::lenenQ)'-a..
1000
800600400Time (s)
200
~OL::::::::::":::::=:::;::::=:==============----------Jo
Figure 8.66: CE 2x4 Upper Plenum Pressure for the Limiting MarginCase (RODEX3A)
AREVA NP Inc.
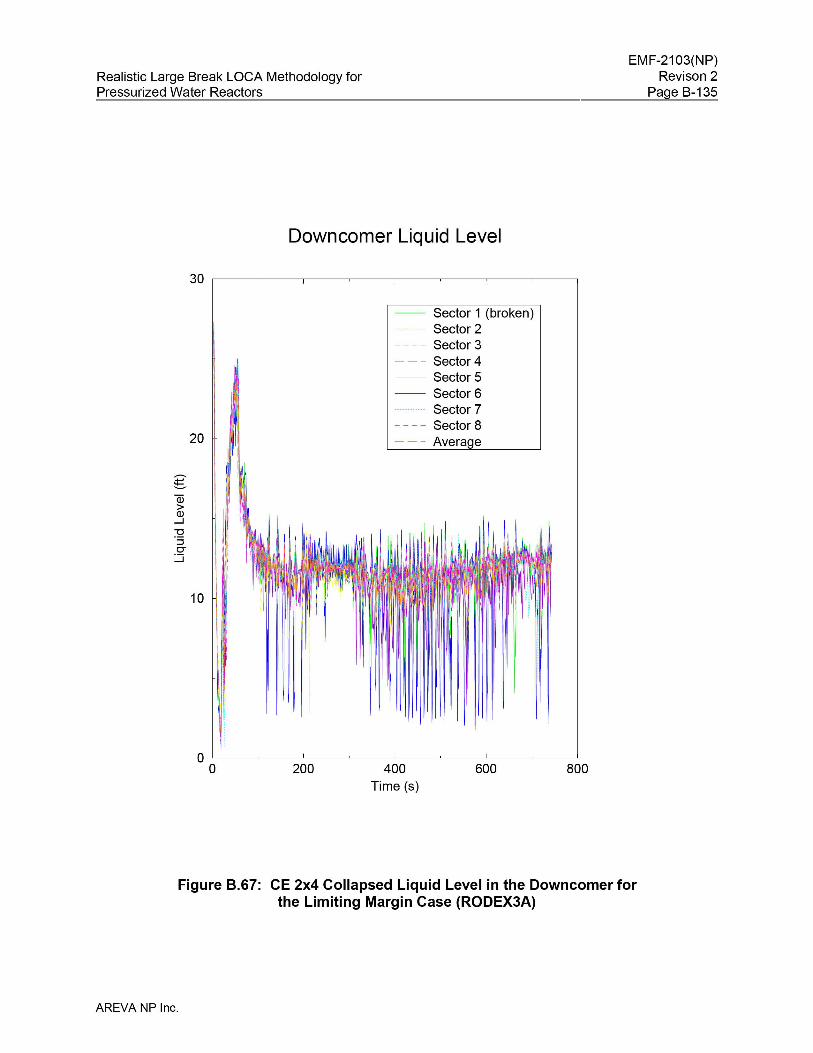
Realistic Large Break LOCA Methodology forPressurized Water Reactors
EMF-2103(NP)Revison 2
Page B-135
Downcomer Liquid Level
30 ,----~---,------~-------,----~------,--~-----,
20
-~Q3>Q)
....J
~:::JCJ
:.::::i
10
-- Sector 1 (broken)Sector 2Sector 3
- - - Sector4Sector 5
-- Sector 6------------ Sector 7- - - - Sector 8- - - Average
800600400Time (s)
200O'------~-----'-------~-------'-----~-------'---~-------.J
o
Figure 8.67: CE 2x4 Collapsed Liquid Level in the Downcomer forthe Limiting Margin Case (RODEX3A)
AREVA NP Inc.
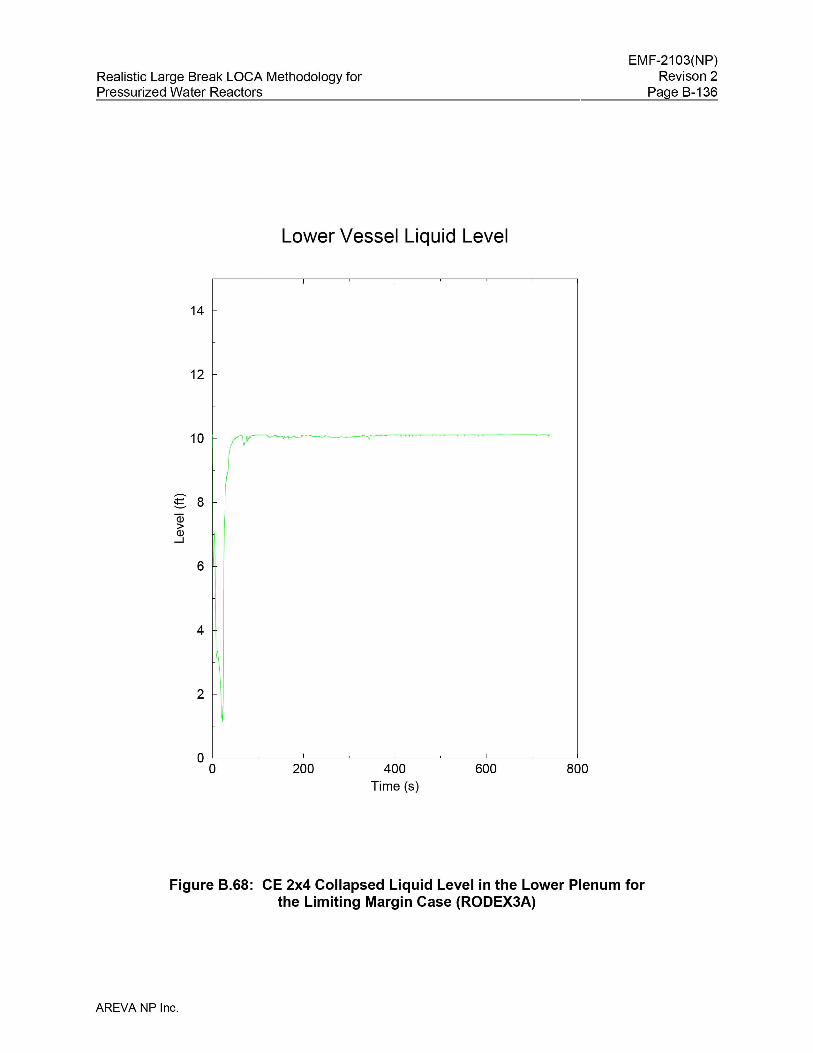
Realistic Large Break LOCA Methodology forPressurized Water Reactors
EMF-2103(NP)Revison 2
Page B-136
Lower Vessel Liquid Level
14
12
10
g 8Q)
>Q)
....J
4
2
800600400Time (s)
200OL--_~-------'--~_-----.L_-~------'----~------'
o
Figure B.68: CE 2x4 Collapsed Liquid Level in the Lower Plenum forthe Limiting Margin Case (RODEX3A)
AREVA NP Inc.
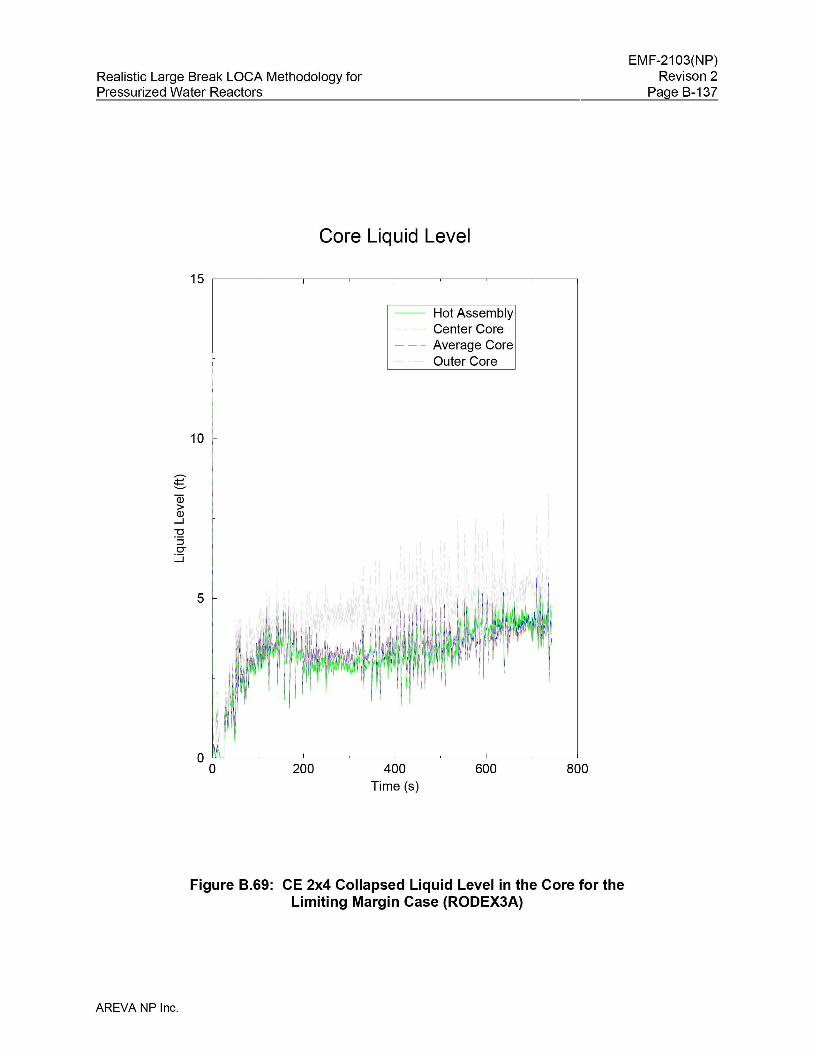
Realistic Large Break LOCA Methodology forPressurized Water Reactors
EMF-2103(NP)Revison 2
Page B-137
Core Liquid Level
15 ,----~--_,___-~---,------~--___r_-~--___,
-- Hot Assembly- - - - Center Core- - - Average Core
Outer Core
800600400Time (s)
200
10
-~Q3>Q)
....J
~:::JCJ
:.::::i
I I
5
Figure 8.69: CE 2x4 Collapsed Liquid Level in the Core for theLimiting Margin Case (RODEX3A)
AREVA NP Inc.
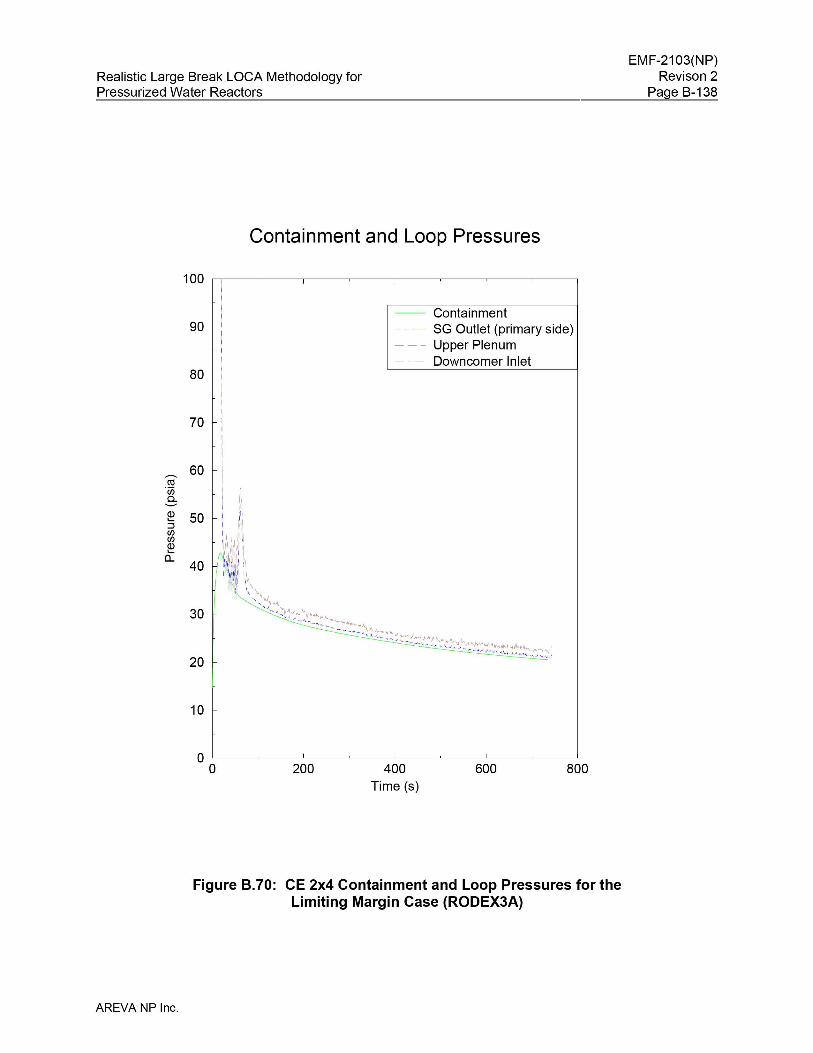
Realistic Large Break LOCA Methodology forPressurized Water Reactors
EMF-2103(NP)Revison 2
Page B-138
Containment and Loop Pressures
20
100II -- ContainmentI
90 I - - - - SG Outlet (primary side)\I - - - Upper PlenumI
IDowncomer Inlet
80
II
70 II
II
60 I
30 I
~ 50:::Jrnrn~
c.. 40
co·w0..
10
800600400Time (s)
200O'-----~----'------~-------'-----~-----'---~------.J
o
Figure 8.70: CE 2x4 Containment and Loop Pressures for theLimiting Margin Case (RODEX3A)
AREVA NP Inc.
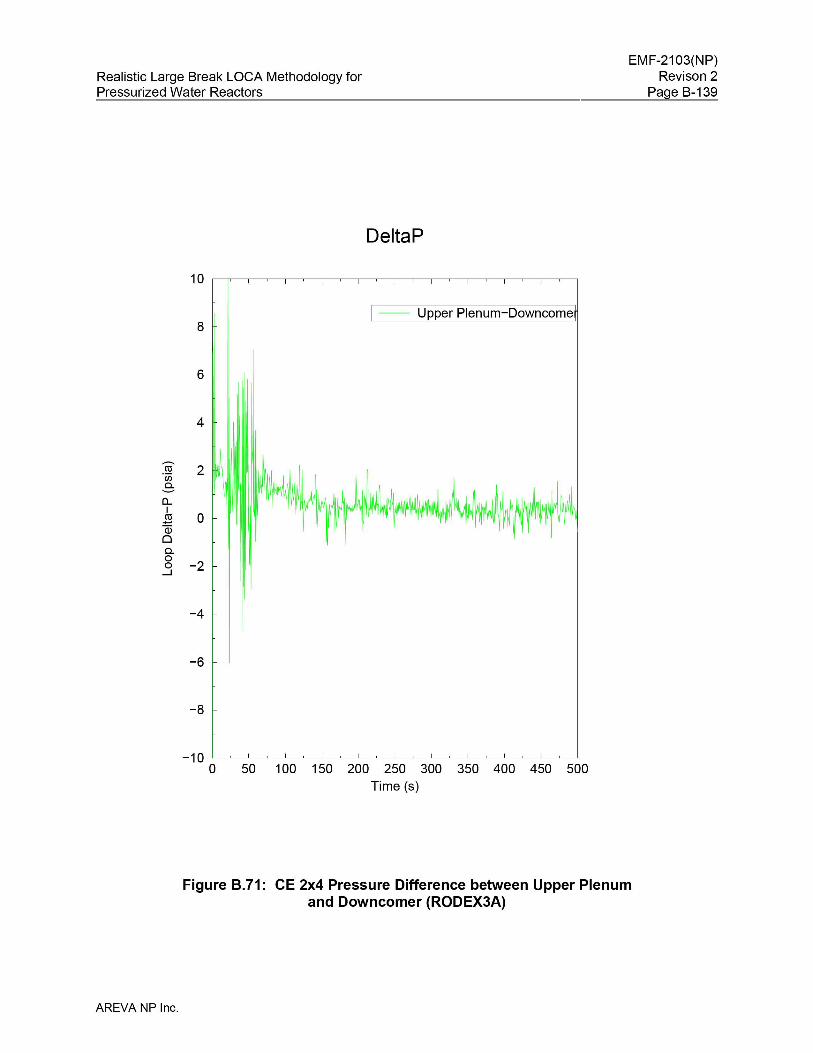
Realistic Large Break LOCA Methodology forPressurized Water Reactors
DeltaP
EMF-2103(NP)Revison 2
Page B-139
10
8 I
6
4I
ro 2·000--0...I
2 0Qj00-0
-20...J
-4
-6
-8
-- Upper Plenum-Downcome
-1 0 '-----~_'_____~--'-----~___'_____~---'----~-----'---~-----'--~-----'-~_____l_~L___'______..J
o 50 100 150 200 250 300 350 400 450 500Time (s)
Figure 8.71: CE 2x4 Pressure Difference between Upper Plenumand Downcomer (RODEX3A)
AREVA NP Inc.
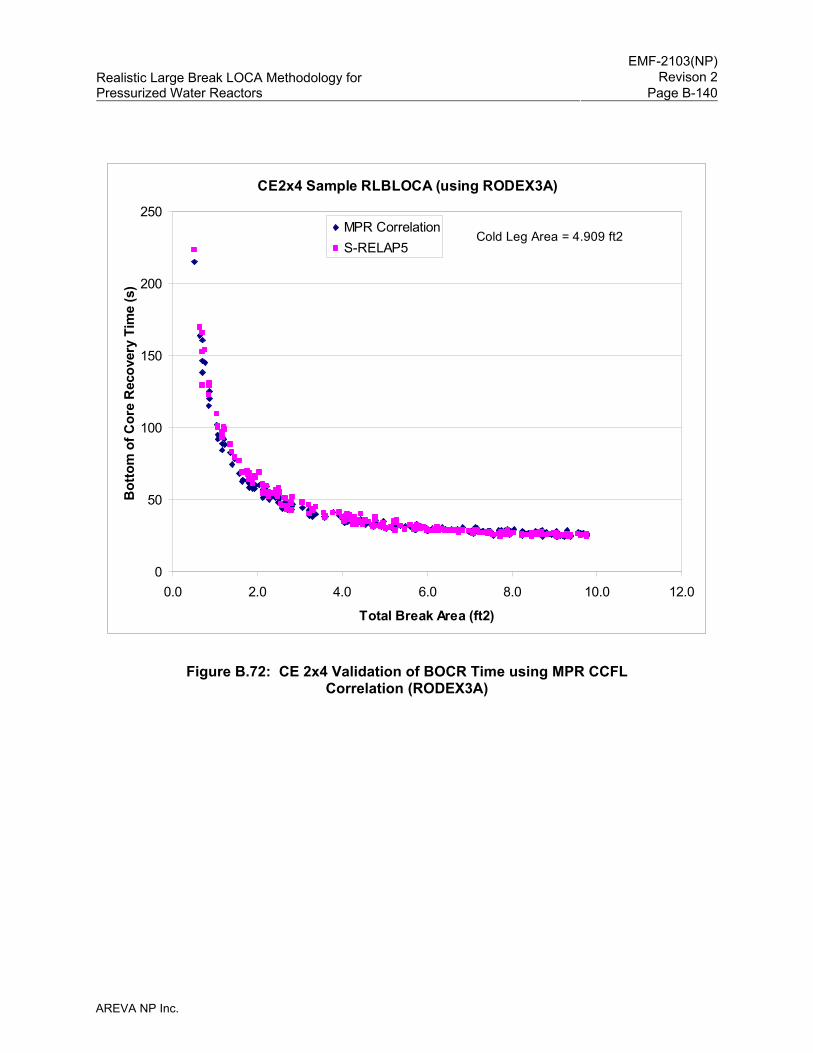
EMF-2103(NP)
Revison 2Realistic Large Break LOCA Methodology for Pressurized Water Reactors Page B-140
AREVA NP Inc.
CE2x4 Sample RLBLOCA (using RODEX3A)
0
50
100
150
200
250
0.0 2.0 4.0 6.0 8.0 10.0 12.0
Total Break Area (ft2)
Bot
tom
of C
ore
Rec
over
y Ti
me
(s)
MPR CorrelationS-RELAP5
Cold Leg Area = 4.909 ft2
Figure B.72: CE 2x4 Validation of BOCR Time using MPR CCFL Correlation (RODEX3A)
EMF-2103(NP)
Revison 2Realistic Large Break LOCA Methodology for Pressurized Water Reactors Page B-141
AREVA NP Inc.
B.5 References
B.1. Technical Program Group, Quantifying Reactor Safety Margins, NUREG/CR-5249, EGG-2552, October 1989.
B.2. EMF-2100(P) Revision 14, S-RELAP5 Models and Correlations Code Manual, December 2009.
B.3. EMF-2102(P) Revision 2, S-RELAP5 Code Verification and Validation, November 2010.
B.4. F. W. Dittus and L. M. K. Boelter, Heat Transfer in Automobile Radiators of the Tubular Type, Publications in Engineering, Volume 2, pp. 443-461, University of California, Berkeley, 1930.
B.5. J. C. Chen, A Correlation for Boiling Heat Transfer to Saturated Fluids in Convective Flow, Process Design and Development, Volume 5, pp. 322-327, 1966.
B.6. N. Zuber, M. Tribus and J. W. Westwater, Hydrodynamic Crisis in Pool Boiling of Saturated and Subcooled Liquid, 2nd International Heat Transfer Conference, Denver, Colorado, 1961.
B.7. Biasi, et al., Studies on Burnout Part 3 - A New Correlation for Round Ducts and Uniform Heating and Its Comparison with World Data, Energia Nucleare, Volume 14, pp. 530-536, 1967.
B.8. J. C. Chen, R. K. Sundaram, F. T. Ozkaynak, A Phenomenological Correlation for Post-CHF Heat Transfer, NUREG-0237, June 1977.
B.9. L. A. Bromley, Heat Transfer in Stable Film Boiling, Chemical Engineering Progress Volume 46, pp. 221-227, 1950.
B.10. E. F. Carpenter and A. P. Colburn, The Effect of Vapor Velocity on Condensation Inside Tubes, Proceedings of General Discussion on Heat Transfer, Institute Mechanical Engineering/American Society of Mechanical Engineers, pp. 20-26, 1951.
B.11. V. H. Ransom, et al., RELAP5/MOD2 Code Manual, Volume 1: Code Structure, Systems Models, and Solution Methods, NUREG/CR-4312, EGG-2396, Revision 1, March 1987.
B.12. K. H. Sun, J. M. Gonzales-Santalo, and C. L. Tien, Calculations of Combined Radiation and Convection Heat Transfer in Rod Bundles Under Emergency Cooling Conditions, Journal of Heat Transfer, pp. 414-420, 1976.
EMF-2103(NP)
Revison 2Realistic Large Break LOCA Methodology for Pressurized Water Reactors Page C-1
AREVA NP Inc.
Appendix C Incorporation of M5® Cladding Properties
This Appendix describes the implementation of the NRC-approved M5® cladding material
properties into the RLBLOCA methodology. M5® is a proprietary variant of Zr1Nb that has
desirable high burnup performance. It provides significant improvements in corrosion, hydrogen
pick-up, axial growth and diametral creep relative to Zircaloy.
Cladding material properties are required for the fuel performance codes, COPERNIC2 and
RODEX3A, and the transient analysis code, S-RELAP5. COPERNIC2 included M5® cladding
material properties at the time of its approval by NRC (Reference C.1); thus, the COPERNIC2
required properties were previously approved by NRC and require no additional discussion
herein. RODEX3A included only Zr-4 properties at the time of its initial approval by the NRC
(Reference C.2). Both RODEX3A and S-RELAP5 were updated to include M5® cladding
properties in Revision 0 of the RLBLOCA methodology (Reference C.3).
M5® cladding specific material properties are incorporated into the AREVA RLBLOCA
methodology for the purpose of analyzing LBLOCA transients when M5® clad fuel rods are
present. No modifications to the base methodology are required for the inclusion of the M5®
properties.
C.1 References
C.1. BAW-10231P-A Revision 1, COPERNIC Fuel Rod Design Computer Code, AREVA NP Inc., January 2004.
C.2. ANF-90-145(P)(A), RODEX3 Fuel Rod Thermal-Mechanical Response Evaluation Model, Volume 1, Theoretical Manual, and Volume 2, Thermal and Gas Release Assessments, April 1996.
C.3. EMF-2103(P)(A) Revision 0, Realistic Large Break LOCA Methodology, Framatome ANP Richland, Inc., April 2003.

EMF-2103(NP)Realistic Large Break LOCA Methodology for
Pressurized Water Reactors Revison 2
AREVA NP Inc.
Distribution
E-Mail Notification R. L. Baxter J. R. Biller K. E. Carlson B. M. Dunn M. E. Garrett N. K. Nithianandan D. W. Pruitt G. S. Uyeda
Related Documents