Real-Time Monitoring of the Venezuelan Exodus through Facebook’s Advertising Platform J. Palotti 1 , N. Adler 2 , A. J. Morales 3 , J. Villaveces 4 , V. Sekara 2 , M. Garcia Herranz 2 , M. Al-Asad 5 , I. Weber 1* 1 Qatar Computing Research Institute, HBKU E-mails: jpalotti,[email protected] 2 UNICEF E-mail: nadler,vsekara,[email protected] 3 MIT Media Lab E-mail: [email protected] 4 iMMAP Colombia E-mail: [email protected] 5 Global Protection Cluster, Geneva, Switzerland. E-mail: [email protected] * To whom correspondence should be addressed; E-mail: [email protected]. March 29, 2019

Welcome message from author
This document is posted to help you gain knowledge. Please leave a comment to let me know what you think about it! Share it to your friends and learn new things together.
Transcript
Real-Time Monitoring of theVenezuelan Exodus through
Facebook’s Advertising Platform
J. Palotti1, N. Adler2, A. J. Morales3, J. Villaveces4, V. Sekara2, M.Garcia Herranz2, M. Al-Asad5, I. Weber1∗
1Qatar Computing Research Institute, HBKUE-mails: jpalotti,[email protected]
2UNICEFE-mail: nadler,vsekara,[email protected]
3MIT Media LabE-mail: [email protected]
4iMMAP ColombiaE-mail: [email protected]
5Global Protection Cluster, Geneva, Switzerland.E-mail: [email protected]
∗To whom correspondence should be addressed; E-mail: [email protected].
March 29, 2019
Abstract
Venezuela is going through the worst economical, political and social crisis in its modernhistory. Basic products like food or medicine are scarce and hyperinflation is combined witheconomic depression. This situation is creating an unprecedented refugee and migrant crisis inthe region. Governments and international agencies have not been able to consistently leveragereliable information using traditional methods. Therefore, to organize and deploy any kind ofhumanitarian response, it is crucial to evaluate new methodologies to measure the numberand location of Venezuelan refugees and migrants across Latin America. In this paper, wepropose to use Facebook’s advertising platform as an additional data source for monitoring theongoing crisis. We estimate and validate national and sub-national numbers of refugees andmigrants and break-down their socio-economic profiles to further understand the complexityof the phenomenon. Although limitations exist, we believe that the presented methodology canbe of value for real-time assessment of refugee and migrant crises world-wide.
Technical ReportThe current economic and political crisis in Venezuela has led to an outpouring of refugees andmigrants from the country. As of February 2019, the Regional Inter-Agency Coordination Plat-form for Refugees and Migrants from Venezuela (R4V) estimates that there are 3.4 million peoplewho have left Venezuela and who currently live in countries in Latin America and the Caribbeanregion [1]. According to the United Nations High Commissioner for Refugees (UNHCR), “this isthe largest exodus in the recent history of Latin America”1. This has prompted humanitarian inter-ventions from governments, UN agencies and civil society. Targeted efforts, however, have beenhampered by missing, outdated or incorrect data concerning the (i) absolute number, (ii) spatialdistribution, and (iii) socio-economic composition of Venezuelan refugees and migrants.
Attempts to measure the size of the population displacement have been conducted by gov-ernments in the receiving countries. Colombia, for example, ran the Registro Administrativo deMigrantes Venezolanos (RAMV) from April to June, 20182, a registry campaign in which Venezue-lans living in Colombia could voluntarily identify themselves at specific registration points desig-nated by the government. While this approach provides a snapshot of the crisis, it is limited inmany ways. First, it only provides a single snapshot of refugee and migrant stocks and is there-fore inadequate to capture sudden flows, e.g., due to an unforeseen deterioration of the situation inVenezuela. Second, the effort of staffing one thousand registration posts for 61 days comes witha significant economic burden. Third, and perhaps most crucially, it relies on self-reported data,which is likely to be incomplete, leading to a considerable under-count of the affected population.One reason for the lack of participation in voluntary registration campaigns such as RAMV is theperceived lack of benefits to registering, in particular for refugees and migrants with an irregularstatus.
For these reasons, which largely apply to displacement and migration monitoring in general,researchers have explored non-traditional data sources for monitoring trans-national mobility, in-cluding IP addresses of email users [2], geo-tagged tweets [3], satellite data to count structures
1https://www.unhcr.org/venezuela-emergency.html, retrieved on Feb 26, 2019.2Available in Spanish at https://data2.unhcr.org/en/documents/download/64101, last ac-
cessed on Feb 26, 2019.
1
in refugee settlements [4] and Facebook’s advertising audience estimates [5]. In this work, webuild on [5] and show how data from Facebook’s advertising platform can be used to supplementthe monitoring of the Venezuelan refugee and migration crisis by providing insights into (i) thetemporal trends of refugee and migrant flows, (ii) the spatial distribution of Venezuelan nationalsin their host countries, and (iii) the socio-economic makeup of these communities.
Facebook’s advertising platform was designed to support targeted advertisements based on alarge number of user attributes, including both self-reported and inferred attributes (See Fig-S1).As an example, an advertiser willing to launch an advertisement campaign on Facebook can chooseto selectively target their advertisement to people who, according to Facebook’s classification, (i)are aged 13 and above, (ii) are currently living in the Colombian department of Norte de Santander,(iii) previously used to live in Venezuela, and (iv) use an iOS device to access Facebook. Beforethe advertisement campaign is launched, Facebook provides the advertiser with an estimate of thenumber of monthly active users (MAUs) matching the provided targeting criteria. In this concreteexample, the estimate is 3,000 MAUs (as of February 24, 2019). Additional targeting criteriainclude education level, relationship status, and topical interests. These estimates of user countsare available free of charge through the Facebook Graph API3.
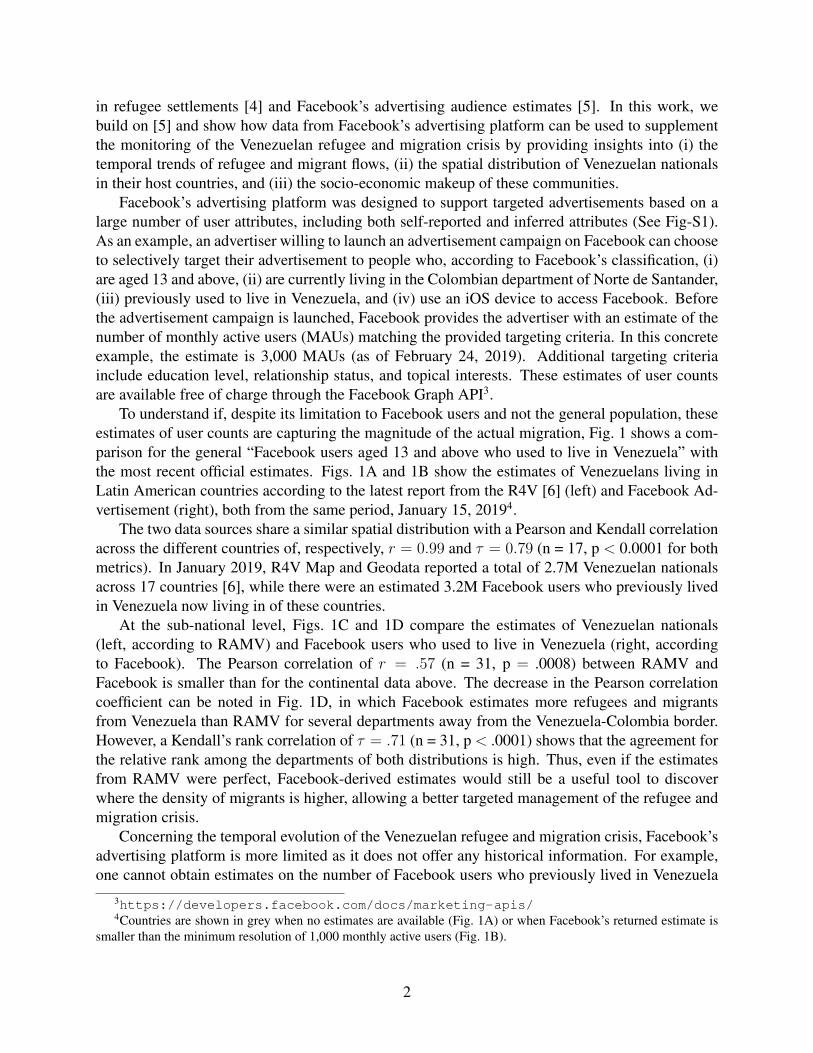
To understand if, despite its limitation to Facebook users and not the general population, theseestimates of user counts are capturing the magnitude of the actual migration, Fig. 1 shows a com-parison for the general “Facebook users aged 13 and above who used to live in Venezuela” withthe most recent official estimates. Figs. 1A and 1B show the estimates of Venezuelans living inLatin American countries according to the latest report from the R4V [6] (left) and Facebook Ad-vertisement (right), both from the same period, January 15, 20194.
The two data sources share a similar spatial distribution with a Pearson and Kendall correlationacross the different countries of, respectively, r = 0.99 and τ = 0.79 (n = 17, p < 0.0001 for bothmetrics). In January 2019, R4V Map and Geodata reported a total of 2.7M Venezuelan nationalsacross 17 countries [6], while there were an estimated 3.2M Facebook users who previously livedin Venezuela now living in of these countries.
At the sub-national level, Figs. 1C and 1D compare the estimates of Venezuelan nationals(left, according to RAMV) and Facebook users who used to live in Venezuela (right, accordingto Facebook). The Pearson correlation of r = .57 (n = 31, p = .0008) between RAMV andFacebook is smaller than for the continental data above. The decrease in the Pearson correlationcoefficient can be noted in Fig. 1D, in which Facebook estimates more refugees and migrantsfrom Venezuela than RAMV for several departments away from the Venezuela-Colombia border.However, a Kendall’s rank correlation of τ = .71 (n = 31, p < .0001) shows that the agreement forthe relative rank among the departments of both distributions is high. Thus, even if the estimatesfrom RAMV were perfect, Facebook-derived estimates would still be a useful tool to discoverwhere the density of migrants is higher, allowing a better targeted management of the refugee andmigration crisis.
Concerning the temporal evolution of the Venezuelan refugee and migration crisis, Facebook’sadvertising platform is more limited as it does not offer any historical information. For example,one cannot obtain estimates on the number of Facebook users who previously lived in Venezuela
3https://developers.facebook.com/docs/marketing-apis/4Countries are shown in grey when no estimates are available (Fig. 1A) or when Facebook’s returned estimate is
smaller than the minimum resolution of 1,000 monthly active users (Fig. 1B).
2
(A) R4V Map and Geodata - January 15, 2019 (B) Facebook - January 15, 2019
(C) RAMV - April 6 to June 8, 2018 (D) Facebook - June 8, 2018
Figure 1: Estimates of Venezuelan refugees and migrants in South America (Figs. 1A and 1B) andColombia (Figs. 1C and 1D) from different data sources.
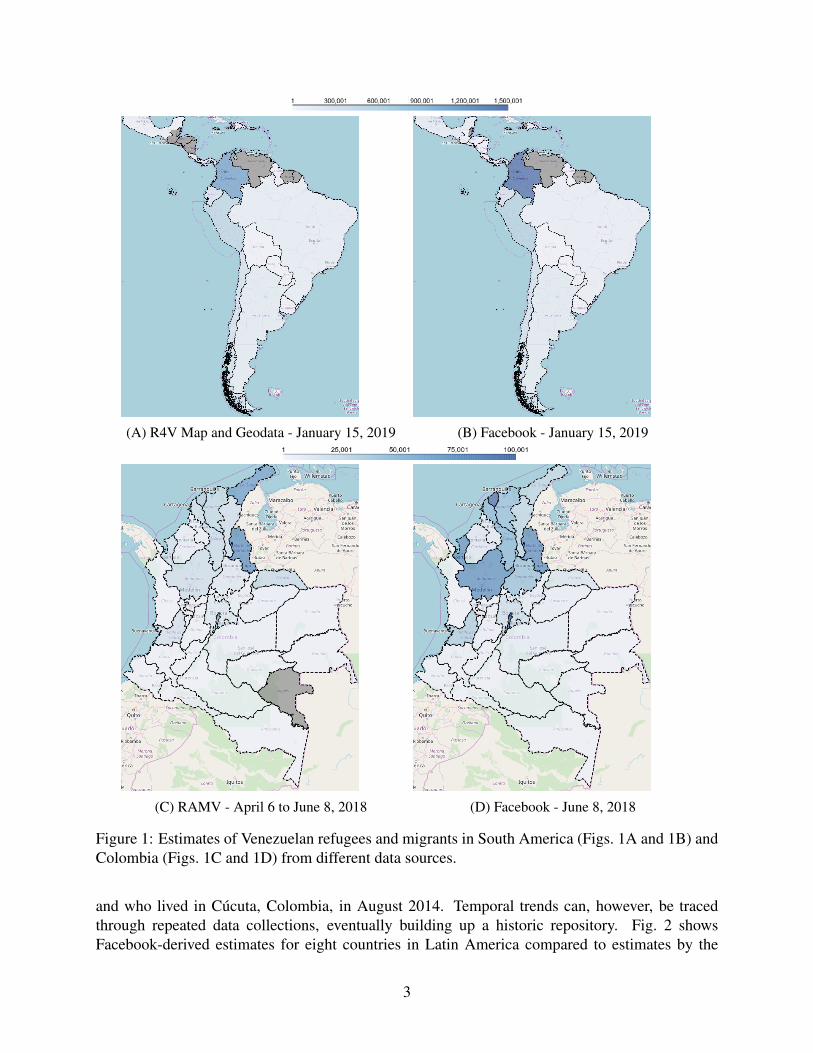
and who lived in Cucuta, Colombia, in August 2014. Temporal trends can, however, be tracedthrough repeated data collections, eventually building up a historic repository. Fig. 2 showsFacebook-derived estimates for eight countries in Latin America compared to estimates by the
3
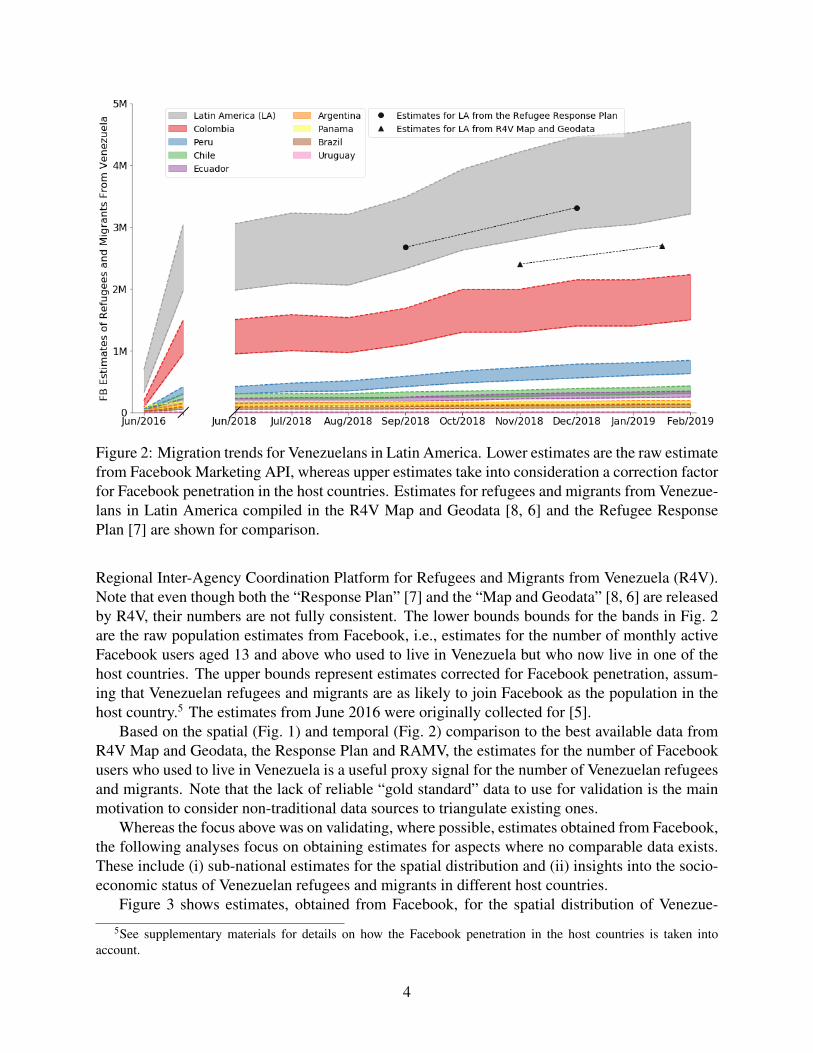
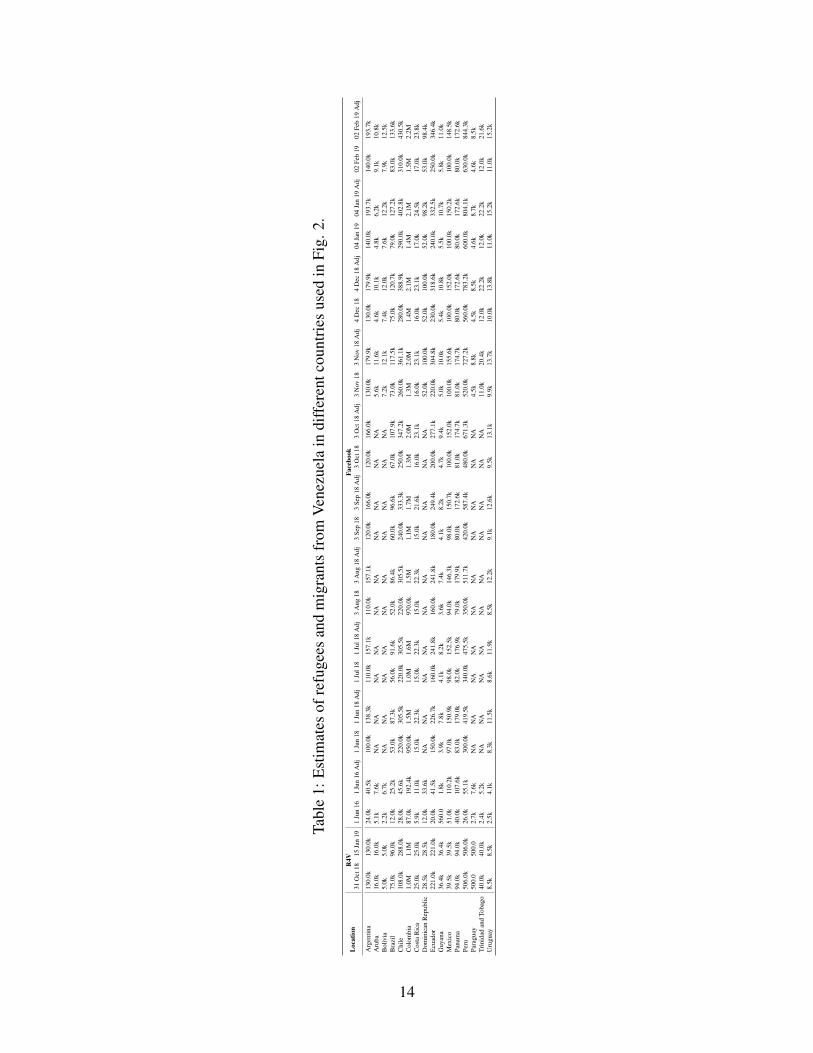
Figure 2: Migration trends for Venezuelans in Latin America. Lower estimates are the raw estimatefrom Facebook Marketing API, whereas upper estimates take into consideration a correction factorfor Facebook penetration in the host countries. Estimates for refugees and migrants from Venezue-lans in Latin America compiled in the R4V Map and Geodata [8, 6] and the Refugee ResponsePlan [7] are shown for comparison.
Regional Inter-Agency Coordination Platform for Refugees and Migrants from Venezuela (R4V).Note that even though both the “Response Plan” [7] and the “Map and Geodata” [8, 6] are releasedby R4V, their numbers are not fully consistent. The lower bounds bounds for the bands in Fig. 2are the raw population estimates from Facebook, i.e., estimates for the number of monthly activeFacebook users aged 13 and above who used to live in Venezuela but who now live in one of thehost countries. The upper bounds represent estimates corrected for Facebook penetration, assum-ing that Venezuelan refugees and migrants are as likely to join Facebook as the population in thehost country.5 The estimates from June 2016 were originally collected for [5].
Based on the spatial (Fig. 1) and temporal (Fig. 2) comparison to the best available data fromR4V Map and Geodata, the Response Plan and RAMV, the estimates for the number of Facebookusers who used to live in Venezuela is a useful proxy signal for the number of Venezuelan refugeesand migrants. Note that the lack of reliable “gold standard” data to use for validation is the mainmotivation to consider non-traditional data sources to triangulate existing ones.
Whereas the focus above was on validating, where possible, estimates obtained from Facebook,the following analyses focus on obtaining estimates for aspects where no comparable data exists.These include (i) sub-national estimates for the spatial distribution and (ii) insights into the socio-economic status of Venezuelan refugees and migrants in different host countries.
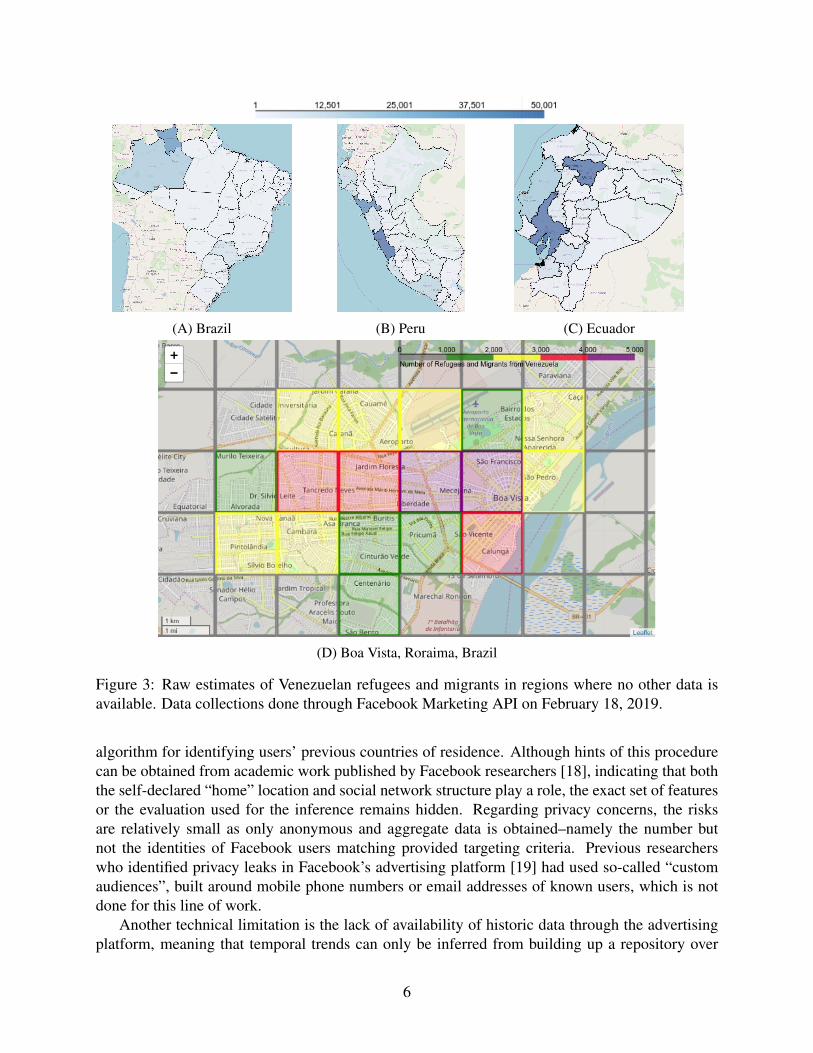
Figure 3 shows estimates, obtained from Facebook, for the spatial distribution of Venezue-
5See supplementary materials for details on how the Facebook penetration in the host countries is taken intoaccount.
4
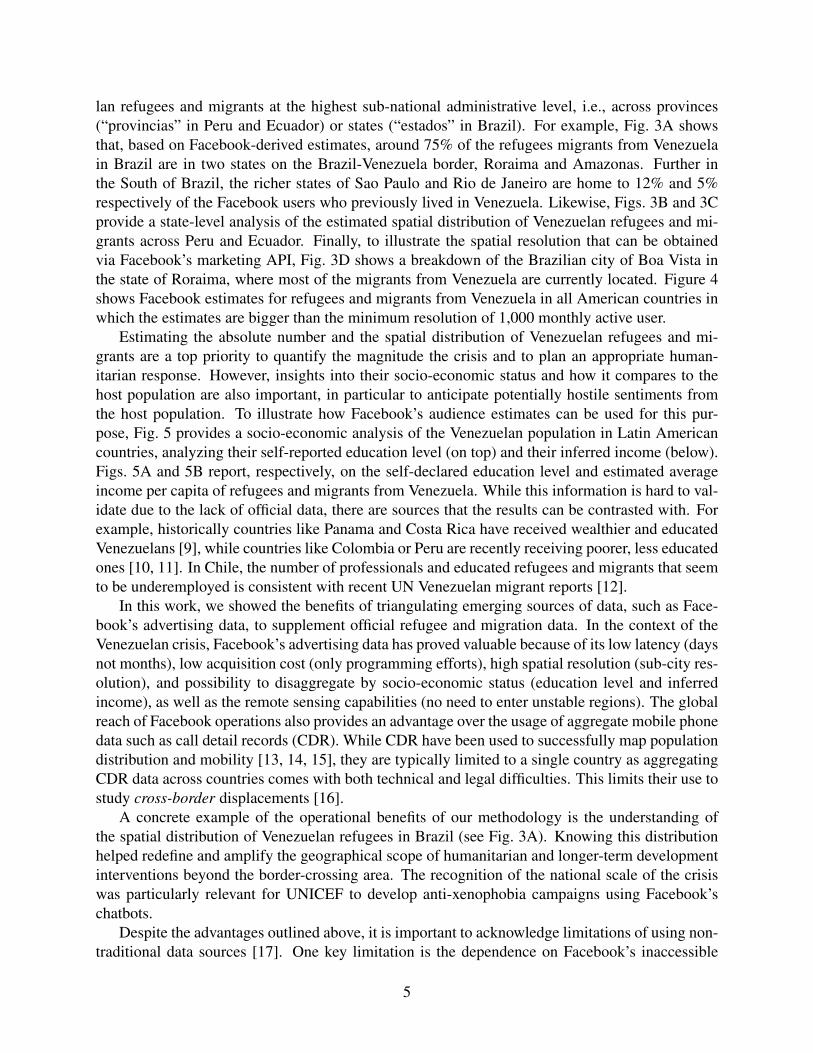
lan refugees and migrants at the highest sub-national administrative level, i.e., across provinces(“provincias” in Peru and Ecuador) or states (“estados” in Brazil). For example, Fig. 3A showsthat, based on Facebook-derived estimates, around 75% of the refugees migrants from Venezuelain Brazil are in two states on the Brazil-Venezuela border, Roraima and Amazonas. Further inthe South of Brazil, the richer states of Sao Paulo and Rio de Janeiro are home to 12% and 5%respectively of the Facebook users who previously lived in Venezuela. Likewise, Figs. 3B and 3Cprovide a state-level analysis of the estimated spatial distribution of Venezuelan refugees and mi-grants across Peru and Ecuador. Finally, to illustrate the spatial resolution that can be obtainedvia Facebook’s marketing API, Fig. 3D shows a breakdown of the Brazilian city of Boa Vista inthe state of Roraima, where most of the migrants from Venezuela are currently located. Figure 4shows Facebook estimates for refugees and migrants from Venezuela in all American countries inwhich the estimates are bigger than the minimum resolution of 1,000 monthly active user.
Estimating the absolute number and the spatial distribution of Venezuelan refugees and mi-grants are a top priority to quantify the magnitude the crisis and to plan an appropriate human-itarian response. However, insights into their socio-economic status and how it compares to thehost population are also important, in particular to anticipate potentially hostile sentiments fromthe host population. To illustrate how Facebook’s audience estimates can be used for this pur-pose, Fig. 5 provides a socio-economic analysis of the Venezuelan population in Latin Americancountries, analyzing their self-reported education level (on top) and their inferred income (below).Figs. 5A and 5B report, respectively, on the self-declared education level and estimated averageincome per capita of refugees and migrants from Venezuela. While this information is hard to val-idate due to the lack of official data, there are sources that the results can be contrasted with. Forexample, historically countries like Panama and Costa Rica have received wealthier and educatedVenezuelans [9], while countries like Colombia or Peru are recently receiving poorer, less educatedones [10, 11]. In Chile, the number of professionals and educated refugees and migrants that seemto be underemployed is consistent with recent UN Venezuelan migrant reports [12].
In this work, we showed the benefits of triangulating emerging sources of data, such as Face-book’s advertising data, to supplement official refugee and migration data. In the context of theVenezuelan crisis, Facebook’s advertising data has proved valuable because of its low latency (daysnot months), low acquisition cost (only programming efforts), high spatial resolution (sub-city res-olution), and possibility to disaggregate by socio-economic status (education level and inferredincome), as well as the remote sensing capabilities (no need to enter unstable regions). The globalreach of Facebook operations also provides an advantage over the usage of aggregate mobile phonedata such as call detail records (CDR). While CDR have been used to successfully map populationdistribution and mobility [13, 14, 15], they are typically limited to a single country as aggregatingCDR data across countries comes with both technical and legal difficulties. This limits their use tostudy cross-border displacements [16].
A concrete example of the operational benefits of our methodology is the understanding ofthe spatial distribution of Venezuelan refugees in Brazil (see Fig. 3A). Knowing this distributionhelped redefine and amplify the geographical scope of humanitarian and longer-term developmentinterventions beyond the border-crossing area. The recognition of the national scale of the crisiswas particularly relevant for UNICEF to develop anti-xenophobia campaigns using Facebook’schatbots.
Despite the advantages outlined above, it is important to acknowledge limitations of using non-traditional data sources [17]. One key limitation is the dependence on Facebook’s inaccessible
5
(A) Brazil (B) Peru (C) Ecuador
(D) Boa Vista, Roraima, Brazil
Figure 3: Raw estimates of Venezuelan refugees and migrants in regions where no other data isavailable. Data collections done through Facebook Marketing API on February 18, 2019.
algorithm for identifying users’ previous countries of residence. Although hints of this procedurecan be obtained from academic work published by Facebook researchers [18], indicating that boththe self-declared “home” location and social network structure play a role, the exact set of featuresor the evaluation used for the inference remains hidden. Regarding privacy concerns, the risksare relatively small as only anonymous and aggregate data is obtained–namely the number butnot the identities of Facebook users matching provided targeting criteria. Previous researcherswho identified privacy leaks in Facebook’s advertising platform [19] had used so-called “customaudiences”, built around mobile phone numbers or email addresses of known users, which is notdone for this line of work.
Another technical limitation is the lack of availability of historic data through the advertisingplatform, meaning that temporal trends can only be inferred from building up a repository over
6
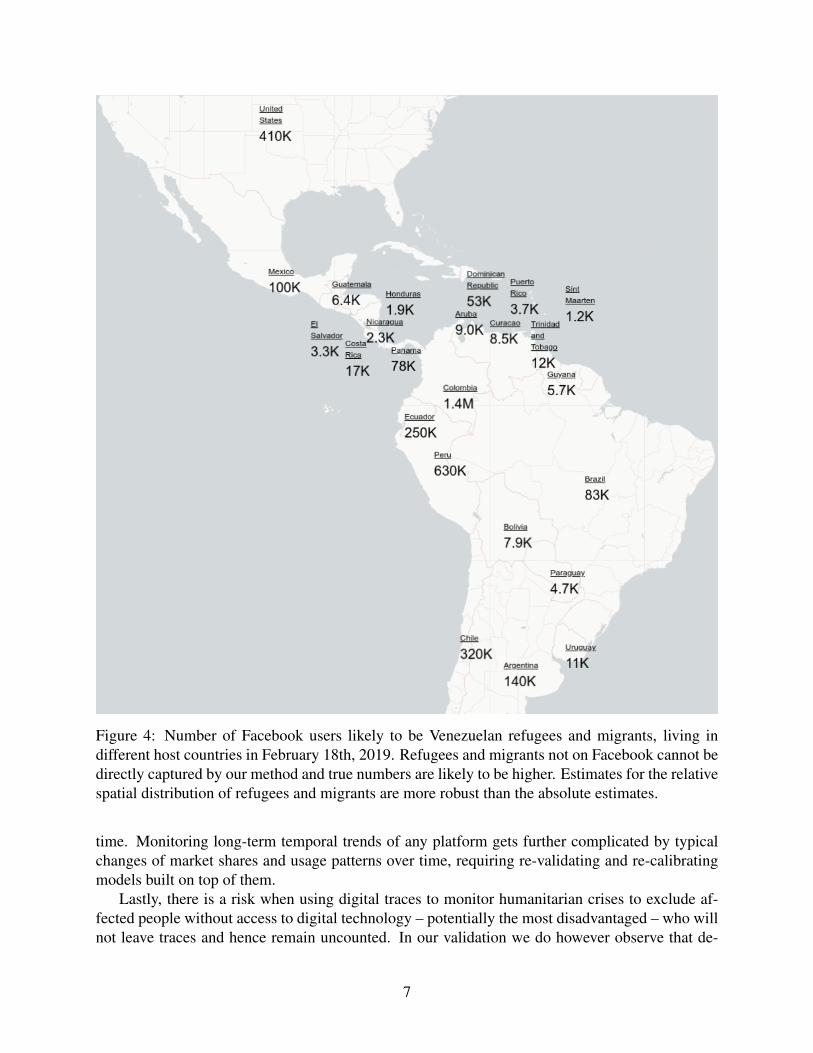
Figure 4: Number of Facebook users likely to be Venezuelan refugees and migrants, living indifferent host countries in February 18th, 2019. Refugees and migrants not on Facebook cannot bedirectly captured by our method and true numbers are likely to be higher. Estimates for the relativespatial distribution of refugees and migrants are more robust than the absolute estimates.
time. Monitoring long-term temporal trends of any platform gets further complicated by typicalchanges of market shares and usage patterns over time, requiring re-validating and re-calibratingmodels built on top of them.
Lastly, there is a risk when using digital traces to monitor humanitarian crises to exclude af-fected people without access to digital technology – potentially the most disadvantaged – who willnot leave traces and hence remain uncounted. In our validation we do however observe that de-
7
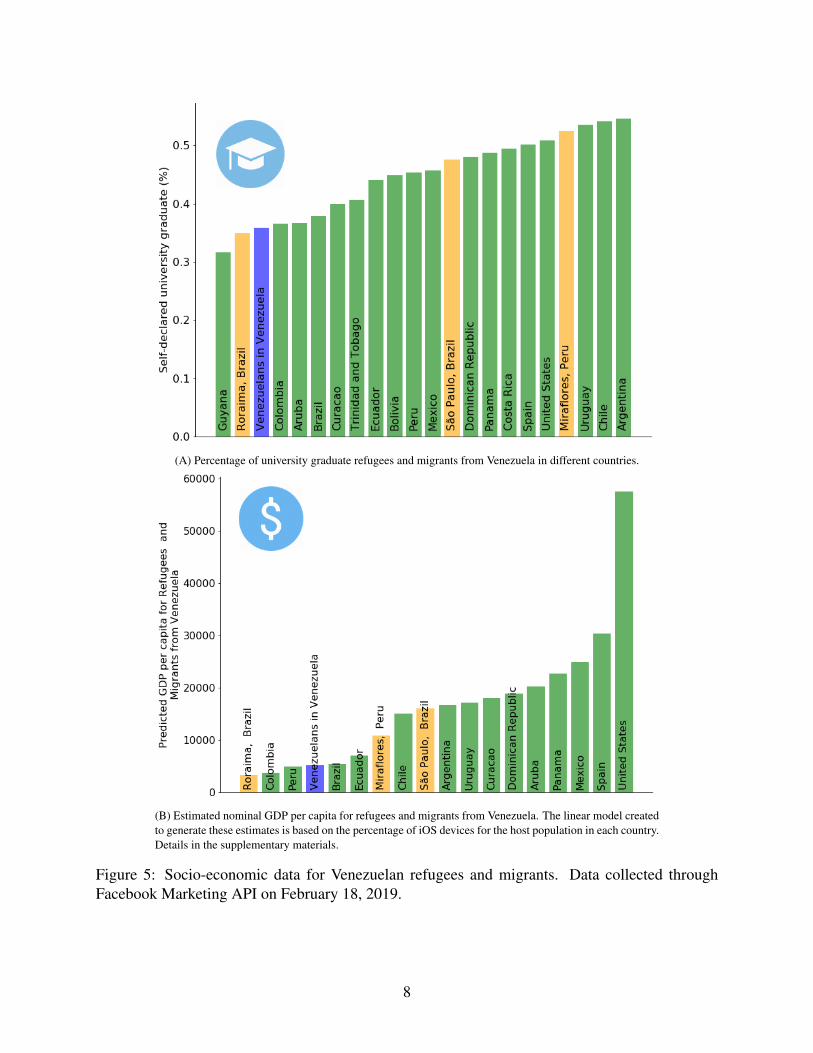
(A) Percentage of university graduate refugees and migrants from Venezuela in different countries.
(B) Estimated nominal GDP per capita for refugees and migrants from Venezuela. The linear model createdto generate these estimates is based on the percentage of iOS devices for the host population in each country.Details in the supplementary materials.
Figure 5: Socio-economic data for Venezuelan refugees and migrants. Data collected throughFacebook Marketing API on February 18, 2019.
8
spite the selection bias and potential noise of the algorithm to infer users’ previous countries ofresidence, the estimates derived from Facebook are close to the best official estimates. This is inline with the observation by Wesolowski et al. that despite the substantial bias in phone ownership,mobility patterns derived from mobile phone data are surprisingly robust [20].
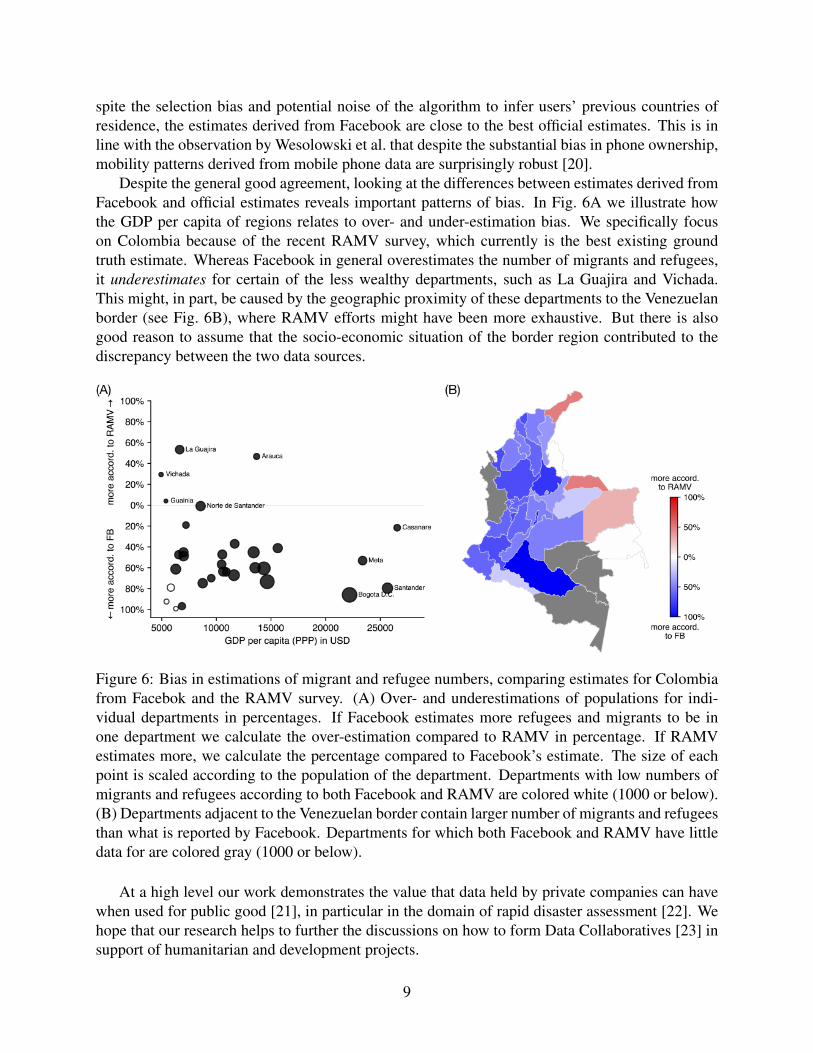
Despite the general good agreement, looking at the differences between estimates derived fromFacebook and official estimates reveals important patterns of bias. In Fig. 6A we illustrate howthe GDP per capita of regions relates to over- and under-estimation bias. We specifically focuson Colombia because of the recent RAMV survey, which currently is the best existing groundtruth estimate. Whereas Facebook in general overestimates the number of migrants and refugees,it underestimates for certain of the less wealthy departments, such as La Guajira and Vichada.This might, in part, be caused by the geographic proximity of these departments to the Venezuelanborder (see Fig. 6B), where RAMV efforts might have been more exhaustive. But there is alsogood reason to assume that the socio-economic situation of the border region contributed to thediscrepancy between the two data sources.
Figure 6: Bias in estimations of migrant and refugee numbers, comparing estimates for Colombiafrom Facebok and the RAMV survey. (A) Over- and underestimations of populations for indi-vidual departments in percentages. If Facebook estimates more refugees and migrants to be inone department we calculate the over-estimation compared to RAMV in percentage. If RAMVestimates more, we calculate the percentage compared to Facebook’s estimate. The size of eachpoint is scaled according to the population of the department. Departments with low numbers ofmigrants and refugees according to both Facebook and RAMV are colored white (1000 or below).(B) Departments adjacent to the Venezuelan border contain larger number of migrants and refugeesthan what is reported by Facebook. Departments for which both Facebook and RAMV have littledata for are colored gray (1000 or below).
At a high level our work demonstrates the value that data held by private companies can havewhen used for public good [21], in particular in the domain of rapid disaster assessment [22]. Wehope that our research helps to further the discussions on how to form Data Collaboratives [23] insupport of humanitarian and development projects.
9
References[1] Data available at r4v.info. Accessed on February 21, 2019.
[2] Emilio Zagheni and Ingmar Weber. You are where you e-mail: using e-mail data to estimateinternational migration rates. In ACM Conference on Web Science, pages 348–357, 2012.
[3] Bartosz Hawelka, Izabela Sitko, Euro Beinat, Stanislav Sobolevsky, Pavlos Kazakopoulos,and Carlo Ratti. Geo-located twitter as proxy for global mobility patterns. Cartography andGeographic Information Science, 41(3):260–271, 2014.
[4] John A. Quinn, Marguerite M. Nyhan, Celia Navarro, Davide Coluccia, Lars Bromley, andMiguel Luengo-Oroz. Humanitarian applications of machine learning with remote-sensingdata: review and case study in refugee settlement mapping. Philosophical Transactions ofthe Royal Society A, 376, 2018.
[5] Emilio Zagheni, Ingmar Weber, and Krishna Gummadi. Leveraging facebook’s advertisingplatform to monitor stocks of migrants. Population and Development Review, 43(4):721–734,2017.
[6] Report available at https://r4v.info/en/documents/details/68069. Ac-cessed on February 24, 2019.
[7] Report available at https://www.iom.int/sites/default/files/press_release/file/rmrp_venezuela_2019_onlineversion_final.pdf. Ac-cessed on February 24, 2019.
[8] Data available at https://data2.unhcr.org/en/documents/download/67311. Accessed on February 24, 2019.
[9] Nairar Galarraga Gortazar. Radiografıa del gran exodo venezolano. El Pais, 2018.
[10] Monica Duarte. La nueva diaspora venezolana es cada vez mas vulnerable y mas masiva. LaRazon, 2018.
[11] Juan Carlos Guataqui, Andres Garcia-Suaza, Cindy Vanessa Ospina-Cartagena, Diana IsabelLondono-Aguirre, Paul Rodriguez-Lesmes, and Juan Pablo Baquero. Informe 3: Caracteris-ticas de los migrantes de Venezuela a Colombia. Universidad del Rosario, 2017.
[12] Organizacion Internacional para las Migraciones. Monitoreo de flujo de poblacion vene-zolana: Chile. Technical report, International Organization for Migration, 2018.
[13] Pierre Deville, Catherine Linard, Samuel Martin, Marius Gilbert, Forrest R. Stevens, An-drea E. Gaughan, Vincent D. Blondel, and Andrew J. Tatem. Dynamic population mappingusing mobile phone data. Proceedings of the National Academy of Sciences, 111(45):15888–15893, 2014.
10
[14] David Pastor-Escuredo, Alfredo Morales-Guzman, Yolanda Torres-Fernandez, Jean-MartinBauer, Amit Wadhwa, Carlos Castro-Correa, Liudmyla Romanoff, Jong Gun Lee, AlexRutherford, Vanessa Frias-Martinez, et al. Flooding through the lens of mobile phone ac-tivity. In IEEE Global Humanitarian Technology Conference (GHTC 2014), pages 279–286.IEEE, 2014.
[15] Alfredo J. Morales, Werner Creixell, Javier Borondo, Juan Carlos Losada, and Rosa MariaBenito. Characterizing ethnic interactions from human communication patterns in ivorycoast. Networks & Heterogeneous Media, 10:87–99, 2015.
[16] Deepa K. Pindolia, Andres J. Garcia, Zhuojie Huang, Timothy Fik, David L. Smith, and An-drew J. Tatem. Quantifying cross-border movements and migrations for guiding the strategicplanning of malaria control and elimination. Malaria Journal, 13(1):169, May 2014.
[17] David Lazer, Ryan Kennedy, Gary King, and Alessandro Vespignani. The parable of googleflu: Traps in big data analysis. Science, 343(6176):1203–1205, 2014.
[18] Amac Herdagdelen, Bogdan State, Lada A. Adamic, and Winter A. Mason. The social tiesof immigrant communities in the united states. In ACM Conference on Web Science, pages78–84, 2016.
[19] G. Venkatadri, A. Andreou, Y. Liu, A. Mislove, K. P. Gummadi, P. Loiseau, and O. Goga. Pri-vacy risks with facebook’s pii-based targeting: Auditing a data broker’s advertising interface.In IEEE Symposium on Security and Privacy (SP), pages 89–107, 2018.
[20] Amy Wesolowski, Nathan Eagle, Abdisalan M. Noor, Robert W. Snow, , and Caroline O.Buckee. The impact of biases in mobile phone ownership on estimates of human mobility.Journal of The Royal Society Interface, 10, 2013.
[21] Hetan Shah. Use our personal data for the common good. Nature, 556(7), 2018.
[22] Yury Kryvasheyeu, Haohui Chen, Nick Obradovich, Esteban Moro, Pascal Van Hentenryck,James Fowler, and Manuel Cebrian. Rapid assessment of disaster damage using social mediaactivity. Science Advances, 2(3), 2016.
[23] Iryna Susha, Marijn Janssen, and Stefaan Verhulst. Data collaboratives as “bazaars”?: Areview of coordination problems and mechanisms to match demand for data with supply.Transforming Government: People, Process and Policy, 11(1):157–172, 2017.
[24] Matheus Araujo, Yelena Mejova, Ingmar Weber, and Fabricio Benevenuto. Using facebookads audiences for global lifestyle disease surveillance: Promises and limitations. In Proceed-ings of the 2017 ACM on Web Science Conference, pages 253–257. ACM, 2017.
[25] Data available at https://esa.un.org/unpd/wpp/DVD/Files/1_Indicators\%20(Standard)/EXCEL_FILES/1_Population/WPP2017_POP_F01_1_TOTAL_POPULATION_BOTH_SEXES.xlsx. Accessed on February 21,2019.
11
AppendicesMaterials and Methods
Estimating the Number of Refugees and Migrants from VenezuelaThe dataset used in this paper was collected through the Facebook Marketing API (version 3.1).Fig. 7 shows a screenshot of the Web interface.6 In this work, we automatically collected datausing the Python library pySocialWatcher7 [24]. This library provides a wrapper for the relevantcalls in Facebook’s Graph API8.
Unless otherwise stated, the collection made in this work aim to capture Facebook monthlyactive users (MAUs) aged 13 or above which Facebook classified as belonging to the categoryExpats - Venezuela, which was renamed in late 2018 to Lived in Venezuela (formerly Expats -Venezuela), as shown in Fig. 7. The definition of this category according to Facebook is “Peoplewho used to live in Venezuela who now live abroad”. Based on the validation results in the mainarticle, we will also refer to these as estimates of Venezuelan refugees and migrants.
Correction Factor for Facebook Penetration in the Host CountriesWhen analyzing the temporal trends in Fig. 2, we included up-adjusted Facebook audience esti-mates that correct for the fact that not all refugees and migrants are on Facebook by taking intoaccount the Facebook penetration in the host country. For that, we used the 2017 population esti-mations compiled by the United Nations [25]. An adjustment factor is calculated for each countryas shown in Eq. 1. Estimates for refugees and migrants from Venezuela are then corrected as shownin Eq. 2.
Adj factor(country) = FB audience(country)/UN 2017(country) (1)
venezuelans adj(location) = venezuelans(country)/adj factor(country) (2)
Table 1 shows both the raw Facebook estimates of refugees and migrants from Venezuela aswell as adjusted values for different countries. The column R4V refers to the only official, butnot necessarily accurate, data available from the Regional Inter-Agency Coordination Platform forRefugees and Migrants from Venezuela (R4V). To correct the estimates from June 2016, we usedthe 2016 population estimates from the United Nations instead of the 2017 one.
University Graduate Users in FacebookThe current Facebook Marketing API version has thirteen non-overlapping categories for edu-cation level.9 In this work, the definition of “university graduate” combines the following five
6https://business.facebook.com/adsmanager/creation/7https://github.com/maraujo/pySocialWatcher8https://developers.facebook.com/docs/marketing-apis9Details about the education levels supported by Facebook’s Marketing API can be found at https:
//developers.facebook.com/docs/marketing-api/targeting-specs/#education_and_workplace, last accessed on February 28, 2019.
12
categories from Facebook: (1) “At university (postgraduate)”, (2) “Doctorate degree”, (3) “Mas-ter’s degree”, (4) “Some university (postgraduate)”, (5) “University graduate”. Tab. 2 detailsinformation regarding university graduate Facebook users in different locations, both for the hostpopulation as well as for the refugees and migrants from Venezuela living in the same location.Part of the data shown in Tab. 2 can be found in Fig. 4A in the main article.
Linear Regression Model to Predict GDPThe prediction of the Gross Domestic Product (GDP) per capita at nominal values was conductedwith an ordinary least squares linear regression model. We employed as ground-truth data to trainthe linear regression model the most recent GDP per capita data collection made in 2017 from theUnited Nation10. The linear regression model has only one independent variable X , representingthe percentage of iOS-device users in the considered population. In detail, the targeting attributeused is called “Facebook access (mobile): Apple (iOS) devices” and is described as “People whoprimarily access Facebook using an Apple (iOS) mobile device”. The fitted model is Y = 507.13+X ·104903.24. The model, detailed in Table 3, reached a Mean Absolute Error of 3,782 and a RootMean Squared Error of 4,537. Table 4 shows the raw data used in this experiment.
The model above, which predicts a country’s GDP per capita at nominal values, is then appliedto the sub-population of Facebook users who used to live in Venezuela and who now live in thedifferent host countries and regions. The predictions for this sub-population can be found in Fig. 4Bin the main article.
10Available Online at https://unstats.un.org/unsd/snaama/Index. Last accessed on February 11,2019.
13
Tabl
e1:
Est
imat
esof
refu
gees
and
mig
rant
sfr
omV
enez
uela
indi
ffer
entc
ount
ries
used
inFi
g.2.
Loc
atio
nR
4VFa
cebo
ok31
Oct
1815
Jan
191
Jun
161
Jun
16A
dj1
Jun
181
Jun
18A
dj1
Jul1
81
Jul1
8A
dj3
Aug
183
Aug
18A
dj3
Sep
183
Sep
18A
dj3
Oct
183
Oct
18A
dj3
Nov
183
Nov
18A
dj4
Dec
184
Dec
18A
dj04
Jan
1904
Jan
19A
dj02
Feb
1902
Feb
19A
dj
Arg
entin
a13
0.0k
130.
0k24
.0k
40.5
k10
0.0k
138.
3k11
0.0k
157.
1k11
0.0k
157.
1k12
0.0k
166.
0k12
0.0k
166.
0k13
0.0k
179.
9k13
0.0k
179.
9k14
0.0k
193.
7k14
0.0k
193.
7kA
ruba
16.0
k16
.0k
5.1k
7.6k
NA
NA
NA
NA
NA
NA
NA
NA
NA
NA
5.6k
11.6
k4.
6k10
.1k
4.8k
6.2k
9.1k
10.8
kB
oliv
ia5.
0k5.
0k2.
2k6.
7kN
AN
AN
AN
AN
AN
AN
AN
AN
AN
A7.
2k12
.1k
7.4k
12.0
k7.
6k12
.2k
7.9k
12.5
kB
razi
l75
.0k
96.0
k12
.0k
25.2
k53
.0k
87.3
k56
.0k
91.6
k52
.0k
86.4
k60
.0k
96.6
k67
.0k
107.
9k73
.0k
117.
5k75
.0k
120.
7k79
.0k
127.
2k83
.0k
133.
6kC
hile
108.
0k28
8.0k
28.0
k45
.6k
220.
0k30
5.5k
220.
0k30
5.5k
220.
0k30
5.5k
240.
0k33
3.3k
250.
0k34
7.2k
260.
0k36
1.1k
280.
0k38
8.9k
290.
0k40
2.8k
310.
0k43
0.5k
Col
ombi
a1.
0M1.
1M87
.0k
192.
4k95
0.0k
1.5M
1.0M
1.6M
970.
0k1.
5M1.
1M1.
7M1.
3M2.
0M1.
3M2.
0M1.
4M2.
1M1.
4M2.
1M1.
5M2.
2MC
osta
Ric
a25
.0k
25.0
k5.
9k11
.0k
15.0
k22
.3k
15.0
k22
.3k
15.0
k22
.3k
15.0
k21
.6k
16.0
k23
.1k
16.0
k23
.1k
16.0
k23
.1k
17.0
k24
.5k
17.0
k23
.8k
Dom
inic
anR
epub
lic28
.5k
28.5
k12
.0k
33.6
kN
AN
AN
AN
AN
AN
AN
AN
AN
AN
A52
.0k
100.
0k52
.0k
100.
0k52
.0k
98.2
k53
.0k
98.4
kE
cuad
or22
1.0k
221.
0k20
.0k
41.5
k15
0.0k
226.
7k16
0.0k
241.
8k16
0.0k
241.
8k18
0.0k
249.
4k20
0.0k
277.
1k22
0.0k
304.
8k23
0.0k
318.
6k24
0.0k
332.
5k25
0.0k
346.
4kG
uyan
a36
.4k
36.4
k56
0.0
1.8k
3.9k
7.8k
4.1k
8.2k
3.6k
7.4k
4.1k
8.2k
4.7k
9.4k
5.0k
10.0
k5.
4k10
.8k
5.5k
10.7
k5.
8k11
.0k
Mex
ico
39.5
k39
.5k
51.0
k11
0.2k
97.0
k15
0.9k
98.0
k15
2.5k
94.0
k14
6.3k
98.0
k15
0.7k
100.
0k15
2.0k
100.
0k15
5.6k
100.
0k15
2.0k
100.
0k15
0.2k
100.
0k14
8.5k
Pana
ma
94.0
k94
.0k
40.0
k10
7.6k
83.0
k17
9.0k
82.0
k17
6.9k
79.0
k17
9.9k
80.0
k17
2.6k
81.0
k17
4.7k
81.0
k17
4.7k
80.0
k17
2.6k
80.0
k17
2.6k
80.0
k17
2.6k
Peru
506.
0k50
6.0k
26.0
k55
.1k
300.
0k41
9.5k
340.
0k47
5.5k
350.
0k51
1.7k
420.
0k58
7.4k
480.
0k67
1.3k
520.
0k72
7.2k
560.
0k78
3.2k
600.
0k80
4.1k
630.
0k84
4.3k
Para
guay
500.
050
0.0
2.7k
7.6k
NA
NA
NA
NA
NA
NA
NA
NA
NA
NA
4.5k
8.8k
4.5k
8.5k
4.6k
8.7k
4.6k
8.5k
Trin
idad
and
Toba
go40
.0k
40.0
k2.
4k5.
2kN
AN
AN
AN
AN
AN
AN
AN
AN
AN
A11
.0k
20.4
k12
.0k
22.2
k12
.0k
22.2
k12
.0k
21.6
kU
rugu
ay8.
5k8.
5k2.
5k4.
1k8.
3k11
.5k
8.6k
11.9
k8.
5k12
.2k
9.1k
12.6
k9.
5k13
.1k
9.9k
13.7
k10
.0k
13.8
k11
.0k
15.2
k11
.0k
15.2
k
14
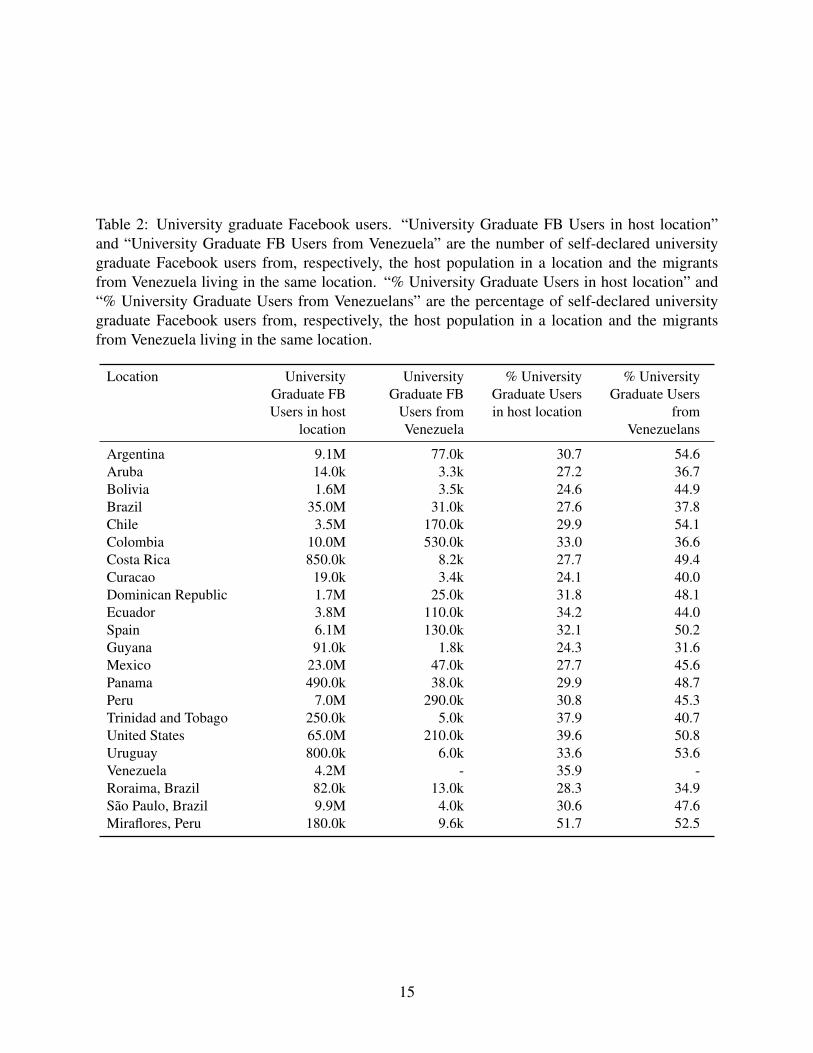
Table 2: University graduate Facebook users. “University Graduate FB Users in host location”and “University Graduate FB Users from Venezuela” are the number of self-declared universitygraduate Facebook users from, respectively, the host population in a location and the migrantsfrom Venezuela living in the same location. “% University Graduate Users in host location” and“% University Graduate Users from Venezuelans” are the percentage of self-declared universitygraduate Facebook users from, respectively, the host population in a location and the migrantsfrom Venezuela living in the same location.
Location UniversityGraduate FBUsers in host
location
UniversityGraduate FB
Users fromVenezuela
% UniversityGraduate Usersin host location
% UniversityGraduate Users
fromVenezuelans
Argentina 9.1M 77.0k 30.7 54.6Aruba 14.0k 3.3k 27.2 36.7Bolivia 1.6M 3.5k 24.6 44.9Brazil 35.0M 31.0k 27.6 37.8Chile 3.5M 170.0k 29.9 54.1Colombia 10.0M 530.0k 33.0 36.6Costa Rica 850.0k 8.2k 27.7 49.4Curacao 19.0k 3.4k 24.1 40.0Dominican Republic 1.7M 25.0k 31.8 48.1Ecuador 3.8M 110.0k 34.2 44.0Spain 6.1M 130.0k 32.1 50.2Guyana 91.0k 1.8k 24.3 31.6Mexico 23.0M 47.0k 27.7 45.6Panama 490.0k 38.0k 29.9 48.7Peru 7.0M 290.0k 30.8 45.3Trinidad and Tobago 250.0k 5.0k 37.9 40.7United States 65.0M 210.0k 39.6 50.8Uruguay 800.0k 6.0k 33.6 53.6Venezuela 4.2M - 35.9 -Roraima, Brazil 82.0k 13.0k 28.3 34.9Sao Paulo, Brazil 9.9M 4.0k 30.6 47.6Miraflores, Peru 180.0k 9.6k 51.7 52.5
15
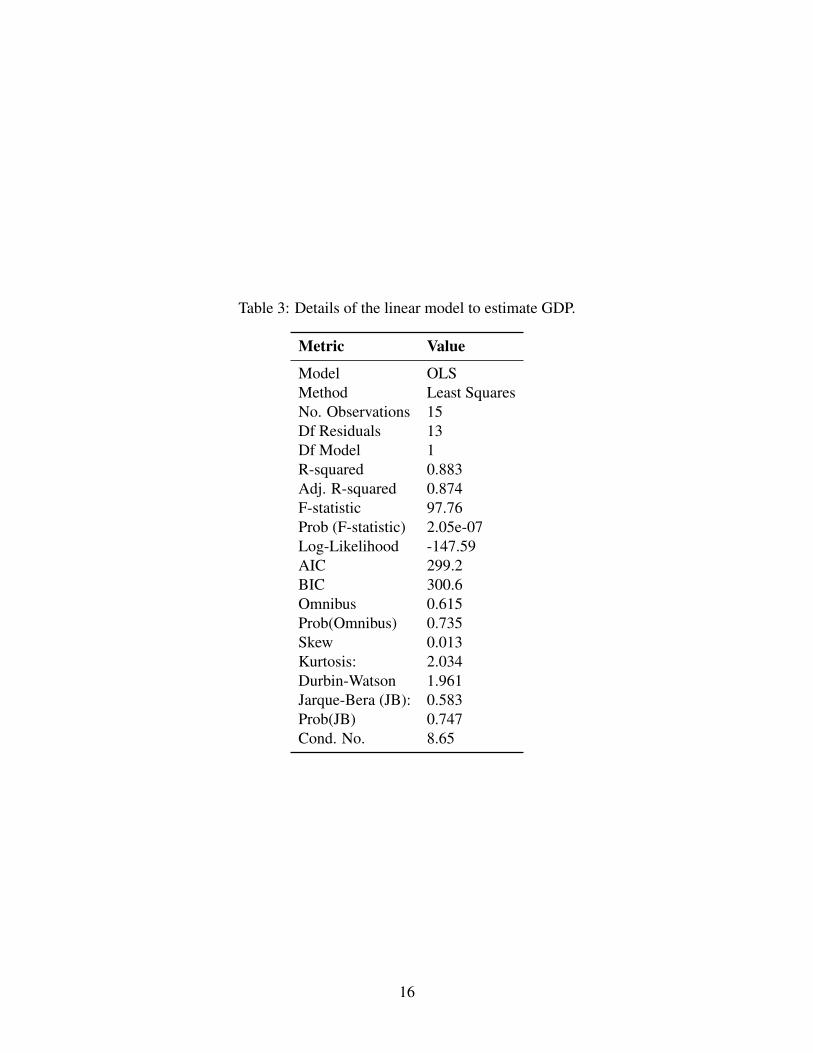
Table 3: Details of the linear model to estimate GDP.
Metric Value
Model OLSMethod Least SquaresNo. Observations 15Df Residuals 13Df Model 1R-squared 0.883Adj. R-squared 0.874F-statistic 97.76Prob (F-statistic) 2.05e-07Log-Likelihood -147.59AIC 299.2BIC 300.6Omnibus 0.615Prob(Omnibus) 0.735Skew 0.013Kurtosis: 2.034Durbin-Watson 1.961Jarque-Bera (JB): 0.583Prob(JB) 0.747Cond. No. 8.65
16
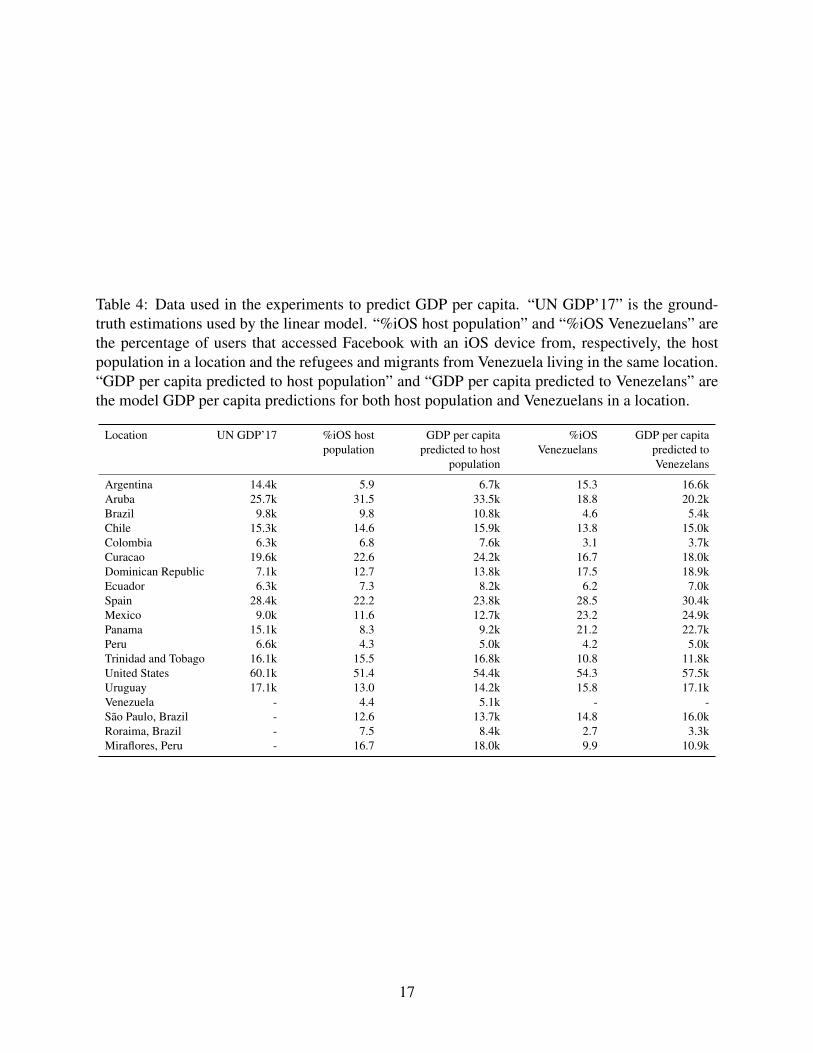
Table 4: Data used in the experiments to predict GDP per capita. “UN GDP’17” is the ground-truth estimations used by the linear model. “%iOS host population” and “%iOS Venezuelans” arethe percentage of users that accessed Facebook with an iOS device from, respectively, the hostpopulation in a location and the refugees and migrants from Venezuela living in the same location.“GDP per capita predicted to host population” and “GDP per capita predicted to Venezelans” arethe model GDP per capita predictions for both host population and Venezuelans in a location.
Location UN GDP’17 %iOS hostpopulation
GDP per capitapredicted to host
population
%iOSVenezuelans
GDP per capitapredicted toVenezelans
Argentina 14.4k 5.9 6.7k 15.3 16.6kAruba 25.7k 31.5 33.5k 18.8 20.2kBrazil 9.8k 9.8 10.8k 4.6 5.4kChile 15.3k 14.6 15.9k 13.8 15.0kColombia 6.3k 6.8 7.6k 3.1 3.7kCuracao 19.6k 22.6 24.2k 16.7 18.0kDominican Republic 7.1k 12.7 13.8k 17.5 18.9kEcuador 6.3k 7.3 8.2k 6.2 7.0kSpain 28.4k 22.2 23.8k 28.5 30.4kMexico 9.0k 11.6 12.7k 23.2 24.9kPanama 15.1k 8.3 9.2k 21.2 22.7kPeru 6.6k 4.3 5.0k 4.2 5.0kTrinidad and Tobago 16.1k 15.5 16.8k 10.8 11.8kUnited States 60.1k 51.4 54.4k 54.3 57.5kUruguay 17.1k 13.0 14.2k 15.8 17.1kVenezuela - 4.4 5.1k - -Sao Paulo, Brazil - 12.6 13.7k 14.8 16.0kRoraima, Brazil - 7.5 8.4k 2.7 3.3kMiraflores, Peru - 16.7 18.0k 9.9 10.9k
17
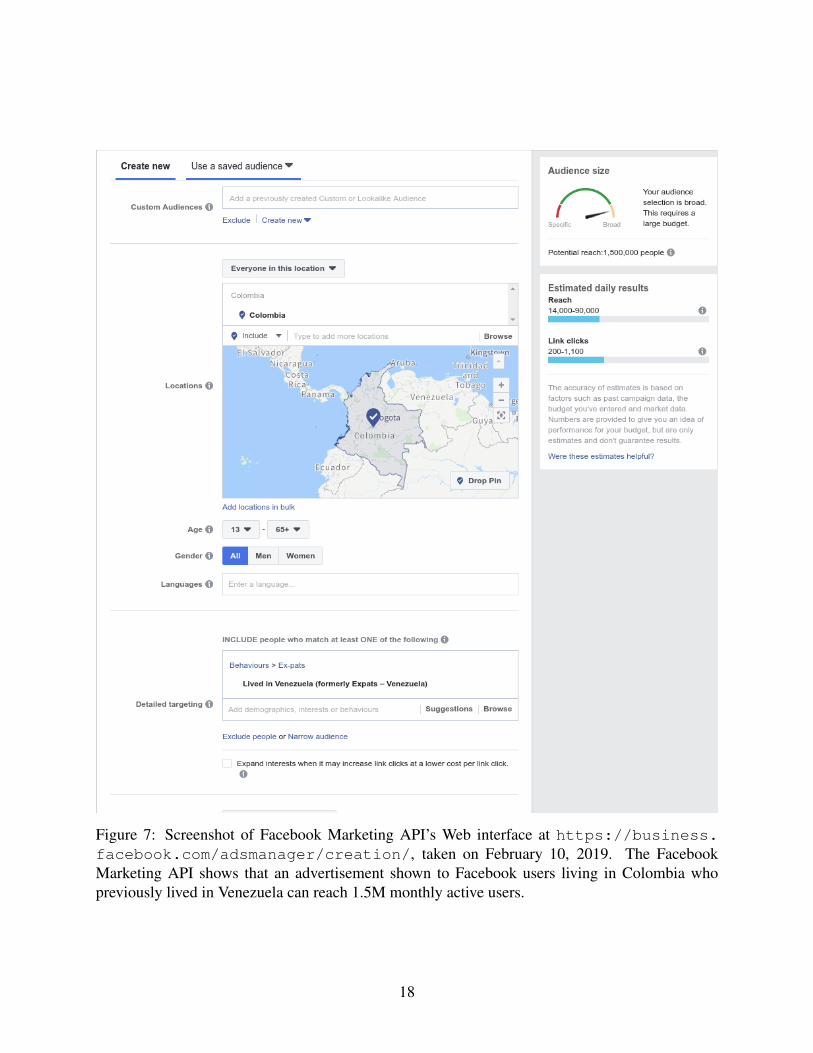
Figure 7: Screenshot of Facebook Marketing API’s Web interface at https://business.facebook.com/adsmanager/creation/, taken on February 10, 2019. The FacebookMarketing API shows that an advertisement shown to Facebook users living in Colombia whopreviously lived in Venezuela can reach 1.5M monthly active users.
18
Related Documents