CBRE RESEARCH REAL ESTATE MARKET OUTLOOK Canada

Welcome message from author
This document is posted to help you gain knowledge. Please leave a comment to let me know what you think about it! Share it to your friends and learn new things together.
Transcript

CBRE RESEARCH
REAL ESTATE MARKET OUTLOOK
Canada
2© 2017 CBRE Limited CBRE RESEARCH
TABLE OF CONTENTS
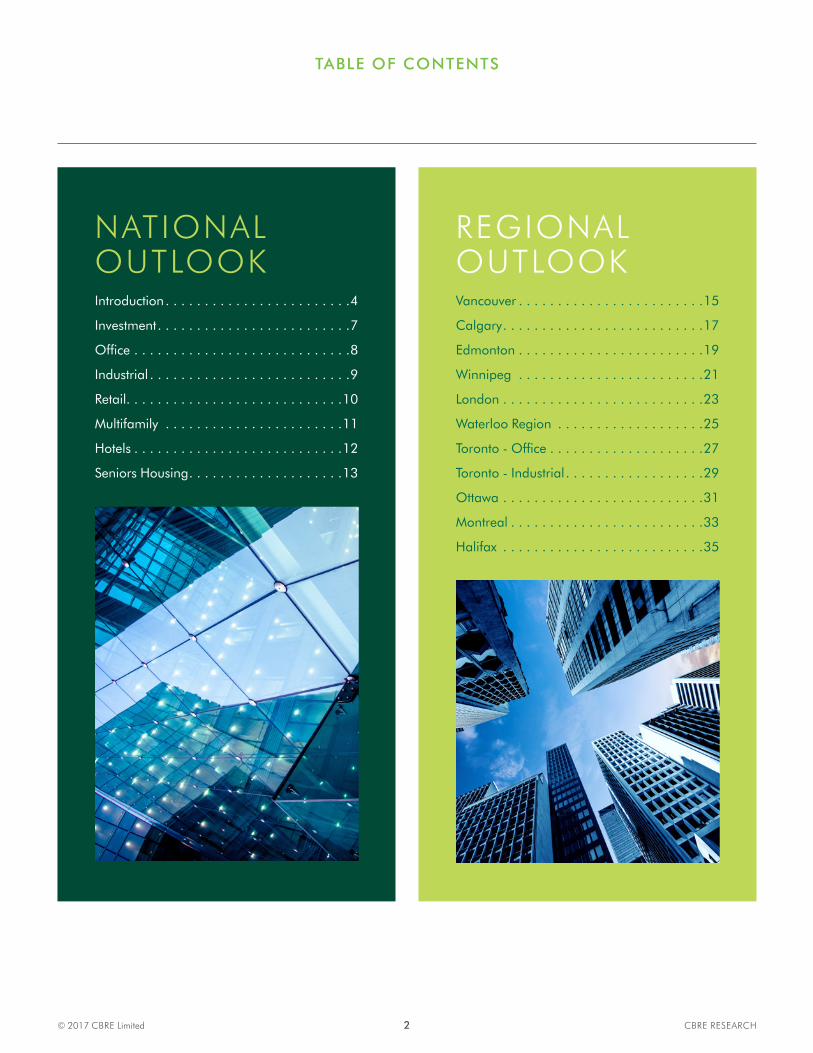
NATIONAL OUTLOOKIntroduction . . . . . . . . . . . . . . . . . . . . . . . .4
Investment . . . . . . . . . . . . . . . . . . . . . . . . .7
Office . . . . . . . . . . . . . . . . . . . . . . . . . . . .8
Industrial . . . . . . . . . . . . . . . . . . . . . . . . . .9
Retail . . . . . . . . . . . . . . . . . . . . . . . . . . . .10
Multifamily . . . . . . . . . . . . . . . . . . . . . . .11
Hotels . . . . . . . . . . . . . . . . . . . . . . . . . . .12
Seniors Housing . . . . . . . . . . . . . . . . . . . .13
REGIONAL OUTLOOKVancouver . . . . . . . . . . . . . . . . . . . . . . . .15
Calgary . . . . . . . . . . . . . . . . . . . . . . . . . .17
Edmonton . . . . . . . . . . . . . . . . . . . . . . . .19
Winnipeg . . . . . . . . . . . . . . . . . . . . . . . .21
London . . . . . . . . . . . . . . . . . . . . . . . . . .23
Waterloo Region . . . . . . . . . . . . . . . . . . .25
Toronto - Office . . . . . . . . . . . . . . . . . . . .27
Toronto - Industrial . . . . . . . . . . . . . . . . . .29
Ottawa . . . . . . . . . . . . . . . . . . . . . . . . . .31
Montreal . . . . . . . . . . . . . . . . . . . . . . . . .33
Halifax . . . . . . . . . . . . . . . . . . . . . . . . . .35

National Outlook

NATIONAL OUTLOOK
4© 2017 CBRE Limited CBRE RESEARCH4© 2017 CBRE Limited CBRE RESEARCH
INTRODUCTION
COMMERCIAL REAL ESTATE IN THE ERA OF CHANGE
Economic, technological and social change are running themes in a world that, more than ever, appears to be susceptible to dramatic shifts. The concept of change is familiar, but the pace at which change is happening has left many searching for safety and stability. Forecasters can no longer default to ‘more of the same’ tropes and the Canadian commercial real estate industry is no different.
A faster pace of change also means a greater frequency of opportunity. Canadian real estate is benefiting from increased uncertainty abroad
as the country’s relative safety and stability continues to attract businesses and investment capital. While property fundamentals have improved and values have increased almost uniformly across the country, a critical assessment of commercial property types and city specifics is essential in an evolving landscape.
As the pace of change accelerates, there will be more wins and losses to go around. For that reason, forecasting has never been more important. Unfortunately, it has rarely been more difficult.
“Change is the law of life.” - John F. Kennedy

NATIONAL OUTLOOK
5© 2017 CBRE Limited CBRE RESEARCH5© 2017 CBRE Limited CBRE RESEARCH
One correlation that has endured sophisticated analysis and technological advancement is the link between employment and economic growth, and the demand for commercial real estate. For an industry that has solid fundamentals to begin with, one would have to be encouraged by the fact that Canada’s GDP is forecast to grow at 2.1% for the next two years on a modest expansion of exports and increased business investment.
Other positive indicators for the economy and commercial real estate in general include the stabilization of oil prices, up from cyclical lows, which will alleviate some pressure on oil producers and increase rig counts at faster rates. Oil’s drag on the economy is dissipating and economic growth will be more regionally balanced in 2017 with Alberta expansion more in-line with the rest of country. Only 3.7% of the $125.0 billion that the federal government has earmarked for infrastructure spending has been allocated and stronger economic growth in the U.S. is expected to increase demand for Canadian goods and commodities.
The downside risks are also mounting on the economic front. While full-time employment has recently increased there has been a long-term trend towards precarious, part-time employment. There is a persistent lack of innovation and excess capacity on the manufacturing front, in addition to record-high household debt levels and increasing protectionist language from our major trading partners.
Despite the recent geopolitical shifts, most of the risks will take time to play out and may not have a material impact in 2017. The Canadian commercial real estate market is on a sustainable path, but now more than ever, there is the potential for speed bumps along the way.
ECONOMIC OUTLOOK
CANADIAN GDP
+2.1%Forecast for 2017 and 2018
INFRASTRUCTURE FUNDS
$125 BMost dollars yet to be deployed
“The Canadian commercial real estate market is on a sustainable path, but now more than ever, there is the potential for speed bumps along the way.”
3.7%

NATIONAL OUTLOOK
6© 2017 CBRE Limited CBRE RESEARCH6© 2017 CBRE Limited CBRE RESEARCH
Canada is coming off a record-setting $34.7 billion in commercial property sales in 2016. Canada’s two major gateway cities, Vancouver and Toronto, will continue to absorb the majority of the new foreign capital entering the country and with cap rates on trophy office product below 4.00%, valuations in our major cities will be on par with New York, Paris, London and Shanghai. Investment activity in 2017 is expected to total $31.9 billion across all sectors, representing the third best year in Canadian history.
Foreign capital accounted for 27.0% of all commercial real estate sales in 2016. National cap rates ended the year at record lows for most commercial property types and rising prices are causing some domestic investors to take pause; however, the continued influx of foreign capital has the potential to propel values even higher in 2017. Capital flows will have to navigate new regulations implemented by both the Chinese and British Columbia governments.
Toronto enters 2017 on the A List as far as commercial real estate performance from a North American perspective. Toronto’s downtown office vacancy rate is the lowest of any major market in North America, its industrial availability rate is the second lowest, and its retail sector is a top destination for new entrants. Strong demand is likely to initiate a wave of development, including a potential 10.0 million sq. ft. of new office space.
Rising prices and the pursuit of yield will encourage investors to consider developing new product. With the previous development cycle trailing off, multiple sectors are primed to turn the tide and planning will ramp up in 2017. Firms that bring quality product to the market efficiently will be rewarded by this highly liquid environment. Mixed-use will be the gold standard as owners look to maximize properties and create environments that appeal to tenants.
One of Canada’s biggest real estate stories in 2017 will be the rise in land prices as residential housing markets remain robust and commercial development gears up. A lack of developable land, especially in Vancouver and Toronto, will increase competition for prime urban redevelopment sites in major markets, especially along transit nodes. Overall land investment will remain robust in 2017, and volume will either meet or exceed last year’s record high.
1. CANADA AT THE FOREFRONT
2. FOREIGN INVESTMENT APPETITE
3. TORONTO ENVY
4. PLANNING ANOTHER DEVELOPMENT CYCLE
5. LAND CONTINUES TO OUTPERFORM
KEY TRENDS

KEY TRENDS
• At $31.9 billion, commercial real estate investment volume is expected to log the third highest annual total in Canadian history in 2017. Activity will be driven by demand for commercial property in Toronto and Vancouver as their stature on the global stage continues to grow and attract foreign and domestic capital. These two markets will account for almost two-thirds of the total national investment volume.
• The Greater Toronto Area will be the leading investment market in Canada in 2017. Activity will focus on a robust office market and growth in the increasingly influential industrial and land sectors. Investment volumes in the GTA are expected to reach a new annual record total of $12.6 billion, 3.2% higher than 2016.
• Even with the potential for interest rate hikes south of the border in 2017, Canadian bond yields should remain at historical lows which will maintain the current spread with cap rates. Furthermore, an influx of foreign capital and the perceived lack of risk in the Canadian markets will protect against any sudden drop in asset pricing and will ensure that commercial real estate yields remain attractive in 2017.
• Foreign investment reached new highs in 2016, led by Chinese capital. While capital controls have the potential to limit out-flows from China, investment activity from European investors is expected to increase as investors seek safety in a changeable environment. Sustained foreign interest, coupled with strong demand from private domestic investors, will produce one of the best investment years on record.
NATIONAL OUTLOOK
INVESTMENT
7© 2017 CBRE Limited CBRE RESEARCH
National Investment Statistics
* Market and surrounding region and portion of portfolio dealSource: CBRE Limited, 2017.
INVESTMENT VOLUME(MILLIONS $) 2015 2016 2017 F YoY
Office $5,022 $7,752 $7,335
Industrial $4,634 $5,794 $5,888
Retail $4,593 $6,780 $5,746
Multifamily $5,532 $5,682 $4,842
ICI Land $4,280 $5,149 $5,195
Hotel* $2,060 $3,548 $2,930
Total $26,121 $34,705 $31,936
$31.9 billion
$25.4 billion10-YR AVERAGE
2017
Top 3 finish for investment predicted
NATIONAL AVERAGE CAP RATE
5.85%Record low cap rate reflects strong fundamentals
and demand for commercial property

KEY TRENDS
• Over 9.0 million sq. ft. of new supply combined with a depressed energy sector led to an increase in the national office vacancy rate in 2016. In 2017, a 25.0% decrease in new construction completions and stabilization in the energy sector will begin to slow the rise in vacancy.
• The Alberta vacancy rate stood at 22.1% in 2016 and will continue to drive up the national average in the year ahead. Excluding Calgary and Edmonton, the Canadian office vacancy rate would be 11.1%, down from 13.3% when included. Alberta currently comprises one-third of total national office construction activity, 78.0% of which is downtown. As such, vacancy rates outside of Alberta signal the potential for a new office development cycle.
• Prospective office tenants will face a disconnect between the small, less desirable configurations that are available in major markets and the large, well-located, quality spaces that they require. Demand for space in the downtown cores of Toronto and Vancouver will remain strong in 2017, as tenants continue their flight-to-quality and enhance the gap between downtown and suburban office markets.
• Office solutions will increasingly evolve to reflect different corporate cultures, company brands and business goals. Employers are realizing that that they do not have a binary choice between closed offices and open, co-working environments. In 2017, the challenge will be to understand and satisfy the needs of a multigenerational workforce while maintaining a focus on the growing portion of millennial office workers.
• Technology companies will account for 25.0% of tenants actively seeking space in Canada and will increasingly anchor new office developments. This prominent role will allow the tech industry to shape the overall design of new office towers and mixed-use developments in accordance with their preference for innovative office designs and workplace strategies. In addition to the large technology firms that are locating in top-tier office towers, smaller technology firms, startups and boutiques will continue to drive demand in the Class B and C office markets across Canada.
NATIONAL OUTLOOK
OFFICE
8© 2017 CBRE Limited CBRE RESEARCH
National Office Statistics
Source: CBRE Limited, 2017.
CENTRAL (ALL CLASSES) 2015 2016 2017 F YoY
Vacancy Rate 10.1% 11.2% 12.2%
Class A Net Asking Rent (per sq. ft.) $24.29 $21.82 $21.54
Net Absorption (million sq. ft. ) (1.29) 0.49 1.03
New Supply (million sq. ft.) 3.49 4.70 3.89
Under Construction (million sq. ft.) 9.90 6.65 5.46
SUBURBAN (ALL CLASSES)
Vacancy Rate 14.8% 15.8% 16.2%
Class A Net Asking Rent (per sq. ft.) $17.96 $18.24 $18.33
Net Absorption (million sq. ft. ) (0.81) 1.07 1.65
New Supply (million sq. ft.) 2.82 4.34 2.89
Under Construction (million sq. ft.) 6.77 2.73 3.24
OVERALL (ALL CLASSES)
Vacancy Rate 12.2% 13.3% 14.0%
Class A Net Asking Rent (per sq. ft.) $20.79 $19.97 $19.98
Net Absorption (million sq. ft. ) (2.10) 1.56 2.68
New Supply (million sq. ft.) 6.31 9.05 6.78
Under Construction (million sq. ft.) 16.67 9.37 8.70
202050%
201733%
Themillenialworkforce
OFFICE CONSTRUCTION IMBALANCE
33.0%Bulk of national office construction
coming on line in Alberta

KEY TRENDS
• Vancouver and Toronto will remain two of North America’s most competitive industrial markets and account for the majority of Canada’s industrial sales and leasing activity. Limited availabilities and robust demand will continue into 2017, driving leasing and investment activity to outpace the prior year. Sale prices and rental rates will reach new highs in many markets.
• The e-commerce induced expansion of the distribution and logistics industry will drive industrial leasing and investment activity. In 2017, the emphasis will turn to perfecting ‘Last Mile’ delivery. Retailers will increasingly choose to partner with third party logistics providers or retrofit existing assets to include online order fulfillment centres. Other businesses will strategically identify new, smaller urban locations close to urban populations.
• The amount of industrial space under construction is at a seven-year low of 9.5 million sq. ft., which will support record low availability rates in 2017, especially in gateway markets. Although tenant demand for Class A inventory will continue to increase, limited development land and high construction costs will force developers to be highly selective before they initiate new construction.
• The lack of available opportunities for tenants, particularly in gateway markets, will encourage many to consider renewing in existing space. Competitive market conditions will continue to put upward pressure on rental rates across the country, particularly for Class A space located within proximity to urban centres. However, landlords with new large bay product in more remote areas may choose to forego higher rental rates in favour of longer lease terms.
• In 2017, two wild cards could impact the Canadian industrial market. Firstly, businesses will be forced to react to changing environmental regulations, particularly in Alberta and Ontario, where there are new costs for carbon emissions. Secondly, the potential renegotiation of NAFTA could alter the free flow of goods across the world’s most integrated manufacturing and transportation logistics network.
NATIONAL OUTLOOK
INDUSTRIAL
9© 2017 CBRE Limited CBRE RESEARCH
National Industrial Statistics
Source: CBRE Limited, 2017.
2015 2016 2017 F YoY
Availability Rate 5.7% 5.3% 5.0%
Net Asking Rent (per sq. ft.) $6.48 $6.60 $6.65
Sale Price (per sq. ft.) $110.39 $120.80 $122.86
Net Absorption (million sq. ft.) 17.17 17.89 13.54
New Supply (million sq. ft.) 23.20 13.14 9.65
Under Construction (million sq. ft.) 13.73 11.35 9.51
UNDER CONSTRUCTION
11.3New supply at a three-year low
millionsq. ft.
Canadian industrial markets amongthe tightest in North America
VANCOUVER
#4
TORONTO
#2

KEY TRENDS
• In 2017, technological disruption will be felt more than ever in the Canadian retail market. While initially slow to adapt, both online and physical stores will elevate customer experiences by including complementary channels for researching, discovering and purchasing products. The seamless integration of the online and physical store network will be at the forefront of this change.
• Canada’s premier shopping destinations will continue to become social gathering places and entertainment centres. Successful landlords and retailers will increasingly integrate experiential elements such as food halls, product testing pop-ups, tech and equipment labs, and VIP movie theatres into their properties. By creating experiences that cannot be replicated online, shoppers will seek out physical retailers for what they can experience rather than what can simply be acquired.
• Retailers will emphasize location and smaller, more efficient footprints in 2017 for all format types – urban street front, power centres and premier shopping centres. Expansion will be approached cautiously, including established foreign retailers that are looking to fill-out their Canadian footprint. To that end, retail leasing velocity will be polarized with the highest quality centres and largest markets dominating activity.
• The rise of mixed-use urban developments will result in the creation of new neighborhoods with a strong sense of placemaking. The tenant mix in these developments, including local artisanal shops, restaurants and other amenities, will make these spaces engaging destinations and provide thriving opportunities for the sector in 2017.
• Logistics will be top of mind for retailers as e-commerce continues to chip away at physical store sales. Reverse supply chain logistics, which facilitate with returns in stores or at warehouses, will become a growing concern. Upgrading systems and innovative fulfillment solutions will be the key to successful retail operations going forward.
NATIONAL OUTLOOK
RETAIL
10© 2017 CBRE Limited CBRE RESEARCH
National Retail Statistics
Source: CBRE Limited, 2017.
2015 2016 2017 F YoY
Total Retail Sales (YoY) 1.7% 3.8% 2.7%
ONLINE SALE RETURNS
30.0%3.75X higher than in-store returns
$1.0 billionin online sales =
1.0 million sq. ft.of distribution space

KEY TRENDS
• New purpose-built rental will begin to materially impact the residential markets in Toronto and Vancouver in 2017. Continuously rising home ownership costs and surging rental rates in gateway markets will spur new construction over the next three to four years. Pension and institutional investors seeking stable, long-term investments will lead the way.
• The stigma against renting will continue to abate in 2017, resulting in a larger renter pool and more long-term renters. Baby boomers and millennials will be attracted to condo-quality housing options that are professionally managed and include new technologies like wifi zones and Uber waiting lounges.
• As multifamily valuations reach new highs, investment discipline will be the main story in 2017, particularly for larger assets. Strong multifamily fundamentals and the prospect of a stable income stream propelled national apartment investment volume to near record levels in 2016. Expect investment activity to normalize in 2017 for the sector overall.
• Smaller and medium-sized deals will emerge as the most active segment of the multifamily investment market in 2017. Montreal, Toronto and Vancouver saw the total proportion of deals above $25.0 million decrease by a combined 57% year-over-year, from $2.3 billion in 2015 to $1.0 billion in 2016. This trend is more a function of available product than it is demand.
• Demand will remain strong for all classes of multifamily product, however, core assets with upside potential, as well as Class A properties in secondary markets near gateway cities will garner most investor attention. Victoria, Hamilton and Waterloo Region, will continue to see cap rates move lower for quality product while Class B and C product in secondary markets will not see similar cap rate compression.
NATIONAL OUTLOOK
MULTIFAMILY
11© 2017 CBRE Limited CBRE RESEARCH
INVESTMENT FOCUS
<$25 million Small and medium-sized deals to dominate
Condo quality rentalconstruction on the rise
FORRENT
FORRENT
FORRENT
FORRENT
KEY TRENDS
• The low Canadian dollar will continue to entice visitors from the U.S. and Asia while also encouraging Canadians to vacation closer to home. Global inbound overnight trips to Canada increased 11.5% in November 2016 according to Statistics Canada and overall demand is expected to rise in 2017. This level of interest will support strong hotel operating fundamentals, especially in Vancouver, Toronto, Montreal and the resort sector.
• British Columbia and Ontario will be the strongest hotel markets in 2017, with Vancouver and Toronto’s RevPAR is expected to rise by 8.0% and 6.0%, respectively. Growing hotel demand is expected in Quebec, along with a rebound in activity in Alberta and Saskatchewan where there is a growing sense that the bottom of the resource downturn has been reached.
• As hotel occupancy rates and RevPAR reach new highs in major markets, foreign investor demand for Canadian hotel assets will remain a significant force and influence hotel cap rates in gateway cities in 2017. This follows a year in which foreign hotel investment reached $2.7 billion, about two-thirds of which stemmed from two portfolio transactions.
• Total hotel investment accounted for 10.2% of overall Canadian commercial investment activity last year, led by large portfolio transactions. Large, single hotel assets will remain prevalent and attract foreign capital from the U.S. and other countries abroad, which should keep 2017 hotel investment volumes at healthy levels.
• A host of factors will buoy the hotel market and help limit the negative impact of technology. Airbnb is geared towards leisure travellers which is only a quarter of the market, while business travel and longer-term stays are increasing and are better served by traditional hoteliers.
NATIONAL OUTLOOK
HOTEL
12© 2017 CBRE Limited CBRE RESEARCH
HOTEL INVESTMENT
10.2%Percentage of total commercial transactions
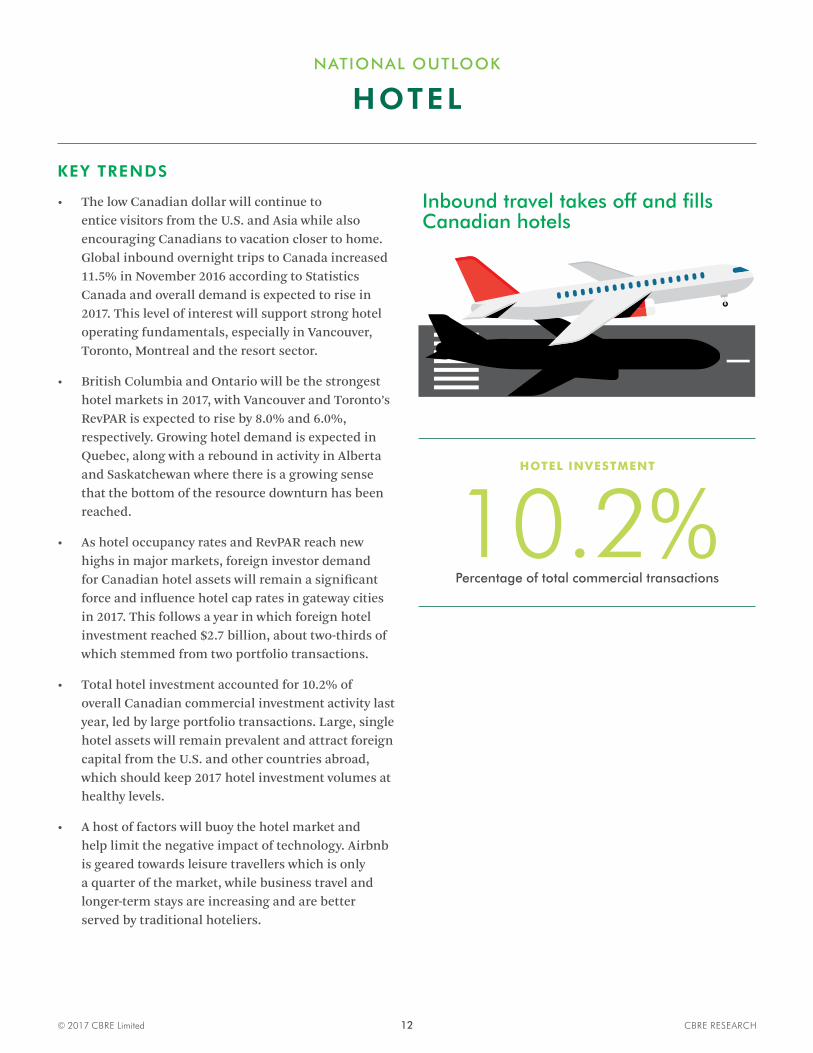
Inbound travel takes off and fillsCanadian hotels

KEY TRENDS
• Lifestyle communities will be the dominant trend in seniors housing development in 2017. Facilities will incorporate more active lifestyles which appeal to seniors who do not require assisted living services, but are still looking to offload the responsibilities of homeownership. This could mean that seniors will choose to move into seniors housing formats earlier and drop the average age of new residents from the current average of 83 years.
• Developers will seek out opportunities in both urban and rural locations as user preferences remain split. Access to amenities in high-density urban neighbourhoods will attract active prospective tenants, while smaller rural communities will be desirable destinations for others. Regardless of urban or rural, there is an overriding desire to age in place. This is one locational factor that differentiates seniors housing from other commercial property types.
• The major players focused on gaining scale through acquisition over the past five years. The trend will shift towards upgrading portfolio quality through capital recycling. Class B product divestments will fund portfolio revitalization through development and targeted Class A acquisitions
• Strong competition for Class A assets will force investors to seek alternative investment strategies. Development will enable new investors to enter the seniors housing market and allow existing investors to improve and grow their portfolios.
• The seniors housing market continues to benefit from robust investment demand based on strong and improving fundamentals and the compelling long-term demographic outlook. As a proportion of the overall commercial real estate investment market, seniors housing transaction volumes continue to account for an increasing share of the overall pie.
• The seniors housing sector appears to be undergoing a ‘re-rating’ by investors, who are becoming comfortable in bidding down the historic spread which has existed between seniors housing and apartment investment returns.
NATIONAL OUTLOOK
SENIORS HOUSING
13© 2017 CBRE Limited CBRE RESEARCH
83 Lifestyle amenities could drop the
average age of new residents
Capital recycling will drive Class B divestments to fund Class A developments
average age

Regional Outlook

REGIONAL OUTLOOK
15© 2017 CBRE Limited CBRE RESEARCH15© 2017 CBRE Limited CBRE RESEARCH
REGIONAL OUTLOOK
VANCOUVER
KEY TRENDS
• Commercial real estate investment volume was propelled to $8.0 billion in 2016 by a wave of foreign capital seeking safety and stability. Market watchers are asking if this level of activity and pricing are sustainable as municipal, provincial and federal governments introduce measures to slow the appreciation of residential homes, which could indirectly discourage the flow of foreign capital to commercial assets in the region. For commercial real estate, efforts by the Chinese government to stem the outflow of capital are likely to be more impactful than any domestic policy changes and should be closely monitored in 2017.
• There are ample reasons to believe that Vancouver investment activity will be sustained in the year ahead: geopolitical instability is likely to continue to encourage a flight to quality, income producing assets; global gateway cities will be sought after; and investors will find it difficult to pass up opportunities to own the rare, iconic properties that are coming to market while others will be enticed to sell into favourable market conditions.
• Vancouver’s office market proved to be resilient in 2016. 682,736 sq.ft. of new space was completed and vacancy rates fell as technology and creative tenants leased space across all classes. In 2017, it would not be surprising to see a tower built entirely speculatively given the strong market fundamentals in the downtown core. The downward pressure on vacancy rates is not, however, limited to the downtown core. Three factors are expected to decrease suburban vacancy rates over the next 12 months – especially
nodes located on transit lines: a limited amount of new construction; inadequate large block opportunities downtown; and technology and creative tenants seeking a live-work-play lifestyle for millennial employees.
• Expect the commercial strata market – industrial, retail and office – to grow in 2017 as a result of heightened investor and user demand for new, strata ownership opportunities. Increased demand for strata product stems from increasing rents, a low interest rate environment and foreign investors seeking alternative investment opportunities in response to the 15% foreign capital tax on Class 1 residential property.
• Over $26.6 billion of planned infrastructure spending will buoy the regional economy through 2037. This will support blue and white collar job growth and have positive real estate implications. Enhanced infrastructure and less than 20 years of developable land in the core will put upward pressure on land prices. The lack of available land will require creativity if developers are to maximize the value and potential of suboptimal sites.
<4 .00% Downtown Office Class A Cap Rates
TECH DISTRIBUTION
FILM20 year diversification ofVancouver’s economy Infrastructure spend
$26.6BILLIONthrough
2037$5.5
BILLION
2010

REGIONAL OUTLOOK
16© 2017 CBRE Limited CBRE RESEARCH
MARKET STATISTICS
PROJECTS TO WATCH:
16© 2017 CBRE Limited CBRE RESEARCH
Office
Retail
Industrial
Multifamily
Investment
Source: Canada Mortgage and Housing Corp., CBRE Limited, 2017.
Source: CBRE Limited, 2017.
*Market and surrounding regionSource: CBRE Limited, 2017.
Source: CBRE Limited, 2017.
Source: CBRE Limited, 2017.
The Exchange Office TowerThe Exchange is a 372,000 sq.ft., Class AAA office building in Vancouver’s financial core. This 31-storey office building has achieved LEED Platinum certification.
Click here for more information
The Amazing BrentwoodShape Properties’ 28.0 acre project at Willingdon and Lougheed Highway will redevelop and expand the retail offering to 1.1 million sq. ft., with 6,000 residential units, and up to 500,000 sq. ft. of office space starting in 2019.
Click here for more information
Tilbury Distribution Centre GWL and Hydro Quebec’s project will deliver 289,000 sq.ft. of Class A speculative industrial product in Delta. The project is conveniently located near the Delta Deep Sea Port terminal in close proximity to three major highways and the US border, and is scheduled for delivery Q3 2017.
Click here for more information
CENTRAL 2015 2016 2017 F YoY
Vacancy Rate 10.0% 7.7% 7.4%
Class A Net Asking Rent (per sq. ft.) $32.75 $30.25 $31.15
Net Absorption (million sq. ft. ) 0.90 0.47 0.17
Class A Cap Rate (%) 4.50-5.00 3.75-4.25 3.75-4.25
New Supply (million sq. ft.) 1.78 0.00 0.11
Under Construction (million sq. ft.) 0.48 0.76 0.65
SUBURBAN
Vacancy Rate 12.2% 13.8% 14.1%
Class A Net Asking Rent (per sq. ft.) $23.30 $23.93 $24.53
Net Absorption (million sq. ft. ) 0.40 0.13 0.44
Class A & B Cap Rate (%) 5.50-6.50 4.75-5.50 4.75-5.50
New Supply (million sq. ft.) 0.17 0.68 0.59
Under Construction (million sq. ft.) 1.17 0.85 0.39
OVERALL
Vacancy Rate 11.1% 10.8% 10.8%
Class A Net Asking Rent (per sq. ft.) $26.97 $25.73 $26.78
Net Absorption (million sq. ft. ) 1.30 0.60 0.61
New Supply (million sq. ft.) 1.95 0.68 0.70
Under Construction (million sq. ft.) 1.65 1.60 1.04
2015 2016 2017 F YoY
Availability Rate 4.4% 3.9% 3.9%
Net Asking Rent (per sq. ft.) $8.46 $9.00 $9.15
Sale Price (per sq. ft.) $219.00 $203.70 $217.61
Net Absorption (million sq. ft.) 6.70 4.01 3.55
Class A & B Cap Rate (%) 5.00-6.25 4.50-5.50 4.50-5.50
New Supply (million sq. ft.) 2.63 3.63 3.77
Under Construction (million sq. ft.) 4.74 4.24 3.97
INVESTMENT VOLUME (MILLIONS) 2015 2016 2017 F YoY
Office $481 $2,220 $1,850
Industrial $853 $1,185 $900
Retail $1,078 $1,608 $1,700
Multifamily $1,231 $1,100 $1,000
ICI Land $1,509 $1,567 $1,700
Hotel * $583 $393 $350
Total $5,735 $8,073 $7,500 2015 2016 2017 F YoY
Total Retail Sales (YoY) 10.2% 7.1% 4.3%
Neighbourhood Cap Rate (%) 5.00-5.75 5.00-5.50 5.00-5.50
2015 2016 2017 F YoY
Overall Vacancy Rate (%) 0.8% 0.7% 0.8%
Apartment Cap Rate (%) 4.25-4.75 3.00-3.50 2.75-3.50
VANCOUVER
REGIONAL OUTLOOK
17© 2017 CBRE Limited CBRE RESEARCH17© 2017 CBRE Limited CBRE RESEARCH
REGIONAL OUTLOOK
CALGARY
KEY TRENDS
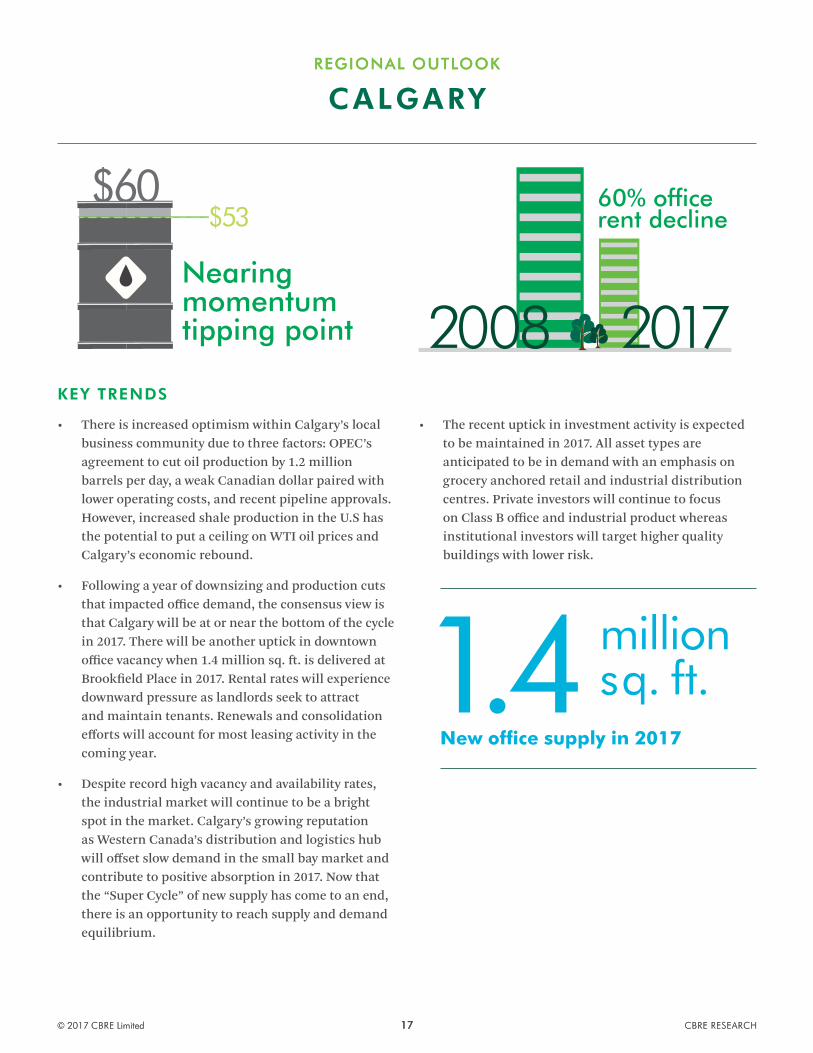
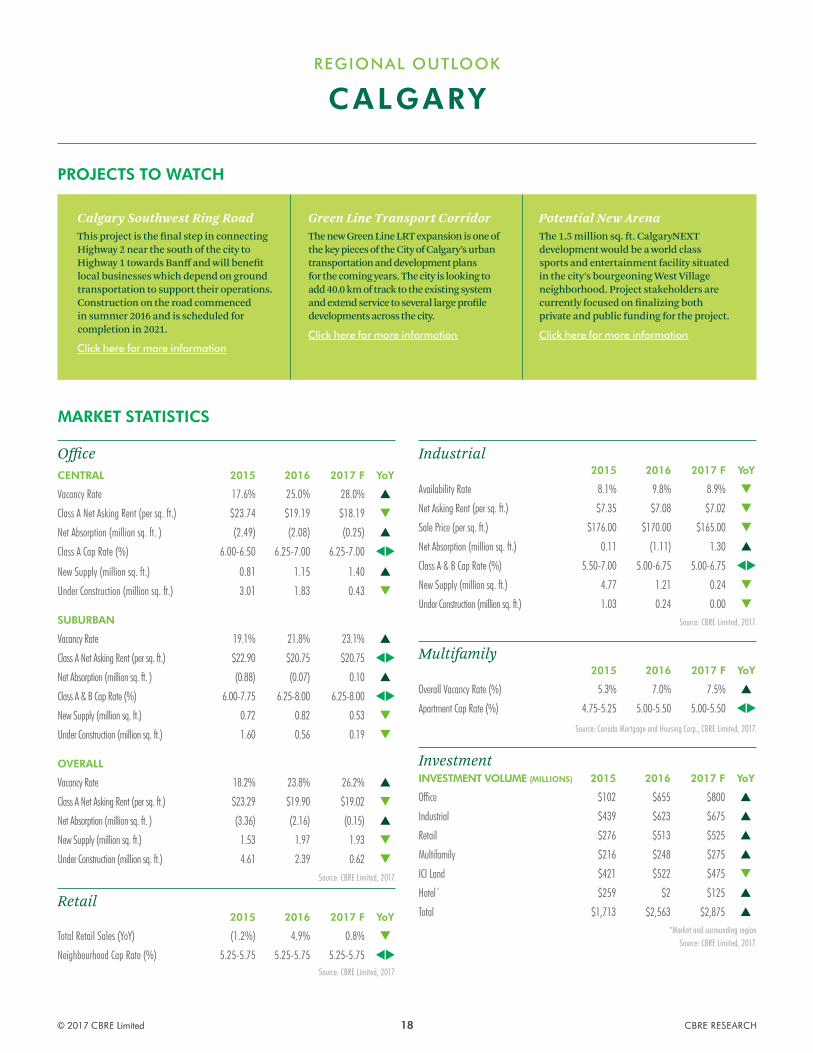
• There is increased optimism within Calgary’s local business community due to three factors: OPEC’s agreement to cut oil production by 1.2 million barrels per day, a weak Canadian dollar paired with lower operating costs, and recent pipeline approvals. However, increased shale production in the U.S has the potential to put a ceiling on WTI oil prices and Calgary’s economic rebound.
• Following a year of downsizing and production cuts that impacted office demand, the consensus view is that Calgary will be at or near the bottom of the cycle in 2017. There will be another uptick in downtown office vacancy when 1.4 million sq. ft. is delivered at Brookfield Place in 2017. Rental rates will experience downward pressure as landlords seek to attract and maintain tenants. Renewals and consolidation efforts will account for most leasing activity in the coming year.
• Despite record high vacancy and availability rates, the industrial market will continue to be a bright spot in the market. Calgary’s growing reputation as Western Canada’s distribution and logistics hub will offset slow demand in the small bay market and contribute to positive absorption in 2017. Now that the “Super Cycle” of new supply has come to an end, there is an opportunity to reach supply and demand equilibrium.
• The recent uptick in investment activity is expected to be maintained in 2017. All asset types are anticipated to be in demand with an emphasis on grocery anchored retail and industrial distribution centres. Private investors will continue to focus on Class B office and industrial product whereas institutional investors will target higher quality buildings with lower risk.
Nearingmomentumtipping point
$60$53
60% officerent decline
2008 2017
1 .4 New office supply in 2017
millionsq . ft .
REGIONAL OUTLOOK
18© 2017 CBRE Limited CBRE RESEARCH
MARKET STATISTICS
PROJECTS TO WATCH:
18© 2017 CBRE Limited CBRE RESEARCH
Office
Retail
Industrial
Multifamily
Investment
Source: Canada Mortgage and Housing Corp., CBRE Limited, 2017.
Source: CBRE Limited, 2017.
*Market and surrounding regionSource: CBRE Limited, 2017.
Source: CBRE Limited, 2017.
Source: CBRE Limited, 2017.
Calgary Southwest Ring RoadThis project is the final step in connecting Highway 2 near the south of the city to Highway 1 towards Banff and will benefit local businesses which depend on ground transportation to support their operations. Construction on the road commenced in summer 2016 and is scheduled for completion in 2021.
Click here for more information
Green Line Transport CorridorThe new Green Line LRT expansion is one of the key pieces of the City of Calgary’s urban transportation and development plans for the coming years. The city is looking to add 40.0 km of track to the existing system and extend service to several large profile developments across the city.
Click here for more information
Potential New ArenaThe 1.5 million sq. ft. CalgaryNEXT development would be a world class sports and entertainment facility situated in the city’s bourgeoning West Village neighborhood. Project stakeholders are currently focused on finalizing both private and public funding for the project.
Click here for more information
CENTRAL 2015 2016 2017 F YoY
Vacancy Rate 17.6% 25.0% 28.0%
Class A Net Asking Rent (per sq. ft.) $23.74 $19.19 $18.19
Net Absorption (million sq. ft. ) (2.49) (2.08) (0.25)
Class A Cap Rate (%) 6.00-6.50 6.25-7.00 6.25-7.00
New Supply (million sq. ft.) 0.81 1.15 1.40
Under Construction (million sq. ft.) 3.01 1.83 0.43
SUBURBAN
Vacancy Rate 19.1% 21.8% 23.1%
Class A Net Asking Rent (per sq. ft.) $22.90 $20.75 $20.75
Net Absorption (million sq. ft. ) (0.88) (0.07) 0.10
Class A & B Cap Rate (%) 6.00-7.75 6.25-8.00 6.25-8.00
New Supply (million sq. ft.) 0.72 0.82 0.53
Under Construction (million sq. ft.) 1.60 0.56 0.19
OVERALL
Vacancy Rate 18.2% 23.8% 26.2%
Class A Net Asking Rent (per sq. ft.) $23.29 $19.90 $19.02
Net Absorption (million sq. ft. ) (3.36) (2.16) (0.15)
New Supply (million sq. ft.) 1.53 1.97 1.93
Under Construction (million sq. ft.) 4.61 2.39 0.62
2015 2016 2017 F YoY
Availability Rate 8.1% 9.8% 8.9%
Net Asking Rent (per sq. ft.) $7.35 $7.08 $7.02
Sale Price (per sq. ft.) $176.00 $170.00 $165.00
Net Absorption (million sq. ft.) 0.11 (1.11) 1.30
Class A & B Cap Rate (%) 5.50-7.00 5.00-6.75 5.00-6.75
New Supply (million sq. ft.) 4.77 1.21 0.24
Under Construction (million sq. ft.) 1.03 0.24 0.00
INVESTMENT VOLUME (MILLIONS) 2015 2016 2017 F YoY
Office $102 $655 $800
Industrial $439 $623 $675
Retail $276 $513 $525
Multifamily $216 $248 $275
ICI Land $421 $522 $475
Hotel * $259 $2 $125
Total $1,713 $2,563 $2,875 2015 2016 2017 F YoY
Total Retail Sales (YoY) (1.2%) 4.9% 0.8%
Neighbourhood Cap Rate (%) 5.25-5.75 5.25-5.75 5.25-5.75
2015 2016 2017 F YoY
Overall Vacancy Rate (%) 5.3% 7.0% 7.5%
Apartment Cap Rate (%) 4.75-5.25 5.00-5.50 5.00-5.50
CALGARY

REGIONAL OUTLOOK
19© 2017 CBRE Limited CBRE RESEARCH19© 2017 CBRE Limited CBRE RESEARCH
REGIONAL OUTLOOK
EDMONTON
KEY TRENDS
• In addition to the gradual increase in oil prices, the stage is set for a modest economic recovery in the years ahead. Leasing activity is expected to remain soft among most asset types and is not likely to rebound as strongly compared to previous recoveries. External uncertainty surrounding political conditions could overshadow economic improvements.
• Edmonton’s downtown landscape has begun to change with the completion of Rogers Place, the development of Ice District, several new high- rise residential towers, and the new J. W. Marriot Hotel. Over 1.8 million sq. ft. of office space will have been completed between 2016 and 2018. Additionally, the expansion of Edmonton’s LRT system will increase access to downtown from suburban Edmonton. These developments will continue to transform the core into a vibrant community.
• On the investment front, Edmonton will retreat slightly from a record 2016 which stemmed from a record performance in the office, industrial, retail and multifamily sectors. Quality assets are still in demand across all product types. Institutional investors will need to continue to adopt a ‘‘build-to-core’’ philosophy to secure retail and industrial assets. It is anticipated that the lending community will continue to underwrite Alberta similarly to what was seen over the last few years. As always, term and covenant will be driving factors in both equity and debt decisions.
• There is a flight to quality in both the industrial and downtown office markets. Tenants are demanding workplace solutions that are both efficient and attractive for today’s new workforce. There are tenants that are willing to pay the rents required to be located in new world-class properties as is evident in the successful lease up of the Edmonton Tower, Enbridge Tower, and Stantec Tower. Efficient floor plates are a key driver of the flight to quality.
• Negative absorption in Edmonton’s downtown office market is expected to continue at levels similar to what was seen in 2016, as companies consolidate their operations in buildings with more efficient floor plates. Many of these movements were previously planned to increase operational efficiencies, and we could see more layoffs within larger companies as they work toward increased efficiency.
• 2017 will be a challenging year for owners of Class B and C product as historically high office vacancy and industrial availability rates are being met with low demand. Plans for redeveloping and repurposing older, less functional, downtown office buildings have begun but valuations are being impacted given the cost to repurpose.
Stan
tec
Tow
er
Edm
onto
nTo
wer
Enbr
idge
Cen
tre
Quality assets perform
98.0% 92.9%78.2%
Investorconfidence returning to market.

REGIONAL OUTLOOK
20© 2017 CBRE Limited CBRE RESEARCH
MARKET STATISTICS
PROJECTS TO WATCH:
20© 2017 CBRE Limited CBRE RESEARCH
Office
Retail
Industrial
Multifamily
Investment
Source: Canada Mortgage and Housing Corp., CBRE Limited, 2017.
Source: CBRE Limited, 2017.
*Market and surrounding regionSource: CBRE Limited, 2017.
Source: CBRE Limited, 2017.
Source: CBRE Limited, 2017.
Edmonton LRT Valley LineThe Edmonton LRT Valley Line will be a 13.0 km rail extension connecting Downtown Edmonton with the Mill Woods neighbourhood. The first phase of the project has begun and will be completed in 2020.
Click here for more information
Ice DistrictICE District is a 25.0 acre mixed-use development in Edmonton’s downtown core. Offering 300,000 sq.ft. of retail space, 1.3 million square feet of office space, a state of the art sports arena, and a residential component, ICE District is positioning itself as premiere live-work-play space.
Click here for more information
Pipelines Trans Mountain Pipeline and the Line 3 Revitalization will have a significant impact on Alberta’s economic prospects and will get underway in 2017. Keystone XL is also gaining momentum and could be approved in the year ahead.
CENTRAL 2015 2016 2017 F YoY
Vacancy Rate 10.0% 17.5% 18.3%
Class A Net Asking Rent (per sq. ft.) $23.97 $23.43 $23.43
Net Absorption (million sq. ft. ) (0.13) (0.12) (0.13)
Class A Cap Rate (%) 6.50-7.00 6.75-7.25 6.75-7.25
New Supply (million sq. ft.) 0.00 1.12 0.00
Under Construction (million sq. ft.) 1.78 0.60 0.60
SUBURBAN
Vacancy Rate 13.3% 18.4% 18.2%
Class A Net Asking Rent (per sq. ft.) $20.91 $20.11 $19.70
Net Absorption (million sq. ft. ) 0.11 (0.34) 0.02
Class A & B Cap Rate (%) 6.75-7.75 6.75-8.00 7.00-8.00
New Supply (million sq. ft.) 0.16 0.15 0.00
Under Construction (million sq. ft.) 0.28 0.11 0.05
OVERALL
Vacancy Rate 12.1% 17.8% 18.2%
Class A Net Asking Rent (per sq. ft.) $21.31 $22.33 $22.01
Net Absorption (million sq. ft. ) (0.01) (0.46) (0.11)
New Supply (million sq. ft.) 0.16 1.27 0.00
Under Construction (million sq. ft.) 2.06 0.71 0.65
2015 2016 2017 F YoY
Availability Rate 8.4% 9.0% 8.3%
Net Asking Rent (per sq. ft.) $11.17 $9.51 $9.10
Sale Price (per sq. ft.) $145.00 $139.00 $130.00
Net Absorption (million sq. ft.) (0.81) 0.80 1.10
Class A & B Cap Rate (%) 5.50-7.25 5.25-8.00 5.50-8.00
New Supply (million sq. ft.) 4.57 1.61 0.27
Under Construction (million sq. ft.) 1.38 0.65 0.15
INVESTMENT VOLUME (MILLIONS) 2015 2016 2017 F YoY
Office $55 $128 $150
Industrial $139 $566 $400
Retail $98 $623 $500
Multifamily $399 $723 $450
ICI Land $533 $394 $300
Hotel* $93 $19 $30
Total $1,317 $2,453 $1,830 2015 2016 2017 F YoY
Total Retail Sales (YoY) (0.4%) 5.9% 1.0%
Neighbourhood Cap Rate (%) 5.75-6.25 5.75-6.25 5.50-6.00
2015 2016 2017 F YoY
Overall Vacancy Rate (%) 4.2% 7.1% 7.0%
Apartment Cap Rate (%) 4.75-5.25 4.75-5.25 4.75-5.25
EDMONTON

REGIONAL OUTLOOK
21© 2017 CBRE Limited CBRE RESEARCH21© 2017 CBRE Limited CBRE RESEARCH
KEY TRENDS
• Winnipeg’s GDP is forecast to grow by 2.0% annually for the next five years. Largely due to an influx of immigration that will see the population grow by 1.6% annually, which will make Winnipeg one of Canada’s more robust economies.
• 2017 will be a landmark year of further downtown revitalization. Three major projects currently underway will add to Winnipeg’s downtown office and residential inventory: True North Square, SkyCity, and 300 Main.
• Suburban office development is also expected to characterize the year ahead. Construction of new suburban office buildings in the city’s southwest suburban market is expected to be complete in early 2017. This development stems from the demand for modern office space and the fact that downtown office vacancy rates fell to a five-quarter low of 8.9% in 2016.
• The evolution of the Seasons Winnipeg super regional mall continues, notably with the completion of the 800,000 sq. ft. Outlet Collection Winnipeg in Q2 2017. Expect progress on a hotel, luxury car dealerships and multifamily components of the project.
• Expect more serviced industrial land to be made available in Winnipeg in 2017. New industrial parks will come to market in the Northwest, South and East quadrants of the city, helping to satiate pent-up demand for modern industrial stock.
From big small town to small big city.
REGIONAL OUTLOOK
WINNIPEG
Battle fordowntownsupremacy
TrueNorth
SquarePortage& Main
New industrialland will becomeavailablein 2017

REGIONAL OUTLOOK
22© 2017 CBRE Limited CBRE RESEARCH
MARKET STATISTICS
PROJECTS TO WATCH:
22© 2017 CBRE Limited CBRE RESEARCH
Office
Retail
Industrial
Multifamily
Investment
Source: Canada Mortgage and Housing Corp., CBRE Limited, 2017.
Source: CBRE Limited, 2017.
*Market and surrounding regionSource: CBRE Limited, 2017.
Source: CBRE Limited, 2017.
Source: CBRE Limited, 2017.
Seasons Winnipeg Canada’s next Super Regional Mall will total >800,000 sq. ft. and will include residential components, open air strip centres, an enclosed outlet mall, two luxury car dealerships and a hotel. Outlet Collection at Winnipeg will be the city’s first pure outlet centre when it opens in spring 2017.
Click here for more information
True North Square The largest development in Winnipeg’s history seeks to re-define downtown Winnipeg. The development will feature office, hotel, residential and retail uses. Preleasing activity has attracted notable tenants seeking new Class A construction and a live-work-play opportunity.
Click here for more information
300 and 360 Main StreetA combination new development and renovation will revitalize downtown Winnipeg with a new 40-storey residential building to complement existing office space creating a new live-work-play hub at Portage and Main.
Click here for more information
CENTRAL 2015 2016 2017 F YoY
Vacancy Rate 11.2% 8.9% 8.5%
Class A Net Asking Rent (per sq. ft.) $17.93 $17.34 $17.60
Net Absorption (million sq. ft. ) (0.04) 0.07 0.03
Class A Cap Rate (%) 5.50-6.00 5.50-6.00 5.50-6.00
New Supply (million sq. ft.) 0.08 0.00 0.00
Under Construction (million sq. ft.) 0.00 0.37 0.37
SUBURBAN
Vacancy Rate 10.7% 8.4% 9.3%
Class A Net Asking Rent (per sq. ft.) n/a n/a n/a
Net Absorption (million sq. ft. ) (0.07) 0.01 0.04
Class A & B Cap Rate (%) 6.50-7.50 6.50-7.50 6.50-7.50
New Supply (million sq. ft.) 0.00 0.00 0.08
Under Construction (million sq. ft.) 0.00 0.03 0.05
OVERALL
Vacancy Rate 11.1% 8.7% 8.7%
Class A Net Asking Rent (per sq. ft.) $17.93 $17.34 $17.60
Net Absorption (million sq. ft. ) (0.11) 0.08 0.07
New Supply (million sq. ft.) 0.08 0.00 0.08
Under Construction (million sq. ft.) 0.00 0.40 0.42
2015 2016 2017 F YoY
Availability Rate 4.8% 4.1% 4.6%
Net Asking Rent (per sq. ft.) $7.48 $7.41 $7.56
Sale Price (per sq. ft.) $88.43 $88.75 $90.50
Net Absorption (million sq. ft.) (0.40) 0.52 (0.26)
Class A & B Cap Rate (%) 6.00-7.25 6.00-7.25 6.00-7.25
New Supply (million sq. ft.) 0.10 0.00 0.10
Under Construction (million sq. ft.) 0.08 0.03 0.10
2015 2016 2017 F YoY
Total Retail Sales (YoY) 1.4% 5.7% 2.4%
Neighbourhood Cap Rate (%) 6.50-7.00 6.50-7.00 6.50-7.00
2015 2016 2017 F YoY
Overall Vacancy Rate (%) 2.9% 2.8% 3.2%
Apartment Cap Rate (%) 5.00-5.75 5.00-5.75 5.00-5.75
WINNIPEG

REGIONAL OUTLOOK
23© 2017 CBRE Limited CBRE RESEARCH23© 2017 CBRE Limited CBRE RESEARCH
REGIONAL OUTLOOK
LONDON
KEY TRENDS
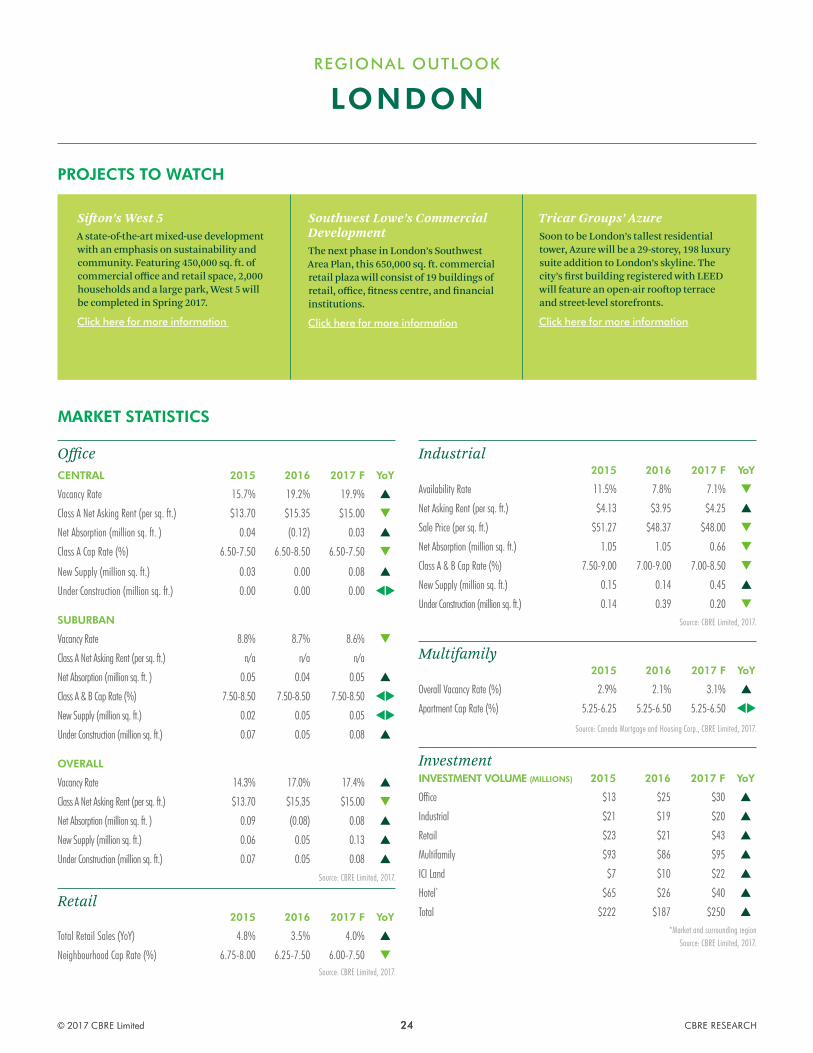
• Retail development has increased in the last few years and the Southwest Area Plan will accommodate 1.0 million sq. ft. of additional retail growth along Wonderland Road and Wharncliffe Road.
• Tricar Group’s new downtown condo building, Azure, is currently under construction and helping energize the core. The tower will enhance the city’s skyline at 29 storeys, including a five-storey podium. Azure boasts downtown luxury living with 200 units, an open-air rooftop terrace, and desirable amenities from living in the core.
• Cadillac Fairview has invested over $100.0 million dollars into Masonville Place. Construction is reconfiguring the gaps left by the closing of Sears and Target, which will allow for the entry of new high-end tenants.
• London will continue to attract tech companies and act as an incubator for start-up companies. Voices.com and Start.ca recently relocated to accommodate growth. AutoData, Big Blue Bubble and Big Viking Games are having success in the city, which could translate into additional office demand.
• London’s industrial market continues to experience high demand and a limited supply of quality product with vacancy rates the lowest since 2008. Low interest rates will make purchasing more advantageous for companies with stable growth and location plans.
• The London housing market was robust in 2016 with houses receiving multiple offers and selling over asking price. London remains one of the most affordable cities of its size for housing in Canada; however, housing and land costs are expected to increase in 2017.
Largeindustrialin demand
>50,000 sq. ft.
Downtown on the high rise
1 .0 Potential retail growth
millionsq . ft .
REGIONAL OUTLOOK
24© 2017 CBRE Limited CBRE RESEARCH
MARKET STATISTICS
PROJECTS TO WATCH:
24© 2017 CBRE Limited CBRE RESEARCH
Office
Retail
Industrial
Multifamily
Investment
Source: Canada Mortgage and Housing Corp., CBRE Limited, 2017.
Source: CBRE Limited, 2017.
*Market and surrounding regionSource: CBRE Limited, 2017.
Source: CBRE Limited, 2017.
Source: CBRE Limited, 2017.
Sifton’s West 5A state-of-the-art mixed-use development with an emphasis on sustainability and community. Featuring 450,000 sq. ft. of commercial office and retail space, 2,000 households and a large park, West 5 will be completed in Spring 2017.
Click here for more information
Southwest Lowe’s Commercial DevelopmentThe next phase in London’s Southwest Area Plan, this 650,000 sq. ft. commercial retail plaza will consist of 19 buildings of retail, office, fitness centre, and financial institutions.
Click here for more information
Tricar Groups’ AzureSoon to be London’s tallest residential tower, Azure will be a 29-storey, 198 luxury suite addition to London’s skyline. The city’s first building registered with LEED will feature an open-air rooftop terrace and street-level storefronts.
Click here for more information
CENTRAL 2015 2016 2017 F YoY
Vacancy Rate 15.7% 19.2% 19.9%
Class A Net Asking Rent (per sq. ft.) $13.70 $15.35 $15.00
Net Absorption (million sq. ft. ) 0.04 (0.12) 0.03
Class A Cap Rate (%) 6.50-7.50 6.50-8.50 6.50-7.50
New Supply (million sq. ft.) 0.03 0.00 0.08
Under Construction (million sq. ft.) 0.00 0.00 0.00
SUBURBAN
Vacancy Rate 8.8% 8.7% 8.6%
Class A Net Asking Rent (per sq. ft.) n/a n/a n/a
Net Absorption (million sq. ft. ) 0.05 0.04 0.05
Class A & B Cap Rate (%) 7.50-8.50 7.50-8.50 7.50-8.50
New Supply (million sq. ft.) 0.02 0.05 0.05
Under Construction (million sq. ft.) 0.07 0.05 0.08
OVERALL
Vacancy Rate 14.3% 17.0% 17.4%
Class A Net Asking Rent (per sq. ft.) $13.70 $15.35 $15.00
Net Absorption (million sq. ft. ) 0.09 (0.08) 0.08
New Supply (million sq. ft.) 0.06 0.05 0.13
Under Construction (million sq. ft.) 0.07 0.05 0.08
2015 2016 2017 F YoY
Availability Rate 11.5% 7.8% 7.1%
Net Asking Rent (per sq. ft.) $4.13 $3.95 $4.25
Sale Price (per sq. ft.) $51.27 $48.37 $48.00
Net Absorption (million sq. ft.) 1.05 1.05 0.66
Class A & B Cap Rate (%) 7.50-9.00 7.00-9.00 7.00-8.50
New Supply (million sq. ft.) 0.15 0.14 0.45
Under Construction (million sq. ft.) 0.14 0.39 0.20
INVESTMENT VOLUME (MILLIONS) 2015 2016 2017 F YoY
Office $13 $25 $30
Industrial $21 $19 $20
Retail $23 $21 $43
Multifamily $93 $86 $95
ICI Land $7 $10 $22
Hotel* $65 $26 $40
Total $222 $187 $250 2015 2016 2017 F YoY
Total Retail Sales (YoY) 4.8% 3.5% 4.0%
Neighbourhood Cap Rate (%) 6.75-8.00 6.25-7.50 6.00-7.50
2015 2016 2017 F YoY
Overall Vacancy Rate (%) 2.9% 2.1% 3.1%
Apartment Cap Rate (%) 5.25-6.25 5.25-6.50 5.25-6.50
LONDON

REGIONAL OUTLOOK
25© 2017 CBRE Limited CBRE RESEARCH25© 2017 CBRE Limited CBRE RESEARCH
REGIONAL OUTLOOK
WATERLOO REGION
KEY TRENDS
• Downtown Kitchener will continue to be revitalized to attract office, retail and residential tenants. Numerous projects have been proposed, including a multimodal transit hub that will combine commercial and residential uses at King and Victoria Street on a 1.6 hectare site and a creative arts space on the first floor of a proposed multifamily building at 44 Gaukel Street. As population density increases, real estate activity will grow as it relates to retail and service companies.
• An industrial site at 137 Glasgow Street in Kitchener has been reimagined as a 475,000 sq. ft. technology manufacturing hub for software enabled devices. Catalyst 137 is expected to attract start-ups, hobbyists and already established tech companies to the potential for collaboration and ability to decrease the time-to-market for products and services. The space will feature a restaurant, fitness centre and garden catering to tech talent and will be ready for occupancy by mid-2017.
• After an exceptionally strong 2016, investment activity in Waterloo Region is expected to remain robust in 2017 and outperform the ten-year average by 4.0%. Factors that will drive this growth include the burgeoning tech market, the upcoming LRT completion and the affordability of residential properties compared to the GTA market.
• The Waterloo Region LRT is now approximately 92.0% complete and will provide consumers with access to important commercial nodes in Kitchener and Waterloo. As the launch date draws closer, commercial real estate activity along the LRT line is expected to increase, with businesses anticipating increased foot traffic along these corridors.
• The Zehr Group is launching a new multifamily development called SIXO in the midtown area between Kitchener and Waterloo. The project is expected to include 200,000 sq. ft. of office space, 50,000 sq. ft. of retail and a proposed residential component. Detailed plans for this urban village span 2.4 hectares and will be announced in March 2017.
Industrial conversions totech office and distribution
TORONTO
$$$$WATERLOO
Drive to mortgage qualification
92% Waterloo Region LRT completion

REGIONAL OUTLOOK
26© 2017 CBRE Limited CBRE RESEARCH
MARKET STATISTICS
PROJECTS TO WATCH:
26© 2017 CBRE Limited CBRE RESEARCH
Office
Retail
Industrial
Multifamily
Investment
Source: Canada Mortgage and Housing Corp., CBRE Limited, 2017.
Source: CBRE Limited, 2017.
*Market and surrounding regionSource: CBRE Limited, 2017.
Source: CBRE Limited, 2017.
Source: CBRE Limited, 2017.
Catalyst 137At 475,000 sq. ft., Catalyst 137 will be one of the world’s largest technology accelerators focused on the Internet of Things. The building will concentrate talent, hardware engineering services and venture capital support for next generation companies.
Click here for more information
Waterloo Region LRTION will be unveiled to the Region in two stages with service set to begin in 2018. It will total over 70.0 km of combined LRT and BRT.
Click here for more information
SIXO MidtownLocated in Downtown Kitchener’s Innovation District, this massive mixed-use development will be the future epicenter for Kitchener-Waterloo’s tech sector and the gateway to the Region’s growing midtown district.
Click here for more information
CENTRAL 2015 2016 2017 F YoY
Vacancy Rate 9.5% 10.0% 9.7%
Class A Net Asking Rent (per sq. ft.) $12.00 $12.43 $12.71
Net Absorption (million sq. ft. ) 0.08 0.03 0.06
Class A Cap Rate (%) 6.00-7.00 6.00-7.00 6.00-7.00
New Supply (million sq. ft.) 0.00 0.05 0.05
Under Construction (million sq. ft.) 0.01 0.05 0.00
SUBURBAN
Vacancy Rate 13.4% 17.1% 18.2%
Class A Net Asking Rent (per sq. ft.) $14.40 $14.72 $15.06
Net Absorption (million sq. ft. ) (0.03) 0.10 (0.08)
Class A & B Cap Rate (%) 6.50-7.50 6.25-8.00 6.50-7.25
New Supply (million sq. ft.) 0.18 0.31 0.05
Under Construction (million sq. ft.) 0.01 0.05 0.04
OVERALL
Vacancy Rate 12.0% 14.6% 15.2%
Class A Net Asking Rent (per sq. ft.) $13.78 $14.27 $14.53
Net Absorption (million sq. ft. ) 0.06 0.13 (0.02)
New Supply (million sq. ft.) 0.18 0.37 0.10
Under Construction (million sq. ft.) 0.02 0.09 0.04
2015 2016 2017 F YoY
Availability Rate 5.7% 6.0% 6.2%
Net Asking Rent (per sq. ft.) $5.00 $5.14 $5.38
Sale Price (per sq. ft.) $58.22 $80.56 $80.68
Net Absorption (million sq. ft.) 0.24 0.27 0.23
Class A & B Cap Rate (%) 6.00-7.50 5.90-7.25 5.50-6.75
New Supply (million sq. ft.) 0.70 0.55 0.44
Under Construction (million sq. ft.) 0.31 0.44 0.29
INVESTMENT VOLUME (MILLIONS) 2015 2016 2017 F YoY
Office $27 $190 $55
Industrial $153 $118 $135
Retail $124 $256 $128
Multifamily $127 $356 $272
ICI Land $22 $119 $78
Hotel* $49 $46 $52
Total $502 $1,085 $720 2015 2016 2017 F YoY
Total Retail Sales (YoY) 4.0% 3.4% 4.3%
Neighbourhood Cap Rate (%) 6.00-6.50 6.00-6.50 6.00-6.50
2015 2016 2017 F YoY
Overall Vacancy Rate (%) 2.4% 2.2% 2.6%
Apartment Cap Rate (%) 5.25-6.00 4.75-5.25 4.75-5.25
WATERLOO REGION

REGIONAL OUTLOOK
27© 2017 CBRE Limited CBRE RESEARCH27© 2017 CBRE Limited CBRE RESEARCH
REGIONAL OUTLOOK
TORONTO - OFFICE
KEY TRENDS
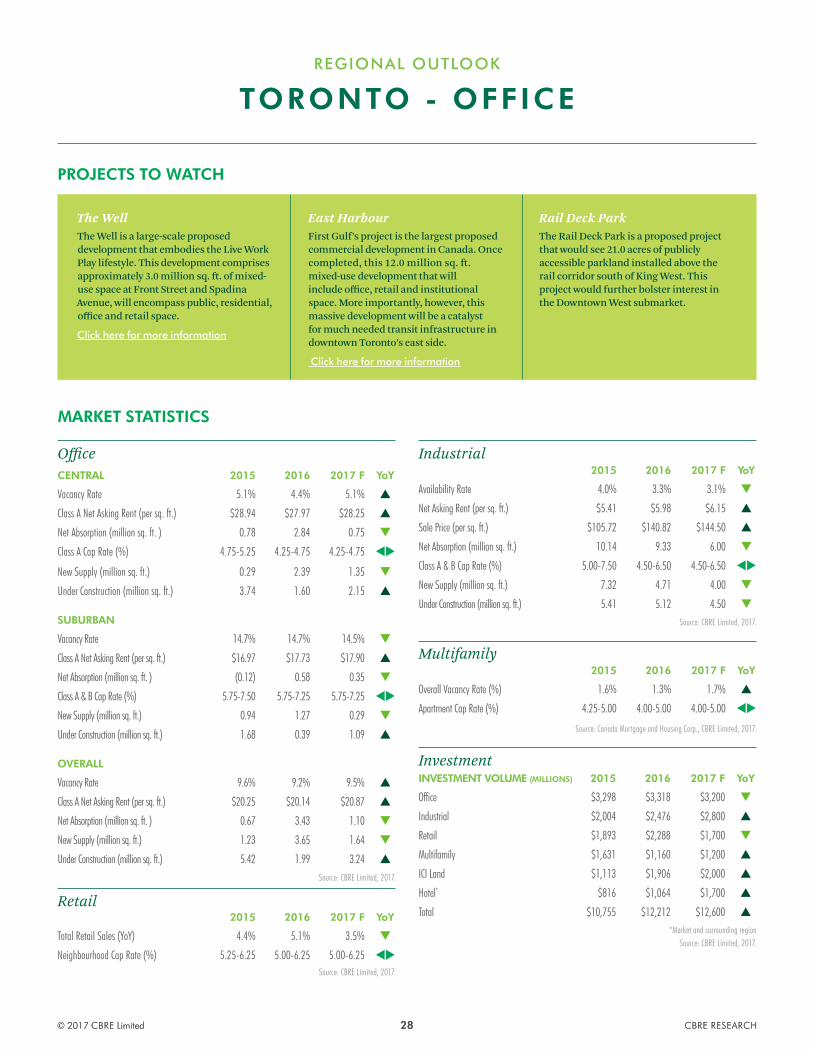
• Toronto boasts the lowest downtown office vacancy rate in ten years and the lowest vacancy rate in North America. Given these conditions and the limited amound of new supply under construction, it is expected that the next wave of office tower developments will kick off in 2017.
• Office construction is most likely to be initiated in peripheral markets like King West, Waterfront and Downtown North; however, at least one significant office tower announcement is anticipated in the Financial Core or Downtown South.
• New office supply will provide some relief for tenants in 2017, but the impact will be relatively tame as 76% of the new space is already leased prior to completion. Despite this, expect a slight increase in options as space vacated by tenants moving into new buildings will come back onto the market.
• Downtown peripheral markets, most notably King West, will continue to attract increased leasing activity in 2017. The appeal of King West’s amenities and livability for employers and top talent will be the main drivers.
• Further appreciation in downtown office rental rates is expected in 2017. Rent growth will be supported by limited supply, technology and business services expansion and by employers staking their position in the Toronto office market as well as the larger war for talent.
• While prior development cycles raised concerns around the viability of Class B office space, tenant demand for downtown space is believed to be strong enough to alleviate those concerns for the foreseeable future.
?Howmanytowerswill bebuilt?
THE‘MANHATTANIZATION’OF TORONTO CONTINUES
76% New supply that is already preleased
REGIONAL OUTLOOK
28© 2017 CBRE Limited CBRE RESEARCH
MARKET STATISTICS
PROJECTS TO WATCH:
28© 2017 CBRE Limited CBRE RESEARCH
Office
Retail
Industrial
Multifamily
Investment
Source: Canada Mortgage and Housing Corp., CBRE Limited, 2017.
Source: CBRE Limited, 2017.
*Market and surrounding regionSource: CBRE Limited, 2017.
Source: CBRE Limited, 2017.
Source: CBRE Limited, 2017.
The WellThe Well is a large-scale proposed development that embodies the Live Work Play lifestyle. This development comprises approximately 3.0 million sq. ft. of mixed-use space at Front Street and Spadina Avenue, will encompass public, residential, office and retail space.
Click here for more information
East HarbourFirst Gulf’s project is the largest proposed commercial development in Canada. Once completed, this 12.0 million sq. ft. mixed-use development that will include office, retail and institutional space. More importantly, however, this massive development will be a catalyst for much needed transit infrastructure in downtown Toronto’s east side.
Click here for more information
Rail Deck ParkThe Rail Deck Park is a proposed project that would see 21.0 acres of publicly accessible parkland installed above the rail corridor south of King West. This project would further bolster interest in the Downtown West submarket.
TORONTO - OFFICE
CENTRAL 2015 2016 2017 F YoY
Vacancy Rate 5.1% 4.4% 5.1%
Class A Net Asking Rent (per sq. ft.) $28.94 $27.97 $28.25
Net Absorption (million sq. ft. ) 0.78 2.84 0.75
Class A Cap Rate (%) 4.75-5.25 4.25-4.75 4.25-4.75
New Supply (million sq. ft.) 0.29 2.39 1.35
Under Construction (million sq. ft.) 3.74 1.60 2.15
SUBURBAN
Vacancy Rate 14.7% 14.7% 14.5%
Class A Net Asking Rent (per sq. ft.) $16.97 $17.73 $17.90
Net Absorption (million sq. ft. ) (0.12) 0.58 0.35
Class A & B Cap Rate (%) 5.75-7.50 5.75-7.25 5.75-7.25
New Supply (million sq. ft.) 0.94 1.27 0.29
Under Construction (million sq. ft.) 1.68 0.39 1.09
OVERALL
Vacancy Rate 9.6% 9.2% 9.5%
Class A Net Asking Rent (per sq. ft.) $20.25 $20.14 $20.87
Net Absorption (million sq. ft. ) 0.67 3.43 1.10
New Supply (million sq. ft.) 1.23 3.65 1.64
Under Construction (million sq. ft.) 5.42 1.99 3.24
2015 2016 2017 F YoY
Availability Rate 4.0% 3.3% 3.1%
Net Asking Rent (per sq. ft.) $5.41 $5.98 $6.15
Sale Price (per sq. ft.) $105.72 $140.82 $144.50
Net Absorption (million sq. ft.) 10.14 9.33 6.00
Class A & B Cap Rate (%) 5.00-7.50 4.50-6.50 4.50-6.50
New Supply (million sq. ft.) 7.32 4.71 4.00
Under Construction (million sq. ft.) 5.41 5.12 4.50
INVESTMENT VOLUME (MILLIONS) 2015 2016 2017 F YoY
Office $3,298 $3,318 $3,200
Industrial $2,004 $2,476 $2,800
Retail $1,893 $2,288 $1,700
Multifamily $1,631 $1,160 $1,200
ICI Land $1,113 $1,906 $2,000
Hotel* $816 $1,064 $1,700
Total $10,755 $12,212 $12,600 2015 2016 2017 F YoY
Total Retail Sales (YoY) 4.4% 5.1% 3.5%
Neighbourhood Cap Rate (%) 5.25-6.25 5.00-6.25 5.00-6.25
2015 2016 2017 F YoY
Overall Vacancy Rate (%) 1.6% 1.3% 1.7%
Apartment Cap Rate (%) 4.25-5.00 4.00-5.00 4.00-5.00

REGIONAL OUTLOOK
29© 2017 CBRE Limited CBRE RESEARCH29© 2017 CBRE Limited CBRE RESEARCH
REGIONAL OUTLOOK
TORONTO - INDUSTRIAL
KEY TRENDS
• On average, developers have added 5.1 million sq. ft. of new supply per annum for the past five years. The GTA currently has 5.1 million sq. ft. of industrial space under construction, 70.0% of which is being built speculatively. Only 15.0% of the speculative development is currently preleased, making 2017 a pivotal year in defining the direction of market fundamentals.
• Demand for properties in the 18’-26’ clear range has been strong. With no substantial new product in the pipeline and growing e-commerce demand, availability should remain limited, while rents will face upward pressure.
• Support for robust sale prices will likely remain in place due to low availability, favorable interest rates, as well as the large number of cash-laden buyers; however, leasing will likely gain appeal once sale prices exceed a $200.00 per sq. ft. tipping point.
• As the third largest industrial market in North America, the GTA is the logistics hub for many national and regional distributors. Tenants from the transportation, distribution, and logistics sector will continue to drive demand with manufacturing and automotive, as well as retail and wholesale trades, likely to follow.
• Amid historically low availability rates and rising rents, landlords are very optimistic about 2017. Meanwhile, investors are trying to find ways to be more creative and look for value-add scenarios.
• The shortage of industrial land for development in core areas, coupled with the lack of availability for existing product for sale has put upward pressure on land prices, which now exceed on average $700,000 per acre. Owners of land with favourable zoning that permits outside storage can expect a 15.0% premium on the selling price in 2017.
Construction breakdown
Build to suit Spec
70%30%
Toronto Westdominates deal flow
WEST NORTH
CENTRALEAST
$200 Rising sale prices to increase leasing appeal
persq .ft .

REGIONAL OUTLOOK
30© 2017 CBRE Limited CBRE RESEARCH
MARKET STATISTICS
PROJECTS TO WATCH:
30© 2017 CBRE Limited CBRE RESEARCH
Office
Retail
Industrial
Multifamily
Investment
Source: Canada Mortgage and Housing Corp., CBRE Limited, 2017.
Source: CBRE Limited, 2017.
*Market and surrounding regionSource: CBRE Limited, 2017.
Source: CBRE Limited, 2017.
Source: CBRE Limited, 2017.
Highway 427 Expansion Road widening, northern expansion and the addition of High Occupancy Toll Lanes will get underway as part of a three-year project to enhance Highway 427 starting in 2017.
6 Cleve Court, Halton HillsThis 564,824 sq.ft. state-of-the-art logistics facility is situated in Halton Hills between CP Rail Terminals, CN Rail Terminals and the Milton Go Station. Construction is expected to be completed in fall 2017.
Click here for more information
11400 Steeles Avenue, Halton HillsThis 639,839 sq. ft. development will offer 36’ ceilings and has direct Highway 401 frontage. Also, it is 2.0 km away from two 401 interchanges and is near CP Rail Intermodal, as well as the planned Milton CN Intermodal. It was completed in January 2017.
TORONTO - INDUSTRIAL
CENTRAL 2015 2016 2017 F YoY
Vacancy Rate 5.1% 4.4% 5.1%
Class A Net Asking Rent (per sq. ft.) $28.94 $27.97 $28.25
Net Absorption (million sq. ft. ) 0.78 2.84 0.75
Class A Cap Rate (%) 4.75-5.25 4.25-4.75 4.25-4.75
New Supply (million sq. ft.) 0.29 2.39 1.35
Under Construction (million sq. ft.) 3.74 1.60 2.15
SUBURBAN
Vacancy Rate 14.7% 14.7% 14.5%
Class A Net Asking Rent (per sq. ft.) $16.97 $17.73 $17.90
Net Absorption (million sq. ft. ) (0.12) 0.58 0.35
Class A & B Cap Rate (%) 5.75-7.50 5.75-7.25 5.75-7.25
New Supply (million sq. ft.) 0.94 1.27 0.29
Under Construction (million sq. ft.) 1.68 0.39 1.09
OVERALL
Vacancy Rate 9.6% 9.2% 9.5%
Class A Net Asking Rent (per sq. ft.) $20.25 $20.14 $20.87
Net Absorption (million sq. ft. ) 0.67 3.43 1.10
New Supply (million sq. ft.) 1.23 3.65 1.64
Under Construction (million sq. ft.) 5.42 1.99 3.24
2015 2016 2017 F YoY
Total Retail Sales (YoY) 4.4% 5.1% 3.5%
Neighbourhood Cap Rate (%) 5.25-6.25 5.00-6.25 5.00-6.25
2015 2016 2017 F YoY
Overall Vacancy Rate (%) 1.6% 1.3% 1.7%
Apartment Cap Rate (%) 4.25-5.00 4.00-5.00 4.00-5.00
2015 2016 2017 F YoY
Availability Rate 4.0% 3.3% 3.1%
Net Asking Rent (per sq. ft.) $5.41 $5.98 $6.15
Sale Price (per sq. ft.) $105.72 $140.82 $144.50
Net Absorption (million sq. ft.) 10.14 9.33 6.00
Class A & B Cap Rate (%) 5.00-7.50 4.50-6.50 4.50-6.50
New Supply (million sq. ft.) 7.32 4.71 4.00
Under Construction (million sq. ft.) 5.41 5.12 4.50
INVESTMENT VOLUME (MILLIONS) 2015 2016 2017 F YoY
Office $3,298 $3,318 $3,200
Industrial $2,004 $2,476 $2,800
Retail $1,893 $2,288 $1,700
Multifamily $1,631 $1,160 $1,200
ICI Land $1,113 $1,906 $2,000
Hotel* $816 $1,064 $1,700
Total $10,755 $12,212 $12,600

REGIONAL OUTLOOK
31© 2017 CBRE Limited CBRE RESEARCH31© 2017 CBRE Limited CBRE RESEARCH
REGIONAL OUTLOOK
OTTAWA
KEY TRENDS
• As Canada rings in its 150th birthday in 2017, Ottawa will have the opportunity to showcase itself as a great place to grow business in Canada.
• The Ottawa office market will experience an increase in vacancy rates. The Department of National Defense has begun consolidation of several downtown offices into a single location outside of Kanata. Meanwhile, 329,000 sq. ft. of space will be coming onto the market as the Bank of Canada relocates to their newly renovated headquarters.
• Non-traditional users will remain prominent tenants in Ottawa’s industrial market and help to generate positive net absorption. Furthermore, as same day delivery is growing in Canada, the potential for more small-scale distribution centres located in proximity to residential populations will be a trend to watch in 2017.
• The finished expansion of the Rideau Shopping Centre and additions to the Tanger Outlets will attract new retailers to the Ottawa retail market. The city’s retail market is growing, supported by above average disposable household income.
<5 .0% Workplace 2.0 implementation rate
+9,000new employees
Federalgovernmentto grow or shrink?
Focuson Ottawain 2017
Infrastructure investment underway
LIBRARY

REGIONAL OUTLOOK
32© 2017 CBRE Limited CBRE RESEARCH
MARKET STATISTICS
PROJECTS TO WATCH:
32© 2017 CBRE Limited CBRE RESEARCH
Office
Retail
Industrial
Multifamily
Investment
Source: Canada Mortgage and Housing Corp., CBRE Limited, 2017.
Source: CBRE Limited, 2017.
*Market and surrounding regionSource: CBRE Limited, 2017.
Source: CBRE Limited, 2017.
Source: CBRE Limited, 2017.
Ottawa LRT The Confederation Light Rail Transit Line is scheduled to be complete in 2018. This is the largest infrastructure project in Ottawa since the Rideau Canal and has spurred extensive renovations to buildings located on or near the line.
Click here for more information
Lebreton Flats The National Capital Commission (NCC) narrowed the Lebreton Flats proposal to a preferred group. While still in the planning phase, this proposal will provide the Ottawa Senators with a new arena and Ottawa residents a new entertainment and culture hub.
Click here for more information
Bank of Canada The Bank of Canada will be moving back to its renovated headquarters at Wellington in 2017 and will feature a new museum.
Click here for more information
CENTRAL 2015 2016 2017 F YoY
Vacancy Rate 9.6% 10.2% 11.9%
Class A Net Asking Rent (per sq. ft.) $22.93 $23.00 $23.00
Net Absorption (million sq. ft. ) (0.16) (0.11) (0.33)
Class A Cap Rate (%) 5.25-6.00 5.25-5.75 5.25-5.75
New Supply (million sq. ft.) 0.00 0.00 0.00
Under Construction (million sq. ft.) 0.00 0.00 0.00
SUBURBAN
Vacancy Rate 11.4% 11.9% 13.0%
Class A Net Asking Rent (per sq. ft.) $16.41 $16.20 $16.26
Net Absorption (million sq. ft. ) (0.16) (0.07) 0.17
Class A & B Cap Rate (%) 6.25-7.50 6.25-7.50 6.25-7.50
New Supply (million sq. ft.) 0.14 0.00 0.46
Under Construction (million sq. ft.) 0.35 0.03 0.00
OVERALL
Vacancy Rate 10.6% 11.1% 12.5%
Class A Net Asking Rent (per sq. ft.) $18.44 $19.09 $19.20
Net Absorption (million sq. ft. ) (0.32) (0.18) (0.16)
New Supply (million sq. ft.) 0.14 0.00 0.46
Under Construction (million sq. ft.) 0.35 0.03 0.00
2015 2016 2017 F YoY
Availability Rate 6.3% 5.4% 5.3%
Net Asking Rent (per sq. ft.) $8.62 $9.17 $9.15
Sale Price (per sq. ft.) $130.81 $133.50 $135.05
Net Absorption (million sq. ft.) 0.25 0.25 0.12
Class A & B Cap Rate (%) 6.00-7.25 6.00-7.25 6.00-7.25
New Supply (million sq. ft.) 0.23 0.09 0.09
Under Construction (million sq. ft.) 0.07 0.13 0.00
INVESTMENT VOLUME (MILLIONS) 2015 2016 2017 F YoY
Office $358 $132 $450
Industrial $146 $117 $135
Retail $173 $212 $150
Multifamily $285 $686 $350
ICI Land $284 $252 $270
Hotel* $43 $128 $25
Total $1,289 $1,527 $1,380 2015 2016 2017 F YoY
Total Retail Sales (YoY) (%) 2.3% 2.9% 3.0%
Neighbourhood Cap Rate (%) 5.75-6.50 5.75-6.50 5.75-6.50
2015 2016 2017 F YoY
Overall Vacancy Rate (%) 3.4% 3.0% 3.0%
Apartment Cap Rate (%) 4.75-5.50 4.75-5.50 4.75-5.50
OTTAWA
REGIONAL OUTLOOK
33© 2017 CBRE Limited CBRE RESEARCH33© 2017 CBRE Limited CBRE RESEARCH
REGIONAL OUTLOOK
MONTREAL
KEY TRENDS
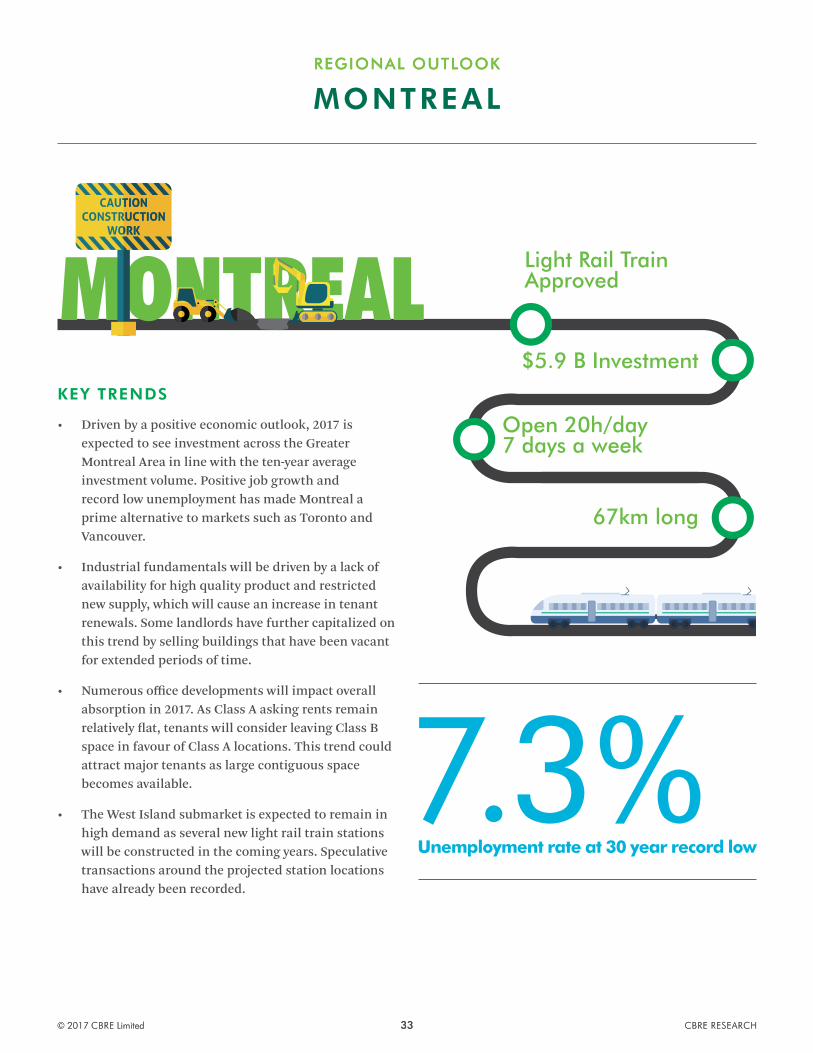
• Driven by a positive economic outlook, 2017 is expected to see investment across the Greater Montreal Area in line with the ten-year average investment volume. Positive job growth and record low unemployment has made Montreal a prime alternative to markets such as Toronto and Vancouver.
• Industrial fundamentals will be driven by a lack of availability for high quality product and restricted new supply, which will cause an increase in tenant renewals. Some landlords have further capitalized on this trend by selling buildings that have been vacant for extended periods of time.
• Numerous office developments will impact overall absorption in 2017. As Class A asking rents remain relatively flat, tenants will consider leaving Class B space in favour of Class A locations. This trend could attract major tenants as large contiguous space becomes available.
• The West Island submarket is expected to remain in high demand as several new light rail train stations will be constructed in the coming years. Speculative transactions around the projected station locations have already been recorded.
7 .3% Unemployment rate at 30 year record low
Light Rail TrainApproved
$5.9 B Investment
Open 20h/day7 days a week
67km long
MONTREAL

REGIONAL OUTLOOK
34© 2017 CBRE Limited CBRE RESEARCH
MARKET STATISTICS
PROJECTS TO WATCH:
34© 2017 CBRE Limited CBRE RESEARCH
Office
Retail
Industrial
Multifamily
Investment
Source: Canada Mortgage and Housing Corp., CBRE Limited, 2017.
Source: CBRE Limited, 2017.
*Market and surrounding regionSource: CBRE Limited, 2017.
Source: CBRE Limited, 2017.
Source: CBRE Limited, 2017.
Project Solar Uniquartier Solar Uniquartier is a massive 2.2 million sq.ft. transit oriented, mixed-use development located off Autoroute 10 that will be connected to a future light rail transit line.
Click here for more information
Montreal LRT (CDPQ Project) Montreal’s brand new Light Rail System will be the fourth largest automated transportation system in the world. Construction of the new transit network will add more than $3.0 billion to Quebec’s GDP over the next four years.
Click here for more information
Ste-Catherine Renovation Montreal’s iconic Rue-Sainte Catherine is undergoing a large scale redevelopment that will add more pedestrian space, free Wi-Fi, electric vehicle charging stations and heated sidewalks. Construction will begin in 2018 and be complete by 2022.
Click here for more information
CENTRAL 2015 2016 2017 F YoY
Vacancy Rate 11.2% 10.6% 10.5%
Class A Net Asking Rent (per sq. ft.) $22.24 $21.21 $21.30
Net Absorption (million sq. ft. ) (0.25) (0.37) 0.59
Class A Cap Rate (%) 5.50-6.00 5.25-5.75 4.75-5.75
New Supply (million sq. ft.) 0.50 0.00 0.60
Under Construction (million sq. ft.) 0.75 1.15 1.06
SUBURBAN
Vacancy Rate 17.7% 18.4% 18.5%
Class A Net Asking Rent (per sq. ft.) $15.41 $16.63 $16.50
Net Absorption (million sq. ft. ) (0.27) 0.59 0.52
Class A & B Cap Rate (%) 6.00-7.75 5.75-7.75 5.75-7.75
New Supply (million sq. ft.) 0.17 1.02 0.68
Under Construction (million sq. ft.) 1.43 0.50 1.35
OVERALL
Vacancy Rate 13.8% 13.8% 13.8%
Class A Net Asking Rent (per sq. ft.) $18.96 $18.32 $18.66
Net Absorption (million sq. ft. ) (0.52) 0.21 1.11
New Supply (million sq. ft.) 0.67 1.02 1.28
Under Construction (million sq. ft.) 2.17 1.65 2.41
2015 2016 2017 F YoY
Availability Rate 7.8% 7.2% 7.0%
Net Asking Rent (per sq. ft.) $5.33 $5.29 $5.45
Sale Price (per sq. ft.) $64.25 $60.38 $65.00
Net Absorption (million sq. ft.) (0.01) 2.76 0.72
Class A & B Cap Rate (%) 5.75-8.00 5.75-7.75 5.75-7.75
New Supply (million sq. ft.) 2.56 1.08 0.20
Under Construction (million sq. ft.) 0.44 0.08 0.25
INVESTMENT VOLUME (MILLIONS) 2015 2016 2017 F YoY
Office $567 $1,062 $750
Industrial $846 $620 $773
Retail $910 $1,077 $900
Multifamily $1,490 $1,217 $1,000
ICI Land $316 $306 $300
Hotel* $106 $145 $250
Total $4,235 $4,427 $3,973 2015 2016 2017 F YoY
Total Retail Sales (YoY) (%) 2.1% 4.6% 3.2%
Neighbourhood Cap Rate (%) 7.00-7.75 7.00-7.75 7.00-7.75
2015 2016 2017 F YoY
Overall Vacancy Rate (%) 4.0% 3.9% 3.8%
Apartment Cap Rate (%) 5.00-5.50 5.00-5.75 4.75-5.50
MONTREAL

REGIONAL OUTLOOK
35© 2017 CBRE Limited CBRE RESEARCH35© 2017 CBRE Limited CBRE RESEARCH
REGIONAL OUTLOOK
HALIFAX
KEY TRENDS
• Fresh off a strong performance in 2016, Halifax’s economy is poised for a robust real GDP increase of 2.5% in 2017. Immigration flows are continuing to trend upwards and a three-year immigration pilot project is set to launch in 2017 as part of the Atlantic Growth Strategy.
• The potential for superior capital returns and relative economic stability should attract investors to Halifax in 2017. While there has been significant cap rate compression in other major Canadian centres, Atlantic Canada’s main investment markets have maintained comparatively high cap rates. Expect further investment opportunities in Halifax for 2017, as an increase in construction projects will lead to new product options on the market.
• In the industrial market, owner occupied properties have become increasingly attractive to users - a trend that will likely continue into 2017. Nearly all of the new supply in the industrial market within the last three years has been owner occupied due to low mortgage rates and the fact that much of the development land is most suitable for smaller buildings.
• The Halifax skyline continues to evolve after decades of limited development activity. The importance of a quality office environment for tenants has resulted in a shift to office spaces that embrace new
workplace solutions and promote collaboration, health, and wellness. New office supply is exceeding absorption and will likely continue to do so, with nearly 500,000 sq. ft. coming onto the market in 2017. In response to this new wave of office supply, underperforming Class C office buildings will be converted for alternative uses, including multifamily developments that will help satisfy residential demand. The majority of these property conversions are located on the Halifax Peninsula. Nevertheless, office vacancy rates are expected to rise in 2017.
• Growth of the downtown core will be sustained as significant multifamily construction continues on the Halifax Peninsula in 2017. As more people shift from suburban areas to an urban lifestyle, there will be increasing demand for office and retail space in Halifax’s central business district for years to come.
18,700 Potential Atlantic Canada annual immigration
3.8%
2015
2016
2017
5.5%6.7%
Manufacturing output growth forecast
SUBURBANURBANShift
in livingpreferences

REGIONAL OUTLOOK
36© 2017 CBRE Limited CBRE RESEARCH
MARKET STATISTICS
PROJECTS TO WATCH:
36© 2017 CBRE Limited CBRE RESEARCH
Office
Retail
Industrial
Multifamily
Investment
Source: Canada Mortgage and Housing Corp., CBRE Limited, 2017.
Source: CBRE Limited, 2017.
*Market and surrounding regionSource: CBRE Limited, 2017.
Source: CBRE Limited, 2017.
Source: CBRE Limited, 2017.
TransCanada Energy East PipelineThe Energy East project is a 4,500 km pipeline that will transport nearly 1.1 million barrels of oil from Alberta to New Brunswick. Energy East is expected to add nearly $7.0 billion in GDP over the next 30 years to maritime provinces alone.
Click here for more information
Atlantic Growth StrategyThe Government of Canada and the four Atlantic Provinces are cooperating on a vision to harness the region’s assets and stimulate economic growth.
Click here for more information
Hebron Project- Offshore Oil Activity in NLLower production costs continue to draw oil and gas investment to the region as the Hebron Project reaches key milestones.
Click here for more information
CENTRAL 2015 2016 2017 F YoY
Vacancy Rate 14.3% 17.5% 20.0%
Class A Net Asking Rent (per sq. ft.) $19.25 $20.16 $20.00
Net Absorption (million sq. ft. ) (0.02) (0.13) 0.11
Class A Cap Rate (%) 6.00-6.50 6.25-6.75 6.25-6.75
New Supply (million sq. ft.) 0.01 0.00 0.30
Under Construction (million sq. ft.) 0.15 0.30 0.20
SUBURBAN
Vacancy Rate 15.5% 13.7% 15.0%
Class A Net Asking Rent (per sq. ft.) $15.83 $15.50 $16.00
Net Absorption (million sq. ft. ) 0.14 0.10 0.04
Class A & B Cap Rate (%) 6.50-8.00 6.50-8.00 6.50-8.00
New Supply (million sq. ft.) 0.31 0.04 0.16
Under Construction (million sq. ft.) 0.18 0.16 0.00
OVERALL
Vacancy Rate 15.0% 15.2% 17.1%
Class A Net Asking Rent (per sq. ft.) $18.30 $19.05 $17.82
Net Absorption (million sq. ft. ) 0.12 (0.02) 0.15
New Supply (million sq. ft.) 0.32 0.04 0.46
Under Construction (million sq. ft.) 0.33 0.46 0.20
2015 2016 2017 F YoY
Availability Rate 10.2% 11.6% 11.1%
Net Asking Rent (per sq. ft.) $7.62 $7.74 $7.50
Sale Price (per sq. ft.) $80.00 $80.00 $85.00
Net Absorption (million sq. ft.) (0.11) 0.03 0.13
Class A & B Cap Rate (%) 6.50-7.75 6.00-7.75 6.00-7.75
New Supply (million sq. ft.) 0.16 0.13 0.08
Under Construction (million sq. ft.) 0.14 0.05 0.06
INVESTMENT VOLUME (MILLIONS) 2015 2016 2017 F YoY
Office $121 $22 $50
Industrial $33 $70 $50
Retail $18 $182 $100
Multifamily $60 $106 $200
ICI Land $75 $73 $50
Hotel* $46 $0 $20
Total $353 $453 $470 2015 2016 2017 F YoY
Total Retail Sales (YoY) (%) (0.2%) 5.2% 3.7%
Neighbourhood Cap Rate (%) 6.25-6.75 6.75-7.75 6.50-8.00
2015 2016 2017 F YoY
Overall Vacancy Rate (%) 3.4% 2.6% 3.6%
Apartment Cap Rate (%) 5.00-5.75 5.00-5.50 5.00-5.50
HALIFAX

Mark RenzoniPresident & Chief Executive [email protected]
Paul MorassuttiExecutive Vice President, Executive Managing [email protected]
INVESTMENT
Peter SenstPresident, Canadian Capital [email protected]
RETAIL
Tom BalkosSenior Vice [email protected]
HOTELS
Bill StoneExecutive Vice [email protected]
SENIORS HOUSING & HEALTHCARE
Matthew BurnettSenior Vice [email protected]
Sean McCrorieValuations and Advisory Services, Senior [email protected]
MULTIFAMILY
David MontressorExecutive Vice [email protected]
LAND
Mike CzestochowskiExecutive Vice [email protected]
VANCOUVER/VICTORIA
Norm TaylorExecutive Vice President, Managing [email protected]
CALGARY
Greg KwongExecutive Vice President, Managing [email protected]
EDMONTON
Dave YoungExecutive Vice President, Managing [email protected]
SASKATCHEWAN
Michael BratvoldVice President, Managing [email protected]
WINNIPEG
Ryan BehieVice President, Managing [email protected]
SOUTHWESTERN ONTARIO
Peter WhatmoreSenior Vice President, Managing [email protected]
TORONTO
Werner Dietl Executive Vice President, Regional Managing [email protected]
Greg ClarkExecutive Vice President, Managing [email protected]
Adrian LeeExecutive Vice President, Managing [email protected]
OTTAWA
Shawn HamiltonSenior Vice President, Managing [email protected]
MONTREAL
Avi Krispine Executive Vice President, Managing [email protected]
ATLANTIC REGION
Robert MussettSenior Vice President, Senior Managing [email protected]
NATIONAL CONTACTS
RESEARCH CONTACTS
REGIONAL CONTACTS
This disclaimer shall apply to CBRE Limited, Real Estate Brokerage, and to all other divisions of the Corporation; to include all employees and independent contractors (“CBRE”) . The information set out herein, including, without limitation, any projections, images, opinions, assumptions and estimates obtained from third parties (the “Information”) has not been verified by CBRE, and CBRE does not represent, warrant or guarantee the accuracy, correctness and completeness of the Information . CBRE does not accept or assume any responsibility or liability, direct or consequential, for the Information or the recipient’s reliance upon the Information . The recipient of the Information should take such steps as the recipient may deem necessary to verify the Information prior to placing any reliance upon the Information . The Information may change and any property described in the Information may be withdrawn from the market at any time without notice or obligation to the recipient from CBRE . CBRE and the CBRE logo are the service marks of CBRE Limited and/or its affiliated or related companies in other countries. All other marks displayed on this document are the property of their respective owners. All Rights Reserved.
To learn more about CBRE Research, or to access additional research reports,
please visit the Global Research Gateway at www.cbre.ca/research.
Richard VilnerHead of Research, [email protected]
Christina CattanaSenior Research [email protected]
Related Documents