New York • Los Angeles • Atlanta • Dallas • Denver 866.545.3216 • rockhopperresearch.com RESEARCH INDUSTRY TRENDS 2008

Welcome message from author
This document is posted to help you gain knowledge. Please leave a comment to let me know what you think about it! Share it to your friends and learn new things together.
Transcript

New York • Los Angeles • Atlanta • Dallas • Denver
866.545.3216 • rockhopperresearch.com
RREESSEEAARRCCHH IINNDDUUSSTTRRYY TTRREENNDDSS
22000088
RReesseeaarrcchh IInndduussttrryy TTrreennddss 22000088 2
TTAABBLLEE OOFF CCOONNTTEENNTTSS
I. INTRODUCTION AND METHODOLOGY ....................................... 4
II. WHAT YOU REALLY NEED TO KNOW (KEY FINDINGS) ..................... 5
III. 2008 RESEARCH INDUSTRY DASHBOARD .................................... 8
IV. DETAILED FINDINGS ........................................................... 9
A. CURRENT MIX OF PROVIDER SERVICES .......................... 9
1. QUANTITATIVE METHODS 9
2. QUALITATIVE METHODS 10
B. GROWTH: SLOWER BUT THERE ................................. 11
1. GROWTH IN OVERALL REVENUES 11
2. GROWTH IN QUANTITATIVE METHODOLOGIES 12
3. GROWTH OF QUALITATIVE METHODOLOGIES 13
C. METHODS: COMPLICATED CHOICES ............................ 14
1. SELECTION CRITERIA 14
2. ISSUES IN DECIDING WHAT METHODOLOGY TO USE 16
3. HYBRIDS 17
4. THE FUTURE OF METHODOLOGIES 18
D. VENDOR RELATIONSHIPS ........................................ 20
1. EVALUATING AND SELECTING PROVIDERS 20
2. REAL CLIENT PRIORITIES VS. PROVIDER ASSUMPTIONS 21
3. OPEN TO TRYING NEW PROVIDERS 23
E. OUTSOURCING/INTERNATIONAL ............................... 24
1. OVERALL OUTSOURCING INCREASING ONLY SLIGHTLY 24
2. QUANTITATIVE TASKS OUTSOURCED 25
3. QUALITATIVE TASKS OUTSOURCED 26
4. OUTSOURCING IS NOT NECESSARILY OFF-SHORING 27
5. INTERNATIONAL 29
RReesseeaarrcchh IInndduussttrryy TTrreennddss 22000088 3
F. MISSION CRITICAL ISSUES ........................................ 30
1. ECONOMIC UNCERTAINTY 30
2. OVERALL CHALLENGES FACING THE INDUSTRY 32
G. USE OF ONLINE ENHANCED LISTINGS OR ADVERTISING ..... 33
H. RESPONDENT PROFILE ........................................... 34
1. TYPE OF COMPANY 34
2. YEARS OF EXPERIENCE AS A RESEARCHER 34
3. ANNUAL REVENUE 35
4. GEOGRAPHIC DISTRIBUTION OF RESPONDENT OFFICES 35
5. RESPONDENT’S POSITION IN ORGANIZATION 36
6. MEMBERSHIPS IN PROFESSIONAL ORGANIZATIONS 36
RReesseeaarrcchh IInndduussttrryy TTrreennddss 22000088 4
II.. IINNTTRROODDUUCCTTIIOONN AANNDD MMEETTHHOODDOOLLOOGGYY
Since 2003, Rockhopper Research has collaborated with select industry partners to produce the annual Research Industry Trends (RIT) report. Initially focused on data collection issues, the scope of RIT has expanded to include directions in outsourcing, advances in technology, and inter-relationships among research providers and clients. Along with Rockhopper, co-sponsors for RIT 2008 are Pioneer Marketing Research, the GreenBook Marketing Research Directory, GMI, Peanut Labs, Inc., and the MRG.
RIT 2008 was completed in two phases. An initial online qualitative phase was conducted early Fall 2008 among three groups of research providers and three groups of clients. Insight gained from these online sessions was used to refine the quantitative survey and to provide perspective on the environment in which RIT 2008 was conducted.
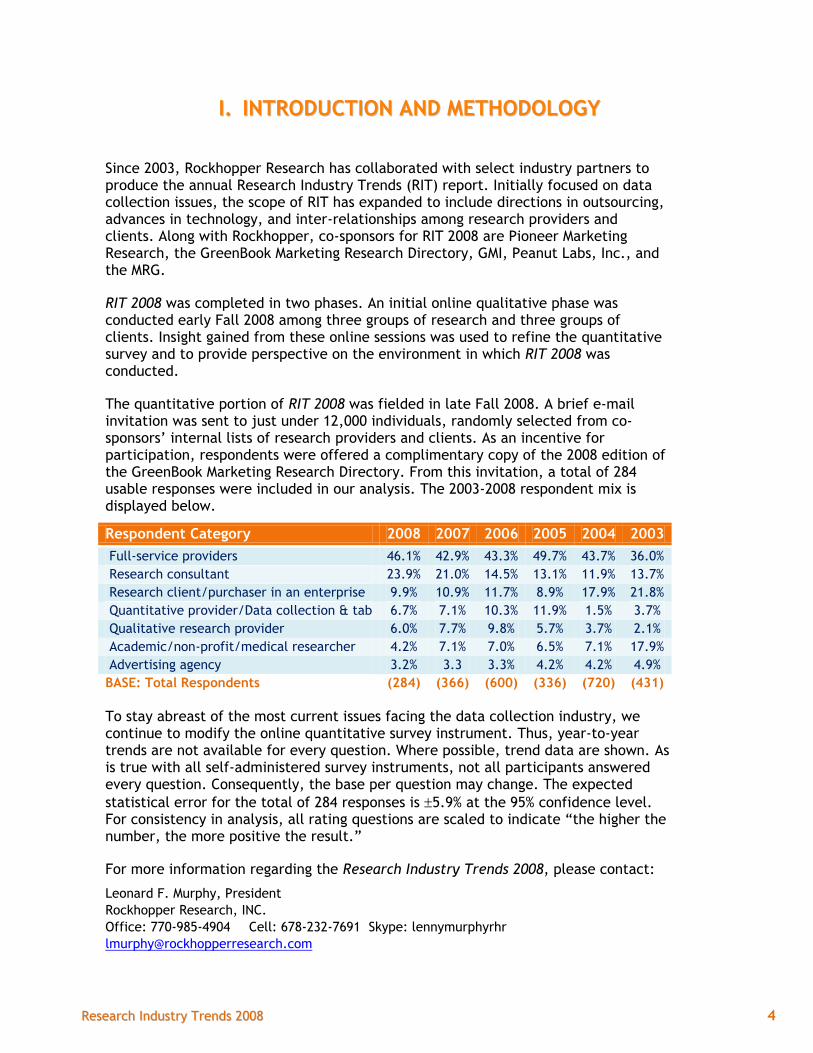
The quantitative portion of RIT 2008 was fielded in late Fall 2008. A brief e-mail invitation was sent to just under 12,000 individuals, randomly selected from co-sponsors’ internal lists of research providers and clients. As an incentive for participation, respondents were offered a complimentary copy of the 2008 edition of the GreenBook Marketing Research Directory. From this invitation, a total of 284 usable responses were included in our analysis. The 2003-2008 respondent mix is displayed below.
Respondent Category 2008 2007 2006 2005 2004 2003
Full-service providers 46.1% 42.9% 43.3% 49.7% 43.7% 36.0%
Research consultant 23.9% 21.0% 14.5% 13.1% 11.9% 13.7%
Research client/purchaser in an enterprise 9.9% 10.9% 11.7% 8.9% 17.9% 21.8%
Quantitative provider/Data collection & tab 6.7% 7.1% 10.3% 11.9% 1.5% 3.7%
Qualitative research provider 6.0% 7.7% 9.8% 5.7% 3.7% 2.1%
Academic/non-profit/medical researcher 4.2% 7.1% 7.0% 6.5% 7.1% 17.9%
Advertising agency 3.2% 3.3 3.3% 4.2% 4.2% 4.9%
BASE: Total Respondents (284) (366) (600) (336) (720) (431)
To stay abreast of the most current issues facing the data collection industry, we continue to modify the online quantitative survey instrument. Thus, year-to-year trends are not available for every question. Where possible, trend data are shown. As is true with all self-administered survey instruments, not all participants answered every question. Consequently, the base per question may change. The expected
statistical error for the total of 284 responses is 5.9% at the 95% confidence level. For consistency in analysis, all rating questions are scaled to indicate “the higher the number, the more positive the result.”
For more information regarding the Research Industry Trends 2008, please contact:
Leonard F. Murphy, President
Rockhopper Research, INC.
Office: 770-985-4904 Cell: 678-232-7691 Skype: lennymurphyrhr

RReesseeaarrcchh IInndduussttrryy TTrreennddss 22000088 5
IIII.. WWHHAATT YYOOUU RREEAALLLLYY NNEEEEDD TTOO KKNNOOWW ((KKEEYY FFIINNDDIINNGGSS))
When this data was collected at the end of 2008, there was optimism that the sinking economy would not have major adverse effects on the industry and even more optimism that respondents’ own businesses would not suffer greatly. The economy was still very much on the radar - far more so than in 2007, but the full impact of the deepening recession was not anticipated.
Apart from the economy, which is likely to trump all other issues in 2009, the results underline the need for research providers to innovate, to be prepared to provide the latest and greatest technology and methodologies, and to be flexible. Being up to the moment is more important to clients than providers realize.
RIT 2008 suggests that clients are very open to considering new providers who can bring them innovative approaches and skill sets. More than ever in the current environment, providers must not take their client relationships for granted.
Expectations for growth are lower, but still positive.
Participants in RIT 2008 are generally less positive about the future demand for their organizations’ services than those interviewed for RIT 2007. Still, two thirds of respondents expected the demand for the services they provide to increase during 2008. In total, clients are slightly less positive than providers. The trend toward globalization identified in previous RIT studies continues with four-in-five international providers predicting the demand for their services would increase during 2008.
Impact of Economic Uncertainty
Findings at the end of 2008 are in line with other concurrently gathered trend data suggesting that the research industry might be counter-cyclical and at least somewhat inoculated against the effects of the strongly recessive economy. Polled several weeks after the collapse of Lehman Brothers, industry respondents reported scant negative effects on business.
Looking forward at the industry as a whole, almost two-thirds of these industry respondents expected little effect or even a possible benefit from the end-of-year economic turbulence, while 36% expected significant negative effect. Looking closer to home, respondents are even more sanguine. Only one in ten expected significant negative effect on their own organizations.
Two thirds indicated their revenues had increased or were unchanged since the collapse of Lehman Brothers. And, only 20% said the economic turbulence was the direct cause of projects bring scaled down or canceled. Most RIT 2008 respondents were not concerned about the immediate impact of the economic turbulence on their organizations’ revenues.

RReesseeaarrcchh IInndduussttrryy TTrreennddss 22000088 6
Challenges Facing the Research Industry
Whatever the level of optimism or concern, it is clear that the economy is definitely on the radar. Costs/budgets and the economy are the two most frequently mentioned “challenges facing the research industry in 2009.” Last year, in RIT 2007 neither issue was in the top ten.
RIT 2008 respondents also expressed caution about a number of more “routine” marketing research issues: response rates, keeping up with technology, sampling issues, maintaining high quality data, and web-based interviewing.
Preferences for data collection modalities include a mix of traditional and newer technologies.
While web-based and other cutting edge technologies will continue to impact quantitative data collection, CATI is not dead, it is just not growing. The main issue is the diminishing penetration of land lines. But, many “insiders” believe the industry will find a way to deal with increased usage of cell phones among younger respondents.
Overall, respondents do not foresee accelerated growth for any specific qualitative research methodology, although across-the-board growth is predicted for a number of traditional and non-traditional qualitative research methodologies. RIT 2008 respondents predict the highest levels of growth for hybrids. Lower growth levels are forecast for traditional focus groups, ethnography, and in-person IDI’s.
Providers must not take clients for granted or rely on relationships. Techno-savvy providers will have an edge that may be decisive.
Approximately three fifths of research buyers indicate they are open to trying new service providers, generally out of an ongoing desire to keep abreast of new resources, latest techniques, technology, and increased quality and expertise. This seems independent of satisfaction with current providers, reinforcing the precept that providers should not take even satisfied clients for granted.
During RIT 2008, we looked closely at the differences between providers and clients in their opinions of what factors are important in the selection of both quantitative and qualitative providers. The results are quite enlightening and should help providers better target their marketing/promotional efforts.
In the selection of quantitative providers, providers under estimate the importance to clients of uses the latest data collection technology, understands online data collection, and has an access panel. In contrast, providers over estimate the value to potential clients of high quality analysis, familiarity with the industry or category, as well as breadth of experience in the target segment.
In the qualitative providers selection process, providers over estimate the importance to clients of also does quantitative research, good relationship with client, has knowledgeable staff, high quality analysis, and provides highest data quality. Of interest, providers tend to vastly under estimate the importance of uses the latest data collection technology to client evaluations of qualitative

RReesseeaarrcchh IInndduussttrryy TTrreennddss 22000088 7
providers. Also relatively more important to clients than providers are company is financially stable and understands online data collection.
Provider Selection
The findings of RIT 2008 showed that the top five selection criteria used to evaluate quantitative providers are 1) listens well/ understands client needs, 2) completes research in agreed-upon time, 3) has good relationship w/client, 4) has knowledgeable staff, and 5) familiar w/clients needs. For choosing qualitative providers, the top five selection factors are nearly the same. The one exception is that flexibility on changing project parameters is considered more important when choosing a qualitative provider than has knowledgeable staff.
Overall, providers and clients have a very similar hierarchy of selection criteria for both quantitative and qualitative methodologies. Key decision factors for both are effectiveness, control of quality, timeliness of results, and cost. More important among providers are data security and demand for a method. Clients felt stronger about familiarity with technique and something new and different.
Outsourcing
Reported levels of outsourcing research tasks are essentially the same in 2008 as found in RIT 2007. Seven-in-ten study respondents indicated their organization outsourced about the same percentage of research functions in 2008 as they did during the previous year. About 20% of respondents reported they experienced a higher percentage of outsourcing in 2008 than in 2007. One half of that percentage say they outsourced a lower percentage of project tasks this year than last.
It is no surprise that the more technologically complicated a research function, the more likely it is to be outsourced. Topping the list of quantitative research functions outsourced most often are CATI, Internet survey hosting, online survey programming and data tabulation. The qualitative research functions outsourced most often are recruiting for focus groups and facilities for groups and interviews.

RReesseeaarrcchh IInndduussttrryy TTrreennddss 22000088 8
IIIIII.. 22000088 RREESSEEAARRCCHH IINNDDUUSSTTRRYY DDAASSHHBBOOAARRDD
On the following page you will find a Flash-based dashboard giving you the opportunity to visualize some of the key data yielded by the 2008 survey.
In order to view the dashboard and interact, you should download the latest version of the free Flash Player. It is available for easy download and installation from http://www.adobe.com.
Please note that you must give permission for your system to run the Flash based content.

RReesseeaarrcchh IInndduussttrryy TTrreennddss 22000088 9
IIVV.. DDEETTAAIILLEEDD FFIINNDDIINNGGSS
A. CURRENT MIX OF PROVIDER SERVICES
1. QUANTITATIVE METHODS
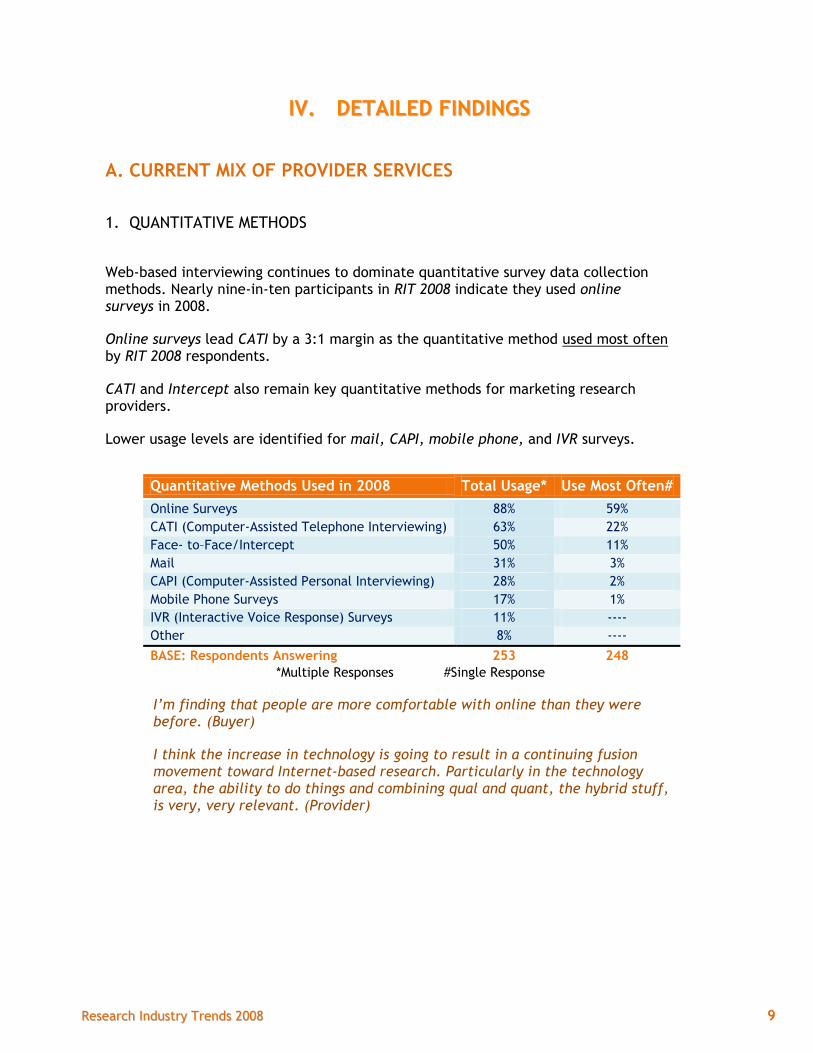
Web-based interviewing continues to dominate quantitative survey data collection methods. Nearly nine-in-ten participants in RIT 2008 indicate they used online surveys in 2008.
Online surveys lead CATI by a 3:1 margin as the quantitative method used most often by RIT 2008 respondents.
CATI and Intercept also remain key quantitative methods for marketing research providers.
Lower usage levels are identified for mail, CAPI, mobile phone, and IVR surveys.
Quantitative Methods Used in 2008 Total Usage* Use Most Often#
Online Surveys 88% 59%
CATI (Computer-Assisted Telephone Interviewing) 63% 22%
Face- to–Face/Intercept 50% 11%
Mail 31% 3%
CAPI (Computer-Assisted Personal Interviewing) 28% 2%
Mobile Phone Surveys 17% 1%
IVR (Interactive Voice Response) Surveys 11% ----
Other 8% ----
BASE: Respondents Answering 253 248
*Multiple Responses #Single Response
I’m finding that people are more comfortable with online than they were before. (Buyer)
I think the increase in technology is going to result in a continuing fusion movement toward Internet-based research. Particularly in the technology area, the ability to do things and combining qual and quant, the hybrid stuff, is very, very relevant. (Provider)
RReesseeaarrcchh IInndduussttrryy TTrreennddss 22000088 10
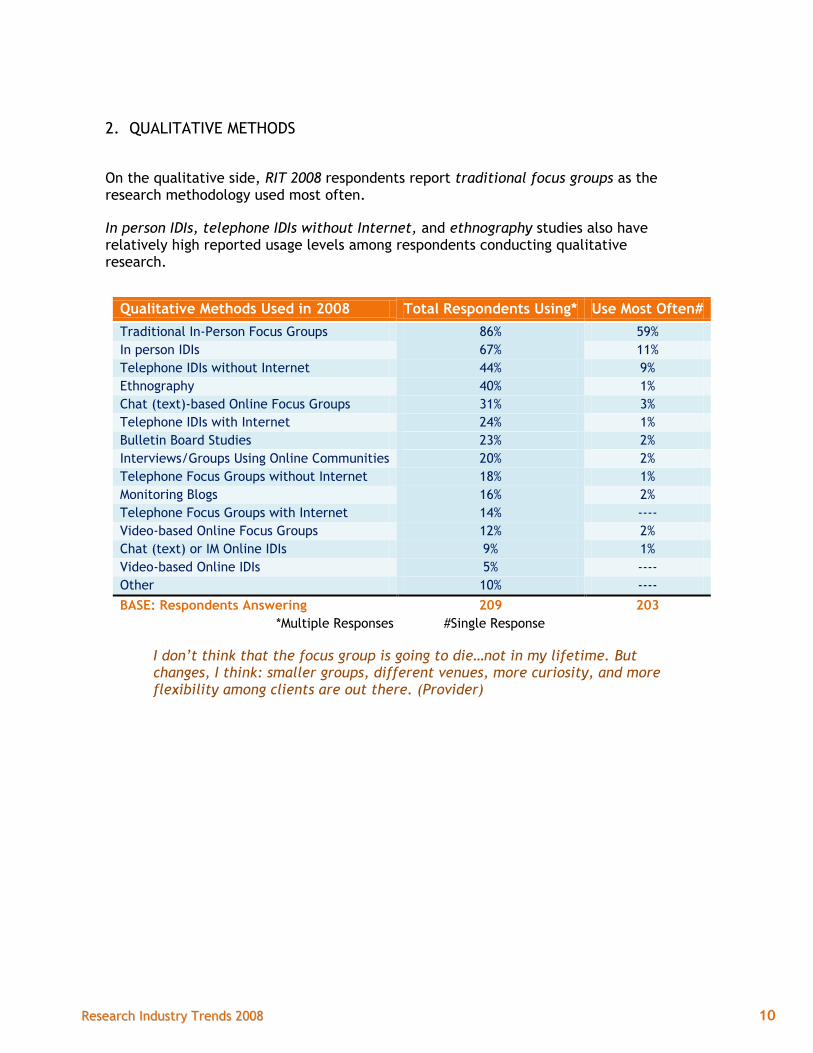
2. QUALITATIVE METHODS
On the qualitative side, RIT 2008 respondents report traditional focus groups as the research methodology used most often.
In person IDIs, telephone IDIs without Internet, and ethnography studies also have relatively high reported usage levels among respondents conducting qualitative research.
Qualitative Methods Used in 2008 Total Respondents Using* Use Most Often#
Traditional In-Person Focus Groups 86% 59%
In person IDIs 67% 11%
Telephone IDIs without Internet 44% 9%
Ethnography 40% 1%
Chat (text)-based Online Focus Groups 31% 3%
Telephone IDIs with Internet 24% 1%
Bulletin Board Studies 23% 2%
Interviews/Groups Using Online Communities 20% 2%
Telephone Focus Groups without Internet 18% 1%
Monitoring Blogs 16% 2%
Telephone Focus Groups with Internet 14% ----
Video-based Online Focus Groups 12% 2%
Chat (text) or IM Online IDIs 9% 1%
Video-based Online IDIs 5% ----
Other 10% ----
BASE: Respondents Answering 209 203
*Multiple Responses #Single Response
I don’t think that the focus group is going to die…not in my lifetime. But changes, I think: smaller groups, different venues, more curiosity, and more flexibility among clients are out there. (Provider)

RReesseeaarrcchh IInndduussttrryy TTrreennddss 22000088 11
B. GROWTH: SLOWER BUT THERE
1. GROWTH IN OVERALL REVENUES
While an overwhelming proportion of 2008 respondents expect increased revenues for the end of 2008, the percentages are lower than in 2007.
There is less change in the number of clients who expect increased revenue than in the number of providers. Providers in 2007 were more optimistic than clients. For 2008 they are at about the same level.
The trend toward globalization identified in previous RIT studies continues with four-in-five international providers predicting the demand for their services would increase during 2008.
We’ve seen some increase in our international business, and I expect that to continue. With the dollar being the way it is, I think a lot of the goods sold here and made here are really valuable internationally. (Provider)
My budget is pretty much exactly the same as last year. (Buyer)
The world changed and there are a lot of research needs again. (Buyer)
85%
76%
68%
82%79%79%
64% 63%66% 66%
Int'l Providers US-only Providers Clients Providers Total
Expect Research Demand to Increase
2007 2008

RReesseeaarrcchh IInndduussttrryy TTrreennddss 22000088 12
2. GROWTH IN QUANTITATIVE METHODOLOGIES
According to RIT 2008 respondents, internet-based research will dominate growth in quantitative methods in 2009 – and beyond.
Expected growth levels are significantly lower for other quantitative methodologies, including hybrids.
One of the most interesting findings is the reluctance of so many respondents to state an opinion.
*Top 2 box, 5-point scale
13%
5%
4%
4%
2%
2%
1%
1%
17%
38%
Internet based research
Hybrid methods
Operational changes
Analysis/segmentation
Cell/mobile phones
CATI
Video options
Max-Diff
Other
Don't know / nothing
Data Collection Growth Areas: Quantitative*
RReesseeaarrcchh IInndduussttrryy TTrreennddss 22000088 13
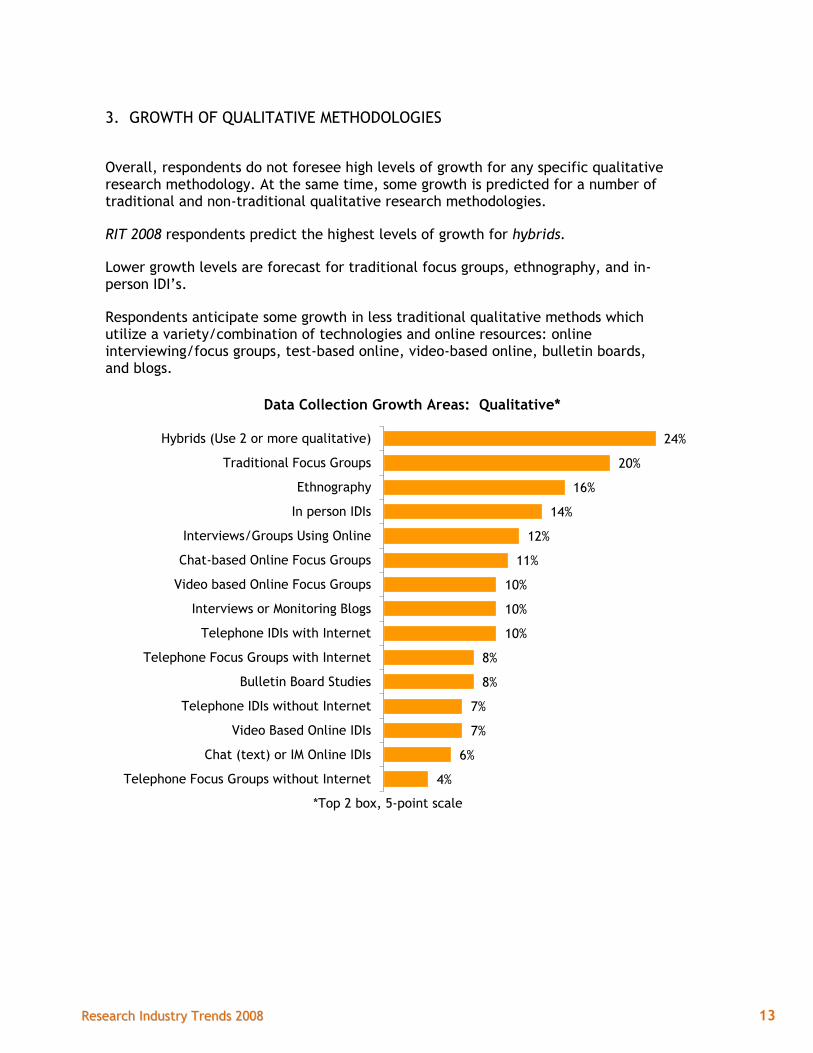
3. GROWTH OF QUALITATIVE METHODOLOGIES
Overall, respondents do not foresee high levels of growth for any specific qualitative research methodology. At the same time, some growth is predicted for a number of traditional and non-traditional qualitative research methodologies.
RIT 2008 respondents predict the highest levels of growth for hybrids.
Lower growth levels are forecast for traditional focus groups, ethnography, and in-person IDI’s.
Respondents anticipate some growth in less traditional qualitative methods which utilize a variety/combination of technologies and online resources: online interviewing/focus groups, test-based online, video-based online, bulletin boards, and blogs.
*Top 2 box, 5-point scale
24%
20%
16%
14%
12%
11%
10%
10%
10%
8%
8%
7%
7%
6%
4%
Hybrids (Use 2 or more qualitative)
Traditional Focus Groups
Ethnography
In person IDIs
Interviews/Groups Using Online
Chat-based Online Focus Groups
Video based Online Focus Groups
Interviews or Monitoring Blogs
Telephone IDIs with Internet
Telephone Focus Groups with Internet
Bulletin Board Studies
Telephone IDIs without Internet
Video Based Online IDIs
Chat (text) or IM Online IDIs
Telephone Focus Groups without Internet
Data Collection Growth Areas: Qualitative*
RReesseeaarrcchh IInndduussttrryy TTrreennddss 22000088 14
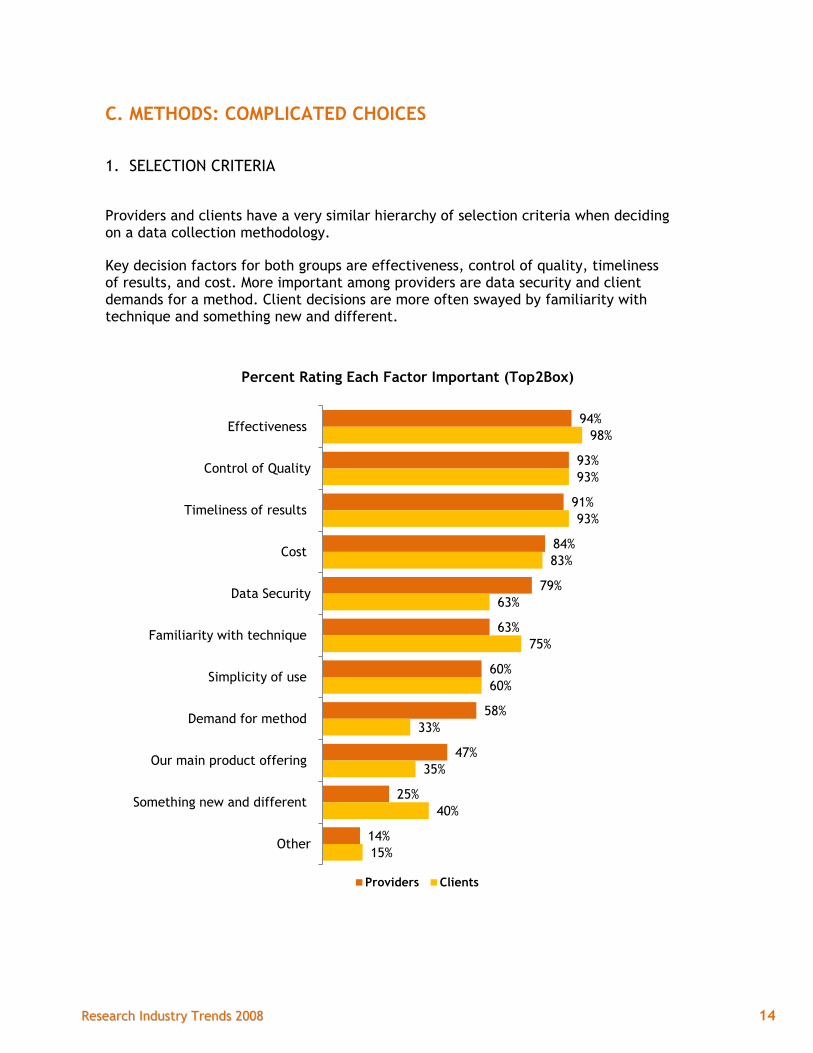
C. METHODS: COMPLICATED CHOICES
1. SELECTION CRITERIA
Providers and clients have a very similar hierarchy of selection criteria when deciding on a data collection methodology.
Key decision factors for both groups are effectiveness, control of quality, timeliness of results, and cost. More important among providers are data security and client demands for a method. Client decisions are more often swayed by familiarity with technique and something new and different.
94%
93%
91%
84%
79%
63%
60%
58%
47%
25%
14%
98%
93%
93%
83%
63%
75%
60%
33%
35%
40%
15%
Effectiveness
Control of Quality
Timeliness of results
Cost
Data Security
Familiarity with technique
Simplicity of use
Demand for method
Our main product offering
Something new and different
Other
Percent Rating Each Factor Important (Top2Box)
Providers Clients

RReesseeaarrcchh IInndduussttrryy TTrreennddss 22000088 15
Following the trend first identified in RIT 2005, the use of web-based methods for quantitative data collection continues to grow – up 12 percentage points from RIT 2007 to RIT 2008.
58%
22%
11%
3%
2%
1%
47%
29%
12%
5%
3%
1%
Internet
CATI
Face-to-face or intercept
CAPI
Cell/Mobile Phones
Quantitative Data Collection Methods
2008 2007

RReesseeaarrcchh IInndduussttrryy TTrreennddss 22000088 16
2. ISSUES IN DECIDING WHAT METHODOLOGY TO USE
It is not surprising that client budgetary restraints remains the issue which will have the greatest impact on changes in respondents’ choices of data collection methods during the coming year. Other important issues are quality of sample and declining response rates.
Issue With the Greatest Impact on How Data Collected %
Anticipate Changes in Data Collection in 2009 (Net) 81%
Client budgetary constraints 25%
Quality of Sample 16%
Declining response rates 12%
Speed of completion 6%
Client demands for innovation 4%
Higher salaries/wages/costs 4%
Higher CPIs for sample 4%
Bias issues (e.g., representativeness) 4%
Increased use of mobile communications 1%
Availability of US sample 1%
Availability of international sample ---
Other 3%
Don’t anticipate changes in 2009 data collection 19%
Base - Total Respondents 284
The main steps respondents are taking to address the impact of these data collection issues include exploring new methodologies, doing more with same resources, exploring new technologies, and actively looking for better sample providers.
Steps to Address Data Collection Issues* %
Exploring new methodologies 45%
Doing more with same resources 40%
Exploring new technologies 38%
Actively looking for better sample providers 38%
Exploring new sample resources 31%
Close partnering with quality access panels 29%
More diligent validation 21%
Recommending higher respondent incentives 20%
Negotiating discounts or shorter timelines with vendors 18%
Using more sample provided by clients 17%
Other 9%
Base - Anticipate changes (*multiple responses) 231
RReesseeaarrcchh IInndduussttrryy TTrreennddss 22000088 17
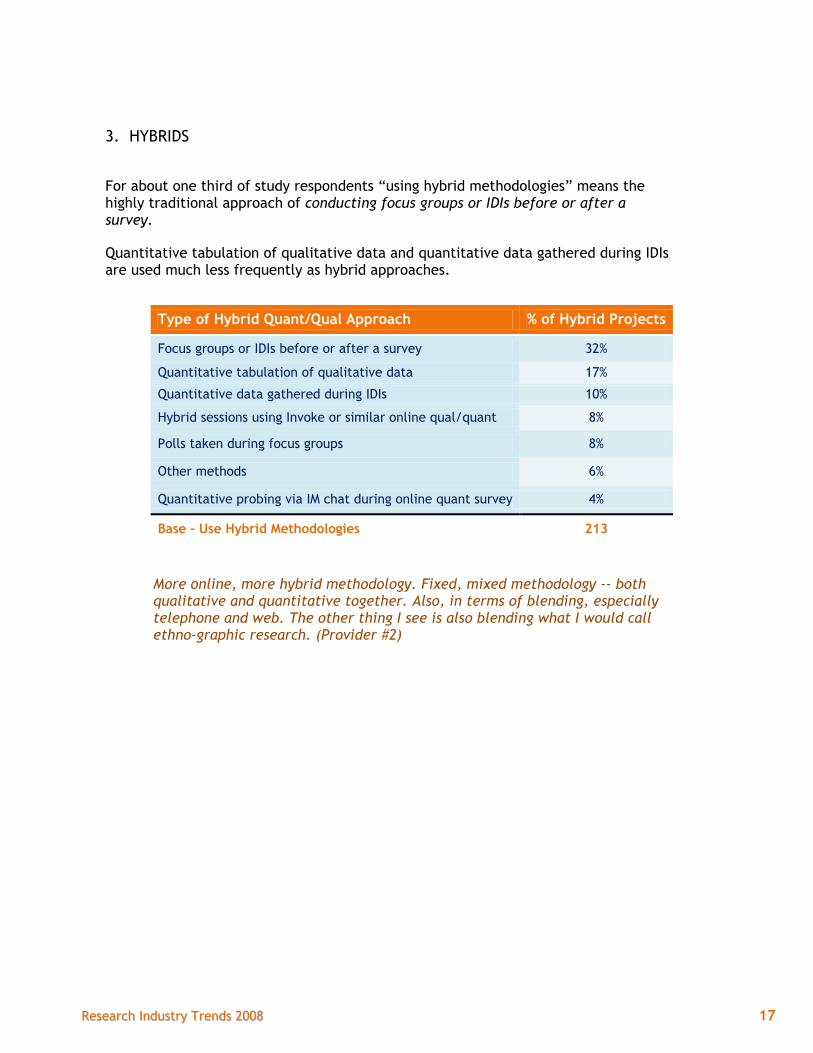
3. HYBRIDS
For about one third of study respondents “using hybrid methodologies” means the highly traditional approach of conducting focus groups or IDIs before or after a survey.
Quantitative tabulation of qualitative data and quantitative data gathered during IDIs are used much less frequently as hybrid approaches.
Type of Hybrid Quant/Qual Approach % of Hybrid Projects
Focus groups or IDIs before or after a survey 32%
Quantitative tabulation of qualitative data 17%
Quantitative data gathered during IDIs 10%
Hybrid sessions using Invoke or similar online qual/quant 8%
Polls taken during focus groups 8%
Other methods 6%
Quantitative probing via IM chat during online quant survey 4%
Base – Use Hybrid Methodologies 213
More online, more hybrid methodology. Fixed, mixed methodology -- both qualitative and quantitative together. Also, in terms of blending, especially telephone and web. The other thing I see is also blending what I would call ethno-graphic research. (Provider #2)

RReesseeaarrcchh IInndduussttrryy TTrreennddss 22000088 18
4. THE FUTURE OF METHODOLOGIES
Over half of 2008 respondents anticipate a significant increase in the use of online surveys for quantitative data collection. Hybrids, online communities, and panels will also see increased utilization during the coming year as quantitative data collection modalities.
Quantitative Method Increase No Change Decrease
Online surveys 58% 38% 4%
Hybrids (two or more quant techniques in same study) 41% 54% 5%
Surveys Within Online Communities 35% 57% 8%
Using panels (all kinds) for sample 33% 61% 6%
Using access (external, for hire) panels for sample 25% 62% 14%
Using proprietary (your own) panels for sample 23% 67% 11%
Face- to -Face or Intercepts 22% 62% 17%
Surveys On Blogs 21% 68% 11%
Mobile Phone Surveys 20% 67% 12%
CATI (Computer-Assisted Telephone Interviewing) 19% 60% 22%
CAPI (Computer-Assisted Personal Interviewing) 16% 67% 18%
Surveys in virtual communities (e.g., Second Life) 14% 71% 15%
IVR (Interactive Voice Response) Surveys 9% 74% 18%
Mail Surveys 5% 66% 29%
Base – Respondents Answering
RReesseeaarrcchh IInndduussttrryy TTrreennddss 22000088 19
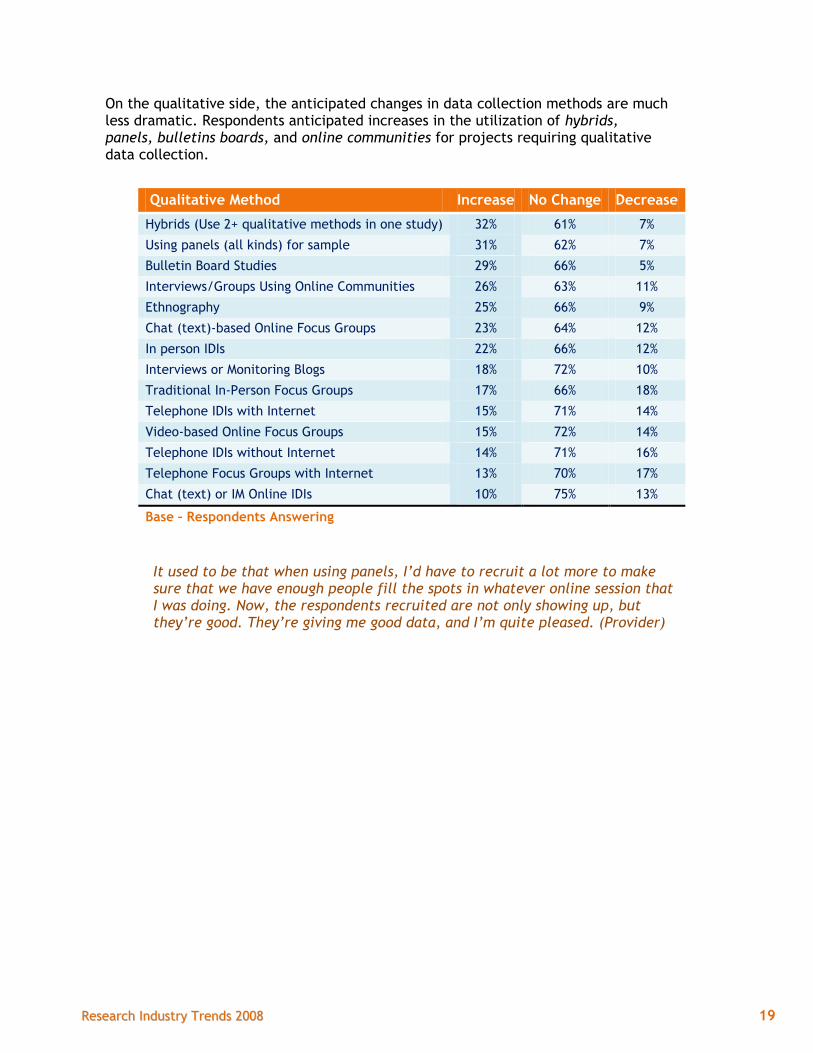
On the qualitative side, the anticipated changes in data collection methods are much less dramatic. Respondents anticipated increases in the utilization of hybrids, panels, bulletins boards, and online communities for projects requiring qualitative data collection.
Qualitative Method Increase No Change Decrease
Hybrids (Use 2+ qualitative methods in one study) 32% 61% 7%
Using panels (all kinds) for sample 31% 62% 7%
Bulletin Board Studies 29% 66% 5%
Interviews/Groups Using Online Communities 26% 63% 11%
Ethnography 25% 66% 9%
Chat (text)-based Online Focus Groups 23% 64% 12%
In person IDIs 22% 66% 12%
Interviews or Monitoring Blogs 18% 72% 10%
Traditional In-Person Focus Groups 17% 66% 18%
Telephone IDIs with Internet 15% 71% 14%
Video-based Online Focus Groups 15% 72% 14%
Telephone IDIs without Internet 14% 71% 16%
Telephone Focus Groups with Internet 13% 70% 17%
Chat (text) or IM Online IDIs 10% 75% 13%
Base – Respondents Answering
It used to be that when using panels, I’d have to recruit a lot more to make sure that we have enough people fill the spots in whatever online session that I was doing. Now, the respondents recruited are not only showing up, but they’re good. They’re giving me good data, and I’m quite pleased. (Provider)

RReesseeaarrcchh IInndduussttrryy TTrreennddss 22000088 20
D. VENDOR RELATIONSHIPS
1. EVALUATING AND SELECTING PROVIDERS
The top three criteria clients cite for evaluating both qualitative and quantitative providers are:
Listening well and understanding client needs
Completing research on time
Good relations with the client
Flexibility about project parameters and experience (both industry and with target segments) are more important criteria for selecting qualitative research providers.
Client Priorities for Provider Selection Quantitative* Qualitative* Differences
Listens well/understands client needs 97% 97% ----
Completes research in agreed-upon time 94% 99% -5%
Has good relationship w/client 93% 93% ----
Has knowledgeable staff 91% 87% 4%
Familiar w/clients needs 90% 93% -3%
Responds rapidly to requests 88% 84% 4%
Has previous experience w/client 85% 88% -3%
Provides highest data quality 85% 87% -2%
Familiar w/industry category 80% 80% ----
Flexibility on changing project parameters 78% 91% -13%
High quality analysis 78% 86% -8%
Has broad experience in the target segment 74% 86% -12%
Consults on best practices and effective methodology 63% 70% -7%
Has long experience/time in business 61% 80% -19%
Provides data analysis services 61% 55% 6%
Understands online data collection 59% 29% 30%
Offers unique methodology or approach 51% 39% 12%
Company is financially stable 48% 46% 2%
Lowest price 42% 36% 6%
Uses the latest data collection technology 41% 28% 13%
Uses sophisticated collection/technology/strategies 39% 36% 3%
Also does quant/qual research 34% 49% -15%
Uses the latest analytical packages 34% 26% 8%
Has an access panel 16% 17% -1%
Base – Total Clients
*Top 2 box, 5-point scale
RReesseeaarrcchh IInndduussttrryy TTrreennddss 22000088 21
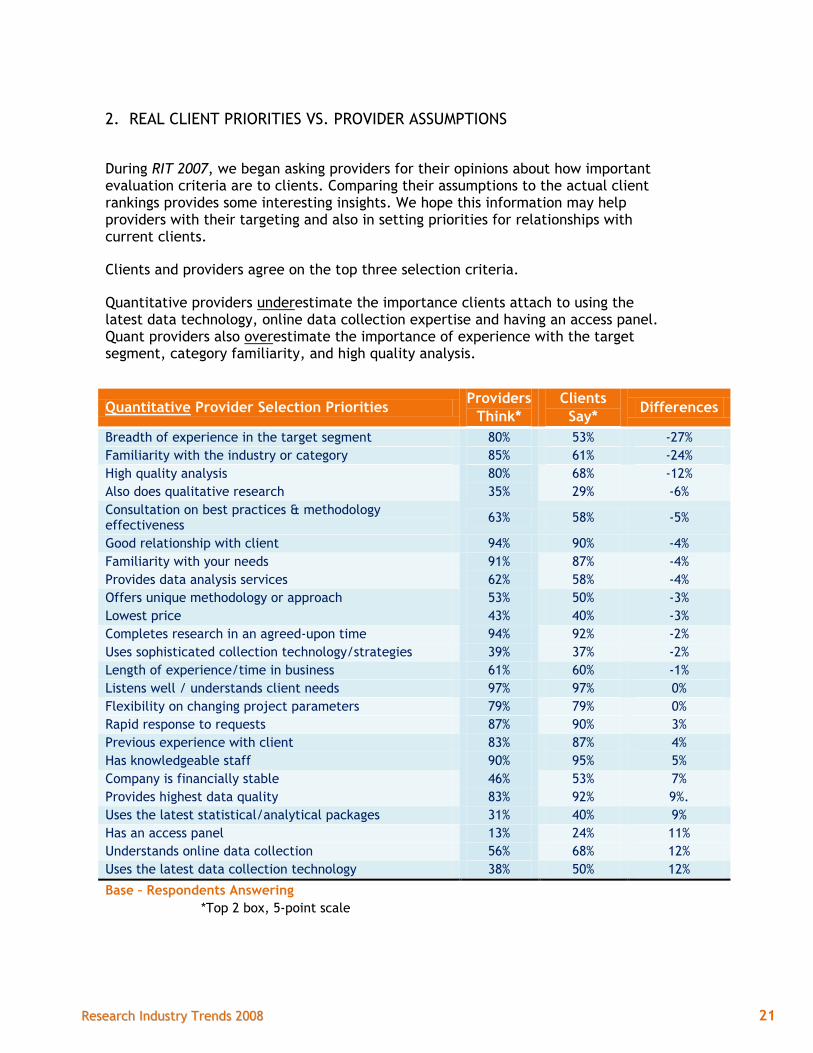
2. REAL CLIENT PRIORITIES VS. PROVIDER ASSUMPTIONS
During RIT 2007, we began asking providers for their opinions about how important evaluation criteria are to clients. Comparing their assumptions to the actual client rankings provides some interesting insights. We hope this information may help providers with their targeting and also in setting priorities for relationships with current clients.
Clients and providers agree on the top three selection criteria.
Quantitative providers underestimate the importance clients attach to using the latest data technology, online data collection expertise and having an access panel. Quant providers also overestimate the importance of experience with the target segment, category familiarity, and high quality analysis.
Quantitative Provider Selection Priorities Providers
Think*
Clients
Say* Differences
Breadth of experience in the target segment 80% 53% -27%
Familiarity with the industry or category 85% 61% -24%
High quality analysis 80% 68% -12%
Also does qualitative research 35% 29% -6%
Consultation on best practices & methodology effectiveness
63% 58% -5%
Good relationship with client 94% 90% -4%
Familiarity with your needs 91% 87% -4%
Provides data analysis services 62% 58% -4%
Offers unique methodology or approach 53% 50% -3%
Lowest price 43% 40% -3%
Completes research in an agreed-upon time 94% 92% -2%
Uses sophisticated collection technology/strategies 39% 37% -2%
Length of experience/time in business 61% 60% -1%
Listens well / understands client needs 97% 97% 0%
Flexibility on changing project parameters 79% 79% 0%
Rapid response to requests 87% 90% 3%
Previous experience with client 83% 87% 4%
Has knowledgeable staff 90% 95% 5%
Company is financially stable 46% 53% 7%
Provides highest data quality 83% 92% 9%.
Uses the latest statistical/analytical packages 31% 40% 9%
Has an access panel 13% 24% 11%
Understands online data collection 56% 68% 12%
Uses the latest data collection technology 38% 50% 12%
Base – Respondents Answering
*Top 2 box, 5-point scale
RReesseeaarrcchh IInndduussttrryy TTrreennddss 22000088 22
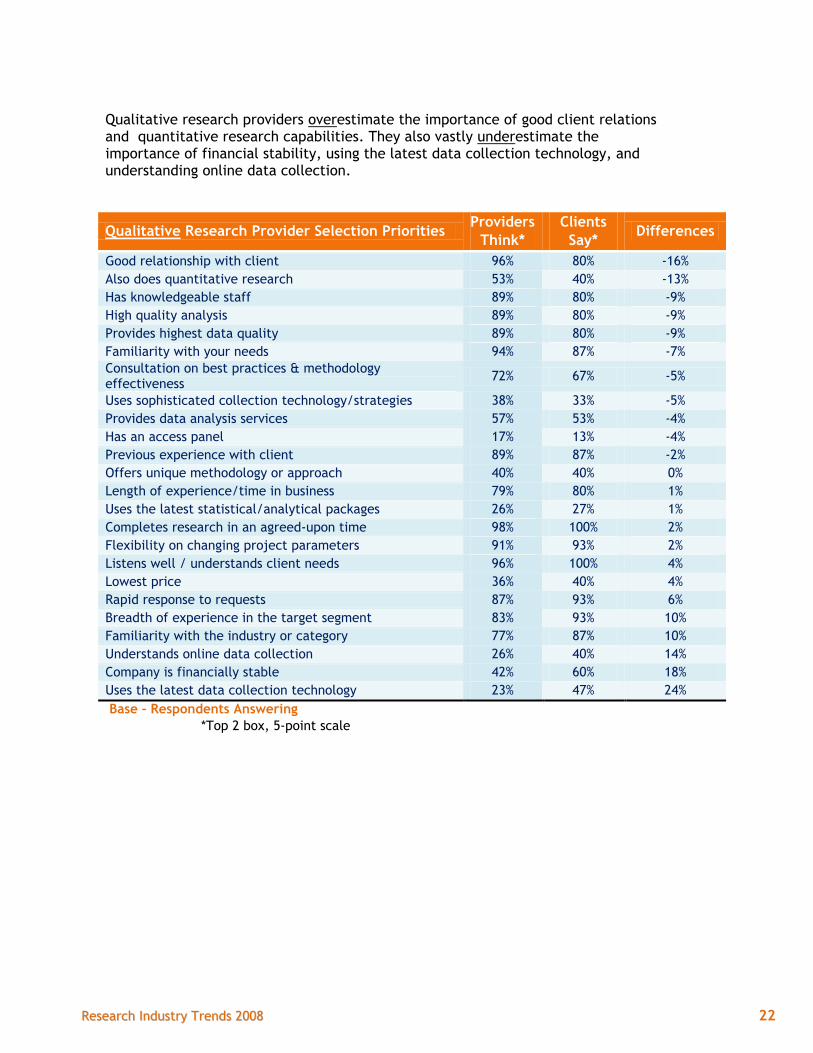
Qualitative research providers overestimate the importance of good client relations and quantitative research capabilities. They also vastly underestimate the importance of financial stability, using the latest data collection technology, and understanding online data collection.
Qualitative Research Provider Selection Priorities Providers
Think*
Clients
Say* Differences
Good relationship with client 96% 80% -16%
Also does quantitative research 53% 40% -13%
Has knowledgeable staff 89% 80% -9%
High quality analysis 89% 80% -9%
Provides highest data quality 89% 80% -9%
Familiarity with your needs 94% 87% -7%
Consultation on best practices & methodology effectiveness
72% 67% -5%
Uses sophisticated collection technology/strategies 38% 33% -5%
Provides data analysis services 57% 53% -4%
Has an access panel 17% 13% -4%
Previous experience with client 89% 87% -2%
Offers unique methodology or approach 40% 40% 0%
Length of experience/time in business 79% 80% 1%
Uses the latest statistical/analytical packages 26% 27% 1%
Completes research in an agreed-upon time 98% 100% 2%
Flexibility on changing project parameters 91% 93% 2%
Listens well / understands client needs 96% 100% 4%
Lowest price 36% 40% 4%
Rapid response to requests 87% 93% 6%
Breadth of experience in the target segment 83% 93% 10%
Familiarity with the industry or category 77% 87% 10%
Understands online data collection 26% 40% 14%
Company is financially stable 42% 60% 18%
Uses the latest data collection technology 23% 47% 24%
Base – Respondents Answering
*Top 2 box, 5-point scale

RReesseeaarrcchh IInndduussttrryy TTrreennddss 22000088 23
3. OPEN TO TRYING NEW PROVIDERS
Providers should not take clients for granted. Only 26% of clients say they plan to stick with their 2007 providers in 2008. And almost 2/3 say they are open to using at least some new providers.
Asked why they consider new providers over existing, 20% of clients say they are always looking for more providers. Looking for better technology, new skills, and ideas are the most frequently offered reasons.
All the same providers
26%
At least some new providers
62%
Don't know/Not applicable
12%
Usage of New Providers in 2008
19%
18%
13%
11%
9%
5%
5%
Always looking for more suppliers
Better technology
New ideas and skills
Quality
Better meet client needs
Better/increased sample
Don't know
Reasons To Look For New Provider
RReesseeaarrcchh IInndduussttrryy TTrreennddss 22000088 24
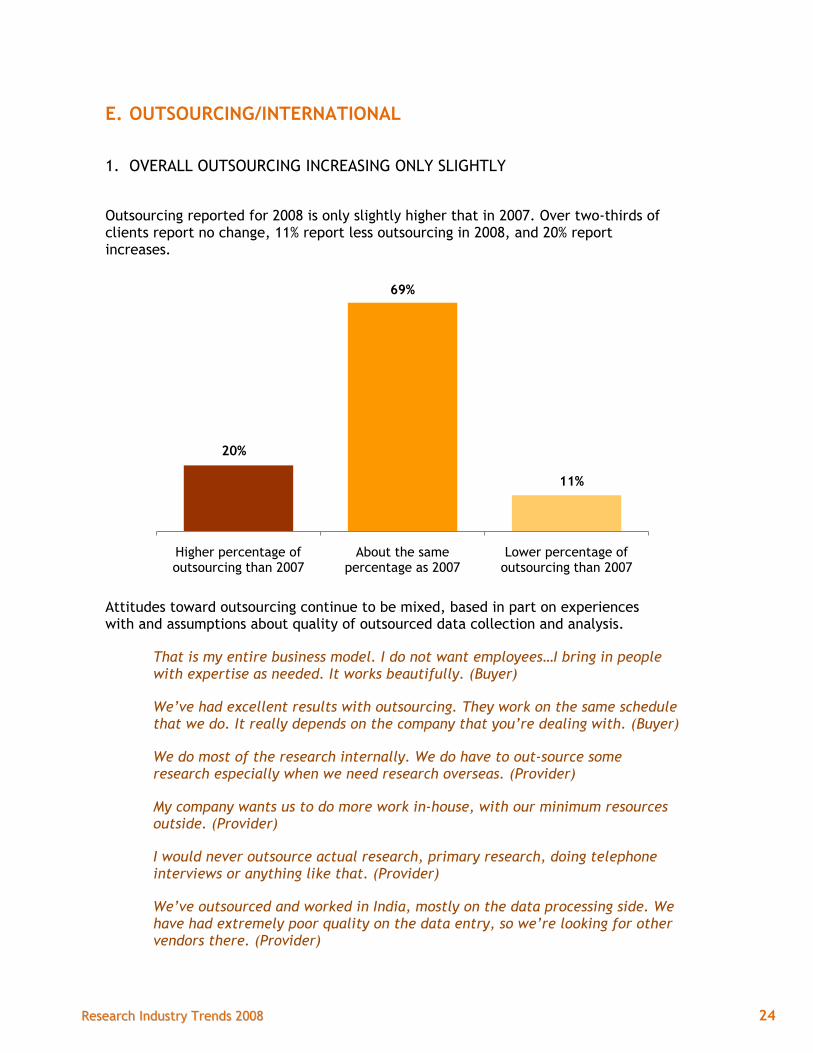
E. OUTSOURCING/INTERNATIONAL
1. OVERALL OUTSOURCING INCREASING ONLY SLIGHTLY
Outsourcing reported for 2008 is only slightly higher that in 2007. Over two-thirds of clients report no change, 11% report less outsourcing in 2008, and 20% report increases.
Attitudes toward outsourcing continue to be mixed, based in part on experiences with and assumptions about quality of outsourced data collection and analysis.
That is my entire business model. I do not want employees…I bring in people with expertise as needed. It works beautifully. (Buyer)
We’ve had excellent results with outsourcing. They work on the same schedule that we do. It really depends on the company that you’re dealing with. (Buyer)
We do most of the research internally. We do have to out-source some research especially when we need research overseas. (Provider)
My company wants us to do more work in-house, with our minimum resources outside. (Provider)
I would never outsource actual research, primary research, doing telephone interviews or anything like that. (Provider)
We’ve outsourced and worked in India, mostly on the data processing side. We have had extremely poor quality on the data entry, so we’re looking for other vendors there. (Provider)
20%
69%
11%
Higher percentage of outsourcing than 2007
About the same percentage as 2007
Lower percentage of outsourcing than 2007
RReesseeaarrcchh IInndduussttrryy TTrreennddss 22000088 25
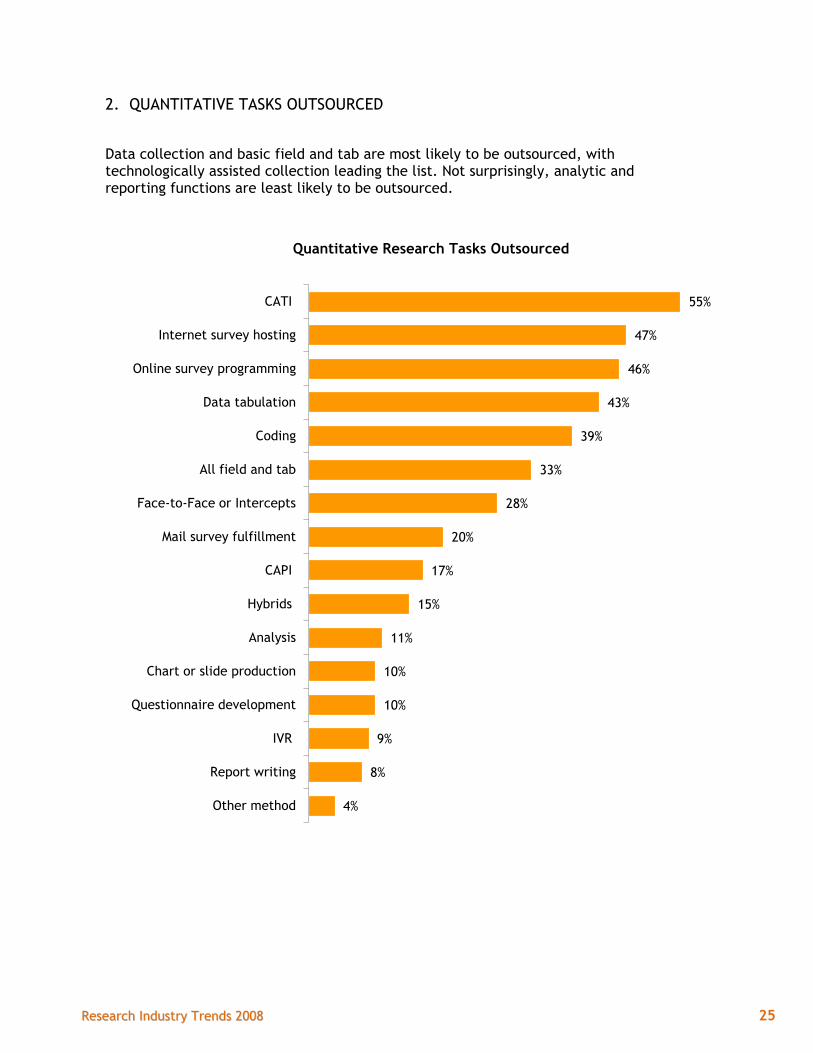
2. QUANTITATIVE TASKS OUTSOURCED
Data collection and basic field and tab are most likely to be outsourced, with technologically assisted collection leading the list. Not surprisingly, analytic and reporting functions are least likely to be outsourced.
55%
47%
46%
43%
39%
33%
28%
20%
17%
15%
11%
10%
10%
9%
8%
4%
CATI
Internet survey hosting
Online survey programming
Data tabulation
Coding
All field and tab
Face-to-Face or Intercepts
Mail survey fulfillment
CAPI
Hybrids
Analysis
Chart or slide production
Questionnaire development
IVR
Report writing
Other method
Quantitative Research Tasks Outsourced
RReesseeaarrcchh IInndduussttrryy TTrreennddss 22000088 26
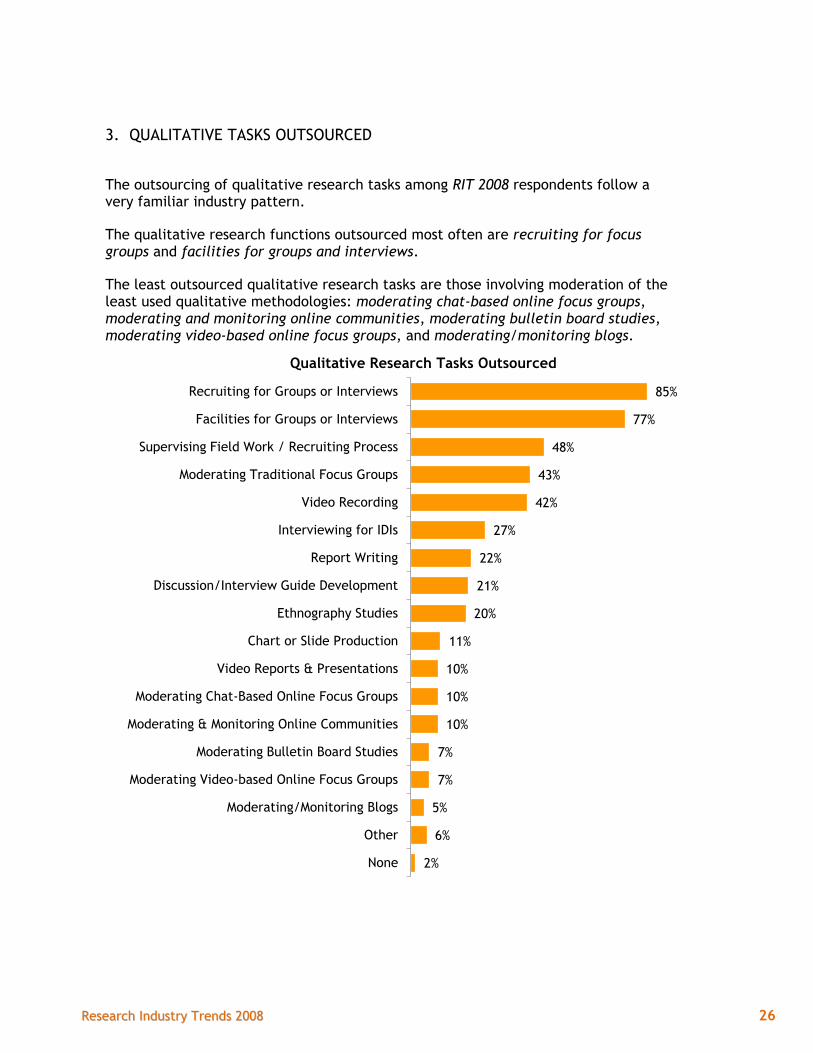
3. QUALITATIVE TASKS OUTSOURCED
The outsourcing of qualitative research tasks among RIT 2008 respondents follow a very familiar industry pattern.
The qualitative research functions outsourced most often are recruiting for focus groups and facilities for groups and interviews.
The least outsourced qualitative research tasks are those involving moderation of the least used qualitative methodologies: moderating chat-based online focus groups, moderating and monitoring online communities, moderating bulletin board studies, moderating video-based online focus groups, and moderating/monitoring blogs.
85%
77%
48%
43%
42%
27%
22%
21%
20%
11%
10%
10%
10%
7%
7%
5%
6%
2%
Recruiting for Groups or Interviews
Facilities for Groups or Interviews
Supervising Field Work / Recruiting Process
Moderating Traditional Focus Groups
Video Recording
Interviewing for IDIs
Report Writing
Discussion/Interview Guide Development
Ethnography Studies
Chart or Slide Production
Video Reports & Presentations
Moderating Chat-Based Online Focus Groups
Moderating & Monitoring Online Communities
Moderating Bulletin Board Studies
Moderating Video-based Online Focus Groups
Moderating/Monitoring Blogs
Other
None
Qualitative Research Tasks Outsourced
RReesseeaarrcchh IInndduussttrryy TTrreennddss 22000088 27
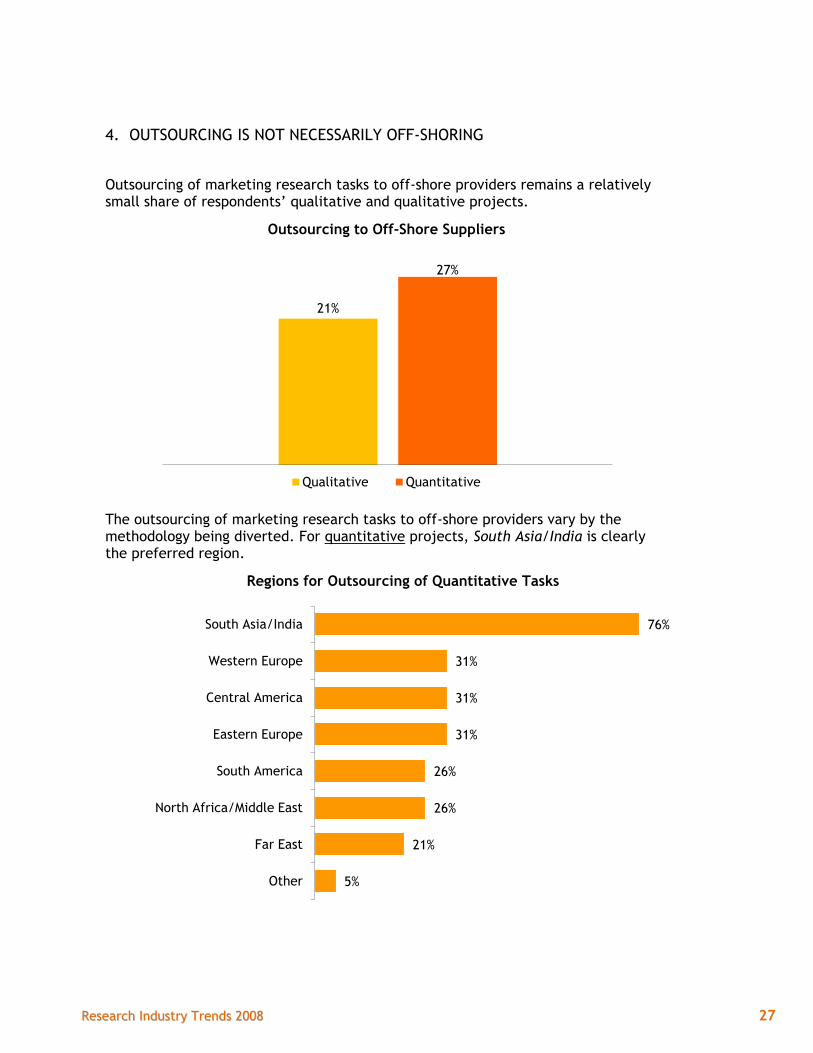
4. OUTSOURCING IS NOT NECESSARILY OFF-SHORING
Outsourcing of marketing research tasks to off-shore providers remains a relatively small share of respondents’ qualitative and qualitative projects.
The outsourcing of marketing research tasks to off-shore providers vary by the methodology being diverted. For quantitative projects, South Asia/India is clearly the preferred region.
21%
27%
1
Outsourcing to Off-Shore Suppliers
Qualitative Quantitative
76%
31%
31%
31%
26%
26%
21%
5%
South Asia/India
Western Europe
Central America
Eastern Europe
South America
North Africa/Middle East
Far East
Other
Regions for Outsourcing of Quantitative Tasks

RReesseeaarrcchh IInndduussttrryy TTrreennddss 22000088 28
Outsourcing of qualitative research tasks is much less concentrated, with Western Europe, South Asia/India, and South America sharing the lead.
56%
56%
56%
48%
36%
36%
32%
Western Europe
South Asia/India
South America
Far East
Eastern Europe
North Africa/Middle East
Central America
Regions for Outsourcing of Qualitative Tasks

RReesseeaarrcchh IInndduussttrryy TTrreennddss 22000088 29
5. INTERNATIONAL
RIT 2008 respondents expect their organizations’ work in the international arena to grow across a number of regions of the globe.
The strongest growth is anticipated in Western Europe, followed closely by South Asia/India and, interestingly, Eastern Europe.
42%
36%
34%
33%
20%
17%
15%
9%
Western Europe
South Asia/India
Eastern Europe
Far East
South America
Central America
North Africa and Middle East
Other
Growth Expectations for Global Regions
RReesseeaarrcchh IInndduussttrryy TTrreennddss 22000088 30
F. MISSION CRITICAL ISSUES
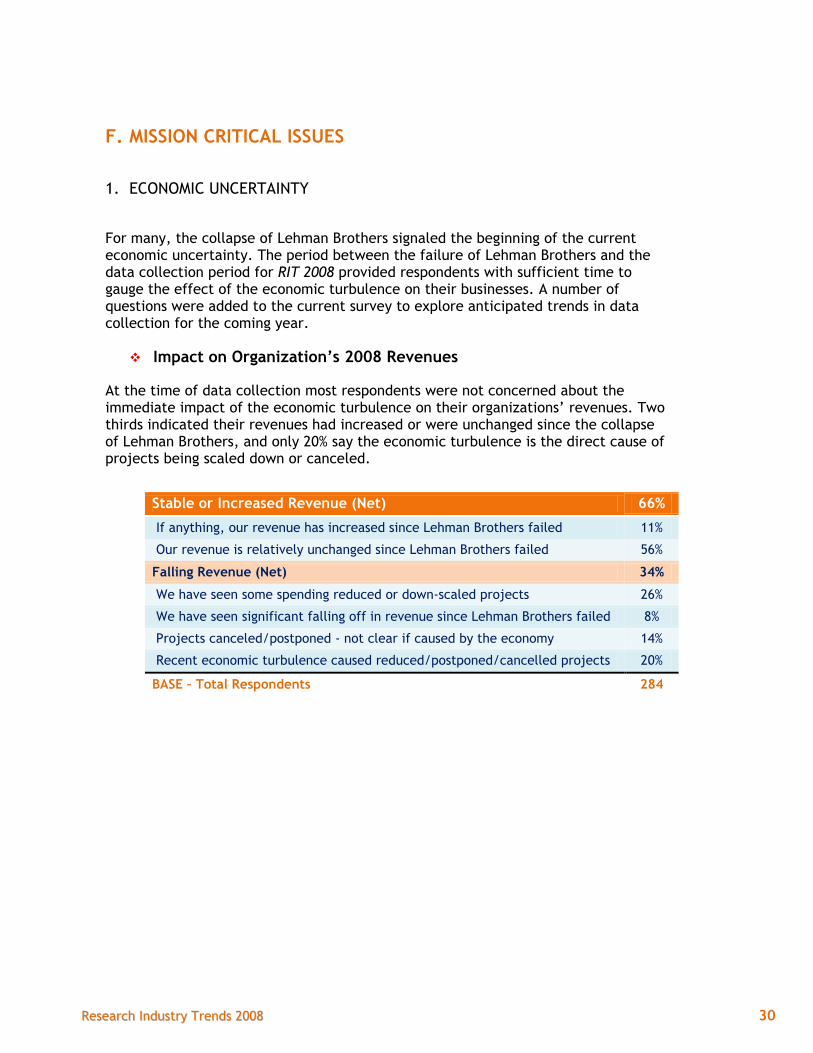
1. ECONOMIC UNCERTAINTY
For many, the collapse of Lehman Brothers signaled the beginning of the current economic uncertainty. The period between the failure of Lehman Brothers and the data collection period for RIT 2008 provided respondents with sufficient time to gauge the effect of the economic turbulence on their businesses. A number of questions were added to the current survey to explore anticipated trends in data collection for the coming year.
Impact on Organization’s 2008 Revenues
At the time of data collection most respondents were not concerned about the immediate impact of the economic turbulence on their organizations’ revenues. Two thirds indicated their revenues had increased or were unchanged since the collapse of Lehman Brothers, and only 20% say the economic turbulence is the direct cause of projects being scaled down or canceled.
Stable or Increased Revenue (Net) 66%
If anything, our revenue has increased since Lehman Brothers failed 11%
Our revenue is relatively unchanged since Lehman Brothers failed 56%
Falling Revenue (Net) 34%
We have seen some spending reduced or down-scaled projects 26%
We have seen significant falling off in revenue since Lehman Brothers failed 8%
Projects canceled/postponed - not clear if caused by the economy 14%
Recent economic turbulence caused reduced/postponed/cancelled projects 20%
BASE – Total Respondents 284

RReesseeaarrcchh IInndduussttrryy TTrreennddss 22000088 31
Projected Impact on Organization’s 2009 Revenues
Only one-in-five respondents indicate the recent economic turbulence will have no negative effects on their organization’s 2009 revenues.
At the same time, only one-in-ten study respondents felt the current economic uncertainty would have a major negative effect on their revenues during 2009.
Projected Effect of Economic Turbulence On 2009 Revenues %
We expect no negative effects of the recent economic turbulence on our revenue in 2009
18%
We expect some negative effects of the recent economic turbulence on our revenue in 2009
72%
We expect major negative effects of the recent economic turbulence on our revenue in 2009
11%
BASE – Total Respondents 284
Projected Impact on Research Industry During 2009
Interestingly, RIT 2008 respondents are nearly evenly divided on their opinions of how the recent economic unpleasantness might affect the research industry as a whole: benefit (28%), little/no effect (36%), and significant negative effect (36%). The proposition that research may be “counter-cyclical” seemed to be operating.
Effect of Economic Turbulence On Research Industry %
We expect that this economic turbulence may actually benefit the research industry as organizations seek to develop new strategies and require new insights
28%
We expect that economic turbulence will have little or no negative impact on the research industry
36%
We expect that economic turbulence will have a significant negative impact on the research industry
36%
BASE – Total Respondents 284
RReesseeaarrcchh IInndduussttrryy TTrreennddss 22000088 32
2. OVERALL CHALLENGES FACING THE INDUSTRY
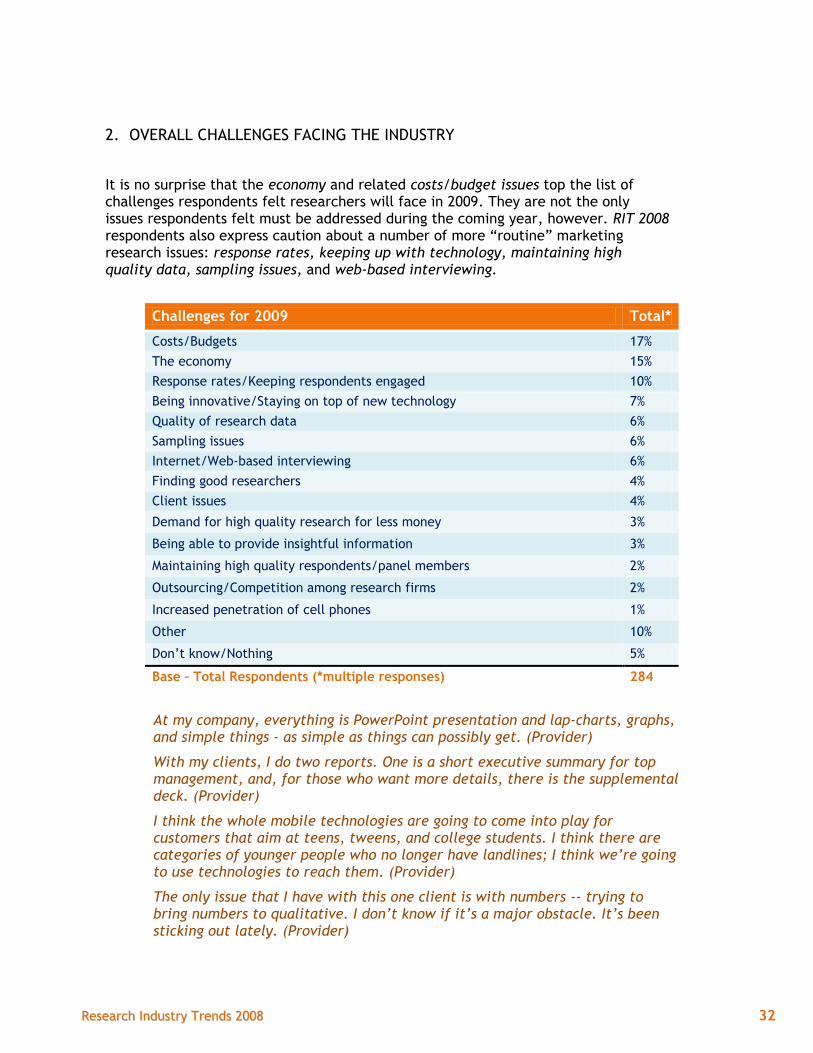
It is no surprise that the economy and related costs/budget issues top the list of challenges respondents felt researchers will face in 2009. They are not the only issues respondents felt must be addressed during the coming year, however. RIT 2008 respondents also express caution about a number of more “routine” marketing research issues: response rates, keeping up with technology, maintaining high quality data, sampling issues, and web-based interviewing.
Challenges for 2009 Total*
Costs/Budgets 17%
The economy 15%
Response rates/Keeping respondents engaged 10%
Being innovative/Staying on top of new technology 7%
Quality of research data 6%
Sampling issues 6%
Internet/Web-based interviewing 6%
Finding good researchers 4%
Client issues 4%
Demand for high quality research for less money 3%
Being able to provide insightful information 3%
Maintaining high quality respondents/panel members 2%
Outsourcing/Competition among research firms 2%
Increased penetration of cell phones 1%
Other 10%
Don’t know/Nothing 5%
Base – Total Respondents (*multiple responses) 284
At my company, everything is PowerPoint presentation and lap-charts, graphs, and simple things - as simple as things can possibly get. (Provider)
With my clients, I do two reports. One is a short executive summary for top management, and, for those who want more details, there is the supplemental deck. (Provider)
I think the whole mobile technologies are going to come into play for customers that aim at teens, tweens, and college students. I think there are categories of younger people who no longer have landlines; I think we’re going to use technologies to reach them. (Provider)
The only issue that I have with this one client is with numbers -- trying to bring numbers to qualitative. I don’t know if it’s a major obstacle. It’s been sticking out lately. (Provider)

RReesseeaarrcchh IInndduussttrryy TTrreennddss 22000088 33
G. USE OF ONLINE ENHANCED LISTINGS OR ADVERTISING
Just under one half of RIT 2008 respondents report past usage of enhanced online listings and/or advertising.
Utilization of online promotional channels will increase in the coming year. Nearly nine-in-ten respondents who use online sources plan to pay for enhanced online listings or advertising in 2008-2009.
Quirks.com and Greenbook.org (New York AMA GreenBook) are mentioned most often as methods of online promotion.
Past Use %
Used Online Sources (Net) 48%
Quirks.com 25%
GreenBook.org (NY AMA GreenBook) 18%
MRA-net.org (Bluebook) 12%
Marketingpower.com (AMA M-Guide) 9%
AAPOR.com 4%
Researchinfo.com 3%
Worldopinion.com 1%
Other 8%
Have Not Used Online sources (Net) 52%
Base – Total Respondents 284
Planned Use 2008-2009 %
Plan On Using Enhanced Listings/Ads (Net) 87%
Quirks.com 23%
GreenBook.org (NY AMA GreenBook) 22%
MRA-net.org (Bluebook) 15%
Marketingpower.com (AMA M-Guide) 11%
AAPOR.com 4%
Researchinfo.com 2%
Worldopinion.com 1%
Other 10%
Do Not Plan On Using Enhanced Listings/Ads (Net) 13%
Base: Used Online Sources 195

RReesseeaarrcchh IInndduussttrryy TTrreennddss 22000088 34
H. RESPONDENT PROFILE
1. TYPE OF COMPANY
2. YEARS OF EXPERIENCE AS A RESEARCHER
Average = 17.7 years
46%
24%
10%
6%
4%
3%
7%
Full service research provider
Research consultant
Enterprise research department
Focus group, CATI, online provider
Academic or NFP research group
Ad or PR research dept.
Othe collection, field and tab
2%8%
18%
19%
19%
14% 1 - 2 years (1.5)
Less than 3 Years
3 - 5 years
6 - 10 years
11 - 15 years
16 - 20 years
21 - 25 years
RReesseeaarrcchh IInndduussttrryy TTrreennddss 22000088 35
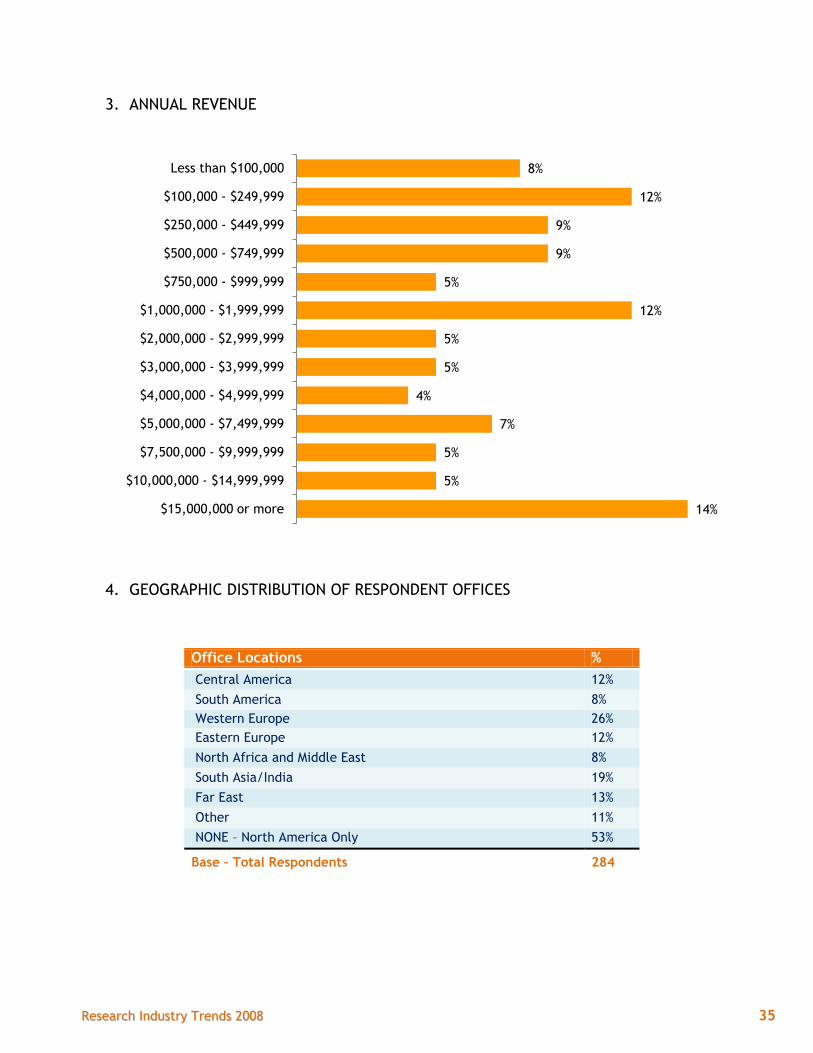
3. ANNUAL REVENUE
4. GEOGRAPHIC DISTRIBUTION OF RESPONDENT OFFICES
Office Locations %
Central America 12%
South America 8%
Western Europe 26%
Eastern Europe 12%
North Africa and Middle East 8%
South Asia/India 19%
Far East 13%
Other 11%
NONE – North America Only 53%
Base – Total Respondents 284
8%
12%
9%
9%
5%
12%
5%
5%
4%
7%
5%
5%
14%
Less than $100,000
$100,000 - $249,999
$250,000 - $449,999
$500,000 - $749,999
$750,000 - $999,999
$1,000,000 - $1,999,999
$2,000,000 - $2,999,999
$3,000,000 - $3,999,999
$4,000,000 - $4,999,999
$5,000,000 - $7,499,999
$7,500,000 - $9,999,999
$10,000,000 - $14,999,999
$15,000,000 or more
RReesseeaarrcchh IInndduussttrryy TTrreennddss 22000088 36
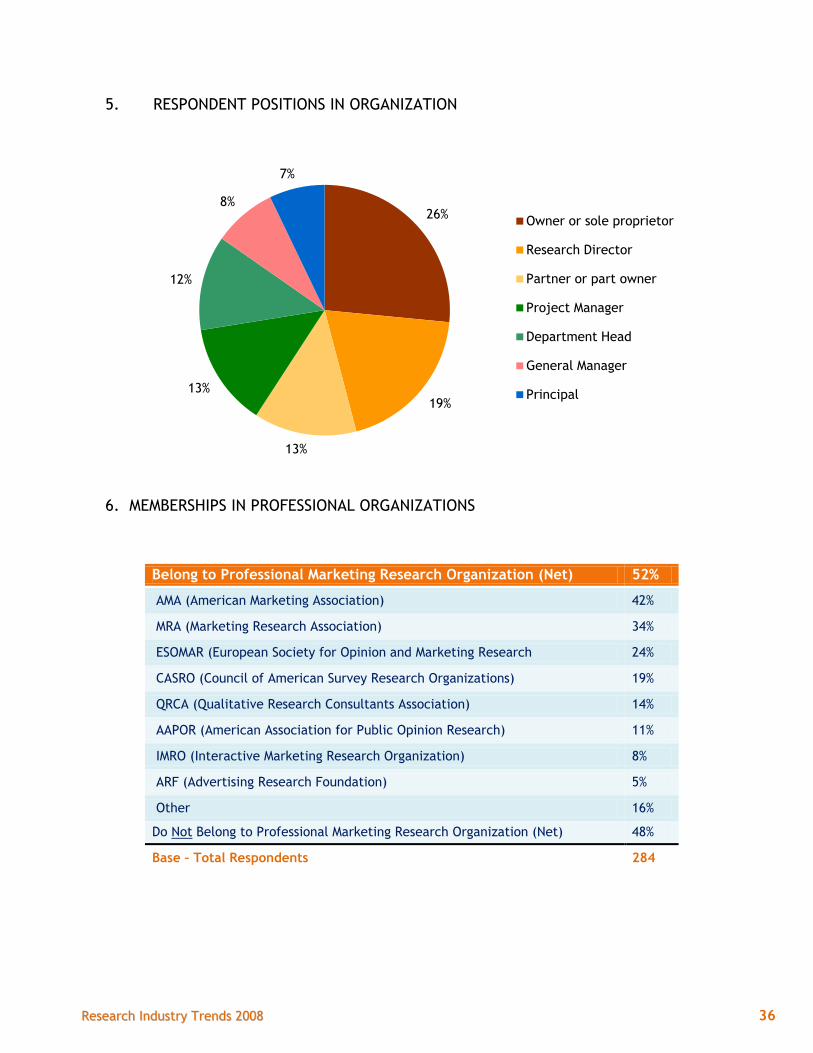
5. RESPONDENT POSITIONS IN ORGANIZATION
6. MEMBERSHIPS IN PROFESSIONAL ORGANIZATIONS
Belong to Professional Marketing Research Organization (Net) 52%
AMA (American Marketing Association) 42%
MRA (Marketing Research Association) 34%
ESOMAR (European Society for Opinion and Marketing Research 24%
CASRO (Council of American Survey Research Organizations) 19%
QRCA (Qualitative Research Consultants Association) 14%
AAPOR (American Association for Public Opinion Research) 11%
IMRO (Interactive Marketing Research Organization) 8%
ARF (Advertising Research Foundation) 5%
Other 16%
Do Not Belong to Professional Marketing Research Organization (Net) 48%
Base – Total Respondents 284
26%
19%
13%
13%
12%
8%
7%
Owner or sole proprietor
Research Director
Partner or part owner
Project Manager
Department Head
General Manager
Principal
Related Documents