BASF 3 rd Quarter 2014 Analyst Conference Call October 24, 2014, 11:00 a.m. (CEST) Ludwigshafen Analyst Conference Call Script (Full Version) Kurt Bock Hans-Ulrich Engel The spoken word applies. Third Quarter 2014 Financial highlights October 24, 2014 BASF with higher sales and earnings despite declining demand

Welcome message from author
This document is posted to help you gain knowledge. Please leave a comment to let me know what you think about it! Share it to your friends and learn new things together.
Transcript

BASF 3rd Quarter 2014 Analyst Conference Call October 24, 2014, 11:00 a.m. (CEST)
Ludwigshafen
Analyst Conference Call Script (Full Version)
Kurt Bock Hans-Ulrich Engel
The spoken word applies.
Third Quarter 2014
Financial highlightsOctober 24, 2014
BASF with higher sales and earnings despite declining demand
Page 2
BASF 3rd Quarter 2014 Analyst Conference Call October 24, 2014
Cautionary note regarding forward-looking statements
This presentation may contain forward-looking statements that are subject to risks and uncertainties, including those pertaining to the anticipated benefits to be realized from the proposals described herein. Forward-looking statements may include, in particular, statements about future events, future financial performance, plans, strategies, expectations, prospects, competitive environment, regulation and supply and demand. BASF has based these forward-looking statements on its views and assumptions with respect to future events and financial performance. Actual financial performance could differ materially from that projected in the forward-looking statements due to the inherent uncertainty of estimates, forecasts and projections, and financial performance may be better or worse than anticipated. Given these uncertainties, readers should not put undue reliance on any forward-looking statements. The information contained in this presentation is subject to change without notice and BASF does not undertake any duty to update the forward-looking statements, and the estimates and assumptions associated with them, except to the extent required by applicable laws and regulations.
2BASF Q3 2014 Analyst Conference Call October 24, 2014
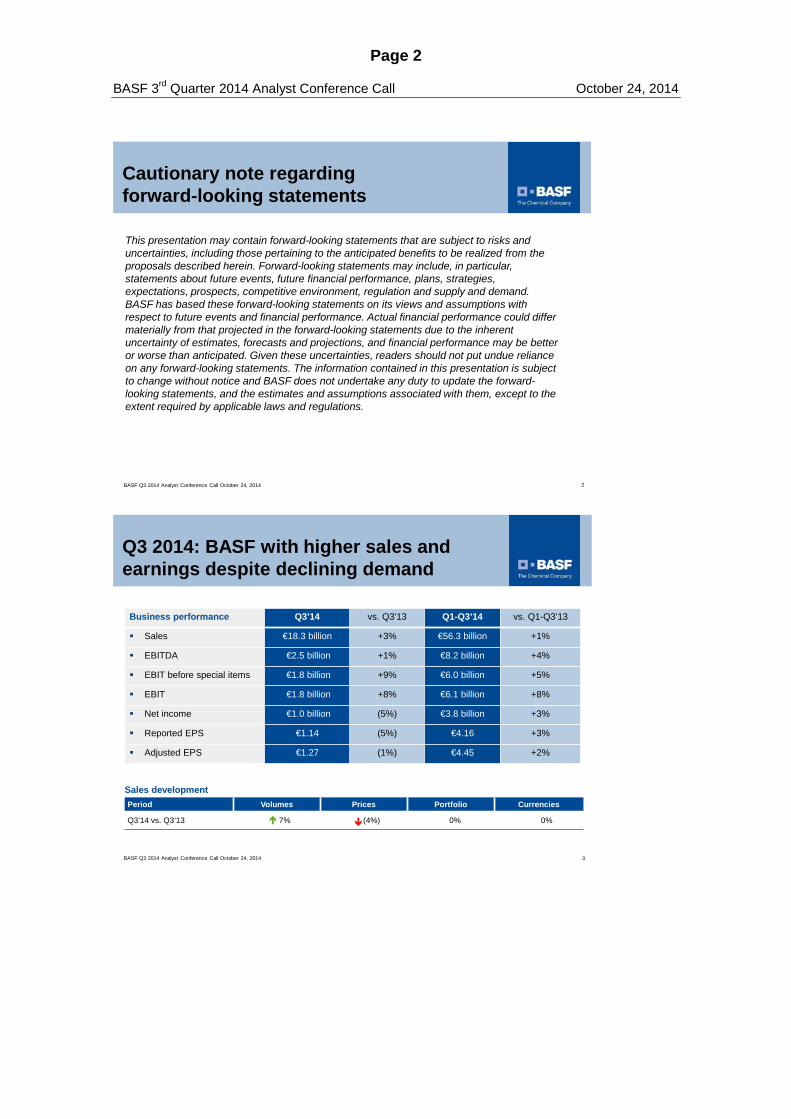
Q3 2014: BASF with higher sales and earnings despite declining demand
Sales developmentPeriod Volumes Prices Portfolio Currencies
Q3’14 vs. Q3’13 7% (4%) 0% 0%
3
Business performance Q3’14 vs. Q3’13 Q1-Q3’14 vs. Q1-Q3’13
Sales €18.3 billion +3% €56.3 billion +1%
EBITDA €2.5 billion +1% €8.2 billion +4%
EBIT before special items €1.8 billion +9% €6.0 billion +5%
EBIT €1.8 billion +8% €6.1 billion +8%
Net income €1.0 billion (5%) €3.8 billion +3%
Reported EPS €1.14 (5%) €4.16 +3%
Adjusted EPS €1.27 (1%) €4.45 +2%
BASF Q3 2014 Analyst Conference Call October 24, 2014

Page 3
BASF 3rd Quarter 2014 Analyst Conference Call October 24, 2014
Kurt Bock
Ladies and Gentlemen, good morning and thank you for joining us.
Today we will present to you our Q3 results, which are solid amidst
a noticeable weakening of markets especially in Europe. We will
also brief you on our preliminary view on 2015. As promised to you
earlier this year we will update you on how we see our strategic
targets in view of the current economic environment. Let’s start with
Q3:
[Chart 3: Q3 2014: BASF with higher sales and earnings despite declining demand]
BASF operated in an increasingly challenging environment in the
third quarter. Geopolitical tensions and an elevated level of
uncertainty surrounding the global macroeconomic development
significantly affected demand in the chemical markets. Especially
in the Euro-zone macro indicators started to turn negative. The
ongoing tensions between Russia and the Ukraine directly
impacted the economy in these two countries and business
sentiment in the region.
In Latin America, Brazil is technically in a recession, after two
consecutive quarters of negative GDP growth. On the positive
side, North American GDP continued to expand somewhat faster
than expected. In China the impact of economic stimuli weakened
and recovery in Japan was modest. The oil price was impacted by
weaker demand as well as dampened growth expectations. On a
Page 4
BASF 3rd Quarter 2014 Analyst Conference Call October 24, 2014
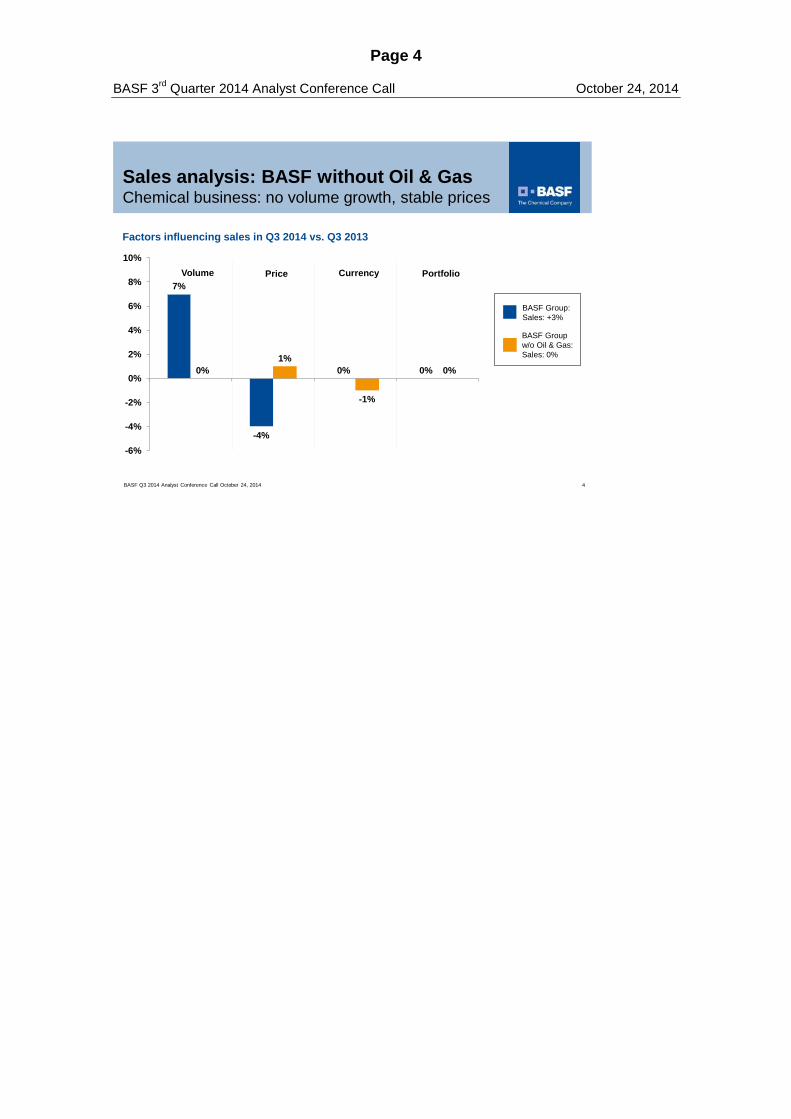
Sales analysis: BASF without Oil & Gas Chemical business: no volume growth, stable prices
7%
-4%
0% 0%0%1%
-1%
0%
-6%
-4%
-2%
0%
2%
4%
6%
8%
10%
Factors influencing sales in Q3 2014 vs. Q3 2013
Price Currency PortfolioVolume
BASF Group: Sales: +3%
BASF Group w/o Oil & Gas:Sales: 0%
BASF Q3 2014 Analyst Conference Call October 24, 2014 4

Page 5
BASF 3rd Quarter 2014 Analyst Conference Call October 24, 2014
euro basis, the average price for Brent crude oil was 8 percent
lower than in Q3 2013.
In Q3, BASF generated sales of 18.3 billion euros, up 3 percent.
Volumes grew by 7 percent driven by higher gas trading volumes.
On a Group level, prices were down 4 percent, but contrary to
previous quarters we experienced no negative currency effects.
To better understand what happened in Q3 we should take a
closer look at our price-volume-currency development (slide 4).
Without Oil & Gas we saw no volume growth globally; in Europe
BASF’s sales even declined by 4 percent. However, we were able
to maintain our prices overall and therefore also margins.
Currency has lost its negative impact, however, did not yet
provide tailwind in Q3.
EBITDA came in 1 percent higher at 2.5 billion euros.
EBIT before special items increased by 9 percent to 1.8 billion
euros, supported by considerably higher earnings in Chemicals
and Oil & Gas. We saw a slight increase in Functional Materials &
Solutions and stable earnings in Performance Products.
Agricultural Solutions reported a strong earnings decrease due to
lower volumes and higher fixed costs.
EBIT before special items in Other improved significantly. The
share price development led to the dissolution of provisions for
our long-term incentive program.
BASF recognized special items in EBIT of minus 32 million euros.
This was partially related to restructuring measures especially in
Performance Products.

Page 6
BASF 3rd Quarter 2014 Analyst Conference Call October 24, 2014
Page 7
BASF 3rd Quarter 2014 Analyst Conference Call October 24, 2014
EBIT amounted to 1.8 billion euros, an increase of 8 percent
versus prior year.
The tax rate was at 28.3 percent compared to 23.1 percent in the
third quarter of 2013. In the prior-year quarter, the tax-rate was
affected by a tax-free one-time gain from the divestment of the 15
percent stake in the Norwegian Edvard Grieg field.
Net income decreased by 5 percent to 1 billion euros.
At 1.27 euros, adjusted earnings per share were at last year’s
level (Q3 2013: 1.28 euros).
In Q3, operating cash flow reached 2.1 billion euros, an increase
of around 170 million euros.
Free cash flow slightly increased to 820 million euros despite
higher capex.

Page 8
BASF 3rd Quarter 2014 Analyst Conference Call October 24, 2014
BASF Q3 2014 Analyst Conference Call October 24, 2014
Recent transaction with Statoil
Acquisition of participations in oil & gas fields in Norway
Purchase price amounts to US$1.25 billion
Increase of production to ~60,000 boepd in Norway
Additional reserves andresources of ~170 millionboe
Restructuring of Performance Products
Strengthening of R&D platforms
Important corporate developments
5
BASF to sell textile chemicals business toArchroma
Paper Chemicals division to be dissolved, product lines moved to other divisions
Strategic options for parts of kaolin business in evaluation
Total earnings improvement of ~€500 million by 2017
Future set up of global research platforms:
- Process Research & Chemical Engineering, led out of Europe
- Bioscience Research, led out of North America (from 2015)
- Advanced Materials & Systems Research, led out of Asia (from 2016)
Page 9
BASF 3rd Quarter 2014 Analyst Conference Call October 24, 2014
[Chart 5: Important corporate developments]
We continue to take measures directed at further improving our
portfolio and strengthening earnings. Let me highlight some of the
most important developments since Q2 reporting.
On September 12, 2014 we announced an agreement with Statoil
of Norway that will strengthen our partnership and enhance
BASF’s earnings and cash flow generation in our core region
Europe. Reserves and resources will rise by approximately 170
million barrels of oil equivalent, and our production in Norway will
increase from currently around 40,000 boe/day to about 60,000
boe/day. The purchase price for the assets amounts to 1.25 billion
US dollars. Closing is expected by the end of 2014, with the
effective date of January 1, 2014.
We continue to restructure our Performance Products segment.
Four weeks ago, we published our plan to dissolve the Paper
Chemicals division. The structural changes in the market for
graphical paper require further adjustments to our positioning: We
aim to enhance value chain synergies by combining the main
product lines with the corresponding operations in our
Performance Chemicals and Dispersions & Pigments divisions.
These changes will be effective from January 1, 2015.
Furthermore, we are evaluating strategic options for parts of our
kaolin business. This adjustment allows to further optimize our
asset base while maintaining our commitment to the paper
industry.
As announced just last week, we have agreed to sell our global
textile chemicals business to Archroma. The parties have agreed

Page 10
BASF 3rd Quarter 2014 Analyst Conference Call October 24, 2014

Page 11
BASF 3rd Quarter 2014 Analyst Conference Call October 24, 2014
not to disclose financial details. Closing is expected to take place
in the first quarter of 2015.
Before we come to the business performance of our segments, let
me briefly inform you about the next step that we will take to
enhance BASF’s innovation power. We are developing the
organization of our research platforms and will bundle
competencies, further globalize research and thereby strengthen
our worldwide R&D Verbund. The new organization will be based
on three global platforms starting January 2015:
Our Process Research & Chemical Engineering will
continue to be headquartered in Ludwigshafen.
Our Biosciences Research will be managed from
Research Triangle Park, North Carolina.
And finally, the headquarters of Advanced Materials &
Systems Research will be moved to our Innovation
Campus Asia Pacific in Shanghai by 2016.
These measures will strengthen our network with research
partners and customers and make BASF’s R&D even more
effective and efficient.
With this I hand it over to Hans.

Page 12
BASF 3rd Quarter 2014 Analyst Conference Call October 24, 2014
ChemicalsEarnings growth despite flat volumes
diates Monomers 1,587
(1%)
Petrochemicals1,913
(1%)
€4,201 (1%)
development Volumes Prices Portfolio Currencies
vs. Q3’13 0% (1%) 0% 0%
6
527 510601 570 616
0
200
400
600
800
Q3 Q4 Q1 Q2 Q3
20142013
Page 13
BASF 3rd Quarter 2014 Analyst Conference Call October 24, 2014
[Chart 6: Chemicals – Earnings growth despite flat volumes]
Sales in the Chemicals segment were on prior-year level, with
overall flat volumes and slightly lower prices. Higher earnings in
Petrochemicals driven by strong profitability in the cracker business
were partly offset by lower results in Monomers, especially in Asia.
EBIT before special items came in considerably higher.
Sales in Petrochemicals reached the level of the prior-year
quarter, on higher prices but lower volumes. Our North American
business benefitted from the expansion of the refitted Port Arthur
cracker. In Europe, the ongoing outage at our Ellba joint venture
with Shell in Moerdijk led to a sales decrease. In acrylics, volumes
remained on a high level globally, but prices were under pressure
especially in Asia Pacific. EBIT before special items came in
considerably higher due to the strong performance of our cracker
products in North America and Europe.
Sales in Monomers also were on prior year’s level. We
experienced higher volumes in MDI and polyamides. Volumes in
polyols were lower due to the outage at Moerdijk. Margins for
caprolactam remained on a low level, while for isocyanates they
came under significant pressure in Asia Pacific. EBIT before
special items decreased considerably.
In Intermediates sales reached the level of the prior-year third
quarter. The seasonal slowdown in most standard products was
more pronounced than usual, but high-margin specialties sold
well. EBIT before special items was up considerably, supported
by fixed cost reductions.

Page 14
BASF 3rd Quarter 2014 Analyst Conference Call October 24, 2014
PerformanceChemicals
847
+3%
hemicals
€3,919 (1%)
hemicals
n h
Dispersions& Pigments
1,003
0%
development Volumes Prices Portfolio Currencies
s. Q3’13 0% 0% 0% (1%)
376
216
427 435376
0
200
400
600
Q3 Q4 Q1 Q2 Q3
7
20142013

Page 15
BASF 3rd Quarter 2014 Analyst Conference Call October 24, 2014
[Chart 7: Performance Products: Sales and earnings stability during restructuring]
In Performance Products sales were almost unchanged. Volumes
and prices were flat but we faced slightly negative currency effects.
EBIT before special items came in on prior-year level, benefitting
from strict fixed cost control. The ongoing restructuring measures
resulted in negative special items of 10 million euros.
Sales in Dispersions & Pigments were stable. In Europe
demand slowed, whereas in Asia Pacific we experienced good
volume growth across most product groups. Total volumes came
in slightly higher and prices were stable. EBIT before special
items increased slightly due to lower fixed costs related to the
successful implementation of our restructuring program.
In Care Chemicals, sales were flat on lower volumes but higher
prices. Especially volumes in hygiene were down due to
aggressive competition and better product availability. In Q3 2013,
the market was tight due to the outage of a competitor’s SAP
plant. Personal care specialties also saw a decrease in demand.
EBIT before special items went slightly down.
Sales in Nutrition & Health came in slightly lower. We saw higher
demand for animal nutrition as well as aroma chemicals, but faced
tough competition in human nutrition and pharma. Prices
remained stable. The market environment for vitamins remained
very competitive. EBIT before special items decreased slightly.
Sales in Paper Chemicals decreased significantly driven by
declining demand in the graphical paper market. Our fixed cost

Page 16
BASF 3rd Quarter 2014 Analyst Conference Call October 24, 2014

Page 17
BASF 3rd Quarter 2014 Analyst Conference Call October 24, 2014
reduction measures helped to maintain EBIT before special items
on prior-year level.
Performance Chemicals sales were up slightly, driven by
significantly higher volumes in most of our businesses. Demand
for fuel & lubricant solutions increased globally. Oilfield & mining
solutions also developed positively. We experienced good
demand for water solutions but competitive pressure remained
high. We faced slightly lower prices and incurred portfolio effects
related to the divestiture of our PolyAd business. EBIT before
special items slightly increased.

Page 18
BASF 3rd Quarter 2014 Analyst Conference Call October 24, 2014
Functional Materials & SolutionsContinued robust demand from automotive
ts
ConstructionChemicals
565
(2%)
Coatings736
+1%
€4,527+2%
development Volumes Prices Portfolio Currencies
s. Q3’13 1% 2% 0% (1%)
mance ls
300238
311356
310
0
200
400
Q3 Q4 Q1 Q2 Q3
8
20142013
Page 19
BASF 3rd Quarter 2014 Analyst Conference Call October 24, 2014
[Chart 8: Functional Materials & Solutions – Continued robust demand from automotive]
In Functional Materials & Solutions, sales were up slightly,
supported by continued robust demand from the automotive
industry. We realized higher volumes and prices, but still faced
negative currency effects in all divisions. EBIT before special items
slightly increased due to higher contributions from Coatings and
Catalysts.
Sales in Catalysts increased significantly on higher volumes and
prices. Volume growth was driven by high demand from mobile
emission and chemical catalysts. Sales from precious metals
trading grew to 685 million euros versus 657 million euros a year
ago. EBIT before special items considerably increased driven by
higher volumes.
In Construction Chemicals sales came in slightly lower, as
higher volumes and prices could only partially compensate the
structural effect related to the divestment of our German wall
systems business in Q4 2013. While we experienced a positive
business development in North America, demand in most
European countries was subdued. Fixed cost reductions from our
efficiency program resulted in a slight improvement of EBIT
before special items.
Sales of our Coatings division were slightly up due to higher
prices. For OEM coatings and refinish coatings we saw good
demand in Europe and North America, robust business in Asia
Pacific and a decline in volumes in South America.

Page 20
BASF 3rd Quarter 2014 Analyst Conference Call October 24, 2014

Page 21
BASF 3rd Quarter 2014 Analyst Conference Call October 24, 2014
Industrial coatings developed very positively due to better
business with coil and wind energy coatings. Sales in decorative
paints slightly decreased, as higher prices could not fully offset
lower volumes. EBIT before special items was up considerably
supported by effective fixed cost control.
Sales in the Performance Materials division were stable with
volumes being flat. Engineering plastics and our specialties such
as Cellasto and Ultrason developed positively due to high
demand from the transportation industry. PU systems, however,
saw lower demand for appliances and construction applications,
especially in Europe. Prices were slightly down. Plant start-ups
and higher R&D expenses led to an increase in fixed costs and
EBIT before special items decreased significantly.

Page 22
BASF 3rd Quarter 2014 Analyst Conference Call October 24, 2014
Agricultural SolutionsStrong earnings decline in seasonally slow quarter
9BASF Q3 2014 Analyst Conference Call October 24, 2014
Q3’14 segment sales (million €) vs. Q3’13
Sales development Period Volumes Prices Portfolio Currencies
Q3’14 vs. Q3’13 (4%) 2% 0% (1%)
0
100
200
Q3 Q30
300
600
900
1,200
Q3 Q3
1,018(3%)
43
(75%)
1721,054
20142013 20142013

Page 23
BASF 3rd Quarter 2014 Analyst Conference Call October 24, 2014
[Chart 9: Agricultural Solutions – Strong earnings decline in seasonally slow quarter]
In Agricultural Solutions we experienced a disappointing business
in this seasonally slow quarter. Excellent crop conditions led to good
harvests for key crops globally, strongly pushing down crop
commodity prices. Our sales decreased by 3 percent versus the
very strong prior-year quarter, mainly due to lower volumes in North
America and Europe. Nevertheless, we were able to increase prices
in all regions.
Business in Europe declined considerably. Lower prices for
oilseed rape led to reduced acreage and consequently demand
for oilseed herbicides declined.
In North America sales dropped significantly, as excellent crop
conditions and low commodity prices adversely impacted demand
especially for our yield-boosting Plant Health products.
Sales in South America were slightly up, supported by higher
volumes and prices. Our recent launches Kixor® and Xemium®
developed well, while there was tough competition in insecticides.
In Asia Pacific sales slightly increased, thanks to higher prices
across the region.
EBIT before special items in Q3 2014 fell considerably on lower
volumes, a less favorable product mix and higher fixed costs. For
the remainder of the year we see business momentum building up in
South America and we currently experience no significant negative
exchange rate impact on earnings. Market response to our
Xemium®-based fungicide solutions is positive. With our positioning

Page 24
BASF 3rd Quarter 2014 Analyst Conference Call October 24, 2014

Page 25
BASF 3rd Quarter 2014 Analyst Conference Call October 24, 2014
and strong product pipeline we are optimistic that we are able
to continue our success story in Agricultural Solutions.
Page 26
BASF 3rd Quarter 2014 Analyst Conference Call October 24, 2014
62
451*
194
265
0
100
200
300
400
500
Q3/2013 Net Income Q3/2014 Net Income
Exploration &Production
611
(19%)
Gas
€3,670+17%
Natural Gas Trading
Exploration & Production
Net income
development Volumes Prices/Currencies Portfolio
s. Q3’13 43% (26%) 0%
422
360
310
504
10
4 Analyst Conference Call October 24, 2014
* Incl. one-time disposal gain of 164 million euros from the divestment of a 15% stake in Edvard Grieg field

Page 27
BASF 3rd Quarter 2014 Analyst Conference Call October 24, 2014
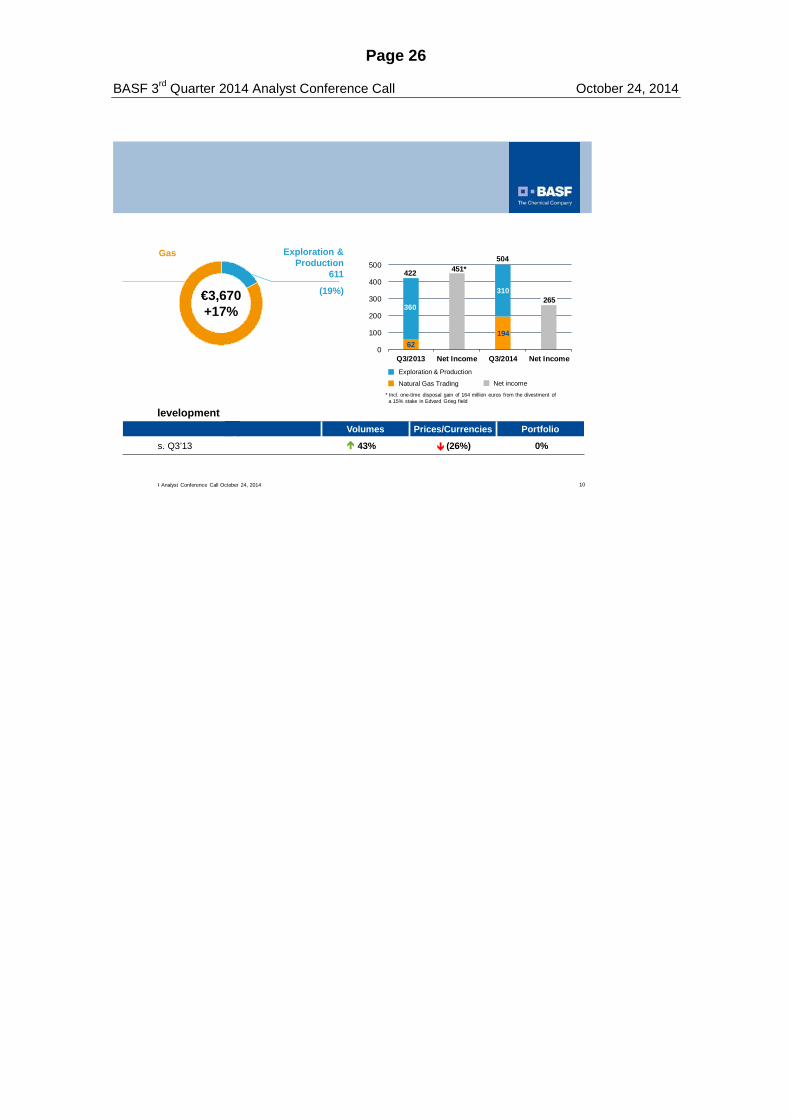
[Chart 10: Oil & Gas – Considerably higher sales and earnings]
In the Oil & Gas segment, sales grew considerably. This was driven
by higher volumes in Natural Gas Trading. EBIT before special
items significantly exceeded prior-year results attributable to higher
contributions from Natural Gas Trading. Net income came in at 265
million euros, a decrease of 186 million euros. In Q3 2013, we had
recognized a disposal gain of 164 million euros from the divestment
of a 15 percent stake in the Edvard Grieg field in the North Sea.
Sales in Exploration & Production decreased considerably due
to lower volumes as well as lower oil and gas prices. The average
price for Brent crude oil decreased by 8 percent to 102 US$ per
barrel. In euro terms it was also 8 percent lower. Volume was
about 10 percent lower. EBIT before special items declined by 14
percent to 310 million euros on lower volumes and prices.
Contrary to prior year we did not have an offshore lifting in Libya.
These missing contributions could not be compensated by higher
earnings in Norway.
Sales in the Natural Gas Trading business grew considerably
due to higher volumes especially on the European spot markets.
EBIT before special items recovered strongly after a relatively
weak first half 2014.

Page 28
BASF 3rd Quarter 2014 Analyst Conference Call October 24, 2014
Review of “Other”
Million € Q3’14 Q3’13Sales 977 947EBIT before special items (7) (105)Thereof Corporate research
Group corporate costsCurrency result, hedges and othervaluation effectsOther business
(96)(53)100
23
(90)(57)(74)
59
Special items (20) (24)
EBIT (27) (129)
11BASF Q3 2014 Analyst Conference Call October 24, 2014

Page 29
BASF 3rd Quarter 2014 Analyst Conference Call October 24, 2014
[Chart 11: Review of „Other“]
EBIT before special items in Other improved strongly from minus
105 million euros to minus 7 million euros, driven by a better
currency result and the recent share price development which led to
the dissolution of provisions for our long-term incentive program.

Page 30
BASF 3rd Quarter 2014 Analyst Conference Call October 24, 2014
Cash Flow Solid cash flow in Q1-Q3 2014
Million € Q1-Q3’14 Q1-Q3’13Cash provided by operating activities 4,765 5,982Thereof Changes in net working capital
Miscellaneous items(739)(425)
374(327)
Cash provided by investing activities (3,625) (4,629)thereof Payments related to tangible / intangible assets (3,426) (3,038)
Acquisitions / divestitures 355 (1,093)Cash used in financing activities (995) (1,300)thereof Changes in financial liabilities
Dividends 1,661
(2,656)1,304
(2,604)
12BASF Q3 2014 Analyst Conference Call October 24, 2014

Page 31
BASF 3rd Quarter 2014 Analyst Conference Call October 24, 2014
[Chart 12: Solid cash flow in Q1-Q3 2014 ] Let me turn to our cash flow. Please be reminded, that we will
summarize the first nine months of 2014.
At 4.8 billion euros cash provided by operating activities was
down by 1.2 billion euros. This was due to a cash outflow in net
working capital of 0.7 billion euros related to the reduction of trade
accounts payable as well as a planned build-up in inventories to
prepare for maintenance shutdowns.
Cash used in investing activities declined by 1 billion euros to 3.6
billion euros. While capex increased by 0.4 billion euros to 3.4
billion euros, cash payments for acquisitions decreased
considerably. In the same period of 2013, we had incurred cash
outflows of 1.1 billion euros for the acquisition of assets from
Statoil as well as the acquisition of Pronova BioPharma.
Free cash flow amounted to 1.3 billion euros in Q1-Q3 2014.
On a sequential basis we recognized a positive trend in cash flow:
While in H1 2014 free cash flow amounted to about 0.5 billion
euros, we generated 820 million euros of free cash flow in Q3
alone.
Coming back to the first nine months of 2014, financing activities
led to a cash outflow of 995 million euros, compared with an
outflow of 1.3 billion euros in the first three quarters of 2013. The
cash inflow resulting from the change in financial liabilities
amounted to 1.7 billion euros. This was mainly attributable to
BASF issuing several bonds with a principal amount of around 1.6
billion euros as well as taking out bank loans. The repayment of a

Page 32
BASF 3rd Quarter 2014 Analyst Conference Call October 24, 2014

Page 33
BASF 3rd Quarter 2014 Analyst Conference Call October 24, 2014
bond with a principal amount of 1.25 billion euros had a
counterbalancing effect.
Net debt amounted to 13.9 billion euros, representing an increase
of 1.3 billion euros in comparison to prior year. At 39 percent, our
equity ratio remained at a healthy level.
Kurt, now back to you for the outlook.

Page 34
BASF 3rd Quarter 2014 Analyst Conference Call October 24, 2014
We aim to increase our sales volumes excluding the effects of acquisitions and divestitures.
Nonetheless, sales will decline slightly compared with 2013 due to the divestiture of the gas trading and storage business planned for autumn 2014 and negative currency effects.
Despite the challenging environment, we strive for a slight increase in EBIT before special items.
Outlook 2014
GDP: 2.3% (previous: 2.5%)
Industrial production: 3.4% (previous: 3.7%)
Chemical production: 4.0% (previous: 4.4%)
US$ / Euro: 1.35 (previous: 1.35)
Oil price (US$ / bbl): 105 (previous: 110)
Assumptions 2014
Outlook 2014
13BASF Q3 2014 Analyst Conference Call October 24, 2014
Page 35
BASF 3rd Quarter 2014 Analyst Conference Call October 24, 2014
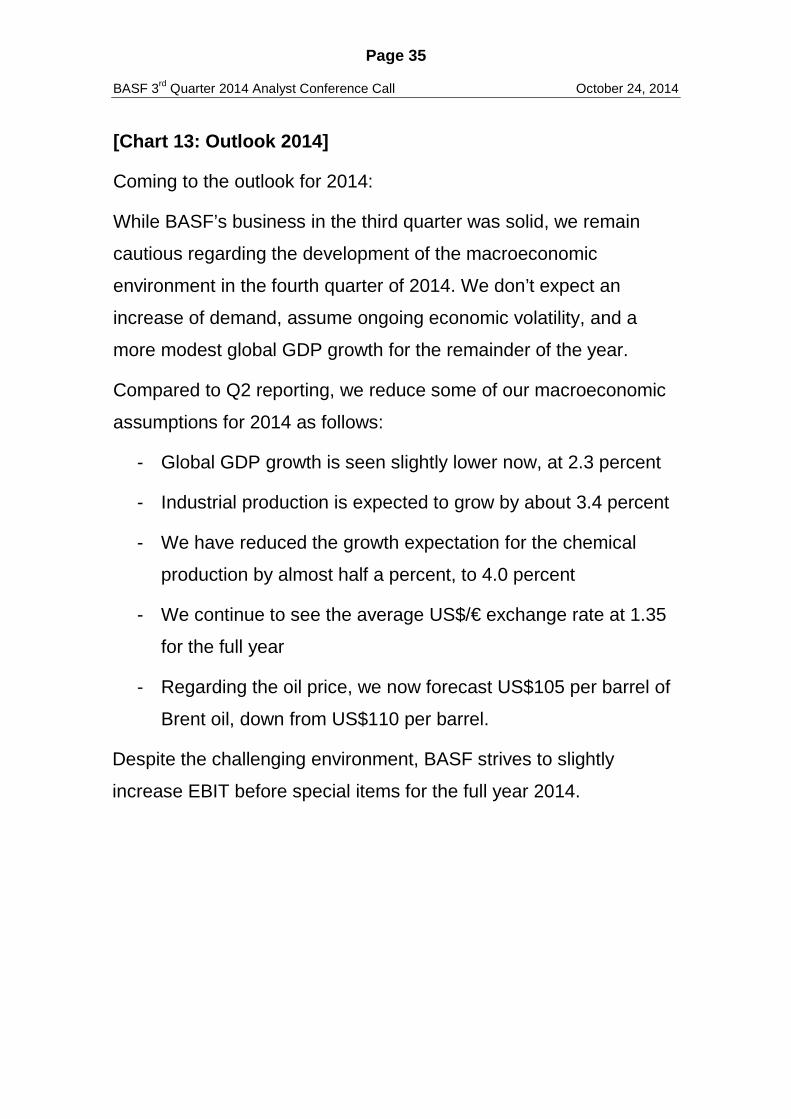
[Chart 13: Outlook 2014]
Coming to the outlook for 2014:
While BASF’s business in the third quarter was solid, we remain
cautious regarding the development of the macroeconomic
environment in the fourth quarter of 2014. We don’t expect an
increase of demand, assume ongoing economic volatility, and a
more modest global GDP growth for the remainder of the year.
Compared to Q2 reporting, we reduce some of our macroeconomic
assumptions for 2014 as follows:
- Global GDP growth is seen slightly lower now, at 2.3 percent
- Industrial production is expected to grow by about 3.4 percent
- We have reduced the growth expectation for the chemical
production by almost half a percent, to 4.0 percent
- We continue to see the average US$/€ exchange rate at 1.35
for the full year
- Regarding the oil price, we now forecast US$105 per barrel of
Brent oil, down from US$110 per barrel.
Despite the challenging environment, BASF strives to slightly
increase EBIT before special items for the full year 2014.

Page 36
BASF 3rd Quarter 2014 Analyst Conference Call October 24, 2014
Update on key assumptions of the “We create chemistry” strategy
Growth 2010 – 2015(today‘s view)
Global GDP 2.6% p.a.
Chemical production
(excl. pharma)4.0% p.a.
Industrial production 3.4% p.a.
Growth 2010 – 2015(‘We create chemistry’ *)
3.4% p.a.
4.9% p.a.
4.6% p.a.
* Rebased figures, new base year 2010
BASF Q3 2014 Analyst Conference Call October 24, 2014 14

Page 37
BASF 3rd Quarter 2014 Analyst Conference Call October 24, 2014
[Chart 14: Update on key assumptions of the ‘We create chemistry’ strategy]
Now I would like to update you on our “We create chemistry”-
strategy and the respective financial targets, which we published in
2011.
Our strategy is based on long-term trends – growth of emerging
markets and certain customer industries, the growing relevance of
innovation, shifts in feedstock costs and industry dynamics – to
name just a few. We increased our investments in selected growth
markets, intensified and globalized R&D, accelerated the pruning of
our portfolio and sharpened the meaning of sustainability for BASF.
We also laid out our operational excellence program STEP, which
aims to achieve savings of 1 billion euros by the end of 2015.
And we announced specific financial targets for 2015 and 2020 in
terms of sales and earnings. We felt this to be necessary, also to
allow you to hold us accountable.
Today, well before starting the year 2015, we want to update you
where we stand.
With regard to our strategy, we are pretty much on track. The
decision to further globalize our R&D platforms mentioned earlier is
just one example of a series of initiatives and changes. Our portfolio
optimization is ongoing, resulting in more than 20 divestitures since
2011, which we balance with selected smaller acquisitions, many of
them technology-driven.
Our operational excellence program STEP is ahead of schedule. By
the end of 2015, we will most likely achieve improvements of 1.3
billion euros, 300 million euros more than planned.

Page 38
BASF 3rd Quarter 2014 Analyst Conference Call October 24, 2014

Page 39
BASF 3rd Quarter 2014 Analyst Conference Call October 24, 2014
And yet, it looks like we will achieve not all of our ambitious financial
targets by 2015. We worked very hard to reach them. However,
early this year we told you that hitting these targets would require an
economic recovery in major markets, especially in Europe, and a
margin improvement for some of our major basic products. It is
pretty obvious that this has not happened; we have seen a further
weakening.
Comparing the previously expected GDP, industry and chemical
production growth rates 2010 to 2015 with what we see today
underlines this growing gap.
The average annual growth of global GDP we now see about 0.8
percentage points lower than expected. Even more importantly, we
now assume growth of chemical production to be 4 percent instead
of 4.9 percent per year. This is still well above GDP and industrial
production. We all know the reasons for this development: Reduced
growth dynamics of emerging markets and a delayed recovery in
Europe.
Aside from lower demand growth which has adversely impacted our
business, we have experienced margin pressure in some of our
major product lines especially in China. To give you just one
example: The margin of caprolactam in Asia today is more than 50
percent lower than in 2011. We did not project such peak margins
into the future. However, the current margin squeeze is beyond of
what we had anticipated.
In Performance Products we have seen a typical commoditization in
selected product lines. This is why we initiated an additional
restructuring program, which will deliver about 500 million euros to
earnings from 2017 onwards.

Page 40
BASF 3rd Quarter 2014 Analyst Conference Call October 24, 2014
BASF Q3 2014 Analyst Conference Call October 24, 2014
EBITDA / EBITDA impact (billion €)
10
11
12
13
14
15
EBITDA target2015
Lower marketgrowth
Lowermargins
Divestituregas tradingand storage
Additionalcontribution
STEP
Positive FXeffects
2015 EBITDA(E)
Consensus
average
Lower market growth and lower margins adversely impact 2015 EBITDA expectation
15
Page 41
BASF 3rd Quarter 2014 Analyst Conference Call October 24, 2014
[Chart 15: Lower market growth and lower margins adversely impact 2015 EBITDA expectation]
We have summarized these effects in one slide. Lower market
growth and lower margins cost us more than 1 billion euros of
EBITDA each.
The planned divestiture of our gas trading and storage business
was not considered in 2011 and will lower sales by approximately
12 billion euros and EBITDA by 500 million euros.
STEP will generate additional earnings of 300 million euros. The
other positive factor, amounting to around 400 million euros, is the
exchange rate since we expected a weaker US dollar than we
currently see.
Most probably we will also see slightly lower growth going forward
and we do not expect an immediate cyclical recovery. We now
expect 2015 sales and EBITDA to be in line with current financial
market expectations. Analysts currently foresee 2015 EBITDA
between 10 billion euros and 12 billion euros. Clearly, we aim to
achieve the upper range. However, we will – as usual – provide you
with the outlook for 2015 at our annual analyst and investor
conference on February 27, 2015. That day we will also discuss our
updated long-term targets.
Be assured that we will remain committed to growing our business
profitably and further improving earnings resilience in the coming
years.
We are now happy to take your questions.
Related Documents