CARBON FOOTPRINT FOR HMA AND PCC PAVEMENTS PREPARED FOR MICHIGAN DEPARTMENT OF TRANSPORTATION OFFICE OF RESEARCH & BEST PRACTICES MURRAY D. VAN WAGONER BUILDING LANSING MI 48909 PREPARED BY PRINCIPLE INVESTIGATOR: AMLAN MUKHERJEE 1,2 , PHD GRADUATE RESEARCH ASSISTANT: DARRELL CASS 1 , MS, EIT MICHIGAN TECHNOLOGICAL UNIVERSITY 1 CIVIL AND ENVIRONMENTAL ENGINEERING DEPARTMENT 2 MICHIGAN TECH TRANSPORTATION INSTITUTE 1400 TOWNSEND DRIVE HOUGHTON, MI 49931 SUBMITTED: MAY 2011

Welcome message from author
This document is posted to help you gain knowledge. Please leave a comment to let me know what you think about it! Share it to your friends and learn new things together.
Transcript

CARBON FOOTPRINT FOR HMA AND PCC PAVEMENTS
PREPARED FOR
MICHIGAN DEPARTMENT OF TRANSPORTATION OFFICE OF RESEARCH & BEST PRACTICES
MURRAY D. VAN WAGONER BUILDING LANSING MI 48909
PREPARED BY PRINCIPLE INVESTIGATOR: AMLAN MUKHERJEE1,2, PHD
GRADUATE RESEARCH ASSISTANT: DARRELL CASS1, MS, EIT
MICHIGAN TECHNOLOGICAL UNIVERSITY 1CIVIL AND ENVIRONMENTAL ENGINEERING DEPARTMENT
2MICHIGAN TECH TRANSPORTATION INSTITUTE
1400 TOWNSEND DRIVE HOUGHTON, MI 49931
SUBMITTED: MAY 2011

RESEARCH TEAM PRINCIPLE INVESTIGATOR: AMLAN MUKHERJEE*, PHD CO-INVESTIGATORS: KRIS G. MATTILA, PHD, PE TIM COLLING, PHD PE
GRADUATE RESEARCH ASSISTANT: DARRELL CASS, MS, EIT
UNDERGRADUATE ASSISTANTS: BRIAN STAWOWY KEKOA KAAIKALA ANTON IMHOFF BRAD ANDERSON ALISHA WIDDIS
INFORMATION TECHNOLOGY SUPPORT: NICK KOSZYKOWSKI. JAMES VANNA
*CORRESPONDING INVESTIGATOR: MICHIGAN TECH 1400 TOWNSEND DR.
HOUGHTOM, MI 49931 EMAIL: [email protected] PHONE: (906) 487-1952

Technical Report Documentation Page 1. Report No.
RC-1553
2. Government Accession No.
3. MDOT Project Manager
C. Bleech
5. Report Date
July 25, 2011
4. Title and Subtitle
Carbon Footprint for HMA and PCC Pavements
6. Performing Organization Code
7. Author(s)
Amlan Mukherjee, Darrell Cass
8. Performing Org. Report No.
10. Work Unit No. (TRAIS)
11. Contract No.
2006-0414
9. Performing Organization Name and Address
Michigan Tech Transportation Institute
1400 Townsend Dr.
Houghton, MI 49931
11(a). Authorization No.
Z22 13. Type of Report & Period Covered
Final 12. Sponsoring Agency Name and Address
Michigan Department of Transportation
P.O. Box 30049
Lansing, MI 48909 14. Sponsoring Agency Code
15. Supplementary Notes
16. Abstract
Motivated by the need to address challenges of global climate change, this study develops and implements a project based life cycle framework that can be used to estimate the carbon footprint for typical construction work-items found in reconstruction, rehabilitation and Capital Preventive Maintenance (CPM) projects. The framework builds on existing life cycle assessment methods and inventories. The proposed framework considers the life cycle emissions of products and processes involved in the raw material acquisition and manufacturing phase, and the pavement construction phase. It also accounts for emissions due to vehicular use and maintenance operations during the service life of the pavements. The framework also develops and implements a method to calculate project level construction emission metrics. Finally, the research provides a web-based tool, the Project Emission Estimator (PE-2) that can be used to benchmark the CO2 footprint of highway construction projects. In conclusion, the research suggests ways of implementing the proposed framework within MDOT to help reduce the CO2 footprint of highway construction projects.
17. Key Words
carbon footprint, GHG, emission calculator, LCA, decision-making, construction, project inventory, use phase, material emissions
18. Distribution Statement
No restrictions. This document is available to the public through the Michigan Department of Transportation.
19. Security Classification - report
20. Security Classification - page
21. No. of Pages
79 + 2 Appendices (9 and 4 pages respectively)
22. Price


i
Table of Contents List of Figures ............................................................................................................................ iii
List of Tables ............................................................................................................................. iv
Acknowledgements..................................................................................................................... v
1. Executive Summary ................................................................................................................. 1
2. Introduction.............................................................................................................................. 2
2.1. Goal and Objectives.......................................................................................................... 2
2.2. Significance....................................................................................................................... 4
2.3. Deliverables ...................................................................................................................... 5
3. Background Literature Review................................................................................................ 7
3.1. Life Cycle Assessment (LCA) .......................................................................................... 7
3.2. Pavement LCA.................................................................................................................. 8
3.3. Available Tools............................................................................................................... 10
3.3.1. Governmental Tools................................................................................................. 11
3.3.2. Academic Tools ....................................................................................................... 12
3.3.3. Industry Tools .......................................................................................................... 15
3.4. Assessment of Tools ....................................................................................................... 17
4. Project Based LCA Framework ............................................................................................. 18
4.1. System Definition ........................................................................................................... 18
4.2. Hybrid LCA Methodology.............................................................................................. 20
4.3. Inventory Development: Data Collection Methodology................................................. 23
4.3.1. Product Data............................................................................................................. 24
4.3.2. Process Data............................................................................................................. 25
4.3.3. Service Data ............................................................................................................. 27
4.4. GHG Calculation Using Project Based LCA Methodology ........................................... 29

ii
4.4.1. Product Component GHG Emissions ...................................................................... 29
4.4.2. Process Component GHG Emissions....................................................................... 30
4.4.3. Service Component GHG Emissions....................................................................... 35
4.5. Functional Units and Metrics.......................................................................................... 40
4.5.1. Average CO2 Equivalents per 100 MT of Concretic and Asphaltic Materials ........ 42
4.5.2. CO2 Equivalent Emissions of On-Road Vehicular Traffic ...................................... 45
4.5.3. Life Cycle CO2 Equivalent Emissions..................................................................... 45
5. Framework Implementation................................................................................................... 48
5.1. Project Emissions Estimator (PE-2)................................................................................ 50
5.2. Inventory Assessment ..................................................................................................... 55
5.2.1. Product Emissions.................................................................................................... 55
5.2.2. Process Emissions.................................................................................................... 59
5.2.3. Process Emissions Case Study................................................................................. 61
5.2.4. Service Emissions .................................................................................................... 68
5.3. Project Life Cycle Emission Estimation ......................................................................... 70
6. Recommendations.................................................................................................................. 75
6.1. Data Reporting and Organization ................................................................................... 75
6.2. Estimation and Benchmarking........................................................................................ 76
6.3. Future Research Directions............................................................................................. 77
7. Appendix A: MDOT Pavement LCA Checklist .................................................................... 80
7. Appendix B: Emission Factors .............................................................................................. 89
8. References.............................................................................................................................. 93

iii
List of Figures
Figure 1-1: Conceptual Solution to Problem Statement ................................................................. 1
Figure 4-1: Concrete Panel Design ............................................................................................... 46
Figure 4-2: HMA Panel Design .................................................................................................... 47
Figure 5-1: PE-2 Homepage ......................................................................................................... 52
Figure 5-2: Project Inventory Report............................................................................................ 53
Figure 5-3: Material Impact Estimator ......................................................................................... 54
Figure 5-4: Equipment Impact Estimator ..................................................................................... 54
Figure 5-5: Life Cycle Impact Estimator ...................................................................................... 54
Figure 5-6: 1/Masp (y-axis) vs. Easp (x-axis) for R1 and R2 projects ............................................ 57
Figure 5-7: 1/Mconc (y-axis) vs. Econc (x-axis) for R1 and R2 projects.......................................... 57
Figure 5-8: 1/Masp (y-axis) vs. Easp (x-axis) for M1 and M2 projects........................................... 58
Figure 5-9: 1/Mconc (y-axis) vs. Econc (x-axis) for M1 and M2 projects ........................................ 58
Figure 5-10: As-Planned vs. As-Built Schedule ........................................................................... 62
Figure 5-11: Pavement Removal Emissions ................................................................................. 65
Figure 5-12: Grade Subbase Emissions ........................................................................................ 65
Figure 5-13: Install Drainage Emissions....................................................................................... 66
Figure 5-14: Place Base Material Emissions ................................................................................ 66
Figure 5-15: Pave Mainline Emissions ......................................................................................... 67
Figure 5-16: Conceptual Illustration of Pavement Life Cycle...................................................... 71
Figure 5-17: Life Cycle Emissions ............................................................................................... 74

iv
List of Tables
Table 3-1: Survey of GHG Impact Assessment Tools.................................................................. 11
Table 4-1: Advantages and Disadvantages of IO and Process-based LCA Models[37] .............. 21
Table 4-2: Source Type Fraction Methodology............................................................................ 37
Table 4-3: Driving Schedule Table............................................................................................... 39
Table 4-4: Link Table ................................................................................................................... 40
Table 4-5: Concrete Unit Weight Mix Design.............................................................................. 43
Table 4-6: HMA Unit Weight Mix Design................................................................................... 44
Table 4-7: Concrete Panel Mix Design......................................................................................... 44
Table 4-8: HMA Panel Mix Design.............................................................................................. 44
Table 5-1: Total Emissions in MT of CO2 Equivalents................................................................ 56
Table 5-2: Emission Regression Models, (metrics expressed in MT of CO2 emissions/100 MT of
material weight.............................................................................................................................. 59
Table 5-3: Quantity Comparison .................................................................................................. 63
Table 5-4: Controlling Item Emissions......................................................................................... 64
Table 5-5: Controlling Equipment Emissions............................................................................... 64
Table 5-6: Regional Performance and Maintenance..................................................................... 70
Table 5-7: Life Cycle Emissions................................................................................................... 73
Table 7-1: Design Life based on Pavement Fix [53] .................................................................... 81
Table 7-1: Emission Factors ......................................................................................................... 89

v
Acknowledgements
The research team at Michigan Technological University would like to acknowledge the
Michigan Department of Transportation for their support in conducting this research. The
authors would also like to acknowledge the faculty and staff of the University Transportation
Center (UTC) for Materials in Sustainable Transportation Infrastructure (UTC-MiSTI) at
Michigan Tech for their support. The UTC program is administered by the U.S. Department of
Transportation’s Research and Innovative Technology Administration (RITA). The views
presented in this report are those of the authors and not necessarily of RITA or the U.S.
Department of Transportation.
The research team would also like to thank the willing and voluntary contributions made by all
the contractors, project managers and MDOT inspectors during the on-site data collection
component of this research. Their support was crucial to the successful completion of this
project. Finally, the research team would also like to thank the Sustainable Futures Institute (SFI)
at Michigan Tech for their direction and invaluable support in this research.
Disclaimer
This publication is based upon work supported by the Michigan Department of Transportation
(MDOT) under Contract No. 2006-0414-Z22. Any opinions, findings and conclusions or
recommendations expressed in this material are those of the authors and do not necessarily
reflect views of MDOT. This publication is disseminated in the interest of information exchange.
MDOT expressly disclaims any liability, of any kind, or for any reason, that might otherwise
arise out of any use of this publication or the information or data provided in the publication.
MDOT further disclaims any responsibility for typographical errors or accuracy of the
information provided or contained within this information. MDOT makes no warranties or
representations whatsoever regarding the quality, content, completeness, suitability, adequacy,
sequence, accuracy or timeliness of the information and data provided, or that the contents
represent standards, specifications, or regulations.

vi

1
1. EXECUTIVE SUMMARY
Motivated by the need to address challenges of global climate change, this study develops and
implements a project based life cycle framework that can be used to estimate the carbon footprint
for typical construction work items found in reconstruction, rehabilitation and Capital Preventive
Maintenance (CPM) projects. The framework applies existing life cycle assessment methods and
inventories using data collected from 14 highway construction, rehabilitation and maintenance
projects in the State of Michigan. Figure 1-1 conceptualizes the solution to the problem
statement setting the scope of this report. The carbon footprint for each of the projects was
calculated in terms of CO2 equivalents
of greenhouse gas (GHG) emissions.
The primary emissions include life
cycle emissions of products and
processes involved in the raw material
acquisition and manufacturing phase,
and the pavement construction phase.
The secondary emissions include
emissions due to vehicular use and
maintenance operations during the
service life of the pavements. The
vehicular use emissions were estimated
using the MOVES simulator, and
pavement maintenance schedules were estimated using sample pavement performance data. A
method to calculate project level construction emission metrics was developed and illustrated
using the observed projects. Finally, a web based tool, the Project Emission Estimator (PE-2),
was developed based on the emissions calculated from the observed project. It includes an
emission estimator tool that can be used to benchmark GHG life cycle emissions for highway
reconstruction, rehabilitation and preventive maintenance projects. In conclusion, the research
suggests ways of implementing the proposed framework within MDOT to help reduce the CO2
footprint of highway construction projects.
Figure 1-1: Conceptual Solution to Problem Statement

2
2. INTRODUCTION
The challenge of global climate change has motivated state transportation agencies involved in
the construction and maintenance of transportation infrastructure to investigate strategies that
reduce the life cycle greenhouse gas (GHG) emissions associated with the construction and
rehabilitation of highway infrastructure [1]. In this study, we propose to measure the greenhouse
gas (GHG) emissions for reconstruction and rehabilitation projects, including pertinent Capital
Preventative Maintenance Program (CPM) treatments of pavements in the State of Michigan.
The aim of this research is to calculate the carbon footprint, defined as a composite measure of
all GHG emissions expressed as equivalents of carbon dioxide emissions, and to develop a tool
that can be used to benchmark and estimate footprints to effectively reduce emissions in future
projects. The underlying methodology uses a life cycle assessment (LCA) approach that accounts
for emissions during the material acquisition and manufacturing, construction and use phases1 of
different pavements.
2.1. Goal and Objectives
The goal of this research is to develop a project-based LCA framework that will enable state and
local agencies to support sustainable decision-making by investigating strategies that reduce
GHG emissions associated with reconstruction, rehabilitation and CPM projects. The framework
considers the product, process and service components of a pavement’s life cycle. It includes a
set of metrics and methods that can be applied to monitor and control GHG for all or some
representative control sections through their life cycle. Decision-makers can use these metrics to
develop strategies that reduce net environmental impacts and GHG emissions. The objectives of
this research are as follows:
Theoretical Framework Development
Develop a project based LCA approach that accounts for the products and processes that support
the construction of a highway project, and the services that the highway provides through its use
life. The framework consists of the following components: 1 Please note that hence forth in this document the term ‘use phase’ of a pavement is used to mean the service life of the pavement.

3
1. A site data collection and organization method to account for emissions associated with
all material and equipment products and construction processes used, in constructing and
maintaining a highway section. Products include all material resources (measured by
weight and/or volume), and equipment (quantity and hours of use) used on site. Processes
include efficient construction schedules, site constraints, distances travelled to and on
construction sites, and pavement maintenance schedules. The product and process data
account for emissions through the materials mining and manufacturing, construction, and
maintenance phases. As most of this data is to be collected directly from construction
sites, the data collection method is based on current project documentation approaches to
minimize the burden of implementation.
2. A simulation-based approach to estimate the vehicular emissions during the service life
of a pavement.
3. Project life cycle metrics that can be used to assess and benchmark project emissions
based on a comprehensive literature survey of LCA metrics and methods as applied to
pavements.
Implementation
Implement the framework developed for 14 construction projects in Michigan.
Toolkit development
Based on the data gathered through the implementation of the framework develop:
1. A web-based inventory of all collected data – allowing remote access via a web-based
interface.
2. A web-based toolkit and associated recommendations on how the established carbon
footprints could be used to develop green construction standards for HMA and PCC
pavements.
This report describes the supporting literature and theoretical foundations of the proposed project
life cycle based framework. It explains the implementation of the methods described in the
framework to collect and organize construction and rehabilitation data from 14 MDOT pavement
re-construction, rehabilitation, and maintenance projects throughout the State of Michigan.

4
Further, it uses the observed data to estimate project GHG emissions and provides a web-based
tool that can be used to benchmark and reduce emissions.
2.2. Significance
The significance of this research lies in the challenges resolved and the methodology developed,
listed as follows:
1. Project Life Cycle Based Approach: Existing applications of LCA methods [2-7] to
pavements, while significant, have advocated the comparison of concrete and HMA
pavements. These studies have often had conflicting results because of an inconsistent
definition of system boundaries (varying emphasis in each study on designs considered
and phases involving materials installed, construction equipment used, and consideration
of use); and use of functional units (such as emissions per lane mile) that may be
misleading. This research effort does not use LCAs to compare alternative pavement
materials. Instead, it extends LCA methods to develop and implement project based life
cycle metrics and methodology to benchmark, monitor and reduce life cycle emissions
for pavement construction projects. The project based approach addresses various
problems with conflicting system boundaries and choice of appropriate functional units.
It also supports decision-making aimed at reducing emissions on any given highway
construction project, regardless of pavement type.
2. Direct Site Observation: It is difficult to arrive at exact metrics that can be reliably used
to support decision-making because of the uncertain and non-prototypical nature of
pavement construction processes, and the wide variation in site conditions and use
patterns. Therefore, to be effective, the study used directly observed construction and
maintenance data from 14 construction projects so that local and regional variations that
influence pavement construction processes, long-term performance and maintenance
needs, can be accounted for.
3. Data Organization: Given the large volume of construction and maintenance data that
was collected, a comprehensive data inventory had to be created. A web-based interface
was implemented so that the data can be easily viewed, analyzed and possibly shared by
various stakeholders.

5
4. Framework Development: Finally, while the research was conducted using directly
observed data, the trends and metrics were observed from a relatively small sample of 14
projects. Given the scope of the research project and the diversity of project types, it was
difficult to collect datasets large enough to support statistically significant conclusions.
Therefore, the emphasis of this research was on the development and implementation of a
methodological framework that can be used to monitor, benchmark, and reduce GHG
emissions. It is expected that if MDOT chooses to implement the recommended methods
over a period, they will need to implement an ongoing data collection plan that will
support recommendations for sustainable construction.
The long-term significance of this research is that it will enable decision-makers to ask and
answer questions that are critical to identifying ways of improving construction operations,
processes and design selection methods that reduce long term emissions and environmental
impacts. A recent survey of pavement performance models [8] most highly recommended the
models that accounted for heterogeneity, possibly arising from differences in environmental
conditions. They also found that averaged behavior data was not representative partly because
system behavior shows auto-correlation – emphasizing the need to base prediction models on
actual historical performance. In keeping with their findings, we describe a method to collect and
integrate historical and current construction and maintenance data of a highway network across
different life cycle phases. It will enable researchers and decision-makers to analyze the behavior
of alternative designs using historical data that reflects on-site conditions. The research takes
advantage of existing methods of calculating GHG emissions, while furthering the goals of
context sensitive performance analysis. This will further the integration between pavement
performance, pavement life cycle cost analysis and environmental impact assessment.
2.3. Deliverables
1. Report construction inventories for 14 highway reconstruction, rehabilitation and CPM
projects observed over a period of two summers
2. Report estimated emission factors for construction materials and equipment used
3. Report estimated emission factors for use phase of highways
4. Provide MDOT a tool to assess emissions through the different life cycle stages of a
pavement

6
5. Provide recommendations for developing construction standards and specifications
The final deliverable has the following principal components:
A framework to account for the product, process and service components of a pavement
life cycle, including a comprehensive data collection and organization plan
An inventory of carbon emissions of product and process components of 14 surveyed
projects. The inventory will be developed by implementing the proposed framework. The
carbon footprint information will be classified by life-cycle stages, by construction
processes and by operation types
An assessment of the life-cycle carbon footprint information along with the development
of metrics that can be used to benchmark emissions for future projects
A web-based tool than can be used to estimate and benchmark carbon emissions for
highway construction projects towards identifying emission reduction strategies
The main result expected from this research is the development and limited implementation of a
methodology to develop project inventories of highway construction and maintenance projects,
and estimate GHG emissions classified by life-cycle stages, construction processes and
operations.

7
3. BACKGROUND LITERATURE REVIEW
In this chapter, we provide an introduction to ideas in LCA and their applications to the field of
pavements. In addition, we also list a set of available tools that address the question of making
pavements more sustainable.
3.1. Life Cycle Assessment (LCA)
Life cycle assessment methodology is used to analyze the environmental impacts of a product
through all its life cycle stages. An ideal life cycle assessment accounts for all life cycle phases
of a product or process, including: raw material mining and extraction, material processing and
manufacturing, use, maintenance and repair, and end of life/disposal. LCA is used to assess the
environmental impacts of a product or process and has commonly been used as an assessment
tool in the manufacturing sector. An LCA study involves the following steps: (i) development of
goal and scope of the study, (ii) development of an exhaustive inventory of all energy and
material inputs, and the environmental outputs and emissions associated with each life cycle
phase, (iii) analysis of relative impacts of specific identified materials or processes, and (iv)
development of an appropriate interpretation of the analysis to support policy and decision-
making. This process ensures that all the environmental burdens associated with each of the life
cycle phases are accounted for, and the most crucial impacts identified for mitigation.
The International Standards Organization (ISO) have developed the principles, framework, and
guidelines necessary for conducting an LCA [9, 10]. These methods are part of the ISO 14000
series on Environmental Management, and are specifically discussed in ISO 14040:2006 and
14044:2006. When developing the goal and scope of an LCA, the guidelines require the
establishment of a system boundary and appropriate functional unit. A system boundary defines
all the processes directly or indirectly associated with a product that are to be included in the
analysis. In defining the functional unit of a product or system being studied, its function must be
established by keeping in mind the expected characteristics of its service and/or performance.
Based on the function a unit is derived that can be used to normalize the associated inputs and
outputs, providing a reference for comparison with similar products. It is important to note that
when using an LCA to compare two products, units of each product must have equivalent
function. Consider, for example, the application of LCA methods to differentiate between a

8
plastic cup and a paper cup. The products are comparable as they have similar usage, and are not
significantly impacted by the context in which they are used. Most importantly, the identity of
the product and the functional unit for comparison does not change during the course of its
lifetime. Similarly, when comparing the life cycle impacts of two different types of bulbs, it is
important to compare bulbs that have the comparable life times and similar luminosity. In
defining the system boundary and the functional units, various assumptions have to be made,
which should be clearly outlined and explained.
3.2. Pavement LCA
Pavement LCA applications and methodologies have their roots in the application of traditional
LCA methodologies that are typically product driven. Pavements, on the other hand, cannot be
easily defined as products. In practice, it is difficult to assume a pavement section to be a well-
defined product with a standard functional unit. Unlike typical products that have clearly defined
functional lives, the functional lives of pavement control sections are less predictable. Even
when two comparable pavement sections are constructed at the same time, they rarely undergo
the same maintenance and rehabilitation during their functional lives. Often different parts of the
same section tend to perform differently due to regional usage and environmental conditions
(varying freeze thaw cycles). This results in incomparable functionality, service lives and
impacts.
Most of the current research efforts in pavement LCAs emphasize prescriptive approaches that
present general conclusions regarding the comparative impacts of pavement materials [11-14]
based on estimated inventories and/or case studies. They have significantly furthered the field by
illustrating the application of life cycle assessment methods. However, their conclusions are
limited by explicit assumptions in the control sections selected for comparison, and implicit
assumptions of uniform climate conditions, usage patterns and environmental contexts, such as
access to raw materials and availability of local water resources. Regional and local variations
are difficult to codify in these approaches, as they emphasize comparisons of alternative designs
across assumed uniform conditions, rather than supporting context sensitive decisions that reduce
long-term impacts. Often, there is limited consideration of construction process information,
such as the type of equipment used and the impact of site location and layout when considering
the total life cycle emissions.

9
There has also been some disagreement on an appropriate functional unit. While the measures
per lane mile have been commonly used, they are not completely representative. As the size of
projects scale, such measures are subject to statistical smoothening resulting in flawed results.
This is partly because, as the number of lane miles increase, the material and equipment used for
each additional lane mile do not scale linearly for a given project or uniformly across projects.
As an alternative, a recent study [15] has used representative panels2 of typical concrete and
asphalt pavements to compare emissions of concrete and asphalt pavements. While not a perfect
functional unit, this provides an approach to compare the emissions from a cluster of materials
that are required to build a concrete panel and an asphalt panel respectively, and is arguably less
sensitive to scale.
A lack of consensus on these underlying definitions has plagued the pavement LCA literature. A
recent review of pavement LCAs, by the Portland Concrete Association (PCA) [16], have
reported inconsistencies due to functional units, improper system boundaries, imbalanced data
for asphalt and cement, use of limited inventory and impact assessment categories, and poor
overall utility.
Efforts at developing decision-support frameworks, to inform agency and stakeholder decisions,
also remain fragmented. Prescriptive LCA frameworks have been developed to support decision-
making between broad pavement classes [17, 18]. However, the assumptions underlying such
frameworks often make them unsuitable for supporting policies that aim to reduce long-term
GHG. They often lead to inaccurate generalizations that cannot be used to support context
sensitive policy. In addition, they leave limited room for monitoring, and/or rewarding
continuous improvement in construction planning processes aimed at reducing GHG. Subjective
point based systems, such as GreenRoadsTM [19], have been considered for reducing construction
emissions. While such systems are easier to implement, they lack appropriate verification.
Hence, the current body of work exhibits methodological deficiencies and incompatibilities that
serve as barriers to the widespread utilization of LCA by pavement engineers and policy makers
[16].
2 Panels are specified lengths of pavement sections. For example, consider a 12’x15’x11” panel of a jointed plain concrete pavement.

10
In view of these limitations, the University of California Pavement Research Center (UCPRC)
and the University of California Institute of Transportation Studies held a pavement life cycle
assessment workshop to establish the common principles and framework that should be used in
conducting a pavement life cycle assessment [20]. An important deliverable of this workshop
was the Pavement LCA guidelines document [21]. It outlines the framework, system boundary
assumptions, and assessment of data models and documentation requirements, along with a
detailed pavement LCA checklist. The guidelines can be used in accordance to the ISO LCA
standards and provide a project-level LCA perspective.
The research in this report builds on this pavement LCA framework and explicitly uses the
checklist. The application of the checklist in this research is outlined in Appendix A: MDOT
Pavement LCA Checklist. However, it avoids using LCAs to compare pavement materials;
instead, it uses LCA methodology to calculate GHG emissions for particular projects. Therefore,
the research uses a project based LCA approach to calculate GHG of highway construction
products, processes and the service life. The approach takes advantage of existing methods of
calculating GHG emissions, while emphasizing the collection of project data through the
construction phase of the pavement life cycle. It particularly accounts for the emissions from (i)
the mining, manufacturing and production of the material products (materials and equipment)
used to construct the pavement, (ii) the processes involved during the construction and
maintenance of the pavement, and (iii) the service life/use phase of the pavement. In doing so,
the research builds on methods and metrics in the literature that apply LCA to different stages of
the pavement’s life.
3.3. Available Tools
This section reviews the available tools that can be used to assess GHG emissions pertaining to
different life cycle phases of highway control sections. With industry facing pressures to market
new innovations [22], Government-University-Industry partnerships and collaborations have
played an important role in the development of many of these tools; fostering innovation and
technology transfer between industry and academia [22]. Most of the tools surveyed have had
limited implementation and their eventual success may depend on state and federal policies.
However, with pending climate and energy legislation in the Unites States, they may be
responsive to emergent policy requirements for agencies and contractors.

11
Table 3-1 highlights the current state of practice regarding tools that can be used to estimate
GHG emissions and can specifically be applied to highway sections.
Table 3-1: Survey of GHG Impact Assessment Tools Institution Type GHG Impact Tools Life Cycle
Inventory/ Assessment
Emission Calculators Rating/Point Systems
Government
NREL LCI
SGEC Tool FHWA Self-Eval Tool
Academic/State EIO-LCA PaLATE
Road Construction Emissions Model GreenDOT
Greenroads™ GreenLITES I-LAST
Industry SimaPro AsPECT
CHANGER e-CALC AggRegain
Greenroads™
3.3.1. Governmental Tools
Impact tools provided by governmental organizations that can be used in assessing life cycle
GHG impacts of highway controls sections include:
1. National Renewable Energy Laboratory (NREL) Life Cycle Inventory
o Organization: U.S. Department of Energy
o This Life Cycle Inventory database can be used by LCA practitioners to assess the
environmental impacts of energy and material flows [7]. The database is useful
when assessing emission metrics related to the materials and transportation
impacts of highway control sections. However, data is limited when trying to
quantify all materials that are commonly used in roadway sections and since
carbon dioxide emissions are not a reporting requirement in the U.S., in some
cases, materials are not assigned a CO2 impact.
o Application to Highway Life Cycle GHG Assessment
Material Acquisition/Extraction
Upstream manufacturing impacts of fuel combusted in equipment
On-Highway Transportation Impacts

12
2. Simplified GHG Emissions Calculator
o Organization: U.S. Environmental Protection Agency
o The simplified GHG emissions calculator is an MS Excel-based spreadsheet that
aims to help organizations estimate their GHG emissions from stationary and
mobile combustion sources, purchased electricity, refrigeration and air
conditioning [23].
o Application to Highway Life Cycle GHG Assessment
Off-Road Transportation and Equipment Impacts
On-Highway Transportation Impacts
On-Site Electricity Use
3. Sustainable Highways Self-Evaluation Tool
o Organization: Federal Highway Administration (FHWA)
o The Sustainable Highways Self-Evaluation Tool attempts to encompass
sustainability aspects into highway and other roadway projects and programs
using a self-evaluated scorecard [24]. The system is applied to the entire project
from planning to operations, in which project score is awarded points for
performing a LCA. Also points are awarded to projects that reduce GHG emission
throughout construction, such as reducing fossil fuel use, having off-road
equipment meeting Tier 4 standards, and encouraging the use of recycled
materials.
o With scoring systems, it is possible to account for all highway life cycle GHG
emissions.
o Recognizes approaches and strategies to assessing life cycle GHG emissions
using; PaLATE, CHANGER, NREL, and EIO-LCA. All are discussed in this
chapter.
3.3.2. Academic Tools
Impact tools provided by state agencies and/or academic organizations that can be used in
assessing various life cycle GHG impacts of highway controls sections include:
4. Economic Input-Output Life-Cycle Assessment (EIO-LCA)
o Organization: Carnegie Mellon University

13
o The EIO-LCA model is an analysis model that defines the scope and number of
environmental effects quantified in a LCA. It estimates the economic
contribution, resource requirements and environmental emissions for a particular
product, service, or activity based on economic transactions [25]. It is unable to
estimate project specific processes such as on-site transportation impacts.
o Application to Highway Life Cycle GHG Assessment
Material Acquisition/Extraction impacts
Upstream manufacturing impacts of fuel combusted in equipment
Upstream manufacturing impacts of the construction equipment
5. Pavement Life-cycle Assessment Tool for Environmental and Economic Effects
(PaLATE)
o Organization: Consortium of Green Design at the University of California,
Berkeley
o PaLATE is an excel-based LCA tool that uses life cycle costing metrics and
environmental parameters from EIO-LCA to assess GHG emissions from
pavement materials. It can also estimate GHG emissions from construction and
hauling equipment used on the project [26].
o Application to Highway Life Cycle GHG Assessment
Material Acquisition/Extraction Impacts
Off-Road Transportation and Equipment Impacts
Batch Plant and Secondary Material Processing Impacts
6. Road Construction Emissions Model
o Organization: Sacramento Metropolitan Air Quality Management District
o The Road Construction Emission Model is an excel-based emission calculator that
estimates air emission due to road construction activities based on construction
period, hauling emissions, commuter emissions, and off-road equipment
emissions [27].
o Application to Highway Life Cycle GHG Assessment
Off-Road Transportation and Equipment Impacts
7. GreenDOT
o Organization: National Cooperative Highway Research Program (NCHRP)
14
o GreenDOT is an excel-based emission calculator designed for state DOTs to
assess emissions from highway construction, and maintenance activities. It
attempts to estimate the carbon dioxide emissions from electricity use, on-road
fleets, off-road equipment and materials used [15]. The product was developed as
part of NCHRP Report 25-25 Task 58.
o Application to Highway Life Cycle GHG Assessment
Material Acquisition/Extraction impacts
Electricity Use
On-Road Transportation Impacts
Off-Road Transportation Impacts
8. Greenroads™
o Organization: University of Washington
o Greenroads™ is a highway sustainability rating system that applies to the design
and construction of highways [28]. The system works with a repository of “best
practices” and assigns them a point value when implemented on the project design
and construction. Regarding GHG emissions in the construction process, the
system gives credit if a LCA is conducted, and also gives credits to projects that
reduce GHG emission throughout construction. For example, reducing fossil fuel
use, having off-road equipment meeting tier 4 standards, and encouraging the use
of recycled materials.
o With rating systems it is possible to account for all highway life cycle GHG
emissions
9. GreenLITES
o Organization: New York Department of Transportation (NYDOT)
o GreenLITES is a certification program used internally by NYDOT. It certifies
their transportation project design and operations are incorporating sustainable
practices by assessing them certified, silver, gold, and evergreen certifications
[29]. In addressing GHG emissions from construction and rehabilitation
operations, the program encourages the reuse and recycling of materials that are
preferably obtained locally. The program also encourages the reduction of the

15
department’s carbon footprint along with reducing petroleum and energy use on
the project.
o With rating systems, it is possible to account for all highway life cycle GHG
emissions
10. Illinois - Livable and Sustainable Transportation Rating System (I-LAST)
o Organization: Illinois Department of Transportation
o I-LAST is a sustainability performance metric system designed to incorporate
sustainable and livable concepts in Illinois highway projects [30]. Using a
comprehensive list of best practices and methods, projects are rated using the
programs scorecard. The program assesses GHG emissions by promoting mass
transit in the community planning stages, using locally produced materials,
recycled and secondary materials used in design and construction, and encourages
non-motorized travel use.
o With rating systems, it is possible to account for all highway life cycle GHG
emissions
3.3.3. Industry Tools
Impact tools provided by industry that can be used in assessing various life cycle GHG impacts
of highway controls sections include:
11. SimaPro
o Organization: Pre’ Consultants
o SimaPro is a process-based LCA software tool that assesses the environmental
impact of products and/or processes [6]. It uses a life cycle approach to assess
environmental impacts. Materials and processes are assessed using the software’s
various life cycle inventory databases. Specific interactions relating to the chain
of processes that comprise the final material and/or process must be itemized
separately to build the overall life cycle.
o Application to Highway Life Cycle GHG Assessment
Material Acquisition/Extraction impacts
Electricity Use
Upstream manufacturing impacts of fuel combusted in equipment

16
12. Asphalt Pavement Embodied Carbon Tool (AsPECT)
o Organization: UK’s Transport Research Laboratory (TRL)
o AsPECT is a LCA used in the United Kingdom to assess embodied energy and
emissions from asphalt used in highways [31]. In can assess asphalt pavement
material production emissions, emissions from placing the material, and batch
plant emissions associated with producing the asphalt mixture.
o Application to Highway Life Cycle GHG Assessment
Asphalt Batch Plant Emissions
Material Production Emissions (Asphalt materials)
Compacting and laying emissions
13. Calculator for Harmonized Assessment and Normalization of GHG Emissions for Roads
(CHANGER)
o Organization: International Road Federation
o CHANGER is a tool that estimates the GHG emissions from pavement materials,
transportation of materials, electricity use, and construction equipment [32]. This
is a commercial product and must be purchased.
o Application to Highway Life Cycle GHG Assessment
Electricity Use
Fuel Use
Material Production Emissions
Transportation Impacts
Off-Road Equipment Use
14. e-CALC
o e-CALC is an excel-based program that estimates GHG emissions from 4 types of
construction methods; underground utility construction, horizontal directional
drilling, pipe bursting, open-cut with excavators or backhoes and open-cut by
trenching[33]. It estimates on-site equipment and hauling emissions associated
with construction projects.
o Although these may not specifically apply to highway construction, the
information modeling capabilities are useful for application to highway life cycle
GHG assessment in the following ways:

17
On-Site Construction Equipment Impacts
On-Site Hauling Impacts
15. AggRegain CO2 Tool
o Organization: Waste & Resources Action Program (WRAP)
o The AggRegain CO2 Tool is CO2 calculator utilized through excel in which
emissions can be assessed by investigating the use of recycled and secondary
materials in bitumen bound, concrete, hydraulically bound, unbound construction
applications [34]. It outputs savings by selecting these various products to be used
in the construction project.
o Application to Highway Life Cycle GHG Assessment
Material Production
Transportation Impacts
Secondary (Composite) Material Production
3.4. Assessment of Tools
The tools highlighted above represent three areas defining tools related to pavement
sustainability: Life Cycle Inventory, Impact (GHG) Calculators, and Rating/Point Systems. Each
of these is used to support a pavement LCA in different ways. For example, Life Cycle Inventory
tools are used to quantify the inputs into the system, Impact calculators establish the magnitude
of outputs investigated, and finally, Rating/Point Systems can illustrate and document
sustainable approaches exemplified in the life cycle. A review of the tools available illustrate that
different approaches can be used to account for the different phases of the construction project.
However, as outlined, each tool lacks the ability to account for all phases of the highway
construction phase. Therefore, it may be necessary to use a combination of these tools to address
the entire construction phase. In addition, there is a shortage of construction project inventories.
The research described here attempts to integrate project-level construction data with a
combination of economic and process LCA based emission factors to estimate GHG emissions.
The approach taken here is to account for the project phase using a combination of these tools
with data obtained directly from construction and rehabilitation projects to estimate the GHG
emissions. This also provides the first step in developing emission reduction strategies to
influence sustainable decision-making.
18
4. PROJECT BASED LCA FRAMEWORK
The most important contribution of this research is the development of the project based LCA
framework. In this chapter, the underlying theory and methods supporting the framework are
discussed. The next chapter describes its implementation.
4.1. System Definition
The goal of the proposed framework is as follows:
1. Calculate project GHG emissions
2. Develop an inventory of construction processes and product footprints that can be used to
benchmark project emissions
3. Provide a tool that can estimate emissions for future projects
4. Serve as a platform for identifying emission reduction best practices
The stakeholders of this study are state agencies such as the Michigan Department of
Transportation (MDOT) and construction contractors. It is expected that an implementation of
this framework will allow the stakeholders to calculate project emissions, and identify ways of
reducing project GHG emissions. Agencies can use the framework to get a life cycle perspective
of emissions from specific highway sections, including observed emissions from construction,
maintenance, rehabilitation projects, and an estimate of emissions during the use phase.
Contractors can use it to estimate GHG emissions for specific construction operations –
particularly with the goal of identifying alternative materials or improvements in construction
processes to reduce their emissions.
Based on the objectives of the proposed framework, the boundaries of the system being studied
in this framework are:
1. Product components: This considers the impact of the pavement product itself –
specifically accounting for all pavement materials and equipment that contribute to the
construction of the highway section. All materials listed in project pay items as per
MDOT specifications, are accounted for except materials that are associated with bridge
construction. For each of the materials, emissions for the mining and manufacturing

19
phase are accounted for. In addition, the emissions of transporting the materials to the
construction site are included. Both virgin materials, and where reported recycled
materials, are accounted for. For example, recycled aggregate is considered explicitly. All
equipment used during the construction and maintenance operations is accounted for as
well. For each equipment type, total energy use (gallons of fuel) on the construction site
(as a function of total hours of usage) is accounted for. In addition, a fraction of the
emissions from manufacturing of the equipment, proportional to the number of hours of
use on a particular project is included. The product components are limited to involve
only materials and equipment directly associated with the stakeholder’s decision-making
processes.
2. Process components: The process includes two components – the processes on site that
are directly involved in the highway construction and maintenance operations, e.g.,
construction schedule and operation design; and the processes that directly influence
decisions of long-term pavement behavior, e.g., determination of maintenance schedules.
The process components are limited to involve only processes that directly involve the
stakeholder decision-making processes.
3. Service life components: Service life components of pavements can be quite difficult to
determine and even more difficult to estimate. Therefore, a traffic simulation
environment MOVES [35] was used to estimate use phase emissions due to on-road
vehicular traffic. Excess emissions due to traffic delays, and reduced speeds in
construction zones, were also considered. While this is a very limited consideration of the
service life of pavements, it provides agency stakeholders a reasonable baseline to
benchmarking projects.
The product and process data will be directly observed from project sites, while the service phase
data is estimated using traffic simulations. The pavement life cycle phases that this framework
involves are:
1. Material Acquisition/Extraction Impacts (Product)
2. Upstream Manufacturing Impacts of Fuel Combusted in Equipment (Product)
3. Upstream Manufacturing Impacts of the Construction Equipment (Product)
4. On-Highway Transportation Impacts (Process)

20
5. Off-Road Transportation Impacts (Process)
6. Off-Road Equipment Impacts (Process)
7. Batch Plant and Secondary Material Processing Impacts (Process)
8. Construction Schedule (Process)
9. On-Road Vehicular Emissions (Service)
10. Long Term Pavement Maintenance Schedules and Performance (Service)
For each of these datasets, the framework includes a comprehensive data collection plan – to be
discussed in a later section.
4.2. Hybrid LCA Methodology
Applying LCA to study the environmental effects of products or processes requires systematic
accounting for the different stages through the life cycle. The life cycle phases considered are the
materials extraction phase, manufacturing/production stage, the use phase and the ultimate end-
of-life/ disposal and recycling phase. All inputs and outputs into a product or process are
accounted for, and the environmental impacts of each are directly calculated to determine the
total life cycle environmental impacts. This report focuses on using this method to calculate the
GHG emissions – one component of all environmental impacts calculated by an LCA.
There are two ways to conduct an LCA - using an input-output based LCA, or a process based
LCA. Economic input-output based LCAs are based on economic transactions and resource
interactions between an exhaustive set of economic sectors. The system wide use of resources, as
measured by economic input and output across all related sectors, is used as an indicator of
emissions from industries in that sector. Input-output models identify emissions that are
immediately related to the product and/or process at hand, as well as emissions from related
economic activity across sectors. Process-based LCA practitioners on the other hand, isolate
processes using well-defined system boundaries and calculate direct emissions of all activities
within the defined boundary. The inputs (materials and energy), along with the outputs
(emissions) from each step in the product or process life cycle are itemized and accounted for. A
critical difference between these two methods is that input-output LCAs take into account
multiple economy-wide interactions, attempting to provide a comprehensive assessment, while
process LCAs tend to be detailed assessments of specific industrial processes that can be easily

21
identified and isolated. All interactions defining the chain of specific processes that comprise the
material extraction and production phase are difficult to account for. For example, the
transportation impacts from raw material extraction sites to the manufacturing/production facility
may fall beyond the system boundary of the process LCA and be excluded, and difficult to
estimate. In such cases, sector wide input-output LCAs are better suited for estimating average
emissions associated with such system wide interactions.
A choice between one or the other LCA often involves trade-offs between accuracy and scope,
and is sometimes dictated by availability and measurability of data sources. The advantages and
disadvantages of these two methods are outlined in previous work [36] and reproduced in Table
4-1.
In this research effort, a hybrid LCA method was adopted. Hybrid LCAs have been previously
considered for application to construction processes [4]. The method takes advantage of the
structure of a process LCA to define the system boundaries of a construction process, and
identify and inventory the associated resource (materials and equipment) inputs, and emission
outputs. In order to estimate the GHG for all materials and equipment inputs, an input-output
and/or process LCA tool is used to take advantage of the most recent emission factors that have
been reported in the process LCA literature, when applicable, as well as maximize the
advantages of an input-output LCA. In effect, we use integrated hybrid LCA models to represent
the life cycle impacts of the construction projects. In the model, the GHG emissions are
quantified as a function of the construction and vehicle operations in terms of material/fuel
usage.
Table 4-1: Advantages and Disadvantages of IO and Process-based LCA Models[37]
22
The emission factors used in this study are from process LCAs reported in literature. They have
been taken primarily from the Stripple [38], Athena [39] and NREL [7] inventories. These
emission factors are usually expressed as Tons of CO2 equivalents per unit weight or volume.
Therefore, given a bulk volume or weight of a material use on a particular project, the emissions
can be calculated by using the emission factors. (Appendix B: Emission Factors itemizes all the
emission factors used in this study and their respective sources.)
The Economic Input Output-Life Cycle Assessment (EIO-LCA) is also used in the hybrid model.
It is a model that defines the scope and number of environmental effects quantified in a LCA.
Developed at Carnegie Mellon University [37], it estimates the economic contribution, resource
requirements and environmental emissions for a particular product, service, or activity. The
model attempts to capture all the requirements to produce a product, service, or activity, for the
life cycle stages of extraction/mining, transportation, and manufacturing. Construction activity,
operation and maintenance activities, and end-of-life/disposal impacts of products are not
accounted for in the EIO-LCA model, and have to be determined independently. EIO-LCA has
been used for conducting LCAs to assess the sustainability of different kinds of pavements. For
this study, EIO-LCA was used to account for manufacturing of the materials used in each
project, along with the manufacturing impacts of the fuel and equipment to be used in the
construction project.
The usefulness of the EIO-LCA model is dependent on the accuracy of the material and
equipment inventories developed for each pavement design and construction operation type. In
addition, the outputs are reliant on the economic input of the identified materials and equipment
in US Dollar and based on the 2002 US economy. Average cost for each material or item varies
by region and the costs reported in the contracts are agency costs (cost to the DOT rather than
cost of material production), which are inapplicable to EIO-LCA studies. Therefore, material
prices must be isolated from agency’s cost. It is important to use material prices (rather than
estimated cost to the agency) that were reflected in the project to obtain the most accurate results
in EIO-LCA. This can be used to investigate the impact of variability in pricing due to
availability of regional materials on life cycle emissions. For this study, national average
material prices were obtained through RS Means data (2009) [40] and then converted to 2002

23
dollar using applicable cost indexes. (Cost indices were calculated using a base of 100 in 1913,
as per Engineering News Record data, e.g. 2010 cost index is 183.5).
4.3. Inventory Development: Data Collection
Methodology
This section describes the method used to collect highway construction data for the development
of inventories of material and equipment associated with a project’s product process and service
components. Product and process data was collected directly from construction sites, while
service data was simulated using highway characteristics and traffic data.
Construction product and process data collection led to the development of material and
equipment inventories, which represent the construction and rehabilitation process. New
construction, re-construction and different maintenance operations were considered. The primary
challenge in collecting this data was eliciting co-operation and collaboration from project
engineers, contractors and sub-contractors on site. Hence, it was imperative to take advantage of
existing reporting methods, thus minimizing the burden of reporting. In addition, data was
collected through direct field observation by researchers. For the service component, the Motor
Vehicle Emission Simulator (MOVES) simulation was used to estimate on-highway vehicle
emissions throughout the service life of the pavement. Results from the simulation were also
used to investigate additional emissions due to construction work zone delays. The MOVES
simulator was developed by United States Environmental Protection Agency (U.S. EPA) [35].
MDOT requires the use of software called FieldManager™, a construction management and
reporting software created by InfoTech Inc. [41] on all their construction and rehabilitation
contracts. The software maintains electronic reports of MDOT Inspector’s Daily Records (IDR).
Inspectors (on behalf of MDOT) use FieldManagerTM to record, on a daily basis, information
regarding general site conditions, contractor personnel and equipment on site, and quantities of
different material installed on site. FieldManagerTM was chosen for this research to take
advantage of MDOT’s existing process for tracking and monitoring all their construction and
rehabilitation contracts. Hence, this method takes advantage of current field expertise, and
reporting practices to support the data collection procedure. The IDRs were directly collected

24
from the FieldManagerTM database and used to accurately account for the product and process
data collected for each of the projects surveyed.
In the next sub-sections, each data category is explained in detail.
4.3.1. Product Data
Materials used on the construction sites were recorded using the IDR, tracking progress made on
each pay item as specified in the construction contract. The location, station information and
quantities of materials associated with each item installed were stored. The data was used to
maintain an as-built record of procured and installed material. The collected data is considered
highly accurate, as the contractors were paid based on these records. Using as-built quantities in
the calculation of life cycle impacts and emissions is significantly more representative of project
impacts compared to similar calculations done with estimated quantities.
Product data allowing for the estimation of impacts associated with the manufacturing of
construction equipment was also collected. First, the purchasing price of general categories of
construction equipment being used on the project was determined. The total impact for
producing the machinery was then determined using three types of data pertaining to the
equipment:
Purchasing value of equipment (from online equipment vendors)
Useful life of equipment [42, 43]
Hours used on specific project (from FieldManagerTM)
Using this information, the impacts were estimated for each individual piece of machinery, and
then broken down further by applying the portion of the machinery’s life that was reflected in the
actual project. This was done using the number of hours used/total useful life ratio. For example,
if the expected life of equipment is 10,000 hours, and the number of usage hours on a particular
project is 1,200 hours, then only three twenty-fifths of the manufacturing impact of that
equipment is considered for the project.
The development of this inventory was crucial to this project. It also has long-term implications.
When available to other researchers, it can support the investigation of questions beyond the
scope of this study but particularly relevant to the topic. It is expected in the long-run, MDOT

25
will continue to use this method to collect data across various construction projects. The data
collected across similar and different construction projects can then be analyzed by cross
classifying across pavement designs, construction operations and site-specific conditions to
highlight sensitivity of impacts and emissions to local and regional variables.
The emissions from these material inventories were estimated from methods described in the
section titled Materials Emissions.
4.3.2. Process Data
The contractor equipment inputs in the IDR were critical to quantifying project construction
equipment emissions. Recent studies have shown that energy use and emissions of construction
processes are primarily due to construction equipment use, which can account for 50% of most
types of emissions. Also, equipment larger than 175 Hp made prior to 1996 tend to have higher
emissions than more recent models [17]. Therefore, data was collected to account for the use of
equipment on construction operations. While, the type and quality of construction equipment
influence project emissions, the design of the operations – in particular travel distances on site –
also influence project emissions. In this report, the emphasis has been on studying the processes
that define the construction operations – with the goal of encouraging emission reduction
through increased efficiency on construction sites.
In taking full advantage of fields specified in the IDR, inspectors were requested to identify
equipment present on-site, how long the equipment worked, and the operation the equipment was
performing. Inspectors recorded: (i) equipment characteristics such as model year, gross vehicle
weight and mileage on the vehicle (henceforth all this information is referred to as equipment
type for brevity); and (ii) activity characteristics such as number of trips, one way distance, and
return distance. Due to a lack of complete cooperation from the inspectors, the data collected
through the inspector reports was incomplete. Appropriate assumptions, explained later in the
report, were made to account for the missing data. For more accurate assessment, there may be a
need to standardize the reporting procedure for Inspectors when using FieldManager™.
Information collected though FieldManager™ was also supplemented with information collected
in collaboration with contractors. This included information regarding equipment specifics
needed to calculate equipment emissions such as the equipment model, year, make, type of fuel
used (sulfur content) and engine type. In some cases, contractors were already tracking their

26
equipment usage to monitor efficiency, and were willing to share the information. This
information is highlighted in the Project Emissions Estimator (PE-2). Information collected from
the contractor was used to support any assumptions made and the information recorded in
FieldManager™ IDR when applicable. In the future, if equipment emissions are to be monitored
by MDOT, reporting standards for all inspectors must be developed for uniform reporting of on-
site equipment use. In addition, it is expected that collaboration between agencies and
contractors will increase so that relevant data can be correctly and exhaustively reported.
On-site travel distance data is an indicator of construction operation design efficiency. For
example, inefficient design can result in longer operation cycle times as well as longer travel
distances from batch plant location. Some of this data was obtained directly from on-site
observation. In addition, material-testing orders provided by MDOT were used to calculate the
distances travelled in transporting materials to the construction site. Researchers were able to
map the site layout with respect to material stockpiles, batch plants, suppliers, etc.
The following outlines the data types collected to accurately account for on-site travel from
hauling equipment:
1. Equipment descriptions are categorized into generalized construction equipment
categories. (i.e. dozer, excavator, etc.)
2. Generalized equipment categories are assigned a fuel consumption rate and an hours per
day operating rate
3. Quantify fuel used/combusted in equipment
This process data also includes travel distances and number of trips for the hauling equipment.
This data was obtained from on-site observation material testing orders. To account for
combustion process emissions, carbon content of diesel fuel was used and obtained from the U.S.
EPA [44].
The data obtained from material testing orders was used to estimate emissions from hauling
equipment traveling to and from material stockpiles and pits that provide the materials which
make up the pavement designs. This data included the travel distances from the suppliers to site,
from stockpiles and batch plants to site, and from stockpiles/suppliers to batch plants. The testing
orders provided addresses of material suppliers along with limited descriptions of material

27
stockpiles. Locations of these stockpiles were also obtained through correspondence with the
contractors.
The following outlines data types collected to account for to-site travel from hauling equipment:
1. Site layout maps to estimate distances from material suppliers to site or batch plant
locations
2. Number of trips taken from suppliers or stock pit
3. Total travel distances on-site
Emissions from equipment activity and to site transport are estimated using the methodology
outlined in Equipment Emissions.
Additionally, the construction schedule process data was collected to investigate net increased
emissions due to schedule delays. Particularly, two schedules were analyzed in performing this
analysis; as-planned and as-built. Original progress schedules (MDOT Form 1130) were used to
outline the as-planned schedule. The resource allocation for the as-planned schedule –
particularly important for calculation of as-planned production rates - was calculated from the
project proposal’s estimate. The progress schedule outlines construction activities along with
proposed starting and end dates for each activity. FieldManager™ was used to develop the as-
built resource loaded schedule, by allocating pay items to activities outlined in the progress
schedule and assessing the actual productivity (material and equipment usage) depicted in
FieldManager™.
4.3.3. Service Data
Life cycle performance of highway sections plays a critical role in reducing GHG emissions.
Long life pavements that require little or no major rehabilitation promise to lower the overall life
cycle GHG emissions. Pavements with minimal rehabilitation and maintenance can lower the
overall life cycle GHG emissions. As part of this study, pavement condition and historical
maintenance data are used to estimate maintenance schedules and overall pavement life cycle
definitions.
In addition, emissions associated with the service provided by the pavement – referred to as the
use phase emissions, must also be accounted for. The system boundary for the use phase is

28
difficult to define. For this research, the scope was limited to emissions due to on-road vehicular
traffic use of the pavement.
Therefore, the data collected for this component is:
Maintenance and rehabilitation records for the highway section investigated
Pavement condition data such as Distress or International Roughness Index
measurements before and after maintenance
Quantity of material and equipment used for rehabilitating the roadway – this simply
accounts for the product and process emissions of the maintenance and rehabilitation
operations and are considered as a gross number in this phase
Highway traffic characteristics
Emissions due to work zone delays
It is important to note that, although not considered in this study, pavement-vehicle interaction
will also influence life cycle GHG emissions. For example, increased fuel efficiency of rigid
pavements reduces life GHG emissions [45].
Service data collection lead to limited traffic scenarios that could adequately represent the
highway sections investigated. In-use service data associated with highway section is used to
estimate on-road vehicle emissions resulting from the service phase of the pavement section. As
mentioned earlier, U.S. EPA MOVES Model was used for this analysis. Types of service data
used in this study are, but not limited to, the following:
Fuel Composition data
Climate data
Vehicle Characteristics
Traffic Class Distribution
It is with these types of service data, the service component of the pavement LCA was assessed.

29
4.4. GHG Calculation Using Project Based LCA
Methodology
Analyzing the three types of data described earlier allowed the researchers to estimate GHG
emissions resulting from the construction and rehabilitation projects investigated. The following
methods were used to estimate GHG emissions:
4.4.1. Product Component GHG Emissions
To estimate the GHG emissions from the product components using the hybrid LCA approach,
researchers used various emission factors. For material acquisition/extraction emission of driving
materials, emission factors were obtained from published process LCA data. For example,
cement, binder, and aggregates are all represented using emission factors published in literature,
and commonly used as representative emission factors for these materials. These factors were
converted to represent units used by MDOT. The calculation is based on the amount of carbon
dioxide emissions per unit of material used. Where published emissions could not be accessed,
EIO-LCA was used to develop emission factors based on emissions associated with the industry
sector that the product was classified under. An example calculation for using EIO-LCA is as
follows:
Material: Pavement Marking Waterborne Paint (Gallon)
EIO-LCA sector and model used: 325510 Paint and Coating Manufacturing represented
in the US 2002 National Producer Price Model
Using $1000 as a baseline to estimate the material’s Global Warming Potential (GWP)
impact, the Metric Tons of CO2 Eq Emissions per $1000 purchased is 0.988.
The unit price for 2009 for a gallon was $83.33. This is converted to a 2002 price using
the factor 0.7146 (= cost index 2002/cost index 2009 = 128.7/180.1).
Therefore, if the project is using 500 gallons of pavement marking paint the estimated
GHG emissions from producing the material is found to be (500 x 83.33 x 0.7146 x
[0.988/1000] =) 29.476 MT CO2 Eq.
EIO-LCA was also used to determine impacts from manufacturing the fuel combusted in the
construction equipment on site, and impacts associated with manufacturing the machinery
utilized on the project. The former was quantified from construction equipment use reports

30
generated from FieldManager™. The latter was estimated by first determining the purchasing
price of generalized construction equipment being used on the project, obtained from equipment
vendor’s websites. Once the price for the equipment representing the projects was determined,
those prices were then converted to 2002 prices using the following formula.
EC2002 = EC2009 x [1 + r]n / [1 + i]n
Where EC is the equipment cost, n=6 years, r is the discount rate assumed to be 5%, and i is the
inflation rate assumed to be 3%.
The total impact for producing the machinery that was used on the projects was then determined
using EIO-LCA. EIO-LCA is only capable of estimating the entire machine’s impact. Therefore,
using the information from EIO-LCA, the impact was broken down for each individual piece of
machinery, and then broken down further by applying the portion of the machinery’s life
reflected in the actual project. This was done using the number of hours used/total useful life
ratio. For example, if the expected life of equipment is 10,000 hours, and the number of usage
hours on a particular project is 1,200 hours, then only three twenty-fifths of the manufacturing
impact of that equipment is considered for the project.
4.4.2. Process Component GHG Emissions
A combination of methods and tools were used to estimate the GHG emissions from process
components of the hybrid LCA. It consisted of emissions from transporting materials to site,
emissions from distances travelled on site during construction, batch plant emissions and
increased emissions associated with delays in construction schedules.
On-Highway transportation impacts were considered by accounting for impacts due to hauling
materials from the supplier to site. Information on supplier locations was obtained from material
testing orders procured through MDOT. The locations and distances were mapped using Google
Maps. The mode of transportation was assumed as on-highway combination diesel transport
truck fully loaded at 30 Metric Tons. The corresponding emissions were found to be 0.386 MT
CO2/Mile. (Refer to factors.xslx)
The emissions resulting from off-road transport and construction equipment usage was estimated
using EPA approved methodologies. The equipment was generalized based on the following
premises:

31
Equipment type categories, horsepower (HP), and load factors (% of HP used)
classifications were obtained from the California Environmental Quality Act (CEQA)
tool for assessing emission for road construction projects [46].
Load factors were estimated considering average operation level as a percentage of the
engine manufacturer’s maximum horsepower rating [47].
The same horsepower and load factor classifications were assigned to the equipment
types used in the case studies.
Variability in year, make, and model are excluded from this analysis due to lack of adequate
current data. The data set classifies the equipment into use types. On-site construction equipment
is considered “stationary.” Hauling equipment, transporting materials on and off site from
stockpiles, batch plants, etc. are considered “hauling”. All miscellaneous equipment such as the
foreman’s pick-up is considered “other”. In some cases, division and section identification
numbers classify the equipment. These represent the type of work being performed by the
equipment. The identification numbers directly relate to division and sections of work outlined in
MDOT’s Standard Specifications for Construction [48]. Analyzing this parameter allows
researcher to assess productivity and GHG emissions based on work type.
Estimated diesel fuel emissions from the equipment were based on fuel consumption. Recent
studies have shown that fuel use emission factors have less variability than time-based emission
rates [49]. Therefore, gallons of fuel consumed were estimated using the following formula:
Fuel Rate (Gal/hr) = LF x TF x FF x HP
Where: LF is load factor and TF is the time factor which was assumed to be 50min/hour in this
study. FF is Fuel factor (diesel) and assumed to be 0.04gal/(hp-hr) [50]. HP is the average
horsepower used for each equipment type. Based on the determination of fuel consumption, three
GHG emissions were estimated (Carbon Dioxide CO2, Nitrous Oxide N2O, and Methane CH4)
using the following equations:
Carbon Dioxide:
Emissions (MT) = Σn i=1 Fueli x HCi x Ci x FOi x [CO2/C] [44]

32
Where: Fueli = Volume of Fuel Type i Combusted, HCi = Heat Content of Fuel Type i, CCi =
Carbon Content Coefficient of Fuel Type i, FOi = Fraction Oxidized of Fuel Type i, CO2 (m.w.)
= Molecular weight of CO2, C (m.w.) = Molecular Weight of Carbon.
The following values were used in the calculation of CO2 emissions and obtained from U.S.
Environmental Protection Agency’s guide on calculating GHG emissions from mobile sources
[44]:
HCi= 5.825 mmBtu/Barrel
Ci= 19.95 kg C/mmBtu
FOi= 1.0
CO2 (m.w.)= 44.01
C(m.w.)= 12.01
Nitrous Oxide & Methane
Emissions (g) = Fueli x EFp
Where: Fueli = Volume of Fuel Type i Combusted, EFp = Emission Factor per pollutant type
(N2O or CH4)
The following values were used in the calculation of N2O and CH4 emissions and obtained from
U.S. Environmental Protection Agency’s guide on calculating GHG emissions from mobile
sources [44]:
EFN2O= 0.26 g/gal
EFCH4= 0.58 g/gal
After determining the various GHG emissions from equipment types estimated from the case
studies, a total carbon dioxide equivalent was calculated using the following Global Warming
Potential (GWP) multipliers [51]:
GWP N2O = 296
GWPCH4 = 23

33
This methodology is used to estimate carbon dioxide emissions from off-road transport and
construction equipment usage for each observed project.
An alternative method to calculating on-site transportation emissions is to directly calculate the
travel distances and number of trips for the hauling equipment using the site-specific location
data directly observed from site. The number of trips is determined from the total amount of
material placed on-site (from FieldManagerTM), and the capacity of the hauling equipment and
the design of the construction operation. Given the cycle times for driving operations (such as
mainline paving), the volume and the number of trucks in use, the distances travelled to and from
the batch plant, and the kind of hauling equipment used, the impacts associated with the
equipment use during the operation can be calculated. This is strictly a function of the site design
and operation logistics. Hot Mix Asphalt (HMA) hauling trucks were assumed to have a hauling
capacity of 28 Tons of HMA, and concrete hauling trucks were assumed to have a hauling
capacity of 10 cubic yards of concrete.
The following formula establishes the method used to calculate the total distances travelled on-
site for a particular scenario in which the batch plant location is placed at the Point of Beginning
(POB) of the pavement section, and trucks hauled the concrete back and forth to the points at
which it was placed. If the batch plant is located off-site, the additional distance to the POB of
pavement section must be added. Assuming there was only one truck equivalent in the placement
operation, the length of each truck trip was incremented by the distance that was paved by the
volume of concrete carried in the truck. The calculation formulates to an arithmetic progression
as follows:
D = [x x n x (n + 1)]/5280
Where D is the distance travelled on site in miles, x is the distance paved per truck trip in feet
and n is the total number of truck trips. The assumption of using a single truck to calculate the
number of truck trips is entirely reasonable, as we are not concerned about the duration of the
operation and are only interested in the distance travelled. The total distance travelled can be
used to estimate emissions using one of the various emission calculators described in this report.
Batch plant emissions were estimated using emission factors published in literature. The source
of the emission factors used can be found in the emission factors table (factors.xslx). Based on
the total tonnage of composite material manufactured in the batch plant, emissions were

34
estimated. Alternative technologies such as warm-mix asphalt (WMA) were not investigated in
this study.
The final process component to be analyzed is construction schedules. The motivation behind
analyzing construction schedules is to recognize that inefficiencies in the activity scheduling
process directly relate to increased construction site emissions. Inappropriate planning can result
in delays and rework that in turn increases equipment and material use, thus increasing the total
project emissions. Therefore, the as-planned schedule for a particular project that suffered
significant delays was compared to the as-built schedule, using information in FieldManager™,
to identify the impact of construction delays on construction emissions.
Equipment usage was estimated based on the number of working days and the assumption of a
10-hour working day. A combination of emission factors in the literature based, in process LCAs
and the Economic Input Output-Life Cycle Assessment (EIO-LCA), was used to estimate the
impacts of materials through the life cycle stages of extraction/mining, transportation, and
manufacturing (see list of all factors in factors.xlsx). When using EIO-LCA, material costs were
obtained through RS Means data [40] and then converted to 2002 dollar using applicable cost
indexes. When using SimaPro, the direct weight of the materials used was considered as inputs.
When assessing equipment emissions, the working days from both as-planned and as-built
schedules were identified to establish extra equipment use. The make, model, type, and
Horsepower characteristics of each type of equipment were identified using fleet information
provided from the contractor. Using the following equation, the emissions were estimated for
each activity’s controlling equipment type.
Emissions = Ot x HP x CF x ε
Where Ot = Operating time factor, HP =Rated Horespower, CF = Fuel Consumption Rate
(Gal/(HP*hr), and ε = emission rate (lbs CO2/Gal)
The following assumptions were made:
Opertaing Time Factor was assumed to be 45 minutes/hr (0.75)
Working Day = 10 hours
Fuel Consumtion Rate = 0.04 Gal/(Hp*hr) (Peurifoy and Oberlender 2002)
Emission Rate = 22lbs CO2/Gallon [52]

35
4.4.3. Service Component GHG Emissions
Service component emissions were estimated in two ways:
Assessment of pavement performance data to estimate the actual pavement maintenance
schedules, that define the service life of the pavement
Estimation of vehicle emissions by simulating and modeling vehicle-use scenarios using
EPA MOVES model
In the performance based approach, the pavement use phase is defined by outlining the various
preventative maintenance strategies that are implemented throughout the life of the highway
section. Rehabilitation options are highlighted in MDOTs capital preventative maintenance
(CPM) manual [53], however, the time at which these options occur is not explicitly stated. In
order to maintain the project-based perspective of this LCA application and account for regional
variations in pavement performance, it is suggested that maintenance schedules be based on
historical performance of the pavement sections. This involves investigating historical pavement
condition data to determine when rehabilitation strategies are being carried out. MDOT uses the
Distress Index (DI) parameter to assess a pavement section’s condition. It is a measure of the
cracking distresses influencing the pavement’s condition. This analysis can prove to be very
beneficial in developing regional maintenance schedules that can be used as a guide to assess the
environmental impacts of the maintenance phase of the LCA. Additionally, analysis like this can
provide the essential timelines needed to define life cycle periods used in LCA. Performance
based approaches like these, promise to further the investigation of context sensitivity regarding
the GHG emissions of highway construction and maintenance operations.
The use phase of the project consists of estimating the CO2 equivalent emissions associated with
different on-road vehicular traffic on the highway sections. This is done using the EPA’s current
official model for estimating air pollution emissions from motor vehicles under different traffic
scenarios, MOVES2010a (Motor Vehicle Emission Simulator) [35]. This tool replaces the
previous EPA official estimator, MOBILE6. MOVES is used for estimating emissions from
motor vehicles at the national, county, and project scale. For this study, MOVES is used to
estimate CO2 equivalent at the project scale. The project parameters are based on actual MDOT
project information. The project scale allows for more detailed input parameters to be analyzed,
which consequently creates a more accurate emission estimation of the particular roadway. The
36
parameters used are specific sections of highway with unique attributes such as road type, length,
speed, average daily traffic (ADT), and meteorology. At the project level, all of these specific
parameters are inputs into the MOVES database.
Two projects were evaluated using MOVES. The first project was US-41, which is a two lane
major collector road located in Northern Michigan in Marquette County. This road type is
classified in MOVES as a type 3 road, which is a rural unrestricted access roadway. The second
project was I-69, which is an expressway located in southeast Lower Michigan in both Genesee
and Lapeer County. This road type is classified as a type 2 road, which is a rural restricted
access roadway. These projects were both actual MDOT road construction projects. The inputs
for the project level analysis were very specific. They describe the unique project parameters.
The inputs are fuel supply and fuel formulation, local meteorology, including temperature and
relative humidity, vehicle/source type fraction for vehicle miles travelled (VMT), vehicle
population fraction, traffic speed, project length, road grade, ADT, and the driving schedule
(traffic maintenance schedules during a maintenance scenario).
The fuel supply and formulation data was a default input generated from the MOVES database.
This data includes very specific information regarding the physical makeup and market share of
gasoline and diesel fuel, explanation of which goes beyond the scope of this study.
The climate data includes the temperature and relative humidity for a typical day in a month
incremented by one hour. Each of these one-hour meteorology snapshots is specific to the
county that is selected in the MOVES graphical user interface (GUI). MOVES also provides this
detailed data within its database. Therefore the default data was used.
The vehicle type fraction data is the fraction of VMT that each vehicle type can be assigned. The
user is required to assign fractions to each MOVES-specific vehicle type using the particular
roadway. These fractions can be defined monthly, type of day or hourly. For this study an
average fraction was assumed for each of the two road types. MOVES allows vehicle type
fraction information to be imported from Highway Performance Monitoring System (HPMS).
HPMS is a national level database maintained by FHWA detailing information about “ the extent,
condition, performance, use and operating characteristics of the nation's highway”
(http://www.fhwa.dot.gov/policyinformation/hpms.cfm). The information for HPMS vehicle
class fraction was found at the Office of Transportation Data for the Georgia Department of

37
Transportation, for vehicle classes 1, 2, and 3, for each specific road type [54]. For the heavy
truck classes 4 through 13, the default traffic fractions from the (Mechanistic-Empirical
Pavement Design Guide) ME-PDG program were used. The choice of ME-PDG is based on its
wide acceptance and general reliability as a pavement design tool. These fractions were
combined using the assumed fraction that 15% of the total traffic is heavy trucks. These fractions
had to be reclassified in order to conform to the MOVES required source type. The HPMS
vehicle classes were grouped into the MOVES source types. Some were matched directly, like
motorcycles, while some MOVES source types contained multiple HPMS vehicle classes such as
combination long haul trucks. The HPMS classes were fractioned and added up according to the
MOVES source type they mapped on to. Table 4-2 outlines the vehicle type fraction data that
was used from HPMS and input into MOVES to characterize the traffic in the simulation.
Table 4-2: Source Type Fraction Methodology sourceTypeID sourceTypeName HPMS Vehicle Class HPMSVtypeID HPMSVtypeName
11 Motorcycle 1 10 Motorcycles 21 Passenger Car 2 20 Passenger Cars 31 Passenger Truck 3 30 Other 2 axle-‐4 tire vehicles 32 Light Commercial Truck 3 30 Other 2 axle-‐4 tire vehicles 41 Intercity Bus 4 40 Buses 42 Transit Bus 4 40 Buses 43 School Bus 4 40 Buses 51 Refuse Truck 6 50 Single Unit Trucks 52 Single Unit Short-‐haul Truck 5,6,7 50 Single Unit Trucks 53 Single Unit Long-‐haul Truck 5,6,7 50 Single Unit Trucks 54 Motor Home 5 50 Single Unit Trucks 61 Combination Short-‐haul
8,9,10,11,12,13 60 Combination Trucks
HPMS Class Source Types Variable for fraction
Source Type Equation
1 11 x1 11= x1 2 21 x2 21= x2 3 31,32 x3 31= x3/2 4 41,42,43 x4 32= x3/2 5 52,53,54 x5 41= not used in rural 6 51,52,53 x6 42= not used in rural 7 52,53 x7 43= x4 8 61,62 x8 51= x6/3 9 61,63 x9 52= x5/3+x6/3+x7/2 10 61,64 x10 53= x5/3+x6/3+x7/2 11 61,65 x11 54= x5/3 12 61,66 x12 61= (x8+x9+x10+x11+x12+x13)/2 13 61,67 x13 62= (x8+x9+x10+x11+x12+x13)/2
MOVES inputs must sum to 1
The variable fractions are uniformly distributed. For example, x4 indicates the fraction of traffic
that belongs to HPMS class 4, which consists of vehicle source types 41, 42 and 43. As vehicle

38
types 41 and 42 are not considered for rural scenarios, their representation in x4 is null. Hence,
the fraction x4 is representative only of vehicle source type 43. Similarly, the vehicle source
types 31 and 32 are represented equally in the fraction x3, which represents HPMS vehicle type
3. Therefore, the representative variable for 31 and 32 is x3/2. Intercity and transit busses were
not factored into MOVES because they were assumed to not drive on rural roads or rural
highways.
The vehicle age distribution is the fraction of vehicles on the road by how old they are for each
of the MOVES source types. MOVES ranges from 0 to 30, new to 30+ years old respectively.
This information was found at the EPA website as a default input [55]. The data was modified
slightly to reflect the fraction of cars by age, which is a required input in MOVES, rather than the
total number of cars by age.
The most crucial input into MOVES is the link input. This describes the project specifics, like
road length, average speed, ADT, and percent grade. The length (in miles from POB to POE) of
the projects were determined from project descriptions from MDOT, this is in miles from
beginning to end. The average speed was assumed to be the permanent speed limit set on the
road. The ADT was found at the MDOT website and is specific to each section of road [56].
This data was averaged if there were more than one ADT given on a single section of road. The
ADT was broken down by the hour. For simplicity, the ADT was fractioned equally between all
24 hours of the day. This becomes the average hourly traffic. The percent grade of the road for a
particular project was calculated from a website that uses the elevation of two user-chosen points
on a map [57]. The points used for these projects were the start and end of the particular project.
When determining the emissions from daily traffic during a construction or maintenance
scenario, additional driving schedule information was used. The driving schedule reflects traffic
management in a construction work zone, particularly the change in traffic speed as vehicles
enter and exit a work zone. It was assumed that for the unrestricted road type a typical vehicle
will come to a stop from 55 mph, and remain stopped for 10 minutes, (600 seconds - maximum
allowable by MDOT), then speed up to the reduced speed through the construction zone
(assumed to be 45 mph), and finally accelerate to a normal driving speed of 55 mph. A
maintenance period driving schedule for a restricted road consists of all vehicles slowing down
from 70 mph to 60 mph. For simplicity, the acceleration and deceleration of traffic was assumed

39
constant. The second by second data was calculated using the following formulae for constant
acceleration (based on time and distance respectively).
a = [vf - vi] /t & a = [vf - vi] [vf - vi]/ [2 x d]
Where a = acceleration, vf = final velocity, vi = initial velocity, d = distance, and t = time. Each
section where there is a change in driving pattern (due to the work zone) is considered to be a
new “link” in the roadway. These had to be input as separate links in the link table as well.
Each link had to be given a new average speed based on the acceleration, and a new length,
which was calculated from the acceleration formula to solve for distance. The following table is
an example of the driving schedule table and link table.
Table 4-3: Driving Schedule Table linkID secondID speed grade
1 1 55.00 0 1 2 50.97 0 1 3 46.93 0 1 4 42.90 0 1 5 38.87 0 1 6 34.83 0 1 7 30.80 0 1 8 26.77 0 1 9 22.73 0 1 10 18.70 0 1 11 14.67 0 1 12 10.63 0 1 13 6.60 0 1 14 2.57 0 1 15 0.00 0 2 1 0.00 0 2 600 0.00 0 3 1 0.00 0 3 2 3.75 0 3 3 7.50 0 3 4 11.25 0 3 5 15.00 0 3 6 18.75 0 3 7 22.50 0 3 8 26.25 0 3 9 30.00 0 3 10 33.75 0 3 11 37.50 0 3 12 41.25 0 3 13 45.00 0 5 1 45.00 0 5 2 47.00 0 5 3 49.00 0 5 4 51.00 0 5 5 53.00 0 5 6 55.00 0

40
Table 4-4: Link Table linkID countyID zoneID roadTypeID linkLength linkVolume linkAvgSpeed linkDescription linkAvgGrade
1 26103 261030 3 0.10417 125 26.86 55-0 0% 2 26103 261030 3 0.00000 125 0 stopped 0% 3 26103 261030 3 0.07500 125 22.5 0-45 0% 4 26103 261030 3 2.77139 125 45 drive through project 0% 5 26103 261030 3 0.06944 125 50 45-55 0%
MDOT’s project plans specify the distance before the work zone where a speed reduction sign is
located. This distance D, was used to account for the deceleration of the vehicle as it approached
the work zone [58]. This distance varied with the speed limit of the road. The time values,
when used, were estimated based on driving experience.
Once the data was estimated using MOVES, it was put together into a spreadsheet to be analyzed
and made useful. All the hours in a month were summed to form a typical days worth of CO2
equivalent emission. Then each of these typical days in a month were multiplied by the number
of days in the particular month and summed to estimate a typical year (typical Jan
day*31+typical Feb day*28.25+…+typical Dec day*31). This total represents the total CO2
emissions on a specific section of highway for one year. To calculate emissions for an average
day, the total was divided by the number of days in a year, 365.25. This total annual emission
can then be represented as a metric by fractioning the average emissions per day by the length of
the project and the ADT of the project. The units for this emission metric are Metric Tons of
CO2e/day/mile/1000 vehicles. This provides a functional unit for considering the emissions
during the service life of pavements with equivalent functionality, as defined by traffic volume.
Throughout the life cycle of the road, the total emissions were estimated using a 1% growth in
ADT each year [58]. This growth factor for ADT directly correlates to the emission output and
was backed up by a sample MOVES run at the national scale over a period of 20 years. The
trend in the yearly data of this set was growing at slightly over 1.07%. This result justified the
assumption of 1% growth in emissions per year.
4.5. Functional Units and Metrics
The functional unit ‘emissions per lane mile’ has been used widely in the literature. However,
this unit has various limitations – most importantly, it does not scale in any uniform fashion as
the number of lane miles increase. One reason is that the length of shoulder does not increase in

41
the same way as the number of lane miles increase. In addition, there is an impact of statistical
smoothening as the denominator increases. Therefore, for the sake of this study, it is not suitable
as the only functional unit, as the proposed framework accounts for multiple pavement
functionalities. The functionalities include:
1. Product performance, e.g. differences in emissions of alternative and/or recycled
materials compared to virgin materials
2. Process performance, e.g. savings in emissions through appropriate construction site
layout, schedule and operation design.
3. Services performance, e.g. increased emissions due to construction zone delays, and
emissions for different maintenance schedules and pavement life cycles.
In addition, it is important to note that while this framework is inspired by LCA approaches, its
aim is not to compare products and processes – but to instead provide decision-support to
strategically reduce GHG emissions for each of these functionalities. Hence, most of the units
discussed in this section are intended to be decision metrics rather than pure functional units.
Therefore, the choice of an appropriate functional unit/metric depends on the decision being
considered. Broadly, the following functional units were considered:
1. Product Component: Project level perspective
a. Average CO2 equivalents per 100 MT of concretic and asphaltic materials (see
explanation later)
b. Average overall CO2 equivalents per MDOT material specifications as defined in
Division 9, reported per lane mile
c. Average overall CO2 equivalents per construction category (e.g. drainage, earthwork)
per lane mile
d. Equipment manufacturing and upstream fuel production emissions per lane mile
e. Transportation emissions of raw materials to site per lane mile
2. Process Component: All emissions expressed per working day of project – Construction
activity/schedule level perspective
a. Composite materials production on site (e.g. batch plant emissions)
b. Secondary materials processing on site (e.g. RCA, RAP)
c. Emissions due to delays in construction schedule

42
d. Emissions related to construction operation design
3. Service Component: Project/Network level
a. CO2 equivalent emissions expressed in units of vehicle emissions per day per mile,
where one unit of vehicle emissions per day per mile, is the daily emission (in MT)
associated with a mile length of a highway section with Average Annual Daily
Traffic of 1000. The emissions for a given highway section over a period can be
derived by multiplying the metric, by the Average Annual Daily Traffic and period
being considered.
b. Integrative life cycle emissions of a highway section per lane mile considering all the
components and phases.
It is important to note that all the units discussed above are incomplete and must be taken as a
whole. Strictly speaking, they should not be used to compare processes and materials. Rather,
they should be used as metrics to establish benchmarks for representative project types and
highway sections. In turn, these can be used as baselines to support decision-making and
continuously reduce GHG emissions and increase efficiency.
Of the above metrics, the ones that were specifically investigated and developed were 1a, 3a and
3b. In both these cases, a calculated metric was derived as discussed next.
4.5.1. Average CO2 Equivalents per 100 MT of Concretic and Asphaltic
Materials
This metric has been derived from a measure developed by ICF International Inc., as part of a
recent study investigating GHG mitigation measures in Transportation Construction [15]. It
expresses the material emissions per 100 MT of concretic or asphaltic materials. The definition
of concretic and asphaltic materials is as follows. Concretic Material Emissions are defined as
the emissions from the concretic materials - cement, aggregate, fly ash, sand, steel, and curing
compound - that go into a 15ft. long by 12ft. wide by 11in. deep concrete panel that has 10 dowel
bars spaced 12in. on center, and 6 tie bars spaced 30in. on center (As illustrated in Figure 4-1).
The concrete unit weight mix design and the weight of materials for such a panel are illustrated
in Table 4-5 and Table 4-7. The emissions from this panel were calculated to be 1.5417 MT of
CO2 equivalents per panel or 13.88 MT of CO2 per 100 MT of concretic materials. This

43
compares with GreenDOT’s metric of 15.484 MT of CO2 per 100 MT of concretic materials.
Asphaltic Material Emissions are defined as the emissions from asphaltic materials – binder,
aggregate, sand, RAP, and bond coat – that go into a 15ft. long by 12ft. wide by 12in. deep
asphalt panel (As illustrated in Figure 4-2). The HMA unit weight mix design and the weight of
materials for such a panel is illustrated in Table 4-6 and Table 4-8. The emissions from this panel
were calculated to be 0.1532 MT of CO2 equivalents per panel or 1.294 MT of CO2 per 100 MT
of asphaltic materials. This does not compare with GreenDOT’s metric of 7.325 MT of CO2 per
100 MT of asphaltic materials.
It is important to note that the terms ‘concretic’ and ‘asphaltic’ are being used on purpose and are
not to be confused with ‘concrete’ and ‘asphalt’. The terms represent a conglomerate of materials
based on the definition of the standard pavement panels. Therefore, they are representative of
emissions associated with 100 MT of such a panel. The pavement material bulk is then expressed
as a function of such panels. For example a project with 500 MT of asphaltic materials could be
compared to five 100 MT of a typical asphaltic panels as described. It is important to note that
most major projects (and this is evident in a later section) can be expressed as a combination of
asphaltic and concretic panels. The choice of this unit is to develop a standard reference that all
project materials can be expressed as – thus providing the ability to compare the emissions of
different projects, rather than compare the emissions of different pavement types.
Table 4-5: Concrete Unit Weight Mix Design Concrete Unit Weight Mix Design/Cyd of Concrete
*Unit/Cyd of Concrete
% of Mix by Weight
Emission Factor
Unit
Cement *(Ton) 0.240 12.037 8.42E-01 MT/Ton Aggregate *(Ton) 0.951 47.758 6.16E-03 MT/Ton Sand *(Cyd) 0.376 30.554 1.08E-04 MT/Cyd Fly Ash *(Ton) 0.042 2.124 1.78E-02 MT/Ton Water *(Ton) 0.150 7.527 NA (0.45 W/C Ratio) (Unit Weight: 1.9914 Tons Concrete/Cyd Concrete) Overall Emissions (MT CO2)/ Cyd of Concrete
2.08E-01

44
Table 4-6: HMA Unit Weight Mix Design
HMA Unit Weight Mix Design/ Ton of HMA
*Unit/Ton of HMA
% of Mix by Weight
Emission Factor
Unit
Binder *(Ton) 0.053 5.32 1.57E-01 MT/Ton Aggregate *(Ton) 0.331 33.14 6.16E-03 MT/Ton Sand *(Cyd) 0.292 47.34 1.08E-04 MT/Cyd RAP *(Ton) 0.142 14.20 4.92E-03 MT/Ton Overall Emissions (MT CO2)/ Ton of HMA
1.11E-02
Table 4-7: Concrete Panel Mix Design Concrete Panel Mix Design
Component Weight/Volume Unit
Emission Factor Unit
Cement 1.722 Tons 8.42E-01 MT/Ton Course Agg 5.806 Tons 6.16E-03 MT/Ton Fine Agg 2.293 Cyds 1.08E-04 MT/Cyd Steel 0.085 Tons 5.20E-01 MT/Ton Curing Compound 0.720 Gallons ($18.30/Gal) 0.96 MT/$1000 Equivalent to 6.105 Cyds and Approximately 12.242 Tons (11.105 MT) *Sand = 120 pcf Overall Emissions (MT CO2)/Panel 1.5417 Overall Emissions (MT CO2)/100MT 13.880
Table 4-8: HMA Panel Mix Design HMA Panel Mix Design
Component Weight/Volume Unit
Emission Factor Unit
Binder 0.694 Tons 1.57E-01 MT/Ton Aggregate 4.325 Tons 6.16E-03 MT/Ton Sand 3.814 Cyds 1.08E-04 MT/Cyd RAP 1.853 Tons 4.92E-03 MT/Ton Bond Coat 0.800 Gallons ($6.90/Gal) 1.45 MT/$1000 Equivalent to 13.05 Tons (11.838 MT) HMA *Sand = 120 pcf Overall Emissions (MT CO2)/Panel 0.1532 Overall Emissions (MT CO2)/100MT 1.294
The Society of Environmental Toxicology and Chemistry (SETAC) guidelines for conducting a
LCA, states that if the material comprises less than 1% of the total product, it can be neglected in

45
the LCA [59]. Therefore, concrete admixtures such as air entrainer and set modifier, along with
HMA additives, have been omitted from this calculation.
These emissions are estimated from the panel designs and can be compared to the metrics
provided in a recent National Cooperative Highway Research Program (NCHRP – GreenDOT)
study [15]. The metric for the concretic materials is comparable. However, the discrepancies in
the metric for asphaltic materials are due to choices of emission metrics used as described below:
1. Aggregate Factor:
a. Used in this research: 0.00616 MT CO2/MT
b. Used in NCHRP Study: 0.012 MT CO2/MT
2. Binder factor:
a. Used in this research: 0.157 MT CO2/MT
b. Used in NCHRP Study: 1.237 MT CO2/MT
These emissions factors were used because there is precedence of their use in other credible LCA
studies [38, 39].
4.5.2. CO2 Equivalent Emissions of On-Road Vehicular Traffic
CO2 emission equivalents were estimated using a metric derived in the vehicle use scenarios
modeled in MOVES. The metric used was MT of CO2 emissions/day/mile/1000 vehicles – its
calculation has been explained in a previous section.
4.5.3. Life Cycle CO2 Equivalent Emissions
Life cycle GHG emissions can be estimated by summing all product, process, and service
components described earlier in this section. The life cycle components for an analysis period of
N can be summarized as follows:
1. Construction emissions (includes product and process emissions plus the emissions due
to traffic delays).
2. Maintenance emissions (includes product and process emissions plus the emissions due
to traffic delays). Total number of maintenance emissions is equal to the number of
interventions over the analysis period. The number and timing of the maintenance
operations can be estimated from the highway historical performance.

46
3. Total service phase emissions (includes the emissions resulting from on-road vehicular
traffic) as estimated using the MOVES simulator.
Sum of each of the above components provides the gross emissions, E for the pavement section
over the entire time horizon of N years. The relevant metric is the equivalent uniform annualized
emissions expressed the same way as the equivalent uniform annualized cost is in a lifecycle cost
analysis.
Figure 4-1: Concrete Panel Design

47
Figure 4-2: HMA Panel Design

48
5. FRAMEWORK IMPLEMENTATION
This chapter illustrates the implementation of the project based LCA framework involving the
following steps for each project surveyed:
1. Visits to assess project location and collect information such as position of batch plant
2. Meeting with contractors, project managers and MDOT inspectors to communicate the
purpose of the project and solicit help with recording equipment use information
For all the projects the following steps were conducted:
1. Product and process data as described in Chapter 4 were remotely accessed from
InfoTech’s database and organized into a working schema on the Michigan Tech
University server
2. Material and equipment use inventories (record of all equipment and material usage and
relevant construction site data) were developed
3. The emission factors as explained and documented in Chapter 4 were used to calculate
the emissions for product and process components for each of the projects
4. The functional metrics as defined in Chapter 4 were calculated for each project
This chapter describes the data collection, and organization process, followed by an explanation
of the tool called Project Emission Estimator or PE-2 that can be used as a decision-support
system for benchmarking future projects.
Each of the projects was classified into four categories: New construction/ major construction
(R1), Reconstruction (R2), Major rehabilitation (M1), Rehabilitation (M2); based on size and
type of the project. The projects that were investigated in this study are [60]:
1. Project number 11056-50757 (R1): 3.27 mi of road reconstruction, ramps, culverts and
permanent traffic recorders on US-31 northbound and southbound from the Michigan state
line northerly to US-12, Berrien County. Alternate 1 is hot mix asphalt road reconstruction
and related items and Alternate 2 is concrete road reconstruction and related items. The State
DOT invited bids for the reconstruction on two alternative pavement designs: one using

49
HMA and the other using concrete. The project was awarded to a bid that had the lowest life
cycle cost, which in the competitive bidding process was the HMA design.
2. Project number 03033-75215 (R2): 6.94 mi of concrete overlay rehabilitation, pavement
removal, concrete pavement reconstruction, culvert replacements, signing,
pavement markings, median cable barrier installation, rest area demolition and construction,
landscaping, concrete deck overlay, and railing replacement on I-196 from 71st Street
northerly to 118th Avenue and on I-196 over 71st Street, Allegan County.
3. Project number 44043-79776 (R1): 10.14 mi of concrete pavement and shoulder
reconstruction, guardrail and drainage improvements, and bridge rehabilitation of 12 bridges
on I-69 from east of M-15 easterly to east of M-24, Genesee and Lapeer Counties.
4. Project number 05071-79647 (R2): 3.00 mi of crack relief, asphalt crack relief layer,
reconstruction, crushing and shaping with hot mix asphalt widening, miscellaneous drainage,
safety improvements, decorative sidewalk, decorative lights, and tree planting on US-131
from Elder Road northerly to M-66 and from north of Dale Avenue to south of Division
Street in the village of Mancelona, Antrim County.
5. Project number 52041-80145 (R1): 3.02 mi of roadway reconstruction and realignment,
drainage improvements, guardrail upgrading, and pavement markings on US-41/M-28 from
Brown Road westerly to the Marquette/Baraga County line, Marquette County.
6. Project number 55011-84193 (R1): 2.02 mi of street reconstruction including excavation, hot
mix asphalt pavement, concrete curb and gutter, sidewalk, storm sewer, sanitary sewer, water
main, traffic signals, permanent signing, pavement marking, and restoration on US-41 from
20th Avenue northerly to 48th Avenue in the city of Menominee, Menominee County. (Data
collected from Yr 1 of 2)
7. Project number 56021-105611 (M1): 4.16 mi of hot mix asphalt cold milling and overlay,
joint repairs, shoulder upgrades behind the existing curb and gutter, sidewalk ramp upgrades,
and other miscellaneous work on M-20 from west of Meridian Road easterly to east of Vance
Road, Midland County.
8. Project number 41031-105479 (M1): 0.81 mi of full depth concrete pavement joint and crack
repairs on M-37 (Broadmoor Avenue) from north of 60th Street northwesterly to south of
52nd Street, in the city of Kentwood, Kent County.

50
9. Project number 51021-106248 (M1): 6.83 mi of hot mix asphalt cold milling and resurfacing
on M-55 from west of Udell Hills Road to west of Cooley Bridge, Manistee County.
10. Project number 02041-106939 (M1): 4.63 mi of concrete pavement repairs, hot mix asphalt
cold milling and resurfacing, drainage structure repairs and sidewalk ramps on M-28 from
east of Center Street easterly to west of the Anna River bridge, in city of Munising, Alger
County.
11. Project number 51012-106238 (M2): 4.35 mi of overband crack filling, micro surfacing,
centerline and shoulder corrugations, and pavement markings on US-31 from north of US-10
to south of Hansen Road and from north of M-55 to south of M-22, Mason and Manistee
Counties.
12. Project number 11112-106504 (M2): 8.63 mi of transverse and longitudinal joint resealing
with isolated transverse crack sealing on US-31 northbound and southbound
from M-139 to Napier Avenue, Berrien County.
13. Project number 37014-106474 (M2): 12.76 mi of crack treatment and single course micro
surfacing on US-127 from River Road northerly to the Isabella/Clare County line, Isabella
County.
14. Project number 83033-106529 (M2): 7.10 mi of overband crack filling and single course
micro surfacing on US-131 northbound and southbound from south of Boon Road
northerly to south of Old US-131, Wexford County.
For each of the projects the data was collected for product and process components as described
in Chapter 4 and organized in a database server that is hosted on a web server at Michigan Tech
University. A web-based tool the PE-2 was developed to provide an interface to querying the
data and directly accessing all the calculated metrics.
5.1. Project Emissions Estimator (PE-2)
PE-2 is an interactive web-based service that was developed primarily using PHP: Hypertext
Preprocessor (PHP) – a general purpose scripting language that is interpreted by a web server
and used to dynamically generate web pages. PE-2 also uses Ajax technology - a combination of
Javascript, CSS and HTML that create interactive web pages - to support a user-friendly
interface primarily designed for contractors and agency decision-makers.
51
The PE-2 tool can be accessed at http://www.construction.mtu.edu:8000/cass_reports/webpage/.
The goal of the PE-2 tool is two-fold:
1. Inventory Reporting: The PHP code queries the data server and calculates the GHG
emissions using the methodology described in Chapter 4. Hence, the user can choose a
project, the PE-2 tool queries all relevant product and process data that was collected and
dynamically creates a report for the particular project. The functional metrics are reported
for each project as well.
2. Benchmarking & Estimating: The PE-2 web service provides an interactive web interface
for decision-makers and contractors to aid them in benchmarking their projects. It uses
the same methods used in calculating the emissions for the projects studied, as explained
in Chapter 4. However, it allows the user to provide the input through an easy to use
interface. The input consists of materials and respective quantities, and the type, number
and hours of estimated equipment usage (product and process). To make the interface
easy to use, the user can choose the materials and equipment from a predefined list. In
addition, the material list in the drop-down menu is classified by MDOT pay-item
specifications to allow for easy navigation. The estimator tool also allows users to
benchmark equivalent annualized emissions for a project by providing traffic
characteristics and an expected maintenance schedule. It uses benchmark values for
emissions of construction, reconstruction and maintenance operations based on the
surveyed 14 projects and the estimated emission metrics for the project section given the
simulated trends from the MOVES simulator.
The PE-2 interface has four main tabs with the following functionalities:
1. Home: Introduction to the project and the purpose of the tool (See Figure 5-1).
2. Methodology: Introduction to the underlying methodology.
3. Inventory: This is the inventory reporting interface. It provides a summary of the product
and process emissions calculated. For each project a report is generated (See Figure 5-2).
4. Estimator: This is the estimator interface and has three components to it:
a. The materials estimator: Figure 5-3 illustrates the interface that allows users to
add materials to a list by choosing the material from a list of items classified by
pay-item divisions specified by MDOT. As the list builds, the summation button

52
at the bottom of the page sums up the total emissions and the page can be printed
off as a report.
b. The equipment estimator: Figure 5-4 illustrates the interface that allows users to
add number of equipment and number of hours of estimated usage, to a list by
choosing the equipment from a list of classified by the activities that typically the
items are associated with. As the list builds, the summation button at the bottom
of the page sums up the total emissions and the page can be printed off as a report.
c. The life cycle estimator: Figure 5-4 illustrates the interface that allows users to
input project traffic characteristics and progressively build a construction and
maintenance schedule to estimate the expected life cycle emissions. An example
has been illustrated later in the chapter.
Figure 5-1: PE-2 Homepage

53
Figure 5-2: Project Inventory Report

54
Figure 5-3: Material Impact Estimator
Figure 5-4: Equipment Impact Estimator
Figure 5-5: Life Cycle Impact Estimator

55
5.2. Inventory Assessment
This section outlines the general results that were observed from an assessment of the project
emissions data. This section investigates the metrics described in Chapter 4 under the following
categories:
Product Emissions: Primarily focusing on materials used in construction projects.
Process Emissions: Primarily focusing on construction operations common to most
highway projects.
Service Emissions: Primarily focusing on emissions during the service life of the
pavement dependent on maintenance scheduling and vehicular traffic emissions.
5.2.1. Product Emissions
The product emissions can be classified into the following categories:
The concretic material tonnage was calculated by summing all the material used for work
in MDOT sections 901, 903, 905, 914, 915 and total tonnage of concrete in any other
section (this is usually extremely small). The emissions observed for this material cluster
was divided by the total tonnage for the cluster and multiplied by 100 to produce the
observed emissions per 100 MT of concretic material, and compared with the theoretical
value calculated in section 4.5.1, uconc = 13.88 MT per 100 MT.
The asphaltic material tonnage was calculated by summing all the material used for work
in MDOT section 904 and all volumes of HMA. The emissions observed for this material
cluster was divided by the total tonnage for the cluster and multiplied by 100 to produce
the observed emissions per 100 MT of asphaltic material, and compared with the
theoretical value calculated in section 4.5.1, uasp = 1.294 MT per 100 MT.
The earthwork emissions were calculated by summing emissions from the material used
for work in MDOT sections 902, 910, 916 and 917.
The drainage emissions were calculated by summing emissions from the material used
for work in MDOT sections 909 and 913.
Materials in all other sections in division 9 were classified as miscellaneous.

56
The purpose of breaking up total project emissions into these categories is to create a metric that
can be used to benchmark material emissions, instead of comparing one material/pavement type
to another. Hence, major concrete pavement reconstruction projects had HMA use and vice
versa. For all the observed projects the values were calculated as follows:
Table 5-1: Total Emissions in MT of CO2 Equivalents
Type Job Concretic Asphaltic Earthwork Drainage Misc Total Lane Miles
M1 Concrete Patch Repairs and HMA Resurfacing 302.62 11.5 0 0 31.91 346.02 9.26
M1 Full Depth Concrete Pavt Joint and Crack Repairs 186.24 0 0 0 72.7 258.94 3.24
M1 HMA Cold Milling and Resurfacing 0 141.11 8.41 0 103.23 252.76 13.66
M1 HMA Cold Milling and Overlay 36.81 208.12 66.36 0.36 38.63 350.28 16.64
M2 Transverse and Long. Joint Cutting and Resealing (Conc.) 72.21 0 0 0 53.01 125.22 34.52
M2 Microsurface 38.31 2592.9 69.5 93.22 174.27 2968.2 51.04
M2 Overband Crack filling and Micro surface 25.64 227.2 7.71 0 34.68 295.23 8.7
M2 Overband Crack Seal and Microsurface 11.84 296.35 9.09 0 50.14 367.41 28.4
R1 HMA Reconstruct 97.86 1163.95 214.93 404.01 587.64 2467.57 13.08
R1 Concrete Reconstruct 32812.81 300.03 2066.04 864.85 1544.06 37587.79 40.56
R1 HMA Reconstruct and Roadway Realignment 36.21 251.71 283.92 374.16 275.78 1221.78 6.04
R1 Road Reconstruction HMA and Concrete 571.75 171.07 121.82 1139.36 59.58 2063.59 4.4
R2 Unbonded Concrete Overlay 18634.75 685.49 850.67 1089.18 1936.14 23196.24 27.76
R2 Asphalt Crack Relief Layer; Reconstruction; Crush and Shape 331.16 308.92 143.38 198.29 46.85 1028.58 6
The values presented in Table 5-1, show that for construction and reconstruction projects (R1
and R2) all the different material categories are well represented. For the maintenance projects,
(M1 ad M2) the type of project influenced the distribution of emissions in each of the categories.
It is important to reiterate that the emissions for concretic and asphaltic materials categories are
representative of a particular collection of materials and should not be confused as a
comparison between with concrete and asphalt pavements. The metric that showed the most
significant trend was a measure of the emissions per 100 MT of concretic materials and asphaltic
materials as defined in section 4.5.1. Specifically, an important trend was noticed, in the
emissions per 100 MT of concretic material and asphaltic materials, across all the R1 and R2
projects, leading to the following notion:

57
The factors u’conc and u’asp, calculated from the observed data represents a consistent
metric across all projects, comparable to the theoretical estimates of uconc and uasp.
Where Econc and Easp are the emissions associated with concrete and asphalt materials
(as calculated from observed site data), and Mconc and Masp are the weights in MT of all
the concretic and asphaltic materials (as observed from site data), and
Econc x (1/ Mconc) = u’conc ; Easp x (1/ Masp) = u’asp
This notion could gain credibility if, the product of Econc and (1/Mconc) is constant across all
observed projects. The constant then would be equal to u’conc. Similarly, across all observed
projects, the product of Easp and (1/Masp) would be a constant and equal to u’asp.
Figure 5-6: 1/Masp (y-axis) vs. Easp (x-axis) for R1 and R2 projects
Figure 5-7: 1/Mconc (y-axis) vs. Econc (x-axis) for R1 and R2 projects
y = 0.014x-‐1.03 R² = 0.997
0 0.00001 0.00002 0.00003 0.00004 0.00005 0.00006 0.00007 0.00008
0 500 1000 1500
Asphal�c: R1 and R2
Asphal�c: R1 and R2
Power(Asphal�c: R1 and R2)
y = 0.123x-‐1.01 R² = 0.999
0
0.0005
0.001
0.0015
0.002
0.0025
0.003
0.0035
0.004
0 10000 20000 30000 40000
Concre�c: R1 and R2
Concre�c: R1 and R2
Power(Concre�c: R1 and R2)

58
Figure 5-8: 1/Masp (y-axis) vs. Easp (x-axis) for M1 and M2 projects
Figure 5-9: 1/Mconc (y-axis) vs. Econc (x-axis) for M1 and M2 projects Figures 5-1 through 5-4 illustrate the plots of 1/Mx versus Ex (x= concretic or asphaltic
materials), for the different project classifications (R1 and R2, and M1 and M2). As can be seen
from the regression models illustrated in Table 5-2, the observed metric validates the notion
described above. In addition, it is similar to the calculated metric thus further adding credibility
to the observation. This is a step towards establishing a metric to benchmark emissions for future
projects.
The exception is the case representing M1 and M2 projects involving concretic materials. This
may be possibly explained by the fact that the observed M1 and M2 projects were primarily
asphalt pavements and had very limited use of concretic materials. In general the reliable metrics
y = 0.015x-‐1.08 R² = 0.991
0
0.0002
0.0004
0.0006
0.0008
0.001
0.0012
0 500 1000 1500 2000 2500 3000
Asphal�c: M1 and M2
Asphal�c: M1 and M2
Power(Asphal�c: M1 and M2)
y = 4.780x-‐1.67 R² = 0.876
0 0.01 0.02 0.03 0.04 0.05 0.06 0.07 0.08 0.09
0 50 100 150 200 250 300 350
Concre�c: M1 and M2
Concre�c: M1 and M2
Power(Concre�c: M1 and M2)

59
are the observed and calculated values for concretic and asphaltic materials for R1 and R2
project types.
Table 5-2: Emission Regression Models (metrics expressed in MT of CO2 emissions/100 MT of material weight)
Project Type Material Type Regression Equation R2
Observed Metrics
Calculated Metrics
R1 and R2 Concretic material Econc1.008x (1/Mconc) = 0.1233 0.99989 u’conc = 12.33 uconc = 13.88
Asphaltic material Easp1.034 x (1/Masp) = 0.0146 0.99743 u’asp = 1.46 uasp = 1.296
M1 and M2 Concretic material Econc1.59x (1/Mconc) = 4.7805 0.87658 u’conc = 478.05 uconc = 13.88
Asphaltic material Easp1.089x (1/Masp) = 0.0159 0.99145 u’asp = 1.59 uasp = 1.296
It is important to reiterate that the purpose of this metric is not to compare asphalt and concrete
materials. The definitions of asphaltic and concretic materials are based on a clustering of
specific material sections in division 9 that contribute to asphalt and concrete pavement
construction respectively. The significance of the metric is that it can be used to estimate
emissions for new projects based on a material estimate. It is also very important to note that this
metric represents only emissions of materials in the pavement (product component) – and
therefore is a reflection of only part of the pavement life cycle emissions. It strictly accounts for
the cradle-to-gate emissions. The performance of a project and/or pavement accounts for
emissions from the process and service components as well.
5.2.2. Process Emissions
This section investigates the emission from construction operations and schedule delays on
construction sites. A particular project was studied in depth to illustrate how inefficiencies in
project planning and scheduling can increase project emissions. This analysis builds on the
method to collect and analyze construction project emissions data, and calculates the associated
GHG emissions by comparing the as-planned and as-built schedules. The purpose of this analysis
is to identify the impact of construction delays on project emissions. The delays often result from
unexpected circumstances that unfold during the project construction, that were not or could not
have been anticipated during the project planning process. It is expected that reduction in such
delays and rework can reduce additional resource usage – as compared to the as-planned
resource usage – thus increasing total project emissions. The following analysis investigates this

60
notion by comparing the emissions associated with the as-planned resource loaded schedule and
the as-built resource loaded schedule.
Data collected from FieldManager™ was used to develop the as-built observed schedule. The as-
planned schedule was developed using the progress schedule (MDOT Form 1130) that is
submitted by the contractors to MDOT project delivery engineers, before the construction start
date. Also used to develop the as-planned schedule was the project proposal’s engineering
estimate (bid tab). The progress schedule outlines construction activities along with proposed
starting and end dates for each activity. Driving activities, defining the actual construction of the
roadway were identified and used. Henceforth they are referred to as primary activities. These
activities were assigned a division of work and section number as defined in the Michigan
Department of Transportation’s (MDOT) Standard Specifications for Construction[48]. In
addition, a controlling pay item was identified to represent each activity. These primary activities
and controlling items were used to characterize the parameters in the schedule analysis.
It was necessary to identify primary activities and controlling items when assessing differences
in schedule performance because the scope of this analysis is to investigate GHG emissions
associated with the highway construction process in particular. The activities were chosen so that
they are representative of typical highway construction projects. Therefore, mainline paving
activities are considered as primary activities as they are common to all projects and variation in
them due to site conditions can be compared across projects. However, traffic control activities
were excluded, as there is limited data to support their inclusion.
The information from FieldManager™ was organized by tabulating the resources associated with
each controlling item installed for each of the primary activities for each day of the project. The
controlling item identification number (Pay Item #) identified in the as-planned schedule was
also used generate as-built information from FieldManager™. Information representing daily
activity and productivity information was analyzed. The controlling items were allocated to
working dates, an identification number, quantities installed and equipment used. The
importance of this data organization and classification is that it can be utilized to generate as-
built schedules automatically from FieldManager™ data.
The data collected through FieldManager™ and outlined in the progress schedule and engineer's
estimate was used to develop material and fuel inventories for the as-planned and as-built

61
schedules, which in turn can be used to calculate emissions from materials and equipment used
throughout the schedules. Using methodologies described in 4.4.1 & 4.4.2, emissions were
estimated comparing as-built and as-planned material consumption and equipment usage.
5.2.3. Process Emissions Case Study
The case study involved in this analysis was a ten mile concrete pavement re-construction project
(JN79776). Along the ten mile length of the job, pavement removal, earthwork and paving
operations were performed in sequence. The schedule analysis was conducted at the level of
primary activities – activities that are most critical to the construction project. For each of these
activities, a controlling work item was chosen – items that had the most impact. The primary
activities and associated controlling items is the major share of the project and therefore
indicative of the overall project performance. The primary activities and associated controlling
items identified were:
Primary Activity: Remove Concrete Pavement
o Controlling Item: Pavement Removal
Primary Activity: Grade Subbase
o Controlling Item: Station Grading
Primary Activity: Install Drainage
o Controlling Item: Underdrain Pipe
Primary Activity: Place Base Material
o Controlling Item: Geotextile Separator
Primary Activity: Pave Mainline
o Controlling Item: Non-reinforced Concrete
Figure 5-10 shows the as-planned schedule and as-built schedule production rates. The X-axis
represents the time and the Y-axis representing the cumulative completion percentages of each
activity. The analysis was done for only the eastbound mainline lanes of the project. When
calculating the as-planned resource loaded schedule the bid tab quantities were used. However,
the original bid tab quantities represent the entire project, not just mainline. Therefore, a ratio of

62
as-built mainline quantities to that of the total quantities (as calculated from FieldManagerTM
records) was calculated and applied to the bid tab quantities to calculate the as-planned
quantities.
For each activity, controlling equipment was identified. Controlling equipment is the equipment
that is crucial to the completion of the activity and likely to be the most important emitter. Each
activity was assigned controlling equipment, as follows:
Remove Concrete Pavement: Pavement Breaker
Grade Subbase: Grader
Install Drainage: Trencher
There was no equipment related to the primary activity of placing base material as the
related controlling item only required manual labor (4-man crew to place the geotextile
separator)
Pave Mainline: Concrete Pave
Figure 5-10: As-Planned vs. As-Built Schedule During the pavement removal operation, the agitation of the soil and the presence of heavy
equipment on site enhanced the capillary effect and caused ground water to flood the subgrade.
In addition, seasonal rains added to the flooding on site and impeded all operations. After the site

63
conditions were re-assessed, an undercut was excavated so that a geo-grid barrier could be
placed and the sub-grade reconstructed to avoid future incidents of flooding. This resulted in a
change order, involving the extra operations needed because of the unforeseen moisture problem
(as shown in Figure 5-10). In most cases, it is estimated that there is a 5-10% increase in project
costs [61] as result of most change orders - depending on work type, operations, and time.
Greater accuracy of preliminary design and estimation methods can reduce the impacts of change
orders. In this example, the unfortunate coincidence of the soil condition, and the consequences
of heavy equipment on unprepared ground, led to significant project delays as was reflected in
schedule delays and thus additional GHG emissions.
The investigation of how material consumption, equipment usage, and productivity of each
activity affects the overall project GHG emissions can lead to recommendations for the design
and management of the project. Table 5-3, Table 5-4, and Table 5-5 illustrate the differences
between as-planned and as-built quantities and emissions from controlling materials and
equipment. Figure 5-11, Figure 5-12, Figure 5-13, Figure 5-14, and Figure 5-15 compare the as-
planned and as-built emissions for each of the primary activities due to the differences in use of
the controlling pay-items and equipment.
Table 5-3: Quantity Comparison Virgin Material Consumption based on Controlling Item (Quantities)
AsPlanned AsBuilt Primary Activity
Controlling Item
Unit
Qty Qty
% Change
Remove Concrete Pavement
Pavment Removal
Syd 249065.99 185431.46 -25.55
Grade Subbase
Station Grading
Syd 448.67 519.32 15.75
Install Drainage
Underdrain Pipe
Ft 110007.45 107945.00 -1.87
Place Base Material
Geotextile Separator
Syd 213236.10 217750.15 2.12
Pave Mainline & Shoulder
Non-reinforced Concrete
Syd 217358.96 229876.19 5.76

64
Table 5-4: Controlling Item Emissions
Virgin Material Consumption based on Controlling Item (Emissions) AsPlanned AsBuilt Primary Activity Controlling
Item Unit
GHG Emissions (MTCO2eq)
GHG Emissions (MTCO2eq)
% Change
Remove Concrete Pavement
Pavment Removal
Syd ¹NA
Grade Subbase Station Grading
Syd ¹NA
Install Drainage Underdrain Pipe
Ft 45.0 44.1 -2.00
Place Base Material
Geotextile Separator
Syd 379 387 2.11
Pave Mainline & Shoulder
Non-reinforced Concrete
Syd 13600 14400 5.88
¹No consumption of virgin materials
Table 5-5: Controlling Equipment Emissions
Mainline Equipment Operations and Emissions based on Controlling Item As Planned
As Built
As Planned
As Built
Primary Activity
Equip Item Unit
# of days
# of days
GHG (MT)
GHG (MT)
% Diff
Remove Concrete Pavement
Pavement Breaker
Pavment Removal
Syd 15 24 5.66 9.06 60.00
Grade Subbase
Grader Station Grading
Syd 19 8 14.87 6.26 -57.89
Install Drainage
Trencher Under- drain Pipe
Ft 14 22 5.29 8.31 57.14
Place Base Material
¹NA Geo- textile Separator
Syd ¹NA
Pave Mainline & Shoulder
Concrete Paver
Non-reinforced Concrete
Syd 14 26 11.63 21.60 85.71
¹Geotextile Seperator placed by manual labor (4-man crew)

65
Figure 5-11: Pavement Removal Emissions
Figure 5-12: Grade Subbase Emissions
0
2
4
6
8
10
0 10 20 30 40
CO
2 E
mis
sion
s (to
nnes
)
Duration (Days)
Pavement Removal
AsPlanned AsBuilt
0 2 4 6 8
10 12 14 16
0 10 20 30 40
CO
2 E
mis
sion
s (to
nnes
)
Duration (Days)
Grade Subbase
AsPlanned AsBuilt

66
Figure 5-13: Install Drainage Emissions
Figure 5-14: Place Base Material Emissions
0
10
20
30
40
50
60
0 5 10 15 20 25 30 35
CO
2 E
mis
sion
s (to
nnes
)
Duration (Days)
Install Drainage
AsPlanned AsBuilt
0
100
200
300
400
500
0 5 10 15 20 25 30 35
CO
2 E
mis
sion
s (to
nnes
)
Duration (Days)
Place Base Material
AsPlanned AsBuilt

67
Figure 5-15: Pave Mainline Emissions For this particular case study, a comparison of the as-planned and as-built schedules shows a
significant increase in equipment use on site, resulting in 7.8 MT of extra CO2 emissions. The
impact of the extra materials used, as measured from their manufacturing phase, was
approximately 807 MT of CO2 emissions. The moisture problem encountered on site during the
pavement removal operation, along with the re-construction of the sub-grade and installation of
the geo-grid barrier, was largely responsible for the excess emissions. It is important to recognize
that the increased emission can be directly ascribed to the oversight during the planning phase.
Indeed, if the as-planned schedule had been realized, the extra emission could have been
avoided. It also indicates that efficient schedules with shorter durations and robust contingency
planning can go a long way in reducing project emissions without any monetary investment on
behalf of the contractor. Besides, it also highlights that increasing efficiency and reducing GHG
emissions of a highway construction project are aligned goals and beneficial to the contractor.
In order to estimate the value of reduction in emissions due to efficient planning, the following
analogy can be considered. The emissions due to extra equipment use on site, 7.8 MT of CO2
emissions, is equivalent to the emissions produced in generating electricity to power an entire
household for one year, or the emissions from 325 propane cylinders used for home barbeques
[62]. The emissions due to extra materials installed due to rework, 807 MT of CO2 emissions, is
equivalent to providing electricity to 100 homes for an entire year or the emissions from 33,000
propane cylinders used for home barbeques [62].
0 2000 4000 6000 8000
10000 12000 14000 16000
0 20 40 60 80 100
CO
2 E
mis
sion
s (to
nnes
)
Duration (Days)
Pave Mainline
AsPlanned AsBuilt

68
The result of this investigation shows that schedule delays and rework resulting from unexpected
change orders during the construction process can lead to more than expected emissions on
construction sites. Therefore, appropriate management of construction schedules and optimal use
of materials and equipment on site during construction can significantly help in lowering
emissions during highway construction. When considered for multiple construction projects
across the nation, a focus on reducing emissions through better management of construction
projects can result in significant savings. Management best practices developed in areas of lean
construction and lessons learned from construction operation simulations and planning can be
transferred and applied very successfully to achieve these goals. This analysis presents a first
step towards more detailed future research.
The pertinent question raised is: how much should contractors and owners explicitly budget into
their operation planning and management budget to avoid these delays and extra emissions, and
more critically, at what point is the return on investment worth the savings in emissions? This
leads to a multi-objective trade-off problem that is very similar to the time-cost trade-off
problem. Alternatively, with appropriate benchmarking of emissions for typical highway
construction projects, DOTs could consider incentive contracts that provide contractors
incentives to reduce emissions during construction. While this is a very attractive idea, it also
requires a reliable and easy method that can be used to measure construction site emissions. The
methods presented in this section are a first step in developing such methods.
Future research work can lead to exact recommendations regarding specific construction
operations. For example, what spatial and schedule constraints need to be explicitly considered
when staging the paving operation and locating the batch plant, to minimize construction site
travel distances. This research is in line with the development of point-based systems for
reducing the emissions from highway construction, such as GreenRoads™ [19], which provide
top-down prescriptive recommendations to practitioners. Results from more detailed analysis of
construction schedules and operations will lead to bottom-up corroboration of such principles.
5.2.4. Service Emissions
Improved life cycle performance of highway sections plays a critical role in reducing GHG
emissions. Long life pavements that require little or no major rehabilitation throughout its life
promises to lower the overall life cycle GHG emissions. With this in mind, designing long-term

69
pavements considering durability and longevity will change the way highway sections are
constructed. Long-life pavements can lead to lower overall life cycle GHG emissions. One study
showed that 40-year designs compared to 20-year designs results in shorter return on
environmental investment [58]. However, long-term pavement performance studies are often
limited due to limited regional availability of pavement construction performance data.
Assessment of performance is critical to assess the long-term effectiveness of alternative
materials (industrial by-products) and construction processes that promise to reduce the energy
and greenhouse gas emissions [11]. A FHWA Long Term Pavement Performance (LTPP) study
identified some early trends that indicate the dependence of long-term pavement performance on
design and site conditions [63]. Ultimately, longer lasting pavements with reduced levels of
maintenance can and will reduce life cycle GHG emissions. In this chapter, intervals of
maintenance operation were investigated based on pavement condition to define a life cycle of
flexible pavements in two regions of Michigan.
To define the overall pavement LCA, a life cycle period must be characterized outlining the
various preventative maintenance strategies that will be implemented throughout the life of the
highway section. Rehabilitation options are highlighted in MDOTs Capital Preventative
Maintenance Manual [53], however, the time at which these options occur is not explicitly
stated. Therefore, this research suggests deriving maintenance schedules based on historical
performance of the pavement sections. This involves investigating historical pavement condition
(Distress Index) data to determine when rehabilitation strategies are being carried out. Distress
Index (DI) is a parameter used by MDOT to assess a pavement section’s condition. It is a
measure of the cracking distresses influencing the pavement’s condition. A limited sub-set of
data was used to investigate the performance of flexible pavements. For this analysis, regional
variability was investigated. Distress index values were assessed over a 15-year period in two
regions of Michigan and then compared to illustrate regional variability. The results of this
analysis are outlined in Table 5-6. The third maintenance cycle was assumed to approach a DI of
35 before intervention.
From this limited performance/maintenance history analysis, the pavements in region 2 reach a
higher DI before maintenance operations are executed. In addition, the age at which the
intervention occurs varies. The maintenance cycles occur in region 2, on average, 1.44 years later

70
than in region 1. This could be a result of climate conditions in each region, local preferences, or
other indicators such as International Roughness Index (IRI) or rutting depth influencing when
operations may occur.
Table 5-6: Regional Performance and Maintenance
Region 1 Maintenance Operations
Cycle 1 Cycle 2 Cycle 3 Age (yrs) 6.04 10.13 15.3
Distress Index (Before/After) Value 10.01/2.55 11.4/2.2 35/0
Region 2 Maintenance Operations
Cycle 1 Cycle 2 Cycle 3 Age (yrs) 7.44 12.75 15
Distress Index (Before/After) Value 27.3/11.4 24.7/17.5 35/0
This analysis can prove to be very beneficial in developing regional maintenance schedules that
can be used as a guide to assess the environmental impacts of the maintenance phase of the LCA.
Additionally, analysis like this can provide the essential timelines needed to define life cycle
periods used in LCA. Performance based approaches like these promises to further the
investigation of context sensitivity regarding the environmental impact of highway construction
and maintenance operations.
5.3. Project Life Cycle Emission Estimation
A pavement's life cycle emissions are illustrated using the PE-2 estimator tool along with data
from the observed MDOT projects. Figure 5-16 outlines a conceptual plot of the cumulative
emissions associated with typical roadway’s life cycle. It illustrates the sub-components of the
service life of a pavement, namely initial construction, followed by vehicle use phases
punctuated by maintenance operations and concluded by a final reconstruction. It is important to
recognize that the life cycle illustrated here as well as the maintenance schedule is purely to
illustrate the underlying method used. Indeed the PE-2 estimation tool allows users to test the life

71
cycle emissions for life cycles and treatments of their own choice. The associated emission
calculation components can be broken down as follows:
Figure 5-16: Conceptual Illustration of Pavement Life Cycle Emissions from construction operations during reconstruction and successive
maintenance and rehabilitation operations:
o Emissions from the manufacturing and processing of virgin and recycled
materials
o Emissions from on-site construction equipment
o Emissions from hauling equipment hauling materials to and from the project site
o Upstream impacts for the manufacturing of the fuel combusted in the construction
and hauling equipment
o Upstream impacts from the manufacturing of equipment being used on site
Work Zone Emissions during construction and maintenance operations
o Emissions associated with traffic delay throughout work zone durations
Use Phase Emissions

72
o Emissions associated with vehicle use of the roadway
To illustrate the information outlined in Figure 5-16 Conceptual Illustration of Pavement Life
Cycle the following example was modeled using the PE2 Life Cycle Tool and the following
results were obtained:
General Project Information:
Roadway Speed = 70mph
Average Daily Traffic = 8800 vehicles/day
Project Length = 10 miles
Number of lanes = 4 (Results in 40 lane miles)
First intervention strategy:
Emissions from US-31 HMA Reconstruct (PN50757) were used to account for year 1
initial construction and work zone emissions.
The duration of the project was determined to be 197 days
Second intervention strategy:
Emissions from US-31 Over band Crack seal and Micro surface (PN106529) were used
to represent the first maintenance.
Defined at year 5, project duration determined to be 22 days
Third intervention strategy:
Emissions from M-20 HMA Cold milling and Overlay (PN105611) were used to
represent the second maintenance.
Defined at year 9, project duration determined to be 95 days
Final intervention strategy:
Emissions from US-41 HMA Reconstruct and Realignment (PN80145) were used to
represent the end-of-life.
Defined at year 15, project duration determined to be 283 days
Results from the life cycle illustration are outlined in Table 5-7 and Figure 5-17. Emissions
associated with construction, maintenance and work zones are diminutive compared to emissions
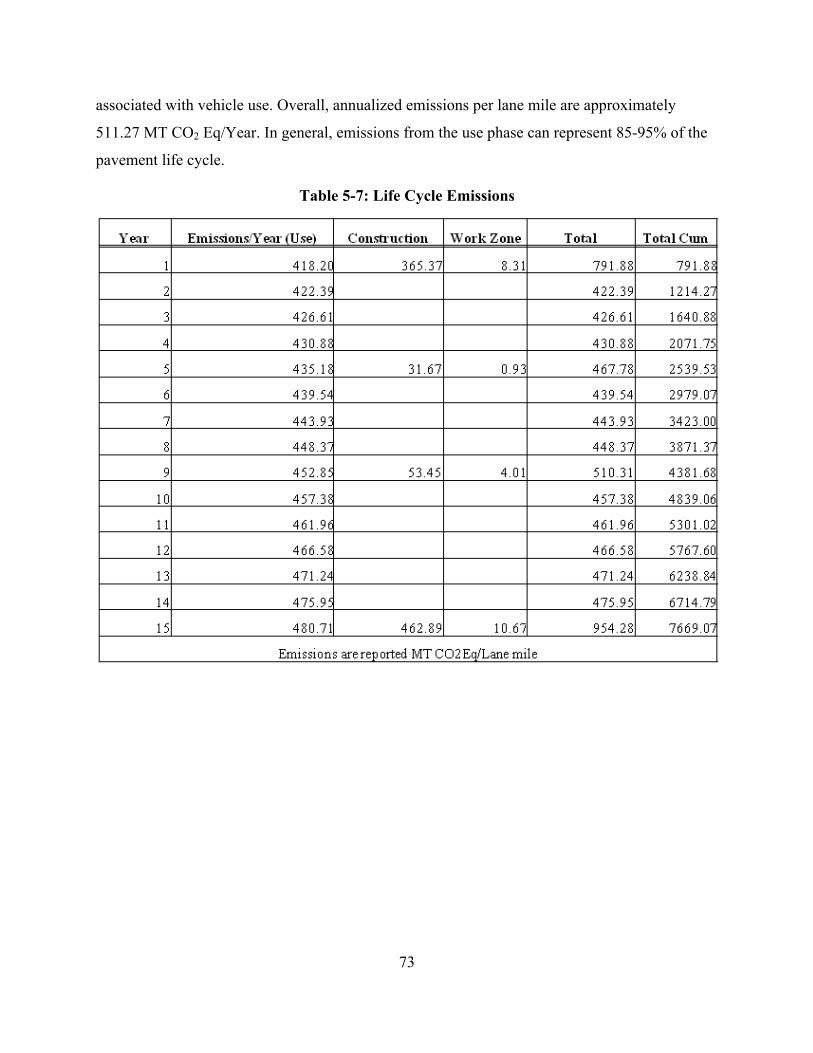
73
associated with vehicle use. Overall, annualized emissions per lane mile are approximately
511.27 MT CO2 Eq/Year. In general, emissions from the use phase can represent 85-95% of the
pavement life cycle.
Table 5-7: Life Cycle Emissions

74
Figure 5-17: Life Cycle Emissions

75
6. RECOMMENDATIONS
This chapter outlines the primary recommendations that are being made to MDOT based on this
research. The premises of the recommendations are that MDOT intends to reduce GHG
emissions associated with the design, construction, maintenance, rehabilitation and use of HMA
and PCC pavements. The main recommendations are as follows:
6.1. Data Reporting and Organization
It is critical for MDOT to recognize that development of GHG emission strategies is a dynamic
process, requiring continuous monitoring of project performance. The strategies have to be
updated to reflect improvements in construction technologies, such as equipment with improved
fuel standards, are introduced in practice, and advances are made in sustainable material
production processes and design. Continuous reporting and monitoring of material and
equipment use on highway construction sites is going to play a crucial role in informing
strategies. It is recommended that MDOT implement the data collection framework described in
this report.
In order to minimally impact the reporting burden of the contractor and the inspectors on site, the
following steps are recommended:
1. Currently equipment use reporting is not mandatory, and when contractors do report
equipment usage, they use text fields to describe equipment type. This often results in
different descriptions (spellings, reporting styles, etc.) of the same equipment. It is
recommended that MDOT update the FieldManagerTM reporting interface in
collaboration with Info Tech to reflect different equipment categories (see example
implementation in PE-2 tool) in drop down menus to enable consistent and easy reporting
of equipment types and quantity being used.
2. MDOT should encourage contractors to report batch plant usage data and provide
estimates of distances travelled in transporting raw materials to construction sites. If
voluntary reporting is not successful, MDOT can motivate contractors by requiring the
information during the bid qualification process. Further monetary incentives can also be

76
introduced in the contracting process, particularly if contractors have an emission
reduction plan in place.
3. In collaboration with InfoTech, implement a procedure by which the data collected
through FieldManagerTM gets automatically transmitted to a database supporting tools
like PE-2. This will ensure that a emissions report page can be automatically generated
for each project without any direct intervention. In conducting this project, the data
collected through FieldManagerTM was accessed by remotely accessing the InfoTech. The
data was then transferred into the MTU database after a few steps of processing. This
process can be automated in collaboration with InfoTech to ensure that actual emissions
for all future projects can be monitored using the PE-2 tool.
4. Implement a system to gather vehicular emissions data for representative pavement
sections across the State of Michigan. This will help monitor and develop accurate
estimates for traffic emissions during the service life of pavements.
5. The PE-2 tool can generate emissions reports using as-built project data. It can also
develop estimates for a new project given an estimate of materials and equipment use.
However, the reliability of these estimates is strongly dependent on the underlying
emission factors in the PE-2 database. At this time, the database reflects emission factors
that are current and consistent with advances in published literature. However, it is
crucial that MDOT revise and update the PE-2 emission factors data base from time to
time, as new technologies are introduced – especially technologies that reduce emissions
during the material production phase, or as new materials are introduced. For example,
the emission factor for cement may need to be updated as improvements are made in the
cement manufacturing and production phases. It is important to ensure that the databases
are updated using peer-reviewed, reliable data sources – preferably data that has been
published in industry and academic journals. In the long-run, this will ensure the
reliability of the tool while nudging the industry towards transparent standards.
6.2. Estimation and Benchmarking
It is strongly recommended that MDOT use the PE-2 tool to monitor GHG emissions from
construction projects, and to benchmark emissions for future projects. The PE-2 tool should be
used at the project and the network levels. Specifically the recommendations are as follows:

77
1. At the project level, use the PE-2 tool on all future projects to estimate and benchmark
emissions. The first step would be to use the bill of materials and estimated material use
to benchmark expected project emissions before the project starts. At the end of the
project, use PE-2 to generate an emissions report using the actual data collected (see data
collection recommendations). MDOT should encourage contractors (through direct
economic or equivalent incentive) to reduce the actual project emissions when compared
to the benchmark for the project.
2. Develop an incentive plan that would recognize contractor’s efforts at reducing GHG
emissions during the project construction process. This could be through more efficient
project site design and schedule planning or using alternative materials during the
construction process.
3. At the network level for all (or a sample of) state highway control sections, maintain a
record of emissions from construction and maintenance projects, and use the service
phase emission metrics defined in this report – or directly through PE-2 – to maintain a
running record of project life cycle emissions for representative corridors.
4. When considering emission reduction strategies, it is very crucial that MDOT recognize
that emission reduction is part of a broader goal of building more sustainable pavements.
Therefore, all measures must consider the long-term socioeconomic outcomes as well.
For example, an easy way of reducing equipment emissions would be to mandate the use
of new and more expensive equipment that have reduced emission footprints. However,
this would bias the playing field in favor of larger national contractors, crowding out
smaller regional contractors who have fewer financial resources to purchase new
equipment. Such socioeconomic impacts should be carefully considered. Reduction
strategies should emphasize incentive based individual adoption based on win-win
premises for all stakeholders, rather than top-down enforced standards that may
disproportionately disadvantage certain stakeholders.
6.3. Future Research Directions
A critical outcome of this research is that it has developed a comprehensive data infrastructure
and developed an inventory using 14 representative projects. It is strongly recommended that the
current database and the PE-2 system be made available to researchers as a resource. In addition,

78
steps should be taken so that the database is continuously updated with new project data. This
sections further outlines the resources needed to guide this research effort to a complete fruitful
field application.
Immediate research needs will include funding at the level of a Tier-II project focusing on an
extensive field implementation of the proposed methodology in collaboration with InfoTech,
participating contractors and material suppliers. This study should be conducted over one to two
years with time for two summers of fieldwork investigating:
(i) The technology necessary to support the automatic collection and integration of
project site data into the PE-2 backend database
(ii) Usability of the new FieldManagerTM interface and devising ways of reducing
barriers for contractors and inspectors in reporting daily resource use information.
It will ensure the implementation of a continuous data recording and monitoring system capable
of generating daily project inventories as the project is being completed. The goal of this
research will be to develop the following procedures for MDOT:
(i) A method that will use PE-2 to benchmark carbon emissions of construction projects
using resource estimates before start of construction, and compare it to actual
emissions based on data collected during construction.
(ii) A method to identify appropriate incentives that can be awarded to contractors if
actual emissions are less than or equal to estimated benchmark emissions.
In future, as the datasets grow in size and diversity, research should be funded at the Tier-I/II
level to investigate questions of pavement sustainability – which can in turn inform important
questions of pavement design and management. Some of the future research directions are:
1. Investigation of long-term statistically significant relationships between pavement life-
cycle parameters such as cost, performance and other sustainability indicators, including
but not limited to emissions, for different kinds of pavements at the project and network
levels using actual observed data, instead of depending on estimates and/or anecdotal
project experiences.
2. Consideration of the influence of context and project specific parameters such as climate,
service loads, geography on the performance of a pavement through its life cycle.

79
3. Development of recommendations for sustainable construction practices that account for
economy, emissions and long-term pavement performance. Such recommendations
would be based on significant trends in observed project and pavement performance data.
All three of the above will support MDOT decision-makers justify their decisions and support
policy that will encourage contractors, suppliers and local agencies coordinate efforts to reduce
pavement life cycle emissions while improving pavement performance. It is very important to
recognize that this research presents a first stepping-stone in that direction.

80
7. APPENDIX A: MDOT PAVEMENT LCA CHECKLIST
Michigan Department of Transportation: Carbon Footprint for HMA and PCC pavements
(checklist)
Prepared for the Michigan Department of Transportation using template from Pavement LCA
Workshop, developed by Pavement LCA Group at UC Davis [21]
A checklist is provided below for the Michigan Department of Transportation (MDOT) outlining
steps, assumptions, data sources, and research gaps for, “Carbon Footprint for Hot Mix Asphalt
and Portland Cement Concrete Pavements”
1. System Definition
This study aims to establish a carbon footprint for Hot Mix Asphalt (HMA) and Portland Cement
Concrete (PCC) Pavements for reconstruction, rehabilitation and Capital Preventive Maintenance
(CPM) projects. The study will consider emissions of GHGs due to energy consumption and
material wastage during the material acquisition and manufacturing and construction phases
(primary impacts) as well as those due to maintenance during the serviceable life of the assets
(secondary impacts). Carbon dioxide emissions for different design types will be determined and
categorized for application to various reconstruction, rehabilitation and preventive maintenance
projects.
The system boundary for this research project attempts to capture the total quantity of Carbon
Dioxide emissions expressed as an equivalence (CO2 eq) taking into account the Nitrous Oxide,
Methane, and where applicable other trace GHGs.
The system is defined by:
Driving materials to be used in the construction and maintenance of the roadway (Virgin
and/or Recycled)
Energy resources consumed (Fossil Fuels, Renewable, Electricity etc.)
Processing Materials (Concrete, HMA, Secondary Materials)

81
Construction and Hauling Equipment employed throughout construction and maintenance
(Non-Road Vehicles)
On Road Vehicles including transportation, maintenance, and passenger vehicles
Vehicle use throughout construction zones
1.1. Functional Unit
See discussion in section 4.5 Functional Units and Metrics
1.1.1. Physical dimension
See discussion in section 4.5.1 Average CO2 Equivalents per 100 MT of Concretic and Asphaltic
Materials
1.1.2. Performance requirements
See discussion in section 4.3.3 Service Data
1.2. Analysis Period
Three methods were considered to determine the analysis period* to be used for each of the
alternative pavement designs:
*Note: Life Cycle Analysis period is assumed the same as functional design life.
Annualized/Amortizing was be implemented.
1. As outlined in MDOT’s Pavement Design and Selection Manual [53] and based off
pavement fix type, analysis periods were determined from the following table:
Table 7-1: Design Life based on Pavement Fix [53] Pavement Fix Design Life and Length of
Accumulated ESALs (Years)
New/Reconstructed Rigid and Flexible Pavements 20
HMA over Rubblized Concrete 20
Unbonded Concrete Overlay over Repaired Concrete 20
HMA on Aggregate Grade Lift 15 to 20
HMA over Crush & Shaped Base 10 to 15

82
Mill & HMA Resurface on a Flexible Pavement 10 to 15
Repair and HMA Resurface on a Flexible Pavement 10 to 15
Repair and HMA Resurface on Composite or Concrete 10 to 12
Mill and HMA Resurface on Composite or Concrete 10 to 12
2. Using archived sample MDOT Historical Maintenance and performance data, researchers
developed a method to estimate the design period of alternative pavement types based on
this data. On average how long before pavement was reconstructed. Compare with
strategies outlined in Pavement Design and Selection Manual.
3. Actual Pavement Design and Selection packages were obtained for 4 of the 5 original
pavement designs investigated, analysis periods were obtained from those reports.
Packages contain traffic info such as ESALs, AADT, Growth rate, etc. Limits Life Cycle
analysis of only five types. (Original Projects combined with maintenance activities that
apply to these original five pavement types) Possible to compare equivalent designs
outlined in selection packages.
1.3. Life Cycle Inventory
1.3.1. Primary energy: Not reported
1.3.2. GHG emissions
For this study, researchers at MTU considered GHG emission from the construction and
rehabilitation, use, and maintenance of various roadways in Michigan. Gases considered were:
Carbon Dioxide
Nitrous Oxide*
Methane*
*These gases were converted to a carbon dioxide equivalent using appropriate methodologies.
1.3.3. Material flows
Material flows were tracked and recorded using construction management software provided by
MDOT. Quantities of materials were analyzed for their corresponding GHG emissions.

83
1.4. Life Cycle Phases and Their System Boundary
1.4.1. Pavement design (for each system)
Pavement designs considered in this study were limited to the designs implemented in the
projects investigated. Material quantities were derived from as-built construction usage rather
than that of estimated design quantities.
Material analyzed was constrained to materials used to make up the actual roadway. (i.e. Base,
Drainage, and Pavement materials). These are the driving materials that were determined to be
analyzed in the study.
1.4.2. Material Production
1.4.2.1. Raw Material
Feedstock energy: Feedstock energy was not considered in this study as the emphasis was on
estimating GHG emissions. Primary energy used to produce raw materials was considered.
1.4.2.2. Engineered Material
Transport of materials to site:
The impacts from the transport of materials to the site were considered in this study. Testing
orders obtained from MDOT outlining material supplier locations allowed for this analysis.
Engineered material
Mixing in plant (HMA or PCC):
Both HMA and Concrete batch plant emissions were considered and estimated using published
emission factors and based on tonnage of material placed throughout construction.
Transport from/to plant:
Transport from/to plant is not explicitly estimated in the project emission estimator. It is
accounted for in FieldManagerTM Equipment usage reports obtained from MDOT inspectors.
However, researchers have derived a formula to predict the total distance travelled to/from the
plants using an arithmetic progression. Impact can be estimated using this technique. See To-Site
impacts.
Transport of recycled material:

84
Transporting of recycle material is assumed to be accounted for in FieldManagerTM Equipment
usage reports obtained from MDOT inspectors.
1.4.3. Construction
Equipment usage:
Equipment usage is estimated from FieldManagerTM Equipment usage reports obtained from
MDOT inspectors.
Water use:
Water use was not estimated in this study.
Work zone traffic congestion:
Considered using MOVES simulation based estimation.
Vehicle technology change:
Not considered
Traffic growth:
Traffic growth throughout construction was not considered
Lighting energy, if at night:
Not considered
Movement of equipment:
Mobilization of equipment was not considered
Equipment manufacturing:
Upstream impacts from equipment manufacturing were considered in this study.
Factory or plant construction:
Not Considered
1.4.4. Use
1.4.4.1. Vehicle operation
Impact to fuel economy from roughness:
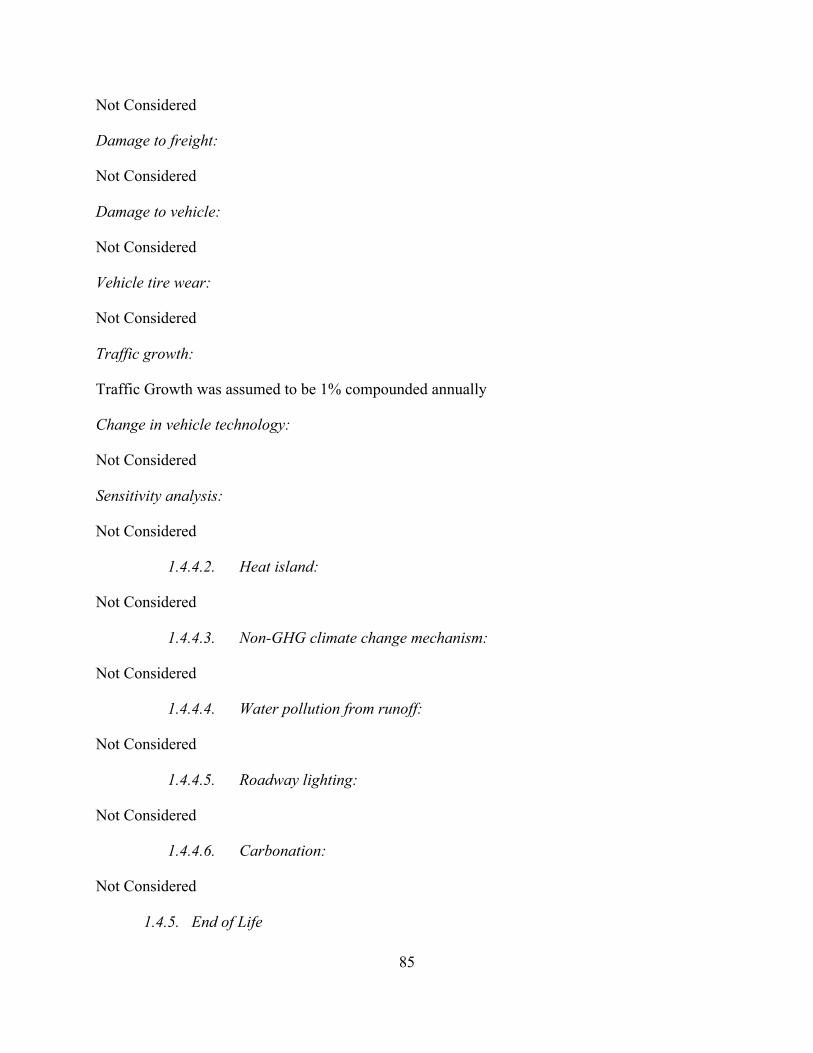
85
Not Considered
Damage to freight:
Not Considered
Damage to vehicle:
Not Considered
Vehicle tire wear:
Not Considered
Traffic growth:
Traffic Growth was assumed to be 1% compounded annually
Change in vehicle technology:
Not Considered
Sensitivity analysis:
Not Considered
1.4.4.2. Heat island:
Not Considered
1.4.4.3. Non-GHG climate change mechanism:
Not Considered
1.4.4.4. Water pollution from runoff:
Not Considered
1.4.4.5. Roadway lighting:
Not Considered
1.4.4.6. Carbonation:
Not Considered
1.4.5. End of Life

86
1.4.5.1. Recycling
End-of-Life Impacts were assumed to be accounted for as recycling impacts. This being, impacts
from processing secondary materials such as RAP and RCA
1.4.5.2. Landfill:
Not Considered
1.5. Impact assessment
1.5.1. Climate change
Global warming potential (GWP): GWP was used to convert nitrous oxide and methane
emissions to a carbon dioxide equivalent using methods outlined by the U.S. EPA and IPCC
[64].
Source: IPCC TAR
2. Models and Data Sources
2.1. Material Production
Material LCI (List all the LCI Sources)
Multiple material LCIs were used in this study for information about type and sources see
Appendix B: Emission Factors.
2.2. Construction
2.2.1. Maintenance and rehabilitation schedule
See discussion in sections 5.2.3 Process Emissions, 5.2.4 Service Emissions and 5.3 Project Life
Cycle Emission Estimation
2.2.2. Equipment use
Construction Schedule Analysis: See discussion in section 5.2.2 Process Emissions.
Equipment emission: EPA GHG estimation Methodology (Diesel)
Data source: EPA [44]
Equipment fuel use: Estimated gallons used per hour (Diesel)
Data source: Usage from FieldManagerTM

87
Truck emission: On highway combination truck emission factor based on miles travelled.
Assumes diesel and fully loaded at 30 tonnes.
Data source: NREL
2.2.3. Construction-related traffic
Work zone traffic analysis: See discussion in sections 4.4.3 Service Component GHG Emissions
and 5.2.4 Service Emissions.
Impact from work zone traffic congestion was modeled into methodologies used to estimate the
use phase of the pavement life cycle.
Data source: EPA MOVES 6.2
2.3. Use
2.3.1. Vehicle operation
Pavement performance model: Vehicle operation modeled for two types of rural highways.
Data source: EPA MOVES 6.2
2.3.2. Urban heat island
Not Considered
2.3.3. Non-GHG climate change Effects
Not Considered
2.3.4. Leachate
Not Considered
2.3.5. Carbonation
Not Considered
2.3.6. Roadway lighting
Not Considered
2.4. End-of-Life
2.4.1. Recycling

88
Processing impacts of secondary materials estimated using published emission factors. See
Appendix B: Emission Factors
2.4.2. Landfill
Not Considered

89
7. APPENDIX B: EMISSION FACTORS
Table 7-1: Emission Factors Material Description
Unit EIO-LCA Sector
GHG GWP MT/$1K
$/Unit (2009)
Factor Unit Source
Cement Ton 8.41E-01
MT/Ton [7]
Binder Ton 1.57E-01
MT/Ton [38]
FlyAsh Ton 1.78E-02
MT/Ton [65]
Blast Furnace Slag
Ton 1.51E-02
MT/Ton [39]
HMA Batch Plant
Tonne 2.86E-02
MTeq/ tonne
[39]
Aggregate Ton 6.16E-03
MT/Ton [39]
Recycled Asphalt Pavement
Ton 4.92E-03
MT/Ton [39]
Concrete Batch Plant
Tonne 7.75E-03
MTeq/ tonne
[39]
RCA Ton 2.18E-03
MT/Ton [66]
Load Transfer Assembly
Ft 6.16E-04
MT/Ft [39]
Steel Reinf Ea 1.33E-03
MT/Ea [39]
Cement Lbs 4.20E-04
MT/Lb [7]
Steel Reinf Epoxy Coated
Lbs 2.59E-04
MT/Lb [39]
Steel Reinf Pavement Mesh
Syd 3.51E-03
MT/Lb [39]
Granular Material
Cyd
1.08E-04
MT/ CYD
[38]
Sand Cyds 1.08E-04
MT/ CYD
[38]

90
Table 7-1: Emission Factors Material Description
Unit EIO-LCA Sector
GHG GWP MT/$1K
$/Unit (2009)
Factor Unit Source
Pavt Mrkg Waterborne Paint White
Gal 325510 0.988 $83.33 [67]
Pavt Mrkg Glass Beads
Lbs 327212 1.070 $0.46 [67]
Silt Fence Ft 313210 1.180 $0.90 [67] Pavt Mrkg Plastic Tape
Ft 326112 1.240 $1.74 [67]
Geotextile Liner
Syd 313210 1.180 $1.54 [67]
Expansive Waterstop
Ft 326122 1.060 $3.20 [67]
Fertilizer Chemical Nutrient
Lbs 325311 5.750 $0.19 [67]
Seeding Mixture
Lbs 111421 0.667 $2.00 [67]
Mulch Blanket
Syd 111940 2.440 $0.46 [67]
Pipe Underdrain
Ft 326122 1.060 $0.56 [67]
Dr Structure Precast Concrete Unit
Ea 327390 1.140 $880.00 [67]
Block Conc Ea 327331 1.470 $1.37 [67] Curing Compound
Gal 325998 0.960 $18.30 [67]
End Section Concrete
Ea 327330 1.470 $763.43 [67]
End Section Metal
Ea 331110 3.110 $539.71 [67]
Fence Post Steel Woven Wire
Ea 331110 3.110 $32.50 [67]
Fence Woven Wire
Ft 331110 3.110 $4.16 [67]
Fence Post Wood
Ea 32111 0.695 $13.10 [67]
Lane Ties Epoxy Coated
Ea 331110 3.110 $4.73 [67]

91
Table 7-1: Emission Factors Material Description
Unit EIO-LCA Sector
GHG GWP MT/$1K
$/Unit (2009)
Factor Unit Source
Drainage Structure Cover
Lbs 327390 1.140 $1.07 [67]
Joint Filler Fiber
Syd 324122 1.090 $17.36 [67]
Joint Sealer Hot Poured Rubber
Lbs 326299 0.836 $1.02 [67]
Dowel Bar Epoxy Coated
Ea 331110 3.110 $4.55 [67]
Pipe Conc Ft 327330 1.470 $63.14 [67] Bond Coat Gal 324121 1.450 $6.90 [67] Guardrail Ft 331110 3.110 $29.50 [67] Underdrain Outlet Ending
Ea 326122 1.060 $1.65 [67]
Pipe Metal Ft 331110 3.110 $65.88 [67] Riprap Syd 21231 1.250 $19.25 [67] Handhole Heavy Duty Cover
Ea 331110 3.110 $26.75 [67]
Waterproofing Membrane Preformed
Syd 326291 0.836 $15.70 [67]
Pipe RCP 24" Ft. 327330 1.470 $29.00 [67] Pipe RCP 15" Ft 327330 1.470 $14.95 [67] Culv Class A CSP 12"
Ft 331110 3.110 $12.95 [67]
Pipe RCP 72" Ft. 327330 1.470 $225.00 [67] End Section Metal 12"
Ea 331110 3.110 $117.00 [67]
End Section Metal SLP 1:4
Ea.
331110
3.110
$117.00
[67]
End Section Concrete 24"
Ea. 327330 1.470 $410.00 [67]
End Section Metal 15"
Ea.
331110
3.110
$139.00
[67]

92
Table 7-1: Emission Factors Material Description
Unit EIO-LCA Sector
GHG GWP MT/$1K
$/Unit (2009)
Factor Unit Source
Neoprene Seal
Ft 325520 1.180 $2.21 [67]
Foam Backer Rod
Ft 326140 1.150 $0.16 [67]
End Section Concrete 72"
Ea. 327330 1.470 $2,325.00
[67]
Piling Steel Sheet
Sft 331110 3.110 $26.50 [67]
Pipe Plastic Ft 326122 1.060 $34.20 [67] Joint Filler Fiber
Sft 324122 1.090 $1.93 [67]

93
8. REFERENCES
[1] N. Santero and A. Harvath, "Global warming potential of pavements," Environmental
Research Letters, vol. 4, p. 034011, 2009.
[2] C. Hendrickson, et al., "Economic input-output models for environmental life-cycle
assessment," Environmental Science & Technology, vol. 32, pp. 184A-191A, Apr 1998.
[3] G. Cicas, et al., "A regional version of a US economic input-output life-cycle assessment
model," International Journal of Life Cycle Assessment, vol. 12, pp. 365-372, Sep 2007.
[4] M. Bilec, et al., "Example of a Hybrid Life-Cycle Assessment of Construction
Processes," Journal of Infrastructure Systems, vol. 12, pp. 207-215, 2006.
[5] Z. Zhang, et al., "BEPAS--a life cycle building environmental performance assessment
model," Building and Environment, vol. 41, pp. 669-675, 2006.
[6] PRe´Consultants. Simapro LCA Software [Online]. Available:
http://www.pre.nl/simapro/
[7] NREL. U.S. Life-Cycle Inventory Database [Online]. Available:
http://www.nrel.gov/lci/database/
[8] C.-Y. Chu and P. L. Durango-Cohen, "Empirical Comparison of Statistical Pavement
Performance Models," Journal of Infrastructure Systems, vol. 14, pp. 138-149, 2008.
[9] ISO, "Life Cycle Assessment - Principles and Framework," in Environmental
Management ed: International Organization for Standardization, 2006a.
[10] ISO, "Life Cycle Assessment – Requirements and Guidelines," in Environmental
Management ed: International Organization for Standardization, 2006b.
[11] H. Muga, et al., "An integrated assessment of continuously reinforced and jointed plain
concrete pavements," Journal of Engineering, Design and Technology, vol. 7, pp. 81-98,
2009.
[12] J. A. Gambatese and S. Rajendran, "Sustainable Roadway Construction: Energy
Consumption and Material Waste Generation of Roadways," San Diego, California,
2005, pp. 21-21.
[13] P. Zapata and J. A. Gambatese, "Energy Consumption of Asphalt and Reinforced
Concrete Pavement Materials and Construction," Journal of Infrastructure Systems, vol.
11, pp. 9-20, 2005.

94
[14] A. Horvath and C. Hendrickson, "Comparison of Environmental Implications of Asphalt
and Steel-Reinforced Concrete Pavements," Transportation Research Record: Journal of
the Transportation Research Board, vol. 1626, pp. 105-113, 1998.
[15] F. Gallivan, "Greenhouse Gas Mitigation Measures For Transportation Construction,
Maintenance, and Operations Activities," ICF International. Inc2010.
[16] N. Santero, "Life Cycle Assessment of Pavements: A Critical Review of Existing
Literature and Research," Portland Cement Association2010.
[17] A. A. Guggemos and A. Horvath, "Decision-Support Tool for Assessing the
Environmental Effects of Constructing Commercial Buildings," Journal of Architectural
Engineering, vol. 12, pp. 187-195, 2006.
[18] A. Horvath, "Pavement Life-cycle Assessment Tool for Environmental and Economic
Effects (PaLATE)," ed: Recycled Materials Resource Center, 2004.
[19] S. Muench, et al., "Greenroads: A Sustainability Rating System for Roadways,"
International Journal of Pavement Research and Technology, vol. 3, pp. 207-279, 2010.
[20] UCPRC. (2010, April 4). Pavement Life Cycle Assessment Workshop. Available:
http://www.ucprc.ucdavis.edu/p-lca/index.html
[21] UCPRC, "UCPRC Pavement LCA Guideline," University of California Pavement
Research Center, Davis, Berkeley, CA2010.
[22] enotes.com. (2006, March 30). Government-University-Industry Partnerships. Available:
http://www.enotes.com/management-encyclopedia/government-university-industry-
partnerships
[23] EPA. EPA Climate Leaders Simplified GHG Emissions Calculator (SGEC) [Online].
Available: http://www.epa.gov/climateleaders/documents/sgec_tool_v2_9.xls
[24] FHWA. (2011, March 30). Sustainable Highways Self-Evaluation Tool. Available:
https://www.sustainablehighways.org/
[25] EIO-LCA. (2011, March 30). Economic Input-Output Life Cycle Assessment. Available:
http://www.eiolca.net/
[26] PaLATE. (2004, March 30). Pavement Life-cycle Assessment Tool for Environmental and
Economic Effects Available:
http://www.rmrc.unh.edu/Resources/CD/PaLATE/PaLATE.htm

95
[27] SMAQMD. (2009, Feb. 17). Road Construction Emissions Model. Available:
http://www.airquality.org/ceqa/RoadConstructionModelVer6.3-2.xls
[28] S. T. Muench, et al., Greenroads Manual v1.5. Seattle, WA: University of Washington,
2011.
[29] NYDOT. (2011, March 30). GreenLITES. Available:
https://www.nysdot.gov/programs/greenlites
[30] IDOT. (2009, March 30). Illinois - Livable and Sustainable Transportation Rating System
(I-LAST). Available: http://www.dot.state.il.us/green/documents/I-LASTGuidebook.pdf
[31] AsPECT. (2010, March 30). Asphalt Pavement Embodied Carbon Tool (AsPECT).
Available: http://www.sustainabilityofhighways.org.uk
[32] IRF. (2011, March 30). Calculator for Harmonised Assessment and Normalisation of
Greenhouse-gas Emissions for Roads (CHANGER). Available: http://www.irfghg.org/
[33] e-CALC. (2009, May 5). Vermeer: Making Green Possible. Available:
http://www2.vermeer.com/vermeer/LA/en/N/about_us/our_commitment/making_green_p
ossible
[34] WRAP. (2010, March 30). CO2 Emissions Estimator Tool (AggRegain). Available:
http://aggregain.wrap.org.uk/sustainability/try_a_sustainability_tool/co2_emissions.html
[35] EPA, "Motor Vehicle Emission Simulator (MOVES)," MOVES2010a ed: U.S.
Environmental Protection Agency, 2010.
[36] C. T. Hendrickson, et al., "Comparing two life cycle assessment approaches: a process
model vs. economic input-output-based assessment," in Electronics and the Environment,
1997. ISEE-1997., Proceedings of the 1997 IEEE International Symposium on, 1997, pp.
176-181.
[37] C. Hendrickson, et al., Environmental Life Cycle Assessment of Goods and Services: An
Input-Output Approach: RFF Press, 2006.
[38] H. Stripple, "Life cycle assessment of road—a pilot study for inventory analysis," IVL
Swedish Environmental Research Institute, Gothenburg2001.
[39] Athena, "A Life Cycle Perspective on Concrete And Asphalt Roadways: Embodied
Primary Energy and Global Warming Potential," The Athena Sustainable Material
Institute2006.
[40] RS Means CostWorks Database [Online]. Available: http://www.meanscostworks.com/

96
[41] InfoTech. FieldManager Software [Online]. Available:
http://www.infotechfl.com/products/fieldmanager.php
[42] R. a. O. Peurifoy, G, Estimating Construction Costs, 5th ed.: McGraw-Hill, 2002.
[43] CAT, Caterpillar Performance Handbook, 30th ed.: Caterpillar, Inc, 1999.
[44] EPA, "Direct Emissions from Mobile Combustion Sources, Climate Leaders GHG
Inventory Protocol Core Module Guidance," U.S. Environmental Protection Agency
2008.
[45] K. Chatti, "Effect of Pavement Conditions on Rolling Resistance and Fuel Consumption,"
in Pavement Life Cycle Assessment Workshop, Davis, California, 2010.
[46] (2011, October 25th). Roadway Construction Emissions Model (Version 6.3.2, July 2009,
in Excel – 4 Mb ed.). Available: http://www.airquality.org/ceqa/index.shtml
[47] CEPA, "Off-Road Emissions Inventory," California Environmental Protection Agency
Air Resources Board 2010.
[48] MDOT, Standard Specifications for Construction: Michigan Department of
Transportation, 2003.
[49] H. Frey, et al., "Comprehensive Field Study of Fuel Use and Emissions of Nonroad
Diesel Construction Equipment," Transportation Research Record: Journal of the
Transportation Research Board, vol. 2158, pp. 69-76, 2010.
[50] R. L. Peurifoy, Construction planning, equipment, and methods, 8th ed. New York:
McGraw-Hill, 2011.
[51] EPA, "Unit Conversions, Emissions Factors, and Other Reference Data," U.S.
Environmental Protection Agency2004.
[52] EPA. (2005, Emission Facts: Average Carbon Dioxide Emissions Resulting from
Gasoline and Diesel Fuel. Available: http://www.epa.gov/oms/climate/420f05001.htm
[53] MDOT, "Pavement Design and Selection Manual," Michigan Department of
Transportation2005.
[54] GDOT, "2009 Vehicle Classification By Functional Class," 2009.
[55] U. S. E. P. A. (EPA), "MOVES2010 Default Age Distributions (XLS)," 2010.
[56] MDOT, "2009 Average Daily Traffic (ADT) Maps," 2009.
[57] veloroutes.org, "Create A Rout," ed, 2010.
97
[58] N. J. Santero, et al., "Environmental policy for long-life pavements," Transportation
Research Part D: Transport and Environment, vol. 16, pp. 129-136, 2011.
[59] SETAC, "Guidelines for Life-Cycle Assessment," Environmental Science and Pollution
Research, vol. 1, p. 55, 1994.
[60] MDOT. (2009, March 25th). Various Project Proposals. Available:
http://mdotwas1.mdot.state.mi.us/public/bids/
[61] E. Serag, et al., "Model for Quantifying the Impact of Change Orders on Project Cost for
U.S. Roadwork Construction," Journal of Construction Engineering and Management,
vol. 136, pp. 1015-1027, 2010.
[62] EPA. (2010, October 30, 2010). Greenhouse Gas Equivalencies Calculator. Available:
http://www.epa.gov/cleanenergy/energy-resources/calculator.html
[63] FHWA, "Preliminary Evaluation of LTPP Continuously Reinforced Concrete (CRC)
Pavement Test Sections," U.S. Department of Transportation, Office of Highway
Information Management, Washington D.C. FHWA-RD-99-086, 1999.
[64] EPA, "Inventory of U.S. Greenhouse Gas Emissions and Sinks: 1990 – 2002," U.S.
Environmental Protection Agency 2007.
[65] K. Kawai, et al., "Inventory Data and Case Studies for Environmental Performance
Evaluation of Concrete Structure Construction," Journal of Advanced Concrete
Technology, vol. 3, pp. 435-456, 2005.
[66] J. McIntyre, et al., "Energy and Greenhouse Gas Emissions Trade-Offs of Recycled
Concrete Aggregate Use in Nonstructural Concrete: A North American Case Study,"
Journal of Infrastructure Systems, vol. 15, pp. 361-370, 2009.
[67] EIO-LCA. Economic Input-Output Life Cycle Assessment [Online]. Available:
http://www.eiolca.net/
Related Documents