TECHNISCHE UNIVERSITÄT MÜNCHEN Fakultät für Sport- und Gesundheitswissenschaften Lehrstuhl für Trainingswissenschaft und Sportinformatik Radio-based Position Tracking in Sports Validation, Pattern Recognition and Performance Analysis Thomas Seidl Vollständiger Abdruck der von der Fakultät für Sport- und Gesundheitswissenschaften der Technischen Universität München zur Erlangung des akademischen Grades eines Doktors der Philosophie (Dr. phil.) genehmigten Dissertation. Vorsitzender: Prof. Dr. David Franklin Prüfer der Dissertation: 1. Prof. Dr. Martin Lames 2. Prof. Jonathan Wheat, PhD Sheffield Hallam University, UK Die Dissertation wurde am 25.1.2019 bei der Technischen Universität München eingereicht und durch die Fakultät für Sport- und Gesundheitswissenschaften am 27.6.2019 angenommen.

Welcome message from author
This document is posted to help you gain knowledge. Please leave a comment to let me know what you think about it! Share it to your friends and learn new things together.
Transcript

TECHNISCHE UNIVERSITÄT MÜNCHENFakultät für Sport- und Gesundheitswissenschaften
Lehrstuhl für Trainingswissenschaft und Sportinformatik
Radio-based Position Tracking in SportsValidation, Pattern Recognition and Performance Analysis
Thomas Seidl
Vollständiger Abdruck der von der Fakultät für Sport- und Gesundheitswissenschaften derTechnischen Universität München zur Erlangung des akademischen Grades eines
Doktors der Philosophie (Dr. phil.)
genehmigten Dissertation.
Vorsitzender: Prof. Dr. David Franklin
Prüfer der Dissertation:
1. Prof. Dr. Martin Lames
2. Prof. Jonathan Wheat, PhD
Sheffield Hallam University, UK
Die Dissertation wurde am 25.1.2019 bei der Technischen Universität München eingereicht unddurch die Fakultät für Sport- und Gesundheitswissenschaften am 27.6.2019 angenommen.


AbstractIn recent years, the acquisition of positional data in sports competitions has established itself asan important part of performance analysis. Positional data contains valuable information aboutthe movement of players and objects, allowing conclusions to be drawn about decision-making,load, technique and tactics. Until now, positional data in sports competitions has mostlybeen collected via video-based tracking systems as competition rules forbid the attachment oftransmitters on players and objects, such as the ball in the sport of football. This restrictiontherefore prevented the use of radio-based systems in sports competitions. Recent studieshave shown the potential of radio-based systems for player tracking as these systems allow tocapture more accurate data with higher sampling rates than video-based systems. Currentrule changes in football now allow players and objects to be equipped with transmitters incompetitions.This dissertation evaluates the quality and the potential, respective applications of radio-basedtracking data in sports. It is based on three publications dedicated to system validation of radio-based football tracking and pattern recognition for the automated detection of performance-relevant sprint parameters in athletics. Results show that radio-based football tracking providesaccurate information about ball position and speed and radio-based positional data can beused to automatically obtain accurate sprint parameters over the full course of a 100 m sprint.As data is available in real-time the application of radio-based tracking systems opens up newpossibilities for performance analysis.


ZusammenfassungDie Erfassung von Positionsdaten im Spitzensport ist mittlerweile ein fester Bestandteil derWettkampfdiagnostik. Diese beinhalten Informationen über die Bewegung von Spielern undSpielobjekt und erlauben es, Rückschlüsse auf Entscheidungsfindung, Belastung, Technik undTaktik zu ziehen. Aktuell werden Positionsdaten hauptsächlich kamerabasiert erfasst, wobei derEinsatz von funkbasierten Ortungssystemen eine vielversprechende Alternative bietet. Durchaktuelle Regeländerungen, beispielsweise im Fußball, ist deren Einsatz im Wettkampf nunebenfalls möglich.Die vorliegende Dissertation untersucht die Qualität von funkbasierten Positionsdaten undpotenzielle Anwendungen für die Leistungsdiagnostik. Der Dissertation liegen drei Veröf-fentlichungen zugrunde, die sich mit den Themen der Validierung des Balltrackings einesfunkbasierten Ortungssystems im Fußball, sowie mit der Mustererkennung zur automatischenDetektion von Sprintparametern im 100 m Sprint auf Basis von funkbasierten Positions-daten beschäftigt haben. Die Studien zeigen, dass funkbasierte Ortungssysteme es erlauben,Fußballposition und -geschwindigkeit genau zu erfassen sowie die automatische Detektion vonSprintparametern für jeden Schritt ermöglichen.Die Verfügbarkeit von akkuraten, zeitlich hochaufgelösten, funkbasierten Positionsdaten inEchtzeit eröffnet somit neue Anwendungsmöglichkeiten für die Leistungsdiagnostik.


Table of Contents
List of Figures iii
List of Tables iii
List of Publications v
1 Introduction 11.1 Player Tracking in Sports . . . . . . . . . . . . . . . . . . . . . . . . . . . . . 11.2 Player Tracking within Training & Exercise Science and Performance Analysis 41.3 Spatio-temporal Data Analytics . . . . . . . . . . . . . . . . . . . . . . . . . . 6
2 Methods 112.1 Assessing a Player’s Position . . . . . . . . . . . . . . . . . . . . . . . . . . . . 122.2 Tracking Methods in Sports . . . . . . . . . . . . . . . . . . . . . . . . . . . . 142.3 Functioning of Radio-based Tracking System RedFIR . . . . . . . . . . . . . . 24
3 Articles 293.1 Evaluating the Indoor Football Tracking Accuracy of a Radio-based Real-Time
Locating System . . . . . . . . . . . . . . . . . . . . . . . . . . . . . . . . . . 293.2 Validation of Football’s Velocity provided by a Radio-based Tracking System . 303.3 Estimation and Validation of Spatio-temporal Parameters for Sprint Running
using a Radio-based Tracking System . . . . . . . . . . . . . . . . . . . . . . . 31
4 Discussion 334.1 System Validation . . . . . . . . . . . . . . . . . . . . . . . . . . . . . . . . . . 334.2 Interchangeability of Results between Tracking Systems . . . . . . . . . . . . . 354.3 Deriving Insights from Spatio-temporal Player Tracking Data . . . . . . . . . . 36
5 Conclusion and Outlook 395.1 Conclusion . . . . . . . . . . . . . . . . . . . . . . . . . . . . . . . . . . . . . . 395.2 Outlook . . . . . . . . . . . . . . . . . . . . . . . . . . . . . . . . . . . . . . . 40
References 45
Appendix 53
i

ii Table of Contents

LIST OF FIGURES iii
List of Figures
1.1 David Marsh, “B. Charlton v F. Beckenbauer - Full Match” Litho print 2010 . 11.2 Subject areas of training and exercise science . . . . . . . . . . . . . . . . . . . 41.3 A hierarchy of positional data analytics in sports . . . . . . . . . . . . . . . . 71.4 Expected goal value modeling in football . . . . . . . . . . . . . . . . . . . . . 8
2.1 “Moving dots” . . . . . . . . . . . . . . . . . . . . . . . . . . . . . . . . . . . . 132.2 Approximating a player’s position: the center of mass . . . . . . . . . . . . . . 142.3 Tracking technologies in sports . . . . . . . . . . . . . . . . . . . . . . . . . . . 152.4 Graphical comparison of positioning principles used in GPS and LPS . . . . . 172.5 Flowchart for video-based player tracking systems . . . . . . . . . . . . . . . . 192.6 Player detection and real-world position . . . . . . . . . . . . . . . . . . . . . 202.7 Convolutional Neural Networks for object detection . . . . . . . . . . . . . . . 212.8 Frequencies of Local Positioning Systems . . . . . . . . . . . . . . . . . . . . . 222.9 Functioning of the RedFIR system . . . . . . . . . . . . . . . . . . . . . . . . 252.10 Fundamentals of Kalman Filtering . . . . . . . . . . . . . . . . . . . . . . . . . 262.11 Kalman Filtering artefacts for LPS systems . . . . . . . . . . . . . . . . . . . . 28
5.1 Beyond “Moving dots”: body pose from video . . . . . . . . . . . . . . . . . . 415.2 Data-Driven Ghosting in football . . . . . . . . . . . . . . . . . . . . . . . . . 425.3 Bhostgusters: Intuitive iPad tool for tactical analysis in basketball . . . . . . . 43
List of Tables
2.1 Comparison of Local Positioning Systems for sports applications . . . . . . . . 23

iv LIST OF TABLES

LIST OF PUBLICATIONS v
List of Publications
Seidl, T., Völker, M., Witt, N., Poimann, D., Czyz, T., Franke, N., & Lochmann, M. (2016b).Evaluating the indoor football tracking accuracy of a radio-based real-time locating system.In P. Chung, A. Soltoggio, C. W. Dawson, Q. Meng, & M. Pain (Eds.), Proceedings ofthe 10th International Symposium on Computer Science in Sports (ISCSS), volume 392of Advances in Intelligent Systems and Computing (pp. 217–224). Cham: Springer.
Seidl, T., Czyz, T., Spandler, D., Franke, N., & Lochmann, M. (2016a). Validation of football’svelocity provided by a radio-based tracking system. Procedia Engineering, 147, 584–589.
Seidl, T., Linke, D., & Lames, M. (2017). Estimation and validation of spatio-temporal param-eters for sprint running using a radio-based tracking system. Journal of Biomechanics,65, 89–95.


1
Chapter 1
Introduction
Figure 1.1: David Marsh Litho Print. “Some People Are on The Pitch. B. Charlton v F. Beckenbauer- 1966 World Cup Final”. The red lines track Bobby Charlton throughout the game, thebold lines show possession of the ball. The black lines show Frank Beckenbauer’s pitchpositions. Image taken from Marsh (2010).
1.1 Player Tracking in SportsFigure 1.1 shows the movements of Franz Beckenbauer and Bobby Charlton in the 1966 WorldCup Final. This artwork, created by David Marsh, “has turned the 1966 World Cup Finalinto a series of prints interpreted through the medium of movement” (FourFourTwo, 2010).Art usually provides no utility. However, if one considers the technological developments in

2 Introduction
sports, these “artworks” are nowadays generated automatically by player tracking systemsin every match for each player in the English Premier League, German Bundesliga or Na-tional Basketball Association. These “artworks” are called spatio-temporal player trackingdata, positional data or player trajectories1 and nowadays form the objective basis for theevaluation of sports performance. However, looking at Figure 1.1 it is hard to believe thatone could actually deduce whether Beckenbauer or Charlton was the better player in thefinal by simply comparing their trajectories. Nowadays, computers are able to translate these“artworks” into insights about player performance and blur the boundaries between art and craft.
Data is collected everywhere. We are in the midst of a data revolution and according toForbes, the amount of data we captured during the last two years makes up 90% of all datathat has ever been collected (Marr, 2018). Accurate and objective data can now be gatheredin activities such as training and matches that was not even possible ten years ago. Theavailability of player tracking data in competitions marks the beginning of a new era for sportsscience as new technologies allow the acquisition of more and better data on all aspects ofsports. At its center lies spatio-temporal player tracking which provides information about themovement of players and ball2 over time. In all major sports leagues player tracking data iscurrently recorded during competition:
• In the German Football Bundesliga, video-based player tracking data has been availablesince the 2011/2012 season and the data is shared with all clubs from 1. and 2. Bundesliga.
• The National Basketball Association (NBA) rolled out league-wide Stats SportVU video-based player tracking in 2013/143. In addition, all NBA teams nowadays have their ownanalytics departments which try to make sense of this data by analyzing shooting andpassing patterns.
• The National Football League (NFL) started to use the RFID-based tracking systemZebra MotionWorks in 2014 which integrates small radio transmitters into shoulder pads(Zebra, 2018).
• The National Hockey League (NHL) is about to introduce a hybrid tracking system(radio-based and video-based) in the 2019/2020 season (Lemire, 2017; Whyno, 2019).
More and more businesses are being built around its acquisition and analysis. The sportsanalytics market size was estimated to be $764.3m in 2016 and is anticipated to reach $15.5bnby 2023 (Wintergreen Research, 2017).Tracking player and ball movements throughout a match creates massive amounts of usabledata; a typical football match tracked by a video-based system creates more than 3 million datapoints4. Leagues and organizations are changing rules to permit the use of transmitter-based
1The terms “trajectories”, “(spatio-temporal) player tracking data” and “positional data” will be usedinterchangeably, meaning xy(z) positions (and if available accelerations and velocities) over time.
2In this thesis the term ball tracking refers to tracking objects like a football, basketball, american footballand ice hockey puck.
3Stats SportVU video-based tracking systems have been first installed in four arenas already in season2010/11.
4If a standard camera with a frame rate of 25 Hz is used to simultaneously track 22 players and the ball (23objects in total), assuming a football match to last 90 minutes, results in 3.105.000 = (25× 60× 90× 23) datapoints for one match.

1.1. Player Tracking in Sports 3
systems in their respective competitions. In January 2014, the International Tennis Federation(ITF) introduced the Player Analysis Technology program (PAT) which aimed to providean official testing procedure that new technologies have to undergo before being used incompetition (ITF, 2018). During the 2018 Soccer World Cup in Russia, FIFA even allowed theuse of electronic performance and tracking systems (EPTS) and the communication of resultswithin matches to coaches (FIFA, 2018).So, why are sports governing bodies such as FIFA in football changing their rules of the gameto permit attaching transmitters to players and the communication of analysis results evenwithin the game to coaches? Why is capturing movement and actions of players so important?This wealth of new information is key to better understand every aspect of the sport. Thisincludes analysis of technique, tactics, decision making, player load and injuries within thegame; it allows clubs to find players fitting to squads and helps to evaluate and improve playerand team performance and to ultimately win championships.Although player tracking systems have been introduced almost a decade ago, there are stillongoing discussions regarding the quality and usefulness of player tracking data. The former isbased on the fact that early validation studies used questionable methods to establish reliabilityand validity of these systems (Di Salvo et al., 2006), which led people to think that all types ofquestions about performance can be answered by using a player tracking system. However, dataquality back then was by no means comparable to today and technology was not mature enoughand only allowed to provide rather simple performance indicators like covered distance or thecreation of heat maps. Data and analysis tools were not able to answer more sophisticatedsport-scientific questions.With regards to the latter, Carling (2013) made clear that for practical purposes performanceanalysis findings are mostly not relevant, i.e. they fail to identify non-trivial performanceindicators, prove significant but hardly relevant positional differences in athletic performance,and mostly fail to measure the degree of fatigue.
Hence, there are still two main questions related to positional player tracking that needto get addressed:
1. How accurate are player tracking systems?
2. How can spatio-temporal player tracking data be used to gain relevant insights forperformance analysis?
This publication-based dissertation tries to get one step closer to answering these questions forradio-based tracking systems. The application of these systems is promising as those allow forhigher accuracies and sampling rates and the availability of results in real-time.Despite the issues mentioned above positional player tracking has become a fundamental partof performance analysis as well as training and exercise science in sports.
How player tracking can be related to topics within performance analysis is discussed inSection 1.2. The analysis of player tracking data can be structured in a hierarchical way whichis presented in Section 1.3.

4 Introduction
1.2 Player Tracking within Training & Exercise Scienceand Performance Analysis
Figure 1.2: Subject areas of training and exercise science: capabilities, training and competition.Interactions between areas are shown. Based on Hohmann et al. (2010). Own translation.Possible applications of player tracking data within each subject area have been added.
This section provides a short introduction to training and exercise science5, performanceanalysis and its relationship to positional player tracking. As will be shown the use of positionalplayer tracking data can be beneficial in almost all subject areas of training and exercise scienceand performance analysis.
Training and Exercise Science & Performance AnalysisHohmann et al. (2010) define training and exercise science as the discipline of sports sciencethat deals with the scientific foundation of training and competition in application fields ofsport from a holistic and applied perspective. At its core are the subject areas capabilities,training, competition and their interactions.
Capabilities, Training and Competition“The underlying assumptions of classic performance analysis are that the observedperformances can be explained by the abilities and skills of the athletes. Theseabilities and skills are conceived of as being stable properties, properties that
5In this thesis training and exercise science refers to the German “Trainingswissenschaft” and performanceanalysis is thought to be a part of “Trainingswissenschaft”.

1.2. Player Tracking within Training & Exercise Science and Performance Analysis 5
may only be influenced in time by special measures taken in training.” (Lames &McGarry, 2007).
Hence, training and exercise science is not only studying its subject areas but also theinteractions between them. Based on the current capabilities of an athlete a coach sets trainingtargets. On the one hand, training will have a positive impact on the capabilities of an athlete.On the other hand capabilities are also prerequisites for competing against others and willdetermine results in competition, whereas competition poses requirements or norms on thecapabilities of an athlete. Whether a coach did a “good” job is evaluated based on resultswithin competition. Success in competition will therefore have implications on training. Figure1.2 shows the three subject areas of training and exercise science, its interactions and possibleapplications of player tracking data within each subject area. The analysis of spatio-temporaldata can be beneficial within all subject areas of training and exercise science.Before possible applications of player tracking data are outlined, the terms theoretical andpractical performance analysis are defined.
Theoretical and Practical Performance AnalysisPerformance analysis can be defined as “an objective way of recording and interpreting sportperformance using the latest technology so that key elements can be quantified in a validand consistent manner” (Katz, 2014). It can be subdivided into theoretical and practicalperformance analysis (Lames & McGarry, 2007).The task of theoretical performance analysis in training and exercise science is to structureathletic performance. This means in the first place prioritisation of the influencing variablesand in the second place their internal order (Hohmann et al., 2010).In order to attain general laws typical methods of behavioural basic research are taken. Large,representative samples are used to ensure to capture typical structures of the game. Within thiscontext, dynamical systems theory has been shown to be a promising tool to better understandthe nature of team sports (Davids et al., 2005; Lames & McGarry, 2007; Siegle & Lames, 2013;Walter et al., 2007).As spatio-temporal player tracking allows to (automatically) capture and analyze large amountsof matches it, nowadays, builds a solid fundament for theoretical performance analysis.In contrast, the task of practical performance analysis is to compare actual and target values,i.e. to identify strengths and weaknesses as well as to monitor training success (Hohmannet al., 2010).One part of practical performance analysis is the assessment of physiological, technical ortactical demands on players within competition in order to steer training in a way such thattraining demands on players or athletes are similar to those present within competition. Asan example Stevens et al. (2017) quantified in-season training load relative to match load inprofessional Dutch Eredivisie football using radio-based tracking data. Thus, the monitoringof player load can potentially be based on player tracking data. In practice, load monitoring isnowadays most often based on Global Positioning System (GPS) (de Silva et al., 2018). Thereare several challenges, however, associated with the comparison of data from GPS systems(Malone et al., 2017). Player tracking systems also allow to analyze actual and target valuesand can, therefore, help to identify strengths and weaknesses. Analysis of positional data canalso be used for monitoring and steering of return to play after injuries (Hoppe et al., 2018b).

6 Introduction
Another part of practical performance analysis comprises agility tests in training. Here, thepossibility of tracking training material, like cones and poles, allows to automate these kind ofagility tests. Grün et al. (2011) showed how radio-based tracking can be used to automate the“DFB-Testbatterie”, which comprises standardized tests for the assessment of technomotoricalskills of football players proposed by the German Football Association (DFB).In this context, the application of radio-based tracking systems in particular seems to bepromising as these systems allow for the same analyses as GPS-based systems but provide moreaccurate data with higher sampling rates. Hence, these systems can be used for automatedmonitoring of training. Since radio-based data does not need any post-processing it can evenbe used in real-time scenarios. This opens up new possibilities for feedback systems in trainingenvironments.Therefore, positional player tracking can be regarded as a standard method within performanceanalysis.
Looking more closely on typical data analysis steps which are needed to obtain measures andmetrics for performance analysis provides another perspective that eventually allows to positionthe publications related with this thesis within this data analytics framework.
1.3 Spatio-temporal Data AnalyticsObtaining positional data within competition provides spatial and temporal information aboutthe movement of players and objects—typically position, speed and acceleration6 over time.However, information about player trajectories is only of limited use as it does not directlyrelate to quantities and concepts of performance analysis, e.g. tactical or technical performance.As shown in Figure 1.1 the result of “tracking” Bobby Charlton and Franz Beckenbauerthroughout the World Cup Final 1966 is rather an artwork than something that can be directlyused to analyze and evaluate their performances. Therefore, some sort of transformation, e.g.event detection or pattern recognition, is needed to obtain useful parameters like shots, passesand possession sequences in football or step parameters in athletics. An analysis built onthese parameters can then be used to assess and understand player or team performance, e.g.tactical, technical or load analysis.This motivates to look at the analysis of player tracking data from a more data analyticalperspective which yields a hierarchical layer structure of data analytics—the data analyticspyramid. Typically, results of a particular layer can be used as input to a technique describedin a higher layer7.This hierarchical structure is shown in Figure 1.3 and is best illustrated by an example.
6This can vary based on the method used. Most video-based systems provide only x,y (and possibly z)positions. Speed and acceleration can then be obtained by numerical differentiation.
7Modern deep learning techniques actually allow to skip the second layer and use trajectory data directly tolearn a concept in the top layer (Knauf et al., 2016).

1.3. Spatio-temporal Data Analytics 7
Figure 1.3: A hierarchy of positional data analytics in sports–data analytics pyramid. A commonfirst step in data analytics is to capture spatio-temporal or event data in competition ortraining (layer 1). Based on player trajectories events, like passes and shots, are detected.Transformation and aggregation steps are needed for (manually captured) events oractions (layer 2). Results can then be used as basis for performance analysis (layer 3).The accuracy or quality of methods and parameters within each layer can (and should)be evaluated as errors will get propagated from lower to higher layers.
Example - Expected Goal Value Model in FootballConsider the tactical analysis task of understanding goal scoring in football8. This is usuallydone by training a machine learning algorithm to learn the (non-linear) relationship betweenscoring context and shot outcome, i.e. whether the shot resulted in a goal (Link et al., 2016;Lucey et al., 2015).
1. For this example, assume the model to be built on spatio-temporal player tracking data9
(layer 1 ).
2. A training set holds examples of shots on goal which resulted in a goal and also examplesthat did not result in a goal. The data set also contains features that describe the contextof the shot, e.g. distance and angle to goal, type of shot, etc. (layer 2 ).
3. Training a machine learning algorithm on many examples allows the algorithm to learn amodel of the relationship between shot context and shot outcome. Model performance isevaluated on an unseen test set and it can then be used for performance analysis (layer3 ) to (a) understand the most important features that influence whether a shot willresult in a goal and (b) to evaluate new unseen shots by providing the probability of thisshot resulting in a goal.
8In the literature, this type of analysis is commonly referred to as expected goal value (xG) model.9xG models can also be trained on event data.

8 Introduction
An example for the relationship between distance to goal and the likelihood of goal scoringis shown in Figure 1.4. Looking only on the distance from goal, and neglecting all othercontextual features, indicates that shots taken from outside the penalty box are less likely toresult in a goal.
Figure 1.4: Expected goal value modeling in football. Distributions of shot location based on allshots (left) and locations based only on shots which resulted in a goal (right). It is morelikely to score if the shot is taken from closer proximity to the goal. Taken from Luceyet al. (2015).
Layer 1 is concerned with data sources that comprise spatio-temporal and event data. Neitherresults from layer 1 and layer 2 are directly applicable to evaluate performance. Only furtheranalyses associated with layer 3 will allow to gain performance insights.
ValidationThe accuracy or quality of methods within each layer can (and should) be validated as errorswill get propagated from lower to higher layers:
• In the first layer, these evaluations will be accuracy studies of player tracking systemsassessing its capability to provide position, speed and acceleration. For notational analysissystems, for example, one can assess the reliability of two human observers to detect thesame actions.
• Within the second layer, accuracy of algorithms to detect passes, shots or foot groundcontacts are evaluated.
• In the third layer the accuracy of performance concepts, e.g. expected goal value model,are evaluated.
Horton (2018) describes a similar, but slightly more technical, layer structure when discussingthe current state of the art in sports analysis. Similarly, a higher layer can build on the resultsof a lower layer, starting with trajectories or events as input10.The pyramid structure presented in Figure 1.3 now allows to discuss the current state of theart and to position the publications on which this dissertation is based.
10Horton’s input layer also contains trajectory data as well as event logs and is succeeded by a data analyticslayer. Finally, visualizations can be created based on results from the analytics layer.

1.3. Spatio-temporal Data Analytics 9
Layer 1: Spatio-temporal Data
Information about the movement of players or athletes can be obtained by various means andan in depth analysis of tracking methods is presented in Chapter 2.Most studies do not concentrate on the quality of the tracking data itself and will simply usethis data to answer questions from layers 2 and 3. Buchheit & Simpson (2017) provided a goodoverview of player tracking systems and their use in football.Since any kind of data analysis, like aggregation or transformation is part of layer 2 themain topic addressed by studies within layer 1 is the evaluation of data quality provided byplayer tracking systems. However, there are only a few studies that investigated the accuracyof player positions. Siegle et al. (2013) compared the positional accuracy of a radio- andvideo-based tracking system for the use in football. The authors used a laser measurementdevice as criterion instrument that is commonly used in biomechanics and allows an accurateestimation of a players position for linear runs. Linke et al. (2018) and Ogris et al. (2012)set up a whole motion capture system as criterion within a stadium environment and wereable to come up with ground truth values even for small sided games. However, both studiesonly evaluated the accuracy of player tracking and excluded the football within their test setups.
The publication Evaluating the Indoor Football Tracking Accuracy of a Radio-based Real-Time Locating System evaluated the positional accuracy of radio-based football tracking bycomparing positional estimates to ground truth positions derived by manually marked highspeed camera footage (Seidl et al., 2016b).The publication Validation of Football’s Velocity provided by a Radio-based Tracking Systemextended this analysis by investigating the capability of radio-based football tracking to esti-mate (mean) football speed (Seidl et al., 2016a).Both publications deal with system validation and can therefore be assigned to layer 1.
Layer 2: Event Detection and Pattern Recognition
For spatio-temporal data the second layer involves some sort of event detection to extractevents or recurring patterns, like shots and passes in football. For event data, this step involvesaggregation and transformations of the data. Typically, developing a new method for eventdetection should also involve a thorough validation, e.g. how good does an algorithm for thedetection of shots in football work?Exemplary studies are the detection of individual ball possession in football (Link & Hoernig,2017) or the detection of step parameters, like step length and step time, based on video (Dunn& Kelley, 2015) or IMUs (Bichler et al., 2012; Schmidt et al., 2016). Choppin et al. (2018)used Hawkeye’s tennis ball tracking data to analyze differences in drag between new and oldballs in tennis. Since this study calculates a new parameter (drag) based on spatio-temporalball tracking data it can also be assigned to layer 2.
The publication Estimation and Validation of Spatio-temporal Parameters for Sprint Runningusing a Radio-based Tracking System developed and validated an algorithm to detect groundcontacts and estimate step length, step time and ground contact time from radio-based trackingdata (Seidl et al., 2017). Hence, it can be assigned to layer 2.

10 Introduction
Layer 3: Performance AnalysisWithin the third layer, analyses of results obtained by methods from the second layer allows tocome up with parameters or constructs that are relevant for performance analysis. Nowadaysmany of these studies will be based on machine learning techniques.Similar to the goal scoring example mentioned before, methods and studies within this layeroften rely on supervised learning techniques and include the development of expected goalvalue models in football (Link et al., 2016; Lucey et al., 2015) or expected goal assist models inice hockey (Stimson & Cane, 2017) which allows to better understand goal scoring and passing,respectively.But also the application of unsupervised learning techniques can be beneficial to enhanceour understanding of sports. In tennis, Kovalchik & Reid (2018) applied techniques fromunsupervised learning to obtain a taxonomy of shots for elite tennis players using trackingdata from multiple years of men’s and women’s matches at the Australian Open. Hobbs et al.(2018) recently applied trajectory clustering to quantify the value of transitions in football.Besides using techniques from machine learning, the application of methods such as networkanalysis can be used to compare passing behaviour across team sports (Korte & Lames, 2018).Due to high accuracy and sampling rates application of radio-based tracking, for example,enabled the analysis of intra-cyclic speed in 100 m sprint. The analysis of intra-cyclic speed hasbeen shown to be useful for performance analysis in other cyclic sports like swimming but onlythe investigation of positional player tracking data allowed to observe fine-grained speed cyclesover the full course of a 100 m sprint (Seidl et al., 2019). These studies clearly constitute totheoretical and practical performance analysis and can be seen as layer 3 studies. Within thishierarchical analysis structure also methods overviews for the analysis of spatio-temporal data(Gudmundsson & Horton, 2017; Horton, 2018) and reviews of tactical performance analyses insoccer using positional data (Memmert et al., 2017) are thought to be parts of layer 3.
The present work is organized as follows: this section, namely Chapter 1, “Introduction”,presents the topic of this publication-based thesis and outlines the major questions concerning(radio-based) positional player tracking in sports.Chapter 2, “Methods”, provides an overview of commonly used player tracking technologiesand methods in sports. As all publications have used the radio-based Local Positioning SystemRedFIR its functioning is discussed in detail.In Chapter 3, “Articles”, summaries of the underlying publications are presented and personalcontributions of the studies are mentioned.Chapter 4, “Discussion”, comments on important topics, such as deficiencies of currentvalidation studies for player (and ball) tracking systems, challenges related to transferability ofobtained parameters between multiple systems and to the analysis of spatio-temporal playertracking data.Chapter 5, “Conclusion and Outlook”, summarizes the results of this thesis, presentspromising approaches and further possibilities for research related to positional player trackingin sports.The publications on which this dissertation is based can be found in the “Appendix”.

11
Chapter 2
Methods
What gets measured gets managed.
Peter Drucker
Positional player tracking systems are nowadays common in training and competition andthere are a multitude of technologies that allow the acquisition of positional data in sports.Systems differ with regard to localization methodology, the potential need for transmitters ormanual post-processing, system’s applicability in training or competition, in indoor or outdoorscenarios, spatial and temporal resolution, as well as accuracy and level of detail of the obtainedpositional data.This chapter provides an overview of the most common methods for position tracking in sportstoday.
• Motion capture systems (MOCAP) track reflective markers attached to an athletebased on images obtained from multiple synchronized high-speed infrared cameras. Thesesystems are known to be accurate within millimeters and by attaching multiple markersallow to capture fine-grained motion details like the movement of body segments. MOCAPsystems are most commonly used in biomechanics laboratories.
• Video-based time-motion analysis (VBT) is based on the manual observation andannotation of videos to obtain activity patterns. It has a long tradition in sports but isno longer used due to the tedious and time-consuming annotation process.
• Global positioning systems (GPS) are nowadays widely used in training. Systemsonly need a player to wear a GPS receiver. Accuracy (within meters) and level of detailare low compared to other methods.
• Inertial measurement units (IMU) also need to be attached to players and typicallymeasure accelerations. The use of multiple IMUs allows to track the movement of bodysegments. However, IMU systems cannot be used as a standalone solution for positionalplayer tracking, but are often integrated in GPS or LPS transmitters.
• Semi-automatic video-based systems use computer vision algorithms to automatethe task of tracking players and objects in RGB videos. Fully automated systems are notyet available as obtained positional data still needs a considerable amount of manual post

12 Methods
processing. Video-based player tracking systems, which are used for tracking all playerswithin a football match for example, are known to be more accurate than GPS systems(with positional errors less than one meter). For very specific applications, like line callingin tennis or goal line technology in football, referee aid systems have been shown tobe accurate within centimeters. The level of detail is nowadays still low as objects aremostly approximated by two-dimensional points on the football pitch or tennis court.
• Local positioning systems (LPS) work similar to GPS and also need transmitterswhich have to be worn by players or have to be integrated into objects, like football or icehockey pucks. In contrast to GPS, LPS systems rely on a dedicated local infrastructureof receiving antennas around the sporting ground, allow to track many transmitters withhigher update rates and are known to be more accurate than video-based player trackingsystems. Depending on the system attaching multiple transmitters to a player can allowto capture the movement of body parts.
Functioning principles of these methods are explained and respective strengths and weaknessesare discussed in the following.Additionally, because all of the studies presented within this thesis used the radio-based trackingsystem RedFIR11 which was developed by Fraunhofer Institute for Integrated Circuits, thefunctioning principles behind the RedFIR system are also described in detail in Section 2.3.
Before an overview of tracking methods are presented it makes sense to discuss how theposition of player can be defined.
2.1 Assessing a Player’s PositionIn general the human body has a shape and volume and consists of different body segmentslike arms, legs or head. Hence, the question arises how to define the position of a player (orhuman body). Since measuring every single point12 belonging to a person’s volume is notpossible an approximation of the human body is needed.The most sensible solution is the (body) center of mass (COM). In biomechanics, it is definedas the unique point where the weighted relative position of the distributed mass of the objectsums to zero and “the entire mass of the body can be considered as concentrated in the centerof mass.” (Kingma et al., 1995). It is, therefore, common to assume that an object behaves asif it were a point mass located at the COM rather than a distributed mass (Winter, 2009).The COM can, thus, be used to effectively represent a football player for example.However, estimating the COM is a non-trivial task and typically requires a motion capturesystem and multiple markers (59 when using Vicon Plug-in Gait for example (Judson et al.,2018)) directly attached to the human body. Given estimated body segment positions, theposition of the COM can then be calculated using a mathematical model of the human body(Hanavan, 1964; Hatze, 1980). This approach is widely used in biomechanics laboratories. Asthis process is very time consuming, even in biomechanics less complex alternatives, such as theattachment of only one marker to the sacrum, are often used to minimize the effort required
11The latest version of the system is called “jogmo”.12This point can be, for example, a pixel in a 2d-image or a voxel in a 3d-image.

2.1. Assessing a Player’s Position 13
Figure 2.1: “Moving dots” are the result of the application of player tracking systems. This exampleshows the camera-based Stats SportVU tracking system for basketball. Image taken fromStats (2019).
to determine the COM (Gard et al., 2004). In sports practice, training and competition, theestimation of COM based on a full body model and motion capture system is simply notpossible and the results of tracking multiple players in sports are typically “moving dots” onthe pitch or court, which are rough approximations of their respective COMs. An example forvideo-based player tracking in basketball resulting in “moving dots” is shown in Figure 2.1.How the COM is approximated depends heavily on the tracking method and there are various,mostly technical, reasons why most (LPS and GPS) transmitters are attached between theshoulders rather than to the sacrum. These include the positioning of receiving antennas forLocal Positioning Systems (LPS), line of sight between GPS receiver and satellites or otherdifficulties when attaching transmitters to an athlete. However, deviating from the theoreticallyoptimal position of COM has severe implications for the interpretation and comparison ofderived tracking variables like covered total and sprinting distance (Linke & Lames, 2018).Figure 2.2 shows the result of attaching markers to pelvis and scapulae. The former is typicalwhen using transmitter-based methods, e.g. GPS or LPS, whereas the latter position is a morerealistic representation of COM for video-based systems13.
An estimate of a player’s or object’s position is then given by the three- or two-dimensionalposition of the estimated COM on the playing field. Tracking a player then means to follow
13How the center of mass will be estimated depends on the tracking method: in vision-based systems themidpoint of a rectangle surrounding a player is commonly used, whereas for transmitter-based systems theposition of the transmitter on the human body will be used as a representation of the COM.

14 Methods
Figure 2.2: Approximating a player’s position: the center of mass. Estimation of the COM dependsheavily on the placement of multiple markers/transmitters on the human body and isbased on mathematical equations (Hanavan, 1964; Hatze, 1980). Center of pelvis (COP)in red and center of scapulae (COS) in yellow are calculated based on markers attached topelvis and scapulae. Sacral marker (SACR) is shown in green. Derived covered distanceand sprinting distance varies strongly based on the used marker positions. Taken fromLinke & Lames (2018).
the player over time, e.g. (x, y, t) where (x, y) corresponds to the two-dimensional position ofthe object at a time stamp t, relating position to a moment in time. Besides knowing position,clearly information about the kinematics of objects like speed and acceleration hold valuableinformation.
Nowadays, many different methods to track players and athletes in sports are availableand an overview of current methods is given in the following.
2.2 Tracking Methods in SportsThere are multiple methods to obtain positional data in sports and this section provides anoverview of most common tracking technologies.Tracking systems vary with regards to the level of detail at which the movement of a playercan be captured. A graphical comparison of tracking methods mentioned in the introductionof this chapter is shown in Figure 2.314. The comparison is based on level of detail (LoD) andpositional accuracy. LoD measures a system’s ability to track details of the human body. Itranges from systems summarizing the body as point mass (“moving dots”) over tracking ofbody segments to systems capable of tracking a full body model. System accuracy is shown onthe x-axis. Accuracy increases from left to right and, therefore, a system that provides highlyaccurate and detailed positional data can be found in the upper right corner.In the lower left corner video-based time motion analysis (VBT) and GPS systems are positionedas these systems allow only rough position estimates (errors larger than 1 m) and low level of
14Note that this figure only represents a schematic overview and accuracies of systems based on the samemethod can vary widely. As it is almost impossible to compare results from accuracy studies for differenttracking systems this figure is thought to provide a rough overview and should be interpreted with caution.

2.2. Tracking Methods in Sports 15
Figure 2.3: Tracking technologies in sports are compared based on positional accuracy (x-axis) andtracking level of detail (y-axis). With typical accuracies of more than one meter video-based time motion analysis (VBT) and GPS are known to be not very accurate andonly provide a low level representation of the human body as “moving dot”. The useof multiple IMUs enables the tracking of body segments, but there is in no IMU-basedsystem available that provides accurate positional data. The accuracy of video-basedtracking system varies strongly based on its application (tracking all 22 players in footballor monitoring of small regions, like court lines or goal line, for aiding referee decisions).Local Positioning Systems (LPS) can vary based on the systems’ capabilities to trackmultiple transmitter per player. Based on the overall frequency of the system, this mightenable tracking of body parts. This is reflected by the LPS box ranging from “movingdots” to “body segments” with respect to tracking level of detail. Therefore, LPS canbe positioned in between low level video-based tracking and high level motion capturesystem used within biomechanics which allow for tracking of a full body model with highaccuracy14.
detail , i.e. “moving dots”. Attaching multiple inertial measurement units (IMUs) to an athleteallows the tracking of body parts. However, due to position drift, IMUs are not very accurateto provide player positions over a longer period of time. The accuracy of video-based trackingsystems depends on its application; player tracking systems monitoring the entire footballpitch and all players achieve accuracies ranging from 50 cm to 1 m. Video-based referee aidsystems are almost as accurate as motion capture system but currently allow only for a lowlevel representation of the human body15. Radio-based tracking systems (LPS) are known tobe accurate within 30 cm. But, there are differences between commercially available systemswith regards to tracking multiple transmitters per player. Dependent on the overall frequency
15Recent advantages in Computer Vision actually allow to fit body pose models which enable the tracking ofbody segments (Felsen & Lucey, 2017). Today, however, no commercially-available video-based tracking systemcurrently allows for such a level of detail. Section 5 provides more details about the detection of body posewithin videos and its application to sports.

16 Methods
of the system, this might enable the tracking of body parts. Therefore, LPS can be positionedin between low level video-based tracking and high level motion capture system used withinbiomechanics. Motion capture systems show the highest accuracy and achieve a very hightracking level of detail by attaching many markers to the human body.In the following the player tracking methods shown in Figure 2.3 are described in more detail.
Motion Capture SystemsMotion capture systems are based on the detection of reflective markers in infrared images.Corresponding real world 3d positions are then estimated based on triangulation of markerpositions from multiple camera images (Leser & Roemer, 2014, pp. 87–89). Due to the extensivesetup MOCAP systems are typically installed in biomechanics laboratories and are known tobe accurate within millimeters for a small volume of a few meters (van der Kruk & Reijne,2018; Windolf et al., 2008). Attaching multiple markers allows to track body segments andeven to obtain full body models. This is especially useful for technical analysis in sports likefor the analysis of golf swing or tennis serve which is based on the analysis of body segmentangles and movements. MOCAP systems are nowadays the gold standard for tracking movingobjects in a small volume.Drawbacks are the high cost, the need to attach markers and the limited applicability to trackmultiple players. These make motion capture system impractical for the use in training16 orcompetition.Examples of MOCAP systems employed in sports research include VICON, Motion AnalysisCorporation and Qualisys.
Video-based Time–Motion Analysis SystemsA traditional method for player tracking which has been most prevalent even before the riseof computers and digital video is commonly referred to as video-based time motion analysis(VBT) (Bangsbo et al., 1991; Mohr et al., 2003) which is part of Notational Analysis (Hughes& Franks, 2004). The manual or computerized analysis of video recordings of the sportingcompetition allows, for example, the schematic recording of player and ball movements duringa rally in tennis (Talbert & Old, 1983) or to manually record an attacking play in football(Winterbottom, 1959). Activity patterns, like time spent and covered distance within differentlocomotor categories (standing, walking, low-intensity and high-speed running) is based on“time for the player to pass pre-markers in the grass, the centre circle and other known distanceswas used to calculate the speed for each activity of locomotion.” (Mohr et al., 2003, p. 520)Based on its non-invasive nature and since it only needs a human observer watching a match17
similar observational techniques from notational analysis are nowadays still widely used torecord events within competition, e.g. passes, shots (and corresponding locations), corner kicksor yellow cards. However, a fair amount of practice is still required for a human observer toaccurately record events as they happen. No information about distances and speed of playerswhich are not directly involved in attacking sequences is contained in event data. NotationalAnalysis is still widely used in competition. VBT, however, is no longer used due to its tedious
16Except for the before mentioned analysis of technique.17This can be done while sitting within a football stadium or by watching the broadcast.

2.2. Tracking Methods in Sports 17
and time-consuming process. An automated alternative, that is nowadays commonly used intraining, is based on Global Positioning System.
Global Positioning Systems
Figure 2.4: Graphical comparison of positioning principles used in GPS and LPS. GPS positioning istypically based on lateration of Time of Arrival (ToA) values (a) whereas LPS systemslocate objects based on Time Difference of Arrival (TDoA) values (b). ToA positioningimplies the object (MS) to be located within the intersection of all circles around basestations (BS). TDoA positioning implies the object to be located at the intersection ofhyperboles. Figure taken from Zaidi et al. (2010).
Global Positioning Systems (GPS) are widely used in outdoor training environments. GPSsystems only require line of sight between a GPS receiver—typically worn by athletes—andGPS satellites which makes these systems especially well-suited for the use in training. Aplayer’s position is estimated by lateration of GPS signals between multiple satellites and GPSreceiver. Multiplying the time of arrival (ToA) of the incoming signal with the speed of lightyields the estimated distance drs between receiver r and satellite s. In case of two-dimensionallocalization, this enforces the receiver’s location to lie on a circle18 with radius drs aroundthe satellite (lateration). Intersecting measurements from at least three satellites allows todetermine the 2d position of the object19. Another possibility for localization is based on thetime differences of arrival (TDoA) between a pair of satellites and the GPS receiver to obtainthe position of the object. A graphical comparison of ToA- and TDoA-based positioning forthe two-dimensional case is depicted in Figure 2.4. Lateration of ToA values as in GPS (Figure2.4(a)) implies the object to be located at the intersection of circles around the GPS satellites
18This is only true in two dimensions. In three dimensions the receiver’s location is determined to lie on aball of radius drs around the satellite.
19Due to small measurement errors, there is actually no guarantee that circles intersect at exactly one point.In practice, the positioning task boils down to solving a least squares optimization problem. This can be doneefficiently, e.g. by the method of Levenberg (1944) and Marquardt (1963).

18 Methods
whereas LPS systems commonly rely on hyperbolic positioning based of TDoA values whichimplies the object to be located at the intersection of hyperboles (Figure 2.4(b)).Update rates (ranging from 1 Hz to 15 Hz) and positional accuracy are rather low with typicalerrors greater than one meter (Linke et al., 2018). Tracking quality is strongly influenced byvarying weather conditions and line of sight between receiver and GPS satellites. This prohibitsthe application of GPS systems in indoor scenarios.However, due to easy application, system mobility and low cost, GPS systems are mostcommonly used for load monitoring in outdoor training. Commercial systems include Catapult,Polar and GPSports.
Inertial Measurement UnitAn inertial measurement unit (IMU) is an electronic device that combines accelerometers,gyroscopes and sometimes also magnetometers. Unlike GPS, IMUs do not need any (satellite)infrastructure to work and are known to provide accurate information about accelerations withhigh update rates (up to 2000 Hz). The low cost and its applicability in indoor and outdoorenvironments make them especially useful in settings where GPS signals are not available.However, as positional estimates can only be obtained by double numerical integration ofthe measured accelerations this results in a position drift error, meaning that the estimatedposition drifts away from the actual position due to an accumulation of integration errorsover time (Leser et al., 2011; Taborri et al., 2016). Also, the necessary synchronization andcommunication of all IMUs across an entire football field, for example, makes the developmentof such systems challenging and, as a consequence, there are currently no commercial playertracking systems available that rely solely on IMUs. Most promising is the combination withother tracking methods like GPS or LPS (Bichler et al., 2012; Braysy et al., 2010).A main drawback of attaching transmitters or IMUs to players is that data will only be availablefor players actually wearing a transmitter. This way, in competition no information aboutopponents can be provided. Using video allows to circumvent this issue as is permits to obtaininformation for all players present in the image or video.
Semi-automatic Video-based SystemsModern video-based systems are most commonly used in competition in team sports, such asfootball or basketball, and can rely on a fixed installation of multiple synchronized cameras orthe use of broadcast videos from one camera. There are basically two types of video-basedsystems:
• Referee aid systems
• Player tracking systems
Hawkeye’s line calling system in tennis and goal line technology (GLT) system in football20
are typical examples of referee aid systems. These systems rely on a fixed installation ofsynchronized (high resolution and high speed) cameras within a sport stadium and monitoronly a small part of the tennis court (court lines) or football pitch (goal area). In this small
20An alternative RFID-based approach to GLT has been certified by FIFA and is described by Psiuk et al.(2014).

2.2. Tracking Methods in Sports 19
area systems record the position of a tennis ball or football with very high accuracy21. Systemsare used to aid the referee in deciding whether a ball has crossed the goal line in football ortouched the court line in tennis.Player tracking systems on the other hand do not necessarily have to be based on a fixedinstallation of cameras in the stadium but can also work on broadcast videos. Usually muchcheaper HD cameras (25 Hz) are used. These systems typically monitor the entire football pitch(or large portions in case of broadcast videos) and track all players and the football within thislarger area. Due to the wider setting tracking accuracy is not nearly as good as for referee aidsystems. Examples for player tracking systems include Stats SportVU, ChyronHego’s Tracaband Second Spectrum.
Regardless of the application, semi-automatic tracking of players in sport videos is commonlybased on multiple preprocessing steps, like play field detection, player detection, occlusionresolution and appearance modelling as described by Manafifard et al. (2017). This is shownin Figure 2.5.
Figure 2.5: Flowchart for video-based player tracking systems. Figure taken from Manafifard et al.(2017).
All of these steps aid the tracking of players and eventually provide real world player locations onthe football pitch or tennis court for example. Playfield detection eliminates the spectator regionfrom an image and, therefore, decreases the possibility for false detections. Player detection isneeded for initialisation of the subsequent tracking task and results in an approximation of aplayer by a rectangular bounding box. A player’s location is then typically determined by theposition of the feet. Player labeling assigns each player to a team. Since results of the previoussteps still lack information about the temporal relationship between frames, this information isadded by application of Kalman or Particle Filters or the Meanshift algorithm in the playertracking step. This step is similar to how LPS systems integrate temporal information intopositioning algorithms. Another problem are occlusions, as stated in Manafifard et al. (2017):
21For a goal line technology system installation to be certified by FIFA it needs to pass a testing procedurethat assures an accuracy of ±1.5 cm. The Hawkeye GLT system, for example, uses images from seven camerasper goal that are installed as high as possible within the stadium structure.

20 Methods
(a) Result of player detection and labeling stepsfor tracking football players. Bounding boxes,coloured by team identity, are drawn around play-ers. Figure taken from Beetz et al. (2006).
(b) Camera calibration allows to map image pix-els (CP1 and CP2) to corresponding real worldlocations (green dot). In tennis, usually linemarkings on the tennis court are used for cameracalibration. Figure taken from Renò et al. (2017).
Figure 2.6: Player detection and real-world position. Results of player detection in football andmapping image pixel to real world locations in tennis.
“Occlusions occur when some players are located in front of the others alongthe optical axis of the camera, and thus backward players are hided partially orcompletely.”
Therefore, occlusion resolution is probably the most severe challenge for video-based playertracking systems. Each of these steps needs to be evaluated separately.Exemplary results for football player tracking and labeling are shown in Figure 2.6a. Boundingboxes for players are drawn in the image and coloured by team identity. Pitch markingsare used for camera calibration and allow to map player pixels in the image to real worldcoordinates on the football pitch (Beetz et al., 2006) or tennis court (Renò et al., 2017) withthe result being “moving dots” (green dot) as shown in Figure 2.6b.Although video-based tracking in sports has a relatively long tradition (Beetz et al., 2005)only recent advances in the field of computer vision—related to the use of Deep ConvolutionalNeural Networks (CNN)—in particular improved the state-of-the-art for detection algorithms.Nowadays, these networks allow to automatically track players and objects in sports withunprecedented quality. Large amounts of labeled images for training combined with a deepnetwork structure allow the network to correctly detect and classify objects in an image(Goodfellow et al., 2016; Lee et al., 2009). Figure 2.7 shows how deep CNNs can learn morecomplex features (e.g. object parts) which built on low-level features (e.g. corners or edges)from earlier layers.
Despite these advances, challenges for video-based player tracking systems are still changingenvironmental conditions, like weather and light, and most importantly occlusions betweenplayers (and ball) which lead to swapping of player identities. Resulting drawbacks are the

2.2. Tracking Methods in Sports 21
Figure 2.7: Convolutional Neural Networks for object detection. The deep network structure, com-prising multiple layers, allows the network to build on low level features, like edges (firstlayer) in earlier layers and learn more complex features, like object parts (layer 3), indeeper layers. Image taken from Goodfellow et al. (2016).
limited accuracy (in particular for ball tracking), the low level of detail (“moving dots”) andthe need for manual post-processing (Barris & Button, 2008). This together with the need ofcameras being installed at a certain height shows why video-based tracking systems are mainlyused in competition.
Local Positioning SystemsLocal Positioning Systems (LPS) circumvent all of these challenges as systems locate objectsbased on analyzing radio signals emitted from transmitters to receiving antennas. Therefore,these systems are commonly referred to as radio-based systems. A radio transmitter has to beworn or attached to an athlete and enables a consistent assignment of player identities—evenin case of visual occlusions—by using a certain bandwidth within the frequency spectrum.Hence, there is no need for manual post-processing of player tracking data. Figure 2.8 showsthe frequency spectrum for a range of communication and localization methods, e.g. GlobalNavigation Satellite System (GNSS), Global System for Mobile Communications (GSM),WLAN, Bluetooth and Ultra-Wideband (UWB)22. Frequencies used by commercially-availableLPS tracking systems for sports applications are also shown.In contrast to GPS, localization of objects relies on a dedicated local infrastructure of receivingantennas around the sporting ground. When LPS systems are installed in stadiums for live
22Emitted radio wave belongs to UWB if either the bandwidth exceeds 500 MHz or 20% of the carrierfrequency. In order to avoid interference with other radio services, the Federal Communications Commission(FCC) in the USA has limited the unlicensed use of UWB to an equivalent isotropically radiated power densityof -41.3 dBm/MHz and restricted the frequency band to 3.1 GHz - 10.6 GHz (respectively 6.0 GHz - 8.5 GHz inaccordance to the European Communications Committee (ECC))(Mautz, 2012).

22 Methods
measurements interference between the tracking system and other services like WLAN canbecome an issue.
Figure 2.8: Frequencies of Local Positioning Systems and frequency spectrum for a range of communi-cation and localization methods. Image taken from (Mautz, 2012, p. 69). Frequencies usedby LPS player tracking systems Zebra MotionWorks, Inmotio LPM, Catapult ClearSkyand Fraunhofer RedFIR have been added. Most LPS systems, with the exception ofRedFIR, are UWB systems. RedFIR, Catapult ClearSky and LPM use frequencies thatare also used by WLAN which can be an issue when systems are used in a stadium duringcompetition. No information about the frequency bands used by Kinexon were found.
High update rates, the ability to track many transmitters simultaneously and the potential forcm-level accuracy makes these systems convenient for precise ranging and positioning in indoorand outdoor environments (Mautz, 2012). Therefore, these systems are especially well-suitedfor sports applications. Drawbacks are the high cost, the need to attach transmitters to athletesand the need for a dedicated receiver infrastructure around the sporting ground.
“From a mathematical point-of-view, the position calculation (. . . ) is similar tothe methods used in the GPS, as there are satellites with known positions and areceiver with an unknown position and a time offset due to a missing synchronizationbetween the receiver and satellites.” (Stelzer et al., 2004, p. 2665)
The underlying functional principles for most LPS systems are similar as those typically relyon multi-lateration (hyperbolic positioning) of TDoA values of the radio signal between atransmitter and multiple receivers23 rather than using ToA values (like GPS). This allows toestimate the position even in absence of synchronisation between transmitter and receiver. Inaddition, LPS systems are usually calibrated based on reference transmitters placed at knownpositions (Grün et al., 2011; Stelzer et al., 2004). As overall update rates are distributed over
23In two dimensions a hyperbolic curve describes the possible location of a transmitter between a pair ofreceiving antennas for one known TDoA value (Figure 2.4).

2.2. Tracking Methods in Sports 23
all active transmitters the frame rate per transmitter (and, therefore, player) decreases asthe total number of transmitters increases. For example, to obtain information about playerheading a second transmitter per player is necessary which further decreases update rates pertransmitter24.As positional estimates based on hyperbolic positioning can still be noisy, LPS systems oftenrely on an additional filtering step like a Kalman Filter (Kalman, 1960). Filtering increasespositional accuracy by denoising raw positional estimates and also allows to estimate velocityand position simultaneously25.
Main differences between systems can be found with regards to update rates, used frequencybands, different number, size and weight of transmitters, the possibility of integrating transmit-ter into objects, like football, basketball or ice hockey puck, and the option for a mobile system.Table 2.126 shows a comparison of commercially available LPS systems for sports applicationsFraunhofer RedFIR, Inmotio LPM, Kinexon, Catapult ClearSky and Zebra MotionWorks.
System Company Method Frequency(GHz )
FrameRate(Hz )
Transmitter(mm3 )
BallTrack-ing
Mobile
RedFIR Fraunhofer Radio 2.4 50, 000 61× 38× 7(15 g) yes noLPM Inmotio UWB 5.8 1, 000 92× 57× 15(60 g) no yesKinexon Kinexon UWB 3.5− 6.5 1, 000 47× 33× 7.5(15 g) yes yesClearSky Catapult UWB 5.2 1, 200 40× 52× 14(28 g) no noMotionWorks Zebra UWB 6.5 3, 500 22.7× 10(7 g) yes no
Table 2.1: Summary of Local Positioning Systems for sports applications. Differences between systemsbased on localization method, used frequency bands, frame rate, transmitter size andweight, the possibility of ball tracking and system mobility is shown. All systems, exceptfor the Zebra system use rectangular transmitters, whereas Zebra uses round transmitters.For the latter transmitter column contains radius × height.
LPS systems use miniaturized lightweight transmitters—typically weighting less than 60 g—andmost of the systems are based on UWB. As transmitters are actively sending signals, theseneed to be charged. Battery life times can range between a couple of hours (RedFIR, LPM,Kinexon and ClearSky) to years (Zebra MotionWorks)27. The integration of transmitters intoa football, basketball or ice hockey puck, is challenging as transmitters have to be integrated
24This can be useful to distinguish between a player jogging forward or backwards (O’Donoghue, 2015).Using an LPS system with an overall frame rate of 1000 Hz for tracking 22 players in a football match, leads toa maximal frame rate of 45.45 Hz (= 1000 Hz
22 ) for each player.25The alternative would be to numerically differentiate positional estimates which will possibly result in
unrealistic velocities without further filtering or smoothing.26Information is based on offical web pages from tracking providers or published web articles. Since this
might not be a reliable source, this table should be read with caution. The difficulty to obtain this kind ofinformation, however, is a good example for the current challenges when dealing with player tracking systems.
27Battery life time depends heavily on update rate. The life time given by Zebra MotionWorks is based ontransmitter with a frame rate of 1 Hz.

24 Methods
seamlessly—rules do not allow any modification of ball weight, size and flight characteristicsif the object is to be used in an official match. That such a seamless integration is possiblefor a football was shown by the magnetic-field based goal line technology system “GoalRef”which integrated copper coils into a football to determine the moment when a ball crossesthe goal line. GoalRef was officially certified by FIFA for use in official matches (Psiuk et al.,2014). LPS transmitters have been succesfully intregrated into a football (RedFIR, Kinexon),handball and volleyball (Kinexon), an american football (Zebra) and ice hockey puck (RedFIR).By integrating a transmitter into the object LPS systems can provide a consistent and accurateball tracking without the need for manual post-processing.Commercial radio-based LPS systems include Fraunhofer’s RedFIR/jogmo, Inmotio’s LPM,Kinexon, Catapult’s Clearsky and Zebra’s MotionWorks.
As all publications have used the RedFIR LPS system, details about the system’s functioningare presented in the following.
2.3 Functioning of Radio-based Tracking System Red-FIR
The following description of a RedFIR system is based on the system installation in the footballstadium in Nuremberg, Germany (Grün et al., 2011; Mutschler et al., 2013; Seidl et al., 2016b).The localization process is illustrated in Figure 2.9.Like other LPS systems, the RedFIR Real-Time Locating System (RTLS) is based on time-of-flight measurements, where small transmitter integrated circuits emit burst signals. Twelveantennas around the pitch receive these signals and send them to a centralized unit whichprocesses them and extracts time of arrival (ToA) values. Based on time difference of arrival(TDoA) values between pairs of receiving antennas raw estimates for the three-dimensionalposition of a player or ball are obtained. The application of a Kalman Filter provides realisticestimates for position, speed and acceleration by the combination of a motion model withraw position measurements. The RedFIR system operates in the globally license-free ISM(industrial, scientific, and medical) band of 2.4 GHz and uses the available bandwidth ofaround 80 MHz. Miniaturized transmitters generate short broadband signal bursts containingidentification sequences. The locating system is able to receive and process an overall of 50, 000of those signal bursts per second. This specific installation provides 12 antennas that receivesignals from up to 144 different transmitters. Balls emit around 2, 000 tracking bursts persecond whereas the remaining transmitters (61 mm× 38 mm× 7 mm, 15 g) emit around 200tracking bursts per second. The miniature transmitters themselves are splash-proof (in case ofthe player transmitters) or integrated into the football.Besides providing kinematics for players and ball the RedFIR system also incorporates amiddleware to detect events, like passes or shots, based on positional data in real time.Compared to other LPS systems, the high overall sampling rate of 50.000 Hz allows the potentialuse of multiple transmitters per player with update rates beyond 200 Hz which enables thetracking of body segments (Figure 2.3). The real-time availability of kinematic data andsubsequent events makes this system in particular useful for potential feedback applications intraining.

2.3. Functioning of Radio-based Tracking System RedFIR 25
Figure 2.9: Functioning of the RedFIR system. Transmitters can be attached to players, trainingmaterial or integrated into a football. Position, speed and acceleration are derivedfrom time difference of arrival values between transmitters and receiving antennas (1.Positioning) and subsequent filtering (2. Kalman Filtering). The system also provides amiddleware to detect events based on this positional data (3. Event Detection). Withpermission.
As discussed before, Kalman Filtering not only allows to increase the accuracy of player positionsbut also provides estimates for velocity and acceleration. However, in certain situations, likefast changes in direction, this process can lead to tracking artefacts. Therefore, the principlesbehind Kalman Filtering and its implications for capturing sport-specific motion is discussedin the following.
Kalman Filtering — PrinciplesEstimation of positions solely based on multi-lateration of TDoA values results in relativelyaccurate positions, where errors are usually less than one meter. To obtain cm-level accuracyLPS (and video-based) systems typically incorporate additional information about the temporalrelationship between subsequent measurements into positioning. This is commonly done byapplying a Kalman Filter (Kalman, 1960).On a high level, a Kalman Filter allows to combine actual measurements and an underlyingmotion model into a single state estimate, which typically contains position and speed. Theimprovement of positional estimates is based on a two-step process where the position of aplayer is predicted based on an underlying motion model (“time update”) and this predictiongets updated based on observed measurements (“measurement update”). For more detailson mathematical principles behind the Kalman Filter see Perse et al. (2005) who applied aKalman Filter to obtain smooth player positions for video-based tracking.

26 Methods
Figure 2.10: Fundamentals of Kalman Filtering. A Kalman Filter consists of two steps: time updatestep predicts the next state of a player x−
k based on a motion model. The measurementupdate step updates the predicted position by incorporating the current measurementzk. Figure taken from Welch & Bishop (1995).
The interplay between update and prediction steps is shown in Figure 2.10. The time updatestep predicts the movement of the player and process covariance P −
k based on the underlyingmotion model. To correct the prediction based on observed measurements the Kalman GainKk = P −
k HT (HP −k HT + R)−1 is calculated. It works like a gate for how much correction is
applied and is strongly influenced by the process noise Q and measurement noise R. If R getslarge, i.e. measurement is very noisy, Kalman Gain goes to zero.Based on the Kalman Gain the estimated state x−
k is updated based on the observed measure-ment zk as xk = x−
k + Kk(zk−Hkx−k ). Kk corresponds to a weighting of innovations zk−Hkx−
k ,.i.e. how much confidence should be put on the measurement compared to the prediction basedon the motion model. Large Kk tend to put more weight on measurements, whereas smallvalues of Kk put more emphasis on the prediction.State covariance will then be updated as Pk = (I −KkH)P −
k , i.e., covariance gets smaller whenKk > 0, i.e. if measurement helps to improve the prediction. This process is then repeated forall measurements.This way the Kalman Filter allows to improve the positioning of LPS systems based onunderlying motion and measurement models.However, the filter is also responsible for motion artefacts when dealing with fast changes ofdirection. This will be discussed based on two real-world examples.
Kalman Filtering — ExamplesAs was shown, the application of a Kalman Filter allows to come up with realistic playermotions the majority of the time. However, this process is also responsible for motion artefactswhen dealing with fast changes of direction—which are typical for football. It is not fullyunderstood where these artefacts come from as there are two possible sources of error:
(a) Measurement errors. The measured phase values overestimate the average speed, which iswhy a compensation process (undershoot) takes place. So errors are caused by measuredvalues. The same can result for the ToA measurements, because these have even largermeasurement errors.

2.3. Functioning of Radio-based Tracking System RedFIR 27
(b) Model errors. The constant acceleration motion model acts like a low-pass filter, smoothingout jerky movements. Relaxing the constant acceleration assumption to a constant velocitymodel might result in smaller filter effects.
Regardless of the error origin, filtering leads to unrealistic results and to errors in player orball positions when dealing with sports-specific movements.Figure 2.11a shows the effect of Kalman Filtering raw positional estimates for the movementof a football player tracked by Inmotio’s LPM system (Ogris et al., 2012). Kalman Filtering(solid blue line) clearly improves raw positioning estimates (green dots) as can be seen byobserving deviations from ground truth positions (dotted black line). Deviations of filteredpositions and ground truth estimates are rather small during straight runs but increase whenthe player changes direction.A similar effect can be observed when attaching a RedFIR transmitter to the shoe of an athleteduring sprinting. High decelerations of the foot before ground contact and high accelerationsafter ground contact (in movement direction) lead to unrealistic negative velocities as shownin Figure 2.11b.To circumvent these issues a threshold-based method was applied to determine ground contactsbased on LPS data. This allowed to compensate for movement artefacts through the KalmanFilter (Seidl et al., 2017). Another possibility would be the development of a more realisticmodel for moments when fast changes in direction happen.

28 Methods
(a) Fast changes of direction in football captured by a radio-based position tracking system.Green dots correspond to raw position estimates based on multi-lateration of TDoA values.Kalman filtered positions are shown as solid blue line. Comparing both estimates to groundtruth positions obtained by a motion capture system (black dotted line) shows the difficultiesof capturing changes in direction. Figure taken from Ogris et al. (2012).
(b) Application of radio-based tracking in 100 m sprint. Velocity of a transmitter attached tothe shoe of an athlete during 100 m sprint is shown (blue line). Unrealistic negative velocitiesare observed that could be caused by Kalman Filtering. As a consequence finding an optimalthreshold for the detection of ground contacts was needed to compensate for filtering artefacts.Figure taken from Seidl et al. (2017).
Figure 2.11: Kalman Filtering artefacts for LPS systems based on fast change of direction in footballand for ground contacts of the foot during 100 m sprint.

29
Chapter 3
Articles
In this chapter, a summary of the articles submitted for this thesis is presented and the personalcontributions of the author are mentioned.
3.1 Evaluating the Indoor Football Tracking Accuracyof a Radio-based Real-Time Locating System
Seidl, T., Völker, M., Witt, N., Poimann, D., Czyz, T., Franke, N., & Lochmann, M. (2016b).Evaluating the indoor football tracking accuracy of a radio-based real-time locating system. InP. Chung, A. Soltoggio, C. W. Dawson, Q. Meng, & M. Pain (Eds.), Proceedings of the 10thInternational Symposium on Computer Science in Sports (ISCSS), volume 392 of Advances inIntelligent Systems and Computing (pp. 217–224). Cham: Springer.DOI: https://doi.org/10.1007/978-3-319-24560-7_28
ContributionThe author’s contributions to this paper were the literature review, development of testmethodology, data analysis, writing of the Section Introduction, the Section Methods, and theSection Results. Data acquisition and writing the Sections Discussion and Conclusion wasdone together with the co-authors.
SummaryNowadays, many tracking systems in football provide positional data of players but only a fewsystems provide reliable data of the ball. Video-based systems are commonly used to trackplayers and ball in competition.However, the tracking quality of video-based systems suffers from high ball velocities upto 120 km h−1 and from the occlusion of both the players and the ball. To the best of ourknowledge, there are actually no studies dealing with the positional accuracy of ball tracking.The use of radio-based local positioning systems for tracking in sports is promising as thesesystems allow for higher update rates and, theoretically, higher accuracy. Player transmittersare tracked with 200 Hz whereas the football transmitter even achieves update rates of 2000 Hz.These systems use transmitters integrated in the ball and located on the players’ back or near

30 Articles
the shoes to avoid before mentioned issues.This paper tried to close this gap by using the RedFIR radio-based locating system togetherwith a ball shooting machine to repeatedly simulate realistic situations with different velocitiesin an indoor environment. As criterion a calibrated high speed camera with a frame rate of1000 Hz was used and the position of the football was manually marked in the images by fittinga circle around the ball throughout 30 video sequences.Positional accuracy of the ball tracking was evaluated by means of root mean square er-ror (RMSE) and Bland-Altman analysis. On average a RMSE of 12.5 cm with 95 %-CI of[−21.1 cm,−1.9 cm] was observed.Results showed the applicability of radio-based local positioning systems for tracking a footballwith a high accuracy.
3.2 Validation of Football’s Velocity provided by a Radio-based Tracking System
Seidl, T., Czyz, T., Spandler, D., Franke, N., & Lochmann, M. (2016a). Validation of football’svelocity provided by a radio-based tracking system. Procedia Engineering, 147, 584–589.DOI: https://doi.org/10.1016/j.proeng.2016.06.244
ContributionThe author’s contributions to this paper were the literature review, data analysis, writing ofthe Section Methods, and main parts of the Section Discussion. Data acquisition and writingthe Sections Introduction, Discussion and Conclusion was done together with the co-authors.
SummaryBuilding on the results of the previous study, dealing with the positional accuracy of radio-basedball tracking, the capability of radio-based football tracking to provide accurate football speedwas investigated. As the previously used test setup did not allow to investigate the effect oflargely varying ball speeds a slightly different setup was used. This study was, therefore, thefirst to consider the accuracy of ball speed estimates for radio-based football tracking.To assess the accuracy of the football’s velocity provided by the radio-based tracking systemRedFIR, again, a ball shooting machine was used to repeatedly simulate realistic situations atdifferent velocities in an indoor environment. The new setup (with no shooting wall) allowed tocapture 50 shots at a much wider range of ball velocities ranging from 7.9 m s−1 to 22.3 m s−1.Obtained football speed values were compared to criterion speed values derived from lightgates by way of mean percentage error (MPE) and Bland-Altman analysis.Results showed a systematic bias of 2.6 % which indicates that the football’s speed providedby the RedFIR system slightly overestimated the football’s mean speed. Limits of agreementof 9.6 % (1.9 m s−1) and the fact that 92 % of analyses had an absolute error of less than 6 %prove RedFIR’s ball speed to be accurate within 10 % for velocities ranging from 7.9 m s−1 to22.3 m s−1.This study demonstrated the applicability of the RedFIR ball tracking to measure (mean) ballspeed. This can be used to provide speed information about passes and shots, and combined

3.3. Estimation and Validation of Spatio-temporal Parameters for Sprint Running using aRadio-based Tracking System 31
with information about the ball position allows to quantitatively assess technomotorical skillsof football players like ball handling, passing and shooting behaviour that is fundamental for aquantitative evaluation of football players.
3.3 Estimation and Validation of Spatio-temporal Pa-rameters for Sprint Running using a Radio-basedTracking System
Seidl, T., Linke, D., & Lames, M. (2017). Estimation and validation of spatio-temporalparameters for sprint running using a radio-based tracking system. Journal of Biomechanics,65, 89–95.DOI: https://doi.org/10.1016/j.jbiomech.2017.10.003
ContributionThe author’s contributions were the ideation, development and implementation of the algorithmfor ground contact detection and the calculation of sprint parameters, literature research aswell as writing of the Section Methods. Data collection concept for the evaluation of sprintparameters and data acquisition as well as writing of the Sections Introduction, Results andDiscussion was done together with the co-authors.
SummarySpatio-temporal parameters like step length, step frequency and ground contact time aredirectly related to sprinting performance. There is still a lack of knowledge, however, on howthese parameters interact.Recently, various algorithms for the automatic detection of step parameters during sprintrunning have been presented which have been based on data from motion capture systems,video cameras, optoelectronic systems or inertial measurement units.However, all of these methods suffer from at least one of the following shortcomings: they are(a) not applicable for more than one sprinter simultaneously, (b) only capable of capturing asmall volume or (c) do not provide accurate spatial parameters. To circumvent these issues, theradio-based local position measurement system RedFIR can be used to obtain spatio-temporalinformation during sprinting based on lightweight transmitters attached to the athletes.To assess and optimize the accuracy of these parameters nineteen 100 m sprints of twelve youngelite athletes (age: 16.5± 2.3 years) were recorded by a radio-based tracking system and anopto-electronic reference instrument. An algorithm to automatically detect spatio-temporalparameters was developed and optimal filter parameters for the step detection algorithm wereobtained based on RMSE differences between estimates and reference values on an unseen testset. Attaching a transmitter above the ankle showed the best results.Bland-Altman analysis yielded 95 % limits of agreement of [−14.65 cm, 15.05 cm] for step length,[−0.016 s, 0.016 s] for step time and [−0.020 s, 0.028 s] for ground contact time, respectively.RMS errors smaller than 2 % for step length and step time show the applicability of radio-basedtracking systems to provide spatio-temporal parameters.

32 Articles
This creates new opportunities for performance analysis that can be applied for any runningdiscipline taking place within a stadium. Since analysis for multiple athletes is available inreal-time this allows immediate feedback to coaches, athletes and media.

33
Chapter 4
Discussion
Essentially, all models are wrong,but some are useful.
George Box
All publications dealt with radio-based positional data in sports; two studies aimed to validatekinematic data obtained by radio-based football tracking whereas the third study investigatedthe development and validation of an algorithm for the detection of fine-grained motion detailssuch as ground contacts. Due to limited space the following three topics related to the validationand use of positional player tracking data could not be addressed in the publications but arediscussed in more detail below.
• System validation
• Interchangeability of results between tracking systems
• Deriving insights from spatio-temporal player tracking data
4.1 System ValidationTwo of the publications on which this dissertation is based are validation studies of radio-basedfootball tracking and to the best of the author’s knowledge, there are still no other studiesdealing with the positional accuracy of (radio-based) ball tracking. In addition, the topic ofpositional accuracy of player tracking is still not satisfactorily dealt with in the literature. Thisis due to the challenges that validation studies of player and especially ball tracking systemspose to test design which are discussed in the following.
To test the accuracy of a player tracking system for a specific sport typical movements—and,therefore, player positions or parameters like covered distance—are simultaneously recordedwith the system under test and a criterion system. The criterion system is known to allow avalid measurement of the parameter(s) of interest, e.g. player position, with known accuracy.Challenges associated with the choice of criterion system concern external validity as thissystem has to validly capture sport-specific motion in a sport-specific setting. As a rule ofthumb, it should be at least one order of magnitude more accurate than the system under test,

34 Discussion
i.e., when validating a system that is assumed to be accurate within 10 cm the criterion shouldbe accurate within 1 cm. As most tracking systems nowadays achieve positional accuraciesof less than one meter (Figure 2.3) potential criterion systems have to be accurate withincentimeters or even millimeters.Moreover, the validation study should be performed in a sport-specific setting. For footballthe study should be done within a football stadium or at least on a football pitch. A studythat aims to validate player or ball tracking in tennis has to be done on a tennis court undertypical match or at least training conditions. At best, test protocols should incorporate drillsand actual match play to be able to infer the validity for the system’s use in competition.In addition, the criterion system must also be able to capture sport-specific movement like fastchanges of direction in football. This additionally requires high sampling rates. For examplea high-speed high-definition camera might be used as criterion measurement to capture themovement of a player (or of his body parts). However, the same system might not be accurateenough to be used as a reference system for ball tracking as a too high speed of the ball canlead to a motion blur in the image28. This would render the method useless as a referencesystem. This narrows down the range of possible criterion systems for positional validationstudies to motion capture and high speed camera systems with high resolutions which are veryexpensive and only available to large research institutions.As a consequence, the majority of validation studies investigated derived parameters likecovered distance and high-intensity runs instead of x,y positions, and used reference systemslike a trundle wheel for covered distance or timing gates for measuring mean speed (Castilloet al., 2018; Frencken et al., 2010; Hoppe et al., 2018a; Sathyan et al., 2012).Based on the hierarchical structure shown in Figure 1.3 in Chapter 1, however, this is highlyproblematic as any errors inherent in player positions (layer 1) get propagated to higher layersand, therefore, influence estimated performance parameters. This fact makes the validation ofpositional accuracy a central issue which was already noted by Siegle et al. (2013) a few yearsago:
“Distances and velocities are calculated based on raw positional data, the x,yposition of a player over time, [. . . ] studies so far have neglected to test this basiccapability of dynamic x,y position measurement of position detection systems.”
However, even in studies that use a reference system that potentially allows positions, velocitiesand accelerations to be analyzed, studies fail to also investigate the effect of errors in positionaldata on derived parameters (Linke et al., 2018; Luteberget et al., 2018; Ogris et al., 2012).This kind of sensitivity analysis is common in numerics for example, and allows the influenceof changes in system inputs (here: positional data) and outputs (here: velocities, accelerationsor covered distance) to be systematically investigated (Nocedal & Wright, 2006). This is notlimited to quantities which are directly derived from positional data, like covered distancebut might also be beneficial when detecting events, e.g. passes, shots or possessions based onpositional data (Link & Hoernig, 2017).The main question is not how accurate positional data is, but rather how accurate can theperformance parameter of interest be estimated based on the error in the underlying positionaldata. However, knowledge about the sensitivity of parameters and positional data would be
28High speed cameras typically allow to change shutter time to cope with these issues. As a consequence,additional light might be needed.

4.2. Interchangeability of Results between Tracking Systems 35
beneficial when a decision about the use of a particular tracking system for a given applicationis to be made.
The design of validation studies for football tracking is even more challenging. The high speedsa football can reach combined with the fact that in camera images the ball is often occludedby players makes video-based ball tracking an extremely challenging problem, and thus a vividresearch topic within computer vision. Despite this positive fact, it is particularly difficult totransfer results from computer vision studies to actual sports; evaluation metrics for trackingalgorithms in computer vision are in most cases only based on detection rates rather thanpositional accuracy, i.e. the percentage of frames a ball has been detected correctly (Gomezet al., 2014; Kamble et al., 2017; Reno et al., 2018). However, a correct detection rate of 98 %does not yield any information about the positional accuracy on the football pitch for example,which also depends on camera calibration to determine the correspondence of image pixels andreal world locations29. Hence, differences in evaluation metrics make computer vision studiesnot directly applicable to evaluate their usefulness in sport practice.Unfortunately, there is actually no gold standard to be used for tracking the position of afootball under match or at least training conditions. Based on accuracies and sampling rates,motion capture systems would be the criterion systems of choice, but fail due to the need toattach reflective markers to the ball itself.
However, there seems to be a encouraging trend. After the International Football AssociationBoard (IFAB) allowed the use of electronical player tracking systems (EPTS) in competitionin March 2015, FIFA began to develop a testing procedure for EPTS which player trackingsystems have to pass before being used in competition (FIFA, 2015). Having every trackingprovider to undergo the same testing protocols performed by an independent test institutewould be a promising basis which would allow a fair comparison of different tracking systems30.Besides validation, the transferability of results between different tracking systems is animportant topic which is addressed in the next section.
4.2 Interchangeability of Results between Tracking Sys-tems
A professional football club usually deploys many different tracking systems and it is notuncommon, in practice, to obtain player tracking data from a video-based system for leaguematches and from GPS or LPS systems for trainings (Buchheit et al., 2014). If the aim is toevaluate player load for a given player over a season one needs to ensure that the way playerload is measured by video-, GPS- and LPS-based systems is actually the same.Based on the interactions between capabilities, training and competition (Figure 1.2) perfor-mance demands on a player in competition are the primary source for identifying the requiredlevels of an athlete’s capabilities. Since those act as targets for training the comparability
29However, a precision of only 60 % does yield valuable information as it would render the tracking algorithmto be useless for practical applications.
30Currently, such a comparison of results from different validation studies is almost impossible as studies areusually based on different test protocols, as well as varying reference systems. This even makes comparisonsbetween studies of the same tracking system difficult.

36 Discussion
of load measurements in training and competition is a prerequisite for the development ofcompetition-specific training and thus for practical performance analysis.Hence, the comparison of performance parameters, like covered distance and number of highintensity runs, is based on the assumption that parameters obtained from different playertracking systems are (a) based on the same definition, e.g. high intensity run (≥ 14.4 km h−1)and (b) that each system is valid and reliable when measuring the parameter of interest.To solve this issue, Buchheit et al. (2014) proposed the use of regression equations to transferresults between tracking systems. Regression coefficients were derived based on the comparisonof player activity during training and match, that was recorded simultaneously with GPS, LPSand video-based systems. The study showed that it is possible to develop such calibrationequations. However, large typical errors of the estimate for the regression were observed andled the authors to develop multiple equations for different areas of the football pitch whichmakes results at least questionable for the use in practice. Although these regression equationsallow to transfer parameters between measurement systems it would be advisable to eventuallytransfer them to a gold standard system.Another issue that is often overlooked is the effect of attaching transmitters to different bodyparts. Even small changes in the positioning of a transmitter on the human body will effectderived parameters. Linke & Lames (2018) used a motion capture system to track footballplayers during football-specific drills and small sided games in a stadium environment. Reflec-tive markers were placed to simulate typical positions for transmitter-based systems (centerof scapulae – COS) and video-based systems (center of pelvis – COP). The authors showedthat differences between COP and COS depended on the underlying movement characteristicand COS sprinting distance was on average 44.65 % (p < .001) lower in comparison to COP.This is an alarming result as these differences are solely based on different marker/transmitterpositions. In practice, these differences are probably a lower bound when comparing estimatesbetween transmitter-based and video-based systems.The transferability of parameter estimates between tracking systems has been insufficientlyinvestigated in the literature. However, the above mentioned studies clearly show commonchallenges when using player tracking systems in practice. Care should be taken when com-paring parameters from different transmitter positions or when transferring results betweentracking systems.
Even in absence of transferability issues between systems the main challenge is how to deriveperformance insights from positional tracking data.
4.3 Deriving Insights from Spatio-temporal Player Track-ing Data
The last years have seen a large increase in the amount of collected data in sports. But as wasmentioned by Pratas et al. (2018)
“it is not always clear how these data should be processed with a view to providingcoaches, match analysts and players with relevant information.”
However, only processing and analysis of spatio-temporal data can actually create insightsabout the underlying mechanisms of performance. This is clearly challenging as player and

4.3. Deriving Insights from Spatio-temporal Player Tracking Data 37
team behaviour in sports is usually complex in nature due to the interaction between opponentsand team mates which gives rise to non-linear systems (Lames & McGarry, 2007). Makingsense of positional data is in particular challenging as there is no guarantee that a closed formsolution31 for a given problem in sports actually exists32. However, modern machine learningalgorithms make it possible to learn those (non-linear) relationships based on examples.The need for machine learning for the analysis of spatio-temporal player tracking data isbest illustrated by the following example. Over a decade ago Beetz et al. (2005) developed aFootball Interaction and Process Model (FIPM) based on first-order predicate logic. Logicalrules governing equations were created by investigation of player tracking data and an examplerule is shown in equation 4.1.
∀sit.(
scoringAngle(sit) ≥ 35.6◦ ∧ distance(sit) ≤ 16.38 86%−−→ ScoringOpportunity(sit))
(4.1)
This logical rule states that
“game situations [sit] in which the offensive player with the ball is less than 16.38 maway from the goal, and in which the largest angle to the goal not blocked by adefensive player is at least 35.6◦, constitutes a scoring opportunity with a probabilityof 86 %.” (Beetz et al., 2005)
The main advantage of the proposed method is that derived rules are easily understandable(once you understand first-order predicate logic). However, these rules are too specific to thesituation to be useful for understanding goal scoring as basis for performance analysis. Thisis due to the missing option to investigate the effect of altering parameters on goal scoringprobability, e.g. what happens if the player has the chance to get 5 m closer to the goal orwhat if the scoring angle is 180◦ instead of 35.6◦?In contrast, by using machine learning methods, one can train a model to learn the non-linearrelationship between game context, e.g. scoring angle and distance in the example above, andthe result of the shot. This approach allows to generalize to new unseen situations and toinvestigate for example the effect of changing distance to the goal on the probability of goalscoring (Link et al., 2016; Lucey et al., 2015) which, in turn, allows to answer the kind of “whatif”–questions mentioned above. The application of machine learning can, therefore, enhanceour understanding of performance concepts, like goal scoring, in unprecedented ways.Even the development of an algorithm for the detection of ground contacts for 100 m sprintinvolved the machine learning concept of cross-validation to obtain an optimal velocity threshold(Seidl et al., 2017).These examples clearly show the benefit and necessity of machine learning for the analysis ofpositional data in sport.
31An equation is said to be a closed-form solution if it solves a given problem in terms of functions andmathematical operations from a given generally-accepted set.
32Even for physical phenomena that can be modelled by governing partial differential equations, e.g. heat orwave equation, a closed form solution exists only in the simplest cases. Most real world problems can only besolved approximately, for example by computer simulation. It is therefore unrealistic to assume to find such asolution for complex phenomena like team sports.

38 Discussion

39
Chapter 5
Conclusion and Outlook
Prediction is difficult,especially about the future.
Yogi Berra
5.1 ConclusionDespite the long-term availability of positional data in almost all major sports such as footballor basketball, the question of the quality of positional data—especially the acquisition of thekinematics of objects such as a football or a basketball—has not been sufficiently investigated.One still has to rely on the statements of manufacturers. This dissertation presented test setupsbased on high speed camera footage and light gates that allowed to investigate the accuracy ofball position and speed for a radio-based tracking system in football. As test design was notspecific to football it can be applied to other sports.Furthermore, the usability of positional data for performance analysis is still controversial(Carling, 2013). However, it could be demonstrated that fine-grained motion details like groundcontacts of the feet can be detected within radio-based positional data. The algorithm whichwas developed for the analysis of 100 m sprint allowed the automatic and continuous recordingof performance-relevant step parameters, such as step length and step time, over the entirerun. As the algorithm is not limited to straight runs it is also applicable to analyze stepcharacteristics in team sports, showing the potential for technical analysis based on radio-basedtracking.These studies have shown the potential of radio-based tracking systems for applications insports which provide more accurate data with higher sampling rates than video-based systemswhich nowadays are primarily used in competition due to competition rules. In addition, asdata does not require a high level of manual post-processing, data available in real time is ofthe same quality as data after the competition. In many sports, there are clear tendencies forcompetition rules to change, to thus allow athletes and players to wear transmitters duringcompetition (FIFA, 2015), and to provide tracking data and analysis results to analysts andcoaches within the match (FIFA, 2018).The present work gave an overview of the state of the art in system validation and analysisof positional data and attempted to classify it within the framework of training and exercise

40 5. Conclusion and Outlook
science and performance analysis as well as from a data analytics perspective. In addition,current methods for the acquisition of positional data were presented, and topics such as systemvalidation, transferability of derived parameters between different systems, and the benefits ofmachine learning for profitable analysis were discussed.
This thesis led to promising first results but further research with regards to system vali-dation and pattern recognition for performance analysis is necessary. However, technologicalinnovations and advances in computer science will lead to various improvements in the waysspatio-temporal data is gathered, analyzed and how results will be used in practice. The followingOutlook discusses these topics.
5.2 OutlookCurrently, there are various technological innovations and promising approaches in computerscience which might help to improve our understanding of sports performance. This sectiongives an outlook on applications that might change the way data is collected, analyzed andintegrated into sports practice. Based on the current literature, and the personal opinion ofthe author, major innovations can be expected in the following areas:
(1) Computer Vision
(2) Wearables
(3) Deep Learning & Predictive Analytics
(4) Integration of insights into practice
Within each subject area promising methods will be presented in the following.
(1) Computer VisionObject detection and tracking is a vivid research area within computer vision. Further break-throughs in computer vision research related to applications in other sectors, like autonomousdriving, can possibly be applied to applications in sports as well.As was seen in Chapter 2 “moving dots” are a vast simplification of the real world and valuableinformation is currently missing, which is, however, contained in other sources like broadcastvideos. For example, there is currently no information on “the aspect (direction) faced by aplayer [contained in the tracking data]. A player moving a 4 m s−1 might be jogging forward,rapidly shuffling backwards or skipping sideways” (O’Donoghue, 2015). Figure 5.1 shows howinformation about body pose, derived from broadcast video, can help to better understand thecurrent situation (Felsen et al., 2018). Looking only at spatio-temporal player tracking data(top) this appears to be a very high-percentage shot opportunity. However, the broadcast view(bottom) shows the pose of the player and reveals an off-balance shooter recovering from apoorly placed pass.Also, advances in camera hardware and software will be beneficial for video-based trackingsystems. Increasing video resolutions from HD (1920 × 1080) to 4k UHD (3840 × 2160)will facilitate the detection and tracking of players and objects. A larger number of pixels

5.2. Outlook 41
Figure 5.1: Beyond “Moving dots”: body pose from video. From SportVU data (top), this appearsto be a very high-percentage shot opportunity. However, the broadcast view (bottom)shows the pose of the player and reveals an off-balance shooter recovering from a poorlyplaced pass. Figure taken from Felsen & Lucey (2017).
corresponding to an object will enable, for example, a better assignment of player identitiesby recognition of jersey numbers. This will lead to the development of more stable trackingalgorithms that will better cope with occlusions and, eventually, to “full automatic vision basedplayer tracking in team sports (. . . ) in the next 10 to 15 years” (Leser & Roemer, 2014, p. 98).
(2) WearablesIn contrast to video, wearables (including LPS systems) are intrusive as athletes need to beequipped with transmitters or sensors. However, wearables allow to make measurements “at”the object/player and therefore are deemed to be more accurate and reliable than non-invasivevideo technologies. Nowadays, wearables are already heavily used within training. In addition,further miniaturization of transmitters will eventually allow integration into clothes, shoulderpads (Zebra, 2018), objects (football, basketball or ice hockey puck) (Grün et al., 2011) ortennis rackets (Keaney & Reid, 2018) to overcome the before mentioned intrusiveness. Thiswill then allow to obtain information about object kinematics like speed, acceleration androtation. In baseball the use of a wearable sleeve integrating IMUs has been shown to bebeneficial for the analysis of pitchers’ performances. The Motus SleevePro, for example, hasfive integrated IMU sensors to analyze the technique of a pitcher in baseball. Only a few yearsago, this type of technical analysis was limited to biomechanics labs but the wearable actuallyallows to be used during competition. 27 of the 30 major league baseball clubs were supposedto use the sleeve in 2016 (New York Times, 2016).The greatest potential of wearables are the capacity to directly measure vital parameters likeheart rate and breath rate which is not possible by using cameras. This information might be

42 5. Conclusion and Outlook
especially useful when measuring load and fatigue.
In particular the combination of camera- and radio-based player tracking and wearableshas the potential to open up completely new possibilities for performance analysis, injuryprevention and to the media33.
(3) Deep Learning & Predictive Analytics
Figure 5.2: Data-Driven Ghosting in Football. Large amounts of player tracking data allow to developdeep learning algorithms that can learn realistic defensive behaviour for different teamsin football. The model allows to predict and evaluate a team’s defensive behaviour insituations which they never experienced in reality. Attacking team is shown in red, actualdefensive team in blue and ghost defense in white. Models trained on sequences fromgood defensive teams (Manchester City, botton row) result in better defensive models(lower expected goal value). In contrast to a league average ghost (top, white circles)defender with jersey number 2 of Manchester City (bottom, white circles) manages to getbetween the striker (jersey number 9) and goal which results in a lower expected goalvalue (41.7 %) compared to the league average ghosts (71.8 %) and the actual defensiveteam (69.1 %). Figure taken from Le et al. (2017).
Besides the possibilities to get more detailed data from video or wearables, the main challengeremains how to gain insights for performance analysis.
33Especially for sports like ice hockey where tracking is even more challenging (Lemire, 2017).

5.2. Outlook 43
The application of Deep Learning (LeCun et al., 2015) to sports applications is in particularpromising as deep neural networks—in contrast to other machine learning methods—allow toleverage the vast amount of data as accuracy further increases as more data is provided tothe deep neural network. Given enough examples deep learning models are capable to learneven complex sports behaviour. These models can then be used to predict most likely actionseven in scenarios that teams or players have never faced in reality (Felsen et al., 2018; Weiet al., 2016). An example for the potential use of predictive analytics is data-driven Ghosting34
where spatio-temporal player tracking data of a full season from the English Premier Leaguewas used to train deep neural networks to learn the defensive behaviour of football teams(Le et al., 2017). These ghosting models are built on the same principles and methods thatallowed computer program AlphaGo to beat the best human Go players (Silver et al., 2017).These models have potential applications in scouting, match analysis and in media reporting.Figure 5.2 shows the comparison of the same attacking sequence run against a mean leaguemodel (top) and against a very good defensive team (bottom). Models trained on examples ofgood defensive teams, like Manchester City in this particular season, learned better defensivebehaviour.These developments are very promising for performance analysis applications. However, thequestion remains how analyses and models can find their way into practice.
(4) Integration of Insights into PracticeThe challenge coming with more and better data (possibly from various sources) and betteranalytics is eventually how to integrate findings into practice.
Figure 5.3: Bhostgusters: Intuitive iPad tool for tactical analysis in basketball: (left) interactivesketching, and (right) frame from corresponding synthesized tracking data with “ghost”players shown as white circles. Figure taken from Seidl et al. (2018).
Hence, there is a need for developing tools which are intuitive and easy to use by non-technicalexperts. As data will potentially be available in real-time, new tools will be developed that helpcoaches and staff to gain match insights and even assist with in-game decision making (Seidlet al., 2018). Figure 5.3 shows an iPad tool that allows NBA coaches to sketch offensive playsthe same way they would do it on a white board. However, the tool then allows to translate the
34Ghosting refers to a concept developed by the Toronto Raptors. “Ghost players [. . . ] are doing whatToronto’s coaching staff and analytics team believe the players should have done on this play” (Lowe, 2013).
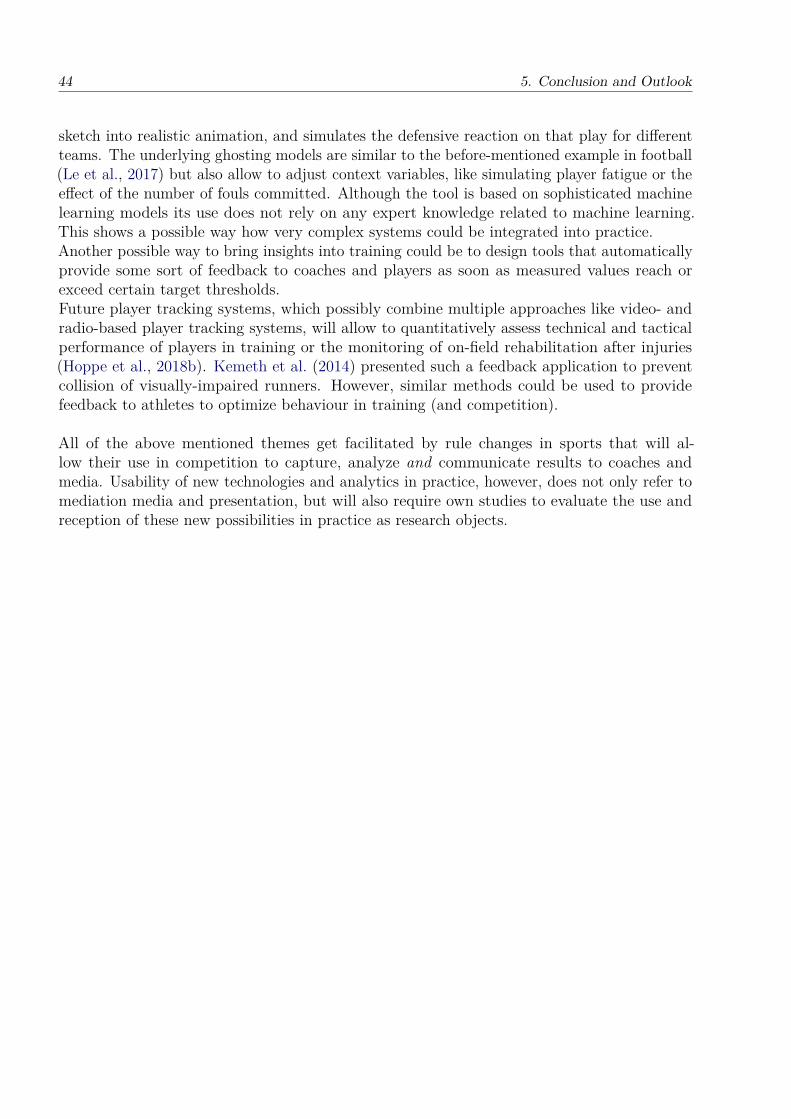
44 5. Conclusion and Outlook
sketch into realistic animation, and simulates the defensive reaction on that play for differentteams. The underlying ghosting models are similar to the before-mentioned example in football(Le et al., 2017) but also allow to adjust context variables, like simulating player fatigue or theeffect of the number of fouls committed. Although the tool is based on sophisticated machinelearning models its use does not rely on any expert knowledge related to machine learning.This shows a possible way how very complex systems could be integrated into practice.Another possible way to bring insights into training could be to design tools that automaticallyprovide some sort of feedback to coaches and players as soon as measured values reach orexceed certain target thresholds.Future player tracking systems, which possibly combine multiple approaches like video- andradio-based player tracking systems, will allow to quantitatively assess technical and tacticalperformance of players in training or the monitoring of on-field rehabilitation after injuries(Hoppe et al., 2018b). Kemeth et al. (2014) presented such a feedback application to preventcollision of visually-impaired runners. However, similar methods could be used to providefeedback to athletes to optimize behaviour in training (and competition).
All of the above mentioned themes get facilitated by rule changes in sports that will al-low their use in competition to capture, analyze and communicate results to coaches andmedia. Usability of new technologies and analytics in practice, however, does not only refer tomediation media and presentation, but will also require own studies to evaluate the use andreception of these new possibilities in practice as research objects.

REFERENCES 45
References
Bangsbo, J., Nørregaard, L., & Thorsø, F. (1991). Activity profile of competition soccer.Canadian Journal of Sport Sciences, 16(2), 110–116.
Barris, S. & Button, C. (2008). A review of vision-based motion analysis in sport. SportsMedicine, 38(12), 1025–1043.
Beetz, M., Hoyningen-Huene, N. v., Bandouch, J., Kirchlechner, B., Gedikli, S., & Maldonado,A. (2006). Camera-based observation of football games for analyzing multi-agent activities.In AAMAS’06: Proceedings of the Fifth International Joint Conference on AutonomousAgents and Multiagent Systems (pp. 42–49). Japan: Hadokate.
Beetz, M., Kirchlechner, B., & Lames, M. (2005). Computerized real-time analysis of footballgames. IEEE Pervasive Computing, 4(3), 33–39.
Bichler, S., Ogris, G., Kremser, V., Schwab, F., Knott, S., & Baca, A. (2012). Towardshigh-precision imu/gps-based stride-parameter determination in an outdoor runners’scenario. Procedia Engineering, 34, 592–597.
Braysy, V., Hurme, J., Teppo, H., Korpela, T., & Karjalainen, M. (2010). Movement trackingof sports team players with wireless sensor network. In Ubiquitous Positioning IndoorNavigation and Location Based Service (UPINLBS), 2010 (pp. 1–8). Piscataway, NJ:IEEE Service Center.
Buchheit, M., Allen, A., Poon, T. K., Modonutti, M., Gregson, W., & Di Salvo, V. (2014).Integrating different tracking systems in football: multiple camera semi-automatic system,local position measurement and gps technologies. Journal of Sports Sciences, 32(20),1844–1857.
Buchheit, M. & Simpson, B. M. (2017). Player-tracking technology: Half-full or half-emptyglass? International Journal of Sports Physiology and Performance, 12(Suppl 2), 235–241.
Carling, C. (2013). Interpreting physical performance in professional soccer match-play: Shouldwe be more pragmatic in our approach? Sports Medicine, 43(8), 655–663.
Castillo, A., Gómez Carmona, C. D., de La Cruz Sánchez, E., & Pino Ortega, J. (2018).Accuracy, intra- and inter-unit reliability, and comparison between gps and uwb-basedposition-tracking systems used for time-motion analyses in soccer. European Journal ofSport Science, 18(4), 450–457.
Choppin, S., Albrecht, S., Spurr, J., & Capel-Davies, J. (2018). The effect of ball wear on ballaerodynamics: An investigation using hawk-eye data. Proceedings, 2(6), 265.
Davids, K., Araujo, D., & Shuttleworth, R. (2005). Applications of dynamical systems theoryto football. In T. Reilly, J. Cabri, & D. Araújo (Eds.), Science and Football V (pp.537–550). London: Routledge.
de Silva, V., Caine, M., Skinner, J., Dogan, S., Kondoz, A., Peter, T., Axtell, E., Birnie, M.,& Smith, B. (2018). Player tracking data analytics as a tool for physical performance

46 REFERENCES
management in football: A case study from chelsea football club academy. Sports, 6(4),130.
Di Salvo, V., Collins, A., McNeill, B., & Cardinale, M. (2006). Validation of prozone : A newvideo-based performance analysis system. International Journal of Performance Analysisin Sport, 6(1), 108–119.
Dunn, M. & Kelley, J. (2015). Non-invasive, spatio-temporal gait analysis for sprint runningusing a single camera. Procedia Engineering, 112, 528–533.
Felsen, P. & Lucey, P. (2017). "Body shots": Analyzing shooting styles in theNBA using body pose. MIT Sloan Sports Analytics Conference. Retrievedfrom http://www.sloansportsconference.com/wp-content/uploads/2017/02/1690.pdf on 15.01.2019.
Felsen, P., Lucey, P., & Ganguly, S. (2018). Where will they go? Predicting fine-grainedadversarial multi-agent motion using conditional variational autoencoders. In V. Ferrari,M. Hebert, C. Sminchisescu, & Y. Weiss (Eds.), Computer Vision – ECCV 2018, LectureNotes in Computer Science (pp. 732–747). Cham: Springer International Publishing.
FIFA (2015). Fifa and IFAB to develop global standard for electronic performance and trackingsystems. [Web page] Retrieved from https://www.fifa.com/about-fifa/news/y=2015/m=10/news=fifa-and-ifab-to-develop-global-standard-for-electronic-performance-an-2709918.html on 13.01.2019.
FIFA (2018). Player stats tablets to be used at the 2018 FIFA World Cup Russia™ -fifa.com. [Web page] Retrieved from https://www.fifa.com/worldcup/news/player-stats-tablets-to-be-used-at-the-2018-fifa-world-cup-russiatm on 06.12.2018.
FourFourTwo (2010). 66: It’s football, but is it art? er, yes. [Web page] Retrieved from https://www.fourfourtwo.com/features/66-its-football-it-art-er-yes on 16.12.2018.
Frencken, W., Lemmink, K., & Delleman, N. (2010). Soccer-specific accuracy and validity ofthe local position measurement (lpm) system. Journal of Science and Medicine in Sport,13(6), 641–645.
Gard, S. A., Miff, S. C., & Kuo, A. D. (2004). Comparison of kinematic and kinetic methodsfor computing the vertical motion of the body center of mass during walking. HumanMovement Science, 22(6), 597–610.
Gomez, G., Herrera Lopez, P., Link, D., & Eskofier, B. (2014). Tracking of ball and players inbeach volleyball videos. PloS one, 9(11), e111730.
Goodfellow, I., Bengio, Y., & Courville, A. (2016). Deep learning. Cambridge, Massachusettsand London, England: MIT Press.
Grün, T. v. d., Franke, N., Wolf, D., Witt, N., & Eidloth, A. (2011). A real-time trackingsystem for football match and training analysis. In A. Heuberger, G. Elst, & R. Hanke(Eds.), Microelectronic Systems (pp. 199–212). Berlin, Heidelberg: Springer.
Gudmundsson, J. & Horton, M. (2017). Spatio-temporal analysis of team sports. ACMComputing Surveys, 50(2), 1–34.
Hanavan, E. P. (1964). A mathematical model of the human body. AMRL-Techn. Report.Aerospace Medical Research Laboratories (U.S.).
Hatze, H. (1980). A mathematical model for the computational determination of parametervalues of anthropomorphic segments. Journal of Biomechanics, 13(10), 833–843.
Hobbs, J., Power, P., Sha, L., Ruiz, H., & Lucey, P. (2018). Quantifying the value of transitionsin soccer via spatiotemporal trajectory clustering. MIT Sloan Sports Analytics Confer-ence. Retrieved from http://www.sloansportsconference.com/wp-content/uploads/

REFERENCES 47
2018/02/2008.pdf on 15.01.2019.Hohmann, A., Lames, M., & Letzelter, M. (2010). Einführung in die Trainingswissenschaft.
Wiebelsheim: Limpert.Hoppe, M. W., Baumgart, C., Polglaze, T., & Freiwald, J. (2018a). Validity and reliability of
gps and lps for measuring distances covered and sprint mechanical properties in teamsports. PloS one, 13(2), e0192708.
Hoppe, M. W., Baumgart, C., Slomka, M., Grim, C., Engelhardt, M., & Freiwald, J. (2018b).Physical performance assessment in elite soccer – past, present and future. OUP, 7,536–544.
Horton, M. (2018). Algorithms for the Analysis of Spatio-Temporal Data from Team Sports.Dissertation, University of Sydney, Sydney.
Hughes, M. & Franks, I. M. (Eds.) (2004). Notational analysis of sport: Systems for bettercoaching and performance in sport (2nd ed.). London and New York: Routledge.
ITF (2018). Itf tennis - player analysis technology. [Web page] Retrieved from https://www.itftennis.com/technical/player-analysis/overview.aspx on 06.12.2018.
Judson, L. J., Churchill, S. M., Barnes, A., Stone, J. A., Brookes, I. G. A., & Wheat, J. (2018).Measurement of bend sprinting kinematics with three-dimensional motion capture: Atest–retest reliability study. Sports Biomechanics.
Kalman, R. E. (1960). A new approach to linear filtering and prediction problems. Journal ofBasic Engineering, 82(1), 35.
Kamble, P. R., Keskar, A. G., & Bhurchandi, K. M. (2017). Ball tracking in sports: A survey.Artificial Intelligence Review.
Katz, L. (2014). Foreword. In A. Baca (Ed.), Computer Science in Sport (pp. x–xi). New York:Routledge.
Keaney, E. M. & Reid, M. (2018). Quantifying hitting activity in tennis with racket sensors:New dawn or false dawn? Sports Biomechanics.
Kemeth, F., Hafenecker, S., Jakab, Á., Varga, M., Csielka, T., & Couronné, S. (2014).Blindtrack: Guiding system for visually impaired - locating system for running on atrack. In Proceedings of the 2nd International Congress on Sports Sciences Research andTechnology Support (pp. 183–189). Rome:ScitePress
Kingma, I., Toussaint, H. M., Commissaris, D. A., Hoozemans, M. J., & Ober, M. J. (1995).Optimizing the determination of the body center of mass. Journal of Biomechanics,28(9), 1137–1142.
Knauf, K., Memmert, D., & Brefeld, U. (2016). Spatio-temporal convolution kernels. MachineLearning, 102(2), 247–273.
Korte, F. & Lames, M. (2018). Characterizing different team sports using network analysis.Current Issues in Sport Science, 3(005), 1–10.
Kovalchik, S. & Reid, M. (2018). A shot taxonomy in the era of tracking data in professionaltennis. Journal of Sports Sciences, 36(18), 2096–2104.
Lames, M. & McGarry, T. (2007). On the search for reliable performance indicators in gamesports. International Journal of Performance Analysis in Sport, 7(1), 62–79.
Le, H. M., Carr, P., Yue, Y., & Lucey, P. (2017). Data driven ghosting us-ing deep imitation learning. MIT Sloan Sports Analytics Conference. Retrievedfrom http://www.sloansportsconference.com/wp-content/uploads/2017/02/1671-2.pdf on 15.01.2019.
LeCun, Y., Bengio, Y., & Hinton, G. (2015). Deep learning. Nature, 521, 436–444.

48 REFERENCES
Lee, H., Grosse, R., Ranganath, R., & Ng, A. Y. (2009). Convolutional deep belief networksfor scalable unsupervised learning of hierarchical representations. In A. P. Danyluk, L.Bottou, & M. L. Littman (Eds.), Proceedings of the 26th Annual International Conferenceon Machine Learning, ACM International Conference Proceeding Series (pp. 609–616).New York: ACM.
Lemire, J. (2017). Nhl plans league-wide optical player, puck tracking for 2019. [Web page]Retrieved from https://www.sporttechie.com/nhl-player-optical-puck-tracking-2019-2020-season/ on 06.12.2018.
Leser, R., Baca, A., & Ogris, G. (2011). Local positioning systems in (game) sports. Sensors,11(10), 9778–9797.
Leser, R. & Roemer, K. (2014). Motion tracking and analysis systems. In A. Baca (Ed.),Computer Science in Sport (pp. 82–109). New York: Routledge.
Levenberg, K. (1944). A method for the solution of certain non-linear problems in least squares.Quarterly of Applied Mathematics, 2(2), 164–168.
Link, D. & Hoernig, M. (2017). Individual ball possession in soccer. PloS one, 12(7), e0179953.Link, D., Lang, S., & Seidenschwarz, P. (2016). Real time quantification of dangerousity in
football using spatiotemporal tracking data. PloS one, 11(12), e0168768.Linke, D. & Lames, M. (2018). Impact of sensor/reference position on player tracking variables:
Center of scapulae vs center of pelvis. Journal of Biomechanics, 83, 319–323.Linke, D., Link, D., & Lames, M. (2018). Validation of electronic performance and tracking
systems epts under field conditions. PloS one, 13(7), e0199519.Lowe, Z. (2013). Lights, cameras, revolution. [Web page] Retrieved from
http://grantland.com/features/the-toronto-raptors-sportvu-cameras-nba-analytical-revolution/ on 15.12.2018.
Lucey, P., Bialkowski, A., Monfort, M., Carr, P., & Matthews, I. (2015). “Qual-ity vs Quantity”: Improved shot prediction in soccer using strategic fea-tures from spatiotemporal data. MIT Sloan Sports Analytics Conference. Re-trieved from http://www.sloansportsconference.com/wp-content/uploads/2015/02/SSAC15-RP-Finalist-Quality-vs-Quantity.pdf on 15.01.2019.
Luteberget, L. S., Spencer, M., & Gilgien, M. (2018). Validity of the catapult clearsky t6local positioning system for team sports specific drills, in indoor conditions. Frontiers inPhysiology, 9, 115.
Malone, J. J., Lovell, R., Varley, M. C., & Coutts, A. J. (2017). Unpacking the black box:Applications and considerations for using gps devices in sport. International Journal ofSports Physiology and Performance, 12(Suppl 2), 218–226.
Manafifard, M., Ebadi, H., & Abrishami Moghaddam, H. (2017). A survey on player trackingin soccer videos. Computer Vision and Image Understanding, 159, 19–46.
Marquardt, D. W. (1963). An algorithm for least-squares estimation of nonlinear parameters.Journal of the Society for Industrial and Applied Mathematics, 11(2), 431–441.
Marr, B. (2018). How much data do we create every day? The mind-blowing statseveryone should read. [Web page] Retrieved from https://www.forbes.com/sites/bernardmarr/2018/05/21/how-much-data-do-we-create-every-day-the-mind-blowing-stats-everyone-should-read/#5770d83a60ba on 06.12.2018.
Marsh, D. (2010). Some people are on the pitch by david marsh. Image taken from football-rambles.blogspot.com. [Blog post] Retrieved from http://footballrambles.blogspot.com/2010/05/some-people-are-on-pitch-by-david-marsh.html on 16.12.2018.

REFERENCES 49
Mautz, R. (2012). Indoor positioning technologies. Habilitation, ETH Zurich, Zurich.Memmert, D., Lemmink, K. A., & Sampaio, J. (2017). Current approaches to tactical
performance analyses in soccer using position data. Sports Medicine, 47(1), 1–10.Mohr, M., Krustrup, P., & Bangsbo, J. (2003). Match performance of high-standard soccer
players with special reference to development of fatigue. Journal of Sports Sciences,21(7), 519–528.
Mutschler, C., Ziekow, H., & Jerzak, Z. (2013). The debs 2013 grand challenge. In DEBS ’13:Proceedings of the 7th ACM international conference on Distributed event-based systems(pp. 289–294). New York, NY, USA: ACM.
New York Times (2016). Putting data science on a player’s sleeve. [Web page]Retrieved from https://www.nytimes.com/2016/04/03/sports/baseball/putting-data-science-on-a-players-sleeve.html on 15.12.2018.
Nocedal, J. & Wright, S. J. (2006). Numerical Optimization (2nd ed.). Springer Series inOperations Research and Financial Engineering. New York, NY: Springer.
O’Donoghue, P. (2015). Introduction to performance analysis of sport. Routledge studies insports performance analysis. London and New York: Routledge.
Ogris, G., Leser, R., Horsak, B., Kornfeind, P., Heller, M., & Baca, A. (2012). Accuracy of thelpm tracking system considering dynamic position changes. Journal of Sports Sciences,30(14), 1503–1511.
Perse, M., Pers, J., Kristan, M., Kovacic, S., & Vuckovic, G. (2005). Physics-based modellingof human motion using kalman filter and collision avoidance algorithm. In S. Lončarić(Ed.), ISPA 2005. Proceedings of the 4th International Symposium on Image and SignalProcessing and Analysis, 2005. (pp. 328–333). Zagreb: IEEE.
Pratas, J. M., Volossovitch, A., & Carita, A. I. (2018). Goal scoring in elite male football: Asystematic review. Journal of Human Sport and Exercise, 13(1), 218–230.
Psiuk, R., Seidl, T., Strauß, W., & Bernhard, J. (2014). Analysis of goal line technology fromthe perspective of an electromagnetic field based approach. Procedia Engineering, 72,279–284.
Reno, V., Mosca, N., Marani, R., Nitti, M., D’Orazio, T., & Stella, E. (2018). Convolutionalneural networks based ball detection in tennis games. In Proceedings of the IEEEConference on Computer Vision and Pattern Recognition Workshops (pp. 1758–1764).Salt Lake City, UT, USA: IEEE.
Renò, V., Mosca, N., Nitti, M., D’Orazio, T., Guaragnella, C., Campagnoli, D., Prati, A., &Stella, E. (2017). A technology platform for automatic high-level tennis game analysis.Computer Vision and Image Understanding, 159, 164–175.
Sathyan, T., Shuttleworth, R., Hedley, M., & Davids, K. (2012). Validity and reliabilityof a radio positioning system for tracking athletes in indoor and outdoor team sports.Behavior Research Methods, 44(4), 1108–1114.
Schmidt, M., Rheinländer, C., Nolte, K. F., Wille, S., Wehn, N., & Jaitner, T. (2016). Imu-based determination of stance duration during sprinting. Procedia Engineering, 147,747–752.
Seidl, T., Russomanno, T. & Lames, M. (2019). Modeling Intra-cyclic Speed in 100m Sprint –a Pilot Study. Manuscript submitted for publication.
Seidl, T., Cherukumudi, A., Hartnett, A., Carr, P., & Lucey, P. (2018). Bhostgusters: Realtimeinteractive play sketching with synthesized nba defenses. MIT Sloan Sports AnalyticsConference. Retrieved from http://www.sloansportsconference.com/wp-content/

50 REFERENCES
uploads/2018/02/1006.pdf on 15.01.2019.Seidl, T., Czyz, T., Spandler, D., Franke, N., & Lochmann, M. (2016a). Validation of football’s
velocity provided by a radio-based tracking system. Procedia Engineering, 147, 584–589.Seidl, T., Linke, D., & Lames, M. (2017). Estimation and validation of spatio-temporal param-
eters for sprint running using a radio-based tracking system. Journal of Biomechanics,65, 89–95.
Seidl, T., Völker, M., Witt, N., Poimann, D., Czyz, T., Franke, N., & Lochmann, M. (2016b).Evaluating the indoor football tracking accuracy of a radio-based real-time locating system.In P. Chung, A. Soltoggio, C. W. Dawson, Q. Meng, & M. Pain (Eds.), Proceedings ofthe 10th International Symposium on Computer Science in Sports (ISCSS), volume 392of Advances in Intelligent Systems and Computing (pp. 217–224). Cham: Springer.
Siegle, M. & Lames, M. (2013). Modeling soccer by means of relative phase. Journal of SystemsScience and Complexity, 26(1), 14–20.
Siegle, M., Stevens, T., & Lames, M. (2013). Design of an accuracy study for position detectionin football. Journal of Sports Sciences, 31(2), 166–172.
Silver, D., Schrittwieser, J., Simonyan, K., Antonoglou, I., Huang, A., Guez, A., Hubert,T., Baker, L., Lai, M., Bolton, A., Chen, Y., Lillicrap, T., Hui, F., Sifre, L., van denDriessche, G., Graepel, T., & Hassabis, D. (2017). Mastering the game of go withouthuman knowledge. Nature, 550, 354–359.
Stats (2019). Stats sportvu basketball player tracking for pro teams. [Web page] Retrievedfrom https://www.stats.com/sportvu-basketball/ on 13.01.2019.
Stelzer, A., Pourvoyeur, K., & Fischer, A. (2004). Concept and application of lpm—a novel3-d local position measurement system. IEEE Transactions on Microwave Theory andTechniques, 52(12), 2664–2669.
Stevens, T. G. A., de Ruiter, C. J., Twisk, J. W. R., Savelsbergh, G. J. P., & Beek, P. J. (2017).Quantification of in-season training load relative to match load in professional dutcheredivisie football players. Science and Medicine in Football, 1(2), 117–125.
Stimson, R. & Cane, M. (2017). Evaluating defensive ability in hockey using passing data. MITSloan Sports Analytics Conference. Retrieved from http://www.sloansportsconference.com/wp-content/uploads/2017/02/1614.pdf on 15.01.2019.
Taborri, J., Palermo, E., Rossi, S., & Cappa, P. (2016). Gait partitioning methods: A systematicreview. Sensors, 16(1), 66.
Talbert, W. F. & Old, B. S. (1983). Tennis tactics: Singles and doubles (1st ed.). New York:Harper & Row.
van der Kruk, E. & Reijne, M. M. (2018). Accuracy of human motion capture systems for sportapplications; state-of-the-art review. European Journal of Sport Science, 18(6), 806–819.
Walter, F., Lames, M., & McGarry, T. (2007). Analysis of sports performance as a dynamicalsystem by means of the relative phase. International Journal of Computer Science inSports, 6(2), 35–41.
Wei, X., Lucey, P., Morgan, S., Reid, M., & Sridharan, S. (2016). “The thin edge of the wedge”:Accurately predicting shot outcomes in tennis using style and context priors. MIT SloanSports Analytics Conference. Retrieved from http://www.sloansportsconference.com/wp-content/uploads/2016/05/1475-Other-Sport.pdf on 15.01.2019.
Welch, G. & Bishop, G. (1995). An Introduction to the Kalman Filter. [Web page] Retrievedfrom https://www.cs.unc.edu/~welch/media/pdf/kalman_intro.pdf on 16.01.2019.
Whyno, S. (2019). Nhl tests puck and player tracking in regular-season games. [Web page] Re-

REFERENCES 51
trieved from https://eu.usatoday.com/story/sports/nhl/2019/01/11/nhl-tests-puck-and-player-tracking-in-regular-season-games/38881987/ on 12.01.2019.
Windolf, M., Götzen, N., & Morlock, M. (2008). Systematic accuracy and precision analysisof video motion capturing systems–exemplified on the vicon-460 system. Journal ofBiomechanics, 41(12), 2776–2780.
Winter, D. A. (2009). Biomechanics and motor control of human movement (2nd ed.). Hoboken,NJ, USA: John Wiley & Sons, Inc.
Winterbottom, W. (1959). Soccer Coaching. Kingswood: The Naldrett Press Ltd.Wintergreen Research (2017). $15.5 bn sports player tracking and analytics mar-
kets - market shares, strategies, and forecasts. [Web page] Retrieved fromhttps://markets.businessinsider.com/news/stocks/15-5-bn-sports-player-tracking-and-analytics-markets-2017-2023-market-shares-strategies-and-forecasts-1002357445 on 11.12.2018.
Zaidi, M., Tourki, R., & Ouni, R. (2010). A new geometric approach to mobile position inwireless lan reducing complex computations. 2010 International Conference on Design &Technology of Integrated Systems in Nanoscale Era, 1–7.
Zebra (2018). Zebra & the nfl | official on-field player-tracking | zebra. [Web page] Retrievedfrom https://www.zebra.com/us/en/nfl.html on 06.12.2018.

52 REFERENCES

REFERENCES 53
Appendix
The Appendix contains full paper versions for all publications related to this dissertation andwritten permission for its use, respectively. Since the paper Validation of football’s velocityprovided by a radio-based tracking system was published as open access article no permissionstatement is attached in this case.
: Retrieved from https://www.elsevier.com/about/policies/copyright/personal-use on17.01.2019.

Estimation and validation of spatio-temporal parameters for sprintrunning using a radio-based tracking system
Thomas Seidl ⇑, Daniel Linke, Martin LamesDepartment of Sport and Health Sciences, Chair of Training Science and Sports Informatics, Technical University of Munich, Germany
a r t i c l e i n f o
Article history:Accepted 1 October 2017
Keywords:Player trackingAthleticsSprint analysisValidity
a b s t r a c t
Spatio-temporal parameters like step length, step frequency and ground contact time are directly relatedto sprinting performance. There is still a lack of knowledge, however, on how these parameters interact.Recently, various algorithms for the automatic detection of step parameters during sprint running have
been presented which have been based on data from motion capture systems, video cameras, opto-electronic systems or Inertial measurement units. However, all of these methods suffer from at leastone of the following shortcomings: they are (a) not applicable for more than one sprinter simultaneously,(b) only capable of capturing a small volume or (c) do not provide accurate spatial parameters. To circum-vent these issues, the radio-based local position measurement system RedFIR could be used to obtainspatio-temporal information during sprinting based on lightweight transmitters attached to the athletes.To assess and optimize the accuracy of these parameters 19 100 m sprints of twelve young elite athletes(age: 16.5 ± 2.3 years) were recorded by a radio-based tracking system and a opto-electronic referenceinstrument. Optimal filter parameters for the step detection algorithm were obtained based on RMSE dif-ferences between estimates and reference values on an unseen test set. Attaching a transmitter above theankle showed the best results.Bland-Altman analysis yielded 95% limits of agreement of [�14.65 cm, 15.05 cm] for step length
[�0.016 s, 0.016 s] for step time and [�0.020 s, 0.028 s] for ground contact time, respectively. RMS errorssmaller than 2% for step length and step time show the applicability of radio-based tracking systems toprovide spatio-temporal parameters. This creates new opportunities for performance analysis that can beapplied for any running discipline taking place within a stadium. Since analysis for multiple athletes isavailable in real-time this allows immediate feedback to coaches, athletes and media.
� 2017 Elsevier Ltd. All rights reserved.
1. Introduction
Spatio-temporal parameters like step length, step time andground contact time are related to running speed and thus sprint-ing performance. There is still a lack of knowledge, however, onhow these parameters interact. Different studies reported contra-dicting results (Debaere et al., 2013; Hunter et al., 2004).
One main reason is the procedure by which these parametersare typically obtained—manual examination of video footage—which is very time-consuming, prone to errors and yields onlymean values for different sections of the running track. Hence,their significance depends heavily on the length of the underlyingintervals (Hanon and Gajer, 2009). The shorter these intervals the
higher the impact of the related performance and competitionanalysis (Letzelter et al., 2005). Since there is a lower limit forthe error of manual recording of ground contacts from video foo-tage, the relative error increases when intervals are diminished.This procedure is therefore limited in its ability to obtain accurateestimates.
In recent years, several studies have been published on theautomated acquisition of step-by-step parameters in sprint run-ning. Different procedures based on motion capture (Nagaharaet al., 2014), video (Dunn and Kelley, 2015), and photoelectric orIMU-based systems (Bichler et al., 2012; Schmidt et al., 2016) havebeen proposed. All of these methods suffer from at least one of thefollowing shortcomings: they are (a) not applicable for more thanone sprinter simultaneously, (b) only capable of capturing a smallvolume and are not applicable for events over 200 m long, or (c) donot provide accurate spatial parameters. Motion capture systemsare very accurate and permit a detailed analysis of sprint kinemat-ics (spatio-temporal parameters, movement and velocities of body
https://doi.org/10.1016/j.jbiomech.2017.10.0030021-9290/� 2017 Elsevier Ltd. All rights reserved.
⇑ Corresponding author at: Department of Sport and Health Sciences, Chair ofTraining Science and Sports Informatics, Technical University of Munich, UptownMünchen – Campus D, Georg-Brauchle Ring 60/62, D-80992 Munich, Germany.
E-mail address: [email protected] (T. Seidl).
Journal of Biomechanics 65 (2017) 89–95
Contents lists available at ScienceDirect
Journal of Biomechanicsjournal homepage: www.elsevier .com/locate / jb iomech
www.JBiomech.com

segments and COM). Their multi-camera setup, the small volumewhich can be captured, the time-intensive post-processing as wellas the need for attaching reflective markers to the athlete maketheir use impractical for training and prohibits their use in compe-tition. Dunn and Kelley (2015) developed a video-based systemwhich is unobtrusive as it does not need markers to be attachedto an athlete’s body. However, one camera captures only a rangeof 10 m. Therefore, to use this system for the analysis for 100 msprints, the installation of a multi-camera network would berequired. The analysis of running disciplines like 200 m, 400 mand 800 m would be even more demanding. To this extent video-based tracking suffers from certain shortcomings like occlu-sions—as athletes can be occluded by other athletes—and varyingweather conditions. Hence their application for more than onesprinter simultaneously becomes impractical. Inertial measure-ment units (IMUs) seem to be a promising approach for detectingtemporal parameters during sprinting as their application is notlimited to a certain area and they are relatively inexpensive.Schmidt et al. (2016) developed an algorithm for the automateddetection of ground contact time using IMUs and compared theirestimates to the opto-electronic OptoJumpNext. However, the esti-mation of spatial parameters (e.g., step length) is challenging as theimplementation of the double integration procedure suffers fromerror accumulation over time (Qi et al., 2016). To the best of theauthors’ knowledge there is no IMU-based system that is capableto provide accurate spatial parameters for a distance of 100 mand longer. For a review of gait partitioning methods see (Taborriet al., 2016). Based on the completeness and accuracy of data, pho-toelectric systems like OptoGait (Microgate, Bolzano, Italy) seem tobe the method of choice as they provide accurate spatial (steplength) as well as temporal (step frequency and ground contacttime) parameters which are readily available after the sprint. How-ever, these systems are only applicable for one athlete, limited tostraight runs and need to be placed directly on the running track.This prohibits their use in competition and for runs includingcurved sections, i.e., that are longer than 100 m.
To circumvent these issues, the radio-based local position mea-surement system RedFIR (which has been developed for use in soc-cer) (Grün et al., 2011) could be used to obtain spatio-temporalinformation during sprinting based on lightweight transmittersattached to the athletes. The aim of the present study was, there-fore, to apply this technology to the sprinting context and todevelop a methodology able to automatically provide step length,step time and ground contact time during sprinting. Differenttransmitter positions were tested and the accuracy of the derivedspatio-temporal parameters was evaluated by comparing them toan opto-electronic system.
2. Methods
2.1. The RedFIR Real-Time Locating System
The RedFIR Real-Time Locating System (RTLS) (Grün et al.,2011) is based on time-of-flight measurements, where small trans-mitter integrated circuits emit burst signals. Antennas around thestadium receive these signals and send them to a centralized unitwhich processes them and extracts time of arrival (ToA) values.ToA values are the basis for time difference of arrival (TDoA) val-ues, from which x, y, and z coordinates, corresponding velocitiesand accelerations are derived using hyperbolic triangulation andby Kalman filtering assuming a movement with constant velocity.The RedFIR system operates in the globally license-free ISM (indus-trial, scientific, and medical) band of 2.4 GHz and uses the availablebandwidth of around 80 MHz. Miniaturized (61 mm � 38 mm � 7mm, 15 g) transmitters generate short broadband signal bursts
together with identification sequences. The locating system is ableto receive 50,000 of those signal bursts per second. The installationprovides 12 antennas that receive signals from up to 144 differenttransmitters. Using a channel multiple access system allows totrack multiple objects at the same time Transmitters typically emitaround 200 tracking bursts per second. The miniature transmittersthemselves are splash-proof. For a more detailed description of theRedFIR system and the generated data streams see Mutschler et al.(2013).
2.2. Test setup
Our experiments were conducted on the athletics track in theGrundig Stadion in Nuremberg—the official soccer Bundesliga sta-dium of 1.FC Nürnberg—where a RedFIR system is installed. Sincethis soccer stadium contains a 400 m running track it is often avenue for national athletics competitions and therefore was a goodplace to conduct our experiments. Twelve young elite athletesfrom various regional clubs (age: 16.5 ± 2.3 years) performed 48sprints in total. The sample consisted of seven female and five maleathletes. Subjects were tested one-by-one after a 20-min warm upthat was chosen individually. Each athlete performed four sprints:two 50 m sprints and two 100 m sprints. Transmitters wereattached to the athletes’ insteps by tape, above both ankles andon the upper back by specially designed compression tubes/com-pression shirts providing a bag for transmitters, which have beendeveloped for use in soccer. This was done to investigate spatio-temporal parameters from transmitters attached to different bodyparts. The chosen fixations have different intrusiveness and accep-tance in sports practice. The work has been approved by the ethicalcommittees of Technical University Munich and subjects gaveinformed consent.
Each sprint was simultaneously recorded by RedFIR and thephotoelectric measurement system OptoGait (Microgate, Bolzano,Italy/OJ) that covered a range of 50 m and provided reference val-ues for step length, step time and ground contact time with a mea-surement rate of 1000 Hz. All athletes were tracked simultaneouslyby the radio-based tracking system, but since the reference instru-ment allowed only one athlete at a time we had to restrict our-selves to test them one after the other.
The OptoGait system is comprised of 1 mmodules which can beattached to each other to cover a larger volume. Each bar was 100� 8 cm long and contained 96 light diodes that were located 3 mmabove floor level and approximately 1 cm apart. Lienhard et al.(2013) reported 95% limits of agreement of [�1.0 cm, 1.8 cm] forstep length, [�0.007 s, 0.023 s] for cycle time and 7.7% for groundcontact time which met our demands for using it as a referenceinstrument.
To capture the entirety of a 100 m sprint the location of our ref-erence instrument was changed during testing. Each athlete per-formed four sprints. For the first two sprints the opto-electronicsystem was placed to capture the first 50 m of the sprint. The sys-tem’s location was then changed to capture the second 50 m of thetrack for the remaining two sprints. A similar approach was usedby Debaere et al. (2013) to capture a 60 m sprint when only 40m of OptoGait system was available.
2.3. Data analysis
The basis for the estimation of sprint-specific parameters is thedetection of ground contacts of the foot. The following definitionsfor the detection of a ground contact are based on the horizontalvelocity in running direction of a transmitter attached to an ath-lete. A ground contact is detected if the horizontal velocity (i)reaches a local minimum or (ii) falls below a given threshold.Ground contact time is defined to be the length of the interval
90 T. Seidl et al. / Journal of Biomechanics 65 (2017) 89–95

when the horizontal velocity stays below a given threshold. Its cen-tre corresponds to the moment of the ground contact ti. Fig.1 illus-trates the two definitions for a ground contact. Looking at thevelocity of the back transmitter it becomes clear that there is noglobal threshold that would allow to obtain ground contact timein this case.
Step length, step time and ground contact time for a single legare given by the following equations
step lengthi ¼ Xðtiþ1Þ � XðtiÞ
step timei ¼ tiþ1 � ti
gcti ¼ tbi � tai
where ti corresponds to the timestamp of the i-th ground contact, Xto the position in the moving direction and tai , t
bi to the first and last
timestamps when the horizontal velocity is below a given thresh-old. If thresholding is applied ti will be the mean of the interval [tai ; t
bi ] or the timestamp where the horizontal velocity reaches a
local minimum between two maximal values for the minimum-based approach.
2.4. Study design
The test setup described in Section 2.2 was applied to validatethe accuracy of the obtained parameters and reference values wereused to optimize several filter parameters (e.g., velocity thresholds,filter methods and window sizes) for the underlying step detectionalgorithms. The estimation of these parameters was based on split-ting the data in separate training and test sets. We optimized(trained) the parameters on a separate training set of 60% of thesamples. The remaining 40% of samples were used to evaluatethe fit on an unseen test set. A similar method has been used byMiller (2009) to circumvent overfitting and to ensure generaliz-ability of result. The parameter optimization scheme is illustratedin Fig. 2.
To differentiate between unfiltered raw estimates and esti-mates based on optimal filter parameters we define the followingterms:
1. Raw/unfiltered estimate: An estimate for a parameter that isdirectly obtained by applying a thresholding of 1 m/s to the hor-izontal velocities for ankle and instep position. For the backposition the raw estimate is based on finding the local mini-mum of the horizontal velocity.
2. Filtered estimate: An estimate for a parameter after using ‘opti-mal’ settings for threshold and filter. Optimal parameters con-sist of a threshold for ground contact detection (1.0, 1.5, 2.0,2.5, 3.0, 3.5, 4.0 m/s), filter type (moving average, loess, lowess,savitzky-golay, robust loess, robust lowess) and filter windowsize (5%, 15%, 30%, 50%, 60% or 1–5 frames). Optimal parametersare found by minimizing the RMSE difference between esti-mated parameters and ground truth parameters.
To compare radio-based estimates and photoelectric groundtruth values a Bland-Altman analysis (Bland and Altman, 1986)was performed, which is typically used to investigate differencesbetween two measurement systems. The corresponding Root MeanSquare Errors were calculated:
RMSE ¼ffiffiffiffiffiffiffiffiffiffiffiffiffiffiffiffiffiffiffiffiffiffiffiffiffiffiffiffiffiffiffiffiffiffiffi1N
XNi¼1
ðprfi � pog
i Þ2vuut
where prfi and pog
i denote the estimates of the parameters for RedFIRand OptoGait (i.e., step length, step time or ground contact time) atthe i -th step, and N equals the total number of steps for all runs.
3. Results
Since each athlete had five transmitters attached during each ofthe 48 runs, a total of 240 ‘sensor runs’ (48 runs ⁄ 5 sensors) havebeen recorded. For 32 of these 240 sensor runs (13.3%) one of the
xxo
Fig. 1. The left plot shows the horizontal velocities for transmitters attached to the instep (blue) and back (red). Since velocities are based on Kalman filtering, unrealisticvalues lower than zero can be observed. The right plot shows a close-up of the red rectangle in the left plot explaining the two approaches to finding ground contacts: Forminimum-based ground contact detection, a ground contact is detected if the horizontal velocity reaches a local minimum (black circle) between two maxima. For threshold-based ground contact detection, a ground contact period is detected if the horizontal velocity falls below a given velocity threshold (red and green line). The mean value ofthis interval corresponds to the moment of the ground contact whereas the duration of this interval is defined to be the ground contact time. Minimum- and threshold-basedapproaches provide slightly different estimates of the moment of the ground contact (black circle, red and green cross). Different thresholds result in different ground contacttimes as well. (For interpretation of the references to colour in this figure legend, the reader is referred to the web version of this article.)
T. Seidl et al. / Journal of Biomechanics 65 (2017) 89–95 91

five transmitters did not provide data continuously throughoutdata acquisition. This resulted in a total of 19 runs where datafor all five transmitters was available. Since this study aimed atcomparing different transmitter positions, analysis was restrictedto these 19 (11 for 1–50 m, 8 for 51–100 m) runs yielding 508ground contacts. By our definition there are no parameters forthe last ground contacts of a sprint because parameters are basedon differences between two consecutive ground contacts, so these508 ground contacts yielded 470 parameters sets for step lengthand step time, respectively (508 ground contacts � 19 runs ⁄ 2legs = 470 parameters).
3.1. Effect of filtering & transmitter positions
Differences between raw and filtered parameters obtained fromattaching transmitters to the instep, above the ankle and to theback have been investigated. Table 1 shows RMS errors for rawand filtered settings and the corresponding 95% limits of agree-ment. The raw RMS errors for step length, step time and groundcontact time based on the instep were found to be 9.6 cm, 0.008s, 0.016 s, based on the ankle 6.5 cm, 0.0075 s, 0.0047 s and basedon back 17.2 cm, 0.023 s-since thresholding wasn’t possible for theback (see Fig. 1) no ground contact time could be estimated. Apply-ing the above-mentioned filtering resulted in similar results forinstep and ankle positions whereas estimates based on a transmit-ter on the back showed slightly inferior results. Transmittersattached above the ankle showed slightly better estimates for steplength (RMSE ankle: 5.85 cm; instep 7.4 cm) and step time (RMSEankle: 0.0068 s; instep 0.007 s) whereas estimates for ground con-tact time (RMSE ankle: 0.01 s; instep: 0.009 s) was slightly betterfor the instep transmitter.
Normalizing error estimates by their respective means yieldedpercentage RMS errors of 1.6%, 1.3% and 7.6% for step length, step
time and ground contact time respectively based on filtered esti-mates for a transmitter attached above the ankle.
Fig. 3 shows the effect of filtering for step length, step time andground contact time based on a transmitter attached above the leftankle. Optimizing filter parameters helped to decrease the varianceof errors compared to the raw parameters. The step time plot inFig. 3 shows spikes at step 6 and step 7. Those are clearly observ-able within the reference data and (slightly less pronounced)within the raw RedFIR data. By filtering the raw estimate of steptime the overall RMSE decreases but this fine-grained behavior—spikes at step 6 and step 7—is no longer observable.
3.2. Bland-Altman analysis
Fig. 4 shows a Bland-Altman plot based on filtered parametersfor a transmitter attached above the ankle. Radio-based estimateswere similar to the reference measurements of parameters: 95%limits of agreements were [�14.65 cm, 15.05 cm] for step length,[�0.016 s, 0.016 s] for step time and [�0.020 s, 0.028 s] for groundcontact time.
Smaller step lengths at the start show larger errors compared toestimates based on the second 50 m of the track. No differences inerrors have been found between first and second halves of thetrack for step time. Estimates for ground contact time, however,were systematically lower for the first 50 m whereas estimateswere systematically higher for the second 50 m.
4. Discussion
We were the first to apply a radio-based tracking system toautomatically obtain spatio-temporal parameters for sprint run-ning. RMS errors smaller than 2% for step length and step time
Fig. 2. Parameter optimization scheme: Based on the RMSE difference between estimated and reference step length, step time or ground contact time every possiblecombination of threshold, filter type and window size is evaluated and the best model (green rectangle) on the test set will be selected. (For interpretation of the references tocolour in this figure legend, the reader is referred to the web version of this article.)
92 T. Seidl et al. / Journal of Biomechanics 65 (2017) 89–95

Table 1Absolute and percentage errors of spatio-temporal parameters obtained by RedFIR: Mean values based on the reference system, RMSE [absolute and percentage] on test set beforeand after filtering, and 95% levels of agreement after filtering [absolute and percentage] are shown for each transmitter position. Since thresholding wasn’t possible for the backtransmitter, no ground contact time could be estimated.
Transmitter position Gait parameter Mean (reference) RMSE (unfiltered) RMSE (filtered) 95% Limits of agreement (filtered)
Instep Step length (cm) 375 9.6(2.6%)
7.4(2.0%)
[�17.88, 14.84]([�4.8%, 4.0%])
Step time (s) 0.504 0.008(1.6%)
0.007(1.4%)
[�0.0155, 0.0145]([�3.1%, 2.9%])
Ground contact time (s) 0.131 0.016(12.2%)
0.009(6.9%)
[�0.0222, 0.0218]([�16.9%, 16.6%])
Ankle Step length (cm) 375 6.54(1.7%)
5.85(1.6%)
[�14.55, 15.05]([�3.9%, 4.0%])
Step time (s) 0.504 0.0075(1.5%)
0.0068(1.3%)
[�0.0166, 0.0154]([�3.3%, 3.1%])
Ground contact time (s) 0.131 0.047(35.9%)
0.01(7.6%)
[�0.02, 0.028]([�15.3%, 21.4%])
Back Step length (cm) 375 17.2(4.6%)
10.7(2.8%)
[�23.44, 17.48]([�6.3%, 4.7%])
Step time (s) 0.504 0.023(4.6%)
0.012(2.5%)
[�0.05, 0.048]([�9.9%, 9.6%])
Ground contact time (s) 0.131 – – –
Fig. 3. Step length (left), step time (middle) and ground contact time (right) for one athlete over the first 50 m. Radio-based estimates are shown in red (raw data) and blue(based on best parameters for filtering) whereas ground truth trajectories are depicted in black. (For interpretation of the references to colour in this figure legend, the readeris referred to the web version of this article.)
Fig. 4. Bland Altman plots based on optimal filter parameters for step length (left), step time (middle) and ground contact time (right): x-axis shows the mean of the radio-based estimate and ground truth. Y-axis shows the difference between radio-based and ground truth parameters. The dotted and dashed lines are the mean of the differencesand the 95% limits of agreement, respectively. The solid black line shows the corresponding regression line. Circles and triangles correspond to the different sections of thetrack.
T. Seidl et al. / Journal of Biomechanics 65 (2017) 89–95 93

showed the validity of these measurements in general. Althoughour system is capable of tracking multiple athletes simultaneouslyaround the entire track—Mutschler et al. (2013) have done thisduring a soccer match and have published their data—we onlymeasured one athlete at a time on the straight part of the trackdue to the limitations of our reference instrument.
We also aimed to find an optimal sensor placement for a set oftransmitter positions which varied in their intrusiveness, signalquality and acceptance in sports practice. The influence of differenttransmitter positions on the accuracy of the step detection algo-rithm was evaluated and we found similar results when placingthe transmitter on the instep and above the ankle and slightly lessaccurate results when attaching the transmitter to an athlete’sback. In competition, where the perceived intrusiveness of theattachment to an athlete plays a major role, one could work withthe least intrusive setup by attaching only one transmitter to theback. However, attaching two transmitters above the ankles oron the insteps provides additional information about foot contactposition, foot velocities and ground contact times, which are alsorelevant for performance analysis. It must also be noted that forsome runs it was not possible to reliably detect each ground con-tact using the back transmitter. Hence, attaching transmittersabove the ankles has been shown to be a good compromisebetween intrusiveness and accuracy of the estimation.
We demonstrated a way to increase the accuracy of the stepdetection algorithm based on reference data. However, the thresh-olds and filter methods found to work best for our setting mightnot be optimal when analyzing top athletes with different runningstyles. As our study was limited to young athletes it is recom-mended to redo this experiment with a sample of top athletes.
Due to the limited area captured by the reference instrumentwe were not able to obtain ground truth values for the full 100m track. Hence, we split the 100 m track into two 50 m parts thatcould be captured by the reference instrument. Since filtering istypically applied to data on a full 100 m sprint, filter parameterswould have to be adapted accordingly.
As described in Section 3, our analysis is based on only 19 out of48 possible runs. The reason for this is threefold: (i) the radio-based tracking system is—like every other tracking system—notperfect and there will always be tracking artefacts from time totime based on environmental conditions. (ii) There was a bigmetallic bench—that is used for substitutes in soccer matches—on the track close to where the athletes performed the sprints.(iii) Our criterion for using a sprint for analysis was very strict:we disregarded a run even if the data from four out of five trans-mitters was perfect and only a small fraction for one transmitterwas corrupted. Nonetheless, we ended up comparing 508 groundcontacts yielded 470 parameter sets which is still more data thanfor comparable studies (Bergamini et al., 2012; Dunn and Kelley,2015; Schmidt et al., 2016).
The errors we reported are slightly lower than the onesreported for a video-based step detection method presented byDunn and Kelley (2015): they evaluated its performance by com-paring estimates to manually marked ground contact positionsfor 10 m sprints and reported limits of agreements of [�182.6mm, 172.8 mm] for step length and [�0.03 s, 0.03 s] for step timeerrors. As mentioned in the introduction this method presentsthe same challenges that are inherent in all camera-based systems:occlusions between athletes and changing weather and light con-ditions. In addition, their system did not provide estimates forground contact time.
IMUs have been shown to provide accurate temporal parame-ters. However, the estimation of spatial parameters (e.g., steplength) is challenging because the implementation of the doubleintegration procedure suffers from error accumulation over time(Qi et al., 2016). Similar to the results reported here, Bergamini
et al. (2012) reported errors of [�20 ms, 30 ms] for ground contacttime based on one IMU attached to the lower back. Schmidt et al.(2016) recently developed an IMU-based system for detectingground contact times in sprint running. They reported limits ofagreement of [7.1 ms, 12.1 ms] for ground contact times, whichare better than the ones found in our study. This is not surprisingsince IMUs allow for high update rates and direct measurementsof accelerations whereas the local positioning system derives esti-mates for velocity and acceleration using Kalman filtering, whichin turn assumes that the transmitter moves at a constant veloc-ity—this is clearly violated when it is attached to a shoe or leg dur-ing sprint running. However, neither of these studies providedestimates for step time and step length or compared differenttransmitter positions, which clearly effects the ground contactdetection.
Therefore, the combination of IMU and positioning systems asin radio-based or video-based systems seems to be a promisingapproach (Bichler et al., 2012, Qi et al., 2014). Another viableoption would be to develop a more realistic sprint model for theKalman filter.
5. Conclusion
We showed the applicability of a radio-based position trackingsystem for the automatic estimation of continuous spatio-temporalparameters in sprint running. Comparing parameter estimates forstep length, step time and ground contact time to ground truth val-ues obtained from a photoelectric system we found 95% limits ofagreement of [�14.65 cm, 15.05 cm] for step length, [�0.016 s,0.016 s] for step time and [�0.020 s, 0.028 s] for ground contacttime, respectively. We compared the different transmitter posi-tions—on the instep, above the ankle and on the upper back—andfound that each position can be used to obtain accurate stepparameters. RMS errors smaller than 2% for step length and steptime show the potential of our approach for applications in perfor-mance analysis. Placing a transmitter slightly above the ankle wasshown to be the best position for measuring step length and time.However, we were not able to detect ground contact time withcomparable results to those that are possible when using IMUs.Therefore, the combination of local position measurement systemsand IMUs seems to be a promising approach to provide in-depthanalyses even beyond step length and step time.
This was the first study to present a method to automaticallyobtain accurate spatio-temporal parameters for each step duringsprint running using a radio-based tracking system. Results areapplicable to every running and jumping discipline that takes placein the interior of a stadium and are in principle available in real-time. This creates new possibilities for performance analysis andcoaching which can benefit coaches, athletes and media.
Conflict of interest statement
The authors do not have any conflicts of interest or personalrelationships with other people or organizations that could inap-propriately influence this work.
Acknowledgement
The authors would like to thank the Fraunhofer Institute forIntegrated Circuits for providing us with the radio-based trackingdata and for their valuable input throughout the course of thisproject.
This work was funded by the Federal Institute for Sport Science(BISp) under grant ZMVI4-071503/16-18.
94 T. Seidl et al. / Journal of Biomechanics 65 (2017) 89–95

The authors declare that they do not have any financial interestor benefit arising from the direct applications of their research.
References
Bergamini, E., Picerno, P., Pillet, H., Natta, F., Thoreux, P., Camomilla, V., 2012.Estimation of temporal parameters during sprint running using a trunk-mounted inertial measurement unit. J. Biomech. 45, 1123–1126.
Bichler, S., Ogris, G., Kremser, V., Schwab, F., Knott, S., Baca, A., 2012. Towards high-precision IMU/GPS-based stride-parameter determination in an outdoorrunners’ scenario. Procedia Eng. 34, 592–597.
Bland, J.M., Altman, D.G., 1986. Statistical methods for assessing agreementbetween two methods of clinical measurement. Lancet (London, England) 1,307–310.
Debaere, S., Jonkers, I., Delecluse, C., 2013. The contribution of step characteristics tosprint running performance in high-level male and female athletes. J. StrengthCond. Res./Natl. Strength Cond Assoc. 27, 116–124.
Dunn, M., Kelley, J., 2015. Non-invasive, spatio-temporal gait analysis for sprintrunning using a single camera. Procedia Eng. 112, 528–533.
Grün, T.V.D., Franke, N., Wolf, D., Witt, N., Eidloth, A., 2011. A real-time trackingsystem for football match and training analysis. In: Heuberger, A., Elst, G.,Hanke, R. (Eds.), Microelectronic Systems. Springer, Berlin Heidelberg, Berlin,Heidelberg, pp. 199–212.
Hanon, C., Gajer, B., 2009. Velocity and stride parameters of world-class 400-meterathletes compared with less experienced runners. J. Strength Cond. Res./Natl.Strength Cond. Assoc. 23, 524–531.
Hunter, J.P., Marshall, R.N., McNair, P.J., 2004. Interaction of step length and steprate during sprint running. Med. Sci. Sports Exerc. 36, 261–271.
Lienhard, K., Schneider, D., Maffiuletti, N.A., 2013. Validity of the Optogaitphotoelectric system for the assessment of spatiotemporal gait parameters.Med. Eng. Phys. 35, 500–504.
Miller, A., 2009. Gait event detection using a multilayer neural network. GaitPosture 29, 542–545.
Mutschler, C., Ziekow, H., Jerzak, Z., 2013. The DEBS 2013 grand challenge. In:Proceedings of the 7th ACM International Conference on Distributed Event-Based Systems. ACM, pp. 289–294.
Letzelter, M., Letzelter, S., Burger, R., 2005. Der Sprint. Eine Bewegungs- undTrainingslehre. [Schors-Verlag], [Niederhausen/Taunus].
Nagahara, R., Matsubayashi, T., Matsuo, A., Zushi, K., 2014. Kinematics of transitionduring human accelerated sprinting. Biology Open 3, 689–699.
Qi, Y., Soh, C.B., Gunawan, E., Low, K.-S., Thomas, R., 2014. Estimation of spatial-temporal gait parameters using a low-cost ultrasonic motion analysis system.Sensors (Basel, Switzerland) 14, 15434–15457.
Qi, Y., Soh, C.B., Gunawan, E., Low, K.-S., Thomas, R., 2016. Assessment of foottrajectory for human gait phase detection using wireless ultrasonic sensornetwork. IEEE Trans. Neural Syst. Rehab. Eng.: Publ. IEEE Eng. Med. Biol. Soc. 24,88–97.
Schmidt, M., Rheinländer, C., Nolte, K.F., Wille, S., Wehn, N., Jaitner, T., 2016. IMU-based determination of stance duration during sprinting. Procedia Eng., 747–752
Taborri, J., Palermo, E., Rossi, S., Cappa, P., 2016. Gait partitioning methods: asystematic review. Sensors (Basel, Switzerland) 16.
T. Seidl et al. / Journal of Biomechanics 65 (2017) 89–95 95

SPRINGER NATURE LICENSETERMS AND CONDITIONS
Dec 13, 2018
This Agreement between Mr. Thomas Seidl ("You") and Springer Nature ("SpringerNature") consists of your license details and the terms and conditions provided by SpringerNature and Copyright Clearance Center.
License Number 4486990344915
License date Dec 13, 2018
Licensed Content Publisher Springer Nature
Licensed Content Publication Springer eBook
Licensed Content Title Evaluating the Indoor Football Tracking Accuracy of a Radio-BasedReal-Time Locating System
Licensed Content Author Thomas Seidl, Matthias Völker, Nicolas Witt et al
Licensed Content Date Jan 1, 2016
Type of Use Thesis/Dissertation
Requestor type academic/university or research institute
Format electronic
Portion full article/chapter
Will you be translating? no
Circulation/distribution <501
Author of this SpringerNature content
yes
Title Research Scientist
Institution name Technical University of Munich
Expected presentation date Mar 2019
Requestor Location Mr. Thomas Seidl
Springer Nature Terms and Conditions for RightsLink PermissionsSpringer Nature Customer Service Centre GmbH (the Licensor) hereby grants you anon-exclusive, world-wide licence to reproduce the material and for the purpose andrequirements specified in the attached copy of your order form, and for no other use, subjectto the conditions below:
The Licensor warrants that it has, to the best of its knowledge, the rights to license reuse1.
RightsLink Printable License https://s100.copyright.com/CustomerAdmin/PLF.jsp?ref=975c1672-6c...
1 of 3 13/12/2018, 11:54

of this material. However, you should ensure that the material you are requesting isoriginal to the Licensor and does not carry the copyright of another entity (as credited inthe published version).
If the credit line on any part of the material you have requested indicates that it wasreprinted or adapted with permission from another source, then you should also seekpermission from that source to reuse the material.
Where print only permission has been granted for a fee, separate permission must beobtained for any additional electronic re-use.
2.
Permission granted free of charge for material in print is also usually granted for anyelectronic version of that work, provided that the material is incidental to your work as awhole and that the electronic version is essentially equivalent to, or substitutes for, theprint version.
3.
A licence for 'post on a website' is valid for 12 months from the licence date. This licencedoes not cover use of full text articles on websites.
4.
Where 'reuse in a dissertation/thesis' has been selected the following terms apply:Print rights of the final author's accepted manuscript (for clarity, NOT the publishedversion) for up to 100 copies, electronic rights for use only on a personal website orinstitutional repository as defined by the Sherpa guideline (www.sherpa.ac.uk/romeo/).
5.
Permission granted for books and journals is granted for the lifetime of the first edition anddoes not apply to second and subsequent editions (except where the first editionpermission was granted free of charge or for signatories to the STM Permissions Guidelineshttp://www.stm-assoc.org/copyright-legal-affairs/permissions/permissions-guidelines/),and does not apply for editions in other languages unless additional translation rights havebeen granted separately in the licence.
6.
Rights for additional components such as custom editions and derivatives require additionalpermission and may be subject to an additional fee. Please apply [email protected]/[email protected] for theserights.
7.
The Licensor's permission must be acknowledged next to the licensed material in print. Inelectronic form, this acknowledgement must be visible at the same time as thefigures/tables/illustrations or abstract, and must be hyperlinked to the journal/book'shomepage. Our required acknowledgement format is in the Appendix below.
8.
Use of the material for incidental promotional use, minor editing privileges (this does notinclude cropping, adapting, omitting material or any other changes that affect the meaning,intention or moral rights of the author) and copies for the disabled are permitted under thislicence.
9.
Minor adaptations of single figures (changes of format, colour and style) do not require theLicensor's approval. However, the adaptation should be credited as shown in Appendixbelow.
10.
Appendix — Acknowledgements:
For Journal Content:Reprinted by permission from [the Licensor]: [Journal Publisher (e.g.Nature/Springer/Palgrave)] [JOURNAL NAME] [REFERENCE CITATION(Article name, Author(s) Name), [COPYRIGHT] (year of publication)
For Advance Online Publication papers:Reprinted by permission from [the Licensor]: [Journal Publisher (e.g.Nature/Springer/Palgrave)] [JOURNAL NAME] [REFERENCE CITATION(Article name, Author(s) Name), [COPYRIGHT] (year of publication), advance
online publication, day month year (doi: 10.1038/sj.[JOURNAL ACRONYM].)
For Adaptations/Translations:
RightsLink Printable License https://s100.copyright.com/CustomerAdmin/PLF.jsp?ref=975c1672-6c...
2 of 3 13/12/2018, 11:54

Adapted/Translated by permission from [the Licensor]: [Journal Publisher (e.g.Nature/Springer/Palgrave)] [JOURNAL NAME] [REFERENCE CITATION(Article name, Author(s) Name), [COPYRIGHT] (year of publication)
Note: For any republication from the British Journal of Cancer, the followingcredit line style applies:
Reprinted/adapted/translated by permission from [the Licensor]: on behalf of CancerResearch UK: : [Journal Publisher (e.g. Nature/Springer/Palgrave)] [JOURNALNAME] [REFERENCE CITATION (Article name, Author(s) Name),[COPYRIGHT] (year of publication)
For Advance Online Publication papers:Reprinted by permission from The [the Licensor]: on behalf of Cancer Research UK:[Journal Publisher (e.g. Nature/Springer/Palgrave)] [JOURNAL NAME][REFERENCE CITATION (Article name, Author(s) Name), [COPYRIGHT] (yearof publication), advance online publication, day month year (doi: 10.1038/sj.
[JOURNAL ACRONYM])
For Book content:Reprinted/adapted by permission from [the Licensor]: [Book Publisher (e.g.Palgrave Macmillan, Springer etc) [Book Title] by [Book author(s)][COPYRIGHT] (year of publication)
Other Conditions:
Version 1.1
Questions? [email protected] or +1-855-239-3415 (toll free in the US) or+1-978-646-2777.
RightsLink Printable License https://s100.copyright.com/CustomerAdmin/PLF.jsp?ref=975c1672-6c...
3 of 3 13/12/2018, 11:54

Evaluating the Indoor Football TrackingAccuracy of a Radio-Based Real-Time Locating
System
Thomas Seidl1, Matthias Volker1, Nicolas Witt1, Dino Poimann2, Titus Czyz2,Norbert Franke1 and Matthias Lochmann2
1 Fraunhofer Institute for Integrated Circuits, Nordostpark 93,90411 Nuremberg, Germany
2 Friedrich-Alexander-University Erlangen-Nuremberg, Gebbertstr. 123b,91058 Erlangen, Germany
Abstract. Nowadays, many tracking systems in football provide posi-tional data of players but only a few systems provide reliable data of theball. The tracking quality of many available systems suffers from highball velocities up to 120km/h and from the occlusion of both the playersand the ball.Radio-based local positioning systems use sensors integrated in the balland located on the players’ back or near the shoes to avoid such issues.However, a qualitative evaluation of the tracking precision of radio-basedsystems is often not available and to the best of our knowledge there areactually no studies that deal with the positional accuracy of ball track-ing.In this paper we close this gap and use the RedFIR radio-based locatingsystem together with a ball shooting machine to repeatedly simulate re-alistic situations with different velocities in an indoor environment. Wecompare the derived positions from high speed camera footage to thepositions provided by the RedFIR system by means of root mean squareerror (RMSE) and Bland-Altman analysis.We found an overall positional RMSE of 12.5cm for different ball veloc-ities ranging from 45km/h to 61km/h. There was a systematic bias of11.5cm between positions obtained by RedFIR and positions obtained
by the high speed camera. Bland-Altman analysis showed 95% limits ofagreement of [ 21.1cm, 1.9cm]. Taking the ball diameter of 22cm intoaccount these results indicate that RedFIR is a valid tool for kinematic,tactical and time-motion analysis of ball movements in football.
1 Introduction
Positional data of football player movements helps to analyze the players’ phys-iological demands during matches, to analyze tactical movements of opponents,and to show additional information about the performance of players to spec-tators. Nowadays, there are different tracking systems available that providepositional data of players. In official matches camera-based systems are used fre-quently as rules do not yet permit GPS- and radio-based systems that need to
� Springer International Publishing Switzerland 2016P. Chung et al. (eds.), Proceedings of the 10th International Symposiumon Computer Science in Sports (ISCSS), Advances in Intelligent Systemsand Computing 392, DOI 10.1007/978-3-319-24560-7_28
217

integrate sensors into the ball or to attach them to players. Hence, sensor-basedsystems are more common in training environments [18].However, the tracking performance of camera-based systems suffers from consid-erable shortcomings: ball velocities of up to 120km/h, instantaneous movements,changing weather and illumination conditions and the occlusion of both the play-ers and the ball are common challenges for these systems [14].Several researchers have tried to evaluate the performance of different playertracking systems. See [2] for an overview how player tracking data has been usedin research in the last few years. Positional data forms the basis for further sta-tistical analyses, e.g. covered distances, runs with different intensities, analysis oftactical patterns. Thus the evaluation of the accuracy of positional data shouldbe an integral part of the evaluation of a tracking system.However, there are only a few studies that evaluated the positional accuracy oftracking systems [16, 18] rather than assessing the quality of a system by eval-uating parameters directly, that are typically derived from positional data, e.g.covered distances and mean velocities [6,8]. This is mainly imposed by the lack ofreference systems that precisely determine the position of fast moving objects.These studies have in common that they are limited to player tracking as nostudy tested the positional accuracy of ball tracking so far.Although ball tracking in sport is a vivid research area within Computer Vision(Football [13] , Baseball [11], Tennis [17], Basketball [3], Volleyball [4, 9]) theperformance of tracking algorithms is typically measured by means of identifica-tion rates or pixel differences whereas resulting differences in 2D or 3D positionsto a gold standard should be considered.Kelley et al. validated an automated ball velocity and spin rate estimator thatworks on images from a high speed camera and compared it to velocities foundwith the help of light gates [12].However, to find a correct estimate for the position of fast moving objects issignificantly more challenging. Choppin et al. provided a set-up for obtainingprecise three-dimensional positions of fast moving objects using two synchro-nized high speed cameras that has been applied in tennis matches for analyzingball and racket speeds [5].We use a similar approach based on one high speed camera (HSC) to provideground truth values for the position of football shots that were simultaneouslytracked by the RedFIR system. The RedFIR radio-based local positioning sys-tem uses sensors integrated in the ball and located near the players’ shoes toprovide positional, velocity and acceleration data on the players and the ball.We organized the remainder of the paper as follows: Section 2 explains thefunctional principle of the RedFIR Real-time Locating System used for the ex-periments we describe in Section 3. We present results in Section 4, provide adiscussion in Section 5 and summarize our conclusions in Section 6.
218 T. Seidl et al.

2 The RedFIR Real-Time Locating System
The RedFIR Real-Time Locating System (RTLS) is based on time-of-flight mea-surements, where small transmitter integrated circuits emit burst signals. An-tennas around the pitch receive these signals and send them to a centralizedunit which processes them and extracts time of arrival (ToA) values. ToA val-ues are the basis for time difference of arrival (TDoA) values, from which x, y,and z coordinates, three-dimensional velocity and acceleration are derived usinghyperbolic triangulation.The RedFIR system operates in the globally license-free ISM (industrial, scien-tific, and medical) band of 2.4GHz and uses the available bandwidth of around80MHz. Miniaturized transmitters generate short broadband signal bursts to-gether with identification sequences. The locating system is able to receive anoverall of 50, 000 of those signal bursts per second. The installation provides 12antennas that receive signals from up to 144 different transmitters. Balls emitaround 2, 000 tracking bursts per second whereas the remaining transmitters(61mm×38mm×7mm) emit around 200 tracking bursts per second. The minia-ture transmitters themselves are splash-proof (in case of the player transmitters)or integrated into the football. Figure 1b shows a glass model of a ball trans-mitter. For a more detailed description of the RedFIR system and the generateddata streams see von der Grun et al. [10] and Mutschler et al. [15].
3 Methods
3.1 Hardware Setup
We conducted our experiments in the Fraunhofer Test and Application CenterL.I.N.K. in Nuremberg, where -within an area of 30m×20m×10m- a RedFIR sys-tem (version 1.1) is installed [7]. We placed a Seattle Sport Sciences SideKick ballshooting machine at a distance of 5.5m from a target wall and shot thirty timeswith speed levels 3 (4, 5), i.e., with approximately 45km/h (53km/h, 61km/h).For better readability we will refer to these velocities as ’slow’, ’medium’ and’fast’. We only activated the ball’s transmitter and two reference transmitter tominimize biasing side effects. Twelve receivers were active during our tests.To map the coordinates of the ball to its real coordinates we used a WeinbergerG2 high speed camera with a resolution of 1536×1024 @ 1, 000fps and a shuttertime of 992μs. The camera was adjusted to aim at the target wall, as shown infigure 1a. Additional flicker-free light ensured that distortion or blurring effectsin the images were avoided. The camera was triggered as soon as the ball becamevisible in the images of our reference system.
To calibrate the camera we used multiple checkerboard images togetherwith the freely available camera calibration and digitization software Check2D(www.check2d.co.uk) and manually marked the ball in the images (Reprojectionerror 0.112 pixel). As a result we obtained real world coordinates of the ball inthe direction of motion for each image frame.We investigated the accuracy of the high speed camera data by digitizing known
Evaluating the Indoor Football Tracking Accuracy … 219

(a) Hardware setup for test measure-ments.
(b) A glass model of the ball’s transmitterand inductive charger.
Fig. 1: Test setup and glass model of a ball transmitter.
coordinates of a grid painted on a panel (residuals: 0.5mm ± 0.2mm) and byplacing the ball at known positions (residuals: 11mm ± 6.8mm) in front of thecamera. As we assume RedFIR’s position errors to be a magnitude higher thissuffices our requirements.
3.2 Synchronization
To synchronize the data of the RedFIR system with the camera data we appliedthe following procedure:RedFIR provides approximately twice as much positions compared to the highspeed camera recordings (2000 per second). We identify the frame that showsthe ball deflecting by the target wall in the high speed camera images and inthe RedFIR data. Since we know the time period of the ball being visible in thecamera images we can cut the corresponding RedFIR data around the identifiedmoment of deflection. We then interpolate RedFIR and high speed camera datato 2000Hz and correlate that position with the current frame provided by thecamera.In order to specify a common coordinate system for the high speed cameradata we used a grid printed on a panel in line with known coordinates in theRedFIR coordinate system. The axes of the high speed camera coordinate systemwere chosen to point parallel to the RedFIR coordinate system. Hence, we cantransform the data points with a simple translation (and mirroring of the axes),and align the data of the high speed camera to the RedFIR coordinate systemand vice versa.
3.3 Data Analysis
We analyzed thirty shots at three different velocities (ten trials each). To min-imize biasing effects we restricted our analyses to one sequence before impactwith the target wall. The sequence starts when the ball becomes visible in the
220 T. Seidl et al.

image and ends 2.5ms before impact. Due to the deformation of the ball at im-pact it is difficult to mark the ball by fitting a circle around it.We then calculated differences between the positions of the RedFIR system andthe positions provided by the high speed camera and summarized them by meansof root-mean-square error (RMSE) and 95% limits of agreement (LOA) for theshot in moving direction.The RMSE is a measure of the deviation between the RedFIR data and the dataprovided by the camera and is defined as:
RMSE =
√√√√ 1
N
N∑
i
(Xirf −Xi
hsc)2, (1)
whereXirf andXi
hsc denote the i-th sample, i.e. the position provided by RedFIRand the high speed camera. N equals the total number of samples.
4 Results
Fig. 2: Bland-Altman plot: The x-axis corresponds to the mean of RedFIR andHSC position in the direction of movement, whereas the y-axis shows the differ-ence between the two systems. The dotted and dashed lines are the mean of thedifferences and the 95% limits of agreement, respectively. Circles, triangles andpluses correspond to slow, medium and fast velocities.
Evaluating the Indoor Football Tracking Accuracy … 221

We were able to analyze all thirty shots. The RedFIR system provided con-tinuously data throughout the experiments. There were no outliers in the dataand we ended up comparing 3614 positions. The mean duration of the measure-ment interval was 0.065s.For the comparison of the two systems we used the method by Bland and Alt-man [1]. Figure 2 shows the corresponding Bland-Altman plot.Ball positions provided by RedFIR showed a systematic bias of −11.5cm. How-ever, the overall standard deviation was 4.9cm and therefore quite low. The lowerand upper 95% limits of agreement were −21.1cm and −1.9cm. The results showonly a 1mm difference in RMS errors between slow, medium and fast shots. Themaximum deviation between the two systems was found at lowest speed withan error of 20.3cm. The correlation between the positions obtained by the twosystems was 98.1%. Table 1 summarizes the results for the different velocities.
Table 1: Positional errors obtained for different velocities: mean, standard devi-ation, RMSE, 95% LOA and maximum error are shown in cm.
Velocity μ(cm) σ(cm) RMSE 95%-CI Max. error(cm)
slow -10.2 7.1 12.4 [-24.1, 3.7] 20.3
medium -12.2 2.6 12.5 [-17.2, -7.0] 18.5
fast -12.4 1.8 12.5 [-15.9, -9.0] 16.8
∅ -11.5 4.9 12.5 [-21.1, -1.9] 20.3
5 Discussion
Our studies show that the RedFIR system is able to accurately track the posi-tion of a football.Its positional accuracy is better than the ones reported in previous studies forplayer tracking by Siegle et al. [18] and Ogris et al. [16].For applications of positional data for kinematic and tactical analyses the esti-mation error of tracking systems should be below the diameter of the human’sbody when dealing with player data. Considering a ball diameter of 22cm theresults indicate that the system is applicable in these domains for the analysisof ball movement. However, the system is not suited for applications like goaldetection where only a maximal error of 1.5cm is allowed.By using only one camera, we have limited our study to only focus on the maindirection of motion. By using two synchronized cameras we could measure thetracking precision in much greater detail. However, the ball does not move muchin y-direction and a comparison of the accuracy in x- and y-direction at the same
222 T. Seidl et al.

time results in imprecise conclusions. Instead, we propose to rotate the set-upby 90 degrees to investigate the system’s accuracy in y-direction separately. Theerrors are expected to be similar to the errors described in this paper. The track-ing accuracy was higher for lower velocities. RMS errors for the tested range ofvelocities were similar. Small differences between trials prove the robustness ofthe RedFIR ball tracking.The experimental design may have had an influence on the results as the posi-tion of the integrated chip, suspended in the middle of the ball, is affected by itsdeformation when the ball hits the target wall. The moment of deflection iden-tified in the images corresponds to the frame when the ball visually changes itsdirection whereas the moment identified in the RedFIR data corresponds to themoment when the integrated chip changes its direction. These estimates do nothave to agree perfectly and this could have led to an imperfect synchronization.The setup was chosen to minimize biasing effects for the high speed camera andthe RedFIR system. The camera system is able to provide a very accurate es-timate of the ball position for a small volume in front of the target wall and ashort time interval (1m and 0.15s in this setup), whereas the RedFIR system isapplicable for the full size of a football pitch.
6 Conclusion
We conclude that the RedFIR system (version 1.1) installed indoors in the Testand Application Center L.I.N.K. is able to reliably track the movement of theball with an RMSE of less than 13cm. This shows the applicability of RedFIR’sfootball tracking for kinematic, tactical and time-motion analyses. Since the ballis the main object of interest in football, knowledge about its movement formsthe basis for an automated detection of ball possession, passes and every tacticalanalysis that involves the ball.As the system was developed for outdoor applications we expect the systemsaccuracy to be better than the one presented here, and aim on redoing thetests with a system that is installed outdoors in future work. Since the rangeof velocities was only between 45km/h and 61km/h we aim on doing a morethorough testing of the accuracy for lower and higher velocities. As a footballcan typically reach a speed of up to 120km/h it will be interesting to see howthe accuracy changes for these high velocities.
7 Acknowledgement
This contribution was supported by the Bavarian Ministry of Economic Affairsand Media, Energy and Technology as a part of the Bavarian project ’Leis-tungszentrum Elektroniksysteme (LZE)’.
References
1. Bland, J.M., Altman, D.G.: Statistical methods for assessing agreement betweenmeasurement. Biochimica Clinica 11, 399–404 (1987)
Evaluating the Indoor Football Tracking Accuracy … 223

2. Castellano, J., Alvarez-Pastor, D., Bradley, P.: Evaluation of research using com-puterised tracking systems (amisco and prozone) to analyse physical performancein elite soccer: a systematic review. Sports Med 44, 701–712 (2014)
3. Chakraborty, B., Meher, S.: A trajectory-based ball detection and tracking systemwith applications to shooting angle and velocity estimation in basketball videos.In: 2013 Annual IEEE India Conference (INDICON). pp. 1–6. IEEE (2013)
4. Chen, H.T., Tsai, W.J., Lee, S.Y., Yu, J.Y.: Ball tracking and 3d trajectory ap-proximation with applications to tactics analysis from single-camera volleyball se-quences. Multimed Tools Appl 60, 641–667 (2011)
5. Choppin, S., Goodwill, S.R., Haake, S.J., Miller, S.: 3d player testing at the wim-bledon qualifying tournament. In: Miller, S., Capel-Davies, J. (eds.) Tennis scienceand technology 3. pp. 333–340. International tennis federation (2007)
6. Di Salvo, V., Collins, A., McNeill, B., Cardinale, M.: Validation of Prozone: Anew video-based performance analysis system. Journal of Performance Analysis inSport 6(1), 108–119 (2006)
7. Eidloth, A., Lehmann, K., Edelhaeusser, T., von der Gruen, T.: The test andapplication center for localization systems L.I.N.K. In: International Conferenceon Indoor Positioning and Indoor Navigation. pp. 27–30 (2014)
8. Frencken, W., Lemmink, K., Dellemann, N.: Soccer-specific accuracy and validityof the local position measurement (LPM) system. Journal of Science and Medicinein Sport 13, 641–645 (2010)
9. Gomez, G., Herrera Lopez, P., Link, D., Eskofier, B.: Tracking of ball and playersin beach volleyball videos. PLoS ONE 9(11), e111730 (11 2014)
10. von der Grun, T., Franke, N., Wolf, D., Witt, N., Eidloth, A.: A real-time trackingsystem for football match and training analysis. In: Microelectronic Systems. pp.199–212. Springer Berlin (2011)
11. Gueziec, A.: Tracking pitches for broadcast television. Computer 35, 38–43 (2002)12. Kelley, J., Choppin, S., Goodwill, S., Haake, S.: Validation of a live, automatic
ball velocity and spin rate finder in tennis. Procedia Engineering 2(2), 2967 – 2972(2010)
13. Liu, S.X., Jiang, L., Garner, J., Vermette, S.: Video based soccer ball tracking.2010 IEEE Southwest Symposium on Image Analysis & Interpretation pp. 53–56(2010)
14. Moeslund, T., Thomas, G., Hilton, A.: Computer Vision in Sports, Advances inComputer Vision and Pattern Recognition. Springer (2015)
15. Mutschler, C., Ziekow, H., Jerzak, Z.: The debs 2013 grand challenge. In: Proceed-ings of the 7th International Conference on Distributed Event-Based Systems. pp.283–294 (2013)
16. Ogris, G., Leser, R., Horsak, B., Kornfeind, P., Heller, M., Baca, A.: Accuracy ofthe LPM tracking system considering dynamic position changes. Journal of SportsSciences 30(14), 1503–1511 (2012)
17. Owens, N., Harris, C., Stennet, C.: Hawk-eye tennis system. Proc Inf Conf VisualInformation Engineering 2003 (2), 182–185 (2003)
18. Siegle, M., Stevens, T., Lames, M.: Design of an accuracy study for position de-tection in football. Journal of Sports Sciences 31(2), 166–172 (2013)
224 T. Seidl et al.

Procedia Engineering 147 ( 2016 ) 584 – 589
1877-7058 © 2016 The Authors. Published by Elsevier Ltd. This is an open access article under the CC BY-NC-ND license (http://creativecommons.org/licenses/by-nc-nd/4.0/).Peer-review under responsibility of the organizing committee of ISEA 2016doi: 10.1016/j.proeng.2016.06.244
ScienceDirectAvailable online at www.sciencedirect.com
11th conference of the International Sports Engineering Association, ISEA 2016
Validation of football’s velocity provided by a radio-based tracking system
Thomas Seidla*, Titus Czyzb, Dominik Spandlera, Norbert Frankea and Matthias Lochmanna,b aFraunhofer Institute for Integrated Circuits, Nordostpark 84, 90411 Nuremberg, Germany
bFriedrich-Alexander-University Erlangen-Nuremberg, Gebbertstr. 123b, 91058 Erlangen, Germany
Abstract
Nowadays, many tracking systems in football provide positional data of players but only a few systems provide reliable data of the ball itself. The tracking quality of many available systems suffers from high ball velocities of up to 34 ms-1 and from the occlusion of both the players and the ball. Knowledge about the position and velocity of the football can yield valuable information for players, coaches and the media. To assess the accuracy of the football’s velocity provided by the radio-based tracking system RedFIR, we used a ball shooting machine to repeatedly simulate realistic situations at different velocities ranging from 7.9 ms-1 to 22.3 ms-1 in an indoor environment. We then compared velocity estimates for 50 shots at five speed levels with ground truth values derived from light gates by way of mean percentage error (MPE) and Bland-Altman analysis. The speed values had an MPE of 2.6% (-0.49 ms-1). These results suggest that RedFIR is capable of providing accurate information about the kinematics of a football. © 2016 The Authors. Published by Elsevier Ltd. Peer-review under responsibility of the organizing committee of ISEA 2016
* Corresponding author. Tel.: +49 (0) 911 58061 3225; fax: +49 (0) 911 58061 3299. E-mail address: [email protected]
Keywords: RTLS; Football Tracking; Accuracy; Speed
1. Introduction
Nowadays, there are different tracking systems available that provide positional and velocity data of football players and the ball. In official matches camera-based systems are used frequently as game rules do not yet permit GPS- and radio-based systems that need to integrate sensors into the ball or to attach them to players. Hence, the latter are more common in training environments [1]. However, the tracking performance of camera-based systems suffers from considerable shortcomings: ball velocities of up to 34 ms-1, instantaneous movements, changing weather and illumination conditions and the occlusion of both the players and the ball are common challenges for these systems [2]. The RedFIR radio-based local positioning system uses sensors integrated into the ball and located near the players' shoes to avoid such issues and provides positional, velocity and acceleration data on the players and the ball with high update rates and high precision that could be used in training and match play.
Knowledge about the movements (position and velocity) of players and playing objects (e.g.; a tennis ball or football) allows for assessing tactical and technomotorical skills quantitatively and qualitatively without the need of subjective expert ratings and forms an important part of performance analysis. Kinematic data of football player movements can also help to analyze the players’ physiological demands during matches and to show additional information about the performance of players to spectators. In game sports, like football or tennis, the target or goal for each party is to handle the ball in such a way to score a goal (or point) and simultaneously prevent the opponent from scoring [3]. Hence, knowledge about the movement and speed of the playing object is of utmost importance to analyze tactical performance in game sports.
Moreover, it can also be helpful when analyzing technomotorical skills: In sports like baseball, exerting force directly onto the ball is crucial for pitchers in order to accelerate it to high speeds which is an important factor of pitching performance [4,5]. Typically, technique-related studies have been conducted in laboratory scenarios on volleyball serves [6,7] as well as ball speed in table tennis [8] and football [9].
In a match or training environment some investigations based on ball speed have been carried out using radar guns, such as in football [10], tennis [11] or handball [12], others have used light gates and/or (high speed) cameras in tennis [13] and baseball
© 2016 The Authors. Published by Elsevier Ltd. This is an open access article under the CC BY-NC-ND license (http://creativecommons.org/licenses/by-nc-nd/4.0/).Peer-review under responsibility of the organizing committee of ISEA 2016

585 Thomas Seidl et al. / Procedia Engineering 147 ( 2016 ) 584 – 589
[14]. Nevertheless, none of these methods provides an easy way to obtain ball speed that is applicable for every pass and shot on the whole football pitch: a radar gun just gives the closing speed between the moving object and the radar gun and is thus limited to goal shots when being placed behind a goal. Light gates require a fixed setup and the ball to intercept both light beams which makes their use non-practical in training and prohibits their use in actual match play. Obtaining ball speed from video cameras is possible in training and match play with the before mentioned shortcomings.
However, there is a lack of scientific research regarding the validity of methods for acquiring kinematic data of the football that are applicable in training and match situations since there are almost no studies concerned with the accuracy of ball speed estimates in sport. Kelley et al. [13] validated an automated software tool based on high-speed video for estimating ball speed and spin rate in tennis. They assessed its accuracy by comparing speed obtained by the software to the ones based on light gates. For this study we adapted their setup to football.
This study aims at validating the estimate of football speed obtained by the radio-based locating system RedFIR. See Seidl et al. [15] for a validation study dealing with the positional accuracy of the ball tracking. Hence the current study complements the validation of kinematic data of a football obtained by a radio-based tracking system.
2. Methods
2.1. The RedFIR Real-Time Locating System
The RedFIR Real-Time Locating System (RTLS) is based on time-of-flight measurements, where small transmitter integrated circuits emit burst signals. Antennas around the pitch receive these signals and send them to a centralized unit which processes them and extracts time of arrival (ToA) values. ToA values are the basis for time difference of arrival (TDoA) values, from which x, y, and z coordinates, (and subsequently three-dimensional velocity and acceleration) are derived using hyperbolic triangulation.
The RedFIR system operates in the globally license-free ISM (industrial, scientific, and medical) band of 2.4 GHz and uses the available bandwidth of around 80 MHz. Miniaturized transmitters generate short broadband signal bursts together with identification sequences. The locating system is able to receive an overall of 50,000 of those signal bursts per second. An installation typically provides 12 antennas that receive signals from up to 144 different transmitters. Balls emit around 2,000 tracking bursts per second whereas the remaining transmitters (61 mm × 38 mm × 7 mm) emit around 200 tracking bursts per second. The miniature transmitters themselves are splash-proof (in case of the player transmitters) or integrated into the football. Figure 1b) shows a glass model of a ball transmitter. For a more detailed description of the RedFIR system and the generated data streams see von der Grün et al. [16] and Mutschler et al. [17].
2.2. Hardware setup
We conducted our experiments in the Fraunhofer Test and Application Center L.I.N.K. in Nuremberg, where – within an area of 30 m × 20 m × 10 m – a RedFIR system is installed [18]. To repeatedly simulate realistic shots we placed a ball shooting machine (Seattle Sport Sciences, Inc., Redmond, WA, USA) in front of two light gates (Tag Heuer, Chronoprinter CP505) at known distances to obtain ground truth values for mean velocity. Since different speed levels resulted in slightly different ball trajectories we had to adjust the position of the second light gate to guarantee that the ball would interrupt both light gates and to increase the accuracy of the reference system based on rounding errors as outlined in 2.3.
We shot the ball ten times at each speed level 0 (2, 4, 6, 10), i.e., with approximately 7.93 ms-1 (9.75 ms-1, 15.04 ms-1, 20.17 ms-1, 22.32 ms-1) resulting in a total of 50 shots. Only the ball's transmitter and two reference transmitters were activated. Twelve receivers were active during our tests. Figure 1a) shows the setup detailing the placement of the ball shooting machine and light gates.

586 Thomas Seidl et al. / Procedia Engineering 147 ( 2016 ) 584 – 589
a) b)
Fig. 1. (a) hardware setup for test measurements; (b) a glass model of the ball’s transmitter and inductive charger.
2.3. Data analysis
To assess the accuracy of the ball velocity obtained by the RedFIR system we compared it to mean velocities based on the light gates. Knowing the distance between the gates one easily obtains mean velocities by dividing the distance between the gates by the time it took the ball to interrupt both light beams.
Based on ground markings in the test center we knew the positions of the light gates within the RedFIR coordinate system and restricted the corresponding ball data accordingly, thus resulting in comparable mean velocities. To assess the differences between these two estimates statistically the method of Bland and Altman [19] was used. We used the percentage error (PE) for our analysis since it is more meaningful than the mean squared error in this case. It is defined as the difference between the two estimates normalized by the ground truth value given by the light gate:
The light gates were capable of measuring time with a precision of 10 milliseconds. We therefore placed the gates as far away
as possible to minimize rounding errors but close enough for the ball to interrupt both light gates to provide valid measurements: Assume it took the ball 0.56 s to cover a distance of 5.5 m between the two light gates which results in a mean speed of 9.82 ms-
1. Since the time is rounded to two digits this will be the case for every value in the range from 0.555 s (which get rounded up to 0.56 s) to 0.564 s (which gets rounded down to 0.56 s) resulting in ‘true’ speeds between 9.75 ms-1 to 9.91 ms-1. Hence, neglecting other possible sources of error, the light gates, in this example, are capable of providing ground truth values with an expected maximal measurement error based on rounding of ~1.0% . An analogous calculation yields an expected maximal error ~1.2% at highest speed level 10 (22.32 ms-1). However, this should suffice our requirements for using the velocity obtained by the light gates as ground truth.
3. Results
We were able to analyze 49 shots since for one shot the battery of the ball’s transmitter was afterwards found to be empty. The RedFIR system provided data continuously throughout the experiments, there were no outliers in the data and we ended up comparing a total of 49 shots at five different speed levels. For the comparison of the two systems we used the method by Bland and Altman [19] that is typically used to investigate differences between two measurement systems. Figure 2 shows the corresponding Bland-Altman plot: Ball speeds provided by RedFIR showed a systematic bias (or Mean Percentage Error) of -2.6% (-0.49 ms-1). In most cases RedFIR slightly overestimated the ball’s velocity. However, the overall standard deviation of 2.4% showed a low variation between measurements. The lower and upper limits of agreement (LOA) were -7.4% (-1.44 ms-1) and 2.16% (0.47 ms-1) providing indication where one would expect the difference between the estimates to be the majority (95%) of time. The results show an increase in error at higher velocities. The maximum deviation between the two systems was found at speed level 6 (20.17 ms-1) with an error of -8.1% (-1.98 ms-1).

587 Thomas Seidl et al. / Procedia Engineering 147 ( 2016 ) 584 – 589
Fig. 2. Bland-Altman plot: The x-axis corresponds to the average of the velocities based on the light gates and RedFIR, whereas the y-axis shows the percentage difference between the two systems’ estimates. The dotted and dashed lines are the mean of the differences (MPE) and the limits of agreement, respectively. Circles, triangles, pluses, crosses and diamonds correspond to the different speed levels.
Table 1 summarizes the results showing speed level, mean speed (based on light gates), mean percentage error, standard deviation, limits of agreement and maximum absolute error for different speed levels. The magnitude of the MPE increases with increasing velocity for speed levels 0-6 but decreases at highest speed level 10. An inspection of the cumulative density function showed that 92% of the analyses had an absolute error of less than 6%.
Table 1. Percentage errors of football speeds obtained by light gates and RedFIR: speed level, mean speed based on light gates, MPE, standard deviation, LOA and maximum absolute error in %.
Speed level Mean speed (ms-1) MPE (%) Std (%) LOA (%) Max. abs. error (%)
0 7.93 0.1 2.0 [-3.8, 4.0] 4.9
2 9.75 -1.5 0.8 [-3.0,0.0] 2.9
4 15.04 -3.2 1.9 [-6.9,0.5] 6.2
6 20.17 -3.9 2.0 [-7.8,0.0] 8.1
10 22.32 -2.4 2.3 [-9.0,0.0] 7.9
Ø -2.6 2.4 [-7.4,2.2] 8.1
4. Discussion
This study was the first to consider the accuracy of ball speed estimates for a radio-based tracking system. We found a systematic bias of 2.6% which indicates that the football’s speed provided by the RedFIR system is slightly overestimating the football’s mean speed. Limits of agreement of 9.6% (1.9 ms-1) and the fact that 92% of analyses had an absolute error of less than 6% prove RedFIR’s ball speed to be accurate within 10% for velocities ranging from 7.9 ms-1 to 22.3 ms-1. The system was found to be more accurate at lower speeds (< 10 ms-1) while the error increases at higher speeds. However, this could not be found to be true for velocities between 15 ms-1 and 22.3 ms-1. For their video-based software tool for automatically measuring tennis ball speed Kelley et al. [13] reported an MPE of 4.47% (1.08ms-1) and 91% of analysis had an error less than 10% and concluded its applicability for ball speed within the tested range with an error to be expected within 10%. Hence our results demonstrate the applicability of the RedFIR ball tracking to measure ball velocities. This could be used to provide speed information about passes and shots, and together with information about the ball position makes it possible to quantitatively assess technomotorical skills of football players like ball handling, passing and shooting behavior that is fundamental for a quantitative evaluation of football players. However, the fastest shot in football was measured at 34 ms-1. Since the ball shooting machine only provided shots up to 22.3 ms-1 one would need to use a more powerful ball shooting machine to test at these high velocities. We were forced to change the light gate positions during the tests to ensure the ball to pass both light gates and to minimize the effects of rounding errors for our reference system. It would be advantageous to use light gates with a higher precision that would allow keeping the test setting constant for all velocities.

588 Thomas Seidl et al. / Procedia Engineering 147 ( 2016 ) 584 – 589
Due to the lack of a reference system for continuous dynamic ball movement the current analysis had to be restricted to compare mean velocities over a straight line without spin. In match situations the ball will change direction and speed rapidly and will be kicked with different types of spin resulting in curved trajectories. With the RedFIR system providing continuous data about the kinematics of the football 2,000 times per second, this allows a much more detailed analysis. Figure 3 shows the ball speed for one trial and the corresponding radio-based and light gates-based estimates for the mean speed of the football in more detail. Having continuous information on the ball and player positions, also long ball velocity sequences, especially consecutive passes, could easily be analyzed, even if the number of passes, directions and passing lengths are initially unknown (as it is in match settings).
Fig. 3. A more detailed look at ball speed provided by the RedFIR system: The left side shows the ball speed for one recording with the dashed vertical lines indicating the positions of the two light gates. The right side shows a zoomed in version where the ball speed between the light gates is shown that was used for the evaluation of the ball speed accuracy.
5. Conclusion
Radio-based tracking systems are promising for the future of sports science since they allow for higher update rates, high precision without being affected by environmental conditions and occlusions by players.
This was the first study to assess the accuracy of football speed estimates provided by a radio-based tracking system. We conclude that ball speed obtained by the RedFIR system installed indoors in the Test and Application Center L.I.N.K. can be used interchangeably with the ball speed measured by light gates for velocities ranging from 7.9 ms-1 to 22.3 ms-1 in applications where an error of 10% is acceptable. This information can be provided in real-time and can be used for every shot on the whole pitch with no need to set up any additional material (provided a RedFIR system is installed) in training and official matches.
In conjunction with the positional accuracy of 13 cm reported previously [15] we postulate that RedFIR provides accurate information about a football’s kinematics in real-time that can help players, coaches and the media.
Acknowledgement
This contribution was supported by the Bavarian Ministry of Economic Affairs and Media, Energy and Technology as a part of the Bavarian project 'Leistungszentrum Elektroniksysteme (LZE)'.
References
[1] Siegle, M., Stevens, T., Lames, M.: Design of an accuracy study for position detection in football. Journal of Sports Sciences 31(2), 166–172 (2013) [2] Moeslund, T., Thomas, G., Hilton, A.: Computer Vision in Sports, Advances in Computer Vision and Pattern Recognition. Springer (2015) [3] Lames, M., McGarry, T. On the search for reliable performance indicators in game sports. Int J Perform Anal Sport. 2007;7:62–79. [4] Matsuo T, Escamilla RF, Fleisig GS, Barrentine SW, Andrews JR. Comparison of kinematic and temporal parameters between different pitch velocity groups.
J Appl Biomech 2001;17(1):1-13. [5] Takahashi K, Norihisa F, Michiyoshi A. Kinematic comparisons of different pitch velocity groups in baseball using motion model method. In: Gianikellis KE,
editor. Proceedings of the XXth International Symposium on Biomechanics in Sports (ISBS 2002). Cáceres, Spain: Universidad de Extremadura; 2002. p. 203-206.
[6] Reeser JC, Fleisig GS, Bolt B, Ruan M. Upper limb biomechanics during the volleyball serve and spike. Sports Health 2010;2(5):368-374. [7] Huang C, Hu LH. Kinematic analysis of volleyball jump topspin and float serve. In: Proceedings of the 25th International Symposium on Biomechanics in
Sports (ISBS 2007). Ouro Preto, Brazil; 2007. p. 333-6. [8] Xie W, Teh KC, Qin ZF. Speed and spin of 40mm table tennis ball and the effects on elite players. In: Gianikellis KE, editor. Proceedings of the XXth
International Symposium on Biomechanics in Sports (ISBS 2002). Cáceres, Spain: Universidad de Extremadura; 2002. p. 279-282. [9] Shahbazi M, Sanders H, Coleman S. Initial ball speed and force estimation at impact in volleyball and football. In: Gianikellis KE, editor. Proceedings of the
XXth International Symposium on Biomechanics in Sports (ISBS 2002). Cáceres, Spain: Universidad de Extremadura; 2002. p. 318–321. [10] Wong PL, Chamari K, Wisloff U. Effects of 12-week onfield combined strength and power training on physical performance among U-14 young soccer
players. J Strength Cond Res 2010;24(3):644-652.

589 Thomas Seidl et al. / Procedia Engineering 147 ( 2016 ) 584 – 589
[11] Mavvidis A, Koronas K, Riaganas C, Metaxas T. Speed differences between forehand and backhand in intermediate-level tennis players. Kinesiology 2005;37(2):159-63.
[12] Debanne T, Laffaye G. Predicting the throwing velocity of the ball in handball with anthropometric variables and isotonic tests. J Sports Sci 2011;29(7):705-713.
[13] Kelley J, Choppin, SB, Goodwill SR, Haake SJ. Validation of a live, automatic ball velocity and spin rate finder in tennis. Procedia Engineering 2010;2(2):2967-2972.
[14] Bowen M. Speed estimation using computer vision (abstract only). In: Proceedings of the 46th ACM Technical Symposium on Computer Science Education (SIGCSE '15). New York, NY, USA: ACM; 2015. p. 714.
[15] Seidl T, Voelker M, Witt N, Poimann D, Czyz T, Franke N, Lochmann M. Evaluating the indoor football tracking accuracy of a radio-based Real-Time Locating System. In: Chung P, Soltoggio A, Dawson C, Meng Q, Pain M, editors. Proceedings of the 10th International Symposium on Computer Science in Sports (ISCSS). Advances in Intelligent Systems and Computing, 392. Springer; 2015. p. 217-224.
[16] Von der Gruen T, Franke N, Wolf D, Witt N, Eidloth A. A real-time tracking system for football match and training analysis. In: Heuberger A, Elst G, Hanke R, editors. Microelectronic Systems. Berlin: Springer; 2011. p. 199-212.
[17] Mutschler C, Ziekow H, Jerzak Z. The DEBS 2013 grand challenge. In: Proceedings of the 7th International Conference on Distributed Event-Based Systems. New York, NY, USA: ACM; 2013. p. 283-294.
[18] Eidloth A, Lehmann K, Edelhaeusser T, von der Gruen T. The test and application center for localization systems L.I.N.K. In: Proceedings of the Fifth International Conference on Indoor Positioning and Indoor Navigation (IPIN 2014). Busan, South Korea; 2014. p. 27-30.
[19] Bland JM, Altman DG. Statistical methods for assessing agreement between measurement. Biochim Clin 1987;11:399-404.
Related Documents