INTERNATIONAL JOURNAL OF RESEARCH IN AERONAUTICAL AND MECHANICAL ENGINEERING Vol.2 Issue.1, January 2014. Pgs: 41-53 Marcelo Bender Perotoni, Luiz Alberto de Andrade, Mirabel Cerqueira Rezende 41 ISSN (ONLINE): 2321-3051 INTERNATIONAL JOURNAL OF RESEARCH IN AERONAUTICAL AND MECHANICAL ENGINEERING Radar Cross Section of a stealthy aircraft using electromagnetic simulation in the X and in VHF/UHF Bands Marcelo Bender Perotoni 1 , Luiz Alberto de Andrade 2 , Mirabel Cerqueira Rezende 3 1 UFABC, [email protected] 2 Institute of Aeronautics and Space, [email protected] 3 Institute of Aeronautics and Space, [email protected] 1 Author Correspondence: Av. dos Estados 5001, Santo Andre, Brazil, CEP 09210-580, Telephone/Fax +55- 11-4996-0118, [email protected] Abstract This article analyzes the use of lower frequency radars, namely in the range of VHF and UHF, to help detect stealthy (low observable objects) aircraft. The radar equation is analyzed taken into account the frequency, in order to check its effect on the maximum distance of detection. Then, a 3D computer model of an F-22 aircraft is used to numerically evaluate its radar cross section (RCS) from 100 MHz (VHF) to 11 GHz (X-band), alongside with its published RCS value. These virtual evaluations were performed using a commercial field solver. The obtained results are then used to determine the maximum detection range for both frequencies, in order to determine the gain in the detection range that is achieved by choosing a longer wavelength. Keywords: Radar cross section; Computer simulations; Scattering Cross Sections; Military Aircraft. 1. Introduction The first known radar, used to detect wood vessels in 1922, employed the frequency of 60 MHz (Knott et al, 2004). Throughout the decades of 1950’s and 1960’s, radars usually employed VHF (30 to 300 MHz) and UHF (300 MHz to 3 GHz) frequency ranges (Kopp, 2008). Later, along the 1970’s and 1980’s they were progressively replaced by S-band units (1.5 to 3.9 GHz). Still during the Vietnam War, the North-Vietnamese troops used radars in the 100 MHz frequency range with success, in spite of their being easily jammed and interfered (Amlie, 1982) .The drive that made the use of higher frequencies possible was the mass production of power microwave components and devices (Skolnik, 2002). Onboard equipment in aircraft, for instance, should ideally be built using lightweight components and systems, so when solid state devices (using semiconductor materials such as gallium arsenide in the early 80’s) replaced vacuum tubes, the technology to

Welcome message from author
This document is posted to help you gain knowledge. Please leave a comment to let me know what you think about it! Share it to your friends and learn new things together.
Transcript
INTERNATIONAL JOURNAL OF RESEARCH IN AERONAUTICAL AND MECHANICAL ENGINEERING
Vol.2 Issue.1,
January 2014.
Pgs: 41-53
Marcelo Bender Perotoni, Luiz Alberto de Andrade, Mirabel Cerqueira Rezende 41
ISSN (ONLINE): 2321-3051
INTERNATIONAL JOURNAL OF RESEARCH IN AERONAUTICAL AND MECHANICAL ENGINEERING
Radar Cross Section of a stealthy aircraft using electromagnetic
simulation in the X and in VHF/UHF Bands
Marcelo Bender Perotoni1, Luiz Alberto de Andrade2, Mirabel Cerqueira Rezende3
1UFABC, [email protected] 2 Institute of Aeronautics and Space, [email protected]
3 Institute of Aeronautics and Space, [email protected] 1Author Correspondence: Av. dos Estados 5001, Santo Andre, Brazil, CEP 09210-580, Telephone/Fax +55-
11-4996-0118, [email protected]
Abstract
This article analyzes the use of lower frequency radars, namely in the range of VHF and UHF, to help detect stealthy (low observable objects) aircraft. The radar equation is analyzed taken into account the frequency, in order to check its effect on the maximum distance of detection. Then, a 3D computer model of an F-22 aircraft is used to numerically evaluate its radar cross section (RCS) from 100 MHz (VHF) to 11 GHz (X-band), alongside with its published RCS value. These virtual evaluations were performed using a commercial field solver. The obtained results are then used to determine the maximum detection range for both frequencies, in order to determine the gain in the detection range that is achieved by choosing a longer wavelength. Keywords: Radar cross section; Computer simulations; Scattering Cross Sections; Military Aircraft.
1. Introduction The first known radar, used to detect wood vessels in 1922, employed the frequency of 60 MHz (Knott et al, 2004). Throughout the decades of 1950’s and 1960’s, radars usually employed VHF (30 to 300 MHz) and UHF (300 MHz to 3 GHz) frequency ranges (Kopp, 2008). Later, along the 1970’s and 1980’s they were progressively replaced by S-band units (1.5 to 3.9 GHz). Still during the Vietnam War, the North-Vietnamese troops used radars in the 100 MHz frequency range with success, in spite of their being easily jammed and interfered (Amlie, 1982) .The drive that made the use of higher frequencies possible was the mass production of power microwave components and devices (Skolnik, 2002). Onboard equipment in aircraft, for instance, should ideally be built using lightweight components and systems, so when solid state devices (using semiconductor materials such as gallium arsenide in the early 80’s) replaced vacuum tubes, the technology to
INTERNATIONAL JOURNAL OF RESEARCH IN AERONAUTICAL AND MECHANICAL ENGINEERING
Vol.2 Issue.1,
January 2014.
Pgs: 35-40
Marcelo Bender Perotoni, Luiz Alberto de Andrade, Mirabel Cerqueira Rezende 42
achieve the use of higher frequencies was set. It is interesting to stress that for radars not only the power has a pivotal rule, but also stable frequency sources (Knott et al, 2004).
From the target point of view, the survivability of a plane depends on how long it flies incognito into the enemy radar screens (Grant, 2010). From the radar equation it is possible to see that the RCS of a target needs to fall 16 times in order to halve the minimum detectable distance. The search for stealth vehicles has becoming one of the main issues in the defense arena nowadays, given the benefits it brings in the battlefield. Much of the research in this area is left undisclosed and not published, therefore restricted. US, European Union, China and Russia are designing ships, aircraft and even UAV’s (unmanned aerial vehicles) with very low visibility to the radar (Richardson, 2001). The use of these stealthy vehicles against conventional forces generates an asymmetric conflict, like the former Iraqi wars (Richardson, 2001), where the US stealthy planes (F-117) could achieve rapid and effective air superiority against Iraqi defense Forces.
Stealth designs have two basic guidelines to achieve the goal of reduced RCS – airframe shape and coating materials with Radar Absorbing Materials (RAM) (Richardson, 2001). Technically, a vehicle is considered stealth if its RCS is lower than -10 dBsm or 0.1 m2 (Grant, 2010). Airframe shaping is the primary item for achieving the RCS reduction, whereas the RAM coating is left to further bring down the aircraft RCS on specific points on the structure (Richardson, 2001), where the electrical current concentration is more intense (the so-called hot-spots). Due to resonant constraints, usually both geometric shaping and RAM are effective mainly at higher frequencies, like in the L up to the X-band (Gama and Rezende, 2010).
During the Balkans War (1999) a stealth F-117 (replaced in 2008 by the F-22) crashed in the former Yugoslavia, now Serbia (Richardson, 2001). Some reports claim that lower frequency radars helped detect the aircraft, therefore directing the anti-aircraft fire (Kopp, 2008), (Westra, 2009), whereas official North-American reports told that the crash was due to a simple mechanical failure, though pictures of the plane debris had typical holes caused by nearby surface-to-air missiles explosions (Richardson, 2001). Nevertheless, countries such as Russia and China advertise and sell lower frequency radar sets aimed to detect stealth aircraft threats (Kopp, 2008)., and VHF and UHF radars are accepted in the literature as an effective weapon to detect stealth vehicles (Fuller, 1990), (Kopp, 2008), (Kuschel, 2010), (Westra, 2009).
However, the use of low frequency radars has some intrinsic problems, due mainly to:
- More sensitive to clutter and interference from rain, TV stations, for example. Therefore the minimum signal to noise ratio tends to be larger than for the microwave range (Knott et al, 2004). Modern developments rely on heavy signal processing to overcome these issues and
- Bigger antenna structures are involved making the assembly, maneuverability, transportation and camouflage of these antennas more challenging.
On the other hand, lower frequency radars have a propagation advantage – they can propagate into shadow regions, due to the diffraction on obstacles (Kuschel, 2010).
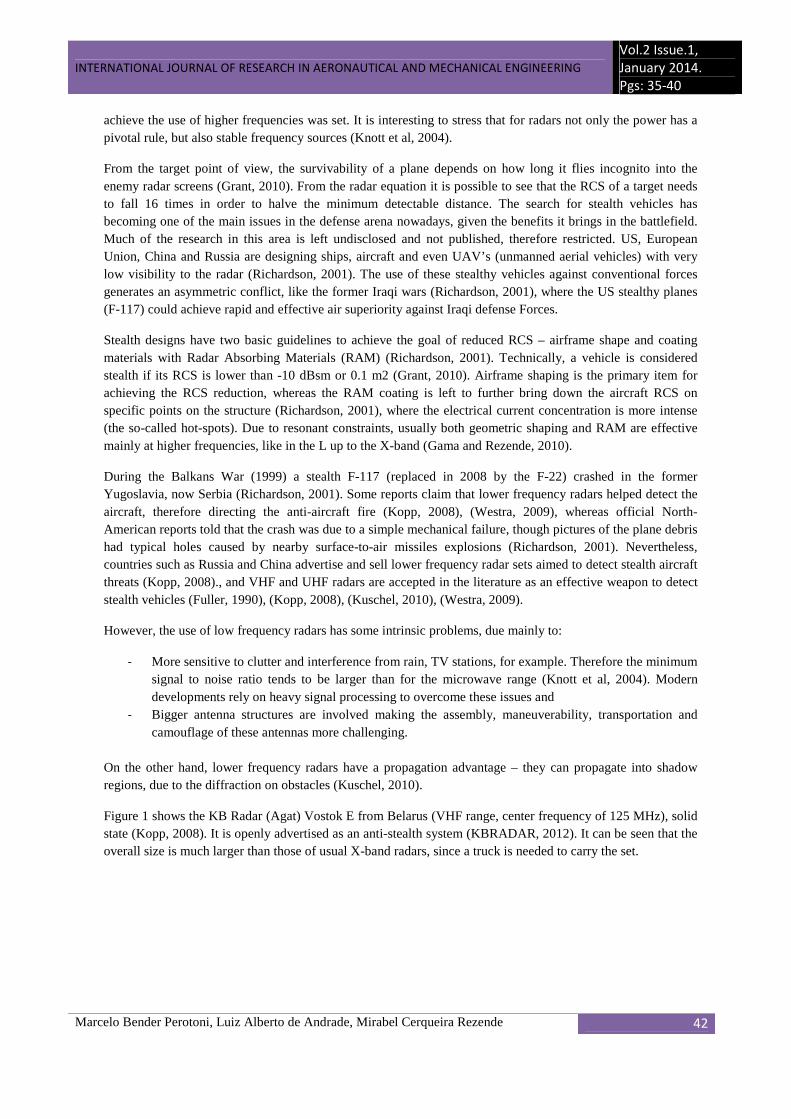
Figure 1 shows the KB Radar (Agat) Vostok E from Belarus (VHF range, center frequency of 125 MHz), solid state (Kopp, 2008). It is openly advertised as an anti-stealth system (KBRADAR, 2012). It can be seen that the overall size is much larger than those of usual X-band radars, since a truck is needed to carry the set.
INTERNATIONAL JOURNAL OF RESEARCH IN AERONAUTICAL AND MECHANICAL ENGINEERING
Vol.2 Issue.1,
January 2014.
Pgs: 35-40
Marcelo Bender Perotoni, Luiz Alberto de Andrade, Mirabel Cerqueira Rezende 43
Figure 1 - VHF Radar KB Vostok E, 125 MHz.
The reason why lower radar frequencies are allegedly more effective against stealth aircraft is due the fact that the shaped engineered parts on the vehicle structure need to be more than a wavelength long, in order to be effective in reducing the RCS. When the shaping features sizes are close to the wavelength used by the radar, a resonance occurs, with electric currents bouncing back along the structure, resulting in strong back-scattered fields. This occurs for the specific case of jet fighters, that wavelength lies on the VHF and UHF range. As for bigger structures, such as the North-American bomber B2 (52 m of wingspan), the counter-stealth based on VHF and UHF are less effective, since the resonance should occur at even lower frequencies (Fuller, 1990), (Kopp, 2008), (Kopp, 2010). Other ways currently being investigated for detecting stealth aircraft are the passive location (Fuller, 1990), (Kuschel, 2010), and also millimeter-wave radars (Westra, 2009).
The goal of this study is the RCS evaluation of a stealthy platform similar to the F-22 using electromagnetic simulation, in different frequency ranges. The impact of the frequency used by the radar on the maximum target detectable range, using a comparative analysis between the X and the VHF/UHF bands, is analyzed. Next, the monostatic RCS of a F-22 model is evaluated by numerically solving the electromagnetic scattering problem, showing the results compared to another non-stealth (conventional) jet. The RCS results are then used to evaluate the operational advantage on the use of lower frequency to help detecting a stealthy aircraft from a larger distance.
2. Frequency impact on the Radar Equation
The radar frequency impacts directly on the parameter called discrimination of a target positioned at a certain distance. From the radar equation (Knott et al, 2004):
R��� � � P�Gcσ 4π��fP�����/�
(1)
INTERNATIONAL JOURNAL OF RESEARCH IN AERONAUTICAL AND MECHANICAL ENGINEERING
Vol.2 Issue.1,
January 2014.
Pgs: 35-40
Marcelo Bender Perotoni, Luiz Alberto de Andrade, Mirabel Cerqueira Rezende 44
where
Rmax = maximum detection range [m],
Pt = transmitted power [W],
G = antenna gains (here it is supposed that both transmitter and receiver antennas have the same gains, typical for monostatic radars, where the transmitter and receiver share the same radiant system),
F = frequency [Hz],
σ = radar cross section of the target [m2],
Pmin = minimum detectable power [W], that is discriminated against the noise floor and
c = speed of light (3x10⁸ m/s).
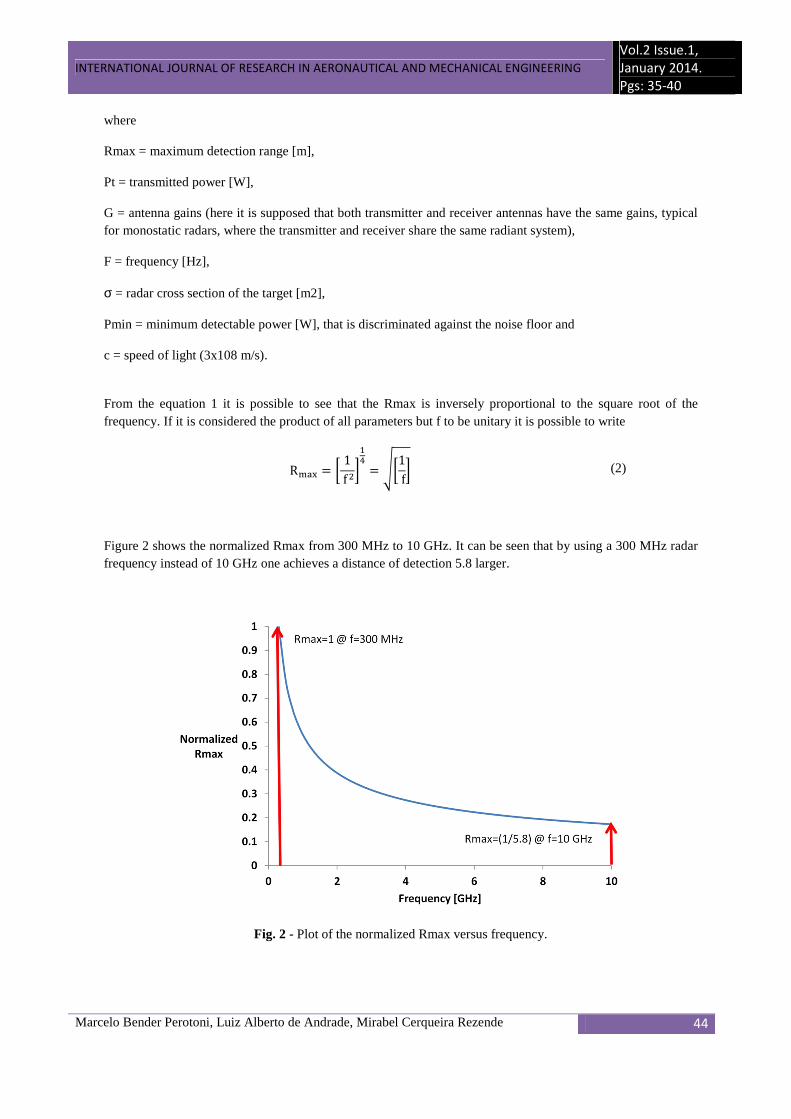
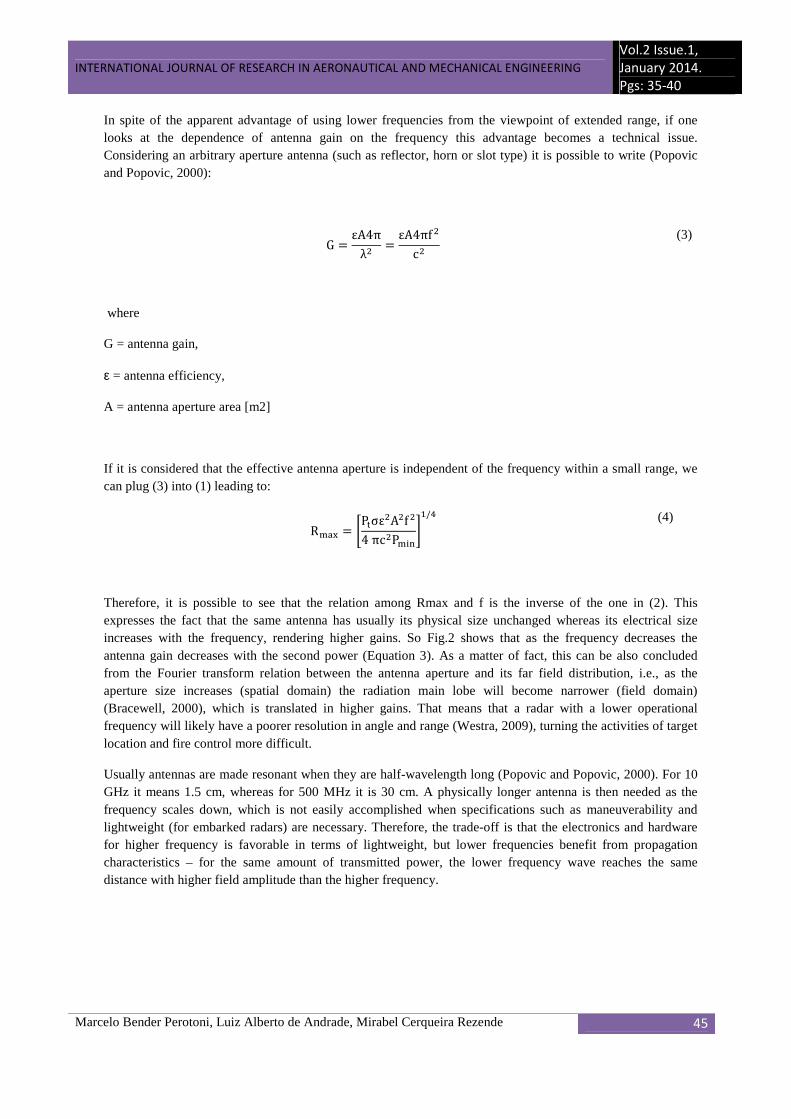
From the equation 1 it is possible to see that the Rmax is inversely proportional to the square root of the frequency. If it is considered the product of all parameters but f to be unitary it is possible to write
R��� � � 1f��� � ��1f� (2)
Figure 2 shows the normalized Rmax from 300 MHz to 10 GHz. It can be seen that by using a 300 MHz radar frequency instead of 10 GHz one achieves a distance of detection 5.8 larger.
Fig. 2 - Plot of the normalized Rmax versus frequency.
INTERNATIONAL JOURNAL OF RESEARCH IN AERONAUTICAL AND MECHANICAL ENGINEERING
Vol.2 Issue.1,
January 2014.
Pgs: 35-40
Marcelo Bender Perotoni, Luiz Alberto de Andrade, Mirabel Cerqueira Rezende 45
In spite of the apparent advantage of using lower frequencies from the viewpoint of extended range, if one looks at the dependence of antenna gain on the frequency this advantage becomes a technical issue. Considering an arbitrary aperture antenna (such as reflector, horn or slot type) it is possible to write (Popovic and Popovic, 2000):
G = εA4πλ = εA4πf
c (3)
where
G = antenna gain,
ε = antenna efficiency,
A = antenna aperture area [m2]
If it is considered that the effective antenna aperture is independent of the frequency within a small range, we can plug (3) into (1) leading to:
R��� = �P�σεAf4πcP����
�/�
(4)
Therefore, it is possible to see that the relation among Rmax and f is the inverse of the one in (2). This expresses the fact that the same antenna has usually its physical size unchanged whereas its electrical size increases with the frequency, rendering higher gains. So Fig.2 shows that as the frequency decreases the antenna gain decreases with the second power (Equation 3). As a matter of fact, this can be also concluded from the Fourier transform relation between the antenna aperture and its far field distribution, i.e., as the aperture size increases (spatial domain) the radiation main lobe will become narrower (field domain) (Bracewell, 2000), which is translated in higher gains. That means that a radar with a lower operational frequency will likely have a poorer resolution in angle and range (Westra, 2009), turning the activities of target location and fire control more difficult.
Usually antennas are made resonant when they are half-wavelength long (Popovic and Popovic, 2000). For 10 GHz it means 1.5 cm, whereas for 500 MHz it is 30 cm. A physically longer antenna is then needed as the frequency scales down, which is not easily accomplished when specifications such as maneuverability and lightweight (for embarked radars) are necessary. Therefore, the trade-off is that the electronics and hardware for higher frequency is favorable in terms of lightweight, but lower frequencies benefit from propagation characteristics – for the same amount of transmitted power, the lower frequency wave reaches the same distance with higher field amplitude than the higher frequency.

INTERNATIONAL JOURNAL OF RESEARCH IN AERONAUTICAL AND MECHANICAL ENGINEERING
Vol.2 Issue.1,
January 2014.
Pgs: 35-40
Marcelo Bender Perotoni, Luiz Alberto de Andrade, Mirabel Cerqueira Rezende 46
3. 3D Full wave RCS Simulation
In order to better evaluate the effect of lower frequency radars, it is analyzed the case of the F-22 plane, dimensions 18.92 m long, 13.56 m wing span (Richardson, 2001), shown in Figure 3, alongside with a pictorial illustration of the direction of the monostatic sweep. This plane is considered one of the most expensive projects to date in this area, with estimated development costs around USD 65 billion and a single unit costing 200 million US Dollars (Miller, 2005). From its inception it was supposed to be a stealth aircraft. Some observed guidelines to achieve this VLO (very low observable) characteristic were (Haisty, 2010):
- avoiding flat planes which present strong reflected energy towards the source;
- using cavities (turbine inlets) with a high cross-sectional aspect ratio (width to height ratio), so that if a signal enters it multiple reflections are forced inside (multiple bounces). Since for each bounce the ray loses part of its total energy, the backscattered ray that goes out of the cavity inlet has smaller amplitudes. They are shaped in a serpentine-like format (Richardson, 2001);
- high-temperature coating, to attenuate the incoming radar wave (low reflectivity paint);
- a pilot helmet presents a high potential source for RCS. The canopy is designed towards VLO characteristics, through its geometry as well as covering it with a non-reflective film similar to those encountered in temperature-efficient commercial window buildings;
- the radome has its antennas RCS signatures reduced with some non-disclosed technology, related to frequency selective surfaces (Munk, 2000);
- the electromagnetic emissions are controlled according to the tactical mission in course (Richardson, 2001), depending on the level of threat involved and
- missiles are carried inside the plane.
Figure 3 - 3D model of the F-22. The blue line shows the sweep direction (along the XY plane) where the RCS is computed.
The simulations were carried out using the CST MICROWAVE STUDIO software (CST, 2012). The Shooting-and-Bounce Ray (SBR) Method (Ling et al, 1989), implemented in the Asymptotic Solver of CST was used for the upper frequency range (above 1 GHz). This method is specifically designed for the scattering of electrically large structures. For the lower frequencies the transient solver was used. The SBR method is valid when the largest object dimension is at least 100 wavelengths long (CST, 2012). Considering the largest
INTERNATIONAL JOURNAL OF RESEARCH IN AERONAUTICAL AND MECHANICAL ENGINEERING
Vol.2 Issue.1,
January 2014.
Pgs: 35-40
Marcelo Bender Perotoni, Luiz Alberto de Andrade, Mirabel Cerqueira Rezende 47
aircraft dimension of 18 m the aforementioned rule of thumb results in 1.6 GHz as the lowest frequency for the Asymptotic solver. Therefore frequencies higher than 2 GHz are computed with the asymptotic solver whereas the transient solver handles the range from 100 MHz to 1 GHz. The frequency gap of 1 to 2 GHz was not analyzed since the computational resources demanded by the transient solver would be too large.
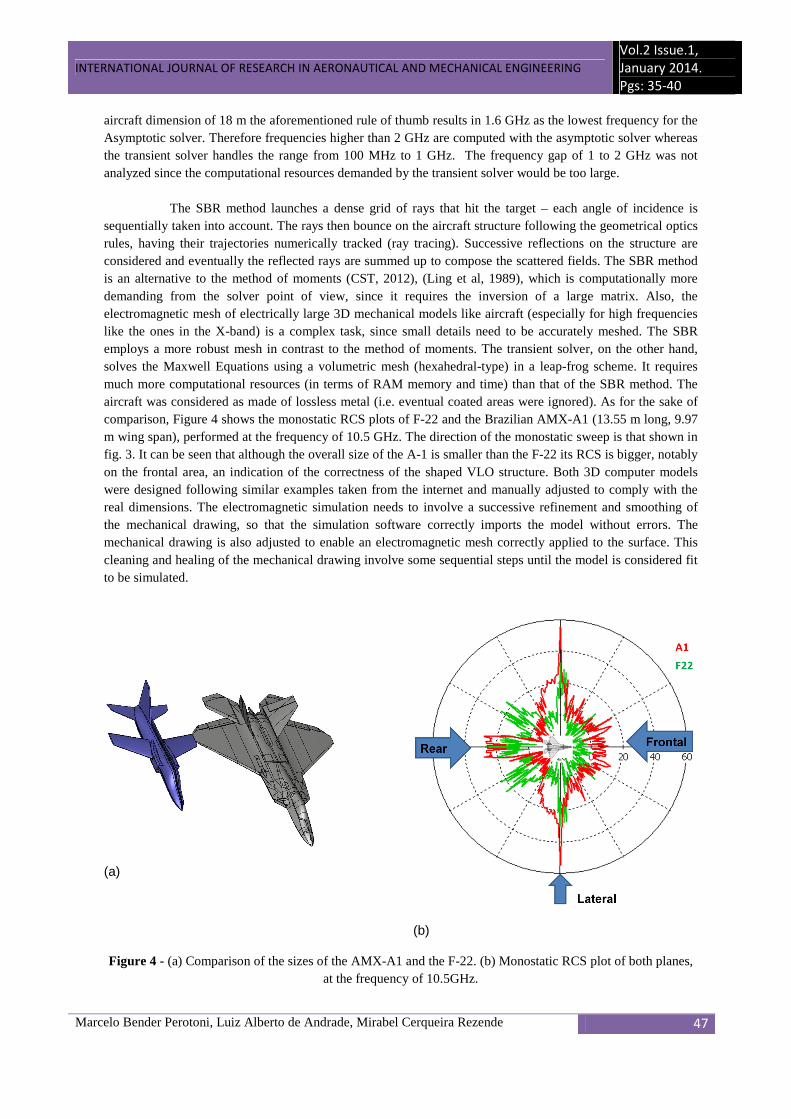
The SBR method launches a dense grid of rays that hit the target – each angle of incidence is sequentially taken into account. The rays then bounce on the aircraft structure following the geometrical optics rules, having their trajectories numerically tracked (ray tracing). Successive reflections on the structure are considered and eventually the reflected rays are summed up to compose the scattered fields. The SBR method is an alternative to the method of moments (CST, 2012), (Ling et al, 1989), which is computationally more demanding from the solver point of view, since it requires the inversion of a large matrix. Also, the electromagnetic mesh of electrically large 3D mechanical models like aircraft (especially for high frequencies like the ones in the X-band) is a complex task, since small details need to be accurately meshed. The SBR employs a more robust mesh in contrast to the method of moments. The transient solver, on the other hand, solves the Maxwell Equations using a volumetric mesh (hexahedral-type) in a leap-frog scheme. It requires much more computational resources (in terms of RAM memory and time) than that of the SBR method. The aircraft was considered as made of lossless metal (i.e. eventual coated areas were ignored). As for the sake of comparison, Figure 4 shows the monostatic RCS plots of F-22 and the Brazilian AMX-A1 (13.55 m long, 9.97 m wing span), performed at the frequency of 10.5 GHz. The direction of the monostatic sweep is that shown in fig. 3. It can be seen that although the overall size of the A-1 is smaller than the F-22 its RCS is bigger, notably on the frontal area, an indication of the correctness of the shaped VLO structure. Both 3D computer models were designed following similar examples taken from the internet and manually adjusted to comply with the real dimensions. The electromagnetic simulation needs to involve a successive refinement and smoothing of the mechanical drawing, so that the simulation software correctly imports the model without errors. The mechanical drawing is also adjusted to enable an electromagnetic mesh correctly applied to the surface. This cleaning and healing of the mechanical drawing involve some sequential steps until the model is considered fit to be simulated.
(a)
(b)
Figure 4 - (a) Comparison of the sizes of the AMX-A1 and the F-22. (b) Monostatic RCS plot of both planes, at the frequency of 10.5GHz.
INTERNATIONAL JOURNAL OF RESEARCH IN AERONAUTICAL AND MECHANICAL ENGINEERING
Vol.2 Issue.1,
January 2014.
Pgs: 35-40
Marcelo Bender Perotoni, Luiz Alberto de Andrade, Mirabel Cerqueira Rezende 48
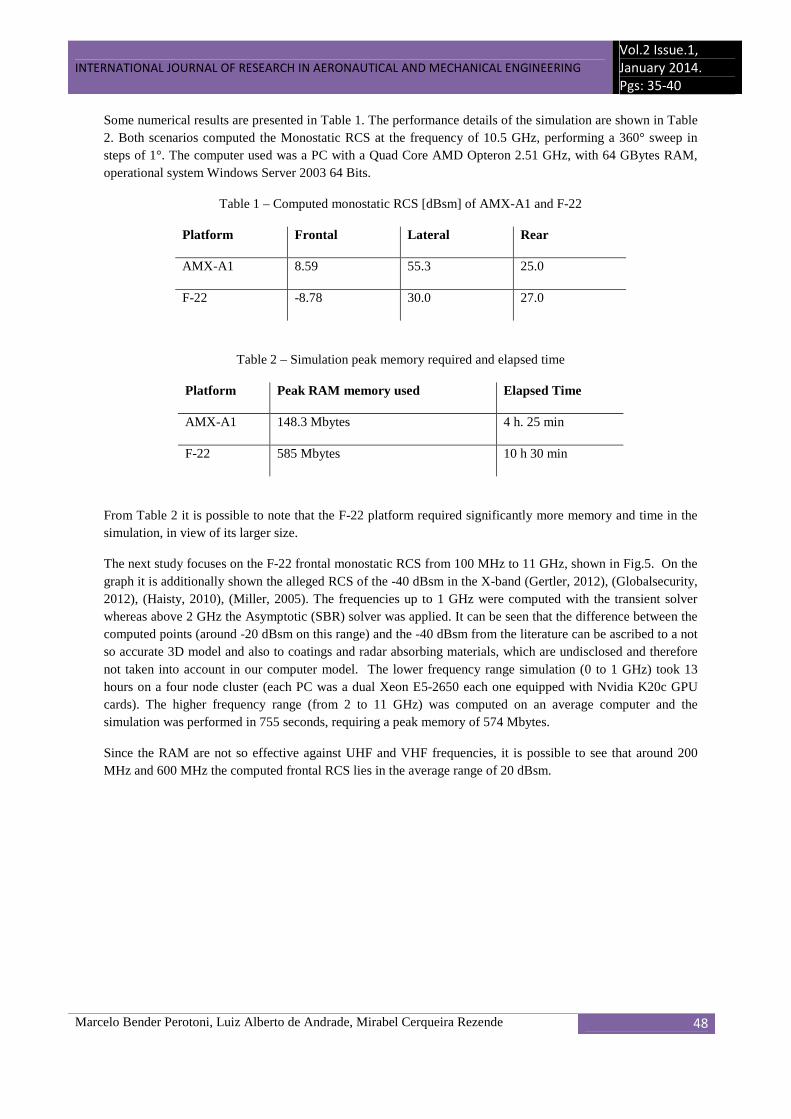
Some numerical results are presented in Table 1. The performance details of the simulation are shown in Table 2. Both scenarios computed the Monostatic RCS at the frequency of 10.5 GHz, performing a 360° sweep in steps of 1°. The computer used was a PC with a Quad Core AMD Opteron 2.51 GHz, with 64 GBytes RAM, operational system Windows Server 2003 64 Bits.
Table 1 – Computed monostatic RCS [dBsm] of AMX-A1 and F-22
Platform Frontal Lateral Rear
AMX-A1 8.59 55.3 25.0
F-22 -8.78 30.0 27.0
Table 2 – Simulation peak memory required and elapsed time
Platform Peak RAM memory used Elapsed Time
AMX-A1 148.3 Mbytes 4 h. 25 min
F-22 585 Mbytes 10 h 30 min
From Table 2 it is possible to note that the F-22 platform required significantly more memory and time in the simulation, in view of its larger size.
The next study focuses on the F-22 frontal monostatic RCS from 100 MHz to 11 GHz, shown in Fig.5. On the graph it is additionally shown the alleged RCS of the -40 dBsm in the X-band (Gertler, 2012), (Globalsecurity, 2012), (Haisty, 2010), (Miller, 2005). The frequencies up to 1 GHz were computed with the transient solver whereas above 2 GHz the Asymptotic (SBR) solver was applied. It can be seen that the difference between the computed points (around -20 dBsm on this range) and the -40 dBsm from the literature can be ascribed to a not so accurate 3D model and also to coatings and radar absorbing materials, which are undisclosed and therefore not taken into account in our computer model. The lower frequency range simulation (0 to 1 GHz) took 13 hours on a four node cluster (each PC was a dual Xeon E5-2650 each one equipped with Nvidia K20c GPU cards). The higher frequency range (from 2 to 11 GHz) was computed on an average computer and the simulation was performed in 755 seconds, requiring a peak memory of 574 Mbytes.
Since the RAM are not so effective against UHF and VHF frequencies, it is possible to see that around 200 MHz and 600 MHz the computed frontal RCS lies in the average range of 20 dBsm.

INTERNATIONAL JOURNAL OF RESEARCH IN AERONAUTICAL AND MECHANICAL ENGINEERING
Vol.2 Issue.1,
January 2014.
Pgs: 35-40
Marcelo Bender Perotoni, Luiz Alberto de Andrade, Mirabel Cerqueira Rezende 49
Figure 5 - Computed (blue line) and the literature (red line) values for the frontal F-22 monostatic RCS.
Since the transient solver uses a volumetric mesh it is possible to visualize the electric field distribution on the structure. These plots help identify the candidate areas where RAM should be applied on (so-called “hot-spots”). Fig. 6 shows the electric field distribution for the frequencies of 200 MHz and 800 MHz, for a plane wave with frontal incidence. For instance, the 800 MHz field plot shows an area of high field amplitude just close to the canopy, which at 200 MHz is not so prominent. In order to address the effect of detecting the F-22 aircraft taken as example using both VHF and X-band radars, with similar fictitious parameters, a comparison was made applying Equation 4 to the following scenarios shown in Table 3.

INTERNATIONAL JOURNAL OF RESEARCH IN AERONAUTICAL AND MECHANICAL ENGINEERING
Vol.2 Issue.1,
January 2014.
Pgs: 35-40
Marcelo Bender Perotoni, Luiz Alberto de Andrade, Mirabel Cerqueira Rezende 50
Figure 6 – Electric field plots for 200 MHz (top) and 800 MHz (bottom), for a frontal plane wave incidence.

INTERNATIONAL JOURNAL OF RESEARCH IN AERONAUTICAL AND MECHANICAL ENGINEERING
Vol.2 Issue.1,
January 2014.
Pgs: 35-40
Marcelo Bender Perotoni, Luiz Alberto de Andrade, Mirabel Cerqueira Rezende 51
Table 3 – Radar scenarios evaluated
Parameter Meaning VHF Radar X-Band Radar
Pt Transmitted peak Power 500 W 500 W
G Antenna gains 17 dB 17 dB
σ Target Radar cross section -40 dBsm 6.6 dBsm
F frequency 100 MHz 10 GHz
Pmin Minimum Detectable signal -100 dBm -100 dBm
Figure 7 shows the maximum detectable distances using both frequencies. Here it was assumed the published RCS figure of -40 dBSm for the F-22 at the X-band (Figure 5), instead of the computed using the 3D model (in order to stress the differences). From the picture it is verified that by using the VHF signal the maximum detected distance of the aircraft is 22.6 km, whereas for the X-band case it is only 151 m. Naturally, the demands for achieving a radar antenna with 17 dB of gain is much more restrictive for the VHF case than that of the microwave range, according to the considerations taken into account in the introduction section.
Figure 7 - Comparison of the maximum detected distance of an F-22 against a VHF (green line) and X-band (blue line).
In Fig. 7, the red bar fixed at -10 dBsm point (definition for a stealth vehicle) intersects the X-band radar at 0.85 km, whereas the VHF radar can detect the target at a distance of 8.68 km. That clearly illustrates the theoretical operational advantage of using lower frequency radar to help identify threats which are of stealthy type, possibly as a complement to conventional higher frequency radar systems.

INTERNATIONAL JOURNAL OF RESEARCH IN AERONAUTICAL AND MECHANICAL ENGINEERING
Vol.2 Issue.1,
January 2014.
Pgs: 35-40
Marcelo Bender Perotoni, Luiz Alberto de Andrade, Mirabel Cerqueira Rezende 52
Conclusion
By the use of electromagnetic simulation it was possible to address the monostatic RCS of a stealthy platform, using a commercial field solver software running on a conventional computer. The computed RCS was shown altogether with a non-stealthy plane, whose dimensions were smaller, and the comparison showed significant lower RCS values for the X-band. The stealthy platform was later subjected to a frequency sweep where it was seen that for the VHF and UHF band the overall RCS was higher, therefore enabling the detection at much larger distances. The results confirm that the VHF/UHF radars can potentially help detect stealthy aircraft with success.
References Amlie T.S., 1982, “Military: Radar: Shield or target? Costly radar being developed by the U.S. may give an opponent a decisive advantage by broadcasting the position and makeup of forces”, IEEE Spectrum, vol. 19, pp.61-65. doi: 10.1109/MSPEC.1982.6366859 Bracewell R.B., 2000, “The Fourier Transform and its applications”, ed. McGraw-Hill, 616p. CST 2012, “CST MICROWAVE STUDIO” retrieved in Aug, 20th 2012 from www.cst.com. Fuller K.L., 1990, “To see and not be seen”, IEE Proceedings F Radar and Signal Processing, vol. 137, pp.1-9. Gama A.M., Rezende M.C., 2010, “Complex permeability and permittivity variation of carbonyl iron rubber in the frequency range of 2 to 18 GHz”, Journal of Aerospace Technology and Management, V.2, Nr.1, pp.59-62. doi: 10.5028/jatm.2010.02015962 Gertler G., 2012, “Air Force F-22 Fighter Program: Background and Issues for Congress”, retrieved in Aug, 20th 2012 from http://www.au.af.mil/au/awc/awcgate/crs/rl31673.pdf. GlobalSecurity, 2012, “Radar Cross Section (RCS)”, retrieved in Aug, 20th 2012 from http://www.globalsecurity.org/military/world/stealth-aircraft-rcs.htm. Grant R., 2010, “The radar game Understanding Stealth and aircraft survivability”, Mitchell Institute Press, 59p. Haisty B.S.,2012 , “Affordable Stealth”, retrieved in Aug, 20th 2012 from http://www.f22fighter.com/AffordableStealth.pdf. KBRADAR, 2012, retrieved in Aug, 20th 2012 from http://www.kbradar.by/text/pages-print-37.html. Knott et al, 2004, “Radar cross section”, 2nd edition, Scitech Publishing, Raleigh, N.C., 637p. Kopp C, 2008, “Russian VHF counter stealth radars proliferate”, Defence Today, Vol.7.No.3, pp. 32-36. Kopp, C., 2010, “Evolving technological strategy in advanced air defense systems”, Joint Force Quarterly [P], vol 57, National Defense University Press, Washington DC USA, pp. 86-93.
INTERNATIONAL JOURNAL OF RESEARCH IN AERONAUTICAL AND MECHANICAL ENGINEERING
Vol.2 Issue.1,
January 2014.
Pgs: 35-40
Marcelo Bender Perotoni, Luiz Alberto de Andrade, Mirabel Cerqueira Rezende 53
Kuschel H., 2010, “Countering Stealth with Passive, Multi-static, Low Frequency Radars”, IEEE Aerospace and Electronics Systems Magazine, Vol. 25, pp. 11-17. doi: 10.1109/MAES.2010.5592986 Ling H. et al, 1989, “Shooting and Bouncing Rays: Calculating the RCS of an Arbitrarily Shaped Cavity”, IEEE Transactions on Antennas and Propagation, vol.37, pp. 194-205. doi: 10.1109/8.18706. Miller J., 2005, “Lockheed Martin F/A-22 Raptor Stealth Fighter”, Midland Publishing, 127p. Munk B., 2000, “Frequency Selective Surfaces”, ed. John Wiley and Sons, 410p. Popovic Z., Popovic B.D., 2000, “Introductory Electromagnetics”, ed. Prentice Hall, 556p. Richardson D., 2001, “Stealth Airplanes”, MBI Publishing Company, 188p. Skolnik M., 2002, “The role of Radar in Microwaves”, IEEE Transactions on Microwave Theory and Techniques, Vol. 50, pp. 625-632. doi: 10.1109/22.989947 Westra A.G., 2009, “Radar versus Stealth: Passive Radar and the Future of U.S. Military Power, Joint Force Quarterly [P]”, vol 55, National Defense University Press, Washington DC USA, pp. 136-143.
Related Documents