Make More Sense of Your Environmental Data with the Branch of Quality System’s Blind-Sample Products IBSP & OBSP

Question You see a trend or pattern in your environmental data that you didn’t expect. How might you explain this? 2.
Dec 24, 2015
Welcome message from author
This document is posted to help you gain knowledge. Please leave a comment to let me know what you think about it! Share it to your friends and learn new things together.
Transcript

Make More Sense of Your Environmental Data with the
Branch of Quality System’s Blind-Sample Products
IBSP & OBSP

2
Question
You see a trend or pattern in your environmental data that you didn’t
expect.
How might you explain this?
-1
0
1
2
3
4
5

3
Blind Samples
What is a “Blind” sample?• A blind sample is a quality-control sample whose
composition and origin is unknown except to those who are submitting the sample.
• It is disguised to appear like a regular environmental sample to the laboratory.
• Its purpose is to allow a realistic and uncensored measure of bias and variability of the entire laboratory process.

4
Blind Samples
How do blind-samples results help data-users assess their environmental sample results
from the NWQL?
• Blind samples are treated the same as environmental samples and are designed to capture the same sources of variability as environmental samples Inorganic-from login through NWIS Organic-from login through StarLIMS
• Blind samples and on-line QC samples are different

5
Blind Samples
How do blind-samples results help data-users assess their environmental sample results
from the NWQL?
• User accessible data sets Blind-sample results are retrieved, posted, and
available to the data-user• Inorganic – Within 1-3 days of release from the NWQL• Organic – Data reviewed when available.

6
Current products that help aid in data interpretation
• Time-series charts/box plots To observe bias and variability over time
• Recovery versus concentration charts To assess recovery and variability at
different concentration ranges• Blind-blank/false positive/false negative
charts To observe blank contamination and
assess reporting levels

7
Current products that help aid in data interpretation
• Raw data
• Custom data packets
• Data-quality assessment reports

8
Time-series charts: IBSP

9
Question
You see a trend or pattern in your environmental data that you didn’t
expect.
How might you explain this?
-1
0
1
2
3
4
5

10
Time-series charts: IBSP

11
Time-series charts: IBSP

12
Time-series charts: OBSP

13
Time-series charts: OBSP

14
Box Plots: OBSPBQS ORGANIC BLIND SAMPLES
DETERMINATION: CYANAZINE, SCHEDULE: 2033 TESTIDCODE: 04041GCM35 , MEASURED IN MICROGRAMS PER LITER
04/03/08 TO 12/22/11 Open Data Set

15
Recovery vs. Concentration: OBSP

16
Question
You’re seeing unexpected results in your blank/low-level environmental
sample data.
How can you sort out these issues?

17
Blind-blank charts: IBSP
ICPMS, Nickel, Water, Filtered, collision
Test ID: 01065PLM10, Labcode: 3130
Open DataSet

18
Blind-blank charts: IBSP
ICPMS, Aluminum, Water, Filtered
Test ID: 01106PLM43, Labcode: 1784
Open DataSet

19
False positive charts: OBSP

20
False positive charts: OBSP
Lab ID Spike Mix Reporting Level Analysis Date Result Conc.
20092960005 Crescent 08LL076: 80 µl 0.2 12/04/09 1.130
20093100005 Accu 209081217: 20 µl 0.2 12/18/09 0.070
20093380010 Crescent 08LL076: 20 µl 0.2 02/09/10 0.300
20093450031 Restek A070024: 40 µl 0.2 02/11/10 0.050
20101270037 Restek A070024: 80 µl 0.2 07/20/10 0.020
20101410010 Crescent 08LL076: 40 µl 0.2 08/18/10 0.590
20102390261 Crescent 08LL076: 40 µl 0.2 09/29/10 0.660
False Positives Listing for DIETHYL PHTHALATE

21
False positive charts: OBSP
False Positives Listing for 3-Chloropropene
Lab ID Spike Mix Reporting Level
Analysis Date
Result Conc.
20103020157 Accu 210061400: 40 µl 0.08 11/02/10 0.198
20110070107 Accu 210061400: 20 µl 0.08 01/08/11 0.101
20110490036 Accu 210061400: 20 µl 0.08 02/19/11 0.140
20110690081 Accu 210061400: 40 µl 0.08 03/17/11 0.261
20111170106 Accu 210061400: 20 µl 0.08 04/29/11 0.162
20111540001 Accu 210061400: 40 µl 0.08 06/05/11 0.187
20112030060 Accu 210061400: 20 µl 0.08 07/23/11 0.134
20113010043 Accu 210061400: 20 µl 0.08 11/03/11 0.104
20113500023 Accu 210061400: 40 µl 0.08 12/17/11 0.110

22
Question
You expected to see a certain compound
in your sample and instead youreceived a < (less than) as your result.
Are the concentrations in your samples too low to be quantified?

23
False negative charts: OBSP

24
False negative charts: OBSP
Lab ID Spike Mix Reporting Level Analysis Date Result Conc.
20101340151 Accu 209081166: 80 µl 0.1 06/10/10 0.062
20111960035 Crescent 163162: 100 µl 0.1 07/18/11 0.087
False Positives Listing for CHLORAMBEN, METHYL ESTER
Lab ID Spike Mix Reporting Level Analysis Date Expected Conc.
20100920050 Restek A069890: 40 µl 0.1 04/14/10 0.1880564
20101270033 Spex Organics T1090828008: 40 µl
0.1 05/26/10 0.1907467
20101550008 Restek A069890: 80 µl 0.1 06/16/10 0.3845367
20101760005 Restek A069890: 40 µl 0.1 07/14/10 0.1879248
20103430088 ChemService 448-45B: 40 µl 0.1 01/04/11 0.1450068
20110130055 Abs 090910HPLC: 40 µl 0.1 02/02/11 0.1506629
20110410063 Abs 090910HPLC: 40 µl 0.1 02/25/11 0.1494322
20110490034 ChemService 448-45B: 40 µl 0.1 03/07/11 0.1443439
20110770004 Abs 090910HPLC: 40 µl 0.1 04/12/11 0.1490757
20111590002 ChemService 448-45B: 100 µl 0.1 06/28/11 0.3669634
False Negatives Listing for CHLORAMBEN, METHYL ESTER

25
Question
You think quality-control charts are OK,but you would really just like to have
the data to work with it yourself.
How can you easily obtain a subset of the QC data in a user-friendly format?

26
Raw data: IBSP/OBSP
ICPMS, Nickel, Water, Filtered, collision
Test ID: 01065PLM10, Labcode: 3130
Open DataSet

27
Raw data: IBSP/OBSP
ICPMS, Nickel, Water, Filtered, collision
Test ID: 01065PLM10, Labcode: 3130
Open DataSet

28
Raw data: IBSP/OBSP

29
Branch of Quality Systemsbqs.usgs.gov
•Inorganic blind-sample project Ted Struzeski
•Organic blind-sample project Suranne Stineman

30
Question
The website can be overwhelming with so many QC charts for so many parameters.
Can you just have a summary of suspecteddata-quality issues?
31
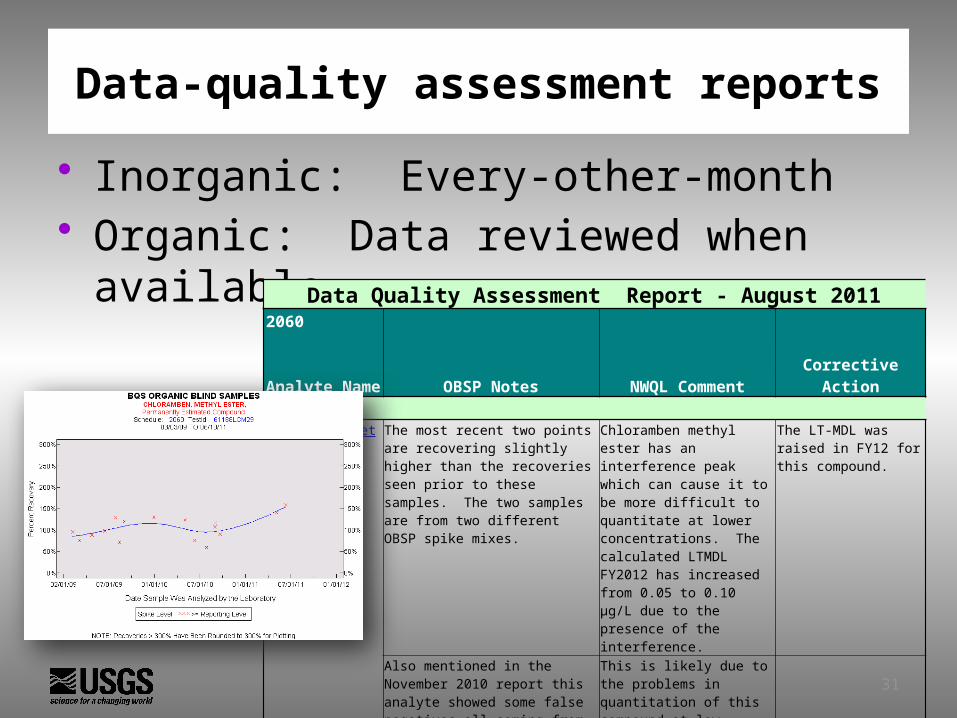
Data-quality assessment reports
• Inorganic: Every-other-month• Organic: Data reviewed when
available Data Quality Assessment Report - August 20112060
Analyte Name OBSP Notes NWQL Comment Corrective Action
Chloramben methyl ester
The most recent two points are recovering slightly higher than the recoveries seen prior to these samples. The two samples are from two different OBSP spike mixes.
Chloramben methyl ester has an interference peak which can cause it to be more difficult to quantitate at lower concentrations. The calculated LTMDL FY2012 has increased from 0.05 to 0.10 µg/L due to the presence of the interference.
The LT-MDL was raised in FY12 for this compound.
Also mentioned in the November 2010 report this analyte showed some false negatives all coming from one vendor. Since then, there have been multiple false negatives from 3 more different vendors.
This is likely due to the problems in quantitation of this compound at low levels due to the presence of the interference.

32
Data-quality assessment reports

33
Moving Forward…Inorganic Blind Sample Project
• Method-to-method charts To assess data-quality between methods
• Method A versus method B• Filtered versus unfiltered• Old method versus new method
• Concentration-dependent charts To assess concentration-dependent bias and
variability• Percent RSD charts
To assess variability at a given concentration To characterize overall method variability

34
Inorganic Blind Sample Project
• Potential Future Products Analyte by different methods: ICP versus DA
08/10/10 11/08/10 02/06/11 05/07/11 08/05/11 11/03/11 02/01/12 05/01/1280
85
90
95
100
105
110
115
120 Silica, filtered .
ICP vs. DA% Recov-DA% Recov-ICP
Date
Pe
rcen
t R
ecovery

35
Inorganic Blind Sample Project
• Potential Future Products Analyte in different phases: filtered versus unfiltered –
Example 1
8/17/03 8/17/04 8/17/05 8/17/06 8/17/07 8/17/08 8/17/09 8/17/10 8/17/1140
60
80
100
120
140
160
Lead, ICP-MS Filtered vs. Unfiltered .
% Recov-FIL
% Recov-UnF
Date
Pe
rce
nt
Re
co
ve
ry

36
Inorganic Blind Sample Project
• Potential Future Products Analyte in different phases: filtered versus unfiltered –
Example 2
12/29/04 12/30/05 12/30/06 12/30/07 12/29/08 12/30/09 12/30/10 12/30/1140
60
80
100
120
140
160
Zinc, cICP-MS Filtered vs. Unfiltered .
% Recov-FIL% Recov-UnF
Date
Pe
rce
nt
Re
co
ve
ry

37
Inorganic Blind Sample Project
• Potential Future Products Analyte by different methods: old method versus new method
7/13/02 7/14/03 7/13/04 7/13/05 7/13/06 7/14/07 7/13/08 7/13/09 7/13/10 7/14/11-6
-4
-2
0
2
4
6
Zinc, Filtered, ICP-MS ICP-MS vs. cICP-MS .
nsd for cICP-MS
nsd for ICP-MS
Date
Nu
mb
er
of
F-P
se
ud
osig
ma
s f
rom
th
e T
arg
et
Va
lue

38
Inorganic Blind Sample Project
• Potential Future Products Concentration-dependent recovery charts
0 1 2 3 4 5 6 7 840
60
80
100
120
140
160
Selenium, Unfiltered -- ICP-MS
Concentration, ug/L
Pe
rce
nt
Re
co
ve
ry

39
Inorganic Blind Sample Project
• Potential Future Products % Relative Standard Deviation chart

Math!
%RSD = (SD/mean)*100
SD = %RSD(mean)/100
Let %RSD = 3 and concentration = 20 mg/L
SD = 3(20)/100
SD = 0.6
40

41
• Analyte in multiple methods• To assess data-quality performance across multiple methods• Old method versus new method
• Chart of expected and reported concentration versus time• To assess concentration-dependent bias over time
• Annual false positive and false negative summaries• To assess potential contamination issues or interferences• To assess confidence in low-concentration results
• Plot some “user defined limits” on the various charts• To assess how blind-sample results compare to these limits
Moving Forward…
Organic Blind Sample Projects

42
Got Caffeine…

43
• Potential Future Products Analyte by several different methods
Organic Blind Sample Project

44
• Potential Future Products Analyte by several different methods
Organic Blind Sample Project

45
Organic Blind Sample Project
• Potential Future Products Expected and reported concentration versus time

46
April 08, 2010 to Jan 19, 2012LS 1383 TestID CAS# # spiked
False negative
# not spiked
False positives
Acenaphthylene34200GCM57
208-96-821 0 27 0
Acenaphthene34205GCM57
83-32-921 0 27 0
Anthracene34220GCM57
120-12-721 0 27 2
Benzo[b]fluoranthene34230GCM57
205-99-221 0 27 0
Benzo[k]fluoranthene34242GCM57
207-08-921 0 27 0
Benzo[a]pyrene34247GCM57
50-32-821 0 27 1
bis(2-Chloroethyl)ether34273GCM57
111-44-421 0 27 0
bis(2-Chloroethoxy)methane
34278GCM57
111-91-121 0 27 0
bis(2-chloroisopropyl) ether
34283GCM57
108-60-121 0 27 0
Butylbenzyl phthalate34292GCM57
85-68-721 0 27 2
Chrysene34320GCM57
218-01-921 0 27 0
Diethyl phthalate34336GCM57
84-66-221 0 27 0
Dimethyl phthalate34341GCM57
131-11-321 1 27 3
Organic Blind Sample Project
• Potential Future Products False positives and false negatives summary table

47------- = Recovery range (50% to 150%)
Organic Blind Sample Project
• Potential Future Products User defined limits on an existing time series chart

48
Moving Forward…Inorganic & Organic Blind Sample Projects
• Modification to format of existing data-quality assessment reports
• Look into NWIS toolbox for IBSP and OBSP data analysis
• QA upcoming organic tissue and sediment methods
• Use more different types of matrices for the inorganic blind samples
• Provide information about the matrix for the inorganic blind samples

49
Moving Forward…Inorganic & Organic Blind Sample Projects
• Requesting input from the data users
What do you want to see?
What would be useful to you?

50
Branch of Quality Systemsbqs.usgs.gov
• Inorganic blind-sample project Ted Struzeski bqs.usgs.gov/ibsp/ [email protected] 303.236.1872
• Organic blind-sample project Suranne Stineman bqs.usgs.gov/obsp/ [email protected] 303.236.1821
Related Documents