Research Article Quantum Chemical and Spectroscopic Investigations of (Ethyl 4 hydroxy-3-((E)-(pyren-1-ylimino)methyl)benzoate) by DFT Method Diwaker and Abhishek Kumar Gupta School of Basic Sciences, Indian Institute of Technology Mandi, Mandi, Himachal Pradesh-175001, India Correspondence should be addressed to Diwaker; [email protected] Received 17 February 2014; Revised 2 April 2014; Accepted 5 April 2014; Published 9 July 2014 Academic Editor: Hakan Arslan Copyright © 2014 Diwaker and A. K. Gupta. is is an open access article distributed under the Creative Commons Attribution License, which permits unrestricted use, distribution, and reproduction in any medium, provided the original work is properly cited. In the present work we have reported the optimized ground state geometry, harmonic vibrational frequencies, NMR chemical shiſts, NBO analysis, and molecular electrostatic potential surface map of the title compound using DFT/B3LYP/6-311++G(2d, 2p) level of theory. We have compared our calculated results with the experimentally obtained values and found that both are in close agreement with each other. We have used the gauge-invariant atomic orbital (GIAO) approach to calculate the NMR ( 13 C and 1 H) chemical shiſts using Gaussian 09 package. TD-DFT (time-dependent DFT) approach has been used to simulate the electronic spectra of the title compound in order to account for excited states. Other molecular properties such as HOMO-LUMO energies, NBO analysis, and PED distribution analysis have been studied and reported using DFT/B3LYP/6-311++G(2d, 2p) level of theory. 1. Introduction e title compound chosen for DFT studies to extract dif- ferent molecular properties has been experimentally synthe- sized and prepared using 1 amino pyrene and (ethyl 3-formyl- 4-hydroxybenzoate) at room temperature for six hours in the presence of dry MeOH [1]. e title compound shows sensing properties for selective detection of niobium ions in mixed aqueous media. In the literature survey we found that there are lot of research articles based upon fluorescent techniques for detection of various metal ions, however literature survey also reveals very few ab initio HF/MP2/DFT calculations of such type of compounds. Fluorescence is a very simple technique and acts as a convenient characterization tool for detection of very small amount (in ppm) of various metal ions in solutions [2]. From application point of view niobium metal is used in various kinds of applications such as superconducting magnets [3] and biological applications [4]. In interest of such applications the quantum mechanical cal- culations of the title compound are thoroughly investigated. e aim of this work is to predict the structural, electronic, vibrational, and spectral parameters and other molecular properties of the title compound using DFT approach [5–9]. 2. Experimental Details In this section we have reported short details about the methodology and characterization tools used for the title compound, however we advised the readers to consult [1] for more details. e chemical structure and fluorescent properties of the title compound are confirmed by single crystal X-ray diffraction, UV spectra, 1 H and 13 C NMR, and FTIR spectra. 1 H and 13 C NMR are recorded in chloroform using TMS as internal standard on a Varian Mercury 300 spectrometer operating at 300 MHz for 1 H and 75 MHz for 13 C. IR spectra are recorded on a Perkin-Elmer PE- 983 infrared spectrometer as KBr pellets with absorption reported in cm −1 . e ultraviolet absorption spectra were recorded on Shimadzu UV-2450 spectrophotometer. Fluo- rescent spectra measurements were performed on Agilent Technologies Cary Eclipse fluorescence spectrometer. Hindawi Publishing Corporation International Journal of Spectroscopy Volume 2014, Article ID 841593, 15 pages http://dx.doi.org/10.1155/2014/841593

Welcome message from author
This document is posted to help you gain knowledge. Please leave a comment to let me know what you think about it! Share it to your friends and learn new things together.
Transcript
Research ArticleQuantum Chemical and Spectroscopic Investigations of(Ethyl 4 hydroxy-3-((E)-(pyren-1-ylimino)methyl)benzoate)by DFT Method
Diwaker and Abhishek Kumar Gupta
School of Basic Sciences, Indian Institute of Technology Mandi, Mandi, Himachal Pradesh-175001, India
Correspondence should be addressed to Diwaker; [email protected]
Received 17 February 2014; Revised 2 April 2014; Accepted 5 April 2014; Published 9 July 2014
Academic Editor: Hakan Arslan
Copyright © 2014 Diwaker and A. K. Gupta. This is an open access article distributed under the Creative Commons AttributionLicense, which permits unrestricted use, distribution, and reproduction in any medium, provided the original work is properlycited.
In the present work we have reported the optimized ground state geometry, harmonic vibrational frequencies, NMR chemicalshifts, NBO analysis, and molecular electrostatic potential surface map of the title compound using DFT/B3LYP/6-311++G(2d, 2p)level of theory. We have compared our calculated results with the experimentally obtained values and found that both are in closeagreement with each other. We have used the gauge-invariant atomic orbital (GIAO) approach to calculate the NMR (13C and 1H)chemical shifts using Gaussian 09 package. TD-DFT (time-dependent DFT) approach has been used to simulate the electronicspectra of the title compound in order to account for excited states. Other molecular properties such as HOMO-LUMO energies,NBO analysis, and PED distribution analysis have been studied and reported using DFT/B3LYP/6-311++G(2d, 2p) level of theory.
1. Introduction
The title compound chosen for DFT studies to extract dif-ferent molecular properties has been experimentally synthe-sized and prepared using 1 amino pyrene and (ethyl 3-formyl-4-hydroxybenzoate) at room temperature for six hours in thepresence of dryMeOH [1].The title compound shows sensingproperties for selective detection of niobium ions in mixedaqueous media. In the literature survey we found that thereare lot of research articles based upon fluorescent techniquesfor detection of various metal ions, however literature surveyalso reveals very few ab initio HF/MP2/DFT calculationsof such type of compounds. Fluorescence is a very simpletechnique and acts as a convenient characterization toolfor detection of very small amount (in ppm) of variousmetal ions in solutions [2]. From application point of viewniobiummetal is used in various kinds of applications such assuperconducting magnets [3] and biological applications [4].In interest of such applications the quantum mechanical cal-culations of the title compound are thoroughly investigated.The aim of this work is to predict the structural, electronic,
vibrational, and spectral parameters and other molecularproperties of the title compound using DFT approach [5–9].
2. Experimental Details
In this section we have reported short details about themethodology and characterization tools used for the titlecompound, however we advised the readers to consult [1]for more details. The chemical structure and fluorescentproperties of the title compound are confirmed by singlecrystal X-ray diffraction, UV spectra, 1H and 13C NMR, andFTIR spectra. 1H and 13CNMR are recorded in chloroformusing TMS as internal standard on a Varian Mercury 300spectrometer operating at 300MHz for 1H and 75MHzfor 13C. IR spectra are recorded on a Perkin-Elmer PE-983 infrared spectrometer as KBr pellets with absorptionreported in cm−1. The ultraviolet absorption spectra wererecorded on Shimadzu UV-2450 spectrophotometer. Fluo-rescent spectra measurements were performed on AgilentTechnologies Cary Eclipse fluorescence spectrometer.
Hindawi Publishing CorporationInternational Journal of SpectroscopyVolume 2014, Article ID 841593, 15 pageshttp://dx.doi.org/10.1155/2014/841593
2 International Journal of Spectroscopy
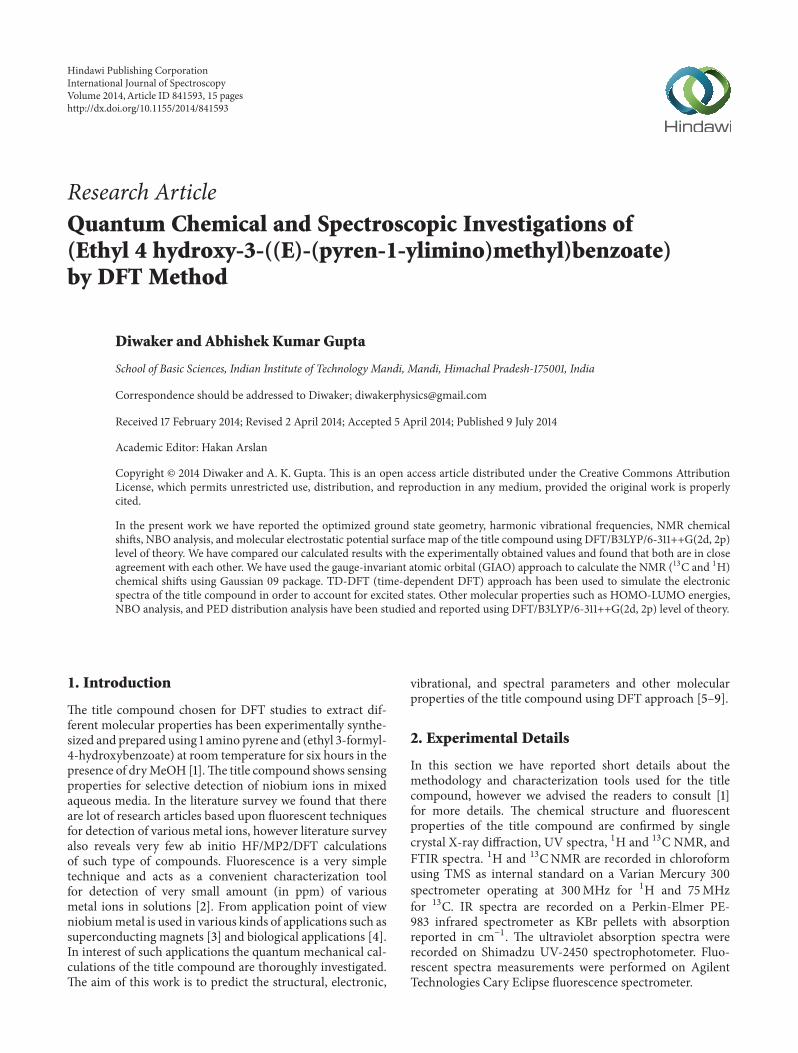
Figure 1: Structure of new Schiff base ((ethyl 4 hydroxy-3-((E)-(pyren-1-ylimino)methyl)benzoate) using hyperchem.
3. Computational Details
Using DFT/B3LYP/6-311++G(2d, 2p) level of theory [10] wehave investigated the ground state optimized geometry ofthe title compound. The molecular geometry is fully opti-mized using tight convergence criteria along with redundantinternal coordinates and Berny’s optimization algorithm.Theoptimized parameters obtained using DFT approach havebeen compared with the experimental values and are in closeagreement with them. Further we have used the optimizedground state geometry of the title compound to study thedifferent properties like NMR spectra, UV-Vis spectra, MEPsurface mapping, PED analysis, and NBO analysis. UsingDFT/B3LYP/6-311++G(2d, 2p) level of theory and GAIO(Gauge-Invariant Atomic Orbital) [11, 12] approach we havereported the NMR (13C and 1H) chemical shifts of thetitle compound and compared them with their experimentalcounterparts. To study the electronic transitions and excitedstates we have used the TD-DFT (time-dependent) methodavailable in Gaussian 09 package. HOMO-LUMO energiesare also calculated at DFT/B3LYP/6-311++G(2d, 2p) levelof theory. Vibrational wavenumbers assignment is done byusingVEDA4program.MEP surfacemapping is investigatedto comment upon the reactive nature of the title compound.In order to find out the various interactions between thefilled and the vacant orbitals, NBO analysis [13] of the titlecompound has been done usingNBO3.1 program available inGaussian 09 package atDFT/6-311++G(2d, 2p) level of theory.Theunoptimized structure of our title compound is presentedin Figure 1.
4. Results and Discussion
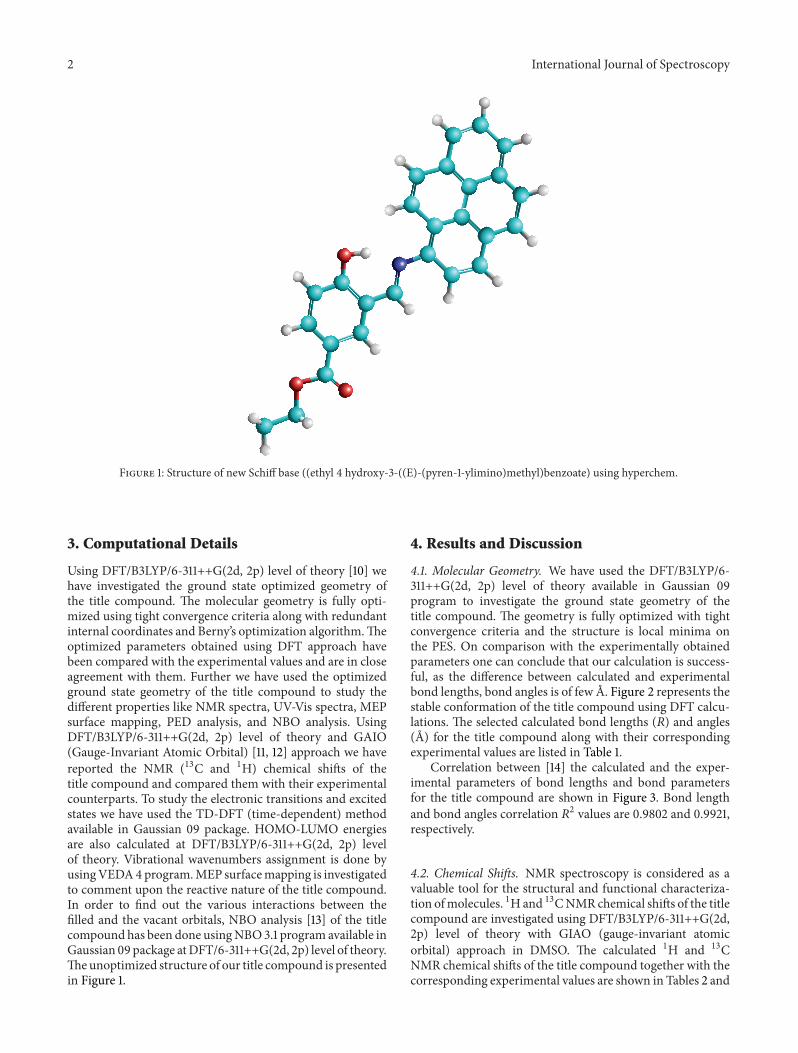
4.1. Molecular Geometry. We have used the DFT/B3LYP/6-311++G(2d, 2p) level of theory available in Gaussian 09program to investigate the ground state geometry of thetitle compound. The geometry is fully optimized with tightconvergence criteria and the structure is local minima onthe PES. On comparison with the experimentally obtainedparameters one can conclude that our calculation is success-ful, as the difference between calculated and experimentalbond lengths, bond angles is of few A. Figure 2 represents thestable conformation of the title compound using DFT calcu-lations. The selected calculated bond lengths (𝑅) and angles(A) for the title compound along with their correspondingexperimental values are listed in Table 1.
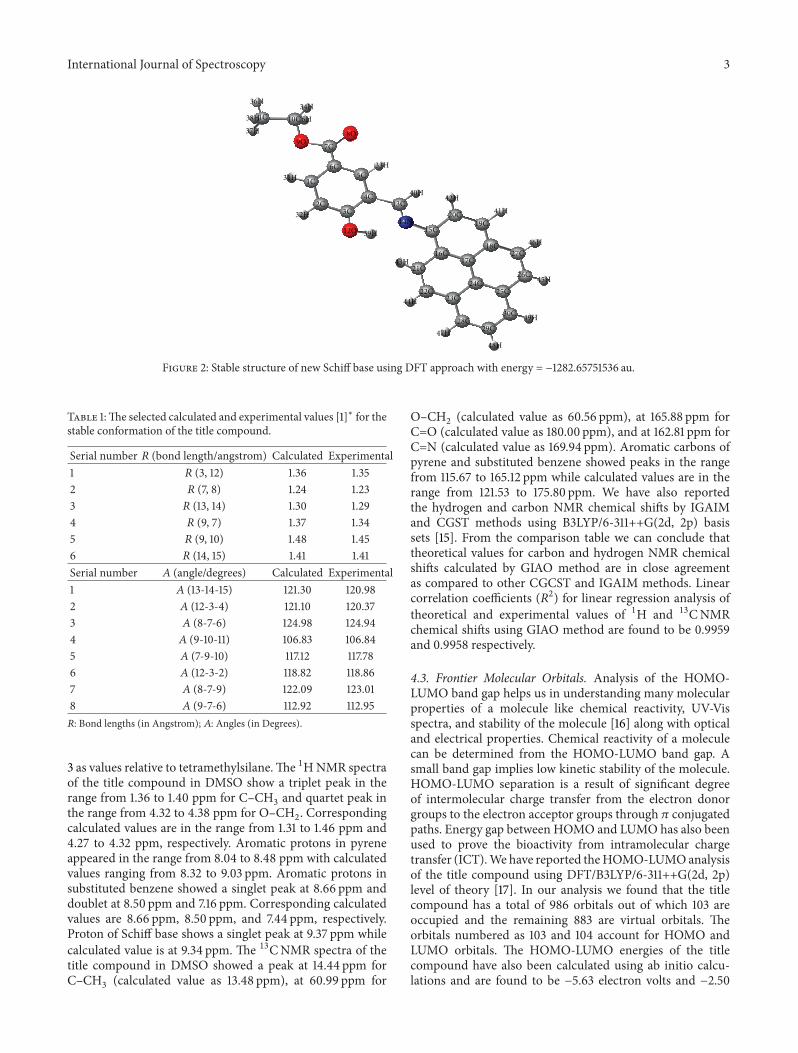
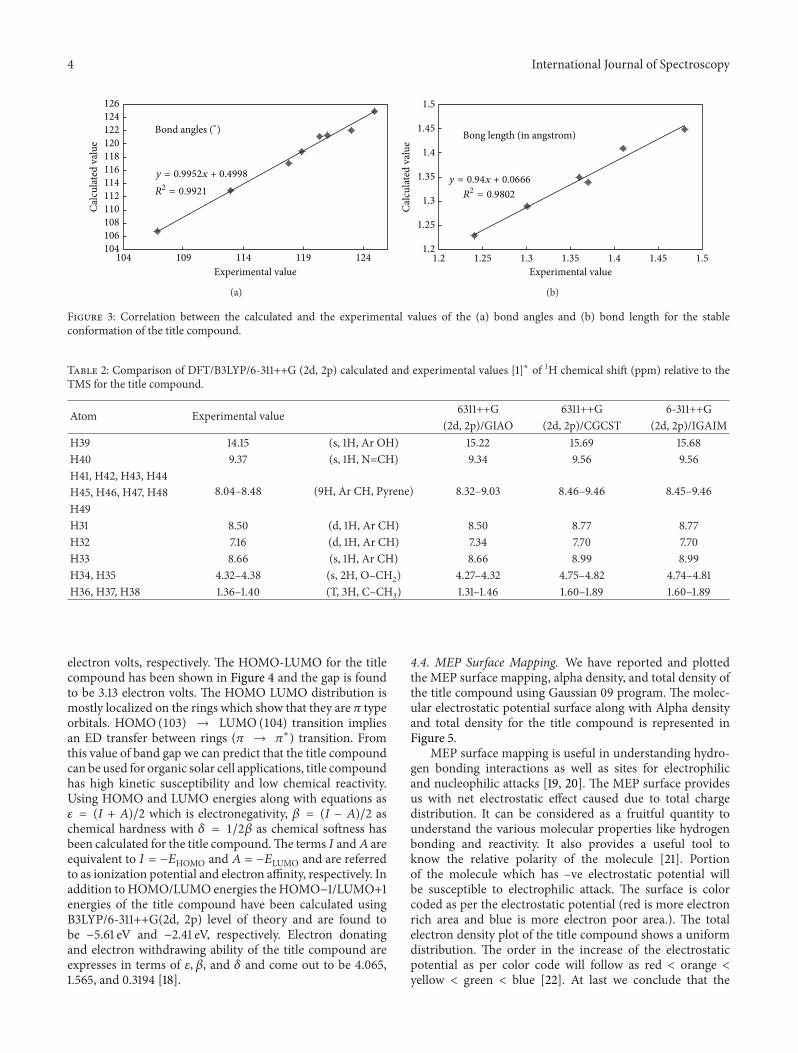
Correlation between [14] the calculated and the exper-imental parameters of bond lengths and bond parametersfor the title compound are shown in Figure 3. Bond lengthand bond angles correlation 𝑅2 values are 0.9802 and 0.9921,respectively.
4.2. Chemical Shifts. NMR spectroscopy is considered as avaluable tool for the structural and functional characteriza-tion ofmolecules. 1Hand 13CNMRchemical shifts of the titlecompound are investigated using DFT/B3LYP/6-311++G(2d,2p) level of theory with GIAO (gauge-invariant atomicorbital) approach in DMSO. The calculated 1H and 13CNMR chemical shifts of the title compound together with thecorresponding experimental values are shown in Tables 2 and
International Journal of Spectroscopy 3
36H
38H1C
37H
34H10C5H
9O8O
7C
6C
1C31H
32H2C
3C
4C
5C33H
12O 39H
13C40H
14N15C
20C
42H
16C17C
18C
19C
21C43H
22C44H 23C
24C
28C47H 29C
48H
30C49H
25C
26C
27C46H
41H
45H
Figure 2: Stable structure of new Schiff base using DFT approach with energy = −1282.65751536 au.
Table 1:The selected calculated and experimental values [1]∗ for thestable conformation of the title compound.
Serial number 𝑅 (bond length/angstrom) Calculated Experimental1 𝑅 (3, 12) 1.36 1.352 𝑅 (7, 8) 1.24 1.233 𝑅 (13, 14) 1.30 1.294 𝑅 (9, 7) 1.37 1.345 𝑅 (9, 10) 1.48 1.456 𝑅 (14, 15) 1.41 1.41Serial number 𝐴 (angle/degrees) Calculated Experimental1 𝐴 (13-14-15) 121.30 120.982 𝐴 (12-3-4) 121.10 120.373 𝐴 (8-7-6) 124.98 124.944 𝐴 (9-10-11) 106.83 106.845 𝐴 (7-9-10) 117.12 117.786 𝐴 (12-3-2) 118.82 118.867 𝐴 (8-7-9) 122.09 123.018 𝐴 (9-7-6) 112.92 112.95𝑅: Bond lengths (in Angstrom); 𝐴: Angles (in Degrees).
3 as values relative to tetramethylsilane.The 1HNMR spectraof the title compound in DMSO show a triplet peak in therange from 1.36 to 1.40 ppm for C–CH
3and quartet peak in
the range from 4.32 to 4.38 ppm for O–CH2. Corresponding
calculated values are in the range from 1.31 to 1.46 ppm and4.27 to 4.32 ppm, respectively. Aromatic protons in pyreneappeared in the range from 8.04 to 8.48 ppm with calculatedvalues ranging from 8.32 to 9.03 ppm. Aromatic protons insubstituted benzene showed a singlet peak at 8.66 ppm anddoublet at 8.50 ppm and 7.16 ppm. Corresponding calculatedvalues are 8.66 ppm, 8.50 ppm, and 7.44 ppm, respectively.Proton of Schiff base shows a singlet peak at 9.37 ppm whilecalculated value is at 9.34 ppm. The 13CNMR spectra of thetitle compound in DMSO showed a peak at 14.44 ppm forC–CH
3(calculated value as 13.48 ppm), at 60.99 ppm for
O–CH2(calculated value as 60.56 ppm), at 165.88 ppm for
C=O (calculated value as 180.00 ppm), and at 162.81 ppm forC=N (calculated value as 169.94 ppm). Aromatic carbons ofpyrene and substituted benzene showed peaks in the rangefrom 115.67 to 165.12 ppm while calculated values are in therange from 121.53 to 175.80 ppm. We have also reportedthe hydrogen and carbon NMR chemical shifts by IGAIMand CGST methods using B3LYP/6-311++G(2d, 2p) basissets [15]. From the comparison table we can conclude thattheoretical values for carbon and hydrogen NMR chemicalshifts calculated by GIAO method are in close agreementas compared to other CGCST and IGAIM methods. Linearcorrelation coefficients (𝑅2) for linear regression analysis oftheoretical and experimental values of 1H and 13CNMRchemical shifts using GIAO method are found to be 0.9959and 0.9958 respectively.
4.3. Frontier Molecular Orbitals. Analysis of the HOMO-LUMO band gap helps us in understanding many molecularproperties of a molecule like chemical reactivity, UV-Visspectra, and stability of the molecule [16] along with opticaland electrical properties. Chemical reactivity of a moleculecan be determined from the HOMO-LUMO band gap. Asmall band gap implies low kinetic stability of the molecule.HOMO-LUMO separation is a result of significant degreeof intermolecular charge transfer from the electron donorgroups to the electron acceptor groups through 𝜋 conjugatedpaths. Energy gap between HOMO and LUMO has also beenused to prove the bioactivity from intramolecular chargetransfer (ICT).We have reported theHOMO-LUMOanalysisof the title compound using DFT/B3LYP/6-311++G(2d, 2p)level of theory [17]. In our analysis we found that the titlecompound has a total of 986 orbitals out of which 103 areoccupied and the remaining 883 are virtual orbitals. Theorbitals numbered as 103 and 104 account for HOMO andLUMO orbitals. The HOMO-LUMO energies of the titlecompound have also been calculated using ab initio calcu-lations and are found to be −5.63 electron volts and −2.50
4 International Journal of Spectroscopy
104106108110112114116118120122124126
104 109 114 119 124
Calc
ulat
ed v
alue
Experimental value
y = 0.9952x + 0.4998
R2 = 0.9921
Bond angles (∘)
(a)
1.2
1.25
1.3
1.35
1.4
1.45
1.5
1.2 1.25 1.3 1.35 1.4 1.45 1.5
Calc
ulat
ed v
alue
Experimental value
y = 0.94x + 0.0666
R2 = 0.9802
Bong length (in angstrom)
(b)
Figure 3: Correlation between the calculated and the experimental values of the (a) bond angles and (b) bond length for the stableconformation of the title compound.
Table 2: Comparison of DFT/B3LYP/6-311++G (2d, 2p) calculated and experimental values [1]∗ of 1H chemical shift (ppm) relative to theTMS for the title compound.
Atom Experimental value 6311++G 6311++G 6-311++G(2d, 2p)/GIAO (2d, 2p)/CGCST (2d, 2p)/IGAIM
H39 14.15 (s, 1H, Ar OH) 15.22 15.69 15.68H40 9.37 (s, 1H, N=CH) 9.34 9.56 9.56H41, H42, H43, H44
8.04–8.48 (9H, Ar CH, Pyrene) 8.32–9.03 8.46–9.46 8.45–9.46H45, H46, H47, H48H49H31 8.50 (d, 1H, Ar CH) 8.50 8.77 8.77H32 7.16 (d, 1H, Ar CH) 7.34 7.70 7.70H33 8.66 (s, 1H, Ar CH) 8.66 8.99 8.99H34, H35 4.32–4.38 (s, 2H, O–CH2) 4.27–4.32 4.75–4.82 4.74–4.81H36, H37, H38 1.36–1.40 (T, 3H, C–CH3) 1.31–1.46 1.60–1.89 1.60–1.89
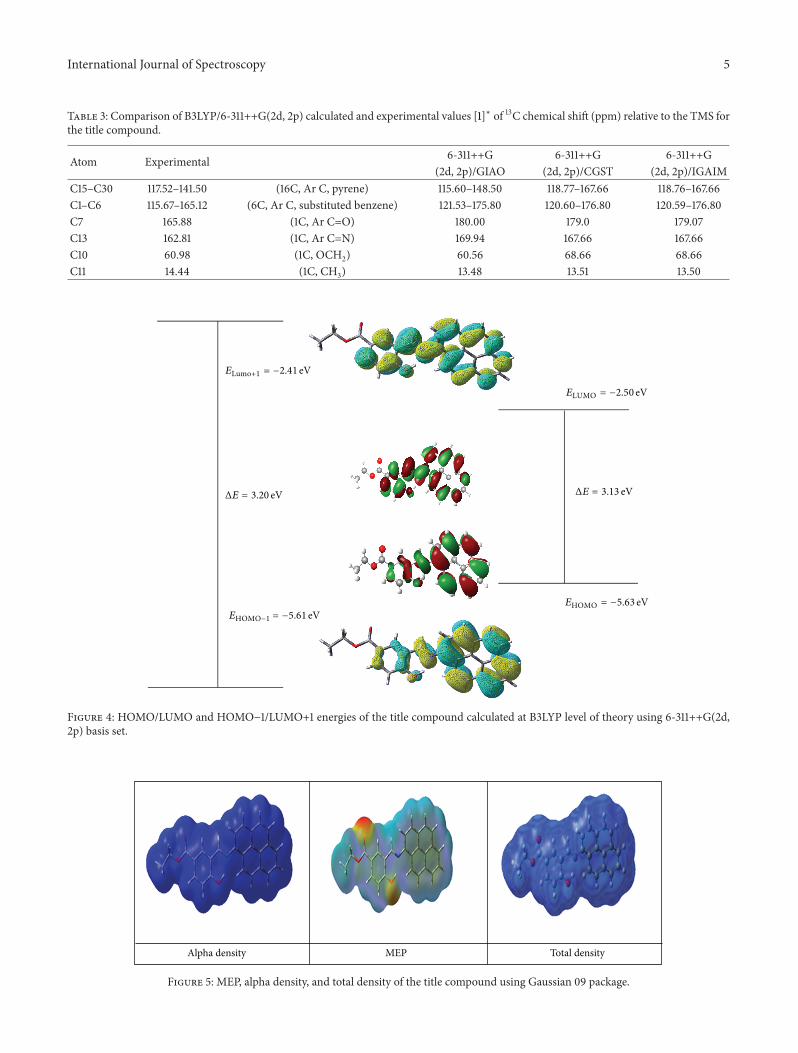
electron volts, respectively. The HOMO-LUMO for the titlecompound has been shown in Figure 4 and the gap is foundto be 3.13 electron volts. The HOMO LUMO distribution ismostly localized on the rings which show that they are 𝜋 typeorbitals. HOMO (103) → LUMO (104) transition impliesan ED transfer between rings (𝜋 → 𝜋∗) transition. Fromthis value of band gap we can predict that the title compoundcan be used for organic solar cell applications, title compoundhas high kinetic susceptibility and low chemical reactivity.Using HOMO and LUMO energies along with equations as𝜀 = (𝐼 + 𝐴)/2 which is electronegativity, 𝛽 = (𝐼 − 𝐴)/2 aschemical hardness with 𝛿 = 1/2𝛽 as chemical softness hasbeen calculated for the title compound.The terms 𝐼 and𝐴 areequivalent to 𝐼 = −𝐸HOMO and 𝐴 = −𝐸LUMO and are referredto as ionization potential and electron affinity, respectively. Inaddition to HOMO/LUMO energies the HOMO−1/LUMO+1energies of the title compound have been calculated usingB3LYP/6-311++G(2d, 2p) level of theory and are found tobe −5.61 eV and −2.41 eV, respectively. Electron donatingand electron withdrawing ability of the title compound areexpresses in terms of 𝜀, 𝛽, and 𝛿 and come out to be 4.065,1.565, and 0.3194 [18].
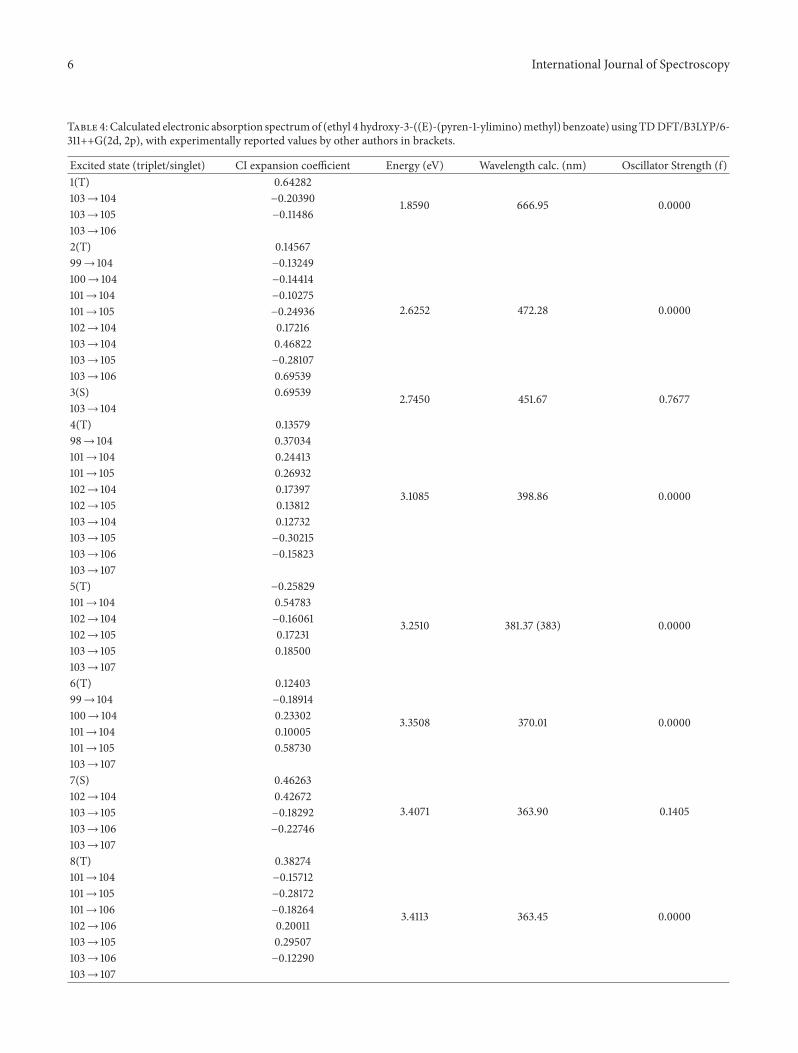
4.4. MEP Surface Mapping. We have reported and plottedthe MEP surface mapping, alpha density, and total density ofthe title compound using Gaussian 09 program. The molec-ular electrostatic potential surface along with Alpha densityand total density for the title compound is represented inFigure 5.
MEP surface mapping is useful in understanding hydro-gen bonding interactions as well as sites for electrophilicand nucleophilic attacks [19, 20]. The MEP surface providesus with net electrostatic effect caused due to total chargedistribution. It can be considered as a fruitful quantity tounderstand the various molecular properties like hydrogenbonding and reactivity. It also provides a useful tool toknow the relative polarity of the molecule [21]. Portionof the molecule which has –ve electrostatic potential willbe susceptible to electrophilic attack. The surface is colorcoded as per the electrostatic potential (red is more electronrich area and blue is more electron poor area.). The totalelectron density plot of the title compound shows a uniformdistribution. The order in the increase of the electrostaticpotential as per color code will follow as red < orange <yellow < green < blue [22]. At last we conclude that the
International Journal of Spectroscopy 5
Table 3: Comparison of B3LYP/6-311++G(2d, 2p) calculated and experimental values [1]∗ of 13C chemical shift (ppm) relative to the TMS forthe title compound.
Atom Experimental 6-311++G 6-311++G 6-311++G(2d, 2p)/GIAO (2d, 2p)/CGST (2d, 2p)/IGAIM
C15–C30 117.52–141.50 (16C, Ar C, pyrene) 115.60–148.50 118.77–167.66 118.76–167.66C1–C6 115.67–165.12 (6C, Ar C, substituted benzene) 121.53–175.80 120.60–176.80 120.59–176.80C7 165.88 (1C, Ar C=O) 180.00 179.0 179.07C13 162.81 (1C, Ar C=N) 169.94 167.66 167.66C10 60.98 (1C, OCH2) 60.56 68.66 68.66C11 14.44 (1C, CH3) 13.48 13.51 13.50
ΔE = 3.20 eV
ELUMO = −2.50 eV
ΔE = 3.13 eV
EHOMO = −5.63 eV
ELumo+1 = −2.41 eV
EHOMO−1 = −5.61 eV
Figure 4: HOMO/LUMO and HOMO−1/LUMO+1 energies of the title compound calculated at B3LYP level of theory using 6-311++G(2d,2p) basis set.
Alpha density MEP Total density
Figure 5: MEP, alpha density, and total density of the title compound using Gaussian 09 package.
6 International Journal of Spectroscopy
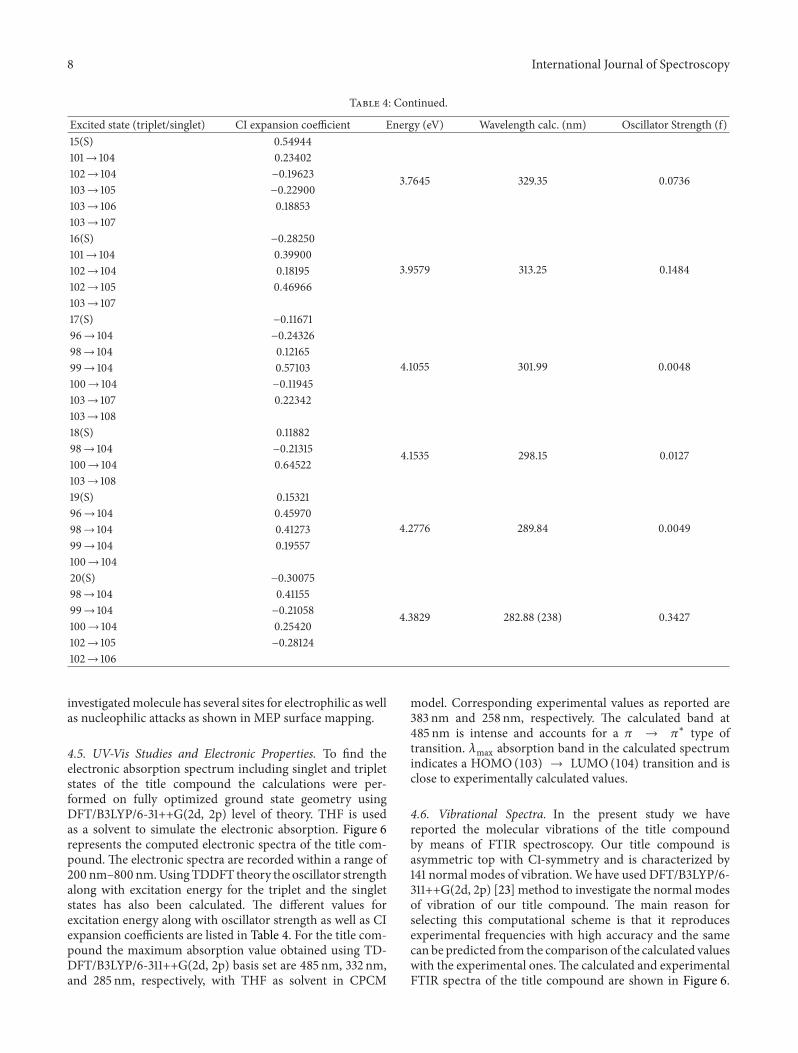
Table 4:Calculated electronic absorption spectrumof (ethyl 4 hydroxy-3-((E)-(pyren-1-ylimino)methyl) benzoate) usingTDDFT/B3LYP/6-311++G(2d, 2p), with experimentally reported values by other authors in brackets.
Excited state (triplet/singlet) CI expansion coefficient Energy (eV) Wavelength calc. (nm) Oscillator Strength (f)1(T) 0.64282
1.8590 666.95 0.0000103→ 104 −0.20390103→ 105 −0.11486103→ 1062(T) 0.14567
2.6252 472.28 0.0000
99→ 104 −0.13249100→ 104 −0.14414101→ 104 −0.10275101→ 105 −0.24936102→ 104 0.17216103→ 104 0.46822103→ 105 −0.28107103→ 106 0.695393(S) 0.69539 2.7450 451.67 0.7677103→ 1044(T) 0.13579
3.1085 398.86 0.0000
98→ 104 0.37034101→ 104 0.24413101→ 105 0.26932102→ 104 0.17397102→ 105 0.13812103→ 104 0.12732103→ 105 −0.30215103→ 106 −0.15823103→ 1075(T) −0.25829
3.2510 381.37 (383) 0.0000
101→ 104 0.54783102→ 104 −0.16061102→ 105 0.17231103→ 105 0.18500103→ 1076(T) 0.12403
3.3508 370.01 0.0000
99→ 104 −0.18914100→ 104 0.23302101→ 104 0.10005101→ 105 0.58730103→ 1077(S) 0.46263
3.4071 363.90 0.1405102→ 104 0.42672103→ 105 −0.18292103→ 106 −0.22746103→ 1078(T) 0.38274
3.4113 363.45 0.0000
101→ 104 −0.15712101→ 105 −0.28172101→ 106 −0.18264102→ 106 0.20011103→ 105 0.29507103→ 106 −0.12290103→ 107
International Journal of Spectroscopy 7
Table 4: Continued.
Excited state (triplet/singlet) CI expansion coefficient Energy (eV) Wavelength calc. (nm) Oscillator Strength (f)9(T) −0.31383
3.4452 359.88 0.0000
99→ 104 0.1275499→ 105 −0.18356100→ 104 0.15473100→ 105 −0.10501100→ 106 0.10458103→ 105 0.10831103→ 106 0.48610103→ 10810(T) 0.26533
3.4968 354.56 0.0000
98→ 104 −0.1753299→ 104 0.1453799→ 106 0.25397100→ 104 0.14670101→ 106 −0.13584102→ 104 0.14197102→ 105 0.10470103→ 104 0.26216103→ 105 0.28660103→ 106 0.15214103→ 10711(S) 0.28917
3.5463 349.62 0.0491
101→ 104 −0.13634102→ 104 0.44769103→ 105 0.37599103→ 106 0.20752103→ 10712(S) 0.30776
3.6873 336.24 0.1203
102→ 104 0.10328102→ 107 −0.23091103→ 105 0.48945103→ 106 0.24268103→ 10713(T) 0.13526
3.6887 336.12 0.0000
99→ 104 −0.17258100→ 104 0.28909101→ 105 0.14313101→ 106 −0.13298101→ 107 −0.14420102→ 105 0.31031102→ 106 0.21164102→ 107 0.19945103→ 105 0.22837103→ 106 −0.12402103→ 10714(T) 0.44193
3.7249 332.85 0.0000
98→ 104 −0.1398699→ 105 −0.25100101→ 106 −0.21945102→ 105 0.22073102→ 107 −0.14380103→ 109
8 International Journal of Spectroscopy
Table 4: Continued.
Excited state (triplet/singlet) CI expansion coefficient Energy (eV) Wavelength calc. (nm) Oscillator Strength (f)15(S) 0.54944
3.7645 329.35 0.0736
101→ 104 0.23402102→ 104 −0.19623103→ 105 −0.22900103→ 106 0.18853103→ 10716(S) −0.28250
3.9579 313.25 0.1484101→ 104 0.39900102→ 104 0.18195102→ 105 0.46966103→ 10717(S) −0.11671
4.1055 301.99 0.0048
96→ 104 −0.2432698→ 104 0.1216599→ 104 0.57103100→ 104 −0.11945103→ 107 0.22342103→ 10818(S) 0.11882
4.1535 298.15 0.012798→ 104 −0.21315100→ 104 0.64522103→ 10819(S) 0.15321
4.2776 289.84 0.004996→ 104 0.4597098→ 104 0.4127399→ 104 0.19557100→ 10420(S) −0.30075
4.3829 282.88 (238) 0.3427
98→ 104 0.4115599→ 104 −0.21058100→ 104 0.25420102→ 105 −0.28124102→ 106
investigatedmolecule has several sites for electrophilic as wellas nucleophilic attacks as shown in MEP surface mapping.
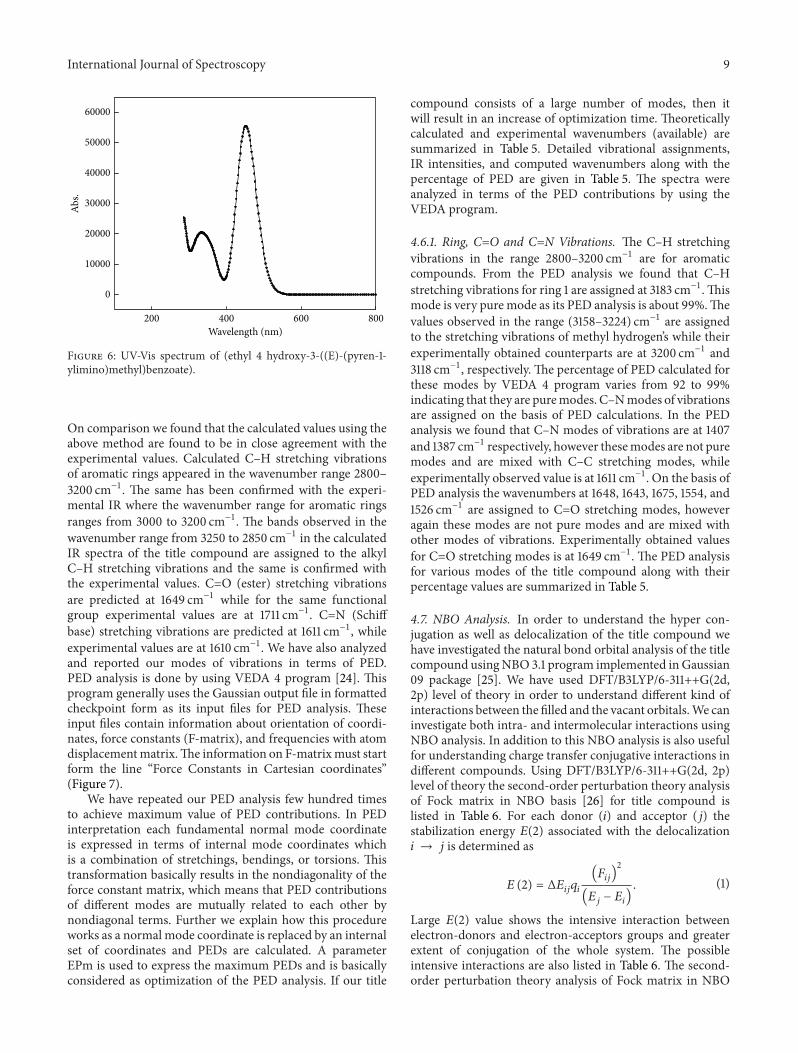
4.5. UV-Vis Studies and Electronic Properties. To find theelectronic absorption spectrum including singlet and tripletstates of the title compound the calculations were per-formed on fully optimized ground state geometry usingDFT/B3LYP/6-31++G(2d, 2p) level of theory. THF is usedas a solvent to simulate the electronic absorption. Figure 6represents the computed electronic spectra of the title com-pound. The electronic spectra are recorded within a range of200 nm–800 nm.UsingTDDFT theory the oscillator strengthalong with excitation energy for the triplet and the singletstates has also been calculated. The different values forexcitation energy along with oscillator strength as well as CIexpansion coefficients are listed in Table 4. For the title com-pound the maximum absorption value obtained using TD-DFT/B3LYP/6-311++G(2d, 2p) basis set are 485 nm, 332 nm,and 285 nm, respectively, with THF as solvent in CPCM
model. Corresponding experimental values as reported are383 nm and 258 nm, respectively. The calculated band at485 nm is intense and accounts for a 𝜋 → 𝜋∗ type oftransition. 𝜆max absorption band in the calculated spectrumindicates a HOMO (103) → LUMO (104) transition and isclose to experimentally calculated values.
4.6. Vibrational Spectra. In the present study we havereported the molecular vibrations of the title compoundby means of FTIR spectroscopy. Our title compound isasymmetric top with C1-symmetry and is characterized by141 normal modes of vibration.We have used DFT/B3LYP/6-311++G(2d, 2p) [23] method to investigate the normal modesof vibration of our title compound. The main reason forselecting this computational scheme is that it reproducesexperimental frequencies with high accuracy and the samecan be predicted from the comparison of the calculated valueswith the experimental ones.The calculated and experimentalFTIR spectra of the title compound are shown in Figure 6.
International Journal of Spectroscopy 9
60000
50000
40000
30000
20000
10000
0
Abs.
200 400 600 800
Wavelength (nm)
Figure 6: UV-Vis spectrum of (ethyl 4 hydroxy-3-((E)-(pyren-1-ylimino)methyl)benzoate).
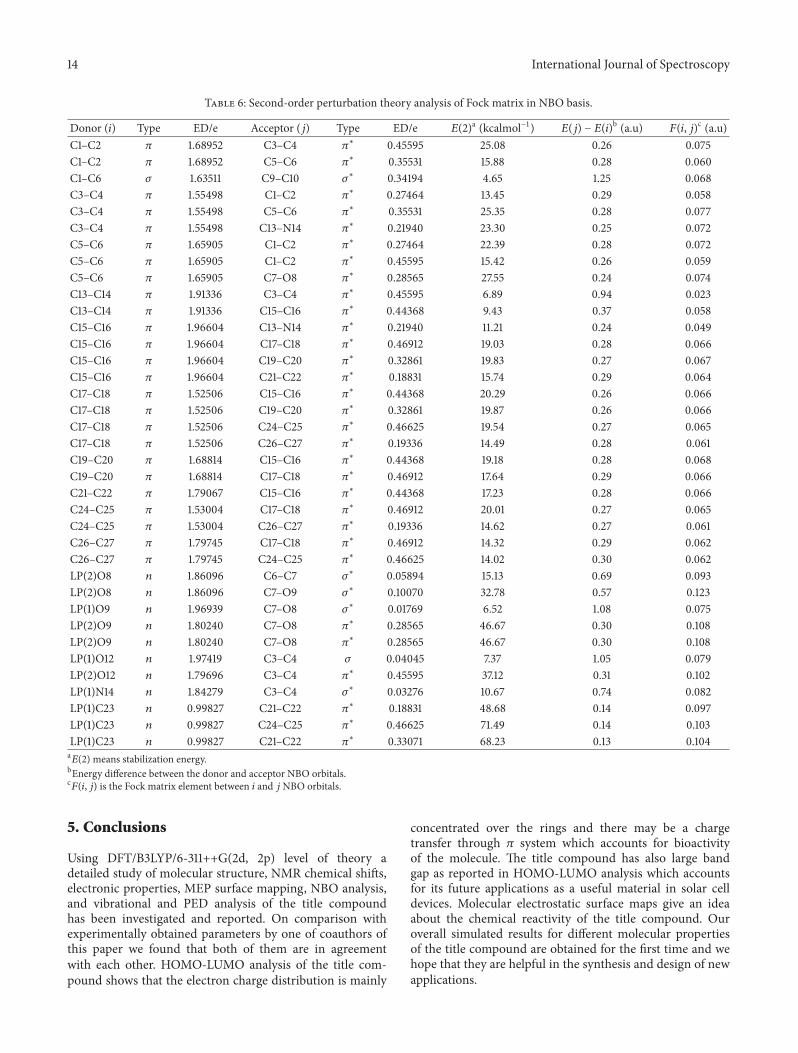
On comparison we found that the calculated values using theabove method are found to be in close agreement with theexperimental values. Calculated C–H stretching vibrationsof aromatic rings appeared in the wavenumber range 2800–3200 cm−1. The same has been confirmed with the experi-mental IR where the wavenumber range for aromatic ringsranges from 3000 to 3200 cm−1. The bands observed in thewavenumber range from 3250 to 2850 cm−1 in the calculatedIR spectra of the title compound are assigned to the alkylC–H stretching vibrations and the same is confirmed withthe experimental values. C=O (ester) stretching vibrationsare predicted at 1649 cm−1 while for the same functionalgroup experimental values are at 1711 cm−1. C=N (Schiffbase) stretching vibrations are predicted at 1611 cm−1, whileexperimental values are at 1610 cm−1. We have also analyzedand reported our modes of vibrations in terms of PED.PED analysis is done by using VEDA 4 program [24]. Thisprogram generally uses the Gaussian output file in formattedcheckpoint form as its input files for PED analysis. Theseinput files contain information about orientation of coordi-nates, force constants (F-matrix), and frequencies with atomdisplacementmatrix.The information on F-matrixmust startform the line “Force Constants in Cartesian coordinates”(Figure 7).
We have repeated our PED analysis few hundred timesto achieve maximum value of PED contributions. In PEDinterpretation each fundamental normal mode coordinateis expressed in terms of internal mode coordinates whichis a combination of stretchings, bendings, or torsions. Thistransformation basically results in the nondiagonality of theforce constant matrix, which means that PED contributionsof different modes are mutually related to each other bynondiagonal terms. Further we explain how this procedureworks as a normal mode coordinate is replaced by an internalset of coordinates and PEDs are calculated. A parameterEPm is used to express the maximum PEDs and is basicallyconsidered as optimization of the PED analysis. If our title
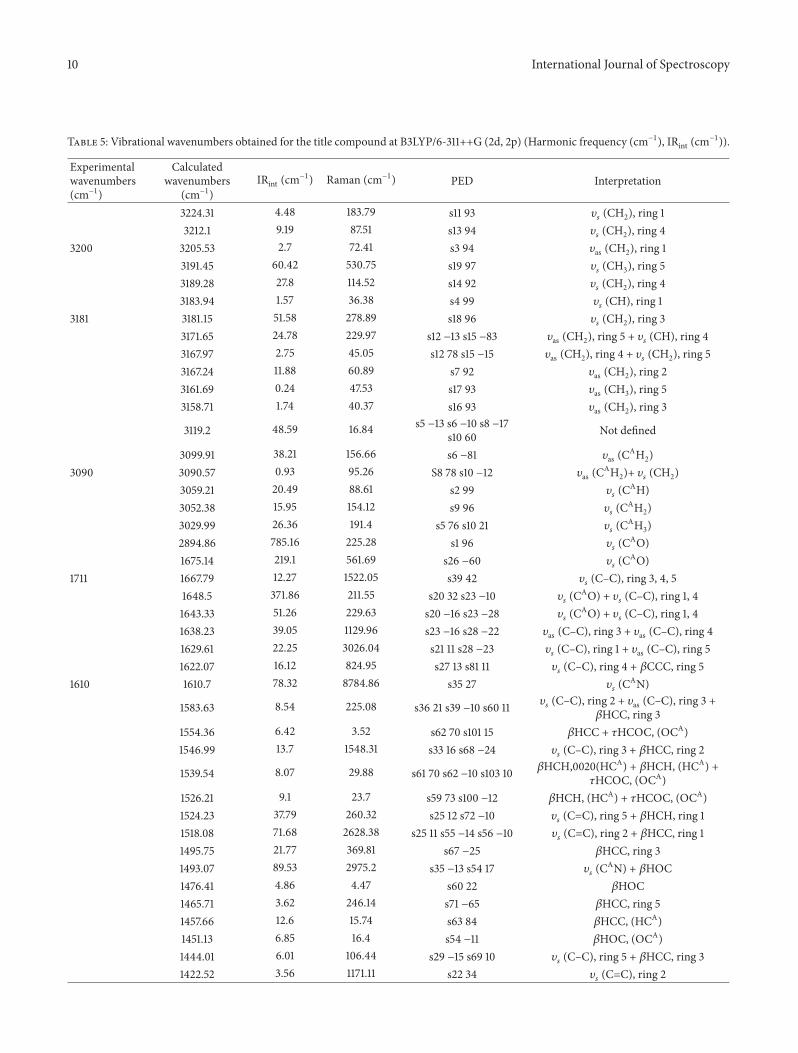
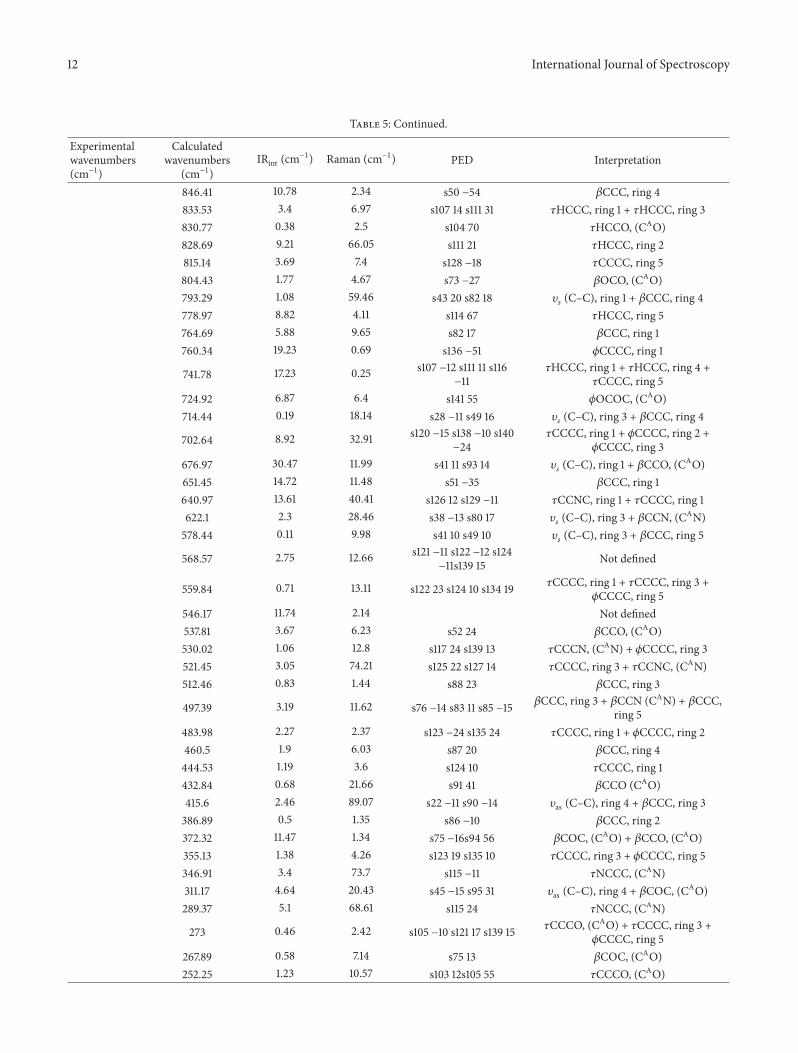
compound consists of a large number of modes, then itwill result in an increase of optimization time. Theoreticallycalculated and experimental wavenumbers (available) aresummarized in Table 5. Detailed vibrational assignments,IR intensities, and computed wavenumbers along with thepercentage of PED are given in Table 5. The spectra wereanalyzed in terms of the PED contributions by using theVEDA program.
4.6.1. Ring, C=O and C=N Vibrations. The C–H stretchingvibrations in the range 2800–3200 cm−1 are for aromaticcompounds. From the PED analysis we found that C–Hstretching vibrations for ring 1 are assigned at 3183 cm−1. Thismode is very puremode as its PED analysis is about 99%.Thevalues observed in the range (3158–3224) cm−1 are assignedto the stretching vibrations of methyl hydrogen’s while theirexperimentally obtained counterparts are at 3200 cm−1 and3118 cm−1, respectively. The percentage of PED calculated forthese modes by VEDA 4 program varies from 92 to 99%indicating that they are puremodes. C–Nmodes of vibrationsare assigned on the basis of PED calculations. In the PEDanalysis we found that C–N modes of vibrations are at 1407and 1387 cm−1 respectively, however thesemodes are not puremodes and are mixed with C–C stretching modes, whileexperimentally observed value is at 1611 cm−1. On the basis ofPED analysis the wavenumbers at 1648, 1643, 1675, 1554, and1526 cm−1 are assigned to C=O stretching modes, howeveragain these modes are not pure modes and are mixed withother modes of vibrations. Experimentally obtained valuesfor C=O stretching modes is at 1649 cm−1. The PED analysisfor various modes of the title compound along with theirpercentage values are summarized in Table 5.
4.7. NBO Analysis. In order to understand the hyper con-jugation as well as delocalization of the title compound wehave investigated the natural bond orbital analysis of the titlecompound usingNBO 3.1 program implemented in Gaussian09 package [25]. We have used DFT/B3LYP/6-311++G(2d,2p) level of theory in order to understand different kind ofinteractions between the filled and the vacant orbitals.We caninvestigate both intra- and intermolecular interactions usingNBO analysis. In addition to this NBO analysis is also usefulfor understanding charge transfer conjugative interactions indifferent compounds. Using DFT/B3LYP/6-311++G(2d, 2p)level of theory the second-order perturbation theory analysisof Fock matrix in NBO basis [26] for title compound islisted in Table 6. For each donor (𝑖) and acceptor (𝑗) thestabilization energy 𝐸(2) associated with the delocalization𝑖 → 𝑗 is determined as
𝐸 (2) = Δ𝐸𝑖𝑗𝑞𝑖
(𝐹𝑖𝑗)2
(𝐸𝑗− 𝐸𝑖). (1)
Large 𝐸(2) value shows the intensive interaction betweenelectron-donors and electron-acceptors groups and greaterextent of conjugation of the whole system. The possibleintensive interactions are also listed in Table 6. The second-order perturbation theory analysis of Fock matrix in NBO
10 International Journal of Spectroscopy
Table 5: Vibrational wavenumbers obtained for the title compound at B3LYP/6-311++G (2d, 2p) (Harmonic frequency (cm−1), IRint (cm−1)).
Experimentalwavenumbers(cm−1)
Calculatedwavenumbers
(cm−1)IRint (cm
−1) Raman (cm−1) PED Interpretation
3224.31 4.48 183.79 s11 93 𝜐𝑠(CH2), ring 1
3212.1 9.19 87.51 s13 94 𝜐𝑠(CH2), ring 4
3200 3205.53 2.7 72.41 s3 94 𝜐as (CH2), ring 13191.45 60.42 530.75 s19 97 𝜐
𝑠(CH3), ring 5
3189.28 27.8 114.52 s14 92 𝜐𝑠(CH2), ring 4
3183.94 1.57 36.38 s4 99 𝜐𝑠(CH), ring 1
3181 3181.15 51.58 278.89 s18 96 𝜐𝑠(CH2), ring 3
3171.65 24.78 229.97 s12 −13 s15 −83 𝜐as (CH2), ring 5 + 𝜐𝑠 (CH), ring 43167.97 2.75 45.05 s12 78 s15 −15 𝜐as (CH2), ring 4 + 𝜐𝑠 (CH2), ring 53167.24 11.88 60.89 s7 92 𝜐as (CH2), ring 23161.69 0.24 47.53 s17 93 𝜐as (CH3), ring 53158.71 1.74 40.37 s16 93 𝜐as (CH2), ring 3
3119.2 48.59 16.84 s5 −13 s6 −10 s8 −17s10 60 Not defined
3099.91 38.21 156.66 s6 −81 𝜐as (CAH2)
3090 3090.57 0.93 95.26 S8 78 s10 −12 𝜐as (CAH2)+ 𝜐𝑠 (CH2)
3059.21 20.49 88.61 s2 99 𝜐𝑠(CAH)
3052.38 15.95 154.12 s9 96 𝜐𝑠(CAH2)
3029.99 26.36 191.4 s5 76 s10 21 𝜐𝑠(CAH3)
2894.86 785.16 225.28 s1 96 𝜐𝑠(CAO)
1675.14 219.1 561.69 s26 −60 𝜐𝑠(CAO)
1711 1667.79 12.27 1522.05 s39 42 𝜐𝑠(C–C), ring 3, 4, 5
1648.5 371.86 211.55 s20 32 s23 −10 𝜐𝑠(CAO) + 𝜐
𝑠(C–C), ring 1, 4
1643.33 51.26 229.63 s20 −16 s23 −28 𝜐𝑠(CAO) + 𝜐
𝑠(C–C), ring 1, 4
1638.23 39.05 1129.96 s23 −16 s28 −22 𝜐as (C–C), ring 3 + 𝜐as (C–C), ring 41629.61 22.25 3026.04 s21 11 s28 −23 𝜐
𝑠(C–C), ring 1 + 𝜐as (C–C), ring 5
1622.07 16.12 824.95 s27 13 s81 11 𝜐𝑠(C–C), ring 4 + 𝛽CCC, ring 5
1610 1610.7 78.32 8784.86 s35 27 𝜐𝑠(CAN)
1583.63 8.54 225.08 s36 21 s39 −10 s60 11 𝜐𝑠(C–C), ring 2 + 𝜐as (C–C), ring 3 +
𝛽HCC, ring 31554.36 6.42 3.52 s62 70 s101 15 𝛽HCC + 𝜏HCOC, (OCA)1546.99 13.7 1548.31 s33 16 s68 −24 𝜐
𝑠(C–C), ring 3 + 𝛽HCC, ring 2
1539.54 8.07 29.88 s61 70 s62 −10 s103 10 𝛽HCH,0020(HCA) + 𝛽HCH, (HCA) +𝜏HCOC, (OCA)
1526.21 9.1 23.7 s59 73 s100 −12 𝛽HCH, (HCA) + 𝜏HCOC, (OCA)1524.23 37.79 260.32 s25 12 s72 −10 𝜐
𝑠(C=C), ring 5 + 𝛽HCH, ring 1
1518.08 71.68 2628.38 s25 11 s55 −14 s56 −10 𝜐𝑠(C=C), ring 2 + 𝛽HCC, ring 1
1495.75 21.77 369.81 s67 −25 𝛽HCC, ring 31493.07 89.53 2975.2 s35 −13 s54 17 𝜐
𝑠(CAN) + 𝛽HOC
1476.41 4.86 4.47 s60 22 𝛽HOC1465.71 3.62 246.14 s71 −65 𝛽HCC, ring 51457.66 12.6 15.74 s63 84 𝛽HCC, (HCA)1451.13 6.85 16.4 s54 −11 𝛽HOC, (OCA)1444.01 6.01 106.44 s29 −15 s69 10 𝜐
𝑠(C–C), ring 5 + 𝛽HCC, ring 3
1422.52 3.56 1171.11 s22 34 𝜐𝑠(C=C), ring 2

International Journal of Spectroscopy 11
Table 5: Continued.
Experimentalwavenumbers(cm−1)
Calculatedwavenumbers
(cm−1)IRint (cm
−1) Raman (cm−1) PED Interpretation
1418.96 8.01 160.33 s62 11 s101 67 𝛽HCH, (HCA) + 𝜏HCOC, (OCA)1407.13 11.57 189.62 s31 −23 s64 −17 𝜐as (C–C), ring 5 + 𝛽HCN, (NCA)1387.02 4.94 692.54 s31 −11 s64 31 𝜐as (C–C), ring 5 + 𝛽HCN, (NCA)1371.3 53.01 744.64 s24 −51 s42 13 𝜐as (C–C), ring 1 + 𝜐𝑠 (C–C), ring 51365.37 3.17 20.73 s85 10 𝛽CCC, ring 41347.53 8.32 30.53 s37 −41 s66 −10 𝜐as (C=C), ring 2 + 𝛽HCC, ring 41322.41 32.6 186.95 s56 −45 𝛽HCC, ring 11301.85 0.32 18.48 s58 76 𝛽HCC, (CAH)
1293.46 1.16 19.8 s33 12 s60 10 s68 21 𝜐as (C–C), ring 3 + 𝛽HCC, ring 4 +𝛽HCC, ring 5
1290.84 115.58 764.31 s30 58 𝜐𝑠(CO), (CAO)
1284.22 2.96 455.48 s41 20 s69 −17 𝜐𝑠(C–C), ring 5 + 𝛽HCC, ring 5
1264.63 151.27 24.03 s26 −16 s57 −14 𝜐as (C–C), ring 5 + 𝛽HCC, ring 11263.15 62.22 3895.41 s41 −11 s44 −11 + 𝜐as (C–C), ring 1 + 𝜐as (C–C), ring 51252.17 107.36 376.98 Not defined1231.74 194.37 485.07 s32 −10 s72 21 𝜐as (C–C), ring 2 + 𝛽HCC, ring 51223.49 154.6 440.05 s70 −52 𝛽HCC, ring 21211.31 266.52 575.9 s70 −13 𝛽HCC, ring 21196.58 52.39 47.76 s25 17 s66 40 𝜐
𝑠(C=C), ring 4 + 𝛽HCC, ring 5
1190.05 0.98 29.65 s39 14s65 49 𝜐𝑠(C=C), ring 3 + 𝛽HCC, ring 3
1188.46 5.77 4.66 s58 −14 s100 54 𝛽HCC (CAH) + 𝜏HCOC, (OCA)1163.11 62.3 4.06 s29 25s57 55 𝜐
𝑠(C=C), ring 1 + 𝛽HCC, ring 1
1147.16 3.05 19.94 s48 22 s61 −18 s94 −12s103 −32
𝛽HCH (CAH) + 𝛽CCO (CAO) + 𝜏HCCO(OCA)
1143.32 0.51 14.59 s77 32 𝛽CCC, ring 41132.55 18.83 225.65 s69 11 𝛽HCC, ring 51118.58 268.59 4.61 s46 −31 s55 15 𝜐as (C=C), ring 1 + 𝛽HCC, ring 11085.93 16.59 30.98 s27 14 s34 22 𝜐
𝑠(C=C), ring 3 + 𝜐
𝑠(C=C), ring 5
1039.71 88.12 4.02 s47 72 𝜐as (C=C), (CAH)
1037.69 2.7 6.89 s102 −80 𝜏HCCC, ring 41015.71 1 19.59 s112 −52 𝜏HCCC, ring 51014.43 16.39 160.22 s99 −66 𝜏HCNC, (CAN)1005.48 0.18 0.64 s113 61 𝜏HCCC, ring 31004.51 5.05 79.88 s106 74 𝜏HCCC, ring 1995.67 6.4 4.17 s32 10 s40 −12 𝜐
𝑠(C–C), ring 2 + 𝜐as (C=C), ring 3
982.59 1.21 30.45 s109 66 𝜏HCCC, ring 2966.87 5.99 189.31 s97 38 𝜏HCCC, ring 1964.36 22.39 3.01 s97 44 𝜏HCCC, ring 1957.27 80.57 1.93 s96 75 𝜏HOCC (CAO)938.59 1.65 4.09 s110 72 𝜏HCCC, ring 5925.25 33.74 166.09 s44 −11 s79 −27 𝜐as (C
AN) + 𝛽CCC, ring 4881.43 111.2 18.99 s108 −60 𝜏HCCC, ring 2876.59 42.03 10.19 s48 −12 s107 25 𝜐as (C–C), ring 1 + 𝜏HCCC, ring 4867.61 38.53 2.37 s98 60 𝜏HCCC, ring 1
866.7 25.46 2.94 s48 −16 s98 −21 s107−12 s108 −14 Not defined
12 International Journal of Spectroscopy
Table 5: Continued.
Experimentalwavenumbers(cm−1)
Calculatedwavenumbers
(cm−1)IRint (cm
−1) Raman (cm−1) PED Interpretation
846.41 10.78 2.34 s50 −54 𝛽CCC, ring 4833.53 3.4 6.97 s107 14 s111 31 𝜏HCCC, ring 1 + 𝜏HCCC, ring 3830.77 0.38 2.5 s104 70 𝜏HCCO, (CAO)828.69 9.21 66.05 s111 21 𝜏HCCC, ring 2815.14 3.69 7.4 s128 −18 𝜏CCCC, ring 5804.43 1.77 4.67 s73 −27 𝛽OCO, (CAO)793.29 1.08 59.46 s43 20 s82 18 𝜐
𝑠(C–C), ring 1 + 𝛽CCC, ring 4
778.97 8.82 4.11 s114 67 𝜏HCCC, ring 5764.69 5.88 9.65 s82 17 𝛽CCC, ring 1760.34 19.23 0.69 s136 −51 𝜙CCCC, ring 1
741.78 17.23 0.25 s107 −12 s111 11 s116−11
𝜏HCCC, ring 1 + 𝜏HCCC, ring 4 +𝜏CCCC, ring 5
724.92 6.87 6.4 s141 55 𝜙OCOC, (CAO)714.44 0.19 18.14 s28 −11 s49 16 𝜐
𝑠(C–C), ring 3 + 𝛽CCC, ring 4
702.64 8.92 32.91 s120 −15 s138 −10 s140−24
𝜏CCCC, ring 1 + 𝜙CCCC, ring 2 +𝜙CCCC, ring 3
676.97 30.47 11.99 s41 11 s93 14 𝜐𝑠(C–C), ring 1 + 𝛽CCO, (CAO)
651.45 14.72 11.48 s51 −35 𝛽CCC, ring 1640.97 13.61 40.41 s126 12 s129 −11 𝜏CCNC, ring 1 + 𝜏CCCC, ring 1622.1 2.3 28.46 s38 −13 s80 17 𝜐
𝑠(C–C), ring 3 + 𝛽CCN, (CAN)
578.44 0.11 9.98 s41 10 s49 10 𝜐𝑠(C–C), ring 3 + 𝛽CCC, ring 5
568.57 2.75 12.66 s121 −11 s122 −12 s124−11s139 15 Not defined
559.84 0.71 13.11 s122 23 s124 10 s134 19 𝜏CCCC, ring 1 + 𝜏CCCC, ring 3 +𝜙CCCC, ring 5
546.17 11.74 2.14 Not defined537.81 3.67 6.23 s52 24 𝛽CCO, (CAO)530.02 1.06 12.8 s117 24 s139 13 𝜏CCCN, (CAN) + 𝜙CCCC, ring 3521.45 3.05 74.21 s125 22 s127 14 𝜏CCCC, ring 3 + 𝜏CCNC, (CAN)512.46 0.83 1.44 s88 23 𝛽CCC, ring 3
497.39 3.19 11.62 s76 −14 s83 11 s85 −15 𝛽CCC, ring 3 + 𝛽CCN (CAN) + 𝛽CCC,ring 5
483.98 2.27 2.37 s123 −24 s135 24 𝜏CCCC, ring 1 + 𝜙CCCC, ring 2460.5 1.9 6.03 s87 20 𝛽CCC, ring 4444.53 1.19 3.6 s124 10 𝜏CCCC, ring 1432.84 0.68 21.66 s91 41 𝛽CCO (CAO)415.6 2.46 89.07 s22 −11 s90 −14 𝜐as (C–C), ring 4 + 𝛽CCC, ring 3386.89 0.5 1.35 s86 −10 𝛽CCC, ring 2372.32 11.47 1.34 s75 −16s94 56 𝛽COC, (CAO) + 𝛽CCO, (CAO)355.13 1.38 4.26 s123 19 s135 10 𝜏CCCC, ring 3 + 𝜙CCCC, ring 5346.91 3.4 73.7 s115 −11 𝜏NCCC, (CAN)311.17 4.64 20.43 s45 −15 s95 31 𝜐as (C–C), ring 4 + 𝛽COC, (CAO)289.37 5.1 68.61 s115 24 𝜏NCCC, (CAN)
273 0.46 2.42 s105 −10 s121 17 s139 15 𝜏CCCO, (CAO) + 𝜏CCCC, ring 3 +𝜙CCCC, ring 5
267.89 0.58 7.14 s75 13 𝛽COC, (CAO)252.25 1.23 10.57 s103 12s105 55 𝜏CCCO, (CAO)
International Journal of Spectroscopy 13
Table 5: Continued.
Experimentalwavenumbers(cm−1)
Calculatedwavenumbers
(cm−1)IRint (cm
−1) Raman (cm−1) PED Interpretation
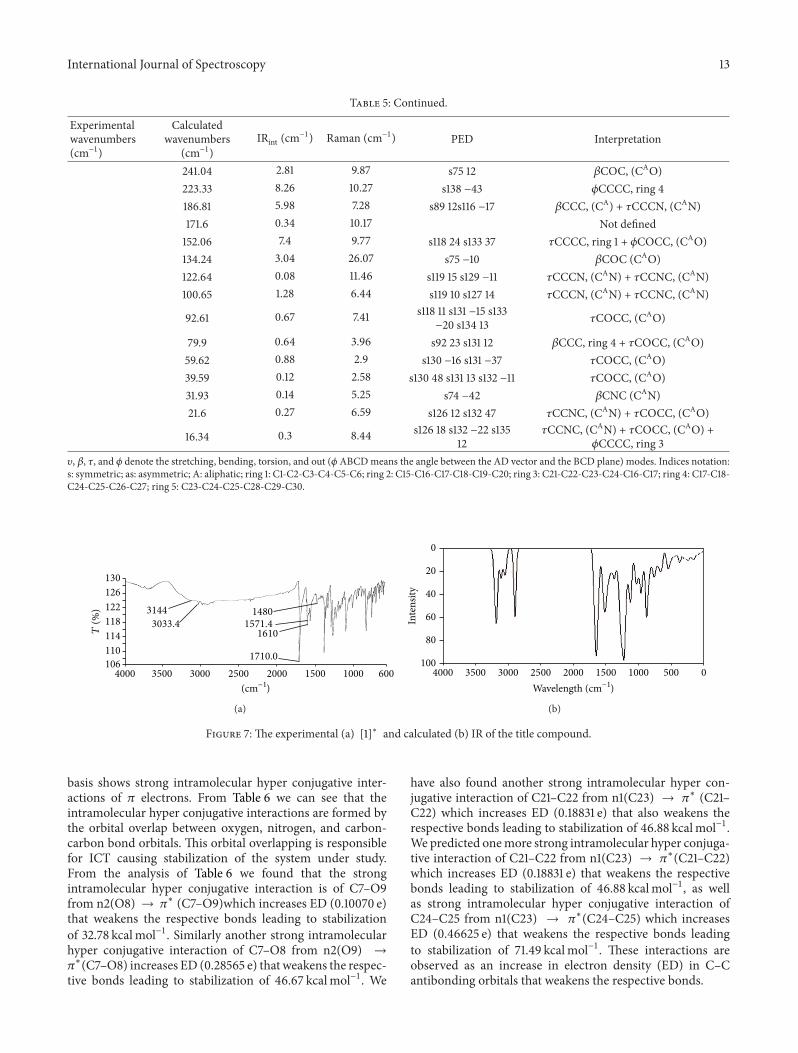
241.04 2.81 9.87 s75 12 𝛽COC, (CAO)223.33 8.26 10.27 s138 −43 𝜙CCCC, ring 4186.81 5.98 7.28 s89 12s116 −17 𝛽CCC, (CA) + 𝜏CCCN, (CAN)171.6 0.34 10.17 Not defined152.06 7.4 9.77 s118 24 s133 37 𝜏CCCC, ring 1 + 𝜙COCC, (CAO)134.24 3.04 26.07 s75 −10 𝛽COC (CAO)122.64 0.08 11.46 s119 15 s129 −11 𝜏CCCN, (CAN) + 𝜏CCNC, (CAN)100.65 1.28 6.44 s119 10 s127 14 𝜏CCCN, (CAN) + 𝜏CCNC, (CAN)
92.61 0.67 7.41 s118 11 s131 −15 s133−20 s134 13 𝜏COCC, (CAO)
79.9 0.64 3.96 s92 23 s131 12 𝛽CCC, ring 4 + 𝜏COCC, (CAO)59.62 0.88 2.9 s130 −16 s131 −37 𝜏COCC, (CAO)39.59 0.12 2.58 s130 48 s131 13 s132 −11 𝜏COCC, (CAO)31.93 0.14 5.25 s74 −42 𝛽CNC (CAN)21.6 0.27 6.59 s126 12 s132 47 𝜏CCNC, (CAN) + 𝜏COCC, (CAO)
16.34 0.3 8.44 s126 18 s132 −22 s13512
𝜏CCNC, (CAN) + 𝜏COCC, (CAO) +𝜙CCCC, ring 3
𝜐, 𝛽, 𝜏, and 𝜙 denote the stretching, bending, torsion, and out (𝜙 ABCDmeans the angle between the AD vector and the BCD plane) modes. Indices notation:s: symmetric; as: asymmetric; A: aliphatic; ring 1: C1-C2-C3-C4-C5-C6; ring 2: C15-C16-C17-C18-C19-C20; ring 3: C21-C22-C23-C24-C16-C17; ring 4: C17-C18-C24-C25-C26-C27; ring 5: C23-C24-C25-C28-C29-C30.
130
126
122
118
114
110
1064000 3500 3000 2500 2000 1500 1000 600
3144
3033.41480
1571.41610
1710.0
T(%
)
(cm−1)
(a)
4000 3500 3000 2500 2000 1500 1000 500
0
0
20
40
60
80
100
Inte
nsity
Wavelength (cm−1)
(b)
Figure 7: The experimental (a) [1]∗ and calculated (b) IR of the title compound.
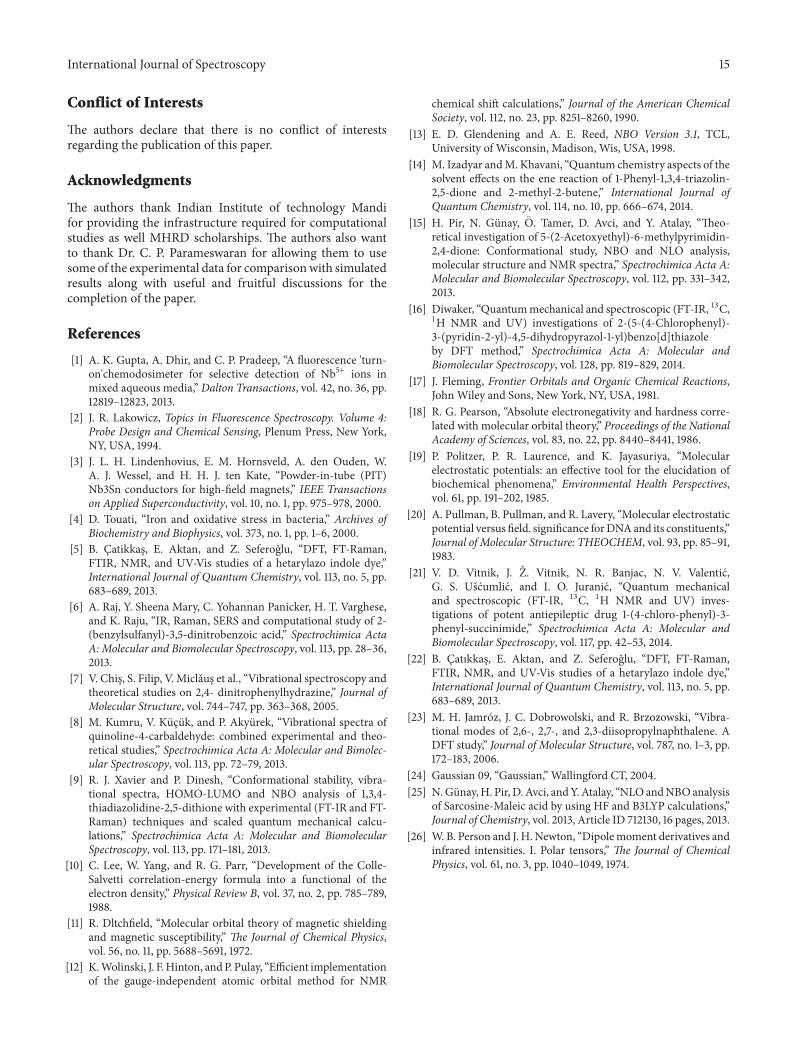
basis shows strong intramolecular hyper conjugative inter-actions of 𝜋 electrons. From Table 6 we can see that theintramolecular hyper conjugative interactions are formed bythe orbital overlap between oxygen, nitrogen, and carbon-carbon bond orbitals. This orbital overlapping is responsiblefor ICT causing stabilization of the system under study.From the analysis of Table 6 we found that the strongintramolecular hyper conjugative interaction is of C7–O9from n2(O8) → 𝜋∗ (C7–O9)which increases ED (0.10070 e)that weakens the respective bonds leading to stabilizationof 32.78 kcalmol−1. Similarly another strong intramolecularhyper conjugative interaction of C7–O8 from n2(O9) →𝜋∗(C7–O8) increases ED (0.28565 e) that weakens the respec-
tive bonds leading to stabilization of 46.67 kcalmol−1. We
have also found another strong intramolecular hyper con-jugative interaction of C21–C22 from n1(C23) → 𝜋∗ (C21–C22) which increases ED (0.18831 e) that also weakens therespective bonds leading to stabilization of 46.88 kcalmol−1.We predicted onemore strong intramolecular hyper conjuga-tive interaction of C21–C22 from n1(C23) → 𝜋∗(C21–C22)which increases ED (0.18831 e) that weakens the respectivebonds leading to stabilization of 46.88 kcalmol−1, as wellas strong intramolecular hyper conjugative interaction ofC24–C25 from n1(C23) → 𝜋∗(C24–C25) which increasesED (0.46625 e) that weakens the respective bonds leadingto stabilization of 71.49 kcalmol−1. These interactions areobserved as an increase in electron density (ED) in C–Cantibonding orbitals that weakens the respective bonds.
14 International Journal of Spectroscopy
Table 6: Second-order perturbation theory analysis of Fock matrix in NBO basis.
Donor (𝑖) Type ED/e Acceptor (𝑗) Type ED/e 𝐸(2)a (kcalmol−1) 𝐸(𝑗) − 𝐸(𝑖)b (a.u) 𝐹(𝑖, 𝑗)
c (a.u)C1–C2 𝜋 1.68952 C3–C4 𝜋∗ 0.45595 25.08 0.26 0.075C1–C2 𝜋 1.68952 C5–C6 𝜋∗ 0.35531 15.88 0.28 0.060C1–C6 𝜎 1.63511 C9–C10 𝜎
∗ 0.34194 4.65 1.25 0.068C3–C4 𝜋 1.55498 C1–C2 𝜋
∗ 0.27464 13.45 0.29 0.058C3–C4 𝜋 1.55498 C5–C6 𝜋∗ 0.35531 25.35 0.28 0.077C3–C4 𝜋 1.55498 C13–N14 𝜋∗ 0.21940 23.30 0.25 0.072C5–C6 𝜋 1.65905 C1–C2 𝜋
∗ 0.27464 22.39 0.28 0.072C5–C6 𝜋 1.65905 C1–C2 𝜋∗ 0.45595 15.42 0.26 0.059C5–C6 𝜋 1.65905 C7–O8 𝜋∗ 0.28565 27.55 0.24 0.074C13–C14 𝜋 1.91336 C3–C4 𝜋
∗ 0.45595 6.89 0.94 0.023C13–C14 𝜋 1.91336 C15–C16 𝜋∗ 0.44368 9.43 0.37 0.058C15–C16 𝜋 1.96604 C13–N14 𝜋∗ 0.21940 11.21 0.24 0.049C15–C16 𝜋 1.96604 C17–C18 𝜋
∗ 0.46912 19.03 0.28 0.066C15–C16 𝜋 1.96604 C19–C20 𝜋∗ 0.32861 19.83 0.27 0.067C15–C16 𝜋 1.96604 C21–C22 𝜋∗ 0.18831 15.74 0.29 0.064C17–C18 𝜋 1.52506 C15–C16 𝜋∗ 0.44368 20.29 0.26 0.066C17–C18 𝜋 1.52506 C19–C20 𝜋
∗ 0.32861 19.87 0.26 0.066C17–C18 𝜋 1.52506 C24–C25 𝜋∗ 0.46625 19.54 0.27 0.065C17–C18 𝜋 1.52506 C26–C27 𝜋∗ 0.19336 14.49 0.28 0.061C19–C20 𝜋 1.68814 C15–C16 𝜋
∗ 0.44368 19.18 0.28 0.068C19–C20 𝜋 1.68814 C17–C18 𝜋∗ 0.46912 17.64 0.29 0.066C21–C22 𝜋 1.79067 C15–C16 𝜋∗ 0.44368 17.23 0.28 0.066C24–C25 𝜋 1.53004 C17–C18 𝜋
∗ 0.46912 20.01 0.27 0.065C24–C25 𝜋 1.53004 C26–C27 𝜋∗ 0.19336 14.62 0.27 0.061C26–C27 𝜋 1.79745 C17–C18 𝜋∗ 0.46912 14.32 0.29 0.062C26–C27 𝜋 1.79745 C24–C25 𝜋∗ 0.46625 14.02 0.30 0.062LP(2)O8 𝑛 1.86096 C6–C7 𝜎
∗ 0.05894 15.13 0.69 0.093LP(2)O8 𝑛 1.86096 C7–O9 𝜎∗ 0.10070 32.78 0.57 0.123LP(1)O9 𝑛 1.96939 C7–O8 𝜎∗ 0.01769 6.52 1.08 0.075LP(2)O9 𝑛 1.80240 C7–O8 𝜋
∗ 0.28565 46.67 0.30 0.108LP(2)O9 𝑛 1.80240 C7–O8 𝜋∗ 0.28565 46.67 0.30 0.108LP(1)O12 𝑛 1.97419 C3–C4 𝜎 0.04045 7.37 1.05 0.079LP(2)O12 𝑛 1.79696 C3–C4 𝜋
∗ 0.45595 37.12 0.31 0.102LP(1)N14 𝑛 1.84279 C3–C4 𝜎∗ 0.03276 10.67 0.74 0.082LP(1)C23 𝑛 0.99827 C21–C22 𝜋∗ 0.18831 48.68 0.14 0.097LP(1)C23 𝑛 0.99827 C24–C25 𝜋
∗ 0.46625 71.49 0.14 0.103LP(1)C23 𝑛 0.99827 C21–C22 𝜋
∗ 0.33071 68.23 0.13 0.104a𝐸(2) means stabilization energy.
bEnergy difference between the donor and acceptor NBO orbitals.c𝐹(𝑖, 𝑗) is the Fock matrix element between 𝑖 and 𝑗 NBO orbitals.
5. Conclusions
Using DFT/B3LYP/6-311++G(2d, 2p) level of theory adetailed study of molecular structure, NMR chemical shifts,electronic properties, MEP surface mapping, NBO analysis,and vibrational and PED analysis of the title compoundhas been investigated and reported. On comparison withexperimentally obtained parameters by one of coauthors ofthis paper we found that both of them are in agreementwith each other. HOMO-LUMO analysis of the title com-pound shows that the electron charge distribution is mainly
concentrated over the rings and there may be a chargetransfer through 𝜋 system which accounts for bioactivityof the molecule. The title compound has also large bandgap as reported in HOMO-LUMO analysis which accountsfor its future applications as a useful material in solar celldevices. Molecular electrostatic surface maps give an ideaabout the chemical reactivity of the title compound. Ouroverall simulated results for different molecular propertiesof the title compound are obtained for the first time and wehope that they are helpful in the synthesis and design of newapplications.
International Journal of Spectroscopy 15
Conflict of Interests
The authors declare that there is no conflict of interestsregarding the publication of this paper.
Acknowledgments
The authors thank Indian Institute of technology Mandifor providing the infrastructure required for computationalstudies as well MHRD scholarships. The authors also wantto thank Dr. C. P. Parameswaran for allowing them to usesome of the experimental data for comparisonwith simulatedresults along with useful and fruitful discussions for thecompletion of the paper.
References
[1] A. K. Gupta, A. Dhir, and C. P. Pradeep, “A fluorescence 'turn-on'chemodosimeter for selective detection of Nb5+ ions inmixed aqueous media,” Dalton Transactions, vol. 42, no. 36, pp.12819–12823, 2013.
[2] J. R. Lakowicz, Topics in Fluorescence Spectroscopy. Volume 4:Probe Design and Chemical Sensing, Plenum Press, New York,NY, USA, 1994.
[3] J. L. H. Lindenhovius, E. M. Hornsveld, A. den Ouden, W.A. J. Wessel, and H. H. J. ten Kate, “Powder-in-tube (PIT)Nb3Sn conductors for high-field magnets,” IEEE Transactionson Applied Superconductivity, vol. 10, no. 1, pp. 975–978, 2000.
[4] D. Touati, “Iron and oxidative stress in bacteria,” Archives ofBiochemistry and Biophysics, vol. 373, no. 1, pp. 1–6, 2000.
[5] B. Catikkas, E. Aktan, and Z. Seferoglu, “DFT, FT-Raman,FTIR, NMR, and UV-Vis studies of a hetarylazo indole dye,”International Journal of Quantum Chemistry, vol. 113, no. 5, pp.683–689, 2013.
[6] A. Raj, Y. Sheena Mary, C. Yohannan Panicker, H. T. Varghese,and K. Raju, “IR, Raman, SERS and computational study of 2-(benzylsulfanyl)-3,5-dinitrobenzoic acid,” Spectrochimica ActaA: Molecular and Biomolecular Spectroscopy, vol. 113, pp. 28–36,2013.
[7] V. Chis, S. Filip, V. Miclaus et al., “Vibrational spectroscopy andtheoretical studies on 2,4- dinitrophenylhydrazine,” Journal ofMolecular Structure, vol. 744–747, pp. 363–368, 2005.
[8] M. Kumru, V. Kucuk, and P. Akyurek, “Vibrational spectra ofquinoline-4-carbaldehyde: combined experimental and theo-retical studies,” Spectrochimica Acta A: Molecular and Bimolec-ular Spectroscopy, vol. 113, pp. 72–79, 2013.
[9] R. J. Xavier and P. Dinesh, “Conformational stability, vibra-tional spectra, HOMO-LUMO and NBO analysis of 1,3,4-thiadiazolidine-2,5-dithione with experimental (FT-IR and FT-Raman) techniques and scaled quantum mechanical calcu-lations,” Spectrochimica Acta A: Molecular and BiomolecularSpectroscopy, vol. 113, pp. 171–181, 2013.
[10] C. Lee, W. Yang, and R. G. Parr, “Development of the Colle-Salvetti correlation-energy formula into a functional of theelectron density,” Physical Review B, vol. 37, no. 2, pp. 785–789,1988.
[11] R. Dltchfield, “Molecular orbital theory of magnetic shieldingand magnetic susceptibility,” The Journal of Chemical Physics,vol. 56, no. 11, pp. 5688–5691, 1972.
[12] K.Wolinski, J. F.Hinton, andP. Pulay, “Efficient implementationof the gauge-independent atomic orbital method for NMR
chemical shift calculations,” Journal of the American ChemicalSociety, vol. 112, no. 23, pp. 8251–8260, 1990.
[13] E. D. Glendening and A. E. Reed, NBO Version 3.1, TCL,University of Wisconsin, Madison, Wis, USA, 1998.
[14] M. Izadyar andM. Khavani, “Quantum chemistry aspects of thesolvent effects on the ene reaction of 1-Phenyl-1,3,4-triazolin-2,5-dione and 2-methyl-2-butene,” International Journal ofQuantum Chemistry, vol. 114, no. 10, pp. 666–674, 2014.
[15] H. Pir, N. Gunay, O. Tamer, D. Avci, and Y. Atalay, “Theo-retical investigation of 5-(2-Acetoxyethyl)-6-methylpyrimidin-2,4-dione: Conformational study, NBO and NLO analysis,molecular structure and NMR spectra,” Spectrochimica Acta A:Molecular and Biomolecular Spectroscopy, vol. 112, pp. 331–342,2013.
[16] Diwaker, “Quantummechanical and spectroscopic (FT-IR, 13C,1H NMR and UV) investigations of 2-(5-(4-Chlorophenyl)-3-(pyridin-2-yl)-4,5-dihydropyrazol-1-yl)benzo[d]thiazoleby DFT method,” Spectrochimica Acta A: Molecular andBiomolecular Spectroscopy, vol. 128, pp. 819–829, 2014.
[17] J. Fleming, Frontier Orbitals and Organic Chemical Reactions,John Wiley and Sons, New York, NY, USA, 1981.
[18] R. G. Pearson, “Absolute electronegativity and hardness corre-lated with molecular orbital theory,” Proceedings of the NationalAcademy of Sciences, vol. 83, no. 22, pp. 8440–8441, 1986.
[19] P. Politzer, P. R. Laurence, and K. Jayasuriya, “Molecularelectrostatic potentials: an effective tool for the elucidation ofbiochemical phenomena,” Environmental Health Perspectives,vol. 61, pp. 191–202, 1985.
[20] A. Pullman, B. Pullman, and R. Lavery, “Molecular electrostaticpotential versus field. significance forDNAand its constituents,”Journal of Molecular Structure: THEOCHEM, vol. 93, pp. 85–91,1983.
[21] V. D. Vitnik, J. Z. Vitnik, N. R. Banjac, N. V. Valentic,G. S. Uscumlic, and I. O. Juranic, “Quantum mechanicaland spectroscopic (FT-IR, 13C, 1H NMR and UV) inves-tigations of potent antiepileptic drug 1-(4-chloro-phenyl)-3-phenyl-succinimide,” Spectrochimica Acta A: Molecular andBiomolecular Spectroscopy, vol. 117, pp. 42–53, 2014.
[22] B. Catıkkas, E. Aktan, and Z. Seferoglu, “DFT, FT-Raman,FTIR, NMR, and UV-Vis studies of a hetarylazo indole dye,”International Journal of Quantum Chemistry, vol. 113, no. 5, pp.683–689, 2013.
[23] M. H. Jamroz, J. C. Dobrowolski, and R. Brzozowski, “Vibra-tional modes of 2,6-, 2,7-, and 2,3-diisopropylnaphthalene. ADFT study,” Journal of Molecular Structure, vol. 787, no. 1–3, pp.172–183, 2006.
[24] Gaussian 09, “Gaussian,” Wallingford CT, 2004.[25] N.Gunay,H. Pir, D.Avci, andY.Atalay, “NLOandNBOanalysis
of Sarcosine-Maleic acid by using HF and B3LYP calculations,”Journal of Chemistry, vol. 2013, Article ID 712130, 16 pages, 2013.
[26] W. B. Person and J. H. Newton, “Dipolemoment derivatives andinfrared intensities. I. Polar tensors,” The Journal of ChemicalPhysics, vol. 61, no. 3, pp. 1040–1049, 1974.

Submit your manuscripts athttp://www.hindawi.com
Hindawi Publishing Corporationhttp://www.hindawi.com Volume 2014
Inorganic ChemistryInternational Journal of
Hindawi Publishing Corporation http://www.hindawi.com Volume 2014
International Journal ofPhotoenergy
Hindawi Publishing Corporationhttp://www.hindawi.com Volume 2014
Carbohydrate Chemistry
International Journal of
Hindawi Publishing Corporationhttp://www.hindawi.com Volume 2014
Journal of
Chemistry
Hindawi Publishing Corporationhttp://www.hindawi.com Volume 2014
Advances in
Physical Chemistry
Hindawi Publishing Corporationhttp://www.hindawi.com
Analytical Methods in Chemistry
Journal of
Volume 2014
Bioinorganic Chemistry and ApplicationsHindawi Publishing Corporationhttp://www.hindawi.com Volume 2014
SpectroscopyInternational Journal of
Hindawi Publishing Corporationhttp://www.hindawi.com Volume 2014
The Scientific World JournalHindawi Publishing Corporation http://www.hindawi.com Volume 2014
Medicinal ChemistryInternational Journal of
Hindawi Publishing Corporationhttp://www.hindawi.com Volume 2014
Chromatography Research International
Hindawi Publishing Corporationhttp://www.hindawi.com Volume 2014
Applied ChemistryJournal of
Hindawi Publishing Corporationhttp://www.hindawi.com Volume 2014
Hindawi Publishing Corporationhttp://www.hindawi.com Volume 2014
Theoretical ChemistryJournal of
Hindawi Publishing Corporationhttp://www.hindawi.com Volume 2014
Journal of
Spectroscopy
Hindawi Publishing Corporationhttp://www.hindawi.com
International Journal of
Analytical ChemistryVolume 2014
Journal of
Hindawi Publishing Corporationhttp://www.hindawi.com Volume 2014
Quantum Chemistry
Hindawi Publishing Corporationhttp://www.hindawi.com Volume 2014
Organic Chemistry International
Hindawi Publishing Corporationhttp://www.hindawi.com Volume 2014
CatalystsJournal of
ElectrochemistryInternational Journal of
Hindawi Publishing Corporation http://www.hindawi.com Volume 2014
Related Documents