Quantitative Proteomics Characterization of a Mouse Embryonic Stem Cell Model of Down Syndrome* □ S Yuqin Wang‡, Claire Mulligan§, Gareth Denyer¶, Frederic Delom§, Franca Dagna-Bricarelli, Victor L. J. Tybulewicz**, Elizabeth M. C. Fisher‡‡, William J. Griffiths‡, Dean Nizetic§, and Ju ¨ rgen Groet§ §§ Down syndrome, caused by the trisomy of chromosome 21, is a complex condition characterized by a number of phenotypic features, including reduced neuron number and synaptic plasticity, early Alzheimer disease-like neu- rodegeneration, craniofacial dysmorphia, heart develop- ment defects, increased incidence of childhood leukemia, and powerful suppression of the incidence of most solid tumors. Mouse models replicate a number of these phe- notypes. The Tc1 Down syndrome model was constructed by introducing a single supernumerary human chromo- some 21 into a mouse embryonic stem cell, and it repro- duces a large number of Down syndrome phenotypes including heart development defects. However, little is still known about the developmental onset of the trisomy 21-induced mechanisms behind these phenotypes or the proteins that are responsible for them. This study deter- mined the proteomic differences that are present in un- differentiated embryonic stem cells and are caused by an additional human chromosome 21. A total of 1661 pro- teins were identified using two-dimensional liquid chro- matography followed by tandem mass spectrometry from whole embryonic stem cell lysates. Using isobaric tags for relative and absolute quantification, we found 52 proteins that differed in expression by greater than two standard deviations from the mean when an extra hu- man chromosome 21 was present. Of these, at least 11 have a possible functional association with a Down syn- drome phenotype or a human chromosome 21-encoded gene. This study also showed that quantitative protein expression differences in embryonic stem cells can per- sist to adult mouse as well as reproduce in human Down syndrome fetal tissue. This indicates that changes that are determined in embryonic stem cells of Down syn- drome could potentially identify proteins that are in- volved in phenotypes of Down syndrome, and it shows that these cell lines can be used for the purpose of studying these pathomechanisms. Molecular & Cellu- lar Proteomics 8:585–595, 2009. Down syndrome (DS) 1 is caused by trisomy of human chro- mosome 21 (HSA21) and has an incidence of 1 in 650 live births (1). Mental retardation, smaller brain size, reduced num- bers of neurons, reduced dendritic spine density and plastic- ity, and early Alzheimer disease-like neurodegeneration are seen in all people with DS, and a plethora of other phenotypes have a variable expression (1, 2). These include phenotypes that are seen only in a subset of DS individuals, such as heart defects, duodenal stenosis, and childhood leukemia. Interest- ingly there is a lower incidence of most solid tumors in people with DS (3). Mouse models mimic some of the phenotypes seen in DS. TS65Dn, which contains 50% of the genes homologous for HSA21 in three copies, exhibits craniofacial skeletal malfor- mation (4) and reduced cerebellar volume and granular and Purkinje cell densities (5). TS65Dn also displays learning and behavioral deficits (6). Ts1Cje is trisomic for 2 /3 of the tripli- cated genes in TS65Dn and displays generally a similar but less severe phenotype than TS65Dn (7, 8). All the orthologous HSA21 genes that are trisomic in TS65Dn and Ts1Cje are From the ‡Institute of Mass-Spectrometry, School of Medicine, Swansea University, Singleton Park, Swansea SA2 8PP, United King- dom, §Centre for Haematology, Institute of Cell and Molecular Sci- ence, Barts and The London School of Medicine, Queen Mary Uni- versity of London, London E1 2AT, United Kingdom, ¶Department of Biochemistry, University of Sydney, Sydney, Australia, Human Ge- netics Institute, Galliera Hospital, 16128 Genoa, Italy, **Medical Re- search Council (MRC)-National Institute for Medical Research, Mill Hill, London NW7 1AA, United Kingdom, and ‡‡Department of Neu- rodegenerative Disease, Institute of Neurology, University College London, London WC1N 3BG, United Kingdom Received, June 9, 2008, and in revised form, October 30, 2008 Published, MCP Papers in Press, November 10, 2008, DOI 10.1074/mcp.M800256-MCP200 1 The abbreviations used are: DS, Down syndrome; HSA21, human chromosome 21; ES, embryonic stem; iTRAQ, isobaric tags for rela- tive and absolute quantification; 2D, two-dimensional; RP, reversed phase; DDA, data-dependent analysis; SCX, strong cation exchange; IPI, International Protein Index; ANOVA, analysis of variance; REST, RE1-silencing transcription factor; CTSB, cathepsin B; LRP, lipopro- tein receptor-related protein; GAPDH, glyceraldehyde-3-phosphate dehydrogenase; NFAT, nuclear factor of activated T-cells; ASS1, argininosuccinate synthetase 1; TAGLN, transgelin; GABPA, GA- binding protein transcription factor, alpha subunit 60 kDa; PFKL, phosphofructokinase liver; SMS, spermine synthase; CALR, calreti- culin; VIM, vimentin; MARCKS, myristoylated alanine-rich C-kinase substrate; PRKCSH, protein kinase C substrate 80K-H; CALU, calu- menin; PPIB, peptidylprolyl isomerase B. Research © 2009 by The American Society for Biochemistry and Molecular Biology, Inc. Molecular & Cellular Proteomics 8.4 585 This paper is available on line at http://www.mcponline.org

Welcome message from author
This document is posted to help you gain knowledge. Please leave a comment to let me know what you think about it! Share it to your friends and learn new things together.
Transcript
Quantitative Proteomics Characterization ofa Mouse Embryonic Stem Cell Model ofDown Syndrome*□S
Yuqin Wang‡, Claire Mulligan§, Gareth Denyer¶, Frederic Delom§,Franca Dagna-Bricarelli�, Victor L. J. Tybulewicz**, Elizabeth M. C. Fisher‡‡,William J. Griffiths‡, Dean Nizetic§, and Jurgen Groet§ §§
Down syndrome, caused by the trisomy of chromosome21, is a complex condition characterized by a number ofphenotypic features, including reduced neuron numberand synaptic plasticity, early Alzheimer disease-like neu-rodegeneration, craniofacial dysmorphia, heart develop-ment defects, increased incidence of childhood leukemia,and powerful suppression of the incidence of most solidtumors. Mouse models replicate a number of these phe-notypes. The Tc1 Down syndrome model was constructedby introducing a single supernumerary human chromo-some 21 into a mouse embryonic stem cell, and it repro-duces a large number of Down syndrome phenotypesincluding heart development defects. However, little isstill known about the developmental onset of the trisomy21-induced mechanisms behind these phenotypes or theproteins that are responsible for them. This study deter-mined the proteomic differences that are present in un-differentiated embryonic stem cells and are caused by anadditional human chromosome 21. A total of 1661 pro-teins were identified using two-dimensional liquid chro-matography followed by tandem mass spectrometry fromwhole embryonic stem cell lysates. Using isobaric tagsfor relative and absolute quantification, we found 52proteins that differed in expression by greater than twostandard deviations from the mean when an extra hu-man chromosome 21 was present. Of these, at least 11have a possible functional association with a Down syn-drome phenotype or a human chromosome 21-encodedgene. This study also showed that quantitative proteinexpression differences in embryonic stem cells can per-sist to adult mouse as well as reproduce in human Down
syndrome fetal tissue. This indicates that changes thatare determined in embryonic stem cells of Down syn-drome could potentially identify proteins that are in-volved in phenotypes of Down syndrome, and it showsthat these cell lines can be used for the purpose ofstudying these pathomechanisms. Molecular & Cellu-lar Proteomics 8:585–595, 2009.
Down syndrome (DS)1 is caused by trisomy of human chro-mosome 21 (HSA21) and has an incidence of 1 in 650 livebirths (1). Mental retardation, smaller brain size, reduced num-bers of neurons, reduced dendritic spine density and plastic-ity, and early Alzheimer disease-like neurodegeneration areseen in all people with DS, and a plethora of other phenotypeshave a variable expression (1, 2). These include phenotypesthat are seen only in a subset of DS individuals, such as heartdefects, duodenal stenosis, and childhood leukemia. Interest-ingly there is a lower incidence of most solid tumors in peoplewith DS (3).
Mouse models mimic some of the phenotypes seen in DS.TS65Dn, which contains �50% of the genes homologous forHSA21 in three copies, exhibits craniofacial skeletal malfor-mation (4) and reduced cerebellar volume and granular andPurkinje cell densities (5). TS65Dn also displays learning andbehavioral deficits (6). Ts1Cje is trisomic for �2⁄3 of the tripli-cated genes in TS65Dn and displays generally a similar butless severe phenotype than TS65Dn (7, 8). All the orthologousHSA21 genes that are trisomic in TS65Dn and Ts1Cje are
From the ‡Institute of Mass-Spectrometry, School of Medicine,Swansea University, Singleton Park, Swansea SA2 8PP, United King-dom, §Centre for Haematology, Institute of Cell and Molecular Sci-ence, Barts and The London School of Medicine, Queen Mary Uni-versity of London, London E1 2AT, United Kingdom, ¶Department ofBiochemistry, University of Sydney, Sydney, Australia, �Human Ge-netics Institute, Galliera Hospital, 16128 Genoa, Italy, **Medical Re-search Council (MRC)-National Institute for Medical Research, MillHill, London NW7 1AA, United Kingdom, and ‡‡Department of Neu-rodegenerative Disease, Institute of Neurology, University CollegeLondon, London WC1N 3BG, United Kingdom
Received, June 9, 2008, and in revised form, October 30, 2008Published, MCP Papers in Press, November 10, 2008, DOI
10.1074/mcp.M800256-MCP200
1 The abbreviations used are: DS, Down syndrome; HSA21, humanchromosome 21; ES, embryonic stem; iTRAQ, isobaric tags for rela-tive and absolute quantification; 2D, two-dimensional; RP, reversedphase; DDA, data-dependent analysis; SCX, strong cation exchange;IPI, International Protein Index; ANOVA, analysis of variance; REST,RE1-silencing transcription factor; CTSB, cathepsin B; LRP, lipopro-tein receptor-related protein; GAPDH, glyceraldehyde-3-phosphatedehydrogenase; NFAT, nuclear factor of activated T-cells; ASS1,argininosuccinate synthetase 1; TAGLN, transgelin; GABPA, GA-binding protein transcription factor, alpha subunit 60 kDa; PFKL,phosphofructokinase liver; SMS, spermine synthase; CALR, calreti-culin; VIM, vimentin; MARCKS, myristoylated alanine-rich C-kinasesubstrate; PRKCSH, protein kinase C substrate 80K-H; CALU, calu-menin; PPIB, peptidylprolyl isomerase B.
Research
© 2009 by The American Society for Biochemistry and Molecular Biology, Inc. Molecular & Cellular Proteomics 8.4 585This paper is available on line at http://www.mcponline.org

present on mouse chromosome 16. HSA21 also has substan-tial regions of synteny with the mouse chromosomes 10 and17, and it has therefore been difficult to engineer a mouse DSmodel that contains all orthologous HSA21 genes in threecopies. To get around this problem, a transgenic mouse wasderived that contains a freely segregating HSA21 (9); this isthe first mouse model with a freely segregating human chro-mosome. This mouse model for DS was derived from tran-schromosomic embryonic stem (ES) cells, which containHSA21 on a wild-type mouse ES cell background (10). TheTc1 mice contain �92% of the HSA21 genes and display anumber of DS phenotypes (heart defect, learning difficulties,and a reduced cerebellar neuron count) (9).
To date, not a great deal is known about the pathways thatare disturbed that lead to the characteristic phenotypes of DS.There have been a limited number of proteomics studies intothe aberrant expression of proteins caused by trisomy ofgenes on HSA21. These were mostly on fully differentiatedtissues from mice trisomic for a small number of genes orfrom people with DS (for instance, see Refs. 11 and 12) withonly one study analyzing an ES cell model in neuronal differ-entiation using two-dimensional (2D) gel electrophoresis (13).
Phenotypic features of DS are retained even in mosaic DSsubjects (14) and also in the Tc1 DS mouse model where adulttissues retain �56% trisomic cells (24–55%), having startedfrom a fully trisomic conceptus (9, 15). This implies that manyphenotypic features of DS are likely to be determined byevents occurring very early in development. Our study utilizedthe transchromosomic ES cell lines to determine proteomicdifferences caused by an additional HSA21 in undifferenti-ated, pluripotent mouse ES cells. The aim was to detectpathways/proteins that are perturbed very early in develop-ment and to determine whether changed protein expressioncan remain during development. The added value of thisapproach is that transchromosomic ES cells can be used forfurther manipulation, such as selective switching off of indi-vidual supernumerary HSA21 genes using human-specificsmall interfering RNA reagents. This can help in further ge-netic dissection of the individual HSA21 gene contributions tothe specific phenotypes of DS and open avenues for noveltherapeutic concepts.
EXPERIMENTAL PROCEDURES
Cell Lines and Tissues—The transchromosomic cell line 47-1, de-scribed in a previous publication (10), has been produced by taggingthe HSA21 with a neomycin resistance marker and introducing thetagged chromosome into a mouse embryonic stem cell line, D3, usingmicrocell-mediated chromosome transfer. ES cells were grown on alayer of mitotically inactivated mouse embryonic fibroblasts (feedercells) in medium supplemented with leukemia-inhibitory factor (Milli-pore, Watford, UK). ES medium contained Dulbecco’s modified Ea-gle’s medium, 15% FCS, 25,000 units of penicillin/streptomycin, L-glutamine, non-essential amino acids, �-mercaptoethanol, and 5 �105 units/ml leukemia-inhibitory factor. 47-1 ES cells were also grownin the presence of G418 (500 �g/ml) until one passage before theywere lysed. During this last passage the G418 was removed so that
the 47-1 and D3 cells had identical culturing conditions. Additionallyfeeders were removed one passage before lysis. We found thatproliferation indexes of 47-1 and D3 grown under these conditionswere similar (16). The WA17 mouse-human hybrid cell line, whichcontained two to three copies of HSA21, was derived from a fusion ofmouse A9 cells and human WI-38 fibroblasts (17). They were pas-saged every 3 days at 3 � 103 cells/cm2 in Dulbecco’s modifiedEagle’s medium and 10% FCS and grown under 5% CO2 at 37 °C.Both the source of HSA21 and the mouse parental cell line aregenotypically different from the 47-1/D3 system. Tc1 mice, back-crossed to C57BL/6 (Tc1 two to three times), were maintained at theNational Institute for Medical Research in accordance with HomeOffice regulations (9). Consented terminated human fetal tissue wascollected by the Galliera Hospital’s Tissue Bank and the MRC-FetalTissue Bank. All archived material was consented for use in research,and the project is covered by ethical approval from the North EastLondon Health Authority.
PCR Analysis—DNA was isolated for analysis using GenElute(Sigma). Analysis of the presence of HSA21 in 47-1 (supplemental Fig.1A) was carried out as follows. Primer sequences were: USP25-F,AGTAGCGAAACAGTGCATTAC; USP25-R, GATGAGGTCACACCT-GAATAG; MIR155b-F, TACTATATGCTGTCACTCCAG; MIR155b-R,AGGTTGAACATCCCAGTGAC; RUNX-F, AAGATGAAACGTGGA-GAAATAG; RUNX-R, CTGGACATCACCCACGAGTG; D21S212-F,CATTTTAATGAACACCGCTC; and D21S212-R, GGCCTCCTG-GAATAATTCTC. The program used was: 95 °C for 1.5 min; 95 °C for30 s, 57 °C for 30 s, and 72 °C for 30 s for 35 cycles; and 72 °C for 9.5min. D21S212 annealing temperature was 53 °C. For analysis of theretention of HSA21 (supplemental Fig. 1B), primer sequences were:16.6Mb-F, ACCGTGCAAACAGTCTAGAC; and 16.6Mb-R, GCTTAC-CTCTTTGCAGCCTC. Forward primer contained a 5� FAM label. Theprogram used was: 95 °C for 7.5 min; 95 °C for 30 s, 58 °C for 30 s,and 72 °C for 30 s for 28 cycles; and 72 °C for 9.5 min. 1 �l of PCRproduct was mixed with 10 �l of formamide and 0.4 �l of ROX350 sizestandards (both from Applied Biosystems, Warrington, UK), dena-tured, and analyzed using a 3130XL automated sequencer accordingto the manufacturer’s instructions (Applied Biosystems). For quanti-tative RT-PCR, RNA from D3 and 47-1 cells was extracted using anRNeasy Plus Mini kit (Qiagen, Crawley, UK). Quantitative RT-PCR wascarried out using an Applied Biosystems 7700 Sequence Detectorv1.7 and SYBR green or TaqMan PCR mixture according to themanufacturer’s protocol (Applied Biosystems). All transcripts weremeasured in duplicate against standard curves relative to Gapdh.Primer sequences for quantitative RT-PCR were: Cse1l-F, CATGA-GTTCAAGTCAAATGAGC; Cse1l-R, CATTTGCATGGGTACTGCAC;SerpinH1-F, TGCAGTCCATCAACGAGTG; and SerpinH1-R, CTTGT-GGTGAAACTTCTCATC.
Labeling—Lysis of 47-1 and D3 was performed as described pre-viously (18), and 100 �g of total protein (per cell line) was trypticallydigested and labeled with isobaric tags for relative and absolutequantification (iTRAQ) reagent 114 (D3 or 47-1) and 117 (47-1 or D3,respectively) according to the manufacturer’s recommendation (Ap-plied Biosystems). The labeled peptides were mixed and diluted10-fold with 0.1% formic acid.
2D LC—The first dimension of off-line 2D LC was performed usinga Dionex UltiMate 3000 LC system (Camberley, Surrey, UK). 200 �gof total digest was injected onto a strong cation exchange (SCX)column (150 � 1 (inner diameter) mm, 5-�m PolySULFOETHYL A,PolyLC, Columbia, MD). The gradient used was 0–500 mM NH4Cl in2% acetonitrile, and 15 fractions were manually collected. Each frac-tion was then desalted on a C-18 spin column (Pierce, Perbio, Cram-lington, UK) and reconstituted in 25 �l of 0.1% formic acid, and 5-�laliquots were injected repeatedly onto the reversed phase (RP) nano-column. For off-line 2D LC the subsequent RP separation was per-
Quantitative Proteomics in Down Syndrome ES Cells
586 Molecular & Cellular Proteomics 8.4
formed using a Micromass CapLC system (Waters, Elstree, UK) withsample loading onto a trap column (5 � 0.3 mm, 5-�m PepMap C18
guard column, Dionex) at a flow rate of 15 �l/min delivered isocrati-cally with solvent C (0.1% formic acid) by auxiliary pump C. Samplewas washed on the trap column for 5 min with solvent C before beingswitched in line with the RP nanocolumn (150 � 0.075 (inner diame-ter) mm, 3-�m C18, Dionex), which was equilibrated with 95% solventA (0.1% formic acid in 5% acetonitrile), 5% solvent B (0.1% formicacid in 95% acetonitrile) at a flow rate of �200 nl/min. 5 min aftersample loading the proportion of solvent B was increased linearly to28% over 75 min and then to 80% over 20 min, maintained at 80%solvent B for 15 min (wash phase), and then re-equilibrated at 95%solvent A, 5% solvent B for 10 min. The column effluent was contin-uously directed into the electrospray ionization source of a Micro-mass Q-TOF Global mass spectrometer. Four repeat injections weremade per SCX fraction, and analysis was performed over successivem/z ranges (19).
Mass Spectrometry—The Q-TOF Global mass spectrometer wasoperated in the positive ion electrospray mode using data-dependentanalysis (DDA) for the identification and quantification of peptides.DDA uses an initial “survey scan” that identifies the four most abun-dant multiply charged ions (tryptic peptides usually appear as 2�and/or 3� ions), which are then fragmented by MS/MS, which pro-vides amino acid sequence information, before another survey scan isperformed, and the cycle is repeated throughout the chromato-graphic run. DDA analysis was performed using a 0.5-s MS surveyscan (m/z range, 420–1000 or e.g. 420–600, 600–700, 700–800, or800–1000) followed by 1-s MS/MS scans (0.1-s interscan time) on upto four different precursor ions (intensity threshold, 10 counts/s). Inthe DDA mode, MS/MS spectrum acquisition (in the m/z range 50–1800) was allowed for up to a total of 2.2 s on each precursor ion orstopped when the signal intensity fell below 3 counts/s, and a new MSto MS/MS cycle was started. Precursors were excluded from anyfurther MS/MS fragmentation for 45 s (retention time) to minimizerepeated identification of the same peptide; singly charged ions werealso excluded as precursors for MS/MS.
Protein Identification—Each raw data file was first processed byMassLynx 4.1. The parameters for creating pkl files were as follows:spectrum selection criteria: combine sequential scans with sameprecursor and process all combined scans; mass measure: smoothwindow, three channels; number of smooths, 2; smooth mode,Savitzky-Golay; centroid: minimum peak width at half-height, 4; cen-troid mode, centroid top 80%. Peptide and protein identificationswere performed using the Mascot search engine (version 2.2, MatrixScience, London, UK) located on a local server. Database searchingwas restricted to tryptic peptides of mouse or human proteins usingthe IPI mouse database (July 7, 2007, 56,450 entries) or IPI humandatabase (July 7, 2007, 67,922 entries). The IPI database provides aminimally redundant, yet maximally complete set of proteins for thefeatured species (one sequence per transcript). Methionine oxidationand N-terminal acetylation of protein were selected as variable modifi-cations, and cysteine blocked with methyl methanethiosulfonate andiTRAQ 114–117 were selected as fixed modifications at the peptide Nterminus and side chain of lysine; one missed cleavage was allowed.Precursor and MS/MS tolerances were �0.3 Da (monoisotopic mass).
The level of confidence for peptide identifications was based on theMascot assignment of “identity” (p � 0.05). Protein identificationswere only made when two or more peptides from that protein wereidentified with Mascot scores above the identity threshold. In caseswhere the identified protein was a member of a multiprotein familywith similar sequences, the protein identified was the one with thehighest number of matched peptides and Mascot score. To assessthe false positive peptide identification rate, the data were searchedas above but against a randomized version of the IPI database.
Protein Quantification—Quantification was first performed usingMascot 2.2. Using the Mascot quantification method, protein quanti-fication was only performed on proteins identified by two or morepeptides with scores above the identity threshold. Protein ratios(47-1/D3) were the “average.” iTRAQ ratios were normalized where acorrection factor is applied such that the median for that ratio for allpeptide matches in the data set would be unity. The global mean andS.D. of protein ratios (47-1/D3) were calculated for each replicate. Thecutoff points for protein differential expression were mean � 2 S.D.(95% confidence interval). Protein differential expression was alsoassessed at the peptide level. All peptides (with scores above theidentity threshold; approximately 16,000 in experiment 1 and 12,000in experiment 2) were used to calculate global mean and S.D. ofpeptide ratios (47-1/D3). The differentially expressed peptides (cutoffpoints for peptide differential expression were mean � 2 S.D.) wereused to infer differentially expressed proteins.
Western Blotting—Western blotting was performed according toLaemmli (20) using 12% polyacrylamide gels and 50 �g of totalprotein/lane. The SERPINH1 (ab13510, 1:500), CSE1L (ab27518,1:1000), ANXA5 (ab14196, 1:500), and TAGLN (ab14106, 1:500) an-tibodies were purchased from Abcam (Cambridge, UK); the �-actinantibody was from Sigma (A5316, 1:20,000); the GAPDH antibody(39-8600) was from Invitrogen; and the secondary antibodies (554002and 554021, 1:5000) were from BD Biosciences. The ECL kit wasfrom Pierce (Perbio).
Analysis of Transcriptome Data—Data from a previous study(MIAMExpress database, number E-MEXP-654) were imported intoGenespring v6.1 (SiliconGenetics), normalized to the 50th percen-tile of each array, and normalized to the median for each probe set.The data were then filtered for removal of all probe sets that werecalled present in fewer than four samples and those that changedfewer than two times between the two cell lines. ANOVA wasapplied to the remaining probe sets (p � 0.05). Additionally a t testwas conducted on the data from the four 47-1/D3 pairs. All geneswhere the differential expression was p � 0.05 are shown (in gray)in Table II.
RESULTS
iTRAQ Comparative Proteomics in Mouse ES Cells withTrisomy 21—Mouse embryonic stem cells containing an in-tact HSA21 (47-1) and parental cells (D3) were grown asindicated. DNA was isolated, and four loci specific for HSA21were only PCR-amplified from 47-1 (supplemental Fig. 1A).The number of cells in the 47-1 population that retainedHSA21 was between 85 and 90% (supplemental Fig. 1B).
In experiment 1, 100 �g of total protein lysate (from 47-1and D3) was labeled with either the iTRAQ 117 label (47-1) orthe 114 label (D3). These were mixed after which an off-lineseparation on an SCX column was performed. With an in-creasing salt concentration 15 fractions were collected. Thesewere subsequently individually injected for RP LC-MS/MS.Every fraction was injected four times to identify peptides inthe following mass windows: m/z range 420–600, 600–700,700–800, and 800–1000. The data generated by the individ-ual injections were merged and analyzed by Mascot. A total of1445 proteins were detected with at least two peptides aboveidentity threshold and a false discovery rate of 0.9% (supple-mental Table 1). A subsequent experiment (experiment 2) wasperformed in which the labeling of the samples was reversed(47-1, iTRAQ 114; D3, iTRAQ 117). This time 1103 proteins
Quantitative Proteomics in Down Syndrome ES Cells
Molecular & Cellular Proteomics 8.4 587
were detected with a false discovery rate of 0.6% (supple-mental Table 1). 80.4% of these proteins were also detectedin the first experiment. The total number of unique proteinsidentified in both experiments was 1661.
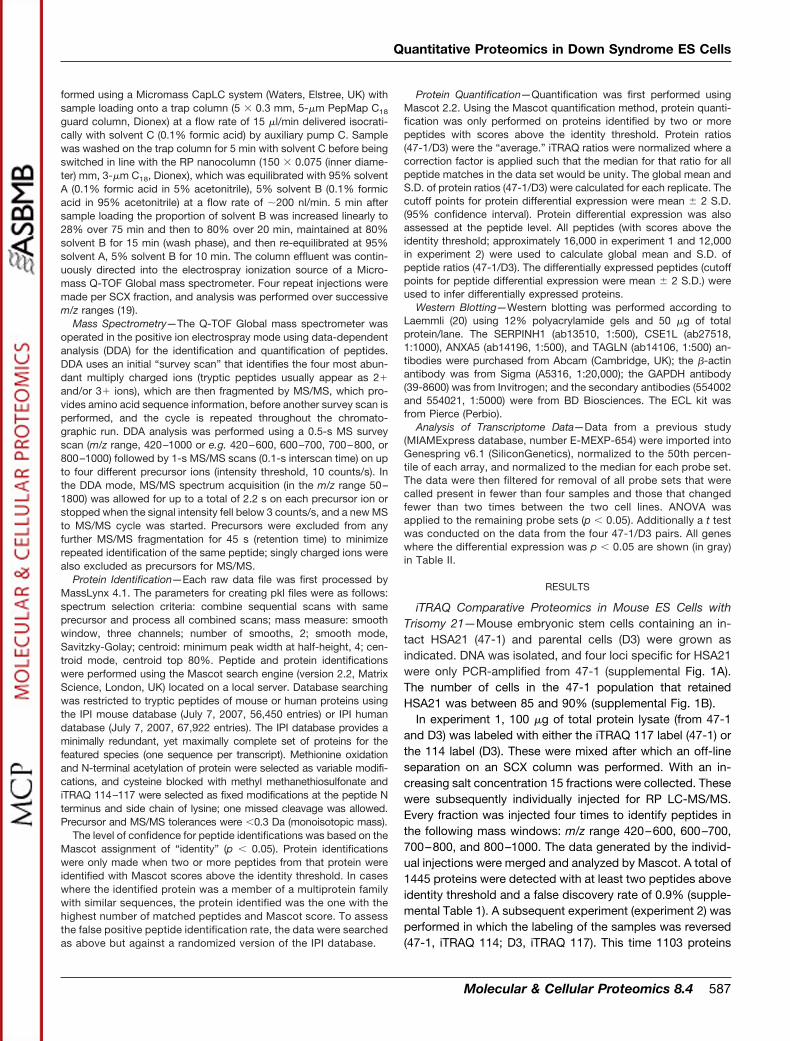
A comparison with a recent study, which identified 5111proteins in undifferentiated mouse ES cells using stable iso-tope labeling by amino acids in cell culture and a more sen-sitive detection system, revealed that 93% of the 1661 pro-teins detected in our study were also found in this morein-depth study (21). An older study that determined 1790proteins in E14 ES cells using anion column separation (22)showed a 48% overlap with our study. However, when pro-teins from both studies are analyzed according to functionalcategory (23) very similar outcomes can be seen (Fig. 1). Bothof these studies used ES cell lines different from our startingcell line D3. Taken together, these in silico comparisons withpublished data provide a solid quality control for the accuracyof detection of the true proteome expression of an undiffer-entiated mouse ES cell in our raw data.
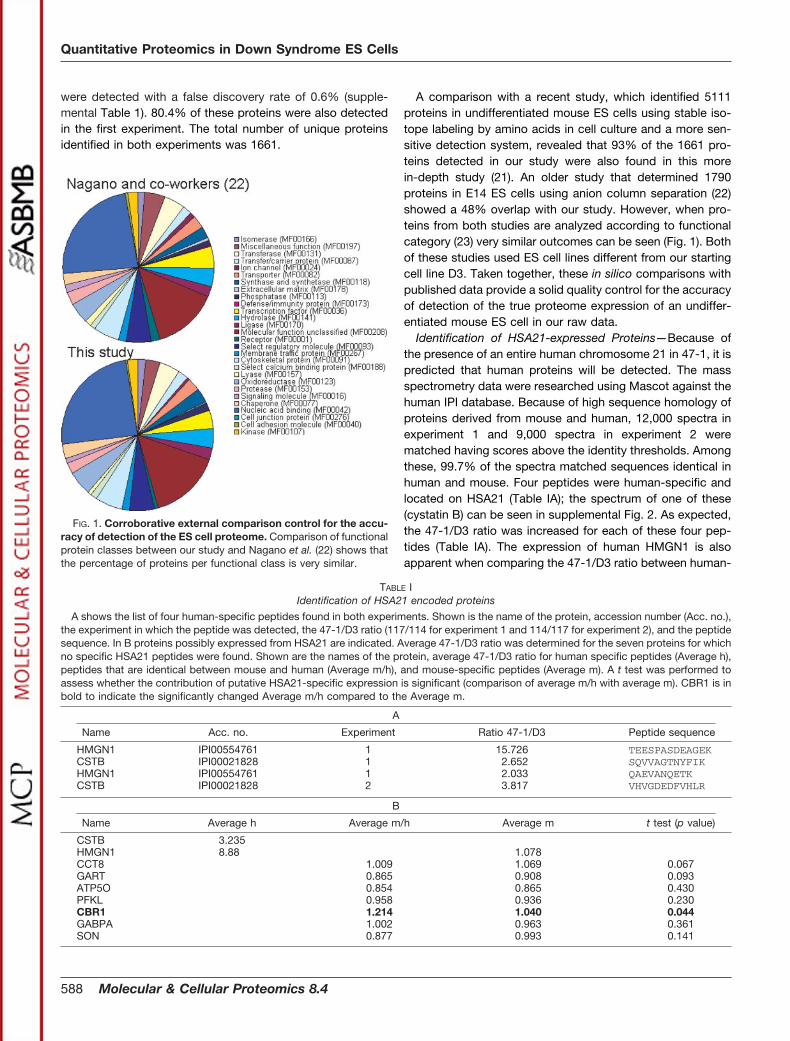
Identification of HSA21-expressed Proteins—Because ofthe presence of an entire human chromosome 21 in 47-1, it ispredicted that human proteins will be detected. The massspectrometry data were researched using Mascot against thehuman IPI database. Because of high sequence homology ofproteins derived from mouse and human, 12,000 spectra inexperiment 1 and 9,000 spectra in experiment 2 werematched having scores above the identity thresholds. Amongthese, 99.7% of the spectra matched sequences identical inhuman and mouse. Four peptides were human-specific andlocated on HSA21 (Table IA); the spectrum of one of these(cystatin B) can be seen in supplemental Fig. 2. As expected,the 47-1/D3 ratio was increased for each of these four pep-tides (Table IA). The expression of human HMGN1 is alsoapparent when comparing the 47-1/D3 ratio between human-
FIG. 1. Corroborative external comparison control for the accu-racy of detection of the ES cell proteome. Comparison of functionalprotein classes between our study and Nagano et al. (22) shows thatthe percentage of proteins per functional class is very similar.
TABLE IIdentification of HSA21 encoded proteins
A shows the list of four human-specific peptides found in both experiments. Shown is the name of the protein, accession number (Acc. no.),the experiment in which the peptide was detected, the 47-1/D3 ratio (117/114 for experiment 1 and 114/117 for experiment 2), and the peptidesequence. In B proteins possibly expressed from HSA21 are indicated. Average 47-1/D3 ratio was determined for the seven proteins for whichno specific HSA21 peptides were found. Shown are the names of the protein, average 47-1/D3 ratio for human specific peptides (Average h),peptides that are identical between mouse and human (Average m/h), and mouse-specific peptides (Average m). A t test was performed toassess whether the contribution of putative HSA21-specific expression is significant (comparison of average m/h with average m). CBR1 is inbold to indicate the significantly changed Average m/h compared to the Average m.
A
Name Acc. no. Experiment Ratio 47-1/D3 Peptide sequence
HMGN1 IPI00554761 1 15.726 TEESPASDEAGEKCSTB IPI00021828 1 2.652 SQVVAGTNYFIKHMGN1 IPI00554761 1 2.033 QAEVANQETKCSTB IPI00021828 2 3.817 VHVGDEDFVHLR
B
Name Average h Average m/h Average m t test (p value)
CSTB 3.235HMGN1 8.88 1.078CCT8 1.009 1.069 0.067GART 0.865 0.908 0.093ATP5O 0.854 0.865 0.430PFKL 0.958 0.936 0.230CBR1 1.214 1.040 0.044GABPA 1.002 0.963 0.361SON 0.877 0.993 0.141
Quantitative Proteomics in Down Syndrome ES Cells
588 Molecular & Cellular Proteomics 8.4

and mouse-specific peptides (Table IB; 8.9 versus 1.1,respectively).
A list containing the IPI accession numbers of all HSA21-coded proteins was generated, and this was compared withthe IPI accession numbers that were generated in the Mascotsearch against the human IPI database. Seven other proteinspotentially expressed from HSA21 were detected (GABPA,CCT8, GART, SON, ATP5O, CBR1, and PFKL). No HSA21-specific peptides were detected in these proteins. However,comparison of 47-1/D3 ratios between human/mouse andmouse-specific peptides revealed a significant increase inexpression of human/mouse peptides compared with mouse-specific peptides in CBR1 (Table IB). This suggests contribu-tion of expression from HSA21 of CBR1.
Identification of Mouse Proteins with Altered ExpressionLevels in Trisomy 21—The Mascot data also included the114/117 ratios for expression from the 47-1 and D3 cell lines.This was used to assess the proteins with an altered expres-sion because of an additional copy of HSA21. The data wereassessed in the following two ways. (i) The average proteinratio from the Mascot analysis was used. Proteins whose114/117 ratios differed by more than two standard deviationsfrom the mean were regarded as differentially expressed.These values were �0.77 or �1.30 for experiment 1 and�0.81 or �1.25 for experiment 2. Proteins that met thesecriteria in at least one of the two experiments are shown inTable II (114/117 and 117/114 ratios in gray). (ii) All peptides(�16,000 in experiment 1 and 12,000 in experiment 2) wereused to calculate the mean 114/117 ratio, and again ratiosthat differ by more than two standard deviations from themean were regarded as different. Fig. 2 shows the ratios of allpeptides as well as the confidence intervals (0.68�, �1.47 forexperiment 1 and 0.72�, �1.40 for experiment 2). Additionallythis figure shows all peptides that identify CSE1L and SER-PINH1 (Fig. 2); these two proteins were validated by furtherexperiments (see further results below). Multiple peptides forthese two validated proteins fell inside the 95% confidenceinterval (Fig. 2); this probably means that there is more pros-pect for extracting further differing proteins from the data byrelaxing the 95% confidence interval criterion. As this is likelyto lead to an increase of false positives in the detection, theconfidence interval was left at 95% for this study. Proteinswith peptides outside the 95% confidence interval are shownwith gray accession numbers in Table II.
Twenty-one proteins were found to have a changed expres-sion where the protein ratio was significantly changed in bothexperiments (Table IIA). Significant changes are indicated ingray in Table II (gray 117/114 and 114/117 ratios indicatesignificant protein changes, and the gray accession numbersindicate significant peptide changes). Twenty-one proteinshad a protein ratio that was significantly changed in at leastone of the two experiments (Table IIB); the other experimentalways showed a change in the same direction that nearedsignificance (for example, LRPAP1 protein ratio, 1.28 in ex-
periment 1 and 1.38 in experiment 2 where �1.30 and �1.25,respectively, indicates significance). Eight proteins were onlysignificantly changed when considering peptide ratios (TableIIC), although the respective protein ratios neared significance(supplemental Table 1). For example, MYBBP1A (Table IIC),for which peptide ratios reached significance, showed a pro-tein ratio of 0.79 (experiment 1) and 0.82 (experiment 2) justinside the 95% confidence interval (�0.77 for experiment 1and �0.81 for experiment 2). Additionally Table IIC containstwo proteins with a limited number of peptides with a sug-gestion that expression was changed in 47-1 compared withD3 (cathepsin B (CTSB) and UHRF1). There were seven in-stances among the 52 proteins in Table II where at least oneof the protein ratios was significantly changed, but the pep-tide ratios were not. However, on closer examination of indi-vidual peptide ratios we found that they were changed for allseven proteins in the same direction as the protein ratios, justnarrowly missing the statistical significance thresholds (notshown).
Considering all data in Table II, a total of 15 proteins weredown-regulated, and 37 showed higher expression in 47-1compared with D3. Table II also shows data from a globaltranscriptome analysis of the same cell lines for the tran-scripts encoding the detected proteins in which four inde-pendent pairs of 47-1/D3 were compared on Affymetrix MG-U74Av2 mouse arrays (24). Ten of the 52 proteins with analtered expression in 47-1 (Table II) were not represented onthe mouse arrays (either not present or expressed at insuffi-cient levels to be detected by the arrays). Of the remaining 42genes, 14 showed a statistically significant expression dif-ference when analyzed by ANOVA at p � 0.05 (see “Exper-imental Procedures”) (only two were predicted to be foundby chance). When a t test (p � 0.05) was performed on thefour 47-1/D3 pairs, 22 of 42 proteins had matching tran-script changes that reached significance (including the 14significant changes identified with ANOVA). These are indi-cated in gray in Table II (transcriptome column). Compari-son of these 22 transcript changes with the proteomics datareveals that 19 change in the same direction (six lower and13 higher expression in 47-1). Intriguingly three proteinsshowed opposite transcriptome expression ratios (UHRF1,TXN1, and TPT1).
Validation of Altered Expression Levels by Western Blot-ting—The different expression profiles were validated byWestern blotting for four proteins. Exportin-2/CSE1L is pre-dicted to be a protein that is involved in nuclear export (25)and also in apoptosis (26). SERPINH1 (HSP47/CBP2) is aprotein with a classical serpin motif, which functions as acollagen binding factor/chaperonin in the endoplasmic retic-ulum (27). ANXA5 forms the voltage-dependent Ca2� chan-nels in phospholipid bilayers and has also been described asan anticoagulant (28, 29). TAGLN is an actin cross-linkingprotein initially described in fibroblasts and smooth musclecells (30). CSE1L has a lower expression in 47-1; SERPINH1,
Quantitative Proteomics in Down Syndrome ES Cells
Molecular & Cellular Proteomics 8.4 589
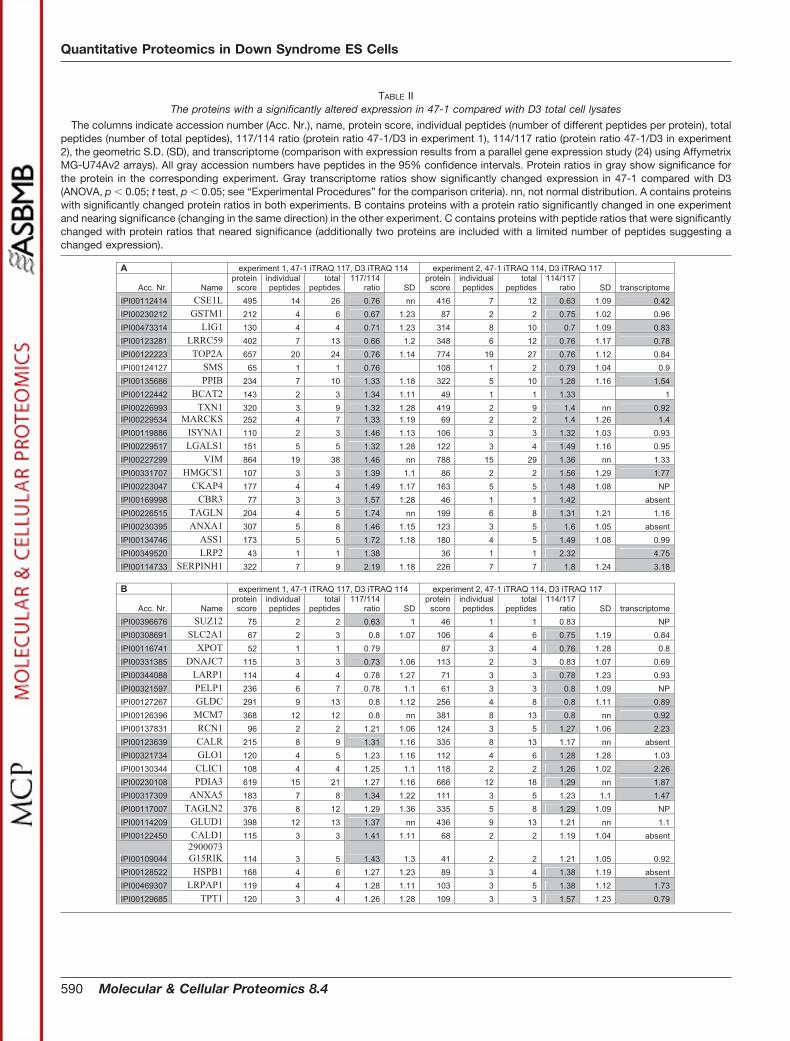
TABLE IIThe proteins with a significantly altered expression in 47-1 compared with D3 total cell lysates
The columns indicate accession number (Acc. Nr.), name, protein score, individual peptides (number of different peptides per protein), totalpeptides (number of total peptides), 117/114 ratio (protein ratio 47-1/D3 in experiment 1), 114/117 ratio (protein ratio 47-1/D3 in experiment2), the geometric S.D. (SD), and transcriptome (comparison with expression results from a parallel gene expression study (24) using AffymetrixMG-U74Av2 arrays). All gray accession numbers have peptides in the 95% confidence intervals. Protein ratios in gray show significance forthe protein in the corresponding experiment. Gray transcriptome ratios show significantly changed expression in 47-1 compared with D3(ANOVA, p � 0.05; t test, p � 0.05; see “Experimental Procedures” for the comparison criteria). nn, not normal distribution. A contains proteinswith significantly changed protein ratios in both experiments. B contains proteins with a protein ratio significantly changed in one experimentand nearing significance (changing in the same direction) in the other experiment. C contains proteins with peptide ratios that were significantlychanged with protein ratios that neared significance (additionally two proteins are included with a limited number of peptides suggesting achanged expression).
A experiment 1, 47-1 iTRAQ 117, D3 iTRAQ 114 experiment 2, 47-1 iTRAQ 114, D3 iTRAQ 117
Acc. Nr. Name protein
score individual peptides
total peptides
117/114 ratio SD
protein score
individual peptides
total peptides
114/117 ratio SD transcriptome
IPI00112414 CSE1L 495 14 26 0.76 nn 416 7 12 0.63 1.09 0.42 IPI00230212 GSTM1 212 4 6 0.67 1.23 87 2 2 0.75 1.02 0.96 IPI00473314 LIG1 130 4 4 0.71 1.23 314 8 10 0.7 1.09 0.83 IPI00123281 LRRC59 402 7 13 0.66 1.2 348 6 12 0.76 1.17 0.78 IPI00122223 TOP2A 657 20 24 0.76 1.14 774 19 27 0.76 1.12 0.84 IPI00124127 SMS 65 1 1 0.76 108 1 2 0.79 1.04 0.9 IPI00135686 PPIB 234 7 10 1.33 1.18 322 5 10 1.28 1.16 1.54 IPI00122442 BCAT2 143 2 3 1.34 1.11 49 1 1 1.33 1 IPI00226993 TXN1 320 3 9 1.32 1.28 419 2 9 1.4 nn 0.92 IPI00229534 MARCKS 252 4 7 1.33 1.19 69 2 2 1.4 1.26 1.4 IPI00119886 ISYNA1 110 2 3 1.46 1.13 106 3 3 1.32 1.03 0.93 IPI00229517 LGALS1 151 5 5 1.32 1.28 122 3 4 1.49 1.16 0.95 IPI00227299 VIM 864 19 38 1.46 nn 788 15 29 1.36 nn 1.33 IPI00331707 HMGCS1 107 3 3 1.39 1.1 86 2 2 1.56 1.29 1.77 IPI00223047 CKAP4 177 4 4 1.49 1.17 163 5 5 1.48 1.08 NP IPI00169998 CBR3 77 3 3 1.57 1.28 46 1 1 1.42 absent IPI00226515 TAGLN 204 4 5 1.74 nn 199 6 8 1.31 1.21 1.16 IPI00230395 ANXA1 307 5 8 1.46 1.15 123 3 5 1.6 1.05 absent IPI00134746 ASS1 173 5 5 1.72 1.18 180 4 5 1.49 1.08 0.99 IPI00349520 LRP2 43 1 1 1.38 36 1 1 2.32 4.75 IPI00114733 SERPINH1 322 7 9 2.19 1.18 226 7 7 1.8 1.24 3.18
B experiment 1, 47-1 iTRAQ 117, D3 iTRAQ 114 experiment 2, 47-1 iTRAQ 114, D3 iTRAQ 117
Acc. Nr. Name protein
score individual peptides
total peptides
117/114 ratio SD
protein score
individual peptides
total peptides
114/117 ratio SD transcriptome
IPI00396676 SUZ12 75 2 2 0.63 1 46 1 1 0.83 NP IPI00308691 SLC2A1 67 2 3 0.8 1.07 106 4 6 0.75 1.19 0.84 IPI00116741 XPOT 52 1 1 0.79 87 3 4 0.76 1.28 0.8 IPI00331385 DNAJC7 115 3 3 0.73 1.06 113 2 3 0.83 1.07 0.69 IPI00344088 LARP1 114 4 4 0.78 1.27 71 3 3 0.78 1.23 0.93 IPI00321597 PELP1 236 6 7 0.78 1.1 61 3 3 0.8 1.09 NP IPI00127267 GLDC 291 9 13 0.8 1.12 256 4 8 0.8 1.11 0.89 IPI00126396 MCM7 368 12 12 0.8 nn 381 8 13 0.8 nn 0.92 IPI00137831 RCN1 96 2 2 1.21 1.06 124 3 5 1.27 1.06 2.23 IPI00123639 CALR 215 8 9 1.31 1.16 335 8 13 1.17 nn absent IPI00321734 GLO1 120 4 5 1.23 1.16 112 4 6 1.28 1.28 1.03 IPI00130344 CLIC1 108 4 4 1.25 1.1 118 2 2 1.26 1.02 2.26 IPI00230108 PDIA3 619 15 21 1.27 1.16 666 12 18 1.29 nn 1.87 IPI00317309 ANXA5 183 7 8 1.34 1.22 111 3 5 1.23 1.1 1.47 IPI00117007 TAGLN2 376 8 12 1.29 1.36 335 5 8 1.29 1.09 NP IPI00114209 GLUD1 398 12 13 1.37 nn 436 9 13 1.21 nn 1.1 IPI00122450 CALD1 115 3 3 1.41 1.11 68 2 2 1.19 1.04 absent
IPI001090442900073 G15RIK 114 3 5 1.43 1.3 41 2 2 1.21 1.05 0.92
IPI00128522 HSPB1 168 4 6 1.27 1.23 89 3 4 1.38 1.19 absent IPI00469307 LRPAP1 119 4 4 1.28 1.11 103 3 5 1.38 1.12 1.73 IPI00129685 TPT1 120 3 4 1.26 1.28 109 3 3 1.57 1.23 0.79
Quantitative Proteomics in Down Syndrome ES Cells
590 Molecular & Cellular Proteomics 8.4
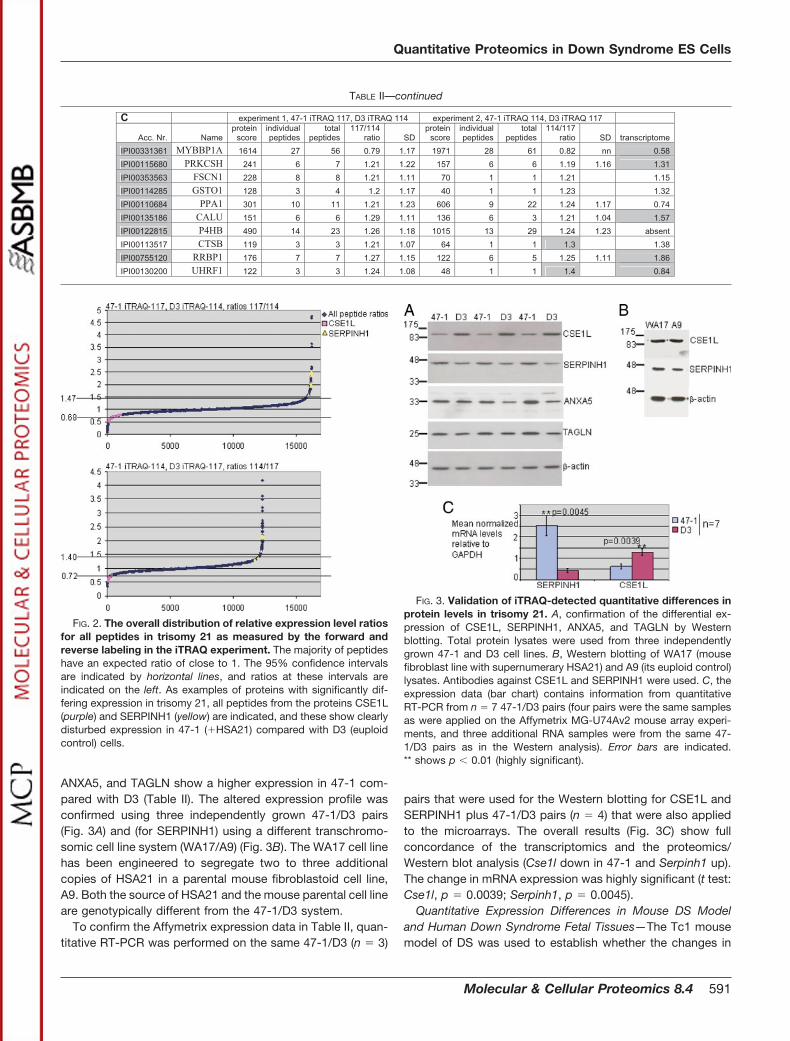
ANXA5, and TAGLN show a higher expression in 47-1 com-pared with D3 (Table II). The altered expression profile wasconfirmed using three independently grown 47-1/D3 pairs(Fig. 3A) and (for SERPINH1) using a different transchromo-somic cell line system (WA17/A9) (Fig. 3B). The WA17 cell linehas been engineered to segregate two to three additionalcopies of HSA21 in a parental mouse fibroblastoid cell line,A9. Both the source of HSA21 and the mouse parental cell lineare genotypically different from the 47-1/D3 system.
To confirm the Affymetrix expression data in Table II, quan-titative RT-PCR was performed on the same 47-1/D3 (n � 3)
pairs that were used for the Western blotting for CSE1L andSERPINH1 plus 47-1/D3 pairs (n � 4) that were also appliedto the microarrays. The overall results (Fig. 3C) show fullconcordance of the transcriptomics and the proteomics/Western blot analysis (Cse1l down in 47-1 and Serpinh1 up).The change in mRNA expression was highly significant (t test:Cse1l, p � 0.0039; Serpinh1, p � 0.0045).
Quantitative Expression Differences in Mouse DS Modeland Human Down Syndrome Fetal Tissues—The Tc1 mousemodel of DS was used to establish whether the changes in
FIG. 2. The overall distribution of relative expression level ratiosfor all peptides in trisomy 21 as measured by the forward andreverse labeling in the iTRAQ experiment. The majority of peptideshave an expected ratio of close to 1. The 95% confidence intervalsare indicated by horizontal lines, and ratios at these intervals areindicated on the left. As examples of proteins with significantly dif-fering expression in trisomy 21, all peptides from the proteins CSE1L(purple) and SERPINH1 (yellow) are indicated, and these show clearlydisturbed expression in 47-1 (�HSA21) compared with D3 (euploidcontrol) cells.
FIG. 3. Validation of iTRAQ-detected quantitative differences inprotein levels in trisomy 21. A, confirmation of the differential ex-pression of CSE1L, SERPINH1, ANXA5, and TAGLN by Westernblotting. Total protein lysates were used from three independentlygrown 47-1 and D3 cell lines. B, Western blotting of WA17 (mousefibroblast line with supernumerary HSA21) and A9 (its euploid control)lysates. Antibodies against CSE1L and SERPINH1 were used. C, theexpression data (bar chart) contains information from quantitativeRT-PCR from n � 7 47-1/D3 pairs (four pairs were the same samplesas were applied on the Affymetrix MG-U74Av2 mouse array experi-ments, and three additional RNA samples were from the same 47-1/D3 pairs as in the Western analysis). Error bars are indicated.** shows p � 0.01 (highly significant).
TABLE II—continued
C experiment 1, 47-1 iTRAQ 117, D3 iTRAQ 114 experiment 2, 47-1 iTRAQ 114, D3 iTRAQ 117
Acc. Nr. Name protein
score individual peptides
total peptides
117/114 ratio SD
protein score
individual peptides
total peptides
114/117 ratio SD transcriptome
IPI00331361 MYBBP1A 1614 27 56 0.79 1.17 1971 28 61 0.82 nn 0.58 IPI00115680 PRKCSH 241 6 7 1.21 1.22 157 6 6 1.19 1.16 1.31 IPI00353563 FSCN1 228 8 8 1.21 1.11 70 1 1 1.21 1.15 IPI00114285 GSTO1 128 3 4 1.2 1.17 40 1 1 1.23 1.32 IPI00110684 PPA1 301 10 11 1.21 1.23 606 9 22 1.24 1.17 0.74 IPI00135186 CALU 151 6 6 1.29 1.11 136 6 3 1.21 1.04 1.57 IPI00122815 P4HB 490 14 23 1.26 1.18 1015 13 29 1.24 1.23 absent IPI00113517 CTSB 119 3 3 1.21 1.07 64 1 1 1.3 1.38 IPI00755120 RRBP1 176 7 7 1.27 1.15 122 6 5 1.25 1.11 1.86 IPI00130200 UHRF1 122 3 3 1.24 1.08 48 1 1 1.4 0.84
Quantitative Proteomics in Down Syndrome ES Cells
Molecular & Cellular Proteomics 8.4 591

protein expression of CSE1L, SERPINH1, ANXA5, and TAGLNthat can be seen in the mouse DS ES cells are also detectablein the transgenic animals. The Tc1 mice were generated froma mouse ES cell, 91-1, which contains a different clone intro-duced in a different parental mouse ES cell line comparedwith 47-1. The mouse displays a number of DS phenotypesthat it shares with other DS mouse models. It contains �90%of the HSA21 genes on a mouse background (9). Total lysateswere prepared from adult liver, kidney, testis, and heart fromTc1 mice and non-transgenic litter mates. Western blots wereprepared and hybridized with CSE1L, SERPINH1, ANXA5,and TAGLN antibodies. CSE1L was expressed in testis andvery slightly in liver and kidney. There was no difference inexpression between Tc1 and littermates in testis (Fig. 4A).Although the expression in kidney of CSE1L was low, a dif-ference could be detected (see the panel in different contrastin Fig. 4A). The expression in kidney was higher in non-transgenic littermates; this is in full agreement with the resultsin ES cells (Table II). SERPINH1 showed increased expressionin all tested Tc1 tissues (Fig. 4A). A second experiment whereliver, kidney, and testis lysates from a different Tc1/non-transgenic litter mate were tested for SERPINH1 expressiongave an identical result (not shown). This is also in full agree-ment with the results in ES cells (Table II and Fig. 3). ANXA5showed higher expression in Tc1 transgenics in testis (con-cordant with the ES cell results) and was unchanged in kidney
and heart. Paradoxically a lower expression of ANXA5 wasdetected in liver in the transgenic animals. This was also thecase for TAGLN in kidney. No expression of TAGLN wasdetected in testis and heart. In liver a very weak but un-changed expression pattern was seen (Fig. 4A).
Total protein lysates were generated from four DS and threenormal, aged-matched, fetal kidneys. Western blots were pre-pared and hybridized with SERPINH1 antibody. This resultalso showed an increased expression of SERPINH1 in the fourDS samples compared with the three normal samples (Fig.4B). No difference in expression was detected in CSE1L,ANXA5, and TAGLN in DS fetal kidney compared with aged-matched control (not shown). Taken together, the ability toreproduce some of the significant differences in the WA17/A9transchromosomic cell line system, the Tc1 mouse model,and human fetal tissues argues against cell line/clone-specificor heterospecific artifacts being the cause of the quantitativeproteomic differences observed.
DISCUSSION
We present a quantitative proteomics comparison (usingiTRAQ) between a mouse embryonic stem cell line containingan additional HSA21 and the wild-type cell line from which itwas derived. Comparison with a published study on system-atic identification of proteins in mouse embryonic stem cells(22) showed that 48% of the proteins were shared by ouridentification procedure. The reason that this is not higher isprobably because of a difference in the starting ES cell line(E14 versus D3) as well as differences in fractionation anddetection of the peptides (cation versus anion column sepa-ration). However, classifying the proteins from both studiesaccording to functional category (23) showed a very similaroverall picture (Fig. 1). A proportion of 93% of the list ofproteins detected in our study was also detected in a recent,in-depth analysis of mouse ES cell lines (21). The nearlycomplete overlap with this study (93%) allows us to estimatethat the overall sensitivity of detection in our system is of theorder of 33% (1661 in our study versus 5111 in the study byGraumann et al. (21)) of all proteins with detectable expres-sion in undifferentiated mouse ES cells.
With the extra HSA21, it is expected that human peptidesare present in 47-1, and indeed four human specific peptideswere found (from CSTB and HMGN1; Table IA). The increasedratio (higher expression in 47-1) and the fact that a mouse-specific HMGN1 peptide had a ratio that was not increased in47-1 (ratio, 1.1; Table IB) indicate that the overexpression ofthese proteins was caused by the expression from HSA21. Wedid not find any human-specific peptides in seven other proteinsthat were detected and are present on HSA21 (Table IB). How-ever, comparison of the ratio of peptides identical in human andmouse with mouse-specific peptides revealed that CBR1 had astatistically significant increase in the former. This suggestsexpression from HSA21. We did not find a difference in the othersix proteins despite the fact that specific widespread HSA21
FIG. 4. Analysis of the relative levels of selected iTRAQ-differingproteins in tissues from adult DS model mice and human fetal DStissue. A, Western blot showing total protein lysate from liver, kidney,testis, and heart from transchromosomic Tc1 (1) and normal littermatecontrols (2). The blot is stained with CSE1L, SERPINH1, ANXA5,TAGLN, and �-actin/GAPDH antibodies. The boxed area in the CSE1Lblot is shown to the right in different contrast. B, Western blot show-ing total protein lysate from human fetal kidneys from DS (four differ-ent fetuses) (lanes 1) and from fetal age-matched euploid control(three different fetuses) (lanes 2). The blot is stained with SERPINH1and �-actin.
Quantitative Proteomics in Down Syndrome ES Cells
592 Molecular & Cellular Proteomics 8.4
expression in transchromosomic ES cells has been demon-strated at the transcript level (9, 10, 24). This suggests thatadditional post-transcriptional regulatory mechanisms affect theexpression of some proteins from HSA21. It is also highly prob-able that the expression of a number of HSA21-encoded pro-teins was below the detection limit in our study.
Fifty-two non-HSA21 proteins were detected with signifi-cantly altered levels in the presence of the supernumeraryHSA21. Of these, 21 had a protein ratio significantly changedin both experiments (Table IIA), another 21 proteins had aprotein ratio significantly changed in one experiment andnearing significance (changing in the same direction) in theother experiment (Table IIB), whereas eight proteins had onlypeptide ratios reaching the significance threshold (Table IIC).The list of proteins in Table IIA is probably the least likely toinclude false-positive changes, and this likelihood theoreti-cally increases for Table IIB and further for Table IIC. Inter-estingly, however, the comparison with the transcriptomicsdata found 22 of 42 detected transcripts significantly changed(gray in the “transcriptome” column in Table II), and the dis-tribution of these is very similar between Table II, A, B, and C,increasing the probability for validity of the detected proteinchanges.
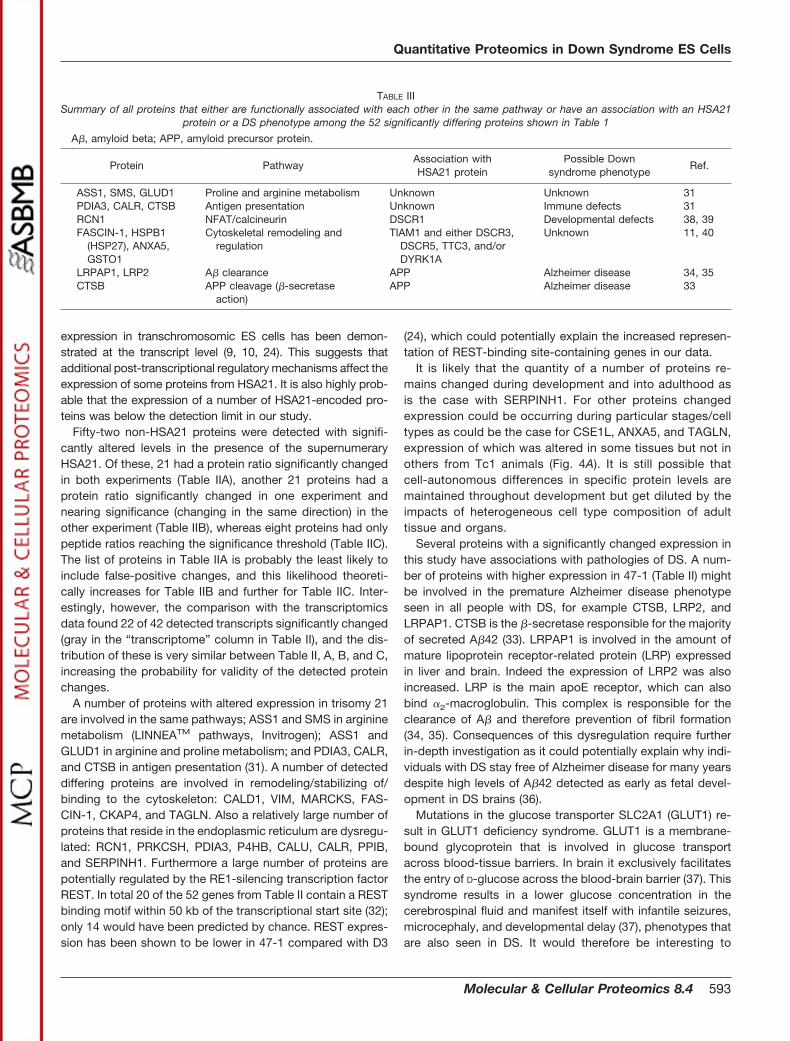
A number of proteins with altered expression in trisomy 21are involved in the same pathways; ASS1 and SMS in argininemetabolism (LINNEATM pathways, Invitrogen); ASS1 andGLUD1 in arginine and proline metabolism; and PDIA3, CALR,and CTSB in antigen presentation (31). A number of detecteddiffering proteins are involved in remodeling/stabilizing of/binding to the cytoskeleton: CALD1, VIM, MARCKS, FAS-CIN-1, CKAP4, and TAGLN. Also a relatively large number ofproteins that reside in the endoplasmic reticulum are dysregu-lated: RCN1, PRKCSH, PDIA3, P4HB, CALU, CALR, PPIB,and SERPINH1. Furthermore a large number of proteins arepotentially regulated by the RE1-silencing transcription factorREST. In total 20 of the 52 genes from Table II contain a RESTbinding motif within 50 kb of the transcriptional start site (32);only 14 would have been predicted by chance. REST expres-sion has been shown to be lower in 47-1 compared with D3
(24), which could potentially explain the increased represen-tation of REST-binding site-containing genes in our data.
It is likely that the quantity of a number of proteins re-mains changed during development and into adulthood asis the case with SERPINH1. For other proteins changedexpression could be occurring during particular stages/celltypes as could be the case for CSE1L, ANXA5, and TAGLN,expression of which was altered in some tissues but not inothers from Tc1 animals (Fig. 4A). It is still possible thatcell-autonomous differences in specific protein levels aremaintained throughout development but get diluted by theimpacts of heterogeneous cell type composition of adulttissue and organs.
Several proteins with a significantly changed expression inthis study have associations with pathologies of DS. A num-ber of proteins with higher expression in 47-1 (Table II) mightbe involved in the premature Alzheimer disease phenotypeseen in all people with DS, for example CTSB, LRP2, andLRPAP1. CTSB is the �-secretase responsible for the majorityof secreted A�42 (33). LRPAP1 is involved in the amount ofmature lipoprotein receptor-related protein (LRP) expressedin liver and brain. Indeed the expression of LRP2 was alsoincreased. LRP is the main apoE receptor, which can alsobind �2-macroglobulin. This complex is responsible for theclearance of A� and therefore prevention of fibril formation(34, 35). Consequences of this dysregulation require furtherin-depth investigation as it could potentially explain why indi-viduals with DS stay free of Alzheimer disease for many yearsdespite high levels of A�42 detected as early as fetal devel-opment in DS brains (36).
Mutations in the glucose transporter SLC2A1 (GLUT1) re-sult in GLUT1 deficiency syndrome. GLUT1 is a membrane-bound glycoprotein that is involved in glucose transportacross blood-tissue barriers. In brain it exclusively facilitatesthe entry of D-glucose across the blood-brain barrier (37). Thissyndrome results in a lower glucose concentration in thecerebrospinal fluid and manifest itself with infantile seizures,microcephaly, and developmental delay (37), phenotypes thatare also seen in DS. It would therefore be interesting to
TABLE IIISummary of all proteins that either are functionally associated with each other in the same pathway or have an association with an HSA21
protein or a DS phenotype among the 52 significantly differing proteins shown in Table 1
A�, amyloid beta; APP, amyloid precursor protein.
Protein PathwayAssociation withHSA21 protein
Possible Downsyndrome phenotype
Ref.
ASS1, SMS, GLUD1 Proline and arginine metabolism Unknown Unknown 31PDIA3, CALR, CTSB Antigen presentation Unknown Immune defects 31RCN1 NFAT/calcineurin DSCR1 Developmental defects 38, 39FASCIN-1, HSPB1
(HSP27), ANXA5,GSTO1
Cytoskeletal remodeling andregulation
TIAM1 and either DSCR3,DSCR5, TTC3, and/orDYRK1A
Unknown 11, 40
LRPAP1, LRP2 A� clearance APP Alzheimer disease 34, 35CTSB APP cleavage (�-secretase
action)APP Alzheimer disease 33
Quantitative Proteomics in Down Syndrome ES Cells
Molecular & Cellular Proteomics 8.4 593

measure glucose levels in cerebrospinal fluid in peoplewith DS.
A number of differing proteins have known functional asso-ciations with human chromosome 21 gene products. RCN1has been shown to regulate calcineurin either as inhibitor oractivator (38). Calcineurin is part of the same Ca2�-dependentregulatory circuit as calcipressin, the product of the HSA21gene DSCR1. The actions of the HSA21 genes DSCR1 andDYRK1A cause the dysregulation of the calcineurin/NFATpathway implicated in the pathogenesis of some of the de-velopmental phenotypes seen in DS (39). The results offersome other suggestions of HSA21 genes that might be re-sponsible for some of the proteome changes. Overexpressionof TIAM1, a guanine nucleotide exchange factor that activatesRAC, in a colorectal cancer cell line resulted in perturbedexpression of 11 proteins in a proteomics experiment (40).Eight proteins in that study had increased expression, andfour of these were also increased in our study (FASCIN-1,HSPB1 (HSP27), ANXA5, and GSTO1). It is highly likely thatthis is not a coincidence but caused by trisomy of TIAM1. Atransgenic mouse containing an integrated human yeast arti-ficial chromosome (152F7) also showed an increased pro-teomic expression of FASCIN-1 (11). This yeast artificial chro-mosome contains the genes DSCR3, DSCR5, TTC3, andDYRK1A, and one of these genes could therefore also beresponsible for the FASCIN-1 overexpression. Table III sum-marizes, among the 52 significantly differing proteins, all pro-teins that either are functionally associated with each other inthe same pathway or have an association with an HSA21protein or a DS phenotype.
Identification of the proteins that are involved in pheno-types of DS is clearly not a trivial undertaking. By studyingundifferentiated DS ES cells it is possible to detect proteinswith altered expression very early in development. The in-volvement of the detected proteins in DS phenotypes canbe assessed by careful analysis of the affected cell types inDS mouse models. Furthermore our findings can assist indetermining the effects of overexpression of (individual)HSA21 genes under physiological conditions on the wholeproteome. The added value of this approach is that tran-schromosomic ES cells can be used for further manipula-tion, such as selective switching off of individual supernu-merary HSA21 genes, using human-specific smallinterfering RNA reagents (24). This can help in further ge-netic dissection of the individual HSA21 gene contributionsto the specific phenotypes of DS and open avenues fornovel therapeutic concepts.
Acknowledgments—We thank Chiara Baldo (Galliera Hospital) andthe MRC-Fetal Tissue Bank for the human tissue material.
* This work was supported by Barts and The London CharitableFoundation Grant RAC405, the AnEUploidy grant from FrameworkProgramme 6 from the European Union Commission, Specialist Pro-gramme Grant 06003 from the Leukemia Research Fund-UK, Bio-
technology and Biological Sciences Research Council Grants BB/C515771/1 and BB/C511356/1, and grants from the MedicalResearch Council-UK and The Wellcome Trust.
□S The on-line version of this article (available at http://www.mcponline.org) contains supplemental material.
§§ To whom correspondence should be addressed. Tel.: 41-207-8822271; Fax: 41-207-88222183; E-mail: [email protected].
REFERENCES
1. Epstein, C. (2001) The Metabolic and Molecular Bases of Inherited Disease,pp. 1223–1256, McGraw-Hill, New York
2. Antonarakis, S. E., Lyle, R., Dermitzakis, E. T., Reymond, A., and Deutsch,S. (2004) Chromosome 21 and Down syndrome: from genomics topathophysiology. Nat. Rev. Genet. 5, 725–738
3. Yang, Q., Rasmussen, S. A., and Friedman, J. M. (2002) Mortality associ-ated with Down’s syndrome in the U. S. A. from 1983 to 1997: a popu-lation-based study. Lancet 359, 1019–1025
4. Richtsmeier, J. T., Baxter, L. L., and Reeves, R. H. (2000) Parallels ofcraniofacial maldevelopment in Down syndrome and Ts65Dn mice. Dev.Dyn. 217, 137–145
5. Baxter, L. L., Moran, T. H., Richtsmeier, J. T., Troncoso, J., and Reeves,R. H. (2000) Discovery and genetic localization of Down syndrome cer-ebellar phenotypes using the Ts65Dn mouse. Hum. Mol. Genet. 9,195–202
6. Reeves, R. H., Irving, N. G., Moran, T. H., Wohn, A., Kitt, C., Sisodia, S. S.,Schmidt, C., Bronson, R. T., and Davisson, M. T. (1995) A mouse modelfor Down syndrome exhibits learning and behaviour deficits. Nat. Genet.11, 177–184
7. Sago, H., Carlson, E. J., Smith, D. J., Kilbridge, J., Rubin, E. M., Mobley,W. C., Epstein, C. J., and Huang, T. T. (1998) Ts1Cje, a partial trisomy 16mouse model for Down syndrome, exhibits learning and behavioral ab-normalities. Proc. Natl. Acad. Sci. U. S. A. 95, 6256–6261
8. Richtsmeier, J. T., Zumwalt, A., Carlson, E. J., Epstein, C. J., and Reeves,R. H. (2002) Craniofacial phenotypes in segmentally trisomic mousemodels for Down syndrome. Am. J. Med. Genet. 107, 317–324
9. O’Doherty, A., Ruf, S., Mulligan, C., Hildreth, V., Errington, M. L., Cooke, S.,Sesay, A., Modino, S., Vanes, L., Hernandez, D., Linehan, J. M., Sharpe,P. T., Brandner, S., Bliss, T. V., Henderson, D. J., Nizetic, D., Tybulewicz,V. L., and Fisher, E. M. (2005) An aneuploid mouse strain carrying humanchromosome 21 with Down syndrome phenotypes. Science 309,2033–2037
10. Hernandez, D., Mee, P. J., Martin, J. E., Tybulewicz, V. L., and Fisher, E. M.(1999) Transchromosomal mouse embryonic stem cell lines and chimericmice that contain freely segregating segments of human chromosome21. Hum. Mol. Genet. 8, 923–933
11. Shin, J. H., Guedj, F., Delabar, J. M., and Lubec, G. (2007) Dysregulation ofgrowth factor receptor-bound protein 2 and fascin in hippocampus ofmice polytransgenic for chromosome 21 structures. Hippocampus 17,1180–1192
12. Bajo, M., Fruehauf, J., Kim, S. H., Fountoulakis, M., and Lubec, G. (2002)Proteomic evaluation of intermediary metabolism enzyme proteins infetal Down’s syndrome cerebral cortex. Proteomics 2, 1539–1546
13. Kadota, M. Nishigaki, R., Wang, C. C., Toda, T., Shirayoshi, Y., Inoue, T.,Gojobori, T., Ikeo, K., Rogers, M. S., and Oshimura, M. (2004) Proteomicsignatures and aberrations of mouse embryonic stem cells containing asingle human chromosome 21 in neuronal differentiation: an in vitromodel of Down syndrome. Neuroscience 129, 325–335
14. Hassold, T., and Hunt, P. (2001) To err (meiotically) is human: the genesisof human aneuploidy. Nat. Rev. Genet. 2, 280–291
15. Shinohara, T., Tomizuka, K., Miyabara, S., Takehara, S., Kazuki, Y., Inoue,J., Katoh, M., Nakane, H., Iino, A., Ohguma, A., Ikegami, S., Inokuchi, K.,Ishida, I., Reeves, R. H., and Oshimura, M. (2001) Mice containing ahuman chromosome 21 model behavioral impairment and cardiac anom-alies of Down’s syndrome. Hum. Mol. Genet. 10, 1163–1175
16. Mensah, A., Mulligan, C., Linehan, J., Ruf, S., O’Doherty, A., Grygalewicz,B., Shipley, J., Groet, J., Tybulewicz, V., Fisher, E., Brandner, S., andNizetic, D. (2007) An additional human chromosome 21 causes suppres-sion of neural fate of pluripotent mouse embryonic stem cells in ateratoma model. BMC Dev. Biol. 7, 131
17. Raziuddin, A., Sarkar, F. H., Dutkowski, R., Shulman, L., Ruddle, F. H., and
Quantitative Proteomics in Down Syndrome ES Cells
594 Molecular & Cellular Proteomics 8.4
Gupta, S. L. (1984) Receptors for human � and � interferon but not for �
interferon are specified by human chromosome 21. Proc. Natl. Acad. Sci.U. S. A. 81, 5504–5508
18. Unwin, R. D., Pierce, A., Watson, R. B., Sternberg, D. W., and Whetton,A. D. (2005) Quantitative proteomic analysis using isobaric protein tagsenables rapid comparison of changes in transcript and protein levels intransformed cells. Mol. Cell. Proteomics 4, 924–935
19. Wang, Y., Muneton, S., Sjovall, J., Jovanovic, J. N., and Griffiths, W. J.(2008) The effect of 24S-hydroxycholesterol on cholesterol homeostasisin neurons: quantitative changes to the cortical neuron proteome. J.Proteome Res. 7, 1606–1614
20. Laemmli, U. K. (1970) Cleavage of structural proteins during the assemblyof the head of bacteriophage T4. Nature 227, 680–685
21. Graumann, J., Hubner, N. C., Kim, J. B., Ko, K., Moser, M., Kumar, C., Cox,J., Scholer, H., and Mann, M. (2008) Stable isotope labeling by aminoacids in cell culture (SILAC) and proteome quantitation of mouse embry-onic stem cells to a depth of 5,111 proteins. Mol. Cell. Proteomics 7,672–683
22. Nagano, K., Taoka, M., Yamauchi, Y., Itagaki, C., Shinkawa, T., Nunomura,K., Okamura, N., Takahashi, N., Izumi, T., and Isobe, T. (2005) Large-scale identification of proteins expressed in mouse embryonic stemcells. Proteomics 5, 1346–1361
23. Thomas, P. D., Campbell, M. J., Kejariwal, A., Mi, H., Karlak, B., Daverman,R., Diemer, K., Muruganujan, A., and Narechania, A (2003) PANTHER: alibrary of protein families and subfamilies indexed by function. GenomeRes. 13, 2129–2141
24. Canzonetta, C., Mulligan, C., Deutsch, S., Ruf, S., O’Doherty, A., Lyle, R.,Borel, C., Lin-Marq, N., Delom, F., Groet, J., Schnappauf, F., De Vita, S.,Averill, S., Priestley, J. V., Martin, J. E., Shipley, J., Denyer, G., Epstein,C. J., Fillat, C., Estivill, X., Tybulewicz, V. L., Fisher, E. M., Antonarakis,S. E., and Nizetic, D. (2008) DYRK1A-dosage imbalance perturbs NRSF/REST levels, deregulating pluripotency and embryonic stem cell fate inDown syndrome. Am. J. Hum. Genet. 83, 388–400
25. Kutay, U., Bischoff, F. R., Kostka, S., Kraft, R., and Gorlich, D. (1997) Exportof importin � from the nucleus is mediated by a specific nuclear transportfactor. Cell 90, 1061–1071
26. Brinkmann, U., Brinkmann, E., Gallo, M., and Pastan, I. (1995) Cloning andcharacterization of a cellular apoptosis susceptibility gene, the humanhomologue to the yeast chromosome segregation gene CSE1. Proc.Natl. Acad. Sci. U. S. A. 92, 10427–10431
27. Ikegawa, S., Sudo, K., Okui, K., and Nakamura, Y. (1995) Isolation, char-acterization and chromosomal assignment of human colligin-2 gene(CBP2). Cytogenet. Cell Genet. 71, 182–186
28. Grundmann, U., Abel, K. J., Bohn, H., Lobermann, H., Lottspeich, F., andKupper, H. (1988) Characterization of cDNA encoding human placental
anticoagulant protein (PP4): homology with the lipocortin family. Proc.Natl. Acad. Sci. U. S. A. 85, 3708–3712
29. Demange, P., Voges, D., Benz, J., Liemann, S., Gottig, P., Berendes, R.,Burger, A., and Huber, R. (1994) Annexin V: the key to understanding ionselectivity and voltage regulation? Trends Biochem. Sci. 19, 272–276
30. Shapland, C., Hsuan, J. J., Totty, N. F., and Lawson, D. (1993) Purificationand properties of transgelin: a transformation and shape change sensi-tive actin-gelling protein. J. Cell Biol. 121, 1065–1073
31. Kanehisa, M., Araki, M., Goto, S., Hattori, M., Hirakawa, M., Itoh, M.,Katayama, T., Kawashima, S., Okuda, S., Tokimatsu, T., and Yamanishi,Y. (2008) KEGG for linking genomes to life and the environment. NucleicAcids Res. 36, D480–D484
32. Otto, S. J., McCorkle, S. R., Hover, J., Conaco, C., Han, J. J., Impey, S.,Yochum, G. S., Dunn, J. J., Goodman, R. H., and Mandel, G. (2007) Anew binding motif for the transcriptional repressor REST uncovers largegene networks devoted to neuronal functions. J. Neurosci. 27,6729–6739
33. Hook, V. Y. (2006) Protease pathways in peptide neurotransmission andneurodegenerative diseases. Cell. Mol. Neurobiol. 26, 449–469
34. Sanchez, L., Alvarez, V., Gonzalez, P., Gonzalez, I., Alvarez, R., and Coto,E. (2001) Variation in the LRP-associated protein gene (LRPAP1) isassociated with late-onset Alzheimer disease. Am. J. Med. Genet. 105,76–78
35. Nistor, M., Don, M., Parekh, M., Sarsoza, F., Goodus, M., Lopez, G. E.,Kawas, C., Leverenz, J., Doran, E., Lott, I. T., Hill, M., and Head, E. (2007)�- and �-secretase activity as a function of age and �-amyloid in Downsyndrome and normal brain. Neurobiol. Aging 28, 1493–1506
36. Teller, J. K., Russo, C., DeBusk, L. M., Angelini, G., Zaccheo, D., Dagna-Bricarelli, F., Scartezzini, P., Bertolini, S., Mann, D. M., Tabaton, M., andGambetti, P. (1996) Presence of soluble amyloid �-peptide precedesamyloid plaque formation in Down’s syndrome. Nat. Med. 2, 93–95
37. Klepper, J., and Leiendecker, B. (2007) GLUT1 deficiency syndrome—2007update. Dev. Med. Child Neurol. 49, 707–716
38. Kishi, T., Ikeda, A., Nagao, R., and Koyama, N. (2007) The SCFCdc4ubiquitin ligase regulates calcineurin signaling through degradation ofphosphorylated Rcn1, an inhibitor of calcineurin. Proc. Natl. Acad. Sci.U. S. A. 104, 17418–17423
39. Arron, J. R., Winslow, M. M., Polleri, A., Chang, C. P., Wu, H., Gao, X.,Neilson, J. R., Chen, L., Heit, J. J., Kim, S. K., Yamasaki, N., Miyakawa,T., Francke, U., Graef, I. A., and Crabtree, G. R. (2006) NFAT dysregu-lation by increased dosage of DSCR1 and DYRK1A on chromosome 21.Nature 441, 595–600
40. Liu, L., Zhao, L., Zhang, Y., Zhang, Q., and Ding, Y. (2007) Proteomicanalysis of Tiam1-mediated metastasis in colorectal cancer. Cell Biol. Int.31, 805–814
Quantitative Proteomics in Down Syndrome ES Cells
Molecular & Cellular Proteomics 8.4 595
Related Documents