Clinical Study Quantitative Electroencephalography and Behavioural Correlates of Daytime Sleepiness in Chronic Stroke Katherine Herron, 1 Derk-Jan Dijk, 2 Philip Dean, 3 Ellen Seiss, 3 and Annette Sterr 3 1 Pain Management Centre, National Hospital for Neurology and Neurosurgery, University College London Hospitals, London WC1N3BG, UK 2 Surrey Sleep Research Centre, Faculty of Health and Medical Sciences, University of Surrey, Guildford GU2 7XH, UK 3 Department of Psychology, Faculty of Arts and Human Science, University of Surrey, Guildford GU2 7XH, UK Correspondence should be addressed to Annette Sterr; [email protected] Received 12 December 2013; Revised 18 March 2014; Accepted 1 April 2014; Published 6 May 2014 Academic Editor: Stefano Masiero Copyright © 2014 Katherine Herron et al. is is an open access article distributed under the Creative Commons Attribution License, which permits unrestricted use, distribution, and reproduction in any medium, provided the original work is properly cited. Sleepiness is common aſter stroke, but in contrast to its importance for rehabilitation, existing studies focus primarily on the acute state and oſten use subjective sleepiness measures only. We used quantitative electroencephalography (qEEG) to extract physiological sleepiness, as well as subjective reports, in response to motor-cognitive demand in stroke patients and controls. We hypothesised that (a) slowing of the EEG is chronically sustained aſter stroke; (b) increased power in lower frequencies and increased sleepiness are associated; and (c) sleepiness is modulated by motor-cognitive demand. QEEGs were recorded in 32 chronic stroke patients and 20 controls using a Karolinska Drowsiness Test protocol administered before and aſter a motor priming task. Subjective sleepiness was measured using the Karolinska Sleepiness Scale. e findings showed that power density was significantly increased in delta and theta frequency bands over both hemispheres in patients which were not associated with subjective sleepiness ratings. is effect was not observed in controls. e motor priming task induced differential hemispheric effects with greater increase in low-frequency bands and presumably compensatory increases in higher frequency bands. e results indicate sustained slowing in the qEEG in chronic stroke, but in contrast to healthy controls, these changes are not related to perceived sleepiness. 1. Introduction Daytime sleepiness is commonly experienced in the acute phase of stroke [1, 2] which becomes a chronic problem in 34% of patients sustaining beyond six months [3–7]. Poststroke sleepiness is associated with lower quality of life [5], affects the ability to return to work [8], impacts cognitive functioning [9, 10], and hinders rehabilitation participation and outcome [7, 11–13]. Furthermore, the increased number of accidents committed by persons with a history of stroke has been attributed to sleepiness and fatigue [14, 15]. Sev- eral factors may contribute to sleepiness in stroke patients including neurological damage per se [16], depression [17], low social interaction [3], medication side effects [18–20], insomnia [21], sleep disordered breathing [17], and general poor health [5]. Strokes that affect the motor cortex may result in partial, or full, paralysis of the limbs. ese limitations in motor functioning require increased effort for most activities of daily living, resulting in a greater level of exhaustion and sleepiness [22]. Sleepiness is complex construct to quantify and mea- sure. Sleepiness describes an increased drive to sleep [23] which is distinct from fatigue. Fatigue refers to exhaustion as a result of physical or mental strain but this does not necessarily require sleep to be reversed [24]. Sleepiness can be measured subjectively using questionnaires; however, this only captures perceived sleepiness which can be influenced by other factors such as experimenter bias, mood, motiva- tion, and poor introspection [25–27]. e latter has been particularly observed in those with brain injury and sleep problems [4, 17, 28]. erefore, the objective measurement of physiological arousal is more accurate for detecting sleepiness levels. is requires the recording of neural activity in real time, and therefore, more sophisticated technology, that Hindawi Publishing Corporation BioMed Research International Volume 2014, Article ID 794086, 11 pages http://dx.doi.org/10.1155/2014/794086

Welcome message from author
This document is posted to help you gain knowledge. Please leave a comment to let me know what you think about it! Share it to your friends and learn new things together.
Transcript
Clinical StudyQuantitative Electroencephalography and BehaviouralCorrelates of Daytime Sleepiness in Chronic Stroke
Katherine Herron,1 Derk-Jan Dijk,2 Philip Dean,3 Ellen Seiss,3 and Annette Sterr3
1 Pain Management Centre, National Hospital for Neurology and Neurosurgery, University College London Hospitals,London WC1N3BG, UK
2 Surrey Sleep Research Centre, Faculty of Health and Medical Sciences, University of Surrey, Guildford GU2 7XH, UK3Department of Psychology, Faculty of Arts and Human Science, University of Surrey, Guildford GU2 7XH, UK
Correspondence should be addressed to Annette Sterr; [email protected]
Received 12 December 2013; Revised 18 March 2014; Accepted 1 April 2014; Published 6 May 2014
Academic Editor: Stefano Masiero
Copyright © 2014 Katherine Herron et al. This is an open access article distributed under the Creative Commons AttributionLicense, which permits unrestricted use, distribution, and reproduction in any medium, provided the original work is properlycited.
Sleepiness is common after stroke, but in contrast to its importance for rehabilitation, existing studies focus primarily on theacute state and often use subjective sleepiness measures only. We used quantitative electroencephalography (qEEG) to extractphysiological sleepiness, as well as subjective reports, in response to motor-cognitive demand in stroke patients and controls. Wehypothesised that (a) slowing of the EEG is chronically sustained after stroke; (b) increased power in lower frequencies and increasedsleepiness are associated; and (c) sleepiness is modulated by motor-cognitive demand. QEEGs were recorded in 32 chronic strokepatients and 20 controls using a KarolinskaDrowsiness Test protocol administered before and after amotor priming task. Subjectivesleepiness was measured using the Karolinska Sleepiness Scale. The findings showed that power density was significantly increasedin delta and theta frequency bands over both hemispheres in patients which were not associated with subjective sleepiness ratings.This effect was not observed in controls. The motor priming task induced differential hemispheric effects with greater increase inlow-frequency bands and presumably compensatory increases in higher frequency bands.The results indicate sustained slowing inthe qEEG in chronic stroke, but in contrast to healthy controls, these changes are not related to perceived sleepiness.
1. Introduction
Daytime sleepiness is commonly experienced in the acutephase of stroke [1, 2] which becomes a chronic problemin 34% of patients sustaining beyond six months [3–7].Poststroke sleepiness is associated with lower quality of life[5], affects the ability to return to work [8], impacts cognitivefunctioning [9, 10], and hinders rehabilitation participationand outcome [7, 11–13]. Furthermore, the increased numberof accidents committed by persons with a history of strokehas been attributed to sleepiness and fatigue [14, 15]. Sev-eral factors may contribute to sleepiness in stroke patientsincluding neurological damage per se [16], depression [17],low social interaction [3], medication side effects [18–20],insomnia [21], sleep disordered breathing [17], and generalpoor health [5]. Strokes that affect themotor cortexmay resultin partial, or full, paralysis of the limbs. These limitations in
motor functioning require increased effort for most activitiesof daily living, resulting in a greater level of exhaustion andsleepiness [22].
Sleepiness is complex construct to quantify and mea-sure. Sleepiness describes an increased drive to sleep [23]which is distinct from fatigue. Fatigue refers to exhaustionas a result of physical or mental strain but this does notnecessarily require sleep to be reversed [24]. Sleepiness canbe measured subjectively using questionnaires; however, thisonly captures perceived sleepiness which can be influencedby other factors such as experimenter bias, mood, motiva-tion, and poor introspection [25–27]. The latter has beenparticularly observed in those with brain injury and sleepproblems [4, 17, 28].Therefore, the objective measurement ofphysiological arousal ismore accurate for detecting sleepinesslevels. This requires the recording of neural activity in realtime, and therefore, more sophisticated technology, that
Hindawi Publishing CorporationBioMed Research InternationalVolume 2014, Article ID 794086, 11 pageshttp://dx.doi.org/10.1155/2014/794086
2 BioMed Research International
is, electroencephalography (EEG). Decreased physiologicalarousal, or sleepiness, is indicated by EEG frequency changes.Frequencies can be grouped into four distinct frequencybands: delta (1–3Hz), theta (4–7Hz), alpha (8–12Hz), andbeta (>12Hz). The EEG in the normal waking adult consistsprimarily of beta and alpha rhythms.When arousal decreases,the rhythm becomes dominated by alpha and eventuallylower frequencies when transitioning to sleep (>8Hz). EEGmethods have been incorporated into protocols for measur-ing sleepiness with a greater level of accuracy compared toquestionnaire approaches alone.
A commonly used protocol is the Multiple Sleep LatencyTest (MSLT) [29]. The MSLT aims to quantify sleepinesspropensity by recording the EEG whilst the participant isgiven an opportunity to sleep in a laboratory. Sleep onset isdetermined by visual scoring of the EEG when the criteriafor stage 1 sleep are met for 90 seconds [29]. A shorter sleeponset latency, measured inminutes, indicates higher the sleeppropensity.
The MSLT protocol does not provide additional infor-mation about the characteristics of the EEG per se. Butthrough offline analysis of the frequency composition of theraw EEG at a particular time point, the power in the slowerfrequencies associated with increased sleepiness (>12Hz) canbe determined to provide important indicators for how sleepya person iswhilst awake.This process is known as quantitativeEEG (qEEG). Karolinska Drowsiness Test (KDT) [30] utilisesqEEG to quantify sleepiness [31]. In the KDT protocol, theEEG is recorded whilst participants are awake and qEEGanalyses are applied offline. Studies have shown that increasedpower in the lower frequency bands, mostly alpha and theta,correlates with subjective ratings of sleepiness acrossmultipletime points in healthy adults [32–34]. Slowing of the wakingEEG is generally recognised as a physiological indicator ofsubjectively experienced sleepiness, and indeed, increasedsleep propensity [33].
Although sleepiness is often reported after stroke whichbrings additional problematic consequences, the majorityof studies rely on subjective reports thus rendering ourunderstanding of sleepiness in this population as limitedwhich has implications for effective patient management.Objective neurophysiological methods, such as qEEQ [31–35], are lacking in this population but could help to improvethe quantification of the level of severity of sleepiness prob-lems in this population.
To the best of our knowledge, qEEG has not yet been usedas a tool to investigate sleepiness in chronic stroke patientswith chronic deficits. Several studies have used qEEG in acutestroke patients in the context of identifying neurologicalabnormalities and reported slowing in the delta and thetafrequency ranges [36–39].The concept of subjective alertnessstate was not addressed in these studies.Therefore, we do notknow if qEEG correlates of sleepiness are present in strokepatients, in the same way as has been observed in nonbraininjured populations, nor to what degree this method can beused to measure sleepiness in this population.
In light of this gap in the literature, the present experimenttherefore examined the qEEG in relation to subjective ratingsof sleepiness in stroke patients with chronic hemiparesis. We
Notask
2min 2min
Motor priming taskElectrodeapplication
KSS
Notask
EEG recording
KSS
45min
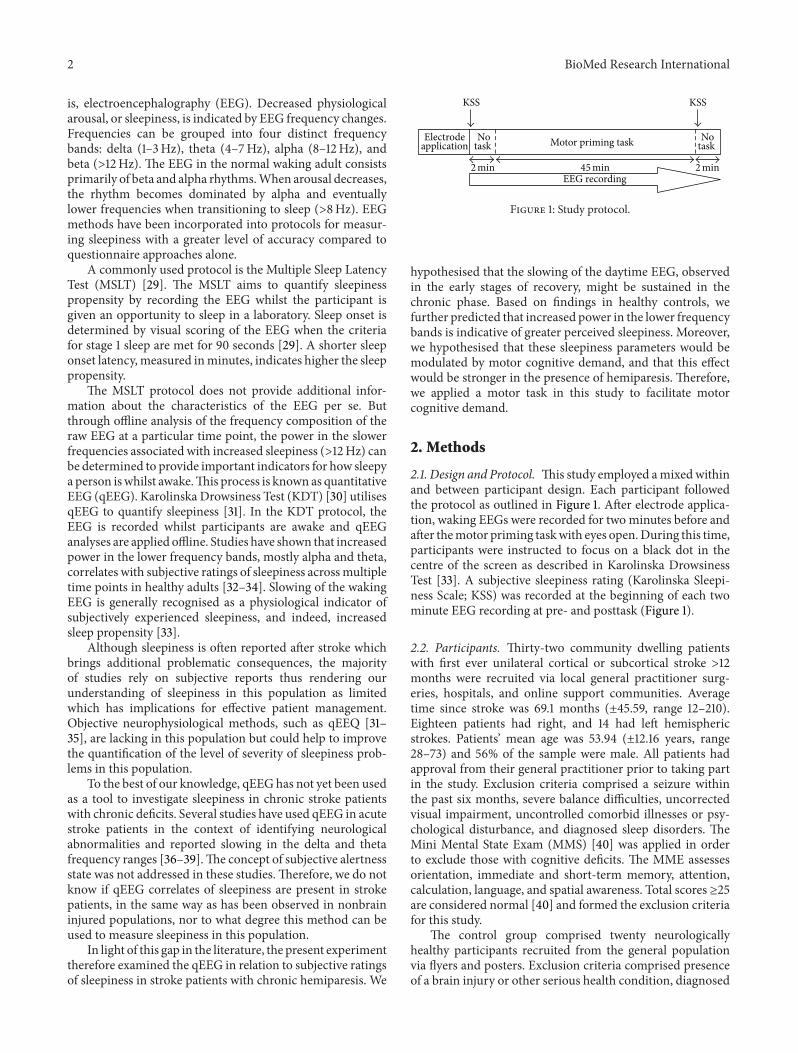
Figure 1: Study protocol.
hypothesised that the slowing of the daytime EEG, observedin the early stages of recovery, might be sustained in thechronic phase. Based on findings in healthy controls, wefurther predicted that increased power in the lower frequencybands is indicative of greater perceived sleepiness. Moreover,we hypothesised that these sleepiness parameters would bemodulated by motor cognitive demand, and that this effectwould be stronger in the presence of hemiparesis. Therefore,we applied a motor task in this study to facilitate motorcognitive demand.
2. Methods
2.1. Design and Protocol. This study employed amixed withinand between participant design. Each participant followedthe protocol as outlined in Figure 1. After electrode applica-tion, waking EEGs were recorded for two minutes before andafter themotor priming taskwith eyes open.During this time,participants were instructed to focus on a black dot in thecentre of the screen as described in Karolinska DrowsinessTest [33]. A subjective sleepiness rating (Karolinska Sleepi-ness Scale; KSS) was recorded at the beginning of each twominute EEG recording at pre- and posttask (Figure 1).
2.2. Participants. Thirty-two community dwelling patientswith first ever unilateral cortical or subcortical stroke >12months were recruited via local general practitioner surg-eries, hospitals, and online support communities. Averagetime since stroke was 69.1 months (±45.59, range 12–210).Eighteen patients had right, and 14 had left hemisphericstrokes. Patients’ mean age was 53.94 (±12.16 years, range28–73) and 56% of the sample were male. All patients hadapproval from their general practitioner prior to taking partin the study. Exclusion criteria comprised a seizure withinthe past six months, severe balance difficulties, uncorrectedvisual impairment, uncontrolled comorbid illnesses or psy-chological disturbance, and diagnosed sleep disorders. TheMini Mental State Exam (MMS) [40] was applied in orderto exclude those with cognitive deficits. The MME assessesorientation, immediate and short-term memory, attention,calculation, language, and spatial awareness. Total scores ≥25are considered normal [40] and formed the exclusion criteriafor this study.
The control group comprised twenty neurologicallyhealthy participants recruited from the general populationvia flyers and posters. Exclusion criteria comprised presenceof a brain injury or other serious health condition, diagnosed
BioMed Research International 3
Table 1: Participant information: data presented as mean, ± 1 standard deviation, range, or percent.
Demographical variables Stroke patients (𝑛 = 32) Controls (𝑛 = 20)Gender (M : F) 18 : 14 10 : 10Age (Years) 53.97 ± 12.16 (28–73) 54.10 ± 13.21 (33–72)BMI 24.10 ± 2.56 (18.20–28.90) 24.56 ± 3.64 (18–30.80)MMSE 29.10 ± 1.06 (26–30) —ESS 6.69 ± 4.41 (0–17) 5.45 ± 4.52 (0–15)Chronicity 60.91 ± 45.59 (12–210) n/aStroke hemisphere (Left : Right) 14 : 18 n/a
Medication (frequency of participants on medications)Antidepressant (4)Cardiac control (4)Antiepileptic (5)Sleep hypnotics (1)
n/a
Alcohol (units per week) 8.98 ± 10.75 (0–45) 3.66 ± 8.12 (0–35)Caffeine (servings per day) 4.36 ± 2.73 (0–12) 3.31 ± 2.74 (0–10)Nicotine (cigarettes per day) 0.97 ± 3.90 (0–20) 0.50 ± 2.24 (0–10)
sleep disorder, and clinically significant psychological distur-bance. Mean age was 54.1 years (±13.21, range 33 to 72) and50% of the sample was male.
No participants were diagnosed with clinically significantsleepiness. The Epworth Sleepiness Scale (ESS) [23] was usedas a measure of average sleepiness levels. ESS scores ≥10 aresuggestive of significant problem with sleepiness. Accordingto the ESS criteria, 28% of patients and 20% of controlsreported significant sleepiness. Two out of five patients takingantiepileptic medication were above the ESS criteria. Oneout of four patients taking antidepressants was above ESScriteria. Mean ESS scores did not significantly differ betweengroups. Patients did not differ from controls apart fromalcohol consumption where patients consumed significantlymore than controls (𝑧 = −2.62, 𝑃 < .01). Further analysesrevealed no differences between patients with left or righthemispheric stroke. The demographics of the two groups aresummarised in Table 1.
The study protocol was approved by the Surrey ResearchEthics Committee (National Health Service UK) and theUniversity of Surrey Research Ethics Committee. Writteninformed consent was obtained prior to participation. Allprocedures adhered to the ethical guidelines outlined by theDeclaration of Helsinki [41].
2.3. Measures. Subjective sleepiness was measured with Kar-olinska Sleepiness Scale (KSS) [33], a one-dimensional scaleto assess sleepiness at a particular time point. Scores rangedfrom 1 (very alert) to 9 (very sleepy). The KSS has showngood correlation with objective measures of alertness includ-ing EEG and vigilance tests [30], and in sleep deprivationparadigms [33, 42].
Waking EEG was used to record physiological indicatorsof sleepiness using a 64-channel QuickAmp system (BrainProducts GmbHMunich, Germany) and Ag/AgCl electrodesusing the standardised 10-10 montage [43]. Impedances werekept below 5 kOhm. Data was recorded in DC mode with asampling rate of 500Hz, and against average reference.
The motor task used Rosenberg’s motor priming para-digm to facilitate motor cognitive demand in patients withchronic motor deficits poststroke [44].
One of four precues (left ≪, right ≫, either right or left<> or noresponse ><) were presented within an empty linedrawn circle. Precues were immediately followed by one ofthree response cues represented by a black semicircle filledin white appearing within the line drawn circle: left half (leftbutton press), right half (right button press), or bottom halfcircle (no response).
Participants were instructed to respond to the cues usingthe button press as quickly as possible. Precue presentationswere randomised and were 100% predictive of the responsecue. Following the response, a feedback screen was displayedfor 500ms and indicated either of the following: correctresponse (“correct”) or incorrect response (“wrong”; “notresponded to response cue”; “a response was required!”)and responses within 200ms of response cue (“too early!”).Sixty trials were presented approximately in 6 blocks. Theresponse window was 1830 to 4000 milliseconds. Responseswere executed with the left or right index finger, hand orarm, dependent on ability of patients who have some levelof chronic hemiparesis. All participants first completed atraining block to familiarise themselves with the procedure.Stimulus presentation was delivered using NeurobehaviouralSystems Presentation Software (http://www.neurobs.com/).
2.4. Analysis. EEG signals were analysed offline using theBrain Analyzer Software (Brain Products GmbH Munich,Germany). A digital 0.5Hz high pass and 30Hz low passphase shift-free Butterworth filter was applied as well as a50Hz notch filter.The two-minute segments of raw data wereinspected manually for artefacts and further subdivided intotwo-second epochs. Frequency composition was determinedthrough the Fast Fourier Transformation (FFT) moduleembedded in Visual Analyser. FFT criteria were set to fullspectrum, resolution 0.5Hz, power density output (𝜇V2/Hz),and a Hanning window (10%) was applied. The FFT values
4 BioMed Research International
(Hz)
Relat
ive p
ower
den
sity
(%)
1 3 5 7 9 11 13 15 17 19 21 23 25 27 290
50
100
150
200
250
300
350
(a)
−3−2−10123456
tva
lue
LesionedNonlesioned
(Hz)
1 3 5 7 9 11 13 15 17 19 21 23 25 27 29
(b)
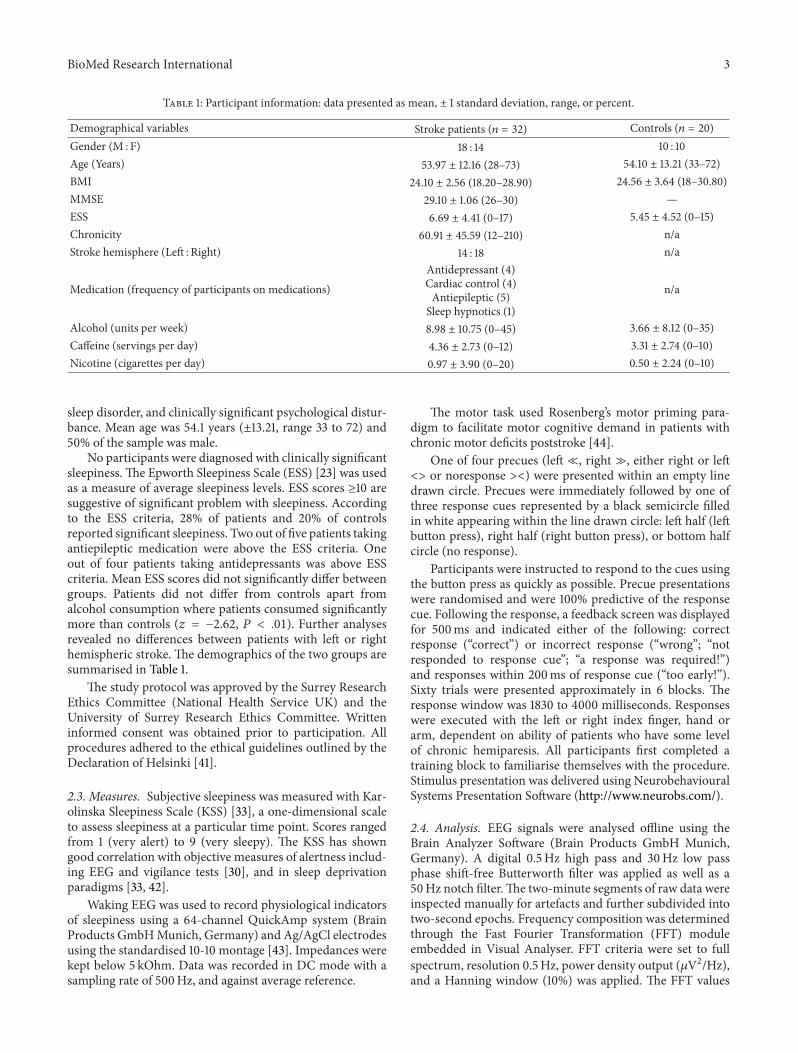
Figure 2: Difference in the EEG between patients and controls: (a) power density for the central derivation per 1Hz for patients expressed asa percentage above or below controls at 100%; (b) between group 𝑡 values with the dashed line to cut off point for significance.
were averaged and exported in 0.5Hz bins ranging from 1to 30Hz. These data were further subdivided into discrete,nonoverlapping frequency bands: delta (1–3Hz), theta (4–7Hz), alpha (8–12Hz), and beta (13–30Hz). Power densityvalues were transformed using log base 10 (Log 10).
Differences in frequency composition between patientsand controls were calculated for central electrodes (C3 andC4). Task and sleepiness effects were examined using cen-tral electrodes plus additional derivations including frontal(F3/F4), parietal (P3/P4), and occipital (O1/O2). Topograph-ical distributions of discrete frequency bands were spline-interpolated [45] to create cortical maps for visual inspection.
To visualise group differences, geometric mean calcu-lations were performed to express power density values ofpatients as a percentage of controls, amethod previously usedin nonbrain injured samples [46–48].Thiswas achieved by (1)transforming power density values using Log10, (2) averagingdata across participants, (3) subtracting patient data fromcontrols, (4) antilogging these values, and (5) multiplying by100.
Performance on the motor task was measured as reactiontime (ms), defined as time between response cue onset andbutton press, and the number of correct responses to thecue (%). For stroke patients, performance results were drawnfrom responses of the nonlesioned hand to minimise theimpact of the motor deficit on performance. Reaction timeand correct responses were averaged across blocks for allparticipants.
Statistical analysis was conducted using SPSS (SPSS Inc.;version 15.0). Between-group demographic variables werecompared using 𝑡-tests or the Mann-Whitney 𝑈 Test fornonnormal data. EEG data was log transformed using Log10.𝑇-tests were used to directly compare the EEG of patientsand controls for each 1Hz bin between 1 and 30Hz. Topo-graphical maps of difference between patients and controlswere plotted using the 𝑃 values drawn from 𝑡-tests betweengroups per frequency band. Mixed-model ANOVAS withthe repeated measures factors of task (pre-, post-) andhemisphere (left/right for controls; lesioned/nonlesioned forpatients) and one between factor (group) were calculated to
test for group and task effects on the KSS and EEG perfrequency band. Significant findings were further examinedusing one-sided Fisher’s protected 𝑡-tests with alpha set to𝑃 ≤ .05. Formultiple comparisons, the Bonferroni correctionwas applied. Pearson’s correlation coefficients were used toexamine associations betweenKSS andEEGparameters. Cor-relations were Fisher’s 𝑧 transformed to allow the calculationof𝑍obs score as described in Steiger [49].𝑍obs larger than 1.96are statistically significant.
3. Results
3.1. QEEGCharacteristics in Patients versusControls. Figure 2presents the power density values where patient data areexpressed as a percentage above or below control data.Patients showed greater power in the delta and theta rangescompared to controls (Figure 2), with significant increasesbetween 1 and 9Hz in the lesioned hemisphere and between2 and 7Hz in the nonlesioned hemisphere. At the sametime, power in the higher frequency bands (18 to 20Hz) wassignificantly decreased in the lesioned hemisphere. Whencorrecting for multiple comparisons, this pattern remains thesame whereby the cutoff for significance is a 𝑡 value of 2.45,with the exception of increases at 1 and 9Hz in the lesionedhemisphere.
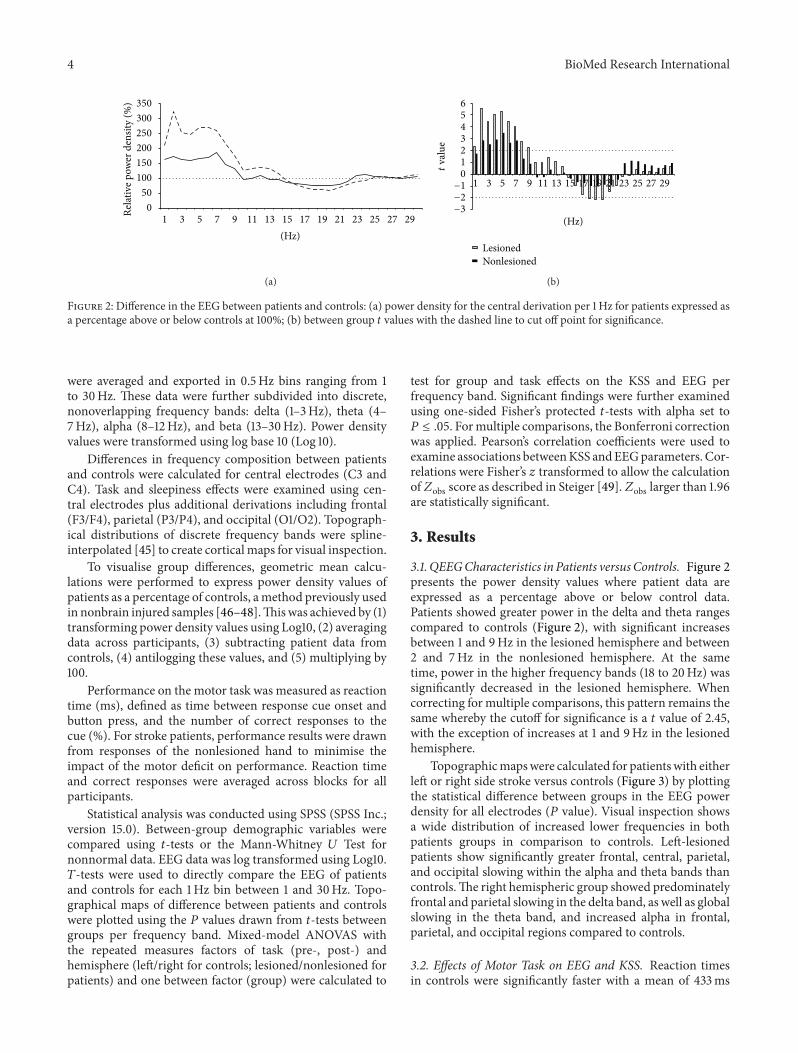
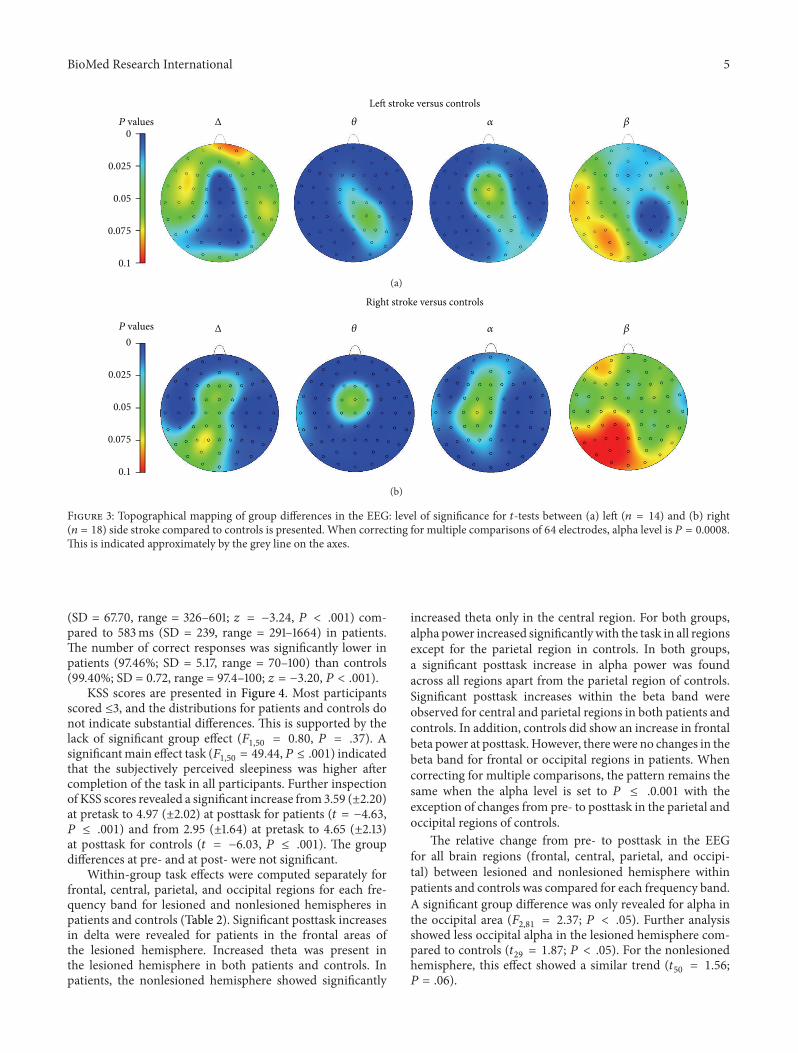
Topographicmapswere calculated for patientswith eitherleft or right side stroke versus controls (Figure 3) by plottingthe statistical difference between groups in the EEG powerdensity for all electrodes (𝑃 value). Visual inspection showsa wide distribution of increased lower frequencies in bothpatients groups in comparison to controls. Left-lesionedpatients show significantly greater frontal, central, parietal,and occipital slowing within the alpha and theta bands thancontrols.The right hemispheric group showed predominatelyfrontal and parietal slowing in the delta band, as well as globalslowing in the theta band, and increased alpha in frontal,parietal, and occipital regions compared to controls.
3.2. Effects of Motor Task on EEG and KSS. Reaction timesin controls were significantly faster with a mean of 433ms
BioMed Research International 5
0
0.025
0.05
0.075
0.1
P values Δ 𝜃 𝛼 𝛽
Left stroke versus controls
(a)
0
0.025
0.05
0.075
0.1
P values Δ 𝜃 𝛼 𝛽
Right stroke versus controls
(b)
Figure 3: Topographical mapping of group differences in the EEG: level of significance for 𝑡-tests between (a) left (𝑛 = 14) and (b) right(𝑛 = 18) side stroke compared to controls is presented. When correcting for multiple comparisons of 64 electrodes, alpha level is 𝑃 = 0.0008.This is indicated approximately by the grey line on the axes.
(SD = 67.70, range = 326–601; 𝑧 = −3.24, 𝑃 < .001) com-pared to 583ms (SD = 239, range = 291–1664) in patients.The number of correct responses was significantly lower inpatients (97.46%; SD = 5.17, range = 70–100) than controls(99.40%; SD = 0.72, range = 97.4–100; 𝑧 = −3.20, 𝑃 < .001).
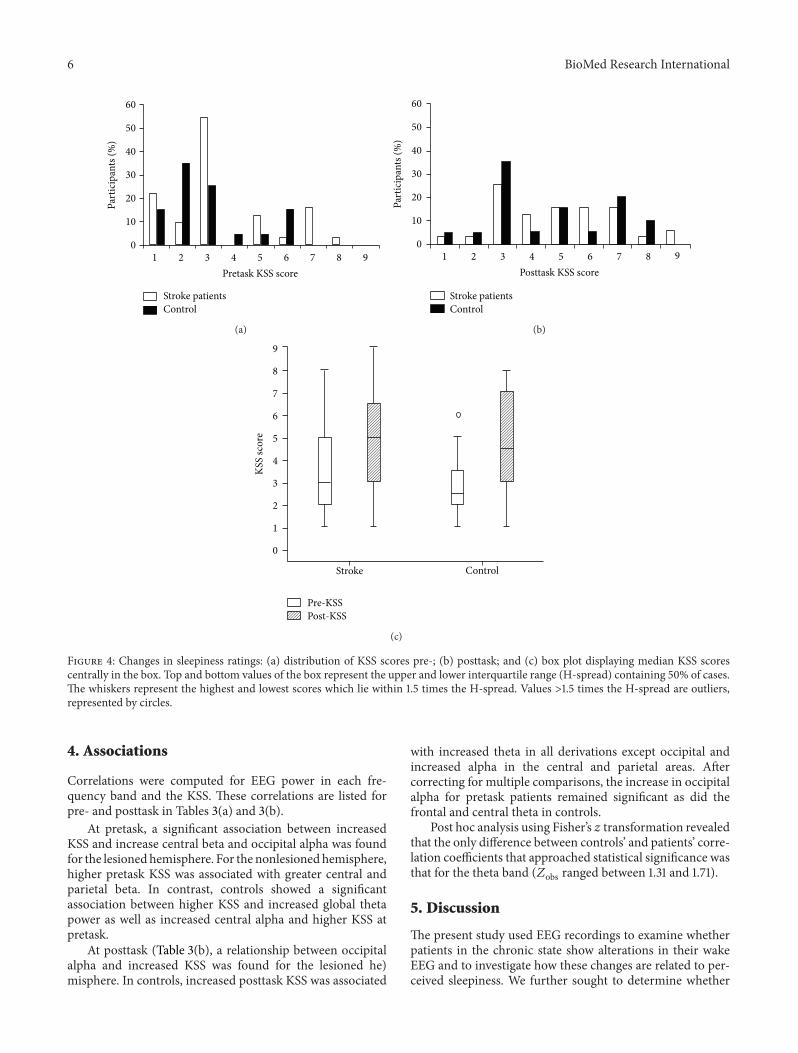
KSS scores are presented in Figure 4. Most participantsscored ≤3, and the distributions for patients and controls donot indicate substantial differences. This is supported by thelack of significant group effect (𝐹
1,50= 0.80, 𝑃 = .37). A
significantmain effect task (𝐹1,50= 49.44,𝑃 ≤ .001) indicated
that the subjectively perceived sleepiness was higher aftercompletion of the task in all participants. Further inspectionof KSS scores revealed a significant increase from 3.59 (±2.20)at pretask to 4.97 (±2.02) at posttask for patients (𝑡 = −4.63,𝑃 ≤ .001) and from 2.95 (±1.64) at pretask to 4.65 (±2.13)at posttask for controls (𝑡 = −6.03, 𝑃 ≤ .001). The groupdifferences at pre- and at post- were not significant.
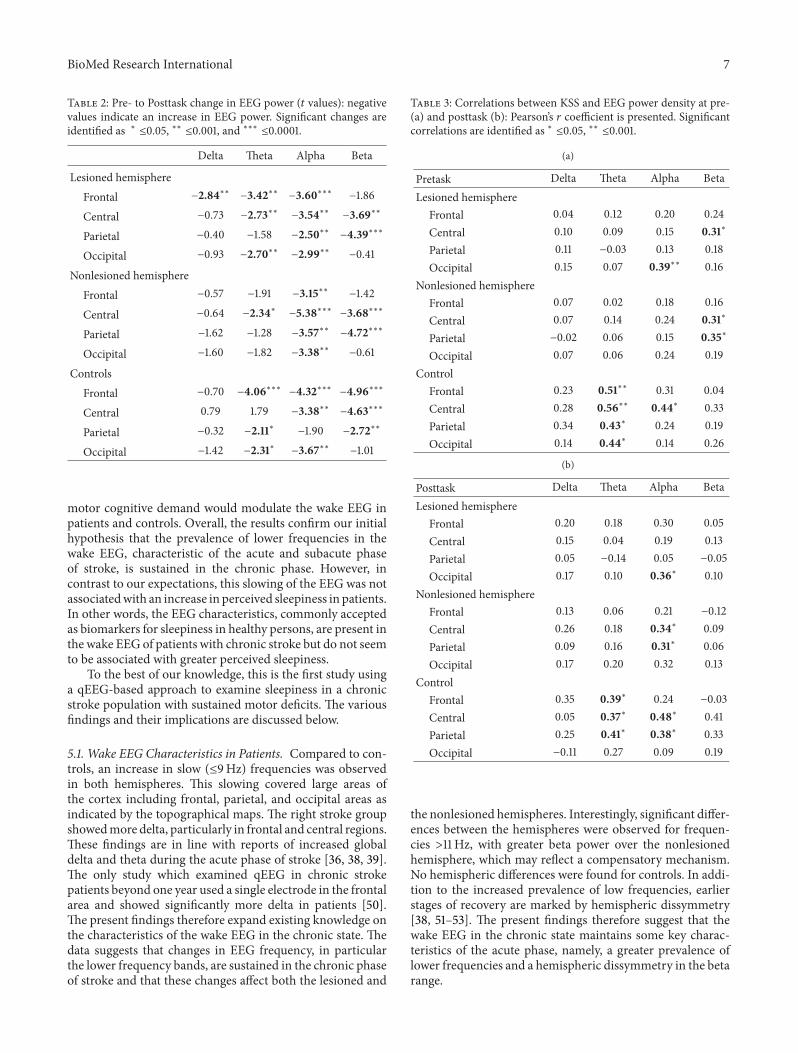
Within-group task effects were computed separately forfrontal, central, parietal, and occipital regions for each fre-quency band for lesioned and nonlesioned hemispheres inpatients and controls (Table 2). Significant posttask increasesin delta were revealed for patients in the frontal areas ofthe lesioned hemisphere. Increased theta was present inthe lesioned hemisphere in both patients and controls. Inpatients, the nonlesioned hemisphere showed significantly
increased theta only in the central region. For both groups,alpha power increased significantlywith the task in all regionsexcept for the parietal region in controls. In both groups,a significant posttask increase in alpha power was foundacross all regions apart from the parietal region of controls.Significant posttask increases within the beta band wereobserved for central and parietal regions in both patients andcontrols. In addition, controls did show an increase in frontalbeta power at posttask. However, there were no changes in thebeta band for frontal or occipital regions in patients. Whencorrecting for multiple comparisons, the pattern remains thesame when the alpha level is set to 𝑃 ≤ .0.001 with theexception of changes from pre- to posttask in the parietal andoccipital regions of controls.
The relative change from pre- to posttask in the EEGfor all brain regions (frontal, central, parietal, and occipi-tal) between lesioned and nonlesioned hemisphere withinpatients and controls was compared for each frequency band.A significant group difference was only revealed for alpha inthe occipital area (𝐹
2,81= 2.37; 𝑃 < .05). Further analysis
showed less occipital alpha in the lesioned hemisphere com-pared to controls (𝑡
29= 1.87; 𝑃 < .05). For the nonlesioned
hemisphere, this effect showed a similar trend (𝑡50= 1.56;
𝑃 = .06).
6 BioMed Research International
Part
icip
ants
(%)
Pretask KSS score
60
50
40
30
20
10
0987654321
Stroke patientsControl
(a)
Part
icip
ants
(%)
Posttask KSS score
60
50
40
30
20
10
0987654321
Stroke patientsControl
(b)
KSS
scor
e
Stroke Control
0
9
8
7
6
5
4
3
2
1
Pre-KSSPost-KSS
(c)
Figure 4: Changes in sleepiness ratings: (a) distribution of KSS scores pre-; (b) posttask; and (c) box plot displaying median KSS scorescentrally in the box. Top and bottom values of the box represent the upper and lower interquartile range (H-spread) containing 50% of cases.The whiskers represent the highest and lowest scores which lie within 1.5 times the H-spread. Values >1.5 times the H-spread are outliers,represented by circles.
4. Associations
Correlations were computed for EEG power in each fre-quency band and the KSS. These correlations are listed forpre- and posttask in Tables 3(a) and 3(b).
At pretask, a significant association between increasedKSS and increase central beta and occipital alpha was foundfor the lesionedhemisphere. For the nonlesionedhemisphere,higher pretask KSS was associated with greater central andparietal beta. In contrast, controls showed a significantassociation between higher KSS and increased global thetapower as well as increased central alpha and higher KSS atpretask.
At posttask (Table 3(b), a relationship between occipitalalpha and increased KSS was found for the lesioned he)misphere. In controls, increased posttask KSS was associated
with increased theta in all derivations except occipital andincreased alpha in the central and parietal areas. Aftercorrecting for multiple comparisons, the increase in occipitalalpha for pretask patients remained significant as did thefrontal and central theta in controls.
Post hoc analysis using Fisher’s 𝑧 transformation revealedthat the only difference between controls’ and patients’ corre-lation coefficients that approached statistical significance wasthat for the theta band (𝑍obs ranged between 1.31 and 1.71).
5. Discussion
The present study used EEG recordings to examine whetherpatients in the chronic state show alterations in their wakeEEG and to investigate how these changes are related to per-ceived sleepiness. We further sought to determine whether
BioMed Research International 7
Table 2: Pre- to Posttask change in EEG power (𝑡 values): negativevalues indicate an increase in EEG power. Significant changes areidentified as ∗ ≤0.05, ∗∗ ≤0.001, and ∗∗∗ ≤0.0001.
Delta Theta Alpha Beta
Lesioned hemisphereFrontal −2.84∗∗ −3.42∗∗ −3.60∗∗∗ −1.86
Central −0.73 −2.73∗∗ −3.54∗∗ −3.69∗∗
Parietal −0.40 −1.58 −2.50∗∗ −4.39∗∗∗
Occipital −0.93 −2.70∗∗ −2.99∗∗ −0.41
Nonlesioned hemisphereFrontal −0.57 −1.91 −3.15∗∗ −1.42
Central −0.64 −2.34∗ −5.38∗∗∗ −3.68∗∗∗
Parietal −1.62 −1.28 −3.57∗∗ −4.72∗∗∗
Occipital −1.60 −1.82 −3.38∗∗ −0.61
ControlsFrontal −0.70 −4.06∗∗∗ −4.32∗∗∗ −4.96∗∗∗
Central 0.79 1.79 −3.38∗∗ −4.63∗∗∗
Parietal −0.32 −2.11∗ −1.90 −2.72∗∗
Occipital −1.42 −2.31∗ −3.67∗∗ −1.01
motor cognitive demand would modulate the wake EEG inpatients and controls. Overall, the results confirm our initialhypothesis that the prevalence of lower frequencies in thewake EEG, characteristic of the acute and subacute phaseof stroke, is sustained in the chronic phase. However, incontrast to our expectations, this slowing of the EEG was notassociatedwith an increase in perceived sleepiness in patients.In other words, the EEG characteristics, commonly acceptedas biomarkers for sleepiness in healthy persons, are present inthe wake EEG of patients with chronic stroke but do not seemto be associated with greater perceived sleepiness.
To the best of our knowledge, this is the first study usinga qEEG-based approach to examine sleepiness in a chronicstroke population with sustained motor deficits. The variousfindings and their implications are discussed below.
5.1. Wake EEG Characteristics in Patients. Compared to con-trols, an increase in slow (≤9Hz) frequencies was observedin both hemispheres. This slowing covered large areas ofthe cortex including frontal, parietal, and occipital areas asindicated by the topographical maps. The right stroke groupshowedmore delta, particularly in frontal and central regions.These findings are in line with reports of increased globaldelta and theta during the acute phase of stroke [36, 38, 39].The only study which examined qEEG in chronic strokepatients beyond one year used a single electrode in the frontalarea and showed significantly more delta in patients [50].The present findings therefore expand existing knowledge onthe characteristics of the wake EEG in the chronic state. Thedata suggests that changes in EEG frequency, in particularthe lower frequency bands, are sustained in the chronic phaseof stroke and that these changes affect both the lesioned and
Table 3: Correlations between KSS and EEG power density at pre-(a) and posttask (b): Pearson’s 𝑟 coefficient is presented. Significantcorrelations are identified as ∗ ≤0.05, ∗∗ ≤0.001.
(a)
Pretask Delta Theta Alpha BetaLesioned hemisphere
Frontal 0.04 0.12 0.20 0.24Central 0.10 0.09 0.15 0.31∗
Parietal 0.11 −0.03 0.13 0.18Occipital 0.15 0.07 0.39∗∗ 0.16
Nonlesioned hemisphereFrontal 0.07 0.02 0.18 0.16Central 0.07 0.14 0.24 0.31∗
Parietal −0.02 0.06 0.15 0.35∗
Occipital 0.07 0.06 0.24 0.19Control
Frontal 0.23 0.51∗∗ 0.31 0.04Central 0.28 0.56∗∗ 0.44∗ 0.33Parietal 0.34 0.43∗ 0.24 0.19Occipital 0.14 0.44∗ 0.14 0.26
(b)
Posttask Delta Theta Alpha BetaLesioned hemisphere
Frontal 0.20 0.18 0.30 0.05Central 0.15 0.04 0.19 0.13Parietal 0.05 −0.14 0.05 −0.05Occipital 0.17 0.10 0.36∗ 0.10
Nonlesioned hemisphereFrontal 0.13 0.06 0.21 −0.12Central 0.26 0.18 0.34∗ 0.09Parietal 0.09 0.16 0.31∗ 0.06Occipital 0.17 0.20 0.32 0.13
ControlFrontal 0.35 0.39∗ 0.24 −0.03Central 0.05 0.37∗ 0.48∗ 0.41Parietal 0.25 0.41∗ 0.38∗ 0.33Occipital −0.11 0.27 0.09 0.19
the nonlesioned hemispheres. Interestingly, significant differ-ences between the hemispheres were observed for frequen-cies >11 Hz, with greater beta power over the nonlesionedhemisphere, which may reflect a compensatory mechanism.No hemispheric differences were found for controls. In addi-tion to the increased prevalence of low frequencies, earlierstages of recovery are marked by hemispheric dissymmetry[38, 51–53]. The present findings therefore suggest that thewake EEG in the chronic state maintains some key charac-teristics of the acute phase, namely, a greater prevalence oflower frequencies and a hemispheric dissymmetry in the betarange.
8 BioMed Research International
5.2. Effects of the Motor Task. Both patients and controlsreported posttask increases in the KSS, suggesting greatersleepiness after the task. Posttask changes were also observedin the EEG, with both groups showing predominantlyincreased alpha and theta. Theta increases were consistentbetween the lesioned hemisphere and controls in frontal,central, and occipital regions. In the nonlesioned hemisphere,only the central area reached significance for increased theta.Critically, patients also showed increased frontal delta inthe lesioned hemisphere which was not observed in thenonelesioned hemisphere or for controls. In other studieswith healthy participants, posttask increases in the alpharange are indicative of mild subjective sleepiness, whereasincreased delta activity is suggestive ofmore severe sleepiness[54, 55].
With regard to between-group effects, there was signifi-cantly less posttask change in occipital alpha in the lesionedhemisphere compared to controls and the nonlesionedhemisphere, while controls and the nonlesioned hemispheredid not differ. In this sense, the nonlesioned hemisphere“responded” to the task in a similar fashion as controls,while the lesioned hemisphere responded differently. Thissuggests that the hemispheric dissymmetry might not justbe a physiological epiphenomenon but a characteristic thatis functionally important for cognition and behaviour.
In addition to changes in the lower frequency bands,we further observed a posttask increase in beta in patients,in both hemispheres, and controls. Notably, this increase inhigher frequencies occurred at the same time as an increasein lower frequencies, an effect also described in studiesrequiring sustained mental effort in control populations [56,57]. This effect most likely reflects that the compensatoryeffort participants have to make in the face of decliningvigilance as the time-on-task increases [56]. However, thistheory has not been tested directly in chronic stroke patients.
5.3. Associations. Thepresent study has found that subjectivesleepiness ratings strongly correlated with increased pre-and posttask theta and alpha in controls, corroboratingprevious work in this area [33–35]. The finding is in linewith the generally accepted assumption that the EEG-derivedneurophysiological markers of sleepiness are directly relatedto the subjective perception of sleepiness and indeed reflectgreater sleep propensity [33]. In patients, the relationshipbetween subjective sleepiness and EEG indices was much lessprominent, with only near significant correlation coefficientswithin the theta band. This dissociation between subjectiveand objective sleepiness markers is an interesting findingand clearly requires further investigation. One possible expla-nation is that patients habituate to their chronic sleepinessover time and therefore fail to perceive or report it. In thiscontext it is interesting to note that other studies have foundpoor consistency between self-reported sleepiness and otherindicators of sleepiness in patients, including observablereport, actigraphy, and indeed the MSLT. Moreover, Sforzaet al. [58] found no correlation between EEG and self-reports in patients with sleep disorders and concluded thatthe wake EEG is not sensitive to sleepiness in this population.
The same argument may be put forward for the presentstudy. However, our own observations during the experimentindicated that patients were indeed rather sleepy. This wasshown in patients’ behavioural characteristics of sleepinessincluding yawning, eyes closed, and a nodding head, whilethe electrodes were attached.The subjective sleepiness ratingstherefore stand in contrast to the behavioural signs of sleepi-ness we observed. We therefore conclude that it is likely thatpatients have greater difficulty with the perception of theirsleepiness, a hypothesis which could be explored using theMSLT. In addition, a larger sample size would build on theresults from this study.
Increased beta weakly correlated with higher KSS inpatients at pretask only and this effect was not observed incontrols. This further provides more direct support to thecompensation theory as discussed above.Wehypothesise thatthe increased beta is indicative of the allocation of cognitiveand behavioural resources, necessary to compensate forthe limited attentional capacity [10]. This may signify asustained compensatory beta enhancement that is necessaryfor patients to function in everyday life. At posttask, thiseffect disappears and may reflect an exhaustion of maximumattention capacity.
5.4. Limitations and FurtherTheoretical Considerations. Eventhough the results show significantly more slowing of theEEG in patients compared to controls, which is similar tothat shown in sleep deprived persons, the cause of sleepinesscannot be identified. It may be the result of several factorsincluding disruption to alertness mechanisms as direct resultof lesion location [16], poor sleep [21], low mood [17], andincreased effort required in movement and cognition afterstroke [22]. It is likely that sleepiness may be the combinedeffect of several factors. Regardless of cause, the resultsshow that patients are poor at recognising alertness stateeven though there is clear evidence of EEG slowing in bothhemispheres, similar to that seen after sleep deprivation.
Theparticipant sample has some points for consideration.Due to the sample size, the statistical power is small andtherefore more studies are necessary to further explore mea-suring sleepiness in stroke populations. The sample includedparticipants taking medication that may affect the EEGincluding antiepileptics [59] and antidepressants [60, 61].Although there are other factors contributing to increasedsleepiness as described in the introduction, we cannot deci-pher the degree to which these factors interact with theEEG and perception of sleepiness. However, had medicationsignificantly affected the patients’ EEG, we would expect theeffect to be observed in both hemispheres. Furthermore,some antidepressants may even increase vigilance [61]. Over-all, we aimed to capture a representative sample of strokepatients which would typically include those who engage inbehaviour that can contribute to changes in physiologicalarousal such as medication usage but are not directly relatedto their stroke per se. We have shown that regardless ofcause of sleepiness, the observed EEG slowing is potentiallyproblematic in patient prognoses after stroke and requiresattention.
BioMed Research International 9
6. Conclusion
The present study shows long-term changes of the wake EEGin patients with chronic hemiparesis after stroke. The datasuggests a general slowing of the EEG that affects the lesionedand nonlesioned hemisphere. This slowing is not associatedwith subjective sleepiness and this has implications for therecognition and treatment of an aspect of stroke that impactsrehabilitation and safety. Investigating the causes of thisdissociation will add to a better understanding of the long-term consequences of stroke and eventually help to improvestroke care.
Conflict of Interests
The authors declare that there is no conflict of interestsregarding the publication of this paper.
Acknowledgments
The study was funded by the UK Research Councils, MedicalResearch Council (Career Establishment Award, Reference:04/MREC/12/25), and Economic and Social Research Coun-cil (PhD Studentship Katherine Herron, Reference: PTA-031-2005-00019).
References
[1] D. L. Bliwise,D. B. Rye, B.Dihenia, andP.Gurecki, “Greater day-time sleepiness in subcortical stroke relative to Parkinson’sdisease and Alzheimer’s disease,” Journal of Geriatric Psychiatryand Neurology, vol. 15, no. 2, pp. 61–67, 2002.
[2] D. P. Davies, H. Rodgers, D. Walshaw, O. F. W. James, and G. J.Gibson, “Snoring, daytime sleepiness and stroke: a case-controlstudy of first-ever stroke,” Journal of Sleep Research, vol. 12, no.4, pp. 313–318, 2003.
[3] T. F. Campos, F. P. Diogenes, F. R. Franca, R. C. S. Dantas, J. F.Araujo, and A. A. L. Menezes, “The sleep-wake cycle in the latestage of cerebral vascular accident recovery,” Biological RhythmResearch, vol. 36, no. 1-2, pp. 109–113, 2005.
[4] B. E. Masel, R. S. Scheibel, T. Kimbark, and S. T. Kuna, “Exces-sive daytime sleepiness in adults with brain injuries,” Archivesof Physical Medicine and Rehabilitation, vol. 82, no. 11, pp. 1526–1532, 2001.
[5] W. J. Schuiling, G. J. E. Rinkel, R. Walchenbach, and A. W. deWeerd, “Disorders of sleep and wake in patients after subarach-noid hemorrhage,” Stroke, vol. 36, no. 3, pp. 578–582, 2005.
[6] J. Vock, P. Achermann,M. Bischof et al., “Evolution of sleep andsleep EEG after hemispheric stroke,” Journal of Sleep Research,vol. 11, no. 4, pp. 331–338, 2002.
[7] A. D. Worthington and Y. Melia, “Rehabilitation is compro-mised by arousal and sleep disorders: results of a survey ofrehabilitation centres,” Brain Injury, vol. 20, no. 3, pp. 327–332,2006.
[8] J. Murray, R. Ashworth, A. Forster, and J. Young, “Developinga primary care-based stroke service: a review of the qualitativeliterature,” British Journal of General Practice, vol. 53, no. 487,pp. 137–142, 2003.
[9] D. M. Hermann, M. Siccoli, P. Brugger et al., “Evolution ofneurological, neuropsychological and sleep-wake disturbances
after paramedian thalamic stroke,” Stroke, vol. 39, no. 1, pp. 62–68, 2008.
[10] M. J. E. van Zandvoort, L. J. Kappelle, A. Algra, and E. H. F. deHaan, “Decreased capacity for mental effort after single supra-tentorial lacunar infarct may affect performance in everydaylife,” Journal of NeurologyNeurosurgery&Psychiatry, vol. 65, no.5, pp. 697–702, 1998.
[11] T. Galski, R. L. Bruno, R. Zorowitz, and J. Walker, “Predictinglength of stay, functional outcome, and aftercare in the reha-bilitation of stroke patients: the dominant role of higher-ordercognition,” Stroke, vol. 24, no. 12, pp. 1794–1800, 1993.
[12] U. Muller, J. Czymmek, A. Thone-Otto, and D. Yves von Cra-mon, “Reduced daytime activity in patients with acquired braindamage and apathy: a study with ambulatory actigraphy,” BrainInjury, vol. 20, no. 2, pp. 157–160, 2006.
[13] S. Zinn, T. K. Dudley, H. B. Bosworth, H. M. Hoenig, P. W.Duncan, and R. D. Horner, “The effect of poststroke cognitiveimpairment on rehabilitation process and functional outcome,”Archives of Physical Medicine and Rehabilitation, vol. 85, no. 7,pp. 1084–1090, 2004.
[14] A. Lundqvist, J. Alinder, and J. Ronnberg, “Factors influencingdriving 10 years after brain injury,” Brain Injury, vol. 22, no. 4,pp. 295–304, 2008.
[15] F. Sagberg, “Driver health and crash involvement: a case-controlstudy,” Accident Analysis & Prevention, vol. 38, no. 1, pp. 28–34,2006.
[16] S. Happe, “Excessive daytime sleepiness and sleep disturbancesin patients with neurological diseases: epidemiology and man-agement,” Drugs, vol. 63, no. 24, pp. 2725–2737, 2003.
[17] C. L. Bassetti and P. Valko, “Poststroke hypersomnia,” SleepMedicine Clinics, vol. 1, no. 1, pp. 139–155, 2006.
[18] R. S. Bourne and G. H. Mills, “Sleep disruption in criticallyill patients—pharmacological ocnsiderations,” Anaesthesia, vol.59, no. 4, pp. 374–384, 2004.
[19] S. M. Lowson and S. Sawh, “Adjuncts to analgesia: sedation andneuromuscular blockade,”Critical Care Clinics, vol. 15, no. 1, pp.119–141, 1999.
[20] M. Novak and C. M. Shapiro, “Drug-induced sleep disturban-ces. Focus on nonpsychotropic medications,” Drug Safety, vol.16, no. 2, pp. 133–149, 1997.
[21] A. Leppavuori, T. Pohjasvaara, R. Vataja,M.Kaste, andT. Erkin-juntti, “Insomnia in ischemic stroke patients,” CerebrovascularDiseases, vol. 14, no. 2, pp. 90–97, 2002.
[22] K. M. Michael, J. K. Allen, and R. F. Macko, “Fatigue afterstroke: relationship to mobility, fitness, ambulatory activity,social support, and falls efficacy,” Rehabilitation Nursing, vol. 31,no. 5, pp. 210–217, 2006.
[23] M.W. Johns, “A newmethod for measuring daytime sleepiness:the Epworth sleepiness scale,” Sleep, vol. 14, no. 6, pp. 540–545,1991.
[24] F. Staub and J. Bogousslavsky, “Post-stroke depression or fa-tigue?” European Neurology, vol. 45, no. 1, pp. 3–5, 2001.
[25] S. Eisenbruch, M. J. Harnish, and W. C. Orr, “Subjectiveand objective sleep quality in irritable bowel syndrome,” TheAmerican Journal of Gastroenterology, vol. 94, no. 9, pp. 2447–2452, 1999.
[26] G. Robert and A. Zadra, “Measuring nightmare and bad dreamfrequency: impact of retrospective and prospective instru-ments,” Journal of Sleep Research, vol. 17, no. 2, pp. 132–139, 2008.
[27] A. G. Harvey, K. Stinson, K. L. Whitaker, D. Moskovitz, and H.Virk, “The subjective meaning of sleep quality: a comparison of
10 BioMed Research International
individuals with and without insomnia,” Sleep, vol. 31, no. 3, pp.383–393, 2008.
[28] T. M. Trudel, W. W. Tryon, and C. M. Purdum, “Awareness ofdisability and long-term outcome after traumatic brain injury,”Rehabilitation Psychology, vol. 43, no. 4, pp. 267–281, 1998.
[29] M. R. Littner, C. Kushida, M. Wise et al., “Practice parametersfor clinical use of the multiple sleep latency test and the mainte-nance of wakefulness test,” Sleep, vol. 28, no. 1, pp. 113–121, 2005.
[30] K. Kaida, M. Takahashi, T. Akerstedt et al., “Validation of theKarolinska sleepiness scale against performance and EEG vari-ables,” Clinical Neurophysiology, vol. 117, no. 7, pp. 1574–1581,2006.
[31] D. A. Kaiser, “Basic principles of quantitative EEG,” Journal ofAdult Development, vol. 12, no. 2-3, pp. 99–104, 2005.
[32] L. Torsvall and T. Akerstedt, “Extreme sleepiness: quantificationof EOGand spectral EEGparameters,”The International Journalof Neuroscience, vol. 38, no. 3-4, pp. 435–441, 1988.
[33] T. Akerstedt and M. Gillberg, “Subjective and objective sleepi-ness in the active individual,” The International Journal ofNeuroscience, vol. 52, no. 1-2, pp. 29–37, 1990.
[34] C. Marzano, F. Fratello, F. Moroni et al., “Slow eye movementsand subjective estimates of sleepiness predict EEG powerchanges during sleep deprivation,” Sleep, vol. 30, no. 5, pp. 610–616, 2007.
[35] C. Cajochen, D. P. Brunner, K. Krauchi, P. Graw, and A. Wirz-Justice, “Power density in theta/alpha frequencies of the wakingEEG progressively increases during sustained wakefulness,”Sleep, vol. 18, no. 10, pp. 890–894, 1995.
[36] S. P. Finnigan, M. Walsh, S. E. Rose, and J. B. Chalk, “Quanti-tative EEG indices of sub-acute ischaemic stroke correlate withclinical outcomes,” Clinical Neurophysiology, vol. 118, no. 11, pp.2525–2532, 2007.
[37] I. P. Lukashevich, V. M. Shklovskii, K. S. Kurkova, R. I. Machin-skaya, G. G. Serova, and N. V. Akopova, “The effects of lesionsto subcortical conducting pathways on the electrical activityof the human cerebral cortex,” Neuroscience and BehavioralPhysiology, vol. 29, no. 3, pp. 283–287, 1999.
[38] K. Nagata, “Topographic EEG mapping in cerebrovasculardisease,” Brain Topography, vol. 2, no. 1-2, pp. 119–128, 1989.
[39] K. Sainio, D. Stenberg, I. Keskimaki, A. Muuronen, and M.Kaste, “Visual and spectral EEG analysis in the evaluation of theoutcome in patients with ischemic brain infarction,” Electroen-cephalography and Clinical Neurophysiology, vol. 56, no. 2, pp.117–124, 1983.
[40] M. F. Folstein, S. E. Folstein, and P. R. McHugh, “Mini mentalstate. A practical method for grading the cognitive state ofpatients for the clinician,” Journal of Psychiatric Research, vol.12, no. 3, pp. 189–198, 1975.
[41] World Medical Association, Declaration of Helsinki: EthicalPrinciples forMedical Research InvolvingHuman Subjects,WorldMedical Association, 2000.
[42] J. van den Berg, G. Neely, L. Nilsson, A. Knutsson, and U.Landstrom, “Electroencephalography and subjective ratings ofsleep deprivation,” Sleep Medicine, vol. 6, no. 3, pp. 231–240,2005.
[43] G. E. Chatrian, E. Lettich, and P. L. Nelson, “Ten percentelectrode system for topographic studies of spontaneous andevoked EEG activities,” The American Journal of EEG Technol-ogy, vol. 25, no. 2, pp. 83–92, 1985.
[44] D. A. Rosenbaum and S. Kornblum, “A priming method forinvestigating the selection of motor responses,” Acta Psycholog-ica, vol. 51, no. 3, pp. 223–243, 1982.
[45] F. Perrin, J. Pernier, O. Bertrand, and J. F. Echallier, “Sphericalsplines for scalp potential and current density mapping,” Elec-troencephalography and Clinical Neurophysiology, vol. 72, no. 2,pp. 184–187, 1989.
[46] L. M. James,Genetic and pharmacological influences on the EEGduring sleep and wakefulness [Ph.D. thesis], Faculty of Healthand Medical Sciences, University of Surrey, 2008.
[47] S. W. Lockley, E. E. Evans, F. A. J. L. Scheer, G. C. Brainard, C.A. Czeisler, andD. Aeschbach, “Short-wavelength sensitivity forthe direct effects of light on alertness, vigilance, and the wakingelectroencephalogram in humans,” Sleep, vol. 29, no. 2, pp. 161–168, 2006.
[48] A. U. Viola, L. M. James, S. N. Archer, and D.-J. Dijk, “PER3polymorphism and cardiac autonomic control: effects of sleepdebt and circadian phase,”TheAmerican Journal of Physiology—Heart and Circulatory Physiology, vol. 295, no. 5, pp. H2156–H2163, 2008.
[49] J. H. Steiger, “Tests for comparing elements of a correlationmatrix,” Psychological Bulletin, vol. 87, no. 2, pp. 245–251, 1980.
[50] T. Yuasa, A.Maeda, S. Higuchi, and Y.Motohashi, “QuantitativeEEG data and comprehensive ADL (Activities of Daily Living)evaluation of stroke survivors residing in the community,” Jour-nal of Physiological Anthropology and Applied Human Science,vol. 20, no. 1, pp. 37–41, 2001.
[51] S. Giaquinto, A. Cobianchi, F. Macera, and G. Nolfe, “EEGrecordings in the course of recovery from stroke,” Stroke, vol.25, no. 11, pp. 2204–2209, 1994.
[52] V. C. Hachinski, M.Mamelak, and J. Morris, “Sleep architectureand recovery from stroke,” inNeuroplasticity: A NewTheraputicTool in the CNS Pathology, R. L. Masland, A. Portera-Sanchez,and G. Toffano, Eds., vol. 12, Liviana Press, Padova, Italy, 1987.
[53] C. Juhasz, A. Kamondi, and I. Szirmai, “Spectral EEG analysisfollowing hemispheric stroke: evidences of transhemisphericdiaschisis,” Acta Neurologica Scandinavica, vol. 96, no. 6, pp.397–400, 1997.
[54] L. A. Finelli, H. Baumann, A. A. Borbely, and P. Achermann,“Dual electroencephalogram markers of human sleep home-ostasis: correlation between theta activity in waking and slow-wave activity in sleep,”Neuroscience, vol. 101, no. 3, pp. 523–529,2000.
[55] C. D. Harris, “Neurophysiology of sleep and wakefulness,”Respiratory Care Clinics of North America, vol. 11, no. 4, pp. 567–586, 2005.
[56] V. N. Kiroy, L. V. Warsawskaya, and V. B. Voynov, “EEGafter prolonged mental activity,” International Journal of Neu-roscience, vol. 85, no. 1-2, pp. 31–43, 1996.
[57] A. S. Smit, P. A. T.M. Eling, andA.M. L. Coenen, “Mental effortaffects vigilance enduringly: after-effects in EEG and behavior,”International Journal of Psychophysiology, vol. 53, no. 3, pp. 239–243, 2004.
[58] E. Sforza, J. Haba-Rubio, F. de Bilbao, T. Rochat, and V. Ibanez,“Performance vigilance task and sleepiness in patients withsleep-disordered breathing,” European Respiratory Journal, vol.24, no. 2, pp. 279–285, 2004.
[59] M. C. Salinsky, B. S. Oken, D. Storzbach, and C. B. Dodrill,“Assessment of CNS effects of antiepileptic drugs by usingquantitative EEG measures,” Epilepsia, vol. 44, no. 8, pp. 1042–1050, 2003.
[60] B. Saletu, J. Grunberger, and P. Rajna, “Pharmaco-EEG profilesof antidepressants. Pharmacodynamic studies with fluvoxam-ine,” British Journal of Clinical Pharmacology, vol. 15, no. 3, 1983.

BioMed Research International 11
[61] B. Saletu, J. Grunberger, and L. Linzmayer, “On central effectsof serotonin re-uptake inhibitors: quantitative EEG and psycho-metric studies with sertraline and zimelidine,” Journal of NeuralTransmission—General Section, vol. 67, no. 3-4, pp. 241–266,1986.

Submit your manuscripts athttp://www.hindawi.com
Stem CellsInternational
Hindawi Publishing Corporationhttp://www.hindawi.com Volume 2014
Hindawi Publishing Corporationhttp://www.hindawi.com Volume 2014
MEDIATORSINFLAMMATION
of
Hindawi Publishing Corporationhttp://www.hindawi.com Volume 2014
Behavioural Neurology
EndocrinologyInternational Journal of
Hindawi Publishing Corporationhttp://www.hindawi.com Volume 2014
Hindawi Publishing Corporationhttp://www.hindawi.com Volume 2014
Disease Markers
Hindawi Publishing Corporationhttp://www.hindawi.com Volume 2014
BioMed Research International
OncologyJournal of
Hindawi Publishing Corporationhttp://www.hindawi.com Volume 2014
Hindawi Publishing Corporationhttp://www.hindawi.com Volume 2014
Oxidative Medicine and Cellular Longevity
Hindawi Publishing Corporationhttp://www.hindawi.com Volume 2014
PPAR Research
The Scientific World JournalHindawi Publishing Corporation http://www.hindawi.com Volume 2014
Immunology ResearchHindawi Publishing Corporationhttp://www.hindawi.com Volume 2014
Journal of
ObesityJournal of
Hindawi Publishing Corporationhttp://www.hindawi.com Volume 2014
Hindawi Publishing Corporationhttp://www.hindawi.com Volume 2014
Computational and Mathematical Methods in Medicine
OphthalmologyJournal of
Hindawi Publishing Corporationhttp://www.hindawi.com Volume 2014
Diabetes ResearchJournal of
Hindawi Publishing Corporationhttp://www.hindawi.com Volume 2014
Hindawi Publishing Corporationhttp://www.hindawi.com Volume 2014
Research and TreatmentAIDS
Hindawi Publishing Corporationhttp://www.hindawi.com Volume 2014
Gastroenterology Research and Practice
Hindawi Publishing Corporationhttp://www.hindawi.com Volume 2014
Parkinson’s Disease
Evidence-Based Complementary and Alternative Medicine
Volume 2014Hindawi Publishing Corporationhttp://www.hindawi.com
Related Documents