Hypercapnia is a Key Correlate of EEG Activation and Daytime Sleepiness in Hypercapnic Sleep-Disordered Breathing Patients David Wang 1,2 PhD, Amanda J Piper 1,2 PhD, Brendon J Yee 1,2,3 PhD, Keith K Wong 1,2,3 PhD, Jong- Won Kim 3,4 PhD, Angela D’Rozario 2,3 BSc (Hons), Luke Rowsell 2 BTech, Derk-Jan Dijk 5 PhD, Ronald R Grunstein 1,2,3 PhD. Affiliations: 1 Department of Respiratory and Sleep Medicine, Royal Prince Alfred Hospital, Sydney, Australia (work performed). 2 Woolcock Institute of Medical Research, University of Sydney. 3 Centre for Integrated Research and Understanding of Sleep (CIRUS), University of Sydney. 4 School of Physics, University of Sydney. 5 Surrey Sleep Research Centre, University of Surrey, UK. Correspondence: Dr. David Wang. Department of Respiratory & Sleep Medicine, Royal Prince Alfred Hospital, Camperdown, NSW 2050, Australia. Ph: +61-2-9114 0446 Fax: +61-2-9515 7196 Email: [email protected] Funded by: Dr David Wang is supported by NHMRC Health Professional Research Fellowship and Sydney Medical School Early Career Researcher/New Staff Award. Prof Ronald Grunstein is supported by NHMRC Practitioner Fellowship. Dr Jong-Won Kim is supported by NHMRC CRE in Respiratory and Sleep Medicine. Conflicts of Interest: No conflicts of interest to declare for all co-authors.

Welcome message from author
This document is posted to help you gain knowledge. Please leave a comment to let me know what you think about it! Share it to your friends and learn new things together.
Transcript

Hypercapnia is a Key Correlate of EEG Activation and Daytime Sleepiness in Hypercapnic
Sleep-Disordered Breathing Patients
David Wang1,2 PhD, Amanda J Piper1,2 PhD, Brendon J Yee1,2,3 PhD, Keith K Wong1,2,3 PhD, Jong-
Won Kim3,4 PhD, Angela D’Rozario2,3 BSc (Hons), Luke Rowsell2 BTech, Derk-Jan Dijk5 PhD,
Ronald R Grunstein1,2,3 PhD.
Affiliations: 1 Department of Respiratory and Sleep Medicine, Royal Prince Alfred Hospital, Sydney,
Australia (work performed). 2 Woolcock Institute of Medical Research, University of Sydney. 3 Centre
for Integrated Research and Understanding of Sleep (CIRUS), University of Sydney. 4School of
Physics, University of Sydney. 5 Surrey Sleep Research Centre, University of Surrey, UK.
Correspondence: Dr. David Wang. Department of Respiratory & Sleep Medicine, Royal Prince
Alfred Hospital, Camperdown, NSW 2050, Australia. Ph: +61-2-9114 0446 Fax: +61-2-9515 7196
Email: [email protected]
Funded by: Dr David Wang is supported by NHMRC Health Professional Research Fellowship
and Sydney Medical School Early Career Researcher/New Staff Award. Prof Ronald Grunstein is
supported by NHMRC Practitioner Fellowship. Dr Jong-Won Kim is supported by NHMRC CRE in
Respiratory and Sleep Medicine.
Conflicts of Interest: No conflicts of interest to declare for all co-authors.

ABBREVIATIONS LIST
ABG arterial blood gas
AHI apnoea-hypopnoea index
BMI body mass index
COPD chronic obstructive pulmonary disease
CPAP continuous positive airway pressure
D/A ratio Delta/Alpha ratio
ECG electrocardiogram
EEG electroencephalography
ESS Epworth Sleepiness Scle
ODI oxygen desaturation index
OHS obesity hypoventilation syndrome
OSA obstructive sleep apnoea
PSG polysomnography
PtcCO2 transcutaneous PCO2
REM rapid eye movement sleep
SDB sleep-disordered breathing

SpO2 oxygen saturation
T90 total sleep time with SpO2<90%
TST total sleep time

ABSTRACT
Background: The key determinants of daytime drowsiness in sleep-disordered breathing (SDB)
are unclear. Hypercapnia has not been examined as a potential contributor due to the lack of
reliable measurement during sleep. To overcome this limitation, we studied predominantly on
hypercapnic SDB patients to investigate the role of hypercapnia on EEG activation and daytime
sleepiness.
Methods: We measured overnight polysomnography (PSG), arterial blood gases, and Epworth
Sleepiness Scale in 55 severe SDB patients with obesity hypoventilation syndrome or overlap
syndrome (COPD+obstructive sleep apnoea) before and ~3 months after positive airway pressure
(PAP) treatment. Quantitative EEG analyses were performed, and the Delta/Alpha ratio was used
as an indicator of EEG activation.
Results: After the PAP treatment, these patients showed a significant decrease in their waking
pCO2, daytime sleepiness, as well as all key breathing/oxygenation parameters during sleep.
Overnight Delta/Alpha ratio of EEG was significantly reduced. There is a significant cross-
correlation between a reduced wake pCO2, a faster (more-activated) sleep EEG (reduced
Delta/Alpha ratio) and reduced daytime sleepiness (all p<0.05) with PAP treatment. Multiple
regression analyses showed the degree of change in hypercapnia to be the only significant
predictor for both ESS and Delta/Alpha ratio.
Conclusions: Hypercapnia is a key correlate of EEG activation and daytime sleepiness in
hypercapnic SDB patients. The relationship between hypercapnia and sleepiness maybe mediated
by reduced neuro-electrical brain activity.

2 | P a g e
Key Words: CO2, O2, EEG Spectra, daytime drowsiness, hypersomnolence, hypoxia, cortical
depression.
3 | P a g e
INTRODUCTION
The key determinants of general sleep-disordered breathing (SDB) related daytime drowsiness are
unclear. Many candidate factors such as intermittent hypoxia, apnoea-hypopnoea index (AHI),
sleep fragmentation, BMI, sleep time, and metabolic factors have been studied, but none show a
strong correlation with daytime sleepiness.1-9 Among those factors, relatively stronger evidence
supports a role for oxygen desaturation index (ODI) or intermittent hypoxia in daytime
sleepiness.1,2,6 However, supplemental O2 does not improve hypersomnolence in obstructive sleep
apnea (OSA) patients despite improving oxygenation.10-12 Similarly, O2 therapy does not improve
neurocognitive or psychosocial performances in hypoxemic, chronic obstructive pulmonary disease
(COPD).13,14 In contrast, some human experimental studies suggest that hypercapnia can cause
impaired mental and psychomotor function.15-18 While SDB is characterized by recurrent episodes
of both hypoxia and hypercapnia, the relationship of hypercapnia to daytime sleepiness in this
patient group has not been investigated.1-5 This omission is likely due to the lack of clinical
equipment to reliably measure continuous pCO2 during the overnight PSG. However, in
hypercapnic SDB patients particularly those with obesity hypoventilation syndrome (OHS) and
overlap syndrome (COPD+OSA), a wide range of pCO2 can be accurately measured during awake
with arterial blood gas (ABG). Therefore this subtype of SDB patients could be an ideal patient
group to investigate the relationship between hypoxia, hypercapnia and daytime sleepiness.
Dose-dependent anesthesia-like effects of CO2 have been previously reported.19 In fact, CO2 has
long been used as a stunning agent to produce unconsciousness during porcine slaughter, while
hypoxia does not produce this effect.20 A clinical study found that untreated OSA patients have

4 | P a g e
slower EEG compared to normal subjects which is not related to hypoxia. CPAP treatment
corrected the EEG slowing together with reduced daytime sleepiness.21 Recently we observed that
respiratory failure patients have a paradoxically high percentage of slow wave sleep, and awake
pCO2 measured by ABG is the best predictor variable for the EEG change.22 Furthermore,
progressive hypercapnia but not hypoxia decreases EEG activation measured by an increased
EEG Delta/Alpha (D/A) ratio.23
Given these findings, we hypothesized that in hypercapnic SDB patients, the decrease in
hypercapnia, but not hypoxia, is a key correlate for the improvement in daytime sleepiness, and
may cross-correlate with changes in EEG spectral power, such as D/A ratio reflecting changes in
EEG activation.21,24-26 We conducted an observational study using PAP treatment to test these
hypotheses.
METHODS
The clinical study was conducted at the clinical sleep laboratory of Royal Prince Alfred Hospital
(RPAH), a major teaching hospital of the University of Sydney. The study protocol was originally
designed to test clinical outcomes of OHS patients receiving CPAP/BiPAP treatment over a 3-
month period. Data of the present study come from post-hoc analyses of the original study. The
study protocol was approved by Sydney South West Area Health Service Ethics Review
Committee (Protocol Numbers: X03-0022). All participants provided written informed consent. The
Australian & New Zealand Clinical Trial Registry number is ACTRN12605000096651.
5 | P a g e
Patients and Procedure
Study patients were consecutive patients recruited from the Sleep and Respiratory Failure Clinics
of RPAH. We sampled late afternoon awake ABG in predominantly hypercapnic patients with
severe SDB. Fifty-five OSA patients with either OHS or overlap syndrome (COPD+OSA)
underwent two overnight PSGs before and after ~3 months Continuous/Bi-level Positive Airway
Pressure (PAP) treatment. The recruited patients had daytime hypercapnia (arterial pCO2 >45
mmHg) and/or frequent hypoventilation with significant oxygen desaturations during the initial
diagnostic PSG studies. Hypoventilation was defined by an awake daytime pCO2 > 45mmHg or
during sleep a sustained fall in SpO2 > 4% from baseline values accompanied by a rise in PtcCO2>
8mmHg. COPD was defined as FEV1/FVC ratio <70%, with severity based on percent of predicted
FEV1 (GOLD criteria, www.goldcopd.com). We included both OHS and overlap syndrome patients
considering that the effect of hypercapnia/hypoxia may share a common mechanism in affecting
EEG and daytime sleepiness. Quantitative EEG spectral analyses were performed on the overnight
PSG recordings. The Epworth Sleepiness Scale (ESS), a widely used measure of subjective
daytime sleepiness was calculated in each patient.27
PSG
Overnight standard in-laboratory PSG was performed (between 10 pm and 7 am) using either
Compumedics E series (Compumedics; Victoria, Australia) or Alice 4 & 5 (Respironics, USA)
diagnostic sleep systems. Each PSG included 4 channels of electroencephalogram (EEG) (C3/A2,
C4/A1, O1/A2, O2/A1), 2 channels of electrooculogram, chin electromyelogram, anterior tibial

6 | P a g e
electromyelogram, electrocardiogram (ECG), body position, nasal pressure, chest and abdomen
movements, and SpO2. PSG recordings were scored by experienced sleep technologists using
standard criteria.28-30 Respiratory events were scored according to Chicago criteria 29, but no
respiratory effort-related arousal events were marked. Sleep arousals were scored according to the
American Sleep Disorder Association task force criteria.30 AHI was calculated by dividing the total
number of apnoeas and hypopnoeas by the total sleep time (hours). ODI was calculated by
dividing the total number of SpO2 dips by the total sleep time (hours).
EEG Spectral Analyses
We converted all EEG recordings to European Data Format for the spectral analyses. We analysed
the EEG power spectra for each 5-second segment. To minimize blinking artefact in the EEG we
encouraged all subjects to keep eyes open and stare at a relaxing picture on the wall during each
testing session of the experimental study. In addition, we used subjects as their control to minimize
behaviour confounders by comparing before-and-after intervention. All EEG study sampling rates
were >200 Hz. A standard fast fourier transform with a rectangular weighting window was
performed twice: first, to the largest power of 2 data points smaller than the total number of data
points, selected from the beginning of the segment, and second, to the same number of data points
selected from the end. This double fast fourier transform method weights middle-data-points. Delta,
theta, alpha and beta bands were defined as the frequency ranges 0.5–4.5, 4.5–8, 8–12, 12-32 Hz,
respectively, appropriate for typical adults. The EEGs were then further examined by an automatic
algorithm which excluded EEG segments showing excessive delta power using a standard two
sigma rule (i.e., median + 2 standard deviations). For our statistical analysis, we focused primarily

7 | P a g e
on the EEG recorded at C3/A2. However, when the C3 channel was contaminated by excessive
artefacts, we used C4/A1 as alternative channel.
Statistical Analyses
Descriptive data were expressed as mean ± SD, unless otherwise stated. Pair-wise comparisons
were tested by paired t-test or Wilcoxon signed-rank test depending on the normality of data
distribution. Unpaired t-tests and Mann-Whitney U tests were used for between group comparisons
where appropriate. Associations were tested by either Pearson’s or Spearman’s tests also based
on normality of distribution. Among the EEG spectral measures, Delta/Alpha ratio was the primary
outcome of interest. ESS is the other primary outcome of interest. Stepwise multiple linear
regression analyses were used to identify factors contributing to the variance of ESS and D/A ratio
respectively. A p-value of less than 0.05 was considered as significant. Analyses were performed
using SPSS 17 (SPSS, Chicago, USA).
RESULTS
From the 55 patients tested, we obtained satisfactory data in 41 patients (30M, 11F, Aged 54.6 ±
12.8 years). Data were excluded due to either an unsatisfactory EEG quality for spectral analyses
or failure to take blood for ABG in any phase of the study. Thirty two EEG spectra data were
analyzed from C3/A2 channel and nine were analyzed from C4/A1 channel. Within these 41
patients, 26 had OHS and 15 had Overlap syndrome. Twenty-five patients received BiPAP
treatment and 16 received CPAP treatment. The treatment option was allocated randomly as a part
of the original study protocol in comparing the therapeutic outcomes of CPAP and BiPAP. Three

8 | P a g e
patients were using O2 supplementation during taking blood samples for ABG and during the initial
diagnostic PSG. No patient had central apnea index > 5/hr either in baseline or after PAP treatment.
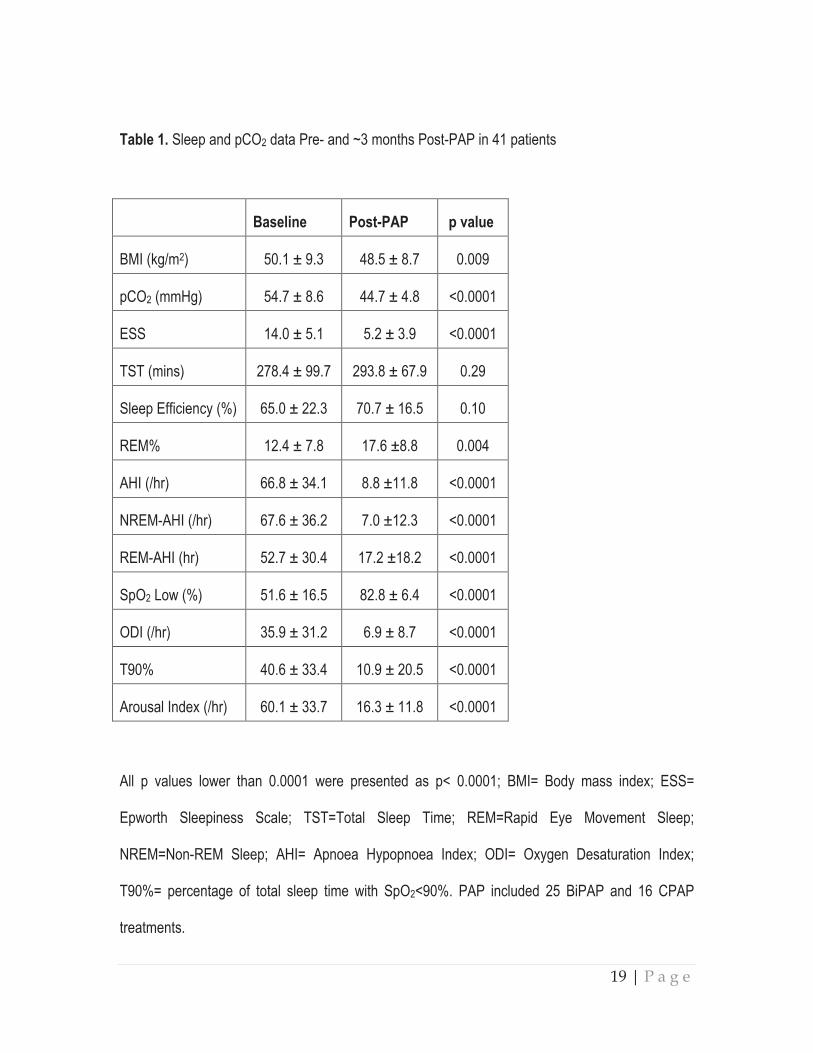
As shown in Table 1, after ~3 months PAP treatment, patients showed a significant decrease in
their waking pCO2, daytime sleepiness, as well as all key breathing/oxygenation parameters during
sleep. BMI also decreased slightly. Similar to our previous report 31, no difference was found
between the options of CPAP and BiPAP in improving awake pCO2 (p=0.27) and SpO2 nadir
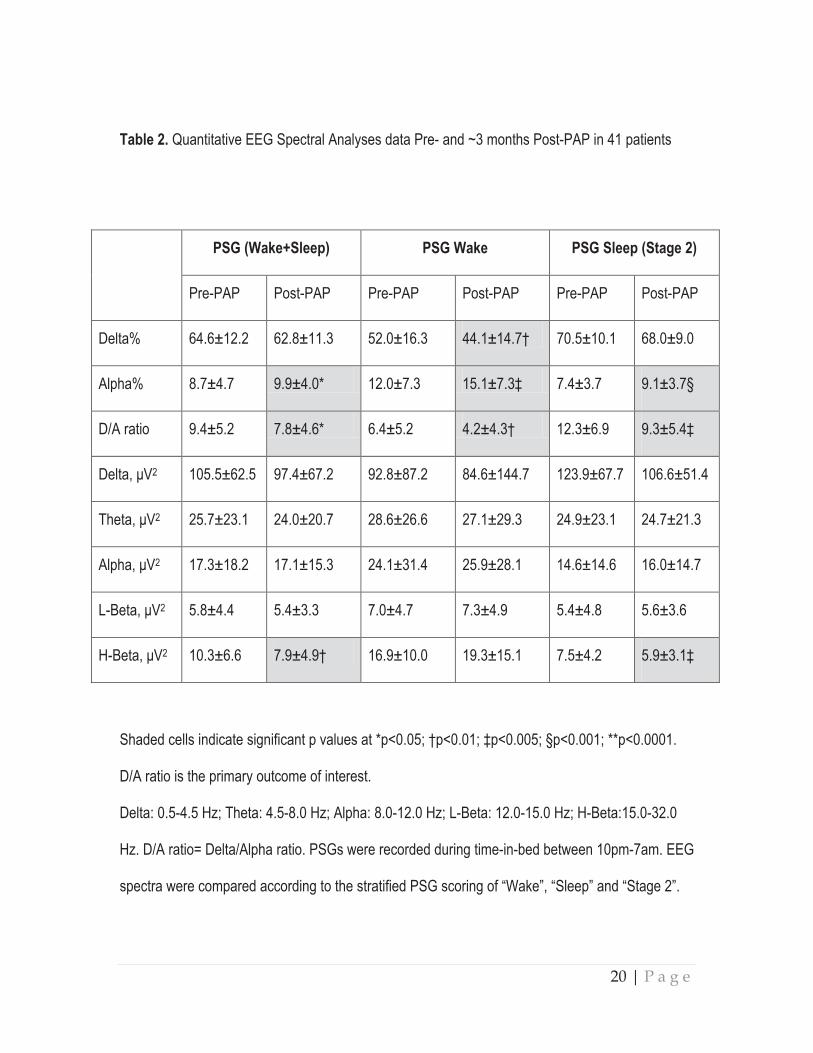
during sleep (p= 0.62) in the present study. EEG spectral analyses showed that the D/A ratio of
EEG was significantly reduced during both sleeping and waking periods, indicating a generally
faster, more activated, EEG spectral profile following treatment (Table 2). There was also a
reduction in High-Beta power (15-32 Hz) after the PAP treatment (Table 2). This reduction was
correlated with the decrease in arousal index (r=0.33, p<0.05).
A cross-correlation was observed between a reduced wake pCO2, a faster (more-activated) EEG
(reduced D/A ratio) and reduced daytime sleepiness (Table 3, Figure 1). The cross-correlation
pattern was similar between OHS and Overlap syndrome subtypes of patients as shown in Figure
1. Specifically, there was a consistent pattern of positive correlations between the change
of %Delta and ESS and pCO2; and negative correlations between the change of %Alpha and ESS
and pCO2 (Table 3). The ESS change also correlated significantly with waking pCO2 change
(r=0.42, p=0.007) (Figure 1). This pattern of the cross-correlations existed in both waking and
sleeping periods of the PSG recordings (Table 3).
9 | P a g e
Given that many related parameters such as hypoxia, hypercapnia, arousal index and BMI were
improved after the PAP treatment (Table 1), we conducted multiple linear regression analyses,
using the changes in ESS and D/A ratio as dependent variables respectively. Using the change of
ESS as the dependent variable, the only significant predictor was pCO2 change; explaining 15% of
the variance of ESS (t=2.44, p=0.02). The change in ODI was the second best predictor but was
not statistically significant, explaining only 7% of the variance in ESS. Other variables such as the
changes in REM%, AHI, SpO2 nadir, BMI, D/A ratio, arousal index and sleep efficiency, were not
significantly associated with the ESS. In regression analyses using the change of D/A ratio as the
dependent variable, pCO2 change was again the only significant predictor, explaining 27% of the
variance in D/A ratio (t=3.51, p=0.001). SpO2 nadir was the second best predictor (not significant),
explaining only 4% of variance of D/A ratio. Other non-significant predictor variables were the
changes of BMI, arousal index, AHI, sleep efficiency, and ODI, respectively.
DISCUSSION
We have demonstrated that hypercapnia but not hypoxia is a key correlate of both daytime
sleepiness and EEG activation in patients with hypercapnic SDB. The decrease in hypercapnia
was the best predictor of both reduction in daytime sleepiness and increase in EEG activation
(reduced D/A ratio). We speculate that hypercapnia may cause daytime sleepiness through a
reduction in brain activation in a hypercapnic SDB population.
SDB is usually associated with cyclic patterns of hypoxia and hypercapnia. In the present study, we
demonstrated a significant cross-correlation between a reduced waking pCO2, a faster, more
10 | P a g e
activated EEG spectral profile, and a reduced reported daytime sleepiness. Using multiple linear
regression modeling, we demonstrated that hypercapnia accounted for more than double the
variance of ESS compared to ODI (a measure of intermittent hypoxia frequency), and nearly 7
times the variance in EEG spectral (D/A ratio) compared to hypoxic severity. By contrast, hypoxia
was not a significant predictor for the variance of ESS, although it is still a better predictor than AHI,
arousal index, BMI and sleep efficiency.
We are not aware of any previous study showing hypercapnia as co-varying with hypersomnolence
in any subtypes of SDB.1-7 In the largest PAP intervention trial in sleep apnea, measures of hypoxia
were only weakly associated with ESS, explaining <2% of the variance. The degree of hypercapnia
in their study patients was unknown.6 In another large study of determinants of sleepiness in 2882
OSA patients,32 there was no real difference in hypoxia between those patients with or without
sleepiness (only 1% difference). Interestingly, OSA patients with excess sleepiness had increased
slow wave sleep compared to the non-sleepy patients, supporting a correlation between daytime
sleepiness and a slower EEG spectral activity.32 pCO2 was not measured in this study.32
Importantly, if hypoxia is a key factor in sleepiness, then hypersomnolence should be alleviated by
giving supplemental O2. However, this prediction is not supported by the few relevant studies.10-13
Our notion that hypercapnia affects cerebral neural activity is supported by a number of
experimental animal and human studies. Hypercapnia, acute or chronic, leads to the slowing of
EEG in eels,33 rats,34 rabbits,35 dogs36 and monkeys.37 In human experimental studies,
hypercapnia led to slower EEG spectral activity with decreased alpha and beta activity 38-42 and
11 | P a g e
increased delta activity39. A recent study tested the effects of mild hypercapnia (5% CO2) on
magnetoencephalogram, event-related potentials, auditory pattern recognition, and visual semantic
tasks in 7 healthy volunteers.41 Hypercapnia attenuated evoked and spontaneous
magnetoencephalogram spectral activity. In addition, comparable decreases were observed in
early sensory components in both auditory and visual modalities as well as cognitive components
related to memory and language, and the depressant effects were distributed across all cortical
regions.41 Similarly, a few experimental studies reported dose-response relationship between
higher CO2 tensions and impaired cognitive and psychomotor performance.15-17 In addition,
breathing of CO2 was reported to attenuate sensory and affective components of experimental
ischemic pain and produce a dose-dependent elevation of heat pain threshold.19 In this context,
80% CO2 is commonly used as a porcine stunning agent to produce unconsciousness before
slaughtering; hypoxia does not produce a similar anesthethetic effect.20,43 Given these data,
exposure to sustained hypercapnia or possibly even brief bursts of intermittent hypercapnia in
sleep-disordered breathing may result in drowsiness secondary to reduced brain neuro-electrical
activation and overall depression of cortical activity.
In our studies, we used the Delta/Alpha ratio obtained from EEG spectral analyses as an objective
marker of EEG activation which correlated to daytime sleepiness. An important consideration is
that the D/A ratio can avoid the misinterpretation of an increased Delta power purely caused by a
global, frequency independent, increase in EEG power. Ratios of slow and fast EEG frequency
bands are commonly used in neurological studies to indicate activation of EEG.21,24-26 D/A ratio has
been previously identified as the best discriminator between wake, and Stage 1, 2 and slow wave

12 | P a g e
sleep,26 and the best brain bio-marker correlating to the clinical outcomes of sub-acute ischemic
stroke.24
In the present study we only examined severe SDB patients with awake hypercapnia, so our
findings may not apply to SDB patients in general, especially mild-moderate OSA patients,
although the mechanism may play a role. To study the less severe SDB patients requires a fully-
validated and accurate continuous measure of pCO2, fast enough to respond to the rapid changes
due to respiratory events. Such a machine is currently not available. The commonly used
transcutaneous pCO2 (PtcCO2) measurement are often affected by a drifting artefact, while a CO2
analyzer connected to nasal cannula cannot sample expired air during a prolonged apnoea. We
speculate that in milder SDB patients, the daytime hypersomnolence would be affected by the CO2
mechanisms of 1) cyclic hypercapnia episodes during apnoea; 2) mild hypercapnia in daytime; and
3) SDB related chemoreflex changes particularly those CO2 related factors such as CO2 threshold.
Indeed, even in healthy individuals, average resting pCO2 may vary largely, ranging from 32 to 44
mmHg.44
There are a number of limitations to the study. This is not a prospective study originally designed to
serve the purpose. The data were retrieved from post-hoc analyses of an interventional clinical
study. Those patients were randomly allocated to BiPAP or CPAP treatment, thus the PAP
treatment they were receiving might not be fully tailored to individual clinical conditions. There was
still some residual SDB after PAP treatment. Three patients were using O2 supplementation during
blood sampling for ABG and during the initial diagnostic PSG which could affect pCO2 and SpO2
13 | P a g e
results. In addition, most of our patients were taking different medications and it is not possible to
obtain a medication free severe SDB patients group. Nevertheless, our study used patients as their
own control, so that the effect of this potential confounding factor was minimized. Furthermore, our
studies relied on self-reported measures of sleepiness. A further study using multiple sleep latency
test or maintenance of wakefulness test to quantify daytime sleepiness in addition to ESS and EEG
spectral analyses would be more definitive. Moreover, the sampling rate of our two PSG systems
was slightly different, being 256 Hz for Compumedics and 200 Hz for Alice. Nevertheless, as the
primary outcome of interest of the present study is Delta/Alpha Ratio (rather than an absolute
spectral power) as an EEG activation marker, the potential confounding effect on our conclusion is
therefore minimal. The last, it would be of interest to examine neuro-metabolic imaging during
hypercapnia to clarify the relationship between hypercapnia, a slower EEG spectral profile and
hypersomnolence.
In conclusion, we identified that in hypercapnic SDB population, hypercapnia is a key correlate of
SDB-related daytime sleepiness, and there is a significant cross-correlation between the changes
of hypercapnia, EEG spectral activity and daytime sleepiness. We speculate that hypercapnia may
cause drowsiness through a reduced brain neuro-electrical activation in this population. Whether
similar mechanisms also apply to less severe SDB patients without daytime hypercapnia deserve
further investigation.

14 | P a g e
REFERENCES
1. Dempsey JA, Veasey SC, Morgan BJ, O'Donnell CP. Pathophysiology of sleep apnea.
Physiol Rev 2010;90:47-112.
2. Engleman HM, Douglas NJ. Sleep. 4: Sleepiness, cognitive function, and quality of life in
obstructive sleep apnoea/hypopnoea syndrome. Thorax 2004;59:618-22.
3. Koehler U, Apelt S, Augsten M, et al. Daytime sleepiness in patients with Obstructive
Sleep Apnoea (OSA) - pathogenetic factors. Pneumologie 2011;65:137-42.
4. Kingshott RN, Vennelle M, Hoy CJ, Engleman HM, Deary IJ, Douglas NJ. Predictors of
improvements in daytime function outcomes with CPAP therapy. Am J Respir Crit Care
Med 2000;161:866-71.
5. Roth T, Roehrs T, Rosenthal L. Hypersomnolence and neurocognitive performance in
sleep apnea. Curr Opin Pulm Med 1995;1:488-90.
6. Quan SF, Chan CS, Dement WC, et al. The association between obstructive sleep apnea
and neurocognitive performance--the Apnea Positive Pressure Long-term Efficacy Study
(APPLES). Sleep 2011;34:303-14B.
7. Lal C, Strange C, Bachman D. Neurocognitive impairment in obstructive sleep apnea.
Chest 2012;141:1601-10.
8. Vgontzas AN, Bixler EO, Chrousos GP. Metabolic disturbances in obesity versus sleep
apnoea: the importance of visceral obesity and insulin resistance. J Intern Med
2003;254:32-44.
15 | P a g e
9. Vgontzas AN, Papanicolaou DA, Bixler EO, Kales A, Tyson K, Chrousos GP. Elevation of
plasma cytokines in disorders of excessive daytime sleepiness: role of sleep disturbance
and obesity. J Clin Endocrinol Metab 1997;82:1313-6.
10. Gold AR, Schwartz AR, Bleecker ER, Smith PL. The effect of chronic nocturnal oxygen
administration upon sleep apnea. Am Rev Respir Dis 1986;134:925-9.
11. Lim W, Bardwell WA, Loredo JS, et al. Neuropsychological effects of 2-week continuous
positive airway pressure treatment and supplemental oxygen in patients with obstructive
sleep apnea: a randomized placebo-controlled study. J Clin Sleep Med 2007;3:380-6.
12. Phillips BA, Schmitt FA, Berry DT, Lamb DG, Amin M, Cook YR. Treatment of obstructive
sleep apnea. A preliminary report comparing nasal CPAP to nasal oxygen in patients with
mild OSA. Chest 1990;98:325-30.
13. Pretto JJ, McDonald CF. Acute oxygen therapy does not improve cognitive and driving
performance in hypoxaemic COPD. Respirology 2008;13:1039-44.
14. Lahdensuo A, Ojanen M, Ahonen A, et al. Psychosocial effects of continuous oxygen
therapy in hypoxaemic chronic obstructive pulmonary disease patients. Eur Respir J
1989;2:977-80.
15. Fothergill DM, Hedges D, Morrison JB. Effects of CO2 and N2 partial pressures on
cognitive and psychomotor performance. Undersea Biomed Res 1991;18:1-19.
16. Henning RA, Sauter SL, Lanphier EH, Reddan WG. Behavioral effects of increased CO2
load in divers. Undersea Biomed Res 1990;17:109-20.
17. Hesser CM, Fagraeus L, Adolfson J. Roles of nitrogen, oxygen, and carbon dioxide in
compressed-air narcosis. Undersea Biomed Res 1978;5:391-400.
18. Sayers JA, Smith RE, Holland RL, Keatinge WR. Effects of carbon dioxide on mental
performance. J Appl Physiol 1987;63:25-30.

16 | P a g e
19. Gronroos M, Pertovaara A. A selective suppression of human pain sensitivity by carbon
dioxide: central mechanisms implicated. Eur J Appl Physiol Occup Physiol 1994;68:74-9.
20. Erhardt W, Ring C, Kraft H, et al. CO2-stunning of swine for slaughter from the
anesthesiological viewpoint. DTW Deutsche tierarztliche Wochenschrift 1989;96:92-9.
21. Morisson F, Decary A, Petit D, Lavigne G, Malo J, Montplaisir J. Daytime sleepiness and
EEG spectral analysis in apneic patients before and after treatment with continuous
positive airway pressure. Chest 2001;119:45-52.
22. Wang D, Piper AJ, Wong KK, et al. Slow wave sleep in patients with respiratory failure.
Sleep Med 2011;12:378-83.
23. Wang D, Piper AJ, Yee BJ, et al. Hypercapnia: New insights into sleep-disordered
breathing related daytime sleepiness. Sleep 2013;36:173A.
24. Finnigan SP, Walsh M, Rose SE, Chalk JB. Quantitative EEG indices of sub-acute
ischaemic stroke correlate with clinical outcomes. Clin Neurophysiol 2007;118:2525-32.
25. Moraes Wdos S, Poyares DR, Guilleminault C, Ramos LR, Bertolucci PH, Tufik S. The
effect of donepezil on sleep and REM sleep EEG in patients with Alzheimer disease: a
double-blind placebo-controlled study. Sleep 2006;29:199-205.
26. Susmakova K, Krakovska A. Classification of Waking, Sleep Onset and Deep Sleep by
Single Measures. In: Measurement Science Review, Volume 7, Section 2, No 4, available
at http://wwwmeasurementsk/2007/S2/Susmakovapdf; 2007.
27. Johns MW. A new method for measuring daytime sleepiness: the Epworth sleepiness
scale. Sleep 1991;14:540-5.
28. Rechtschaffen A, Kales A. A manual of standardized terminology, techniques and scoring
systems for sleep stages of human subjects. Washington, D. C.: Public Health Services,
U.S. Government Printing Office; 1968.
17 | P a g e
29. AASM Task Force. Sleep-related breathing disorders in adults: recommendations for
syndrome definition and measurement technique in clinical research. Sleep 1999;22:667-
89.
30. American Sleep Disorders Association. EEG arousals: scoring rules and examples: a
preliminary report from the Sleep Disorders Atlas Task Force of the American Sleep
Disorders Association. Sleep 1992;15:173-84.
31. Piper AJ, Wang D, Yee BJ, Barnes DJ, Grunstein RR. Randomised trial of CPAP vs bilevel
support in the treatment of obesity hypoventilation syndrome without severe nocturnal
desaturation. Thorax 2008;63:395-401.
32. Roure N, Gomez S, Mediano O, et al. Daytime sleepiness and polysomnography in
obstructive sleep apnea patients. Sleep Med 2008;9:727-31.
33. Barthelemy L, Mabin D, Belaud A, Peyraud C. [Electrical activity of the brain of the eel
(Anguilla anguilla L.) subjected to hypoxia and hypercapnia]. J Physiol (Paris)
1977;73:1035-44.
34. Forslid A, Ingvar M, Rosen I, Ingvar DH. Carbon dioxide narcosis: influence of short-term
high concentration carbon dioxide inhalation on EEG and cortical evoked responses in the
rat. Acta Physiol Scand 1986;127:281-7.
35. Matakas F, Birkle J, Cervos-Navarro J. The effect of prolonged experimental hypercapnia
on the brain. Acta Neuropathol 1978;41:207-10.
36. Smith LJ, Greene SA, Moore MP, Keegan RD. Effects of altered arterial carbon dioxide
tension on quantitative electroencephalography in halothane-anesthetized dogs. Am J Vet
Res 1994;55:467-71.
18 | P a g e
37. Zappe AC, Uludag K, Oeltermann A, Ugurbil K, Logothetis NK. The influence of moderate
hypercapnia on neural activity in the anesthetized nonhuman primate. Cereb Cortex
2008;18:2666-73.
38. Bloch-Salisbury E, Lansing R, Shea SA. Acute changes in carbon dioxide levels alter the
electroencephalogram without affecting cognitive function. Psychophysiology 2000;37:418-
26.
39. Halpern P, Neufeld MY, Sade K, et al. Middle cerebral artery flow velocity decreases and
electroencephalogram (EEG) changes occur as acute hypercapnia reverses. Intensive
Care Med 2003;29:1650-5.
40. Kalkman CJ, Boezeman EH, Ribberink AA, Oosting J, Deen L, Bovill JG. Influence of
changes in arterial carbon dioxide tension on the electroencephalogram and posterior tibial
nerve somatosensory cortical evoked potentials during alfentanil/nitrous oxide anesthesia.
Anesthesiology 1991;75:68-74.
41. Thesen T, Leontiev O, Song T, et al. Depression of cortical activity in humans by mild
hypercapnia. Human brain mapping 2012;33:715-26.
42. Woodbury DM, Karler R. The role of carbon dioxide in the nervous system. Anesthesiology
1960;21:686-703.
43. Hartung J, Nowak B, Waldmann KH, Ellerbrock S. CO2-stunning of slaughter pigs: effects
on EEG, catecholamines and clinical reflexes. DTW Deutsche tierarztliche Wochenschrift
2002;109:135-9.
44. Shea SA, Walter J, Murphy K, Guz A. Evidence for individuality of breathing patterns in
resting healthy man. Respir Physiol 1987;68:331-44.
19 | P a g e
Table 1. Sleep and pCO2 data Pre- and ~3 months Post-PAP in 41 patients
Baseline Post-PAP p value
BMI (kg/m2) 50.1 ± 9.3 48.5 ± 8.7 0.009
pCO2 (mmHg) 54.7 ± 8.6 44.7 ± 4.8 <0.0001
ESS 14.0 ± 5.1 5.2 ± 3.9 <0.0001
TST (mins) 278.4 ± 99.7 293.8 ± 67.9 0.29
Sleep Efficiency (%) 65.0 ± 22.3 70.7 ± 16.5 0.10
REM% 12.4 ± 7.8 17.6 ±8.8 0.004
AHI (/hr) 66.8 ± 34.1 8.8 ±11.8 <0.0001
NREM-AHI (/hr) 67.6 ± 36.2 7.0 ±12.3 <0.0001
REM-AHI (hr) 52.7 ± 30.4 17.2 ±18.2 <0.0001
SpO2 Low (%) 51.6 ± 16.5 82.8 ± 6.4 <0.0001
ODI (/hr) 35.9 ± 31.2 6.9 ± 8.7 <0.0001
T90% 40.6 ± 33.4 10.9 ± 20.5 <0.0001
Arousal Index (/hr) 60.1 ± 33.7 16.3 ± 11.8 <0.0001
All p values lower than 0.0001 were presented as p< 0.0001; BMI= Body mass index; ESS=
Epworth Sleepiness Scale; TST=Total Sleep Time; REM=Rapid Eye Movement Sleep;
NREM=Non-REM Sleep; AHI= Apnoea Hypopnoea Index; ODI= Oxygen Desaturation Index;
T90%= percentage of total sleep time with SpO2<90%. PAP included 25 BiPAP and 16 CPAP
treatments.
20 | P a g e
Table 2. Quantitative EEG Spectral Analyses data Pre- and ~3 months Post-PAP in 41 patients
PSG (Wake+Sleep) PSG Wake PSG Sleep (Stage 2)
Pre-PAP Post-PAP Pre-PAP Post-PAP Pre-PAP Post-PAP
Delta% 64.6±12.2 62.8±11.3 52.0±16.3 44.1±14.7† 70.5±10.1 68.0±9.0
Alpha% 8.7±4.7 9.9±4.0* 12.0±7.3 15.1±7.3‡ 7.4±3.7 9.1±3.7§
D/A ratio 9.4±5.2 7.8±4.6* 6.4±5.2 4.2±4.3† 12.3±6.9 9.3±5.4‡
2 105.5±62.5 97.4±67.2 92.8±87.2 84.6±144.7 123.9±67.7 106.6±51.4
2 25.7±23.1 24.0±20.7 28.6±26.6 27.1±29.3 24.9±23.1 24.7±21.3
2 17.3±18.2 17.1±15.3 24.1±31.4 25.9±28.1 14.6±14.6 16.0±14.7
L- 2 5.8±4.4 5.4±3.3 7.0±4.7 7.3±4.9 5.4±4.8 5.6±3.6
H- 2 10.3±6.6 7.9±4.9† 16.9±10.0 19.3±15.1 7.5±4.2 5.9±3.1‡
Shaded cells indicate significant p values at *p<0.05; †p<0.01; ‡p<0.005; §p<0.001; **p<0.0001.
D/A ratio is the primary outcome of interest.
Delta: 0.5-4.5 Hz; Theta: 4.5-8.0 Hz; Alpha: 8.0-12.0 Hz; L-Beta: 12.0-15.0 Hz; H-Beta:15.0-32.0
Hz. D/A ratio= Delta/Alpha ratio. PSGs were recorded during time-in-bed between 10pm-7am. EEG
spectra were compared according to the stratified PSG scoring of “Wake”, “Sleep” and “Stage 2”.
21 | P a g e
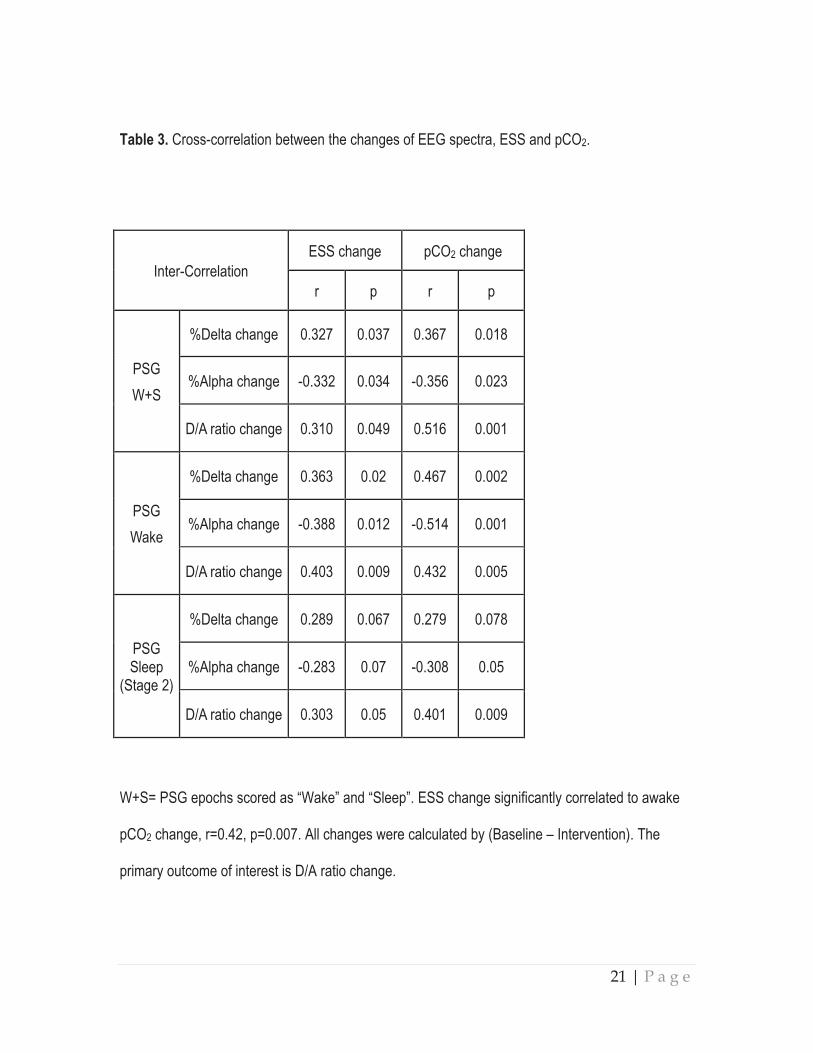
Table 3. Cross-correlation between the changes of EEG spectra, ESS and pCO2.
Inter-Correlation
ESS change pCO2 change
r p r p
PSG
W+S
%Delta change 0.327 0.037 0.367 0.018
%Alpha change -0.332 0.034 -0.356 0.023
D/A ratio change 0.310 0.049 0.516 0.001
PSG
Wake
%Delta change 0.363 0.02 0.467 0.002
%Alpha change -0.388 0.012 -0.514 0.001
D/A ratio change 0.403 0.009 0.432 0.005
PSG Sleep
(Stage 2)
%Delta change 0.289 0.067 0.279 0.078
%Alpha change -0.283 0.07 -0.308 0.05
D/A ratio change 0.303 0.05 0.401 0.009
W+S= PSG epochs scored as “Wake” and “Sleep”. ESS change significantly correlated to awake
pCO2 change, r=0.42, p=0.007. All changes were calculated by (Baseline – Intervention). The
primary outcome of interest is D/A ratio change.

22 | P a g e
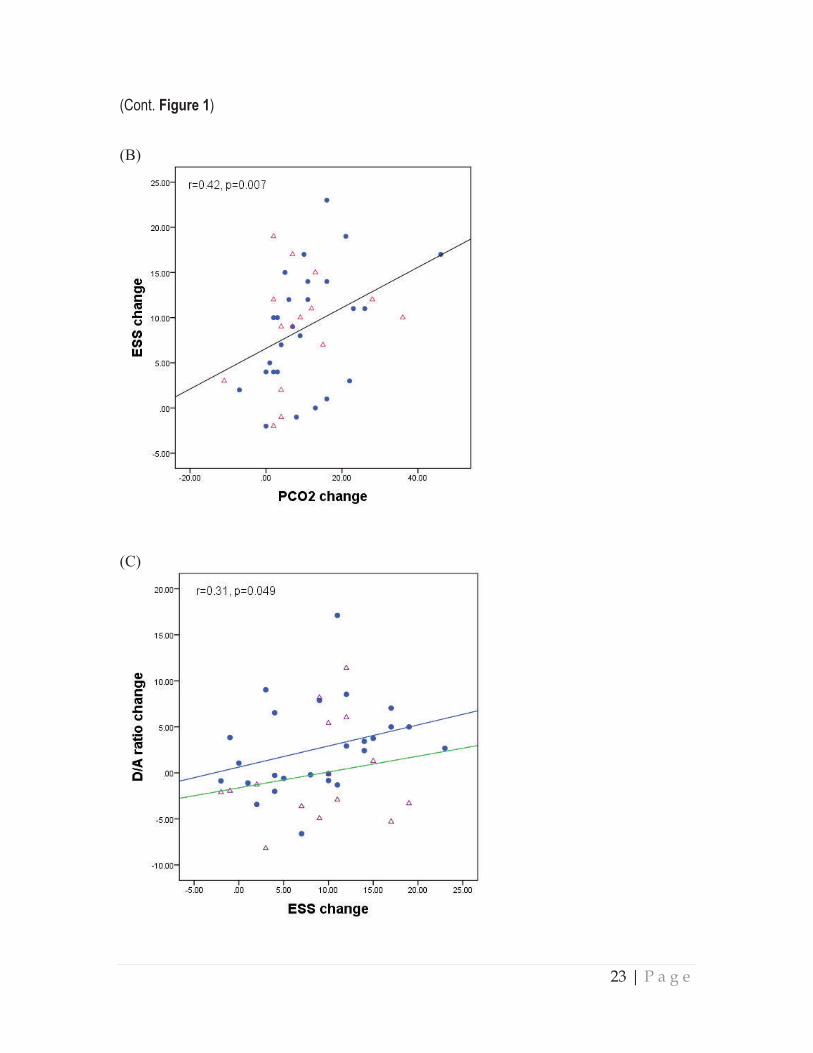
Figure 1. Inter-correlations between the changes of pCO2, EEG Delta/Alpha ratio and ESS before
and after PAP treatment. The 3 panels show consistent pattern of relationships between OHS and
Overlap subtypes. Panel (C) shows that even though the overall correlation between the changes
of ESS and D/A ratio is relevantly loose (p=0.049), the OHS and Overlap subgroups show a similar
pattern of relationship.
(A)
(Cont. next page)
23 | P a g e
(Cont. Figure 1)
(B)
(C)
Related Documents