Top Banner
Quantitative Analysis of the Ideal Free Distribution G. Ramirez, G. Huete, T. Knight, K. Heard, and D. Bellinger University of Miami Department of Biology Coral Gables, Florida, USA
27

Quantitative Analysis of the Ideal Free Distribution G. Ramirez, G. Huete, T. Knight, K. Heard, and D. Bellinger University of Miami Department of Biology.

Dec 16, 2015

Download

Documents

Macy Lathe
Welcome message from author
This document is posted to help you gain knowledge. Please leave a comment to let me know what you think about it! Share it to your friends and learn new things together.
Transcript
Page 1: Quantitative Analysis of the Ideal Free Distribution G. Ramirez, G. Huete, T. Knight, K. Heard, and D. Bellinger University of Miami Department of Biology.

Quantitative Analysis of the Ideal Free

Distribution

G. Ramirez, G. Huete, T. Knight, K. Heard, and D. Bellinger

 University of Miami

Department of BiologyCoral Gables, Florida, USA

Page 2: Quantitative Analysis of the Ideal Free Distribution G. Ramirez, G. Huete, T. Knight, K. Heard, and D. Bellinger University of Miami Department of Biology.

Outline

• Introduction: Gabriela Huete• Methods: Desmond Bellinger• Results: Keandre Heard• Discussion and conclusion: Trenton

Knight • Acknowledgments: Gabby Ramirez

Page 3: Quantitative Analysis of the Ideal Free Distribution G. Ramirez, G. Huete, T. Knight, K. Heard, and D. Bellinger University of Miami Department of Biology.

INTRODUCTION

• Ecologists attempt to establish general behavioral rules of animals.

• One of the most well-known generalizations is the Ideal Free Distribution hypothesis (Fretwell and Lucas, 1970).

• This ecological term basically refers to the way animals distribute themselves in their natural environment.

Page 4: Quantitative Analysis of the Ideal Free Distribution G. Ramirez, G. Huete, T. Knight, K. Heard, and D. Bellinger University of Miami Department of Biology.

Example: 12 turtles are presented 2 groups of food. The food ratio is 3:1.

Page 5: Quantitative Analysis of the Ideal Free Distribution G. Ramirez, G. Huete, T. Knight, K. Heard, and D. Bellinger University of Miami Department of Biology.

According to the Ideal Free Distribution, the turtles should distribute themselves in proportion to the food, 9:3.

Page 6: Quantitative Analysis of the Ideal Free Distribution G. Ramirez, G. Huete, T. Knight, K. Heard, and D. Bellinger University of Miami Department of Biology.

Hypothesis

• According to the Ideal Free Distribution, we expected the ratios of turtles at the feeding stations to correspond quantitatively to the proportions of food at the feeding stations.

• Therefore, in performing our experiment, we tested the following null hypothesis:

Ho: The proportion of turtles at the feeding stations will not significantly correspond to the proportions of food being delivered at the stations.

Page 7: Quantitative Analysis of the Ideal Free Distribution G. Ramirez, G. Huete, T. Knight, K. Heard, and D. Bellinger University of Miami Department of Biology.

What we did

• In this experiment, we tested Ideal Free Distribution by using the turtles as our experimental species. We fed the turtles at four feeding stations, with ratios of food at 6:3:2:1.

Page 8: Quantitative Analysis of the Ideal Free Distribution G. Ramirez, G. Huete, T. Knight, K. Heard, and D. Bellinger University of Miami Department of Biology.

Methods (setting up)•Location: “pond near the bridge” at F.I.U.

•Materials: Pond carp food, four spoons different in size (TBS, ½ TBS, TSP, ½ TSP), and a stopwatch.

•Teams: teams of two; one thrower and one counter. spread out evenly and assigned a spoon randomly; assigned a person each trial as the time keeper.

Page 9: Quantitative Analysis of the Ideal Free Distribution G. Ramirez, G. Huete, T. Knight, K. Heard, and D. Bellinger University of Miami Department of Biology.

Teams and Time Keeper

Page 10: Quantitative Analysis of the Ideal Free Distribution G. Ramirez, G. Huete, T. Knight, K. Heard, and D. Bellinger University of Miami Department of Biology.

Methods cont. (how we did it)

• Each experiment lasted 15 minutes.

• Food was thrown every 30 seconds and turtles were counted 10 seconds after food was thrown.

• A turtle was counted only if it showed interest in the food.
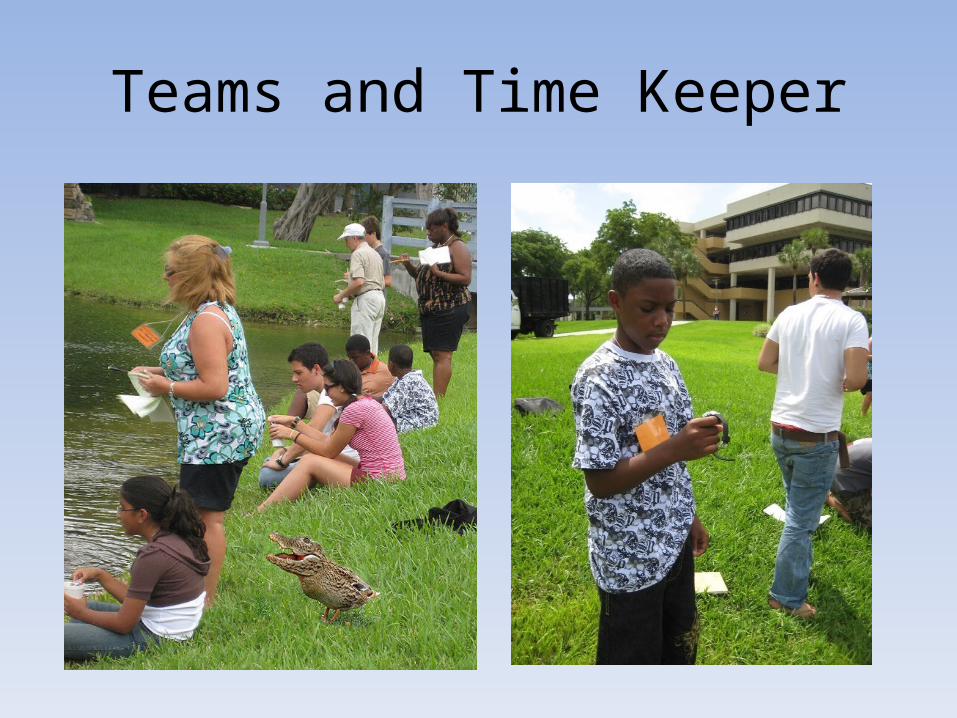
Page 11: Quantitative Analysis of the Ideal Free Distribution G. Ramirez, G. Huete, T. Knight, K. Heard, and D. Bellinger University of Miami Department of Biology.

Turtles

Peninsula cooter Turtles in front of a feeding station

Page 12: Quantitative Analysis of the Ideal Free Distribution G. Ramirez, G. Huete, T. Knight, K. Heard, and D. Bellinger University of Miami Department of Biology.

Methods cont. (data)

• The counters would record the number of turtles eating in front the teams.

• Using the data, we found the averages, standard deviations, and the long term means.

• We also needed to identify the “transient” of the data sets.

• We made exactly eight graphs with the 4 data sets.

Page 13: Quantitative Analysis of the Ideal Free Distribution G. Ramirez, G. Huete, T. Knight, K. Heard, and D. Bellinger University of Miami Department of Biology.

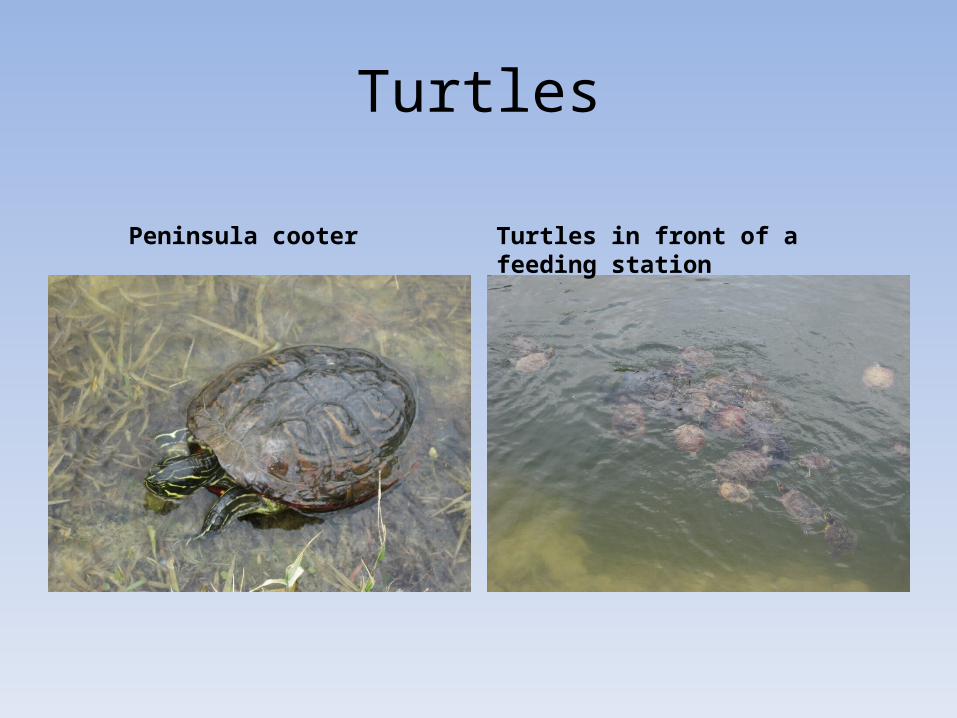
Results• We took data sets from 4 different trials.• We analyzed data and determined a

“transient” and “long term” period for each trial.

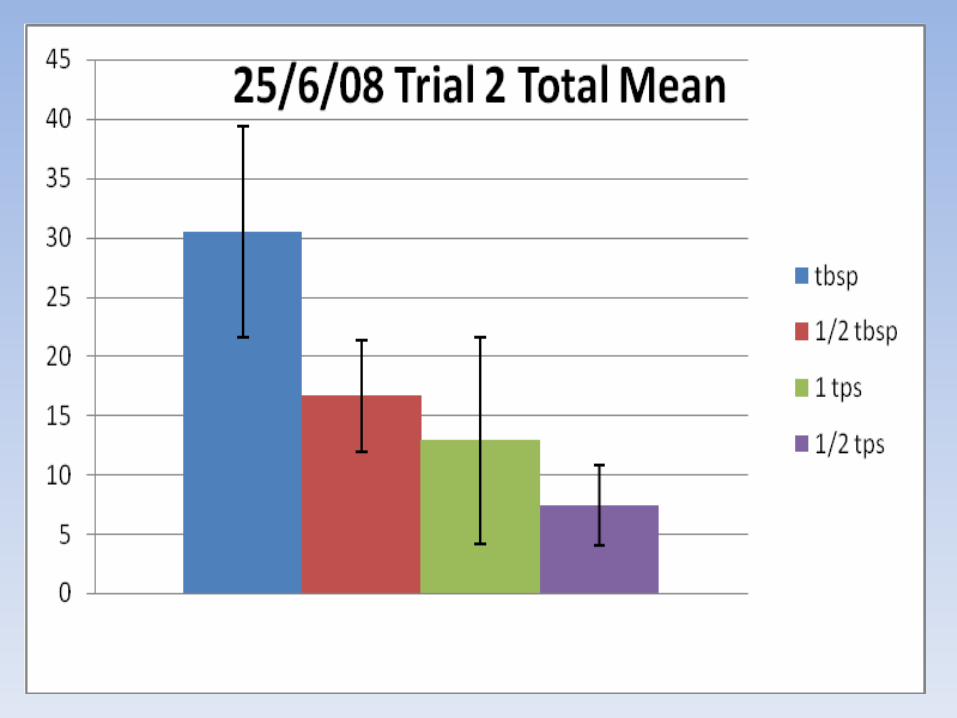
• We calculated total and long term means for the data sets.

• We analyzed data to see if the following inequalities held: Number of turtles for TBS > ½ TBS > TSP > ½ TSP

Page 14: Quantitative Analysis of the Ideal Free Distribution G. Ramirez, G. Huete, T. Knight, K. Heard, and D. Bellinger University of Miami Department of Biology.

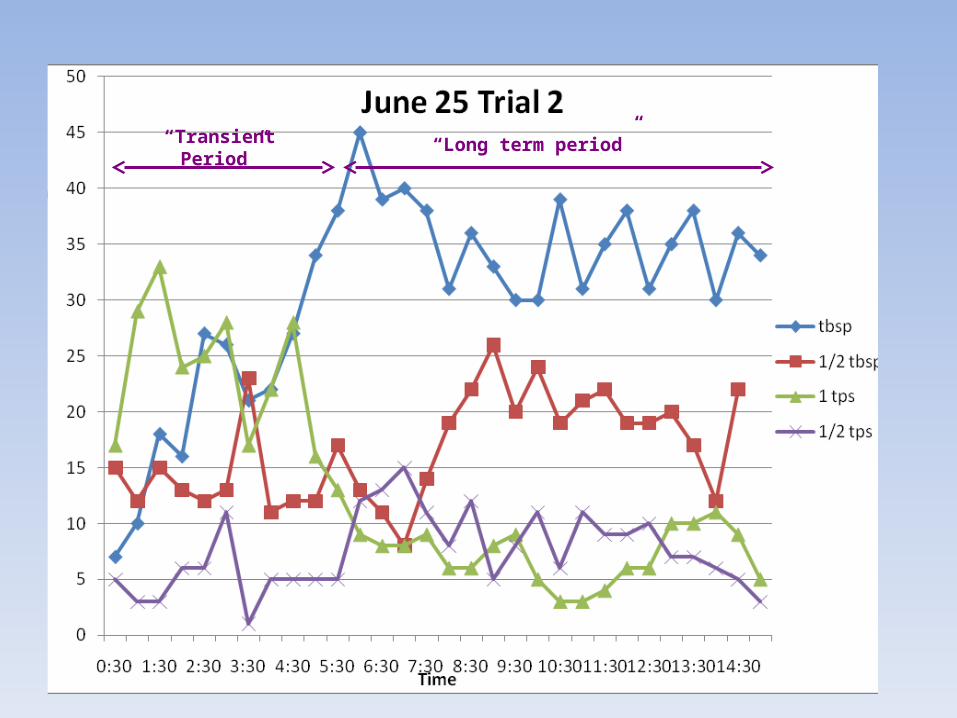
“Transient Period” “Long term period”

Page 15: Quantitative Analysis of the Ideal Free Distribution G. Ramirez, G. Huete, T. Knight, K. Heard, and D. Bellinger University of Miami Department of Biology.
Page 16: Quantitative Analysis of the Ideal Free Distribution G. Ramirez, G. Huete, T. Knight, K. Heard, and D. Bellinger University of Miami Department of Biology.
Page 17: Quantitative Analysis of the Ideal Free Distribution G. Ramirez, G. Huete, T. Knight, K. Heard, and D. Bellinger University of Miami Department of Biology.
Page 18: Quantitative Analysis of the Ideal Free Distribution G. Ramirez, G. Huete, T. Knight, K. Heard, and D. Bellinger University of Miami Department of Biology.
Page 19: Quantitative Analysis of the Ideal Free Distribution G. Ramirez, G. Huete, T. Knight, K. Heard, and D. Bellinger University of Miami Department of Biology.
Page 20: Quantitative Analysis of the Ideal Free Distribution G. Ramirez, G. Huete, T. Knight, K. Heard, and D. Bellinger University of Miami Department of Biology.
Page 21: Quantitative Analysis of the Ideal Free Distribution G. Ramirez, G. Huete, T. Knight, K. Heard, and D. Bellinger University of Miami Department of Biology.
Page 22: Quantitative Analysis of the Ideal Free Distribution G. Ramirez, G. Huete, T. Knight, K. Heard, and D. Bellinger University of Miami Department of Biology.
Page 23: Quantitative Analysis of the Ideal Free Distribution G. Ramirez, G. Huete, T. Knight, K. Heard, and D. Bellinger University of Miami Department of Biology.
Page 24: Quantitative Analysis of the Ideal Free Distribution G. Ramirez, G. Huete, T. Knight, K. Heard, and D. Bellinger University of Miami Department of Biology.
Page 25: Quantitative Analysis of the Ideal Free Distribution G. Ramirez, G. Huete, T. Knight, K. Heard, and D. Bellinger University of Miami Department of Biology.
Page 26: Quantitative Analysis of the Ideal Free Distribution G. Ramirez, G. Huete, T. Knight, K. Heard, and D. Bellinger University of Miami Department of Biology.
Page 27: Quantitative Analysis of the Ideal Free Distribution G. Ramirez, G. Huete, T. Knight, K. Heard, and D. Bellinger University of Miami Department of Biology.