(1) Global surface warming since 1850 consisted of a series of decadal timescale slowdowns (hiatus periods) followed by surges. These are likely due to a combination of external forcing and intrinsic variability (either in the ocean alone or in the coupled system). (3) Composite analysis of the ensemble members with the most extreme individual decadal heat uptake changes pinpoints the southern and northern high latitudes as the regions where intrinsic variability plays a large role: tropical heat uptake change is largely fixed by the surface forcing. Note the asymmetry between high and low extremes. Here we evaluate the influence of ocean intrinsic variability on global ocean heat uptake and hence the rate of global surface warming, using a 50-member ensemble of eddy-permitting ocean general circulation model simulations (OCCIPUT ensemble), forced with identical surface atmospheric conditions during 1960-2015 (Bessières et al., 2016) . Cumulative ocean heat uptake difference (W m -2 ) Latitude °N (2) Air-sea heat flux, integrated zonally and accumulated with latitude provides a useful measure of ocean heat uptake (Drijfhout et al., 2014). Main diagnostic is the difference between the 2000s and the 1990s. Fig 2:heat uptake difference between 2000-2009 (hiatus) and 1990-1999 (surge). green=ensemble mean red=high heat uptake blue=low heat uptake ~0.32 W m -2 ~0.39 W m -2 ~0.28 W m -2 OCCIPUT suggests the 2000s saw ocean heat uptake of +0.32 W m -2 compared to the 1990s shared between the tropics and the high latitudes. Intrinsic ocean variability modifies the mean ocean heat uptake change by up to 0.05 W m -2 or ±15%. Anomalous ocean heat uptake difference (W m -2 ) Latitude °N red=4 highest wrt ens. mean (4) The western boundary currents and the Antarctic Circumpolar Current (eddy rich regions) are responsible for the range of simulated ocean heat uptake, with the North Pacific exhibiting a particularly strong signal. Kuroshio Gulf Stream/NAC Agulhas E. Australian Falklands ACC GIN/Barents ACC ACC Fig 4:Change in air-sea heat flux difference (2000s minus 1990s) 4 highest minus 4 lowest (~5° spatial smoothing) W m -2 blue=4 lowest Quantifying uncertainty in decadal ocean heat uptake due to intrinsic ocean variability Bablu Sinha 1 , Alex Megann 1 , Thierry Penduff 2 , Jean-Marc Molines 2 , and Sybren Drijfhout 3,4,5 Fig 3:extreme heat uptake differences Southern Ocean N. high latitudes Southern Ocean N. high latitudes Tropics 1 National Oceanography Centre, United Kingdom 2 Institut des Géosciences de l’Environnement, France 3 Utrecht University, The Netherlands 4 University of Southampton, United Kingdom 5 Royal Netherlands Meteorological Institute, The Netherlands

Welcome message from author
This document is posted to help you gain knowledge. Please leave a comment to let me know what you think about it! Share it to your friends and learn new things together.
Transcript

(1) Global surface warming since 1850 consisted of a series of decadal timescale slowdowns (hiatus periods) followed bysurges. These are likely due to a combination of external forcing and intrinsic variability (either in the ocean alone or in thecoupled system).
(3) Composite analysis of the ensemble members with the most extreme individualdecadal heat uptake changes pinpoints the southern and northern high latitudes as theregions where intrinsic variability plays a large role: tropical heat uptake change islargely fixed by the surface forcing. Note the asymmetry between high and lowextremes.
Here we evaluate the influence of ocean intrinsic variability on global ocean heatuptake and hence the rate of global surface warming, using a 50-member ensemble ofeddy-permitting ocean general circulation model simulations (OCCIPUT ensemble),forced with identical surface atmospheric conditions during 1960-2015 (Bessières etal., 2016) .
Cumulativeoceanhe
atuptake
diffe
rence(W
m-2)
Latitude °N
(2) Air-sea heat flux, integrated zonally and accumulated with latitude provides auseful measure of ocean heat uptake (Drijfhout et al., 2014). Main diagnostic is thedifference between the 2000s and the 1990s.
Fig 2:heat uptake difference between2000-2009 (hiatus) and 1990-1999 (surge).
green=ensemble meanred=high heat uptakeblue=low heat uptake
~0.32 W m-2
~0.39 W m-2
~0.28 W m-2
OCCIPUT suggests the 2000s saw ocean heat uptake of +0.32 W m-2 compared to the1990s shared between the tropics and the high latitudes. Intrinsic ocean variabilitymodifies the mean ocean heat uptake change by up to 0.05 W m-2 or ±15%.
Anom
alou
socean
heatu
ptake
diffe
rence(W
m-2)
Latitude °N
red=4 highest wrt ens. mean (4) The western boundary currents andthe Antarctic Circumpolar Current (eddyrich regions) are responsible for therange of simulated ocean heat uptake,with the North Pacific exhibiting aparticularly strong signal.
KuroshioGulf Stream/NAC
AgulhasE. AustralianFalklands
ACC
GIN/Barents
ACCACC
Fig4:Changeinair-seaheatfluxdifference(2000sminus1990s)4 highestminus4 lowest(~5° spatialsmoothing)
W m-2
blue=4 lowest
QuantifyinguncertaintyindecadaloceanheatuptakeduetointrinsicoceanvariabilityBabluSinha1,AlexMegann1,ThierryPenduff2,Jean-MarcMolines2,andSybrenDrijfhout3,4,5
Fig 3:extreme heat uptake differences
Southern Ocean
N. high latitudes
Southern Ocean
N. high latitudes
Tropics
1NationalOceanographyCentre,UnitedKingdom2InstitutdesGéosciences del’Environnement,France3UtrechtUniversity,TheNetherlands4UniversityofSouthampton,UnitedKingdom5RoyalNetherlandsMeteorologicalInstitute,TheNetherlands
Cumulativeoceanhe
atuptake
diffe
rence(W
m-2)
Fig 5:North Pacific uptake difference between2000-2009 (hiatus) and 1990-1999 (surge).
~0.04 W m-2
~0.08 W m-2
~-0.04 W m-2
green=ensemble meanred=high heat uptake (same members as in Fig 2)blue=low heat uptake (same members as in Fig 2)
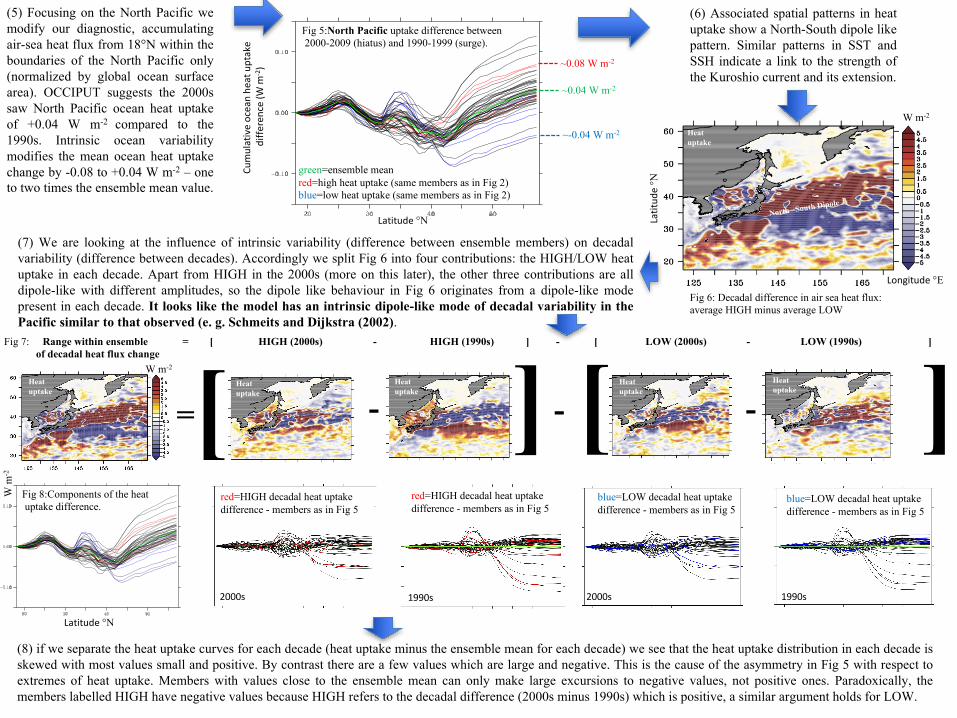
(5) Focusing on the North Pacific wemodify our diagnostic, accumulatingair-sea heat flux from 18°N within theboundaries of the North Pacific only(normalized by global ocean surfacearea). OCCIPUT suggests the 2000ssaw North Pacific ocean heat uptakeof +0.04 W m-2 compared to the1990s. Intrinsic ocean variabilitymodifies the mean ocean heat uptakechange by -0.08 to +0.04 W m-2 – oneto two times the ensemble mean value.
(7) We are looking at the influence of intrinsic variability (difference between ensemble members) on decadalvariability (difference between decades). Accordingly we split Fig 6 into four contributions: the HIGH/LOW heatuptake in each decade. Apart from HIGH in the 2000s (more on this later), the other three contributions are alldipole-like with different amplitudes, so the dipole like behaviour in Fig 6 originates from a dipole-like modepresent in each decade. It looks like the model has an intrinsic dipole-like mode of decadal variability in thePacific similar to that observed (e. g. Schmeits and Dijkstra (2002).
(8) if we separate the heat uptake curves for each decade (heat uptake minus the ensemble mean for each decade) we see that the heat uptake distribution in each decade isskewed with most values small and positive. By contrast there are a few values which are large and negative. This is the cause of the asymmetry in Fig 5 with respect toextremes of heat uptake. Members with values close to the ensemble mean can only make large excursions to negative values, not positive ones. Paradoxically, themembers labelled HIGH have negative values because HIGH refers to the decadal difference (2000s minus 1990s) which is positive, a similar argument holds for LOW.
Fig 6: Decadal difference in air sea heat flux:average HIGH minus average LOW
W m-2
Fig 7: Range within ensemble = [ HIGH (2000s) - HIGH (1990s) ] - [ LOW (2000s) - LOW (1990s) ] of decadal heat flux change
=[ ]] -- -
Latitude°N
Longitude°E
Latitud
e°N
[W m-2
W m
-2
Latitude°N
Fig 8:Components of the heatuptake difference.
red=HIGH decadal heat uptake difference - members as in Fig 5
red=HIGH decadal heat uptake difference - members as in Fig 5
blue=LOW decadal heat uptake difference - members as in Fig 5
blue=LOW decadal heat uptake difference - members as in Fig 5
Heatuptake
Heatuptake
Heatuptake
Heatuptake
Heatuptake
Heatuptake
(6) Associated spatial patterns in heatuptake show a North-South dipole likepattern. Similar patterns in SST andSSH indicate a link to the strength ofthe Kuroshio current and its extension.
2000s 1990s 2000s 1990s
2000sHIGH
2000sLOW
1990sHIGH
1990sLOW
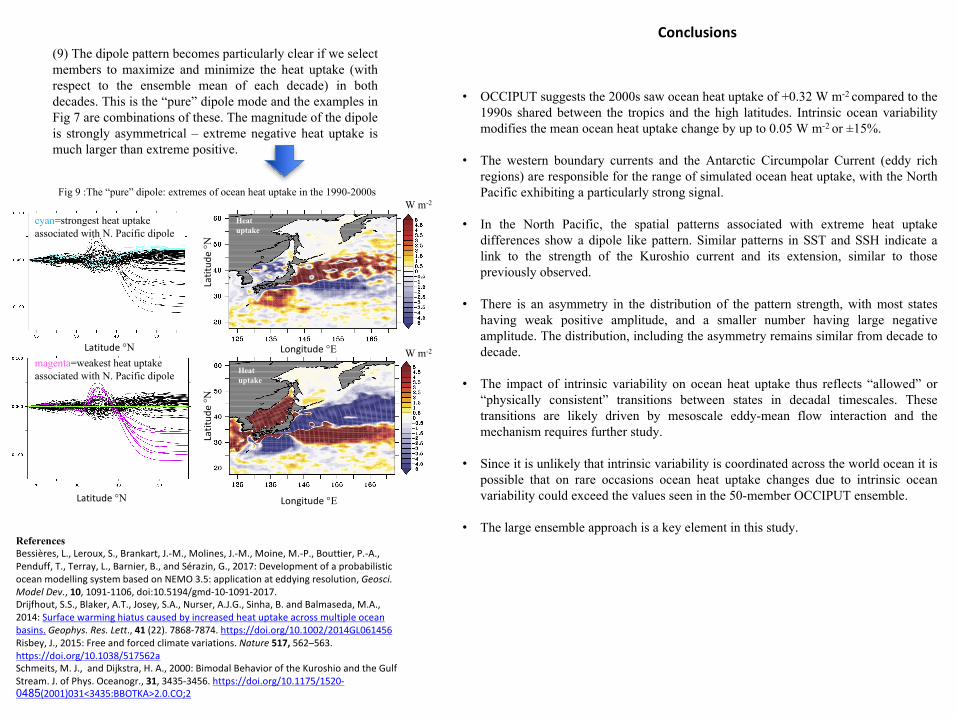
(9) The dipole pattern becomes particularly clear if we selectmembers to maximize and minimize the heat uptake (withrespect to the ensemble mean of each decade) in bothdecades. This is the “pure” dipole mode and the examples inFig 7 are combinations of these. The magnitude of the dipoleis strongly asymmetrical – extreme negative heat uptake ismuch larger than extreme positive.
Conclusions
• OCCIPUT suggests the 2000s saw ocean heat uptake of +0.32 W m-2 compared to the1990s shared between the tropics and the high latitudes. Intrinsic ocean variabilitymodifies the mean ocean heat uptake change by up to 0.05 W m-2 or ±15%.
• The western boundary currents and the Antarctic Circumpolar Current (eddy richregions) are responsible for the range of simulated ocean heat uptake, with the NorthPacific exhibiting a particularly strong signal.
• In the North Pacific, the spatial patterns associated with extreme heat uptakedifferences show a dipole like pattern. Similar patterns in SST and SSH indicate alink to the strength of the Kuroshio current and its extension, similar to thosepreviously observed.
• There is an asymmetry in the distribution of the pattern strength, with most stateshaving weak positive amplitude, and a smaller number having large negativeamplitude. The distribution, including the asymmetry remains similar from decade todecade.
• The impact of intrinsic variability on ocean heat uptake thus reflects “allowed” or“physically consistent” transitions between states in decadal timescales. Thesetransitions are likely driven by mesoscale eddy-mean flow interaction and themechanism requires further study.
• Since it is unlikely that intrinsic variability is coordinated across the world ocean it ispossible that on rare occasions ocean heat uptake changes due to intrinsic oceanvariability could exceed the values seen in the 50-member OCCIPUT ensemble.
• The large ensemble approach is a key element in this study.
Fig 9 :The “pure” dipole: extremes of ocean heat uptake in the 1990-2000sW m-2
Longitude°E
Latitud
e°N
W m-2
Longitude°E
Latitud
e°N
Latitude°N
Latitude°N
Heatuptake
Heatuptake
cyan=strongest heat uptake associated with N. Pacific dipole
magenta=weakest heat uptake associated with N. Pacific dipole
ReferencesBessières,L.,Leroux,S.,Brankart,J.-M.,Molines,J.-M.,Moine,M.-P.,Bouttier,P.-A.,Penduff,T.,Terray,L.,Barnier,B.,andSérazin,G.,2017:DevelopmentofaprobabilisticoceanmodellingsystembasedonNEMO3.5:applicationateddyingresolution,Geosci.ModelDev.,10,1091-1106,doi:10.5194/gmd-10-1091-2017.Drijfhout,S.S.,Blaker,A.T.,Josey,S.A.,Nurser,A.J.G.,Sinha,B.andBalmaseda,M.A.,2014: Surfacewarminghiatuscausedbyincreasedheatuptakeacrossmultipleoceanbasins. Geophys.Res.Lett.,41 (22).7868-7874.https://doi.org/10.1002/2014GL061456Risbey,J.,2015:Freeandforcedclimatevariations. Nature 517, 562–563.https://doi.org/10.1038/517562aSchmeits,M.J.,andDijkstra,H.A.,2000:BimodalBehavior oftheKuroshioandtheGulfStream.J.ofPhys.Oceanogr.,31,3435-3456.https://doi.org/10.1175/1520-0485(2001)031<3435:BBOTKA>2.0.CO;2
Related Documents