Active Sulforhodamine 101 Uptake into Hippocampal Astrocytes Christian Schnell 1,2 , Yohannes Hagos 3 , Swen Hu ¨ lsmann 1,2 * 1 Abt. Neurophysiologie und Zellula ¨re Biophysik, Zentrum Physiologie und Pathophysiologie, Georg-August-Universita ¨t, Go ¨ ttingen, Germany, 2 DFG Research Center Molecular Physiology of the Brain (CMPB), Go ¨ ttingen, Germany, 3 Abt. Vegetative Physiologie, Zentrum Physiologie und Pathophysiologie, Georg-August-Universita ¨t, Go ¨ ttingen, Germany Abstract Sulforhodamine 101 (SR101) is widely used as a marker of astrocytes. In this study we investigated labeling of astrocytes by SR101 in acute slices from the ventrolateral medulla and the hippocampus of transgenic mice expressing EGFP under the control of the astrocyte-specific human GFAP promoter. While SR101 efficiently and specifically labeled EGFP-expressing astrocytes in hippocampus, we found that the same staining procedure failed to label astrocytes efficiently in the ventrolateral medulla. Although carbenoxolone is able to decrease the SR101-labeling of astrocytes in the hippocampus, it is unlikely that SR101 is taken up via gap-junction hemichannels because mefloquine, a blocker for pannexin and connexin hemichannels, was unable to prevent SR101-labeling of hippocampal astrocytes. However, SR101-labeling of the hippocampal astrocytes was significantly reduced by substrates of organic anion transport polypeptides, including estron-3- sulfate and dehydroepiandrosterone sulfate, suggesting that SR101 is actively transported into hippocampal astrocytes. Citation: Schnell C, Hagos Y, Hu ¨ lsmann S (2012) Active Sulforhodamine 101 Uptake into Hippocampal Astrocytes. PLoS ONE 7(11): e49398. doi:10.1371/ journal.pone.0049398 Editor: Sven G. Meuth, University of Muenster, Germany Received June 14, 2012; Accepted October 11, 2012; Published November 26, 2012 Copyright: ß 2012 Schnell et al. This is an open-access article distributed under the terms of the Creative Commons Attribution License, which permits unrestricted use, distribution, and reproduction in any medium, provided the original author and source are credited. Funding: The work was founded by the ‘‘Deutsche Forschungsgemeinschaft’’ (DFG Hu 797/5-1 and the DFG-Research Center Molecular Physiology of the Brain (CMPB)). The funders had no role in study design, data collection and analysis, decision to publish, or preparation of the manuscript. Competing Interests: Dr. YH is also Chief Executive Officer (CEO) of PortaCellTec Biosciences GmbH, a company that provides hepatic/renal uptake transporter assays. This does not alter the authors’ adherence to all the PLOS ONE policies on sharing data and materials. * E-mail: [email protected] Introduction Astrocytes are important players in neuronal networks. They maintain the extracellular milieu by removal of potassium and neurotransmitters like glutamate and modulate synaptic transmis- sion by releasing gliotransmitters [1,2,3]. Unequivocal identifica- tion of astrocytes for imaging experiments as well as electrophys- iological recordings was facilitated by the availability of transgenic mouse lines expressing fluorescent proteins under the control of glia specific promoters [4,5]. Recently, sulforhodamine 101 (SR101) has been used for specific visualization of astrocytes in cortex and hippocampus [6,7,8,9]. In the spinal cord, however, SR101 has been described as unspecific [10] and it was also reported to label oligodendrocytes in the rabbit retina [11]. Furthermore, during hypoxia SR101 can enter also hippocampal neurons via hemichannels [12]. Currently, it is not known how the specific loading of SR101 into astrocytes is achieved under normoxic conditions. Although the synthetic glycyrrhetinic acid derivative carbenoxolone has been shown to block SR101-labeling of astrocytes [7], it is not yet clear if this is due to its action on gap- junctions and hemichannels or a yet unknown, maybe indirect mechanism. Nevertheless, SR101 is widely used as a marker for astrocytes in different brain regions [13,14,15] even despite the fact that sulforhodamine 101 has been found to trigger epileptic activity in the hippocampus [16]. In this study, we initially aimed to use SR101 for identification of astrocytes in ventrolateral medulla (VLM). Since VLM astrocytes were not labeled by SR101 sufficiently, we tried to improve the staining by pharmacological manipulations of potential mechanisms that might be involved in export of SR101 from medullary astrocytes. The results guided us to a series of experiments in the hippocampus to unveil the potential mecha- nism and functional role of this regional heterogeneity of astrocytes in ventrolateral medulla and the hippocampus. Materials and Methods Ethics statement In accordance with the German Protection of Animals Act (Tierschutzgesetz; TierSchG 14 Abs. 3) we did not need formal approval for the post mortem removal of brain tissue. The experiments were communicated to and notified by animal welfare office of University Medical Center Go ¨ttingen, Germany (institu- tional act number: T19.08). Breeding of mice Animals were hold and bred in the animal facilities of the University Hospital Go ¨ ttingen in accordance with guidelines of the German Physiological Society as well as the regulations of the State of Lower Saxony and the Federal Republic of Germany. Experiments were performed on acute brain slice preparations of neonatal (P2–P12), juvenile (P29–33) and adult mice (P98–99) expressing the enhanced green fluorescent protein in astrocytes [Tg(hGFAP-EGFP)GFEC-Fki; [4]]. Additionally we used mice in which glycinergic neurons were labeled [Tg(Slc6a5-EGFP)1Uze; [17]] to unequivocally identify inhibitory neurons. PLOS ONE | www.plosone.org 1 November 2012 | Volume 7 | Issue 11 | e49398

Welcome message from author
This document is posted to help you gain knowledge. Please leave a comment to let me know what you think about it! Share it to your friends and learn new things together.
Transcript
Active Sulforhodamine 101 Uptake into HippocampalAstrocytesChristian Schnell1,2, Yohannes Hagos3, Swen Hulsmann1,2*
1 Abt. Neurophysiologie und Zellulare Biophysik, Zentrum Physiologie und Pathophysiologie, Georg-August-Universitat, Gottingen, Germany, 2 DFG Research Center
Molecular Physiology of the Brain (CMPB), Gottingen, Germany, 3 Abt. Vegetative Physiologie, Zentrum Physiologie und Pathophysiologie, Georg-August-Universitat,
Gottingen, Germany
Abstract
Sulforhodamine 101 (SR101) is widely used as a marker of astrocytes. In this study we investigated labeling of astrocytes bySR101 in acute slices from the ventrolateral medulla and the hippocampus of transgenic mice expressing EGFP under thecontrol of the astrocyte-specific human GFAP promoter. While SR101 efficiently and specifically labeled EGFP-expressingastrocytes in hippocampus, we found that the same staining procedure failed to label astrocytes efficiently in theventrolateral medulla. Although carbenoxolone is able to decrease the SR101-labeling of astrocytes in the hippocampus, itis unlikely that SR101 is taken up via gap-junction hemichannels because mefloquine, a blocker for pannexin and connexinhemichannels, was unable to prevent SR101-labeling of hippocampal astrocytes. However, SR101-labeling of thehippocampal astrocytes was significantly reduced by substrates of organic anion transport polypeptides, including estron-3-sulfate and dehydroepiandrosterone sulfate, suggesting that SR101 is actively transported into hippocampal astrocytes.
Citation: Schnell C, Hagos Y, Hulsmann S (2012) Active Sulforhodamine 101 Uptake into Hippocampal Astrocytes. PLoS ONE 7(11): e49398. doi:10.1371/journal.pone.0049398
Editor: Sven G. Meuth, University of Muenster, Germany
Received June 14, 2012; Accepted October 11, 2012; Published November 26, 2012
Copyright: � 2012 Schnell et al. This is an open-access article distributed under the terms of the Creative Commons Attribution License, which permitsunrestricted use, distribution, and reproduction in any medium, provided the original author and source are credited.
Funding: The work was founded by the ‘‘Deutsche Forschungsgemeinschaft’’ (DFG Hu 797/5-1 and the DFG-Research Center Molecular Physiology of the Brain(CMPB)). The funders had no role in study design, data collection and analysis, decision to publish, or preparation of the manuscript.
Competing Interests: Dr. YH is also Chief Executive Officer (CEO) of PortaCellTec Biosciences GmbH, a company that provides hepatic/renal uptake transporterassays. This does not alter the authors’ adherence to all the PLOS ONE policies on sharing data and materials.
* E-mail: [email protected]
Introduction
Astrocytes are important players in neuronal networks. They
maintain the extracellular milieu by removal of potassium and
neurotransmitters like glutamate and modulate synaptic transmis-
sion by releasing gliotransmitters [1,2,3]. Unequivocal identifica-
tion of astrocytes for imaging experiments as well as electrophys-
iological recordings was facilitated by the availability of transgenic
mouse lines expressing fluorescent proteins under the control of
glia specific promoters [4,5]. Recently, sulforhodamine 101
(SR101) has been used for specific visualization of astrocytes in
cortex and hippocampus [6,7,8,9]. In the spinal cord, however,
SR101 has been described as unspecific [10] and it was also
reported to label oligodendrocytes in the rabbit retina [11].
Furthermore, during hypoxia SR101 can enter also hippocampal
neurons via hemichannels [12]. Currently, it is not known how the
specific loading of SR101 into astrocytes is achieved under
normoxic conditions. Although the synthetic glycyrrhetinic acid
derivative carbenoxolone has been shown to block SR101-labeling
of astrocytes [7], it is not yet clear if this is due to its action on gap-
junctions and hemichannels or a yet unknown, maybe indirect
mechanism. Nevertheless, SR101 is widely used as a marker for
astrocytes in different brain regions [13,14,15] even despite the
fact that sulforhodamine 101 has been found to trigger epileptic
activity in the hippocampus [16].
In this study, we initially aimed to use SR101 for identification
of astrocytes in ventrolateral medulla (VLM). Since VLM
astrocytes were not labeled by SR101 sufficiently, we tried to
improve the staining by pharmacological manipulations of
potential mechanisms that might be involved in export of SR101
from medullary astrocytes. The results guided us to a series of
experiments in the hippocampus to unveil the potential mecha-
nism and functional role of this regional heterogeneity of astrocytes
in ventrolateral medulla and the hippocampus.
Materials and Methods
Ethics statementIn accordance with the German Protection of Animals Act
(Tierschutzgesetz; TierSchG 14 Abs. 3) we did not need formal
approval for the post mortem removal of brain tissue. The
experiments were communicated to and notified by animal welfare
office of University Medical Center Gottingen, Germany (institu-
tional act number: T19.08).
Breeding of miceAnimals were hold and bred in the animal facilities of the
University Hospital Gottingen in accordance with guidelines of the
German Physiological Society as well as the regulations of the
State of Lower Saxony and the Federal Republic of Germany.
Experiments were performed on acute brain slice preparations of
neonatal (P2–P12), juvenile (P29–33) and adult mice (P98–99)
expressing the enhanced green fluorescent protein in astrocytes
[Tg(hGFAP-EGFP)GFEC-Fki; [4]]. Additionally we used mice in
which glycinergic neurons were labeled [Tg(Slc6a5-EGFP)1Uze;
[17]] to unequivocally identify inhibitory neurons.
PLOS ONE | www.plosone.org 1 November 2012 | Volume 7 | Issue 11 | e49398

Slice preparationsAcute transversal slices from brainstem and hippocampus were
prepared as described previously [18]. Briefly, animals were
decapitated under diethyl-ether anesthesia, brainstem and hippo-
campus were isolated and placed in ice-cooled, carbogen-saturated
(95% O2, 5% CO2) artificial cerebrospinal fluid (aCSF) containing
118 mM NaCl, 3 KCl, 1.5 mM CaCl2, 1 mM MgCl2, 1 mM
NaH2PO4, 25 mM NaHCO3, and 30 mM D-glucose). The
osmolarity was 325–335 mosm/l and the pH was adjusted to
7.4. The isolated brain part was glued with cyanoacryl glue
(Loctite Deutschland GmbH) to an agar block and mounted in a
vibroslicer (VT 1000S or VT 1200S, Leica). Brainstem and
hippocampal slices of 250 mm were cut and stored in oxygenated
aCSF at room temperature for at least 30 minutes before staining.
For the actual experiments, slices were transferred to a recording
chamber at the regarding microscope (see below). Slices were kept
submerged by a nylon fiber grid and continuously perfused with
aCSF at a flow rate of 5–10 ml/min.
Sulforhodamine 101 staining protocolSulforhodamine 101 (SR101) labeling was performed with a low
concentration of the dye [6,19]. If not stated otherwise, slices were
incubated for 20 minutes in carbogen-saturated aCSF containing
1 mM SR101 at 34uC. Thereafter, slices were incubated in aCSF
for 10 minutes at 34uC to allow washout of excess dye from the
extracellular space. Sodium-reduced solution was prepared by
replacing NaCl by cholineCl.
Fluorescence imaging using multifocal 2-photonexcitation microscopy
For detection of EGFP- and SR101-fluorescence, we used
multifocal (8 or 16 foci) 2-photon excitation. The principle
arrangement of the microscope (TriMScope, LaVision BioTec)
was described earlier [20]. Two-photon excitation was achieved
with a Ti:Sapphire Laser (SpectraPhysics MaiTai BB) at 800 nm.
Images were acquired with CCD-cameras (Ixon 885 or Clara,
Andor Technology) using either no or 262 binning. Fluorescence
signals of hGFAP-EGFP expressing astrocytes were detected
through a 531/40 nm band pass emission filter, whereas SR101-
fluorescence was detected through a BP 645/75 nm band pass
emission filter (AHF Analysentechnik AG). Image noise minimi-
zation, was achieved either by offline averaging of four consecutive
images or by integrating the emitted light of consecutive scans on
the CCD camera. To allow quantitative comparison of the
SR101-intensity between controls and drug treatments, all image
parameters, especially camera settings (exposure time, gain and
binning) as well as laser settings (laser power, beam number) were
identical for a particular set of experiments. Cell counting was
performed in a defined volume that was scanned with 2 mm step z-
stacks using a piezo-focus (Physik Instrumente). All settings were
controlled by ‘‘Imspector’’ software (LaVision BioTec, Bielefeld,
Germany). Since fluorescence intensity of EGFP in glycinergic
neurons was low and sensitive to photo bleaching, we used the
dual camera mode of our microscope when performing time-lapse
recordings of SR101-loading in slices from Tg(GlyT2-EGFP)-
mice. In these experiments, emitted light was divided by a dichroic
mirror (580 nm, beam splitter 580 DCXR, AHF), thus shorter
wavelengths could be passed through a 531/40 nm band pass
filter for detection of EGFP-fluorescence with a second CCD-
camera (Clara, Andor Technology), while longer wavelengths
(SR101-fluorescence) were detected with the other Clara CCD-
camera as described above. Overlap of both cameras was adjusted
before the experiment using standard fluorescent probes (Chro-
ma). This technique allows adjusting the camera settings of the
green and red channel independently and, thus, the camera setting
for detection of SR101 could remain the same as in the single
camera experiments.
For analysis of SR101-fluorescence, ‘‘Imspector’’-images were
exported to TIFF-format. Deconvolution was performed with
Autoquant software (MediaCybernetics) using the theoretical point-
spread-function (adaptive PSF, 10 iterations). 3D-volumes were
then further analyzed in Imaris (Bitplane). Drift correction was
performed for time-lapse recordings. The fluorescence intensity of
the SR101 and EGFP channel was determined using the spot
objects feature of Imaris. A spherical 3D volume (spot) of 6 mm
diameter was manually assigned to EGFP-expressing cells in the
‘‘surpass’’ view. In the SR101-channel the ‘‘recenter’’ function of
Imaris was used to identify cells with SR101-labeling. Only if
‘‘recentering’’ was possible a cell was counted as a SR101-positive.
To quantify the fluorescence intensity of an individual cell the
median intensity of the assigned spot was calculated (in the time-
lapse experiments for each time point). We used a R script (The R
Foundation for Statistical Computing) to extract the number of
cells and their intensities out of the comma separated file that was
exported from Imaris and to calculate the average SR101-
fluorescence intensities of the regarding slice.
ElectrophysiologyElectrophysiological characterization of SR101-labeled or
EGFP-labeled CA1 stratum radiatum cells was performed as
described earlier [9,21]. After SR101-staining, using the protocol
described above, hippocampal slices were transferred to a custom-
built recording chamber mounted to an upright microscope (Axio
Examiner.Z1, Zeiss) and superfused with aCSF at room temper-
ature. Epifluorescence illumination was achieved by a HBO100
mercury lamp (Zeiss). Two filter sets were used to discriminate
between SR101-labeled cells that did not express EGFP and
EGFP-expressing astrocytes. A dualband GFP/mCherry ET filter
set (F56-019; AHF Analysentechnik) allowed the identification
SR101-positive cells while the GFP filter set (38; AHF) was used to
confirm the expression of EGFP. Fluorescence illumination was
stopped to avoid bleaching, and a Dodt-Gradient-Contrast [22]
was used to approach the identified cell with the patch-pipette.
EGFP- and SR101-fluorescence was documented using a CCD-
camera (Sensicam QE; PCO) that was controlled by CamWare
software (PCO).
Whole-cell recordings were conducted with a Multiclamp 700A
amplifier, Digidata 1440A interface and pClamp10 software
(Molecular Devices, Forster City, CA, USA). For characterization
of the current-voltage (I–V) relations, SR101-positive and EGFP-
positive cells that were voltage-clamped at a holding potential of
280 mV, were exposed to 200 ms voltage-steps that reached from
2160 mV to +60 mV (10 mV increments). Current responses
were low-pass filtered at 2 kHz and digitized at 10 kHz. The
steady state current at 200 ms was measured to calculate the (I–V)
curves. Additionally, the membrane resistance was calculated from
the change of the holding current in response to a hyperpolarizing
voltage step to 290 mV.
DrugsElectrolytes for aCSF (see above) were purchased from Sigma-
Aldrich (Taufkirchen, Germany) and Merck chemicals (Darm-
stadt, Germany). Drugs were stored in concentrated stock solution
at 220uC and used following dilution in aCSF in final
concentrations as follows: Carbenoxolone (CBX, 100 mM, Sig-
ma-Aldrich), Probenecid (1 mM, Sigma-Aldrich), Estrone-3-sul-
fate (E3S, 100 mM, Sigma-Aldrich), MK-571 (50 and 200 mM,
Active Sulforhodamine 101 Uptake
PLOS ONE | www.plosone.org 2 November 2012 | Volume 7 | Issue 11 | e49398

Enzo Life Sciences), Rifampicin (100 mM, Sigma-Aldrich), Dehy-
droepiandrosterone sulfate (DHEAS; 100 mM, Sigma-Aldrich).
Mefloquine (MFQ) was purchased from BioBlocks as (6)-erythro-
(R*/S*)-mefloquine (QU024-1) and used in concentrations
between 0.1–50 mM.
Data analysisData are expressed as mean 6 SEM. Statistical comparison was
performed with the SigmaPlot software (Systat Software, Inc.).
Statistical significance (t-test or Mann-Whitney U test) was
expected if p,0.05.
Results
Sulforhodamine 101 is not a selective marker forastrocytes in the ventrolateral medulla
To assess the specificity of SR101-staining in the ventrolateral
medulla (VLM) in the brainstem, we adopted the Sulforhodamine
101 (SR101) staining protocol described earlier for acute
hippocampal slices [6], to acute brainstem slices from neonatal
Tg(hGFAP-EGFP) mice (Figure 1). It was obvious that labeling of
VLM-astrocytes with SR101 was not sufficient for the reliable
identification of astrocytes (Figure 1B). The intensity of SR101-
staining was so weak that we had to increase the gain of the images
to detect SR101-staining in astrocytes at all (Figure 1B9). In
contrast, SR101-staining of hippocampal slices with the same
protocol confirmed a good labeling of stratum radiatum astrocytes in
the CA1 and CA3 region with SR101 (Figure 1F).
We quantified the differences in SR101-labeling by measuring
the intensity of the red-fluorescence using 2-photon microscopy. In
the VLM we were able to identify a faint SR101-fluorescence,
which was different from the background, in 59.9612.4% EGFP-
positive astrocytes. The SR101-intensity was determined to be
22.3262.9 au (n = 5 slices; mean 6 SEM). In the hippocampus
SR101-intensity of astrocytes (EGFP-positive) was five-fold higher
(101.72621.29 au) (n = 6, p,0.05, Mann-Whitney U test). The
Figure 1. Sulforhodamine 101 labeling in the ventrolateral medulla (VLM) and stratum radiatum (CA1 area) of the hippocampus. A–C: Sulforhodamine (SR101) labeling (B) in VLM from transgenic mice expressing EGFP (A) under the hGFAP-promotor. B9: The overall labeling withSR101 of the VLM is very weak and only visible after increasing image gain. C: Overlay of A and B. D–E: In hippocampal slices, SR101-staining (E)largely overlaps with EGFP-labeling (D) of astrocytes. (F) Overlay of D and E. Images are maximum intensity projections of 21 2P-images, 2 mmdistance). Scale bars: 40 mm. G–H: Statistical comparison of labeling of EGFP-astrocytes with SR101 in slices from the VLM and hippocampus. G:Comparison of the percentage of EGFP-positive astrocytes that showed detectable levels of red SR101-fluorescence. H: Comparison of SR101-intensity of EGFP-positive astrocytes. The intensity of SR101 is significantly reduced (asterisk) in the VLM. Error bars = standard error of the mean.doi:10.1371/journal.pone.0049398.g001
Active Sulforhodamine 101 Uptake
PLOS ONE | www.plosone.org 3 November 2012 | Volume 7 | Issue 11 | e49398
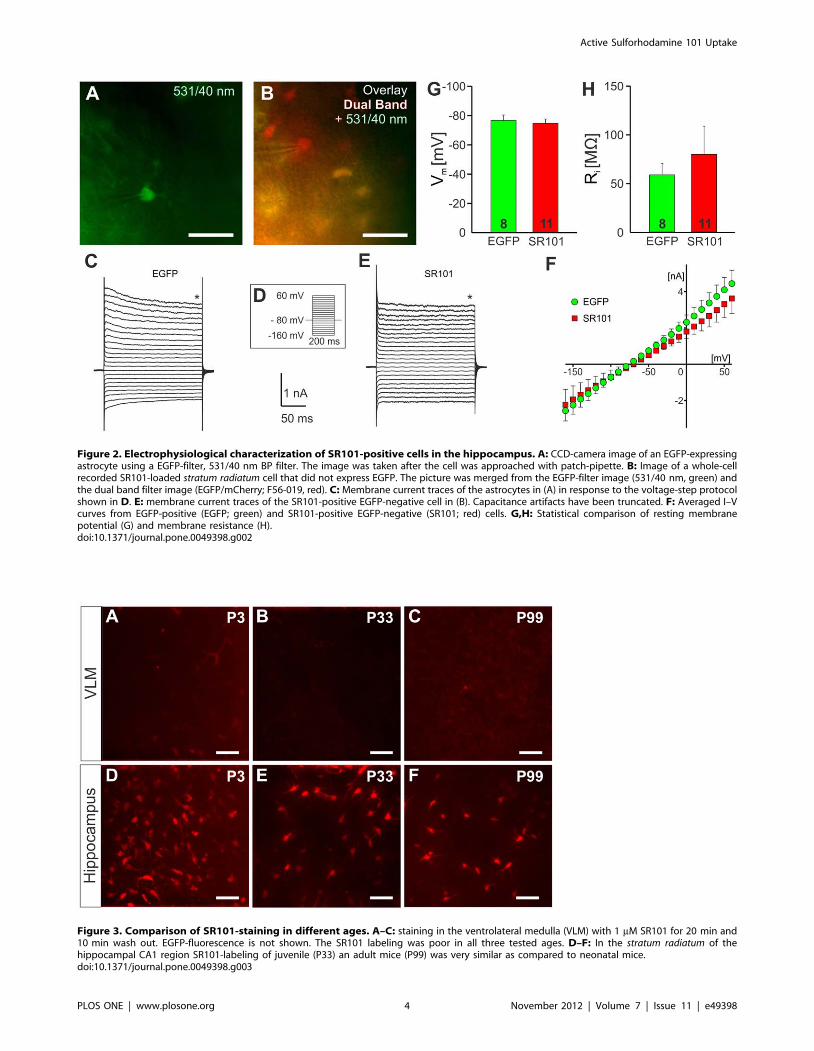
Figure 2. Electrophysiological characterization of SR101-positive cells in the hippocampus. A: CCD-camera image of an EGFP-expressingastrocyte using a EGFP-filter, 531/40 nm BP filter. The image was taken after the cell was approached with patch-pipette. B: Image of a whole-cellrecorded SR101-loaded stratum radiatum cell that did not express EGFP. The picture was merged from the EGFP-filter image (531/40 nm, green) andthe dual band filter image (EGFP/mCherry; F56-019, red). C: Membrane current traces of the astrocytes in (A) in response to the voltage-step protocolshown in D. E: membrane current traces of the SR101-positive EGFP-negative cell in (B). Capacitance artifacts have been truncated. F: Averaged I–Vcurves from EGFP-positive (EGFP; green) and SR101-positive EGFP-negative (SR101; red) cells. G,H: Statistical comparison of resting membranepotential (G) and membrane resistance (H).doi:10.1371/journal.pone.0049398.g002
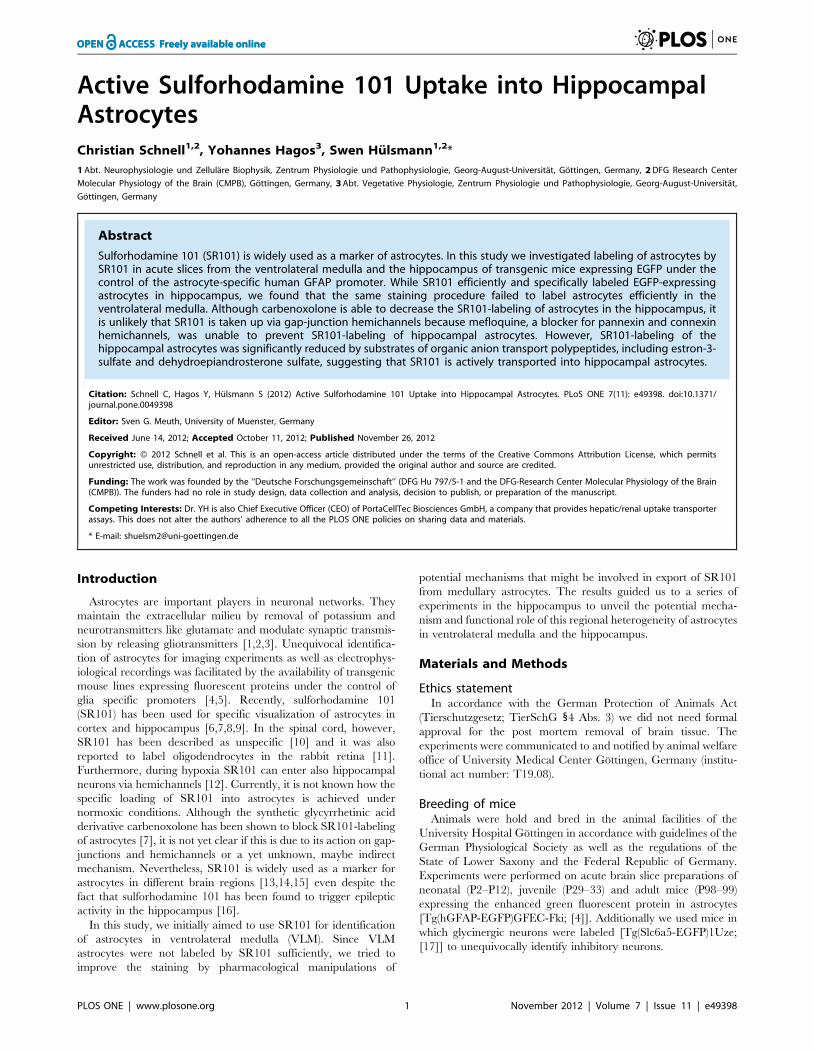
Figure 3. Comparison of SR101-staining in different ages. A–C: staining in the ventrolateral medulla (VLM) with 1 mM SR101 for 20 min and10 min wash out. EGFP-fluorescence is not shown. The SR101 labeling was poor in all three tested ages. D–F: In the stratum radiatum of thehippocampal CA1 region SR101-labeling of juvenile (P33) an adult mice (P99) was very similar as compared to neonatal mice.doi:10.1371/journal.pone.0049398.g003
Active Sulforhodamine 101 Uptake
PLOS ONE | www.plosone.org 4 November 2012 | Volume 7 | Issue 11 | e49398

number of EGFP-positive cells that were stained with SR101 was
76.567.2% (n = 6, n.s., t-test).
In the hippocampus 46.363.1% of SR101-positive cells were
lacking EGFP-fluorescence. These cells resembled astrocytes in
size and shape and when we recorded from these cells we found no
differences in the electrophysiological properties between EGFP-
negative SR101-positive cells and EGFP-positive astrocytes
(Figure 2). The resting membrane potential of EGFP-positive
astrocytes was 276.6363.74 mV (n = 8) and 274.7362.93 mV
(n = 11) for the SR101-positive but EGFP-negative cells. No
difference was detected in the membrane resistance (SR101-
positive but EGFP-negative: 80.1628.8 MV; EGFP-positive:
59.0611.9 MV). Additionally, it appears that SR101-labeled cells
that did not express EGFP resembled also mature astrocytes
indicated by the almost linear IV-curve (Figure 2H).
We also performed SR101-labeling in brainstem and hippo-
campus slices from different developmental stages (Figure 3).
While in the VLM SR101 did not allow a reliable identification of
astrocytes at any time (Figure 3A–C), solid SR101-staining of
astrocytes was always possible in the stratum radiatum of the CA1
region (Figure 3D–F).
2-photon time lapse imaging reveals transient labeling ofnon-astrocytic cells in the VLM
To examine the time course of SR101-labeling of astrocytes, we
performed time-lapse 2-photon-imaging during the labeling
procedure. After recording the fluorescence background in aCSF
for 2 min, SR101 (1 mM) was bath-applied. Then changes of the
fluorescence intensity were recorded every 2 min. In the VLM,
EGFP-positive astrocytes did not take up much SR101 during the
20 min loading phase (Figure 4 C). However, we found SR101-
positive cells that were EGFP-negative (Figure 4 C,G). During
washout, SR101-fluorescence disappeared rapidly from the latter
(Figure 4 F,G).
In the hippocampus most EGFP-positive astrocytes but also
EGFP-negative were loaded with SR101 during the 20 min
loading phase (Figure 4 C9). Among the EGFP-negative cells most
SR101-labeled cell resembled the EGFP-positive astrocytes in size
Figure 4. Time course of the SR101-staining procedure. (A–E9) Images show 2-photon time-lapse recording of SR101-stainings and unstainingduring washout in acute slices (40 mm, 21 images, 0.5 min21). A–E show the results from the ventrolateral medulla (VLM) and A9–E9 fromhippocampus. A, A9: Maximum intensity projections of the EGFP-fluorescence of the astrocytes. B–E, B9–E9: Images show maximum intensityprojections of the SR101-labeling at 4 different time points in the hippocampus and in the VLM. Scale bars: 40 mm. F–H: Analysis of the time course ofSR101-staining. Arrows underneath the traces represent the time points according to the images in A–E and A9–E9, respectively. Data (mean 6 SEM) isderived from 3–5 cells per slice (6 slices in hippocampus and 5 in the VLM). F: Note that the SR101-staining of hippocampal astrocytes (red) is muchstronger than the staining in the VLM astrocytes (green). G: In the VLM additionally EGFP-negative cells are stained while SR101 is applied (blue trace)but the fluorescence is disappearing during the washout. H: Normalized time course of the staining of astrocytes (red in the hippocampus; green inthe VLM) and EGFP-negative cells in the VLM (blue).doi:10.1371/journal.pone.0049398.g004
Active Sulforhodamine 101 Uptake
PLOS ONE | www.plosone.org 5 November 2012 | Volume 7 | Issue 11 | e49398

and shape. During washout, SR101-fluorescence of EGFP-positive
astrocytes decreased only slightly and allowed identification of
astrocytes until the end of the recording (Figure 2 D9,E9).
Additionally, a large number of the EGFP-negative cells retained
SR101, yet, most of them resembling astrocytes in size and shape,
confirming the labeling pattern of the initial staining experiments
described above.
In an additional set of 2-photon time lapse imaging experi-
ments, we stepwise increased the SR101-concentration in the bath
solution (Figure 5; n = 3). With a SR101 concentration of 0.1 mM,
astrocytes in the CA1 stratum radiatum started to become labeled
(Figure 5 B). During the 20 min staining procedure the SR101-
fluorescence intensity in the astrocytes was increasing above the
fluorescence intensity of the SR101-containing aCSF that was
measured above the slice (Figure 5F). At 1 mM, the intracellular
SR101-intensity increased further (Figure 5 C,F), while also the
SR101 background fluorescence in the slice increased slightly.
Both measured fluorescence intensities were larger as compared to
the SR101-fluorescence in solution above the slice. Subsequent
increase of the SR101-concentration to 10 mM caused an
additional increase of the SR101-fluorescence of astrocytes during
the 20 min staining procedure. The fluorescence intensity at
20 min did not reach a plateau, suggesting continuing accumu-
lation of SR101 in the astrocytes (Figure 5D). In all 3 tested
conditions the SR101-intensity in astrocytes exceeded the fluores-
cence intensity of the background in the slice as well as the
intensity in the aCSF (See also Movie S1). However the best signal
to noise ratio was found in the 1 mM SR101-solution (Figure 5G).
Gap-junction hemichannels are not responsible forSR101-uptake in the hippocampus
In the original study describing the specific labeling of astrocytes
with SR101 in vivo [7], the gap-junction blocker carbenoxolone
was found to suppress labeling of astrocytes by topical applied
SR101. Thus one can speculate that SR101 enters hippocampal
astrocytes via gap-junctional hemichannels. We therefore tested if
carbenoxolone also blocks SR101-labeling of hippocampal astro-
cytes in the slice preparation. Carbenoxolone (CBX; 100 mM)
reduced SR101-labeling of EGFP-positive astrocytes
(50.61621.59 au (CTRL) vs. 18.3562.16 au (CBX); n = 6,
p,0.05, Mann-Whitney U test; Figure 3A–C). The fraction of
SR101-positive EGFP-positive astrocytes was, however, not
reduced by CBX (70.565.7% (CTRL) vs. 53.468.9% (CBX);
n = 6, n.s., t-test; Figure 6D).
Carbenoxolone does not discriminate between hemichannels
formed by connexins or pannexins [23]. Therefore we tested if the
anti-malaria drug and pannexin blocker mefloquine (MFQ) blocks
SR101-staining of hippocampal astrocytes. However, SR101-
staining of hippocampal astrocytes was not changed by MFQ
using a concentration of 0.1 mM or 1 mM (not shown). Even at a
concentration of 50 mM when MFQ blocks also connexin
hemichannels [24] no change of SR101-intensity (58.569.5 au
in MFQ (n = 4) vs. 49.564.0 au in CTRL (n = 3, n.s., t-test,
Figure 6G) or cell number (81.764.1% in MFQ (n = 4) vs.
92.060.7% in CTRL (n = 3, n.s., t-test, Figure 6H) was observed.
Since MFQ did not affect SR101-fluorescence intensity, we
conclude that hemichannels formed by connexins or pannexins
are not the major route for SR101-uptake and that the organic
Figure 5. Accumulation of SR101 in cells. A–D: Maximum intensity projections of 2-photon z-stacks from time-lapse recordings during thestaining of hippocampal CA1 region with different SR101-concentrations (70 mm z-stacks, 2 mm steps, 2 min21). A: SR101-fluorescence before SR101was applied. B–D: SR101-fluorescence at different time points as indicated. E: EGFP-fluorescence of the astrocytes. Scale bars: 40 mm. F: Quantitativeanalysis of the time course of the SR101- fluorescence in hippocampal astrocytes (n = 17 astrocytes, 3 slices, red circles) and SR101-intensity of thebackground within the slice (n = 3 spots) and in the SR101 containing aCSF solution above the slice (n = 3 spots). G: Comparison of signal to noiseratio of the somatic SR101-fluorescence of astrocytes versus background (in the slice) and versus the SR101 in the aCSF solution above the slice. Note:1 mM SR101 gave the best signal to noise ration.doi:10.1371/journal.pone.0049398.g005
Active Sulforhodamine 101 Uptake
PLOS ONE | www.plosone.org 6 November 2012 | Volume 7 | Issue 11 | e49398
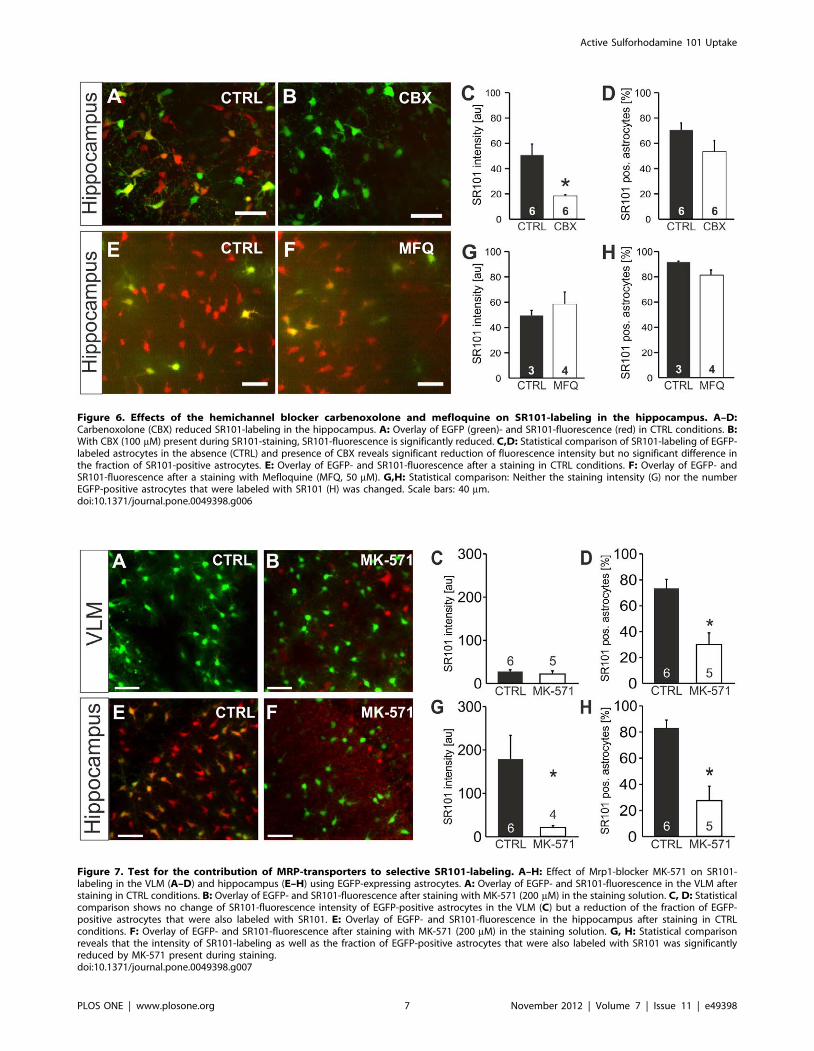
Figure 7. Test for the contribution of MRP-transporters to selective SR101-labeling. A–H: Effect of Mrp1-blocker MK-571 on SR101-labeling in the VLM (A–D) and hippocampus (E–H) using EGFP-expressing astrocytes. A: Overlay of EGFP- and SR101-fluorescence in the VLM afterstaining in CTRL conditions. B: Overlay of EGFP- and SR101-fluorescence after staining with MK-571 (200 mM) in the staining solution. C, D: Statisticalcomparison shows no change of SR101-fluorescence intensity of EGFP-positive astrocytes in the VLM (C) but a reduction of the fraction of EGFP-positive astrocytes that were also labeled with SR101. E: Overlay of EGFP- and SR101-fluorescence in the hippocampus after staining in CTRLconditions. F: Overlay of EGFP- and SR101-fluorescence after staining with MK-571 (200 mM) in the staining solution. G, H: Statistical comparisonreveals that the intensity of SR101-labeling as well as the fraction of EGFP-positive astrocytes that were also labeled with SR101 was significantlyreduced by MK-571 present during staining.doi:10.1371/journal.pone.0049398.g007
Figure 6. Effects of the hemichannel blocker carbenoxolone and mefloquine on SR101-labeling in the hippocampus. A–D:Carbenoxolone (CBX) reduced SR101-labeling in the hippocampus. A: Overlay of EGFP (green)- and SR101-fluorescence (red) in CTRL conditions. B:With CBX (100 mM) present during SR101-staining, SR101-fluorescence is significantly reduced. C,D: Statistical comparison of SR101-labeling of EGFP-labeled astrocytes in the absence (CTRL) and presence of CBX reveals significant reduction of fluorescence intensity but no significant difference inthe fraction of SR101-positive astrocytes. E: Overlay of EGFP- and SR101-fluorescence after a staining in CTRL conditions. F: Overlay of EGFP- andSR101-fluorescence after a staining with Mefloquine (MFQ, 50 mM). G,H: Statistical comparison: Neither the staining intensity (G) nor the numberEGFP-positive astrocytes that were labeled with SR101 (H) was changed. Scale bars: 40 mm.doi:10.1371/journal.pone.0049398.g006
Active Sulforhodamine 101 Uptake
PLOS ONE | www.plosone.org 7 November 2012 | Volume 7 | Issue 11 | e49398
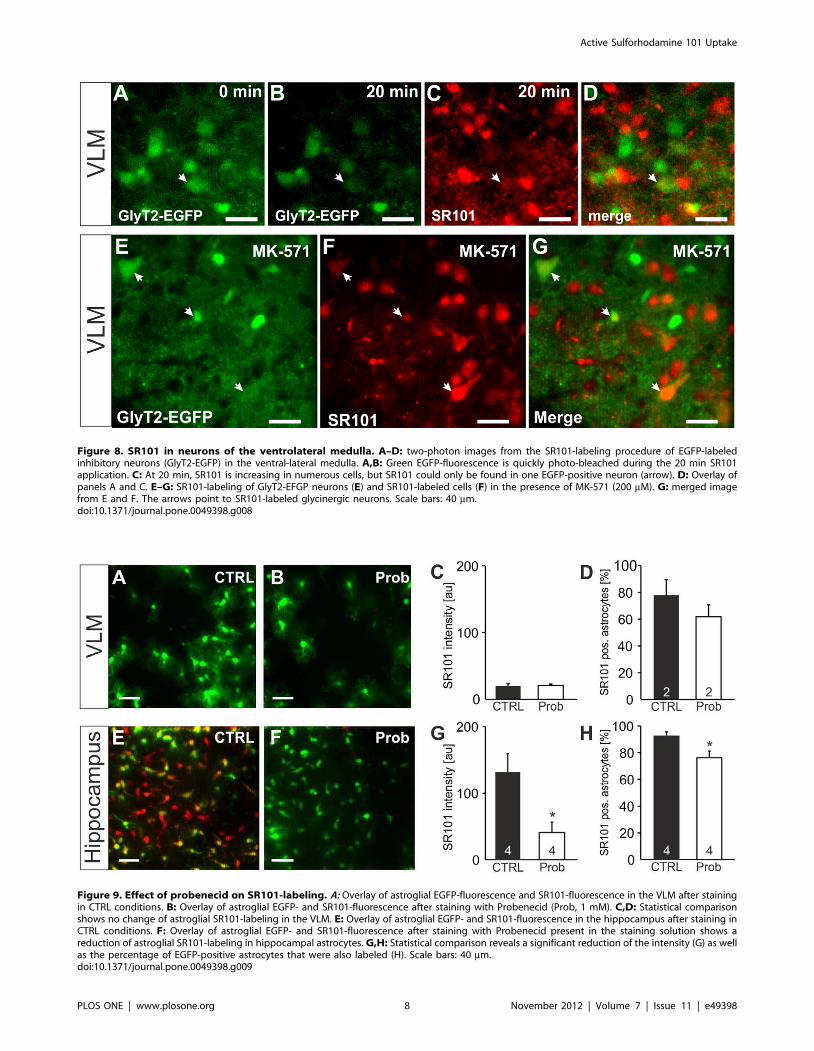
Figure 8. SR101 in neurons of the ventrolateral medulla. A–D: two-photon images from the SR101-labeling procedure of EGFP-labeledinhibitory neurons (GlyT2-EGFP) in the ventral-lateral medulla. A,B: Green EGFP-fluorescence is quickly photo-bleached during the 20 min SR101application. C: At 20 min, SR101 is increasing in numerous cells, but SR101 could only be found in one EGFP-positive neuron (arrow). D: Overlay ofpanels A and C. E–G: SR101-labeling of GlyT2-EFGP neurons (E) and SR101-labeled cells (F) in the presence of MK-571 (200 mM). G: merged imagefrom E and F. The arrows point to SR101-labeled glycinergic neurons. Scale bars: 40 mm.doi:10.1371/journal.pone.0049398.g008
Figure 9. Effect of probenecid on SR101-labeling. A: Overlay of astroglial EGFP-fluorescence and SR101-fluorescence in the VLM after stainingin CTRL conditions. B: Overlay of astroglial EGFP- and SR101-fluorescence after staining with Probenecid (Prob, 1 mM). C,D: Statistical comparisonshows no change of astroglial SR101-labeling in the VLM. E: Overlay of astroglial EGFP- and SR101-fluorescence in the hippocampus after staining inCTRL conditions. F: Overlay of astroglial EGFP- and SR101-fluorescence after staining with Probenecid present in the staining solution shows areduction of astroglial SR101-labeling in hippocampal astrocytes. G,H: Statistical comparison reveals a significant reduction of the intensity (G) as wellas the percentage of EGFP-positive astrocytes that were also labeled (H). Scale bars: 40 mm.doi:10.1371/journal.pone.0049398.g009
Active Sulforhodamine 101 Uptake
PLOS ONE | www.plosone.org 8 November 2012 | Volume 7 | Issue 11 | e49398
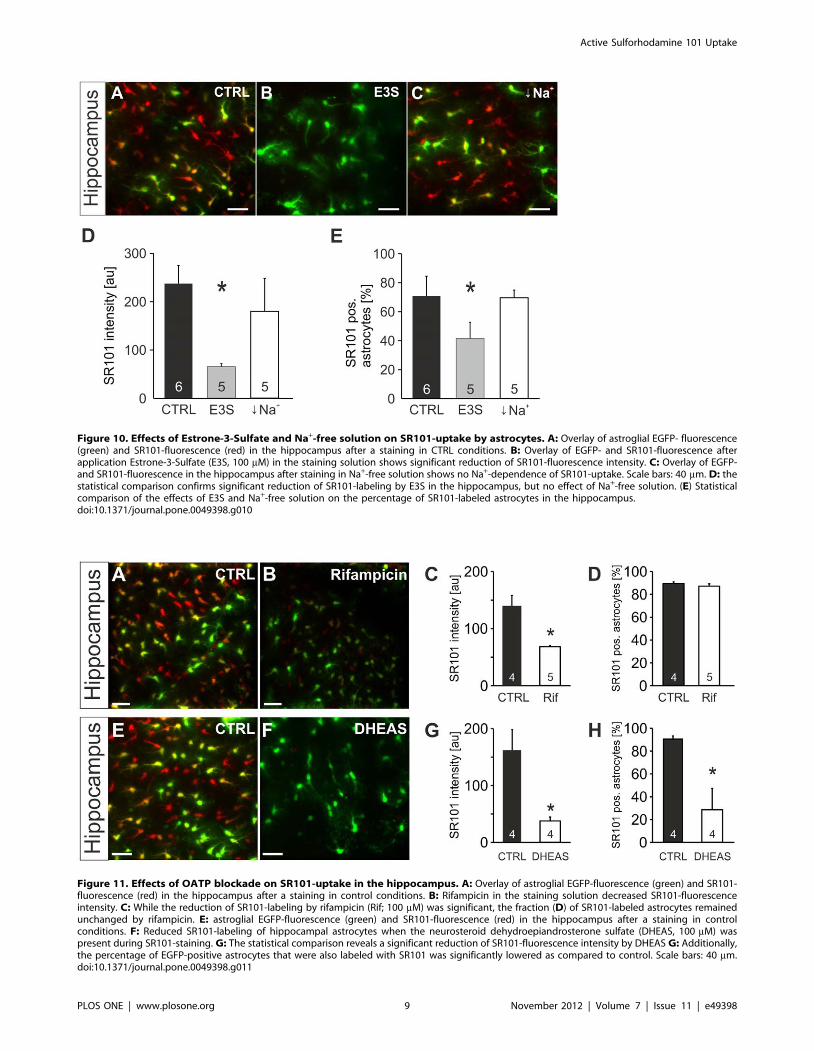
Figure 10. Effects of Estrone-3-Sulfate and Na+-free solution on SR101-uptake by astrocytes. A: Overlay of astroglial EGFP- fluorescence(green) and SR101-fluorescence (red) in the hippocampus after a staining in CTRL conditions. B: Overlay of EGFP- and SR101-fluorescence afterapplication Estrone-3-Sulfate (E3S, 100 mM) in the staining solution shows significant reduction of SR101-fluorescence intensity. C: Overlay of EGFP-and SR101-fluorescence in the hippocampus after staining in Na+-free solution shows no Na+-dependence of SR101-uptake. Scale bars: 40 mm. D: thestatistical comparison confirms significant reduction of SR101-labeling by E3S in the hippocampus, but no effect of Na+-free solution. (E) Statisticalcomparison of the effects of E3S and Na+-free solution on the percentage of SR101-labeled astrocytes in the hippocampus.doi:10.1371/journal.pone.0049398.g010
Figure 11. Effects of OATP blockade on SR101-uptake in the hippocampus. A: Overlay of astroglial EGFP-fluorescence (green) and SR101-fluorescence (red) in the hippocampus after a staining in control conditions. B: Rifampicin in the staining solution decreased SR101-fluorescenceintensity. C: While the reduction of SR101-labeling by rifampicin (Rif; 100 mM) was significant, the fraction (D) of SR101-labeled astrocytes remainedunchanged by rifampicin. E: astroglial EGFP-fluorescence (green) and SR101-fluorescence (red) in the hippocampus after a staining in controlconditions. F: Reduced SR101-labeling of hippocampal astrocytes when the neurosteroid dehydroepiandrosterone sulfate (DHEAS, 100 mM) waspresent during SR101-staining. G: The statistical comparison reveals a significant reduction of SR101-fluorescence intensity by DHEAS G: Additionally,the percentage of EGFP-positive astrocytes that were also labeled with SR101 was significantly lowered as compared to control. Scale bars: 40 mm.doi:10.1371/journal.pone.0049398.g011
Active Sulforhodamine 101 Uptake
PLOS ONE | www.plosone.org 9 November 2012 | Volume 7 | Issue 11 | e49398

anion carbenoxolone might interfere with another uptake mech-
anism.
MK-571 reduces SR101-labeling in the hippocampusTime-lapse imaging suggested that SR101 might be removed
from neurons and VLM astrocytes via an active transport
mechanism. Possible candidates are multidrug resistance proteins,
which can mediate efflux of SR101 from cells [25] and also have
been found in astrocytes [26]. Furthermore, blockade of efflux-
transporters was shown to improve fluorescent dye-labeling of
neurons [27].
When we tested MK-571 (200 mM), an inhibitor of the Mrp1
(ABCC1) transporter, SR101-labeling of EGFP-positive VLM-
astrocytes was not improved (Figure 7, A–D). The SR101 intensity
was 22.267.4 au (n = 5) in MK-571 (vs. 28.363.5 au in aCSF;
n = 6, n.s., t-test, Figure 7C). Rather, the number of EGFP-positive
astrocytes, in which some SR101-fluorescence could be detected
was reduced (30.168.9% (n = 5) in MK-571 vs. 73.467.0% in
aCSF; n = 6, p,0.05, t-test, Figure 7D). Interestingly, labeling of
EGFP-negative cells, including some that rather looked like
neurons (arrow in Figure 7B), appeared to be improved by MK-
571 in the VLM.
When we applied MK-571 to hippocampal slices, the number of
SR101-positive astrocytes was significantly reduced (27.6611.0%
(n = 5) in MK-571 vs. 83.166.0% in aCSF; n = 6, p,0.05, Mann-
Whitney U test, Figure 7H). The effect of MK-571 on the SR101-
intensity of EGFP-positive astrocytes was even more pronounced
(21.364.3 au (n = 4) in MK-571 vs. 179.1655.0 au in aCSF;
n = 6, p,0.05, Mann-Whitney U test, Figure 7G). One possible
interpretation of this observation is that MK-571 interferes with
the uptake of SR101.
Neurons can be labeled by SR101 in the ventrolateralmedulla
In the VLM, as shown in Figure 4, SR101 enters EGFP-
negative cell when SR101 is applied but leaves these cells once
SR101 is removed from the extracellular medium. When MK-571
is applied in the VLM, SR101 was also detectable in EGFP-
negative cells (Figure 7), which suggests that extrusion might be
depending on a MK-571-sensitive process. Since some of the
EGFP-negative SR101-positive cells had the shape and size of
neurons, we aimed to test this by using another transgenic mouse
line that expresses EGFP under the control of the GlyT2-
promotor [28]. In a first set of experiments we performed time
lapse imaging of the labeling process with 1 mM SR101 in the
VLM (Figure 8A–D). Most of the SR101-fluorescence did not co-
localize with cell bodies of glycinergic neurons. We could measure
SR101-fluorescence after 20 min of SR101-application in only 2
glycinergic neurons (n = 3 slices). When we labeled VLM-slices
(n = 5) from GlyT2-EGFP mice in the presence of MK-5171
(200 mM) we also found SR101 in a small number of glycinergic
neurons (Figure 8 E–G). On average 7.362.7% of the SR101-
positive cells were glycinergic neurons.
Probenecid reduces astroglial SR101-uptake intohippocampal astrocytes
Probenecid [29], another MRP-transporter blocker, also did not
increase the SR101 labeling in VLM astrocytes (Figure 9A–D).
This indicates that the weak SR101-labeling of astrocytes in the
ventrolateral medulla is not due to an active extrusion mechanism
but rather result of a poor uptake. Like MK-571, probenecid
reduced the SR101-labeling of hippocampal astrocytes. The
SR101-intensity of EGFP-positive astrocytes was reduced by
probenecid (1 mM) to 41.3615.6 au (n = 4) as compared to
131.8627.8 au in aCSF (n = 4, p,0.05, t-test, Figure 9G). In
probenecid, the fraction of SR101-positive astrocytes was smaller
(76.564.9% (n = 4)) as compared to aCSF (93.362.3%; n = 4,
p,0.05, t-test, Figure 9H). Since it is very unlikely that MRP-
transporter (e.g. ABCC1 transporter) mediate an uptake into cells
[30], our observation might be explained by an interaction of
probenecid and MK-571 with another type of uptake transporters.
SR101 labeling can be reduced by antagonists of organicanion transporting polypeptides
Probenecid is not only known to block MRP-transporters but is
also a blocker of organic anion transporters (OATs) [31,32] and
some organic anion transporting polypeptides (OATPs) [33]. Since
SR101 is an organic anion [34,35], we hypothesized that OATs
and OATPs are candidates for the SR101-uptake into hippocam-
pal astrocytes. By simultaneous application of estrone-3-sulfate
(E3S; 100 mM), a substrate of both families of organic anion
transporters, we observed a strong reduction of SR101-intensity in
hippocampus astrocytes (65.566.4 au (n = 5) as compared to
237.3637.7 au in aCSF (n = 6, p,0.05, Mann-Whitney U test,
Figure 12. Pharmacological profile of astrocyte SR101-staining. Carbenoxolone (CBX); mefloquine (MFQ); estrone-3-sulfate (E3S);dehydroepiandrosterone sulfate (DHEAS); not tested (n.t.); very strong reduction of intensity (KKK), strong reduction (KK), moderate reduction(K), unchanged (I).doi:10.1371/journal.pone.0049398.g012
Active Sulforhodamine 101 Uptake
PLOS ONE | www.plosone.org 10 November 2012 | Volume 7 | Issue 11 | e49398

Figure 10D). The fraction of SR101-positive astrocytes was also
reduced (68.169.4% (n = 5) in E3S vs. and 87.362.4% in aCSF
(n = 6, p,0.05, Mann-Whitney U test, Figure 10E). Since E3S is
also a substrate of sodium-dependent anion transporters of the
SLC10 family [36], we tested SR101-uptake in sodium free aCSF.
However, no significant reduction of SR101-staining was observed
(Figure 10C–E).
Furthermore, rifampicin (100 mM; Figure 11), which is an
inhibitor of OATPs but not of OATs [32] reduced the SR101-
intensity of hippocampal astrocytes to approximately 50%
(Figure 11C), while leaving the fraction of labeled astrocytes
unchanged.
The OATP substrate DHEAS reduces SR101-uptakeThe brain endogenous steroid hormone dehydroepiandroster-
one sulfate (DHEAS; [37]) has been shown to be a substrate of
OATPs [38]. When we tested the effect of 100 mM DHEAS on
SR101-uptake, we observed a significant reduction of the SR101-
fluorescence of hippocampal astrocytes (37.766.8 au in DHEAS
(n = 4) vs. 162.1636.1 au in CTRL (n = 4), p,0.05, Mann-
Whitney U test, Figure 11F,G). We observed also a significant
reduction of the fraction of SR101-labeled EGFP-positive
astrocytes (28.7618.5% in DHEAS (n = 4) vs. 90.662.8% in
CTRL (n = 4), p,0.05, t-test, Figure 11H). This strong reduction
of astroglial SR101-labeling indicates that DHEAS competes with
the uptake of SR101 into astrocytes.
Discussion
SR101 is an excellent tool for the identification of astrocytes for
imaging experiments in the hippocampus and cortex of rodents
[6,7]. In this study, we show that SR101 is taken up into
hippocampal astrocytes via an active transport mechanism. The
uptake is likely to be mediated via a yet not described (orphan)
organic anion transporting polypeptide (OATP; SLCO family),
which can be blocked by probenecid and rifampicin.
SR101 is not a good marker for astrocytes in theventrolateral medulla
We were unable to stain astrocytes efficiently in the ventrolat-
eral medulla with SR101. SR101-labeling of astrocytes was also
poor in the hypoglossal nucleus and in the spinal trigeminal
nucleus (data not shown). In the ventrolateral medulla, SR101 can
enter neurons (Figure 8) and other cell types during the staining
procedure but escapes from these cells when the slice is rinsed with
normal aCSF (Figure 2). However, additional experiments are
necessary to clarify the mechanism of SR101-loading in neurons.
In this context it is noteworthy that, during hypoxia, hippocampal
neurons can be labeled with SR101 via gap-junction hemichannels
[12].
SR101 labels astrocytes in the hippocampal stratumradiatum efficiently and selectively
We found that about 46% of the SR101-positive cells did not
express EGFP. However, SR101-positive EGFP-negative cells in
the hippocampus resemble astrocytes in shape, size and process
morphology, corroborating earlier observations by other groups
[6,8]. When we performed whole-cell recordings from SR101-
positive EGFP-negative cells in the stratum radiatum of the
hippocampus we only found cells that had electrophysiological
properties of astrocytes (Figure 2). Thus we conclude that SR101 is
an efficient and selective marker for hippocampal astrocytes.
Blockers of organic anion uptake prevent SR101-labelingof hippocampal astrocytes
In the hippocampus astrocytes, intracellular SR101-concentra-
tion reaches a much higher level compared to the VLM (Figure 4).
Obviously, the SR101-fluorescence within the astrocytes increased
above the fluorescence intensity of the SR101 containing aCSF,
suggesting that SR101-fluorescence intensity is not depending on
passive diffusion but rather on an active SR101-uptake into
hippocampal astrocytes.
Since carbenoxolone [39] and probenecid are organic anions
and probenecid is known to block organic anion transport [40],
possible transporters for the SR101-uptake are organic anion
transport systems including organic anion transporters (OAT)
belonging to the SLC22 family or organic anion transporting
polypeptides (OATP; SLCO family) and also transporters of the
SLC10 family. Estron-3-sulfate (E3S) is the substrate of many
members of these transporter families [32] and indeed was able to
reduce the SR101-labeling significantly. Interestingly, organic
anion transporting polypeptides have also been shown to be
inhibited by MK-571 [41] and probenecid [40]. Finally rifampicin
(rifampin) is known as an inhibitor of OATPs, i.e. OATP1A2,
OATP1B1, OATP1B3, and OATP2B1 but not for OATs [32],
strongly suggesting that SR101-uptake is mediated via an organic
anion transporting polypeptide.
Although little is known about OATP expression in astrocytes,
the pharmacological profile of the SR101-labeling in the
hippocampus (figure 12) favors an orphan organic anion
transporting polypeptide (OATP) as the transporter for selective
loading of SR101 into astrocytes. Unfortunately, most of the
pharmacology on OATP has been performed with human
transporter clones, and thus species differences cannot be excluded
for the mouse orthologues. Nevertheless, we can assume that
hippocampal astrocytes have a higher expression of that uptake
transporter as compared to VLM astrocytes.
Efflux transporter inhibition does not improve astrocytelabeling in the VLM
It appears very unlikely that multidrug resistance proteins
(MRPs) of the ABCC-subfamily or p-glycoprotein are actively
lowering the SR101-concentration in the VLM astrocytes, since
inhibition of those efflux transporters did not improve SR101-
labeling of VLM astrocytes. Neither MK-571 (MRP1, Mrp2) nor
probenecid (MRP2-6) did increase the SR101-fluorescence in
VLM astrocytes. However, we observed an increase of SR101-
staining in EGFP-negative cells, suggesting that MRPs contribute
to the de-staining of cells in the VLM.
A potential role of the orphan SR101-transporter in thehippocampus
It is interesting to note that sulfated neurosteroids, such as
dehydroepiandrosterone sulfate (DHEAS) [38] or pregnenolone
sulfate [42], are known substrates of organic anion transporting
polypeptides. Thus, we can speculate that in the hippocampus,
astrocytic organic anion transporting polypeptides might be
involved in transport and regulation of neurosteroids and thereby
might modulate neuronal network activity [37,43] or glial
plasticity [44,45]. If this is the case, external application of
SR101 could compete with the astrocytic uptake of those
neurosteroids and then may cause side effects such as described
by Kang et al. [16]. SR101-induced elevation of DHEAS or
pregnenolone-sulfate might increase neuronal excitability by
blocking GABAA receptors [46,47,48] and activation of NMDA-
receptors [43,49].
Active Sulforhodamine 101 Uptake
PLOS ONE | www.plosone.org 11 November 2012 | Volume 7 | Issue 11 | e49398
ConclusionIn conclusion, the selective labeling of astrocytes in the
hippocampus with SR101 was confirmed, but this method is not
applicable for the identification of astrocytes in the ventrolateral
medulla. Additionally, our data strongly suggest that SR101 is
taken up by hippocampal astrocytes via a transporter for organic
anions, most likely an organic anion transporting polypeptide
(OATP), which, however, is missing or differentially regulated in
VLM astrocytes. An unequivocal identification of the candidate
gene among the cloned OATPs requires new experiments.
Supporting Information
Movie S1 This movie is a two-photon z-stack recording(70 mm, 2 mm, 0.5 min21) of a SR101-staining experi-ment with 3 different SR101-concentrations. After record-
ing one z-stack without SR101, 0.1 mM SR101 was bath-applied,
20 minutes later the SR101-concentration was increased to 1 mM
for 20 minutes. Finally, 10 mM SR101 was applied for 20 minutes
before the recording was stopped. The white spots identify EGFP-
labeled astrocytes that were selected for analysis of fluorescence
intensities (Figure 5). The blue spot marks the position where
fluorescence background within the slice was recorded, while the
purple spot was located above the slice to record fluorescence
changes of the bath solution (Scale bar 40 mm).
(AVI)
Acknowledgments
The authors are grateful to Anja-Annett Grutzner for technical support.
We thank Dr. Martin Oheim (Paris) and Michal Fortuna, PhD (Gottingen)
for critical comments on the manuscript.
Author Contributions
Conceived and designed the experiments: CS YH SH. Performed the
experiments: CS SH. Analyzed the data: CS SH. Contributed reagents/
materials/analysis tools: YH. Wrote the paper: CS SH.
References
1. Kettenmann H, Verkhratsky A (2008) Neuroglia: the 150 years after. Trends in
Neurosciences 31: 653–659.
2. Schnell C, Fresemann J, Hulsmann S (2011) Determinants of Functional
Coupling between Astrocytes and Respiratory Neurons in the Pre-Botzinger
Complex. PLoS ONE 6: e26309.
3. Araque A, Parpura V, Sanzgiri RP, Haydon PG (1999) Tripartite synapses: glia,
the unacknowledged partner. Trends Neurosci 22: 208–215.
4. Nolte C, Matyash M, Pivneva T, Schipke CG, Ohlemeyer C, et al. (2001) GFAP
promoter-controlled EGFP-expressing transgenic mice: a tool to visualize
astrocytes and astrogliosis in living brain tissue. Glia 33: 72–86.
5. Hirrlinger PG, Scheller A, Braun C, Quintela-Schneider M, Fuss B, et al. (2005)
Expression of reef coral fluorescent proteins in the central nervous system of
transgenic mice. Mol Cell Neurosci 30: 291–303.
6. Kafitz KW, Meier SD, Stephan J, Rose CR (2008) Developmental profile and
properties of sulforhodamine 101–Labeled glial cells in acute brain slices of rat
hippocampus. J Neurosci Methods 169: 84–92.
7. Nimmerjahn A, Kirchhoff F, Kerr JN, Helmchen F (2004) Sulforhodamine 101
as a specific marker of astroglia in the neocortex in vivo. Nat Methods 1: 31–37.
8. Nimmerjahn A, Helmchen F (2012) In vivo labeling of cortical astrocytes with
sulforhodamine 101 (SR101). Cold Spring Harb Protoc 2012: 326–334.
9. Schnell C, Janc O, Kempkes B, Araya-Callis C, Flugge G, et al. (2012) Restraint
stress intensifies interstitial K+ accumulation during severe hypoxia. Front
Pharmacol 3: 53.
10. Cina C, Hochman S (2000) Diffuse distribution of sulforhodamine-labeled
neurons during serotonin-evoked locomotion in the neonatal rat thoracolumbar
spinal cord. J Comp Neurol 423: 590–602.
11. Ehinger B, Zucker CL, Bruun A, Adolph A (1994) In vivo staining of
oligodendroglia in the rabbit retina. Glia 10: 40–48.
12. Thompson RJ, Zhou N, MacVicar BA (2006) Ischemia opens neuronal gap
junction hemichannels. Science 312: 924–927.
13. McDougal DH, Hermann GE, Rogers RC (2011) Vagal afferent stimulation
activates astrocytes in the nucleus of the solitary tract via AMPA receptors:
evidence of an atypical neural-glial interaction in the brainstem. J Neurosci 31:
14037–14045.
14. McCaslin AF, Chen BR, Radosevich AJ, Cauli B, Hillman EM (2011) In vivo
3D morphology of astrocyte-vasculature interactions in the somatosensory
cortex: implications for neurovascular coupling. J Cereb Blood Flow Metab 31:
795–806.
15. Appaix F, Girod S, Boisseau S, Romer J, Vial J-C, et al. (2012) Specific In Vivo
Staining of Astrocytes in the Whole Brain after Intravenous Injection of
Sulforhodamine Dyes. PLoS ONE 7: e35169.
16. Kang J, Kang N, Yu Y, Zhang J, Petersen N, et al. (2010) Sulforhodamine 101
induces long-term potentiation of intrinsic excitability and synaptic efficacy in
hippocampal CA1 pyramidal neurons. Neuroscience 169: 1601–1609.
17. Zeilhofer HU, Wildner H, Yevenes GE (2012) Fast Synaptic Inhibition in Spinal
Sensory Processing and Pain Control. Physiological Reviews 92: 193–235.
18. Hartel K, Singaravelu K, Kaiser M, Neusch C, Hulsmann S, et al. (2007)
Calcium influx mediated by the inwardly rectifying K+ channel Kir4.1
(KCNJ10) at low external K+ concentration. Cell Calcium 42: 271–280.
19. Meier SD, Kafitz KW, Rose CR (2008) Developmental profile and mechanisms
of GABA-induced calcium signaling in hippocampal astrocytes. Glia 56: 1127–
1137.
20. Winter SM, Fresemann J, Schnell C, Oku Y, Hirrlinger J, et al. (2009)
Glycinergic interneurons are functionally integrated into the inspiratory network
of mouse medullary slices. Pflugers Arch 458: 459–469.
21. Graß D, Pawlowski PG, Hirrlinger J, Papadopoulos N, Richter DW, et al. (2004)
Diversity of functional astroglial properties in the respiratory network. J Neurosci
24: 1358–1365.
22. Dodt HU, Zieglgansberger W (1994) Infrared videomicroscopy: a new look at
neuronal structure and function. Trends Neurosci 17: 453–458.
23. Bruzzone R, Barbe MT, Jakob NJ, Monyer H (2005) Pharmacological
properties of homomeric and heteromeric pannexin hemichannels expressed
in Xenopus oocytes. J Neurochem 92: 1033–1043.
24. Cruikshank SJ, Hopperstad M, Younger M, Connors BW, Spray DC, et al.
(2004) Potent block of Cx36 and Cx50 gap junction channels by mefloquine.
Proceedings of the National Academy of Sciences of the United States of
America 101: 12364–12369.
25. Kaufmann AM, Toro-Ramos AJ, Krise JP (2008) Assessment of golgi apparatus
versus plasma membrane-localized multi-drug resistance-associated protein 1.
Mol Pharm 5: 787–794.
26. Hirrlinger J, Moeller H, Kirchhoff F, Dringen R (2005) Expression of multidrug
resistance proteins (Mrps) in astrocytes of the mouse brain: a single cell RT-PCR
study. Neurochem Res 30: 1237–1244.
27. Manzini I, Schild D (2003) Multidrug resistance transporters in the olfactory
receptor neurons of Xenopus laevis tadpoles. J Physiol 546: 375–385.
28. Zeilhofer HU, Studler B, Arabadzisz D, Schweizer C, Ahmadi S, et al. (2005)
Glycinergic neurons expressing enhanced green fluorescent protein in bacterial
artificial chromosome transgenic mice. J Comp Neurol 482: 123–141.
29. Ishikawa Y, Nagai J, Okada Y, Sato K, Yumoto R, et al. (2010) Function and
expression of ATP-binding cassette transporters in cultured human Y79
retinoblastoma cells. Biol Pharm Bull 33: 504–511.
30. Loscher W, Potschka H (2005) Drug resistance in brain diseases and the role of
drug efflux transporters. Nat Rev Neurosci 6: 591–602.
31. Bahn A, Ljubojevic M, Lorenz H, Schultz C, Ghebremedhin E, et al. (2005)
Murine renal organic anion transporters mOAT1 and mOAT3 facilitate the
transport of neuroactive tryptophan metabolites. American Journal of
Physiology - Cell Physiology 289: C1075–C1084.
32. Giacomini KM, Huang SM, Tweedie DJ, Benet LZ, Brouwer KL, et al. (2010)
Membrane transporters in drug development. Nat Rev Drug Discov 9: 215–236.
33. Janneh O, Jones E, Chandler B, Owen A, Khoo SH (2007) Inhibition of P-
glycoprotein and multidrug resistance-associated proteins modulates the
intracellular concentration of lopinavir in cultured CD4 T cells and primary
human lymphocytes. Journal of Antimicrobial Chemotherapy 60: 987–993.
34. Miller DS, Masereeuw R, Karnaky KJ Jr (2002) Regulation of MRP2-mediated
transport in shark rectal salt gland tubules. Am J Physiol Regul Integr Comp
Physiol 282: R774–781.
35. Franco R, Cidlowski JA (2006) SLCO/OATP-like transport of glutathione in
FasL-induced apoptosis: glutathione efflux is coupled to an organic anion
exchange and is necessary for the progression of the execution phase of
apoptosis. J Biol Chem 281: 29542–29557.
36. Geyer J, Wilke T, Petzinger E (2006) The solute carrier family SLC10: more
than a family of bile acid transporters regarding function and phylogenetic
relationships. Naunyn-Schmiedeberg’s Archives of Pharmacology 372: 413–431.
37. Dong Y, Zheng P (2012) Dehydroepiandrosterone Sulphate: Action and
Mechanism in the Brain. J Neuroendocrinol 24: 215–224.
38. Hagenbuch B, Meier P (2004) Organic anion transporting polypeptides of the
OATP/SLC21 family: phylogenetic classification as OATP/SLCO superfamily,
new nomenclature and molecular/functional properties. Pflugers Archiv
European Journal of Physiology 447: 653–665.
Active Sulforhodamine 101 Uptake
PLOS ONE | www.plosone.org 12 November 2012 | Volume 7 | Issue 11 | e49398

39. Parke DV, Lindup WE (1973) Quantitative and qualitative aspects of the plasma
protein binding of carbenoxolone, an ulcer-healing drug. Ann N Y Acad Sci
226: 200–213.
40. Nishimura T, Kubo Y, Kato Y, Sai Y, Ogihara T, et al. (2007) Characterization
of the Uptake Mechanism for a Novel Loop Diuretic, M17055, in Caco-2 Cells:
Involvement of Organic Anion Transporting Polypeptide (OATP)-B. Pharma-
ceutical Research 24: 90–98.
41. Letschert K, Faulstich H, Keller D, Keppler D (2006) Molecular Character-
ization and Inhibition of Amanitin Uptake into Human Hepatocytes.
Toxicological Sciences 91: 140–149.
42. Grube M, Kock K, Karner S, Reuther S, Ritter CA, et al. (2006) Modification of
OATP2B1-Mediated Transport by Steroid Hormones. Molecular Pharmacol-
ogy 70: 1735–1741.
43. Monnet FP, Mahe V, Robel P, Baulieu EE (1995) Neurosteroids, via sigma
receptors, modulate the [3H]norepinephrine release evoked by N-methyl-D-
aspartate in the rat hippocampus. Proceedings of the National Academy of
Sciences 92: 3774–3778.
44. Del Cerro S, Garcia Estrada J, Garcia Segura LM (1995) Neuroactive steroids
regulate astroglia morphology in hippocampal cultures from adult rats. Glia 14:65–71.
45. Garcia Segura LM, Chowen JA, Naftolin F (1996) Endocrine glia: roles of glial
cells in the brain actions of steroid and thyroid hormones and in the regulation ofhormone secretion. Front-Neuroendocrinol 17: 180–211.
46. Le Foll F, Louiset E, Castel H, Vaudry H, Cazin L (1997) Electrophysiologicaleffects of various neuroactive steroids on the GABA(A) receptor in pituitary
melanotrope cells. Eur J Pharmacol 331: 303–311.
47. Demirgoren S, Majewska MD, Spivak CE, London ED (1991) Receptor bindingand electrophysiological effects of Dehydroepiandrosterone sulfate, an antago-
nist of the GABAA receptor. Neuroscience 45: 127–135.48. Chvatal A, Kettenmann H (1991) Effect of steroids on c-aminobutyrate-induced
currents in cultured rat astrocytes. Pflugers Archiv European Journal ofPhysiology 419: 263–266.
49. Mortaud S, Nicolas L, Pinoteau W, Tordjman S, Carlier M, et al. (2010) Brain
pathways mediating the pro-aggressive effect of the steroid sulfatase (Sts) gene.Behav Genet 40: 211–219.
Active Sulforhodamine 101 Uptake
PLOS ONE | www.plosone.org 13 November 2012 | Volume 7 | Issue 11 | e49398
Related Documents