ORIGINAL RESEARCH ARTICLE published: 16 October 2013 doi: 10.3389/fncom.2013.00134 Quantifying network properties in multi-electrode recordings: spatiotemporal characterization and inter-trial variation of evoked gamma oscillations in mouse somatosensory cortex in vitro Cristian Carmeli 1† , Paolo Bonifazi 2,3† , Hugh P. C. Robinson 2† and Michael Small 4 * † 1 Laboratoire de Recherche en Neuroimagerie, Department of Clinical Neurosciences, Centre Hospitalier Universitaire Vaudois and University of Lausanne, Lausanne, Switzerland 2 Department of Physiology, Development and Neuroscience, University of Cambridge, Cambridge, UK 3 School of Physics and Astronomy, Tel-Aviv University, Tel-Aviv, Israel 4 School of Mathematics and Statistics, The University of Western Australia, Crawley, WA, Australia Edited by: Qawi K. Telesford, Wake Forest University School of Medicine, USA Reviewed by: Karl Friston, University College London, UK Ian Stevenson, University of Connecticut, USA *Correspondence: Michael Small, School of Mathematics and Statistics (M019), The University of Western Australia, Crawley, WA 6009, Australia e-mail: [email protected] † These authors have contributed equally to this work. Linking the structural connectivity of brain circuits to their cooperative dynamics and emergent functions is a central aim of neuroscience research. Graph theory has recently been applied to study the structure-function relationship of networks, where dynamical similarity of different nodes has been turned into a “static” functional connection. However, the capability of the brain to adapt, learn and process external stimuli requires a constant dynamical functional rewiring between circuitries and cell assemblies. Hence, we must capture the changes of network functional connectivity over time. Multi-electrode array data present a unique challenge within this framework. We study the dynamics of gamma oscillations in acute slices of the somatosensory cortex from juvenile mice recorded by planar multi-electrode arrays. Bursts of gamma oscillatory activity lasting a few hundred milliseconds could be initiated only by brief trains of electrical stimulations applied at the deepest cortical layers and simultaneously delivered at multiple locations. Local field potentials were used to study the spatio-temporal properties and the instantaneous synchronization profile of the gamma oscillatory activity, combined with current source density (CSD) analysis. Pair-wise differences in the oscillation phase were used to determine the presence of instantaneous synchronization between the different sites of the circuitry during the oscillatory period. Despite variation in the duration of the oscillatory response over successive trials, they showed a constant average power, suggesting that the rate of expenditure of energy during the gamma bursts is consistent across repeated stimulations. Within each gamma burst, the functional connectivity map reflected the columnar organization of the neocortex. Over successive trials, an apparently random rearrangement of the functional connectivity was observed, with a more stable columnar than horizontal organization. This work reveals new features of evoked gamma oscillations in developing cortex. Keywords: gamma oscillations, acute cortical slices, multi-electrode arrays, local field potentials, spatial synchronization, functional connectivity INTRODUCTION In the last decade, the connectome approach is providing more and more information on the wiring of the nervous system at different spatial scales of investigation, while multi-channel electrical and optical recordings provide a massive amount of data on brain activity dynamics recorded from multiple sites (Friston, 2005; Lebedev and Nicolelis, 2006; Homma et al., 2009; Sporns, 2011). Therefore, there is a need for new theoretical and experimental tools to bridge these different levels (scale) of investigations (Stevenson et al., 2008; Rubinov and Sporns, 2010; Feldt et al., 2011; Bastos et al., 2012). The aim of this paper is to provide a range of techniques that may be applied to elucidate functional relationships among brain regions from multi-electrode recordings of structured cortical tissue. In partic- ular, by studying the dynamics of gamma oscillatory activity, a main brain rhythm (Buzsáki, 2006; Fries, 2009), we concentrate on establishing a clear and general set of tools that minimizes assumptions about network structure. Oscillatory synchronous activity is a general feature of fir- ing of neuronal networks both in adult animals and during development (Buzsáki, 2006; Uhlhaas et al., 2010). Oscillations are seen in-vivo in local field potential and/or EEG signals, in peripheral structures (olfactory bulb), in sensory and motor cor- tices, in the hippocampus and in the thalamus (Buzsáki and Frontiers in Computational Neuroscience www.frontiersin.org October 2013 | Volume 7 | Article 134 | 1 COMPUTATIONAL NEUROSCIENCE

Welcome message from author
This document is posted to help you gain knowledge. Please leave a comment to let me know what you think about it! Share it to your friends and learn new things together.
Transcript
ORIGINAL RESEARCH ARTICLEpublished: 16 October 2013
doi: 10.3389/fncom.2013.00134
Quantifying network properties in multi-electroderecordings: spatiotemporal characterization and inter-trialvariation of evoked gamma oscillations in mousesomatosensory cortex in vitroCristian Carmeli1†, Paolo Bonifazi2,3†, Hugh P. C. Robinson2† and Michael Small4*†
1 Laboratoire de Recherche en Neuroimagerie, Department of Clinical Neurosciences, Centre Hospitalier Universitaire Vaudois and University of Lausanne,Lausanne, Switzerland
2 Department of Physiology, Development and Neuroscience, University of Cambridge, Cambridge, UK3 School of Physics and Astronomy, Tel-Aviv University, Tel-Aviv, Israel4 School of Mathematics and Statistics, The University of Western Australia, Crawley, WA, Australia
Edited by:
Qawi K. Telesford, Wake ForestUniversity School of Medicine, USA
Reviewed by:
Karl Friston, University CollegeLondon, UKIan Stevenson, University ofConnecticut, USA
*Correspondence:
Michael Small, School ofMathematics and Statistics (M019),The University of Western Australia,Crawley, WA 6009, Australiae-mail: [email protected]†These authors have contributedequally to this work.
Linking the structural connectivity of brain circuits to their cooperative dynamics andemergent functions is a central aim of neuroscience research. Graph theory has recentlybeen applied to study the structure-function relationship of networks, where dynamicalsimilarity of different nodes has been turned into a “static” functional connection.However, the capability of the brain to adapt, learn and process external stimuli requires aconstant dynamical functional rewiring between circuitries and cell assemblies. Hence, wemust capture the changes of network functional connectivity over time. Multi-electrodearray data present a unique challenge within this framework. We study the dynamicsof gamma oscillations in acute slices of the somatosensory cortex from juvenile micerecorded by planar multi-electrode arrays. Bursts of gamma oscillatory activity lasting a fewhundred milliseconds could be initiated only by brief trains of electrical stimulations appliedat the deepest cortical layers and simultaneously delivered at multiple locations. Localfield potentials were used to study the spatio-temporal properties and the instantaneoussynchronization profile of the gamma oscillatory activity, combined with current sourcedensity (CSD) analysis. Pair-wise differences in the oscillation phase were used todetermine the presence of instantaneous synchronization between the different sites ofthe circuitry during the oscillatory period. Despite variation in the duration of the oscillatoryresponse over successive trials, they showed a constant average power, suggesting thatthe rate of expenditure of energy during the gamma bursts is consistent across repeatedstimulations. Within each gamma burst, the functional connectivity map reflected thecolumnar organization of the neocortex. Over successive trials, an apparently randomrearrangement of the functional connectivity was observed, with a more stable columnarthan horizontal organization. This work reveals new features of evoked gamma oscillationsin developing cortex.
Keywords: gamma oscillations, acute cortical slices, multi-electrode arrays, local field potentials, spatial
synchronization, functional connectivity
INTRODUCTIONIn the last decade, the connectome approach is providing moreand more information on the wiring of the nervous systemat different spatial scales of investigation, while multi-channelelectrical and optical recordings provide a massive amount ofdata on brain activity dynamics recorded from multiple sites(Friston, 2005; Lebedev and Nicolelis, 2006; Homma et al., 2009;Sporns, 2011). Therefore, there is a need for new theoreticaland experimental tools to bridge these different levels (scale)of investigations (Stevenson et al., 2008; Rubinov and Sporns,2010; Feldt et al., 2011; Bastos et al., 2012). The aim of thispaper is to provide a range of techniques that may be applied
to elucidate functional relationships among brain regions frommulti-electrode recordings of structured cortical tissue. In partic-ular, by studying the dynamics of gamma oscillatory activity, amain brain rhythm (Buzsáki, 2006; Fries, 2009), we concentrateon establishing a clear and general set of tools that minimizesassumptions about network structure.
Oscillatory synchronous activity is a general feature of fir-ing of neuronal networks both in adult animals and duringdevelopment (Buzsáki, 2006; Uhlhaas et al., 2010). Oscillationsare seen in-vivo in local field potential and/or EEG signals, inperipheral structures (olfactory bulb), in sensory and motor cor-tices, in the hippocampus and in the thalamus (Buzsáki and
Frontiers in Computational Neuroscience www.frontiersin.org October 2013 | Volume 7 | Article 134 | 1
COMPUTATIONAL NEUROSCIENCE

Carmeli et al. spatiotemporal characterization of gamma oscillations
Draguhn, 2004; Buzsáki, 2006). In vitro, oscillations have beenobserved in spontaneous activity or in response to drug applica-tion and/or electrical stimulation (Buhl et al., 1998; Traub et al.,2004; Khazipov and Luhmann, 2006). Intracellular recording ofsingle neurons during network oscillations reveals subthresholdmembrane potentials fluctuations and action potential timingwhich is correlated to the oscillation in extracellular field poten-tial (Hasenstaub et al., 2005). Oscillations occur over a very widerange of frequencies (f ) ranging from 0.05 to 500 Hz, with EEGsignals showing a 1/f power relationship (Buzsáki and Draguhn,2004). This suggests that perturbations occurring at slow fre-quencies can cause a cascade of energy dissipation at higherfrequencies, and that widespread slow oscillations could mod-ulate faster local events. Within this wide range of frequencies,gamma rhythms (30–80 Hz) have been proposed to play a funda-mental role in sensory encoding and processing (Fries, 2009), forexample in the olfactory system (Laurent and Davidowitz, 1994),in perceptual binding (Singer and Gray, 1995), motor program-ming (Murthy and Fetz, 1996), and associative learning (Miltneret al., 1999). In the somatosensory cortex, detection of input fre-quencies in the gamma range is functionally important (Romoand Salinas, 2003).
It appears that the gap-junctional network of coupled fast-spiking inhibitory interneurons, which forms an electrical syn-cytium through the layers of the cortex (Galarreta and Hestrin,1999; Gibson et al., 1999), is a crucial component in the dynam-ics of gamma oscillations (Fries, 2005; Hasenstaub et al., 2005;Morita et al., 2008). The ability to evoke gamma oscillations inacutely-isolated slices (Traub et al., 2004) makes it clear that localmechanisms in the cortex can suffice to drive gamma oscillations.Interestingly, gamma oscillations have been recorded also in dis-sociated neuronal cultures which lack the structural organizationof intact cortical circuits (Shein Idelson et al., 2010).
To assess how gamma oscillations can structure the timingof network activity and set the context for temporal codingin cortical neurons, it is necessary to understand quantitativelyhow gamma oscillations form and disperse in space and timeand their variability in different activation. In this work, wehave electrically evoked and recorded gamma oscillations fromthe local field potential at multiple sites within acutely-isolatedslices of mouse somatosensory cortex, using planar multielec-trode arrays (MEAs) (Maeda et al., 1995; Jimbo et al., 1998).We used Hilbert transform and wavelet analysis to resolve thetemporal evolution of oscillation frequency and phase at multi-ple sites, and methods of non-linear time series analysis (Kantzand Schreiber, 1997) to describe the evolution of dynamicalsynchrony at different sites at the pair-wise level. This allowedus to quantify how synchrony between different regions ofthe cortical network builds up and decays during an oscilla-tory event and how synchrony varies when applying repeatedstimuli.
The experimental data shows significant trial-to-trial variabil-ity in both the raw time series and the evoked gamma oscillations.Nonetheless, the data analysis described above allows us to studythe mechanism underlying onset and maintenance of synchro-nization in different regions within a gamma burst. We find thatfunctional connectivity between multi-electrode locations has a
rather non-random structure (more vertically oriented than hor-izontal), but that the precise configuration of the connectionsappears random, changing from trial to trial. Hence, we do notexplicitly build a network, nor analyse the network properties.The main effect we observe is evident in the extent and dynamicsof synchrony as measured operationally in terms of phase syn-chronization or functional connectivity-by analyzing more elab-orate network based properties we would only serve to obfuscatethis information. In this report, we focus on the dynamic aspectof transient coupling using a non-linear measure of functionalconnectivity (phase synchronization). Here, we use functionalconnectivity in the formal sense to reflect statistical dependen-cies among neuronal responses. However, we do not attempt toexplain this in terms of directed or effective connectivity—or theunderlying microcircuits—but simply highlight the challenge tounderstand the phenomena we report below.
METHODSSLICE PREPARATIONNeocortical slices have been prepared as described in (Kim andRobinson, 2011). Briefly, 8–12 days old CD-1 mice (CharlesRiver, Margate, UK) were used for brain slice preparation (killedaccording to UK Home Office guidelines). Following cervical dis-location, the brain was rapidly immersed in ice-cold Ringer’ssolution of the following composition (in mM): 125 NaCl, 25NaHCO3, 2.5 KCl, 1.25 NaH2PO4, 2 CaCl2, 1 MgCl2, and 25glucose, oxygenated with 95% O2, 5% CO2 to maintain a pHof 7.4. Three hundred micrometer sagittal slices were cut fromone hemisphere. Brain slices were incubated in Ringer’s solu-tion on a cotton mesh at room temperaturefor at least 30 minbefore recording and perfused with oxygenated slicing solutionat 30–33◦C during recording.
ELECTRICAL RECORDING AND STIMULATION THROUGHMULTI-ELECTRODE ARRAYSA Multichannel Systems (Reutlingen, Germany) MEA60 multi-electrode array recording system was used to record simultane-ously from 60-channel planar MEAs. Slices were held on thesurface of the array using a “harp” of threads stretched acrossa gold ring (Sakmann and Stuart, 1995). Five biphasic volt-age pulses at 200 Hz of amplitude varying between 0.1 and 1 Vand duration of 0.1 ms each, were delivered through subsets ofthe array electrodes using the blanking circuitry built in to thepreamplifiers. The particular subsets of electrodes used to deliverthe stimuli were selected in order to produce reliable gammaresponses. Having been selected, the same set of electrodes wasused for all subsequent stimulations and usually comprised oneto three electrodes of the available array. The minimal amplitudecapable of evoking a gamma burst was applied to the subset ofelectrodes used for stimulation. Stimulations were delivered withat least 30 s interval in between consecutive stimulations. Removalof the stimulation artifact was performed according to Ruaro et al.(2005).
When synaptic agonists/antagonists were used, drugs were per-fused for at least 20 min before applying the stimulation protocol.
The following synaptic agonists/antagonists were used: 2-amino-5-phosphonovalerate (APV; Sigma-Aldrich), Carbachol
Frontiers in Computational Neuroscience www.frontiersin.org October 2013 | Volume 7 | Article 134 | 2
Carmeli et al. spatiotemporal characterization of gamma oscillations
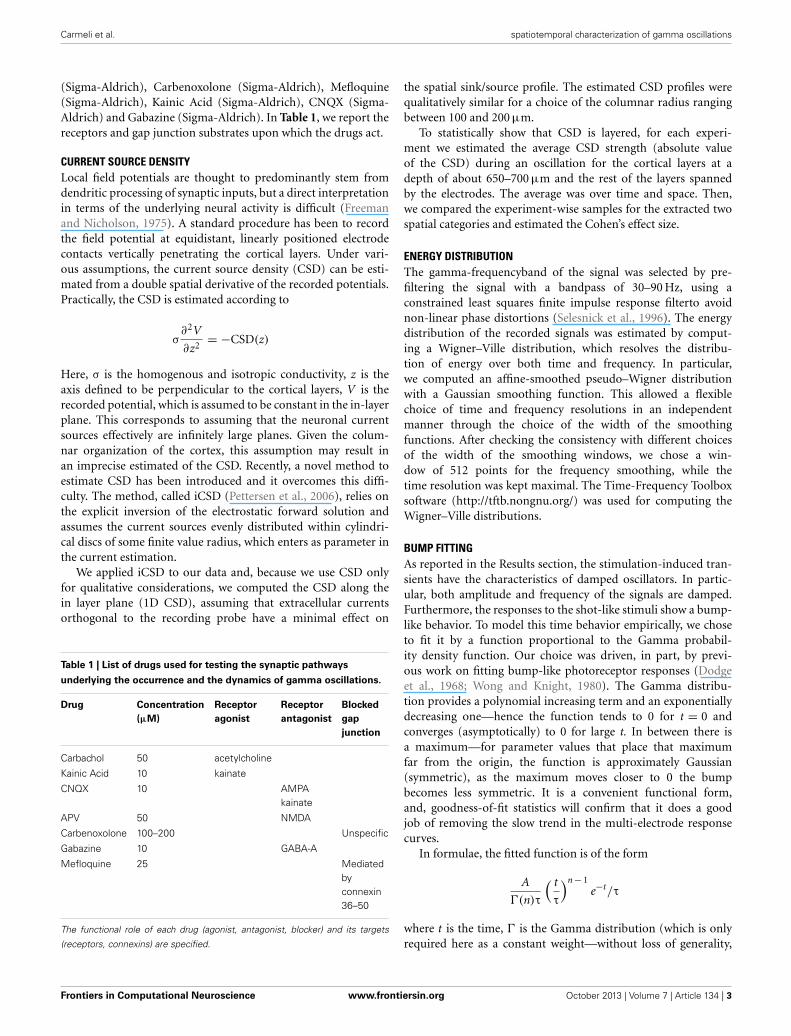
(Sigma-Aldrich), Carbenoxolone (Sigma-Aldrich), Mefloquine(Sigma-Aldrich), Kainic Acid (Sigma-Aldrich), CNQX (Sigma-Aldrich) and Gabazine (Sigma-Aldrich). In Table 1, we report thereceptors and gap junction substrates upon which the drugs act.
CURRENT SOURCE DENSITYLocal field potentials are thought to predominantly stem fromdendritic processing of synaptic inputs, but a direct interpretationin terms of the underlying neural activity is difficult (Freemanand Nicholson, 1975). A standard procedure has been to recordthe field potential at equidistant, linearly positioned electrodecontacts vertically penetrating the cortical layers. Under vari-ous assumptions, the current source density (CSD) can be esti-mated from a double spatial derivative of the recorded potentials.Practically, the CSD is estimated according to
σ∂2V
∂z2= −CSD(z)
Here, σ is the homogenous and isotropic conductivity, z is theaxis defined to be perpendicular to the cortical layers, V is therecorded potential, which is assumed to be constant in the in-layerplane. This corresponds to assuming that the neuronal currentsources effectively are infinitely large planes. Given the colum-nar organization of the cortex, this assumption may result inan imprecise estimated of the CSD. Recently, a novel method toestimate CSD has been introduced and it overcomes this diffi-culty. The method, called iCSD (Pettersen et al., 2006), relies onthe explicit inversion of the electrostatic forward solution andassumes the current sources evenly distributed within cylindri-cal discs of some finite value radius, which enters as parameter inthe current estimation.
We applied iCSD to our data and, because we use CSD onlyfor qualitative considerations, we computed the CSD along thein layer plane (1D CSD), assuming that extracellular currentsorthogonal to the recording probe have a minimal effect on
Table 1 | List of drugs used for testing the synaptic pathways
underlying the occurrence and the dynamics of gamma oscillations.
Drug Concentration
(µM)
Receptor
agonist
Receptor
antagonist
Blocked
gap
junction
Carbachol 50 acetylcholine
Kainic Acid 10 kainate
CNQX 10 AMPAkainate
APV 50 NMDA
Carbenoxolone 100–200 Unspecific
Gabazine 10 GABA-A
Mefloquine 25 Mediatedbyconnexin36–50
The functional role of each drug (agonist, antagonist, blocker) and its targets
(receptors, connexins) are specified.
the spatial sink/source profile. The estimated CSD profiles werequalitatively similar for a choice of the columnar radius rangingbetween 100 and 200 μm.
To statistically show that CSD is layered, for each experi-ment we estimated the average CSD strength (absolute valueof the CSD) during an oscillation for the cortical layers at adepth of about 650–700 μm and the rest of the layers spannedby the electrodes. The average was over time and space. Then,we compared the experiment-wise samples for the extracted twospatial categories and estimated the Cohen’s effect size.
ENERGY DISTRIBUTIONThe gamma-frequencyband of the signal was selected by pre-filtering the signal with a bandpass of 30–90 Hz, using aconstrained least squares finite impulse response filterto avoidnon-linear phase distortions (Selesnick et al., 1996). The energydistribution of the recorded signals was estimated by comput-ing a Wigner–Ville distribution, which resolves the distribu-tion of energy over both time and frequency. In particular,we computed an affine-smoothed pseudo–Wigner distributionwith a Gaussian smoothing function. This allowed a flexiblechoice of time and frequency resolutions in an independentmanner through the choice of the width of the smoothingfunctions. After checking the consistency with different choicesof the width of the smoothing windows, we chose a win-dow of 512 points for the frequency smoothing, while thetime resolution was kept maximal. The Time-Frequency Toolboxsoftware (http://tftb.nongnu.org/) was used for computing theWigner–Ville distributions.
BUMP FITTINGAs reported in the Results section, the stimulation-induced tran-sients have the characteristics of damped oscillators. In partic-ular, both amplitude and frequency of the signals are damped.Furthermore, the responses to the shot-like stimuli show a bump-like behavior. To model this time behavior empirically, we choseto fit it by a function proportional to the Gamma probabil-ity density function. Our choice was driven, in part, by previ-ous work on fitting bump-like photoreceptor responses (Dodgeet al., 1968; Wong and Knight, 1980). The Gamma distribu-tion provides a polynomial increasing term and an exponentiallydecreasing one—hence the function tends to 0 for t = 0 andconverges (asymptotically) to 0 for large t. In between there isa maximum—for parameter values that place that maximumfar from the origin, the function is approximately Gaussian(symmetric), as the maximum moves closer to 0 the bumpbecomes less symmetric. It is a convenient functional form,and, goodness-of-fit statistics will confirm that it does a goodjob of removing the slow trend in the multi-electrode responsecurves.
In formulae, the fitted function is of the form
A
�(n)τ
( t
τ
)n − 1e−t/τ
where t is the time, � is the Gamma distribution (which is onlyrequired here as a constant weight—without loss of generality,
Frontiers in Computational Neuroscience www.frontiersin.org October 2013 | Volume 7 | Article 134 | 3
Carmeli et al. spatiotemporal characterization of gamma oscillations
this term could be subsumed by A) and A, n, τ are the threeparameters. Specifically, A represents the amplitude of the bump,n and τ are, respectively, the shape and scale parameters of theGamma distribution corresponding to A equal to 1.
Importantly, the duration of the bump can be defined and thenevaluated by the following formula (Wong and Knight, 1980)
(n!)222n + 1
(2n)! τ
Once n and τ have been calibrated. To determine the duration ofan oscillation in an experiment for a particular slice, the fittingwas performed on the average time course at the recording elec-trodes on that slice. Moreover, as a further check, we estimatedthe duration of oscillations with another method, by measuringit as the time interval between the first peak after the stimulationtransient and the last peak of the instantaneous power averagedover the recording electrodes. The last peak was determined asthe last peak above the noise floor estimated from the averagepower before stimulation. Both approaches provided concordantresults.
PAIR-WISE ESTIMATOR OF SYNCHRONIZATIONSeveral methods have been proposed to estimate functionalconnectivity from multivariate time series (David et al., 2004;Carmeli et al., 2005). They can be subdivided into methodsinferring undirected or directed (uni- or bi-directional) func-tional connectivity (Sato et al., 2006; De Feo and Carmeli, 2008;Sommerlade et al., 2012). Although important, directed func-tional connectivity is difficult to estimate from real noisy datawhen the number of time series is high (>10) or the underlyingoscillators are not weakly coupled. For these reasons, we optedfor estimating undirected functional connectivity, specifically bycomparing the phase angles of the interacting oscillatory systems.Indeed, phase coupling is an appealing approach becausephasesynchronization phenomena may in general include synchronyofphases but with uncorrelated amplitudes (Pikovsky et al., 2001).In our case, the dominant presence of the gamma rhythm con-fers meaning to the phase, and makes it natural to use the phaseto examine synchronization phenomena. The separation of phaseand amplitude was achieved by employing the analytical signalconcept, i.e., by means of the Hilbert transform (Rosenblum et al.,2001).
Suppose that we have estimated the phases φ(1)t , φ
(2)t , t =
0, . . . , L − 1, for two signals (1) and (2), respectively. To detect1:1 phase locking in noisy signals, we can look at the appearanceof peaks in the distribution of the difference of the unwrapped
phases φ(1, 2)t = φ
(1)t − φ
(2)t , ∀t (Tass et al., 1998). Hence, an esti-
mator of synchronization (EOS) can be defined (Mormann et al.,2000) as
EOS(1, 2) =∣∣∣∣∣
1
L
L − 1∑t = 0
e(iφ(1, 2)t )
∣∣∣∣∣2
EOS(1,2) measures the (time) average phase coherence. By con-struction, it is zero if the phases are independent one another
(φ(1,2)t has a uniform distribution) and is one if the phase differ-
ence is constant (perfect phase synchronization). Furthermore, sodefined, EOS(1,2) reflects both zero phase lags as well as non-zerophase lag coupling of the phases between two signals.
To measure only phase lagged coupling, one way is to discardphase differences that are centered around 0 mod π. An asymme-try in the distribution of phase differences implies the presence ofa consistent, non-zero phase lag between the two signals. An indexof the asymmetry of the phase difference distribution is given byStam et al. (2007)
PLI(1, 2) =∣∣∣∣∣
1
L
L − 1∑t = 0
sign(φ(1, 2)t )
∣∣∣∣∣
when the phase difference φ(1,2)t is bounded in the interval −π <
φ(1,2)t ≤ π. The phase lag index (PLI) ranges between 0 and 1.
A PLI(1,2) of 0 indicates either no coupling or coupling with aphase difference centered around 0 mod π. A PLI(1,2) of 1 indi-
cates perfect phase locking at a value of φ(1,2)t different from
0 mod π. Recently, the weighted phase lag index (WPLI) hasbeen introduced and shown to possess increased sensitivity com-pared to the PLI (Vinck et al., 2011). The WPLI is based on theimaginary part of the cross-spectra of the multivariate signals.Considering the difficulty to reliably estimate cross-spectra fromvery short signals (Böhm and von Sachs, 2009), we opted forthe PLI approach only. Furthermore, formulating the WPLI interms of wavelets would represent an attractive solution, however,such a methodological development is out of the scope of thiswork.
To investigate the synchronization dynamics during an oscilla-tion, we computed the indices of synchronization (EOS and PLI)on windows of 50 ms shifted of 2 ms. That window of 50 ms allowsto include about 3 gamma cycles and corresponds to 1000 samplespoints. From a statistical estimation point of view that sample sizeis large enough to reliably estimate the EOS (small variance andbias), which is basically a second order statistic of the distribu-tion of the considered directional variable (or, concentration ofthe mean direction of the phase difference) (Mardia and Jupp,2000).
Subsequently, for each pair of signals, to decide whether thestimulation induced synchronization was not explained by noise,we compared the values of synchrony (EOS or PLI) at eachtime window with the 99% percentile of the values obtainedin a pre-stimulation time period of 0.5 s. If the former valueexceeded the latter, we declared the synchronization between thatpair as existing or significantly non null. To study the robust-ness of our analysis with respect to the choice of the threshold,we repeated the analyses with the 95% percentile as thresholdvalue. We obtained similar patterns, and so, in the following,we report only the findings obtained with the 99% percentilethreshold. Finally, although the distribution of baseline values iskey to determine whether the stimulation-induced EOS change ispresent, it also seems important to take the actual EOS values intoaccount. In this work, we focus only on the presence/absence ofsynchronization, without investigating the effect size of the EOSchanges.
Frontiers in Computational Neuroscience www.frontiersin.org October 2013 | Volume 7 | Article 134 | 4
Carmeli et al. spatiotemporal characterization of gamma oscillations
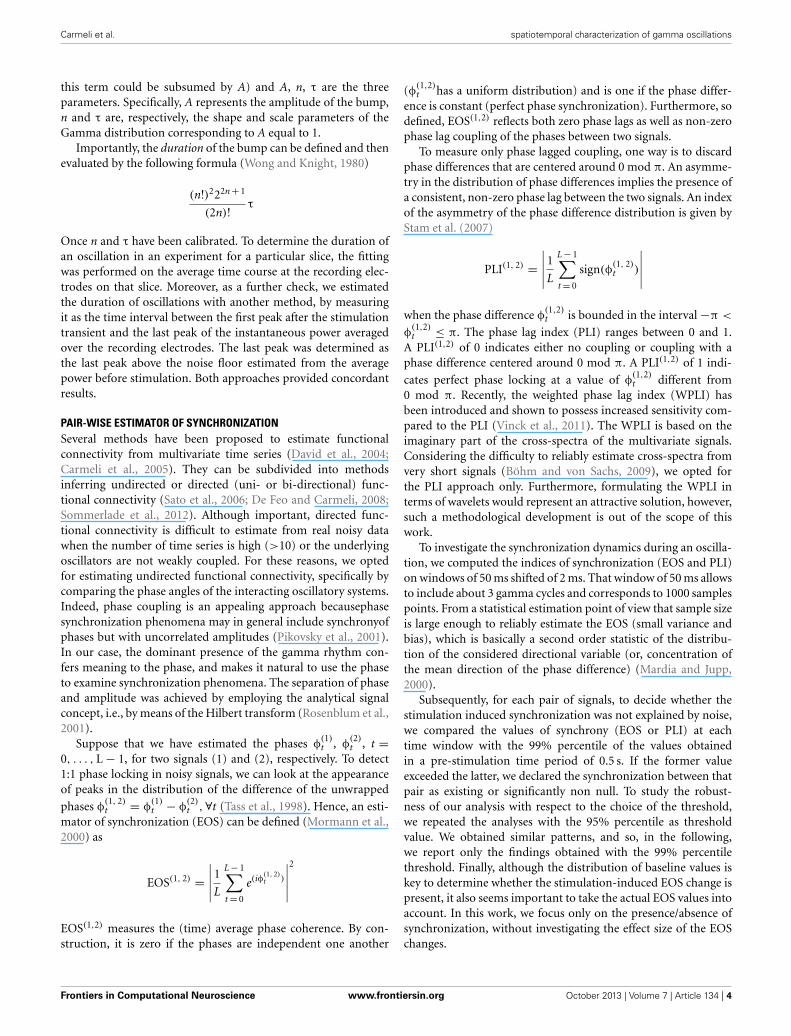
RESULTSELECTRICALLY EVOKED GAMMA OSCILLATIONS IN CORTICAL SLICESFROM YOUNG MICEExperiments were carried out on 19 sagittal cortical slices fromP8-12 mice. The electrical activity in the somatosensory corticalarea was evoked and measured using multi-electrode arrays(MEAs) with 60 electrode terminals arranged in an 8 × 8 gridand with an inter-electrode distance of 100 or 200 μm with itstop aligned at about 150 μm below the cortical surface. Usingthis configuration, it was possible to cover most cortical layers(Figure 1A). The spontaneous activity of the network was verylow, consisting of only occasional, isolated action potentials (notshown).
Using short trains of electrical stimuli (5 bipolar pulses at200 Hz, see Methods) applied at one or more loci in the net-work (Figure 1B), we were able to evoke oscillatory networkactivity in the gamma frequency band (30–90 Hz, Figures 1C,D).Stimulations with different spatial profiles were applied every30 s and a series of at least 6 trials was collected for each
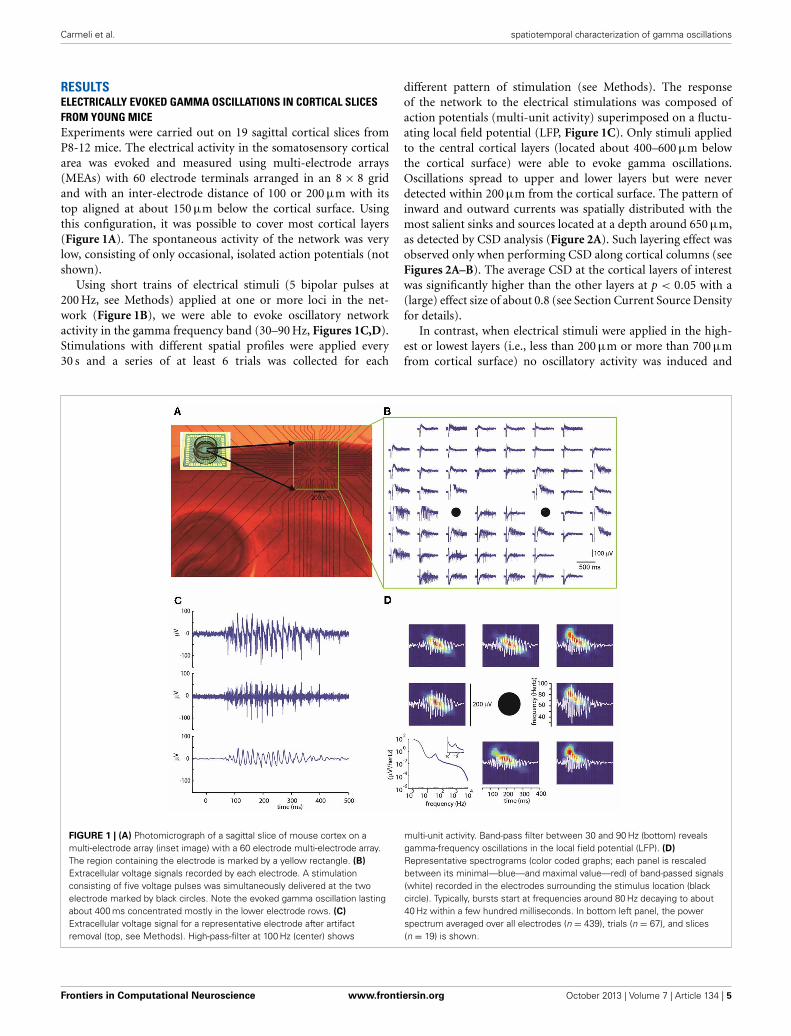
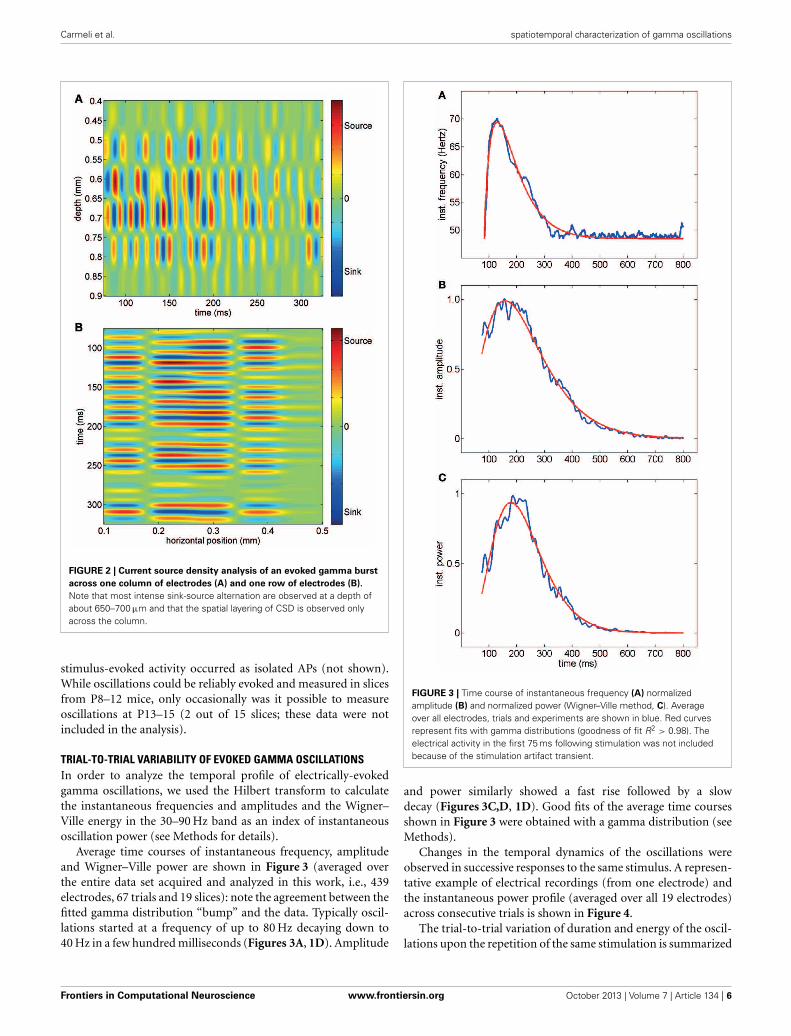
different pattern of stimulation (see Methods). The responseof the network to the electrical stimulations was composed ofaction potentials (multi-unit activity) superimposed on a fluctu-ating local field potential (LFP, Figure 1C). Only stimuli appliedto the central cortical layers (located about 400–600 μm belowthe cortical surface) were able to evoke gamma oscillations.Oscillations spread to upper and lower layers but were neverdetected within 200 μm from the cortical surface. The pattern ofinward and outward currents was spatially distributed with themost salient sinks and sources located at a depth around 650 μm,as detected by CSD analysis (Figure 2A). Such layering effect wasobserved only when performing CSD along cortical columns (seeFigures 2A–B). The average CSD at the cortical layers of interestwas significantly higher than the other layers at p < 0.05 with a(large) effect size of about 0.8 (see Section Current Source Densityfor details).
In contrast, when electrical stimuli were applied in the high-est or lowest layers (i.e., less than 200 μm or more than 700 μmfrom cortical surface) no oscillatory activity was induced and
FIGURE 1 | (A) Photomicrograph of a sagittal slice of mouse cortex on amulti-electrode array (inset image) with a 60 electrode multi-electrode array.The region containing the electrode is marked by a yellow rectangle. (B)
Extracellular voltage signals recorded by each electrode. A stimulationconsisting of five voltage pulses was simultaneously delivered at the twoelectrode marked by black circles. Note the evoked gamma oscillation lastingabout 400 ms concentrated mostly in the lower electrode rows. (C)
Extracellular voltage signal for a representative electrode after artifactremoval (top, see Methods). High-pass-filter at 100 Hz (center) shows
multi-unit activity. Band-pass filter between 30 and 90 Hz (bottom) revealsgamma-frequency oscillations in the local field potential (LFP). (D)
Representative spectrograms (color coded graphs; each panel is rescaledbetween its minimal—blue—and maximal value—red) of band-passed signals(white) recorded in the electrodes surrounding the stimulus location (blackcircle). Typically, bursts start at frequencies around 80 Hz decaying to about40 Hz within a few hundred milliseconds. In bottom left panel, the powerspectrum averaged over all electrodes (n = 439), trials (n = 67), and slices(n = 19) is shown.
Frontiers in Computational Neuroscience www.frontiersin.org October 2013 | Volume 7 | Article 134 | 5
Carmeli et al. spatiotemporal characterization of gamma oscillations
FIGURE 2 | Current source density analysis of an evoked gamma burst
across one column of electrodes (A) and one row of electrodes (B).
Note that most intense sink-source alternation are observed at a depth ofabout 650–700 μm and that the spatial layering of CSD is observed onlyacross the column.
stimulus-evoked activity occurred as isolated APs (not shown).While oscillations could be reliably evoked and measured in slicesfrom P8–12 mice, only occasionally was it possible to measureoscillations at P13–15 (2 out of 15 slices; these data were notincluded in the analysis).
TRIAL-TO-TRIAL VARIABILITY OF EVOKED GAMMA OSCILLATIONSIn order to analyze the temporal profile of electrically-evokedgamma oscillations, we used the Hilbert transform to calculatethe instantaneous frequencies and amplitudes and the Wigner–Ville energy in the 30–90 Hz band as an index of instantaneousoscillation power (see Methods for details).
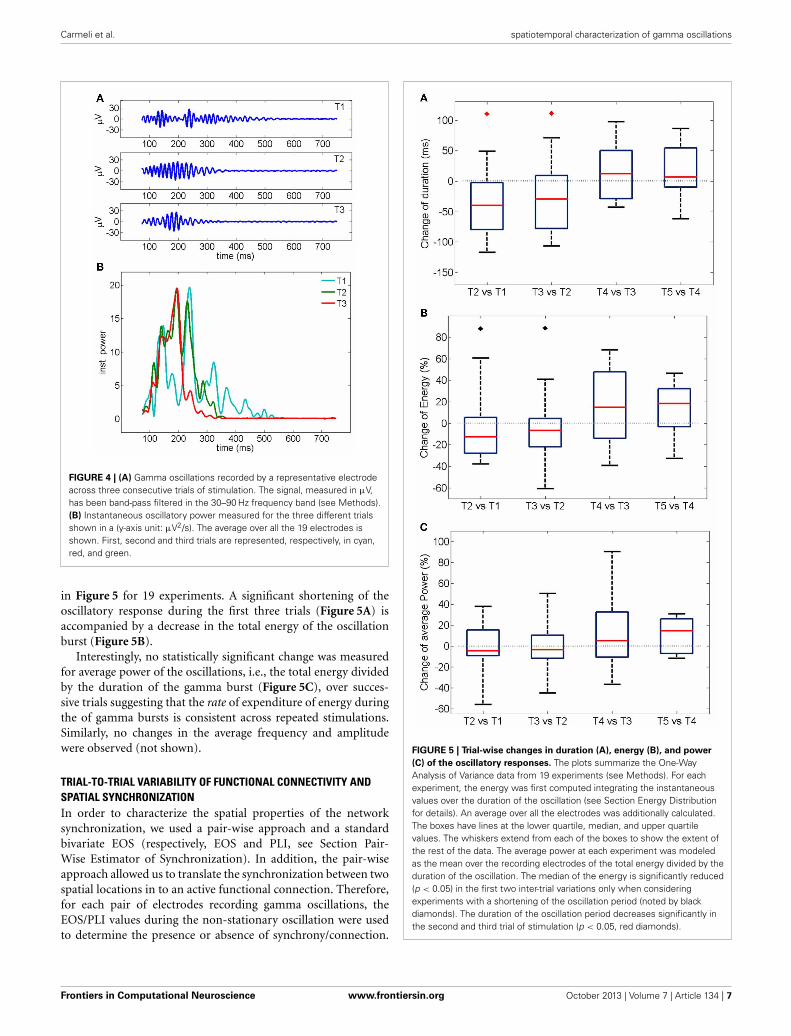
Average time courses of instantaneous frequency, amplitudeand Wigner–Ville power are shown in Figure 3 (averaged overthe entire data set acquired and analyzed in this work, i.e., 439electrodes, 67 trials and 19 slices): note the agreement between thefitted gamma distribution “bump” and the data. Typically oscil-lations started at a frequency of up to 80 Hz decaying down to40 Hz in a few hundred milliseconds (Figures 3A, 1D). Amplitude
FIGURE 3 | Time course of instantaneous frequency (A) normalizedamplitude (B) and normalized power (Wigner–Ville method, C). Averageover all electrodes, trials and experiments are shown in blue. Red curvesrepresent fits with gamma distributions (goodness of fit R2 > 0.98). Theelectrical activity in the first 75 ms following stimulation was not includedbecause of the stimulation artifact transient.
and power similarly showed a fast rise followed by a slowdecay (Figures 3C,D, 1D). Good fits of the average time coursesshown in Figure 3 were obtained with a gamma distribution (seeMethods).
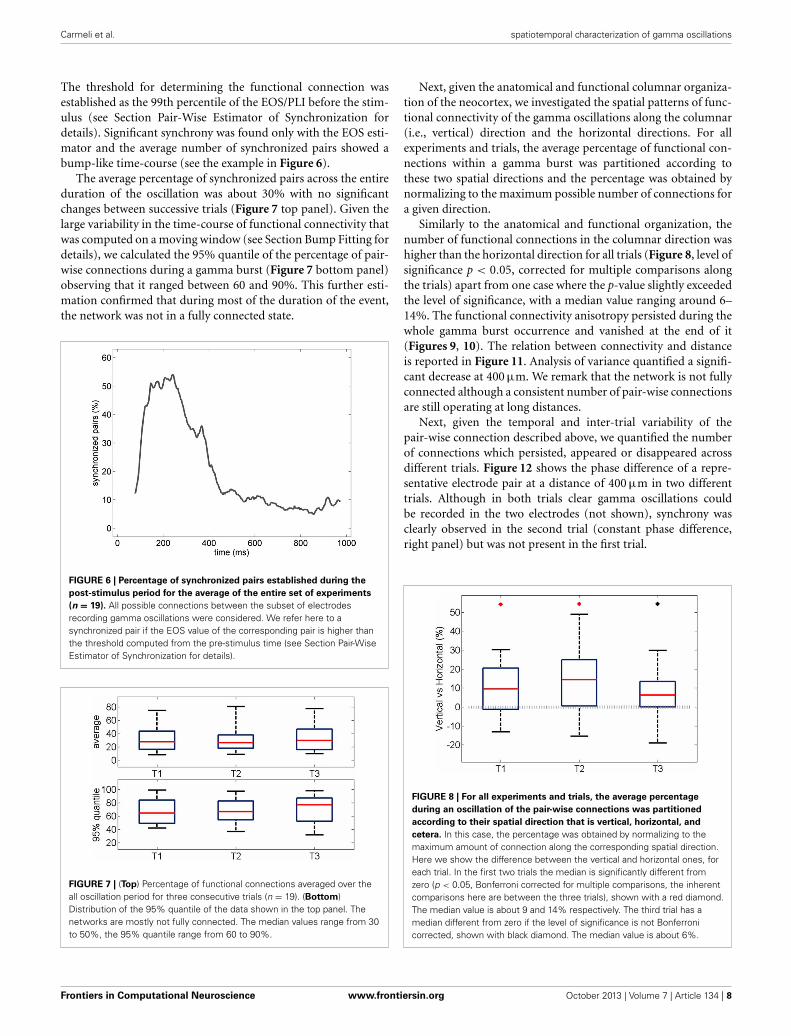
Changes in the temporal dynamics of the oscillations wereobserved in successive responses to the same stimulus. A represen-tative example of electrical recordings (from one electrode) andthe instantaneous power profile (averaged over all 19 electrodes)across consecutive trials is shown in Figure 4.
The trial-to-trial variation of duration and energy of the oscil-lations upon the repetition of the same stimulation is summarized
Frontiers in Computational Neuroscience www.frontiersin.org October 2013 | Volume 7 | Article 134 | 6
Carmeli et al. spatiotemporal characterization of gamma oscillations
FIGURE 4 | (A) Gamma oscillations recorded by a representative electrodeacross three consecutive trials of stimulation. The signal, measured in μV,has been band-pass filtered in the 30–90 Hz frequency band (see Methods).(B) Instantaneous oscillatory power measured for the three different trialsshown in a (y-axis unit: μV2/s). The average over all the 19 electrodes isshown. First, second and third trials are represented, respectively, in cyan,red, and green.
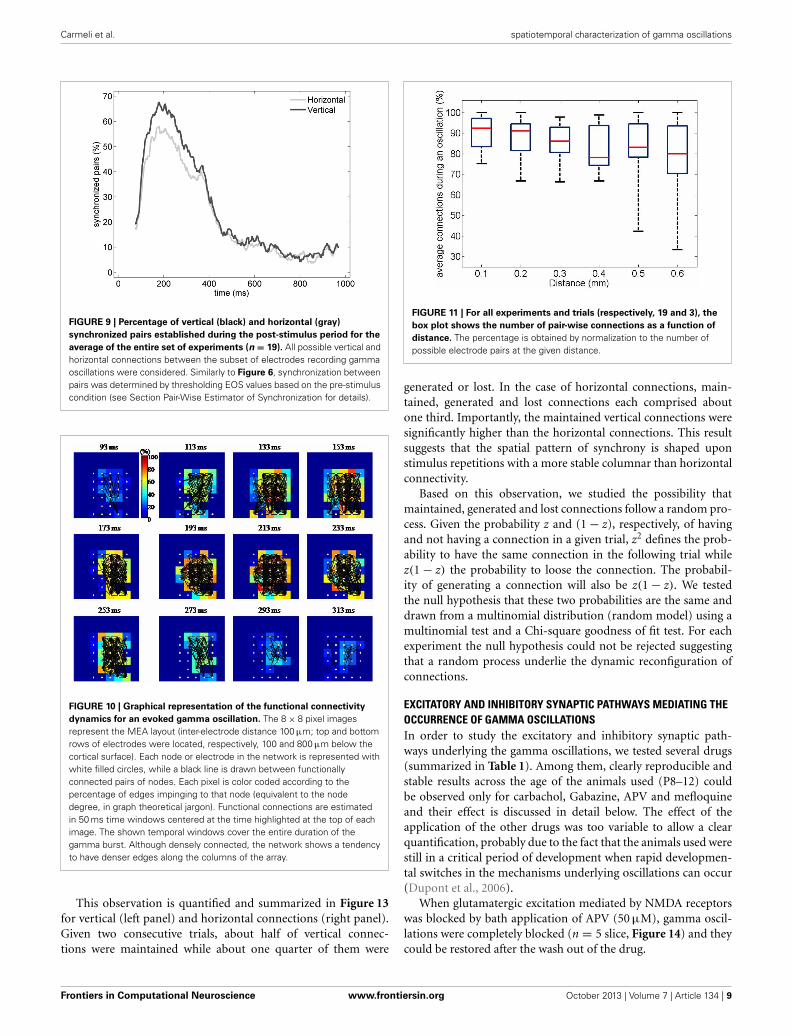
in Figure 5 for 19 experiments. A significant shortening of theoscillatory response during the first three trials (Figure 5A) isaccompanied by a decrease in the total energy of the oscillationburst (Figure 5B).
Interestingly, no statistically significant change was measuredfor average power of the oscillations, i.e., the total energy dividedby the duration of the gamma burst (Figure 5C), over succes-sive trials suggesting that the rate of expenditure of energy duringthe of gamma bursts is consistent across repeated stimulations.Similarly, no changes in the average frequency and amplitudewere observed (not shown).
TRIAL-TO-TRIAL VARIABILITY OF FUNCTIONAL CONNECTIVITY ANDSPATIAL SYNCHRONIZATIONIn order to characterize the spatial properties of the networksynchronization, we used a pair-wise approach and a standardbivariate EOS (respectively, EOS and PLI, see Section Pair-Wise Estimator of Synchronization). In addition, the pair-wiseapproach allowed us to translate the synchronization between twospatial locations in to an active functional connection. Therefore,for each pair of electrodes recording gamma oscillations, theEOS/PLI values during the non-stationary oscillation were usedto determine the presence or absence of synchrony/connection.
FIGURE 5 | Trial-wise changes in duration (A), energy (B), and power
(C) of the oscillatory responses. The plots summarize the One-WayAnalysis of Variance data from 19 experiments (see Methods). For eachexperiment, the energy was first computed integrating the instantaneousvalues over the duration of the oscillation (see Section Energy Distributionfor details). An average over all the electrodes was additionally calculated.The boxes have lines at the lower quartile, median, and upper quartilevalues. The whiskers extend from each of the boxes to show the extent ofthe rest of the data. The average power at each experiment was modeledas the mean over the recording electrodes of the total energy divided by theduration of the oscillation. The median of the energy is significantly reduced(p < 0.05) in the first two inter-trial variations only when consideringexperiments with a shortening of the oscillation period (noted by blackdiamonds). The duration of the oscillation period decreases significantly inthe second and third trial of stimulation (p < 0.05, red diamonds).
Frontiers in Computational Neuroscience www.frontiersin.org October 2013 | Volume 7 | Article 134 | 7
Carmeli et al. spatiotemporal characterization of gamma oscillations
The threshold for determining the functional connection wasestablished as the 99th percentile of the EOS/PLI before the stim-ulus (see Section Pair-Wise Estimator of Synchronization fordetails). Significant synchrony was found only with the EOS esti-mator and the average number of synchronized pairs showed abump-like time-course (see the example in Figure 6).
The average percentage of synchronized pairs across the entireduration of the oscillation was about 30% with no significantchanges between successive trials (Figure 7 top panel). Given thelarge variability in the time-course of functional connectivity thatwas computed on a moving window (see Section Bump Fitting fordetails), we calculated the 95% quantile of the percentage of pair-wise connections during a gamma burst (Figure 7 bottom panel)observing that it ranged between 60 and 90%. This further esti-mation confirmed that during most of the duration of the event,the network was not in a fully connected state.
FIGURE 6 | Percentage of synchronized pairs established during the
post-stimulus period for the average of the entire set of experiments
(n = 19). All possible connections between the subset of electrodesrecording gamma oscillations were considered. We refer here to asynchronized pair if the EOS value of the corresponding pair is higher thanthe threshold computed from the pre-stimulus time (see Section Pair-WiseEstimator of Synchronization for details).
FIGURE 7 | (Top) Percentage of functional connections averaged over theall oscillation period for three consecutive trials (n = 19). (Bottom)Distribution of the 95% quantile of the data shown in the top panel. Thenetworks are mostly not fully connected. The median values range from 30to 50%, the 95% quantile range from 60 to 90%.
Next, given the anatomical and functional columnar organiza-tion of the neocortex, we investigated the spatial patterns of func-tional connectivity of the gamma oscillations along the columnar(i.e., vertical) direction and the horizontal directions. For allexperiments and trials, the average percentage of functional con-nections within a gamma burst was partitioned according tothese two spatial directions and the percentage was obtained bynormalizing to the maximum possible number of connections fora given direction.
Similarly to the anatomical and functional organization, thenumber of functional connections in the columnar direction washigher than the horizontal direction for all trials (Figure 8, level ofsignificance p < 0.05, corrected for multiple comparisons alongthe trials) apart from one case where the p-value slightly exceededthe level of significance, with a median value ranging around 6–14%. The functional connectivity anisotropy persisted during thewhole gamma burst occurrence and vanished at the end of it(Figures 9, 10). The relation between connectivity and distanceis reported in Figure 11. Analysis of variance quantified a signifi-cant decrease at 400 μm. We remark that the network is not fullyconnected although a consistent number of pair-wise connectionsare still operating at long distances.
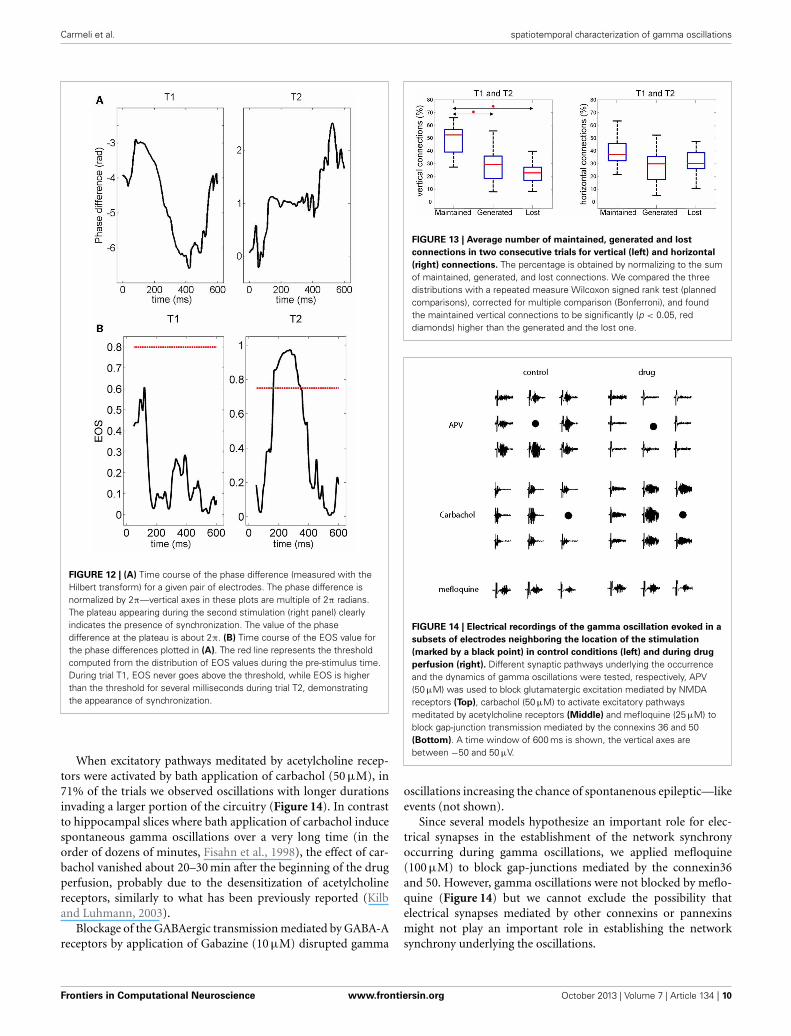
Next, given the temporal and inter-trial variability of thepair-wise connection described above, we quantified the numberof connections which persisted, appeared or disappeared acrossdifferent trials. Figure 12 shows the phase difference of a repre-sentative electrode pair at a distance of 400 μm in two differenttrials. Although in both trials clear gamma oscillations couldbe recorded in the two electrodes (not shown), synchrony wasclearly observed in the second trial (constant phase difference,right panel) but was not present in the first trial.
FIGURE 8 | For all experiments and trials, the average percentage
during an oscillation of the pair-wise connections was partitioned
according to their spatial direction that is vertical, horizontal, and
cetera. In this case, the percentage was obtained by normalizing to themaximum amount of connection along the corresponding spatial direction.Here we show the difference between the vertical and horizontal ones, foreach trial. In the first two trials the median is significantly different fromzero (p < 0.05, Bonferroni corrected for multiple comparisons, the inherentcomparisons here are between the three trials), shown with a red diamond.The median value is about 9 and 14% respectively. The third trial has amedian different from zero if the level of significance is not Bonferronicorrected, shown with black diamond. The median value is about 6%.
Frontiers in Computational Neuroscience www.frontiersin.org October 2013 | Volume 7 | Article 134 | 8
Carmeli et al. spatiotemporal characterization of gamma oscillations
FIGURE 9 | Percentage of vertical (black) and horizontal (gray)
synchronized pairs established during the post-stimulus period for the
average of the entire set of experiments (n = 19). All possible vertical andhorizontal connections between the subset of electrodes recording gammaoscillations were considered. Similarly to Figure 6, synchronization betweenpairs was determined by thresholding EOS values based on the pre-stimuluscondition (see Section Pair-Wise Estimator of Synchronization for details).
FIGURE 10 | Graphical representation of the functional connectivity
dynamics for an evoked gamma oscillation. The 8 × 8 pixel imagesrepresent the MEA layout (inter-electrode distance 100 μm; top and bottomrows of electrodes were located, respectively, 100 and 800 μm below thecortical surface). Each node or electrode in the network is represented withwhite filled circles, while a black line is drawn between functionallyconnected pairs of nodes. Each pixel is color coded according to thepercentage of edges impinging to that node (equivalent to the nodedegree, in graph theoretical jargon). Functional connections are estimatedin 50 ms time windows centered at the time highlighted at the top of eachimage. The shown temporal windows cover the entire duration of thegamma burst. Although densely connected, the network shows a tendencyto have denser edges along the columns of the array.
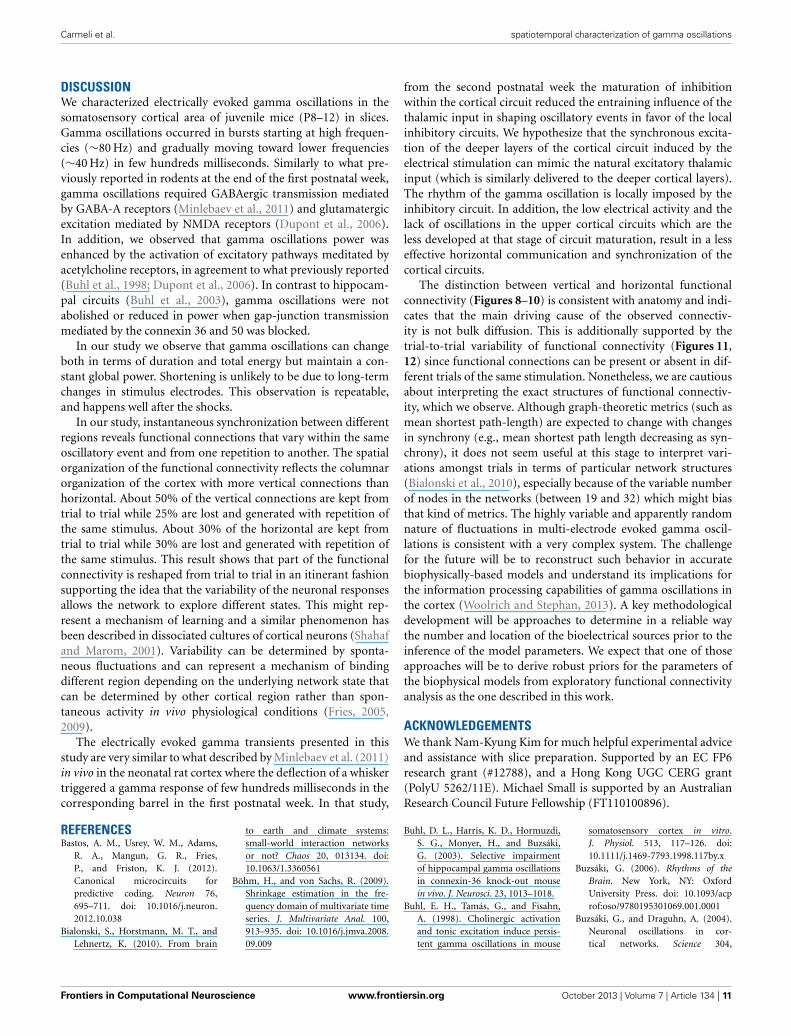
This observation is quantified and summarized in Figure 13for vertical (left panel) and horizontal connections (right panel).Given two consecutive trials, about half of vertical connec-tions were maintained while about one quarter of them were
FIGURE 11 | For all experiments and trials (respectively, 19 and 3), the
box plot shows the number of pair-wise connections as a function of
distance. The percentage is obtained by normalization to the number ofpossible electrode pairs at the given distance.
generated or lost. In the case of horizontal connections, main-tained, generated and lost connections each comprised aboutone third. Importantly, the maintained vertical connections weresignificantly higher than the horizontal connections. This resultsuggests that the spatial pattern of synchrony is shaped uponstimulus repetitions with a more stable columnar than horizontalconnectivity.
Based on this observation, we studied the possibility thatmaintained, generated and lost connections follow a random pro-cess. Given the probability z and (1 − z), respectively, of havingand not having a connection in a given trial, z2 defines the prob-ability to have the same connection in the following trial whilez(1 − z) the probability to loose the connection. The probabil-ity of generating a connection will also be z(1 − z). We testedthe null hypothesis that these two probabilities are the same anddrawn from a multinomial distribution (random model) using amultinomial test and a Chi-square goodness of fit test. For eachexperiment the null hypothesis could not be rejected suggestingthat a random process underlie the dynamic reconfiguration ofconnections.
EXCITATORY AND INHIBITORY SYNAPTIC PATHWAYS MEDIATING THEOCCURRENCE OF GAMMA OSCILLATIONSIn order to study the excitatory and inhibitory synaptic path-ways underlying the gamma oscillations, we tested several drugs(summarized in Table 1). Among them, clearly reproducible andstable results across the age of the animals used (P8–12) couldbe observed only for carbachol, Gabazine, APV and mefloquineand their effect is discussed in detail below. The effect of theapplication of the other drugs was too variable to allow a clearquantification, probably due to the fact that the animals used werestill in a critical period of development when rapid developmen-tal switches in the mechanisms underlying oscillations can occur(Dupont et al., 2006).
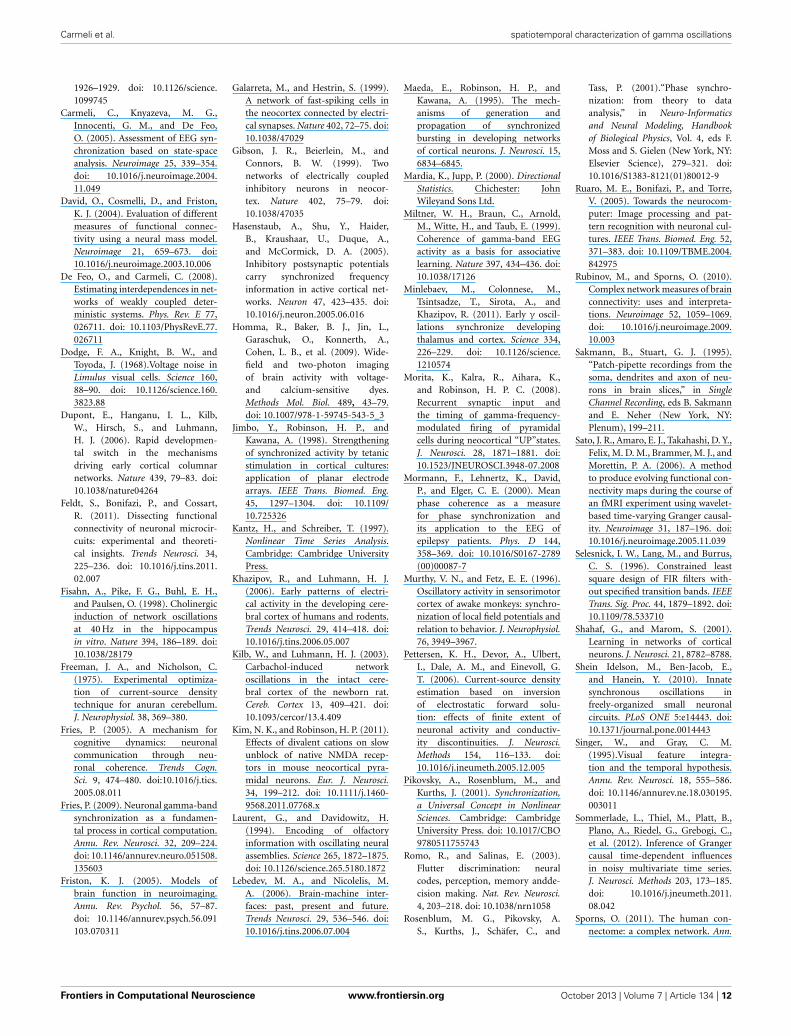
When glutamatergic excitation mediated by NMDA receptorswas blocked by bath application of APV (50 μM), gamma oscil-lations were completely blocked (n = 5 slice, Figure 14) and theycould be restored after the wash out of the drug.
Frontiers in Computational Neuroscience www.frontiersin.org October 2013 | Volume 7 | Article 134 | 9
Carmeli et al. spatiotemporal characterization of gamma oscillations
FIGURE 12 | (A) Time course of the phase difference (measured with theHilbert transform) for a given pair of electrodes. The phase difference isnormalized by 2π—vertical axes in these plots are multiple of 2π radians.The plateau appearing during the second stimulation (right panel) clearlyindicates the presence of synchronization. The value of the phasedifference at the plateau is about 2π. (B) Time course of the EOS value forthe phase differences plotted in (A). The red line represents the thresholdcomputed from the distribution of EOS values during the pre-stimulus time.During trial T1, EOS never goes above the threshold, while EOS is higherthan the threshold for several milliseconds during trial T2, demonstratingthe appearance of synchronization.
When excitatory pathways meditated by acetylcholine recep-tors were activated by bath application of carbachol (50 μM), in71% of the trials we observed oscillations with longer durationsinvading a larger portion of the circuitry (Figure 14). In contrastto hippocampal slices where bath application of carbachol inducespontaneous gamma oscillations over a very long time (in theorder of dozens of minutes, Fisahn et al., 1998), the effect of car-bachol vanished about 20–30 min after the beginning of the drugperfusion, probably due to the desensitization of acetylcholinereceptors, similarly to what has been previously reported (Kilband Luhmann, 2003).
Blockage of the GABAergic transmission mediated by GABA-Areceptors by application of Gabazine (10 μM) disrupted gamma
FIGURE 13 | Average number of maintained, generated and lost
connections in two consecutive trials for vertical (left) and horizontal
(right) connections. The percentage is obtained by normalizing to the sumof maintained, generated, and lost connections. We compared the threedistributions with a repeated measure Wilcoxon signed rank test (plannedcomparisons), corrected for multiple comparison (Bonferroni), and foundthe maintained vertical connections to be significantly (p < 0.05, reddiamonds) higher than the generated and the lost one.
FIGURE 14 | Electrical recordings of the gamma oscillation evoked in a
subsets of electrodes neighboring the location of the stimulation
(marked by a black point) in control conditions (left) and during drug
perfusion (right). Different synaptic pathways underlying the occurrenceand the dynamics of gamma oscillations were tested, respectively, APV(50 μM) was used to block glutamatergic excitation mediated by NMDAreceptors (Top), carbachol (50 μM) to activate excitatory pathwaysmeditated by acetylcholine receptors (Middle) and mefloquine (25 μM) toblock gap-junction transmission mediated by the connexins 36 and 50(Bottom). A time window of 600 ms is shown, the vertical axes arebetween −50 and 50 μV.
oscillations increasing the chance of spontanenous epileptic—likeevents (not shown).
Since several models hypothesize an important role for elec-trical synapses in the establishment of the network synchronyoccurring during gamma oscillations, we applied mefloquine(100 μM) to block gap-junctions mediated by the connexin36and 50. However, gamma oscillations were not blocked by meflo-quine (Figure 14) but we cannot exclude the possibility thatelectrical synapses mediated by other connexins or pannexinsmight not play an important role in establishing the networksynchrony underlying the oscillations.
Frontiers in Computational Neuroscience www.frontiersin.org October 2013 | Volume 7 | Article 134 | 10
Carmeli et al. spatiotemporal characterization of gamma oscillations
DISCUSSIONWe characterized electrically evoked gamma oscillations in thesomatosensory cortical area of juvenile mice (P8–12) in slices.Gamma oscillations occurred in bursts starting at high frequen-cies (∼80 Hz) and gradually moving toward lower frequencies(∼40 Hz) in few hundreds milliseconds. Similarly to what pre-viously reported in rodents at the end of the first postnatal week,gamma oscillations required GABAergic transmission mediatedby GABA-A receptors (Minlebaev et al., 2011) and glutamatergicexcitation mediated by NMDA receptors (Dupont et al., 2006).In addition, we observed that gamma oscillations power wasenhanced by the activation of excitatory pathways meditated byacetylcholine receptors, in agreement to what previously reported(Buhl et al., 1998; Dupont et al., 2006). In contrast to hippocam-pal circuits (Buhl et al., 2003), gamma oscillations were notabolished or reduced in power when gap-junction transmissionmediated by the connexin 36 and 50 was blocked.
In our study we observe that gamma oscillations can changeboth in terms of duration and total energy but maintain a con-stant global power. Shortening is unlikely to be due to long-termchanges in stimulus electrodes. This observation is repeatable,and happens well after the shocks.
In our study, instantaneous synchronization between differentregions reveals functional connections that vary within the sameoscillatory event and from one repetition to another. The spatialorganization of the functional connectivity reflects the columnarorganization of the cortex with more vertical connections thanhorizontal. About 50% of the vertical connections are kept fromtrial to trial while 25% are lost and generated with repetition ofthe same stimulus. About 30% of the horizontal are kept fromtrial to trial while 30% are lost and generated with repetition ofthe same stimulus. This result shows that part of the functionalconnectivity is reshaped from trial to trial in an itinerant fashionsupporting the idea that the variability of the neuronal responsesallows the network to explore different states. This might rep-resent a mechanism of learning and a similar phenomenon hasbeen described in dissociated cultures of cortical neurons (Shahafand Marom, 2001). Variability can be determined by sponta-neous fluctuations and can represent a mechanism of bindingdifferent region depending on the underlying network state thatcan be determined by other cortical region rather than spon-taneous activity in vivo physiological conditions (Fries, 2005,2009).
The electrically evoked gamma transients presented in thisstudy are very similar to what described by Minlebaev et al. (2011)in vivo in the neonatal rat cortex where the deflection of a whiskertriggered a gamma response of few hundreds milliseconds in thecorresponding barrel in the first postnatal week. In that study,
from the second postnatal week the maturation of inhibitionwithin the cortical circuit reduced the entraining influence of thethalamic input in shaping oscillatory events in favor of the localinhibitory circuits. We hypothesize that the synchronous excita-tion of the deeper layers of the cortical circuit induced by theelectrical stimulation can mimic the natural excitatory thalamicinput (which is similarly delivered to the deeper cortical layers).The rhythm of the gamma oscillation is locally imposed by theinhibitory circuit. In addition, the low electrical activity and thelack of oscillations in the upper cortical circuits which are theless developed at that stage of circuit maturation, result in a lesseffective horizontal communication and synchronization of thecortical circuits.
The distinction between vertical and horizontal functionalconnectivity (Figures 8–10) is consistent with anatomy and indi-cates that the main driving cause of the observed connectiv-ity is not bulk diffusion. This is additionally supported by thetrial-to-trial variability of functional connectivity (Figures 11,12) since functional connections can be present or absent in dif-ferent trials of the same stimulation. Nonetheless, we are cautiousabout interpreting the exact structures of functional connectiv-ity, which we observe. Although graph-theoretic metrics (such asmean shortest path-length) are expected to change with changesin synchrony (e.g., mean shortest path length decreasing as syn-chrony), it does not seem useful at this stage to interpret vari-ations amongst trials in terms of particular network structures(Bialonski et al., 2010), especially because of the variable numberof nodes in the networks (between 19 and 32) which might biasthat kind of metrics. The highly variable and apparently randomnature of fluctuations in multi-electrode evoked gamma oscil-lations is consistent with a very complex system. The challengefor the future will be to reconstruct such behavior in accuratebiophysically-based models and understand its implications forthe information processing capabilities of gamma oscillations inthe cortex (Woolrich and Stephan, 2013). A key methodologicaldevelopment will be approaches to determine in a reliable waythe number and location of the bioelectrical sources prior to theinference of the model parameters. We expect that one of thoseapproaches will be to derive robust priors for the parameters ofthe biophysical models from exploratory functional connectivityanalysis as the one described in this work.
ACKNOWLEDGEMENTSWe thank Nam-Kyung Kim for much helpful experimental adviceand assistance with slice preparation. Supported by an EC FP6research grant (#12788), and a Hong Kong UGC CERG grant(PolyU 5262/11E). Michael Small is supported by an AustralianResearch Council Future Fellowship (FT110100896).
REFERENCESBastos, A. M., Usrey, W. M., Adams,
R. A., Mangun, G. R., Fries,P., and Friston, K. J. (2012).Canonical microcircuits forpredictive coding. Neuron 76,695–711. doi: 10.1016/j.neuron.2012.10.038
Bialonski, S., Horstmann, M. T., andLehnertz, K. (2010). From brain
to earth and climate systems:small-world interaction networksor not? Chaos 20, 013134. doi:10.1063/1.3360561
Böhm, H., and von Sachs, R. (2009).Shrinkage estimation in the fre-quency domain of multivariate timeseries. J. Multivariate Anal. 100,913–935. doi: 10.1016/j.jmva.2008.09.009
Buhl, D. L., Harris, K. D., Hormuzdi,S. G., Monyer, H., and Buzsáki,G. (2003). Selective impairmentof hippocampal gamma oscillationsin connexin-36 knock-out mousein vivo. J. Neurosci. 23, 1013–1018.
Buhl, E. H., Tamás, G., and Fisahn,A. (1998). Cholinergic activationand tonic excitation induce persis-tent gamma oscillations in mouse
somatosensory cortex in vitro.J. Physiol. 513, 117–126. doi:10.1111/j.1469-7793.1998.117by.x
Buzsáki, G. (2006). Rhythms of theBrain. New York, NY: OxfordUniversity Press. doi: 10.1093/acprof:oso/9780195301069.001.0001
Buzsáki, G., and Draguhn, A. (2004).Neuronal oscillations in cor-tical networks. Science 304,
Frontiers in Computational Neuroscience www.frontiersin.org October 2013 | Volume 7 | Article 134 | 11
Carmeli et al. spatiotemporal characterization of gamma oscillations
1926–1929. doi: 10.1126/science.1099745
Carmeli, C., Knyazeva, M. G.,Innocenti, G. M., and De Feo,O. (2005). Assessment of EEG syn-chronization based on state-spaceanalysis. Neuroimage 25, 339–354.doi: 10.1016/j.neuroimage.2004.11.049
David, O., Cosmelli, D., and Friston,K. J. (2004). Evaluation of differentmeasures of functional connec-tivity using a neural mass model.Neuroimage 21, 659–673. doi:10.1016/j.neuroimage.2003.10.006
De Feo, O., and Carmeli, C. (2008).Estimating interdependences in net-works of weakly coupled deter-ministic systems. Phys. Rev. E 77,026711. doi: 10.1103/PhysRevE.77.026711
Dodge, F. A., Knight, B. W., andToyoda, J. (1968).Voltage noise inLimulus visual cells. Science 160,88–90. doi: 10.1126/science.160.3823.88
Dupont, E., Hanganu, I. L., Kilb,W., Hirsch, S., and Luhmann,H. J. (2006). Rapid developmen-tal switch in the mechanismsdriving early cortical columnarnetworks. Nature 439, 79–83. doi:10.1038/nature04264
Feldt, S., Bonifazi, P., and Cossart,R. (2011). Dissecting functionalconnectivity of neuronal microcir-cuits: experimental and theoreti-cal insights. Trends Neurosci. 34,225–236. doi: 10.1016/j.tins.2011.02.007
Fisahn, A., Pike, F. G., Buhl, E. H.,and Paulsen, O. (1998). Cholinergicinduction of network oscillationsat 40 Hz in the hippocampusin vitro. Nature 394, 186–189. doi:10.1038/28179
Freeman, J. A., and Nicholson, C.(1975). Experimental optimiza-tion of current-source densitytechnique for anuran cerebellum.J. Neurophysiol. 38, 369–380.
Fries, P. (2005). A mechanism forcognitive dynamics: neuronalcommunication through neu-ronal coherence. Trends Cogn.Sci. 9, 474–480. doi:10.1016/j.tics.2005.08.011
Fries, P. (2009). Neuronal gamma-bandsynchronization as a fundamen-tal process in cortical computation.Annu. Rev. Neurosci. 32, 209–224.doi: 10.1146/annurev.neuro.051508.135603
Friston, K. J. (2005). Models ofbrain function in neuroimaging.Annu. Rev. Psychol. 56, 57–87.doi: 10.1146/annurev.psych.56.091103.070311
Galarreta, M., and Hestrin, S. (1999).A network of fast-spiking cells inthe neocortex connected by electri-cal synapses. Nature 402, 72–75. doi:10.1038/47029
Gibson, J. R., Beierlein, M., andConnors, B. W. (1999). Twonetworks of electrically coupledinhibitory neurons in neocor-tex. Nature 402, 75–79. doi:10.1038/47035
Hasenstaub, A., Shu, Y., Haider,B., Kraushaar, U., Duque, A.,and McCormick, D. A. (2005).Inhibitory postsynaptic potentialscarry synchronized frequencyinformation in active cortical net-works. Neuron 47, 423–435. doi:10.1016/j.neuron.2005.06.016
Homma, R., Baker, B. J., Jin, L.,Garaschuk, O., Konnerth, A.,Cohen, L. B., et al. (2009). Wide-field and two-photon imagingof brain activity with voltage-and calcium-sensitive dyes.Methods Mol. Biol. 489, 43–79.doi: 10.1007/978-1-59745-543-5_3
Jimbo, Y., Robinson, H. P., andKawana, A. (1998). Strengtheningof synchronized activity by tetanicstimulation in cortical cultures:application of planar electrodearrays. IEEE Trans. Biomed. Eng.45, 1297–1304. doi: 10.1109/10.725326
Kantz, H., and Schreiber, T. (1997).Nonlinear Time Series Analysis.Cambridge: Cambridge UniversityPress.
Khazipov, R., and Luhmann, H. J.(2006). Early patterns of electri-cal activity in the developing cere-bral cortex of humans and rodents.Trends Neurosci. 29, 414–418. doi:10.1016/j.tins.2006.05.007
Kilb, W., and Luhmann, H. J. (2003).Carbachol-induced networkoscillations in the intact cere-bral cortex of the newborn rat.Cereb. Cortex 13, 409–421. doi:10.1093/cercor/13.4.409
Kim, N. K., and Robinson, H. P. (2011).Effects of divalent cations on slowunblock of native NMDA recep-tors in mouse neocortical pyra-midal neurons. Eur. J. Neurosci.34, 199–212. doi: 10.1111/j.1460-9568.2011.07768.x
Laurent, G., and Davidowitz, H.(1994). Encoding of olfactoryinformation with oscillating neuralassemblies. Science 265, 1872–1875.doi: 10.1126/science.265.5180.1872
Lebedev, M. A., and Nicolelis, M.A. (2006). Brain-machine inter-faces: past, present and future.Trends Neurosci. 29, 536–546. doi:10.1016/j.tins.2006.07.004
Maeda, E., Robinson, H. P., andKawana, A. (1995). The mech-anisms of generation andpropagation of synchronizedbursting in developing networksof cortical neurons. J. Neurosci. 15,6834–6845.
Mardia, K., Jupp, P. (2000). DirectionalStatistics. Chichester: JohnWileyand Sons Ltd.
Miltner, W. H., Braun, C., Arnold,M., Witte, H., and Taub, E. (1999).Coherence of gamma-band EEGactivity as a basis for associativelearning. Nature 397, 434–436. doi:10.1038/17126
Minlebaev, M., Colonnese, M.,Tsintsadze, T., Sirota, A., andKhazipov, R. (2011). Early γ oscil-lations synchronize developingthalamus and cortex. Science 334,226–229. doi: 10.1126/science.1210574
Morita, K., Kalra, R., Aihara, K.,and Robinson, H. P. C. (2008).Recurrent synaptic input andthe timing of gamma-frequency-modulated firing of pyramidalcells during neocortical “UP”states.J. Neurosci. 28, 1871–1881. doi:10.1523/JNEUROSCI.3948-07.2008
Mormann, F., Lehnertz, K., David,P., and Elger, C. E. (2000). Meanphase coherence as a measurefor phase synchronization andits application to the EEG ofepilepsy patients. Phys. D 144,358–369. doi: 10.1016/S0167-2789(00)00087-7
Murthy, V. N., and Fetz, E. E. (1996).Oscillatory activity in sensorimotorcortex of awake monkeys: synchro-nization of local field potentials andrelation to behavior. J. Neurophysiol.76, 3949–3967.
Pettersen, K. H., Devor, A., Ulbert,I., Dale, A. M., and Einevoll, G.T. (2006). Current-source densityestimation based on inversionof electrostatic forward solu-tion: effects of finite extent ofneuronal activity and conductiv-ity discontinuities. J. Neurosci.Methods 154, 116–133. doi:10.1016/j.jneumeth.2005.12.005
Pikovsky, A., Rosenblum, M., andKurths, J. (2001). Synchronization,a Universal Concept in NonlinearSciences. Cambridge: CambridgeUniversity Press. doi: 10.1017/CBO9780511755743
Romo, R., and Salinas, E. (2003).Flutter discrimination: neuralcodes, perception, memory andde-cision making. Nat. Rev. Neurosci.4, 203–218. doi: 10.1038/nrn1058
Rosenblum, M. G., Pikovsky, A.S., Kurths, J., Schäfer, C., and
Tass, P. (2001).“Phase synchro-nization: from theory to dataanalysis,” in Neuro-Informaticsand Neural Modeling, Handbookof Biological Physics, Vol. 4, eds F.Moss and S. Gielen (New York, NY:Elsevier Science), 279–321. doi:10.1016/S1383-8121(01)80012-9
Ruaro, M. E., Bonifazi, P., and Torre,V. (2005). Towards the neurocom-puter: Image processing and pat-tern recognition with neuronal cul-tures. IEEE Trans. Biomed. Eng. 52,371–383. doi: 10.1109/TBME.2004.842975
Rubinov, M., and Sporns, O. (2010).Complex network measures of brainconnectivity: uses and interpreta-tions. Neuroimage 52, 1059–1069.doi: 10.1016/j.neuroimage.2009.10.003
Sakmann, B., Stuart, G. J. (1995).“Patch-pipette recordings from thesoma, dendrites and axon of neu-rons in brain slices,” in SingleChannel Recording, eds B. Sakmannand E. Neher (New York, NY:Plenum), 199–211.
Sato, J. R., Amaro, E. J., Takahashi, D. Y.,Felix, M. D. M., Brammer, M. J., andMorettin, P. A. (2006). A methodto produce evolving functional con-nectivity maps during the course ofan fMRI experiment using wavelet-based time-varying Granger causal-ity. Neuroimage 31, 187–196. doi:10.1016/j.neuroimage.2005.11.039
Selesnick, I. W., Lang, M., and Burrus,C. S. (1996). Constrained leastsquare design of FIR filters with-out specified transition bands. IEEETrans. Sig. Proc. 44, 1879–1892. doi:10.1109/78.533710
Shahaf, G., and Marom, S. (2001).Learning in networks of corticalneurons. J. Neurosci. 21, 8782–8788.
Shein Idelson, M., Ben-Jacob, E.,and Hanein, Y. (2010). Innatesynchronous oscillations infreely-organized small neuronalcircuits. PLoS ONE 5:e14443. doi:10.1371/journal.pone.0014443
Singer, W., and Gray, C. M.(1995).Visual feature integra-tion and the temporal hypothesis.Annu. Rev. Neurosci. 18, 555–586.doi: 10.1146/annurev.ne.18.030195.003011
Sommerlade, L., Thiel, M., Platt, B.,Plano, A., Riedel, G., Grebogi, C.,et al. (2012). Inference of Grangercausal time-dependent influencesin noisy multivariate time series.J. Neurosci. Methods 203, 173–185.doi: 10.1016/j.jneumeth.2011.08.042
Sporns, O. (2011). The human con-nectome: a complex network. Ann.
Frontiers in Computational Neuroscience www.frontiersin.org October 2013 | Volume 7 | Article 134 | 12
Carmeli et al. spatiotemporal characterization of gamma oscillations
N.Y. Acad. Sci. 1224, 109–125. doi:10.1111/j.1749-6632.2010.05888.x
Stam, C. J., Nolte, G., and Daffertshofer,A. (2007). Phase lag index: assess-ment of functional connectivityfrom multi channel EEG andMEG with diminished biasfrom common sources. Hum.Brain Mapp. 28, 1178–1193. doi:10.1002/hbm.20346
Stevenson, I. H., Rebesco, J. M.,Miller, L. E., and Körding, K. P.(2008). Inferring functional con-nections between neurons. Curr.Opin. Neurobiol. 18, 582–588. doi:10.1016/j.conb.2008.11.005
Tass, P. A., Rosenblum, M., Weule,J., Kurths, J., Pikovsky, A.,Volkmann, J., et al. (1998).Detection of n:m phase lockingfrom noisy data: application tomagnetoencephalography. Phys.Rev. Lett. 81, 3291–3294. doi:10.1103/PhysRevLett.81.3291
Traub, R. D., Bibbig, A., LeBeau, F.E., Buhl, E. H., and Whittington,M. A. (2004).Cellular mechanismsof neuronal population oscilla-tions in the hippocampus in vitro.Annu. Rev. Neurosci. 27, 247–278.doi: 10.1146/annurev.neuro.27.070203.144303
Uhlhaas, P. J., Roux, F., Rodriguez, E.,Rotarska-Jagiela, A., and Singer, W.(2010). Neural synchrony and thedevelopment of cortical networks.Trends Cogn. Sci. 14, 72–80. doi:10.1016/j.tics.2009.12.002
Vinck, M., Oostenveld, R., vanWingerden, M., Battaglia,F., and Pennartz, C. M.(2011). An improved index ofphase-synchronization for electro-physiological data in the presenceof volume-conduction, noise andsample-size bias. Neuroimage55, 1548–1565. doi: 10.1016/j.neuroimage.2011.01.055
Wong, F., and Knight, B. W. (1980).Adapting-bump model for eccen-tric cells of Limulus. J. Gen. Physiol.76, 539–557. doi: 10.1085/jgp.76.5.539
Woolrich, M. W., and Stephan, K.E. (2013). Biophysical networkmodels and the human connec-tome. Neuroimage 80, 330–338. doi:10.1016/j.neuroimage.2013.03.059
Conflict of Interest Statement: Theauthors declare that the researchwas conducted in the absence of anycommercial or financial relationshipsthat could be construed as a potentialconflict of interest.
Received: 20 June 2013; accepted: 18September 2013; published online:October 2013.Citation: Carmeli C, Bonifazi P,Robinson HPC and Small M (2013)Quantifying network properties
in multi-electrode recordings: spa-tiotemporal characterization andinter-trial variation of evokedgamma oscillations in mouse somatosen-sory cortex in vitro. Front. Comput.Neurosci. 7:134. doi: 10.3389/fncom.2013.00134This article was submitted to thejournal Frontiers in ComputationalNeuroscience.Copyright © 2013 Carmeli, Bonifazi,Robinson and Small. This is an open-access article distributed under the termsof the Creative Commons AttributionLicense (CC BY). The use, distribu-tion or reproduction in other forumsis permitted, provided the originalauthor(s) or licensor are credited andthat the original publication in thisjournal is cited, in accordance withaccepted academic practice. No use,distribution or reproduction is permit-ted which does not comply with theseterms.
Frontiers in Computational Neuroscience www.frontiersin.org October 2013 | Volume 7 | Article 134 | 13
16
Related Documents