Remote Sens. 2014, 6, 10716-10732; doi:10.3390/rs61110716 remote sensing ISSN 2072-4292 www.mdpi.com/journal/remotesensing Article Quantifying Ancient Maya Land Use Legacy Effects on Contemporary Rainforest Canopy Structure Jessica N. Hightower 1,2 , A. Christine Butterfield 1 and John F. Weishampel 1, * 1 Department of Biology, University of Central Florida, 4110 Libra Drive, Orlando, FL 32816, USA; E-Mails: [email protected] (J.N.H.); [email protected] (A.C.B.) 2 Round River Conservation Studies, 284 West 400 North #105, Salt Lake City, UT 84103, USA * Author to whom correspondence should be addressed; E-Mail: [email protected]; Tel.: +1-407-823-6634; Fax: +1-407-823-5769. External Editors: Rosa Lasaponara and Prasad S. Thenkabail Received: 1 July 2014; in revised form: 27 October 2014 / Accepted: 27 October 2014 / Published: 6 November 2014 Abstract: Human land use legacies have significant and long-lasting ecological impacts across landscapes. Investigating ancient (>400 years) legacy effects can be problematic due to the difficulty in detecting specific, historic land uses, especially those hidden beneath dense canopies. Caracol, the largest (~200 km 2 ) Maya archaeological site in Belize, was abandoned ca. A.D. 900, leaving behind myriad structures, causeways, and an extensive network of agricultural terraces that persist beneath the architecturally complex tropical forest canopy. Airborne LiDAR enables the detection of these below-canopy archaeological features while simultaneously providing a detailed record of the aboveground 3-dimensional canopy organization, which is indicative of a forest’s ecological function. Here, this remote sensing technology is used to determine the effects of ancient land use legacies on contemporary forest structure. Canopy morphology was assessed by extracting LiDAR point clouds (0.25 ha plots) from LiDAR-identified terraced (n = 150) and non-terraced (n = 150) areas on low (0°–10°), medium (10°–20°), and high (>20°) slopes. We calculated the average canopy height, canopy openness, and vertical diversity from the LiDAR returns, with topographic features (i.e., slope, elevation, and aspect) as covariates. Using a PerMANOVA procedure, we determined that forests growing on agricultural terraces exhibited significantly different canopy structure from those growing on non-terraced land. Terraces appear to mediate the effect of slope, resulting in less structural variation between slope and non-sloped land and yielding taller, OPEN ACCESS

Welcome message from author
This document is posted to help you gain knowledge. Please leave a comment to let me know what you think about it! Share it to your friends and learn new things together.
Transcript

Remote Sens. 2014, 6, 10716-10732; doi:10.3390/rs61110716
remote sensing ISSN 2072-4292
www.mdpi.com/journal/remotesensing
Article
Quantifying Ancient Maya Land Use Legacy Effects on Contemporary Rainforest Canopy Structure
Jessica N. Hightower 1,2, A. Christine Butterfield 1 and John F. Weishampel 1,*
1 Department of Biology, University of Central Florida, 4110 Libra Drive, Orlando, FL 32816, USA;
E-Mails: [email protected] (J.N.H.); [email protected] (A.C.B.) 2 Round River Conservation Studies, 284 West 400 North #105, Salt Lake City, UT 84103, USA
* Author to whom correspondence should be addressed; E-Mail: [email protected];
Tel.: +1-407-823-6634; Fax: +1-407-823-5769.
External Editors: Rosa Lasaponara and Prasad S. Thenkabail
Received: 1 July 2014; in revised form: 27 October 2014 / Accepted: 27 October 2014 /
Published: 6 November 2014
Abstract: Human land use legacies have significant and long-lasting ecological impacts
across landscapes. Investigating ancient (>400 years) legacy effects can be problematic due
to the difficulty in detecting specific, historic land uses, especially those hidden beneath
dense canopies. Caracol, the largest (~200 km2) Maya archaeological site in Belize, was
abandoned ca. A.D. 900, leaving behind myriad structures, causeways, and an extensive
network of agricultural terraces that persist beneath the architecturally complex tropical
forest canopy. Airborne LiDAR enables the detection of these below-canopy
archaeological features while simultaneously providing a detailed record of the
aboveground 3-dimensional canopy organization, which is indicative of a forest’s
ecological function. Here, this remote sensing technology is used to determine the effects
of ancient land use legacies on contemporary forest structure. Canopy morphology was
assessed by extracting LiDAR point clouds (0.25 ha plots) from LiDAR-identified terraced
(n = 150) and non-terraced (n = 150) areas on low (0°–10°), medium (10°–20°), and high
(>20°) slopes. We calculated the average canopy height, canopy openness, and vertical
diversity from the LiDAR returns, with topographic features (i.e., slope, elevation, and
aspect) as covariates. Using a PerMANOVA procedure, we determined that forests
growing on agricultural terraces exhibited significantly different canopy structure from
those growing on non-terraced land. Terraces appear to mediate the effect of slope,
resulting in less structural variation between slope and non-sloped land and yielding taller,
OPEN ACCESS

Remote Sens. 2014, 6 10717
more closed, more vertically diverse forests. These human land uses abandoned >1000
years ago continue to impact contemporary tropical rainforests having implications related
to arboreal habitat and carbon storage.
Keywords: agricultural terracing; forest canopy structure; land use legacy; LiDAR; Maya
1. Background and Rationale
1.1. Human Land Use Legacies
One interface between the disciplines of landscape archaeology and landscape ecology is the study
of land use legacies. Understanding the consequences of human alteration of landscapes has become
increasingly important as human populations continue to expand and natural landscapes are
continually transformed [1,2]. Just as modern human societies alter landscapes, so did prior ones [3].
Land use history (e.g., forest clearing, agricultural regime, abandonment) directly influences both the
biotic (e.g., presence of novel species assemblages) and abiotic (e.g., changes in soil nutrients,
hydrology, topography) environments [4]. These changes may lead to long-term effects on
contemporary measures of biodiversity (i.e., composition, structure, and function) that may impact
current services (e.g., habitat, carbon sequestration) provided by the ecosystem (Figure 1).
Figure 1. The interacting and cascading effects of land use legacies on modern
forested systems adapted from [4]. Regions enclosed by dashed outlines include some
parameters that can be measured with airborne LiDAR. Blue and red outlines represent
historic-archaeological (past) influences and contemporary (present) factors, respectively.

Remote Sens. 2014, 6 10718
While deforestation is still occurring at an alarming rate throughout many parts of the world,
afforestation is occurring in other regions as former agricultural fields are abandoned [5–7]. By one
estimate 50%–80% of the forests in New England are on former agricultural fields [8]. Locations that
have traditionally been thought of as sparsely populated and fairly pristine prior to European
colonization, such as the Americas, are now known to have been significantly altered by ancient
humans [9,10]; hence, the concept of “virgin” forests is now relatively obsolete [11,12]. Evidence
suggests that vast tracks of forest had been cleared for agriculture or burned by indigenous humans
prior to western arrival in the New World [13–15]. Given the current rate of land alteration and the
extensiveness of past alteration by ancient people, the persistence and implications of these land use
legacies have become important questions in ecology [16–18].
The time since a land use has been abandoned and allowed to revert back to a natural state is a
determinant of the type and extent of the legacy present [1,2,10]. In European forests, agricultural
legacies have been shown to endure over a millennium after abandonment, with species composition in
secondary forests that regenerated over former agricultural fields lacking native species found in
ancient forests [13,19]. Another example of ancient land use legacies continuing today is found in
Central America with the Maya civilization. A large percentage of forests in Central America are
secondary forests that have regenerated after the collapse of the Maya civilization [10,20]. Studies
have suggested these forests contain trees species that were of economic importance to the ancient
Maya, which may persist as remnants of the Maya orchard-gardens [21]. In addition to species
introduction by the Maya, disturbance from agriculture and settlement constructions may have altered
the landscape in ways that provided optimal habitat for specific, limestone loving species, such as the
Ramon tree (Brosimum alicastrum) [22,23]. Fingerprints of ancient land use may also be found in
forest structure (basal area, biomass, canopy height canopy closure, etc.) independent of species
composition [24,25]. Forests may take between 60–200 years to regenerate to their previous canopy
height [26,27]. However, structure has been shown to be influenced by topography [28] and soil
nutrients [29], which may have been irrevocably altered by past land use, making it impossible for
forests to regenerate to pre-land alteration conditions [2,17].
1.2. Forest Canopy Structure
The structure of a forest offers key insights into ecosystem function and biodiversity. It has been
directly correlated to a number of important ecological measures, such as biodiversity and carbon
stocks, i.e., aboveground biomass (AGB) [30,31]. By describing spatial patterns we can determine
processes at work in a landscape [32]. Forest structure can be directly tied to species diversity, with a
more heterogeneous structure often indicative of not only higher floral diversity, but also high faunal
diversity as well [33–35]. The structure of forests is often used as a proxy for determining live AGB,
an important factor in identifying sources of carbon sequestration [28,36]. Forest structure relates to
the health of an ecosystem, where a higher degree of heterogeneity is suggestive of a more dynamic
forest (i.e., disturbance, gaps, recruitment) [37,38]. Understanding the factors that drive forest structure
can enable a better understanding of general ecosystem function [39–41].
A number of factors are known to affect forest structure, among them natural and human
disturbance [42], climate, soil type and nutrients, and topographic position [29,43]. Topographic

Remote Sens. 2014, 6 10719
position, which include measures of relief (or slope) and elevation, have been shown to have a strong
effect on forest structure. Forest canopy height and AGB have been directly correlated to topographic
relief, with high AGB and greater canopy heights in lower slopes and valleys compared to steeper
slopes which are typically associated with lower AGB and lower canopy heights [28,44]. Canopy
openness has also been shown to increase on steeper slopes compared to low slopes and valleys [45].
While topographic position appears to be a strong factor in influencing forest structure, another
important, if indirect, factor to consider is disturbance.
While natural disturbances such as floods, fire, and wind damage can drastically alter the structure
of a forest [30,46], human disturbances can also have a significant impact [24,25,47]. However, for
many human land uses, regenerating forests attain levels of vertical structure very close to original
levels within 50 to 200 years [25,27]. Other forms of human land use may have longer lasting impacts,
depending on the intensity of former land use [2]. Land use that alters the topography of the landscape
has the potential to permanently alter the structure of the forest that regenerates, so long as the change
in topography remains. One such land use can be found at Caracol, Belize, where the Maya extensively
terraced across the hilly landscape. The terraces were constructed between A.D. 650–900 and are still
in place today [48,49]. The terracing has essentially created fine-scale, level areas along hill slopes,
effectively transforming the micro-topography of the region. Thus, Caracol provides the opportunity to
investigate the extent to which human-altered topography continues to impact the ecosystem 1000
years after forest reestablishment.
2. Objectives
Though archaeologists typically wish to ignore or remove the vegetation that obscures the view
of their ancient landscapes [50] and ecologists often wish to discount the influence of historic events
on ecosystem composition, structure, and function [2], this study exploits the ability of LiDAR to
simultaneously map forest canopy and below-canopy archaeological surfaces. Specifically, the goals
of this research are to use LiDAR to (1) delineate the location of Maya agricultural terracing and areas
where there are no detectable terraces and (2) quantify structural attributes of the forest canopy
(i.e., height, openness, and vertical diversity) at Caracol. Furnished with this information, we can
(3) assess the extent to which the ancient Maya agriculturally engineered (i.e., terraced) landscape
impacts the LiDAR-derived forest structure of today.
3. Study Area
The Caracol Archaeological Reserve is located in west-central Belize along the Guatemalan border.
The reserve resides across a karst landscape consisting of alternating hills and valleys, with elevations
ranging between ~310 to 720 m asl. The Caracol study site encompasses an area of ~200 km2 (Figure 2)
and is surrounded by the Chiquibil National Park. It represents a massive Maya city with extensive
monumental architecture whose extent has been documented through LiDAR [51,52]. The dense
subtropical moist forest of Caracol reaches average heights of 22 m and leaf off never exceeds 20%, with
lowest leaf area index occurring during the end of the dry season (end of March, beginning of April) [42].
Recent human and natural disturbance of the forest has included hurricanes in 1968 and 1973 [53] and
encroachment from Guatemala. These incursions entail the clearing of large swaths of forest along the
Remote Sens. 2014, 6 10720
border and targeted removal of desirable tree species throughout the reserve, primarily Swietenia
macrophylla (Mahogany) and Cedrela odorata (Cedar) [54].
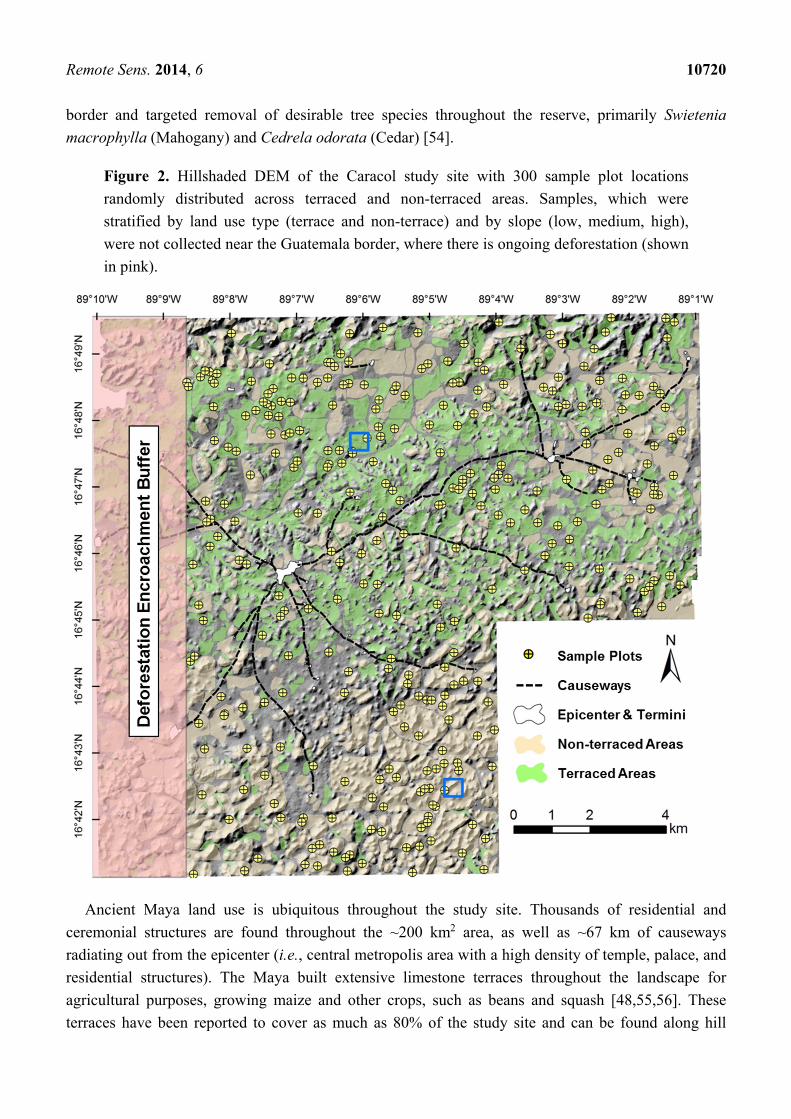
Figure 2. Hillshaded DEM of the Caracol study site with 300 sample plot locations
randomly distributed across terraced and non-terraced areas. Samples, which were
stratified by land use type (terrace and non-terrace) and by slope (low, medium, high),
were not collected near the Guatemala border, where there is ongoing deforestation (shown
in pink).
Ancient Maya land use is ubiquitous throughout the study site. Thousands of residential and
ceremonial structures are found throughout the ~200 km2 area, as well as ~67 km of causeways
radiating out from the epicenter (i.e., central metropolis area with a high density of temple, palace, and
residential structures). The Maya built extensive limestone terraces throughout the landscape for
agricultural purposes, growing maize and other crops, such as beans and squash [48,55,56]. These
terraces have been reported to cover as much as 80% of the study site and can be found along hill

Remote Sens. 2014, 6 10721
slopes and in valleys. The ability of airborne LiDAR to geolocate accurately ground surveyed terraces
hidden below the forest canopy at Caracol has been previously documented [52,57,58]. From our
visual analysis and digitization of the hillshaded digital elevation model (DEM), conspicuously
terraced areas represented 28.7% of the landscape while conspicuously non-terraced areas represented
35.7%. Terraces at Caracol have been shown to increase soil depth along hill slope by up to 0.6 m [48].
Studies of other Maya terraces have shown that terraces effectively prevent soil erosion along slopes,
increase soil depth, and increase moisture retention [59,60].
4. Methods
4.1. LiDAR Data Collection, Extraction, and Sampling
In April 2009, LiDAR was flown over the Caracol study site [61]. The LiDAR survey used an
Optech GEMINI Airborne Laser Terrain Mapper (ALTM) mounted on a twin-engine Cessna
Skymaster. During the 9.5 h of laser-on flight time, a total of 122 flight lines were flown ~800 m above
the ground surface, 66 in a North-South direction and 60 in an East-West direction, allowing optimal
penetration through the dense canopy. The swath width was 520 m and flight lines were placed 260 m
apart, insuring a 200% overlap. The survey yielded ~20 points per m2, for a total of 4.28 billion
measurements, of which 295 million were classified as ground returns (1.35 ground return points per m2
on average). The data were processed by NCALM (National Center for Airborne Laser Mapping); the
final product included LiDAR point cloud files and a bare earth DEM with a 1 m horizontal resolution
(see [62] for details explaining the DEM creation).
Three hundred non-overlapping 0.25 ha circular plots were randomly placed across the entire
Caracol DEM using Hawth’s tools [63] to the east of a ~2.5 km-wide area near the Guatemala border
which has been subjected to illegal clearing and selective logging [54]. Sample plots were stratified
using terraced (n = 150) and non-terraced (n = 150) land use layers in ArcGIS that had been carefully
digitized off the DEM (Figure 3). Other than terraces, these areas excluded areas with other Maya
structures (e.g., causeways, residences, monuments). Samples were further stratified by low (0°–10°;
n = 50), medium (10°–20°; n = 50), and high (20°–40°; n = 50) slopes to insure an even representation
of slopes. Using FUSION LiDAR analysis software [64], LiDAR point returns were extracted for all
elevation layers for the Caracol DEM and slope, aspect, and elevation values were obtained for each of
the slope classes in the sample. ArcGIS 9.3 Spatial Analyst was used to generate slope, aspect, and
plots. The Density Metrics function in FUSION permitted us to sample the 0.25 ha LiDAR point
clouds by extracting slices associates with height ranges. Returns were sampled in 3 m height slices
and sorted into bins from the forest floor to the canopy top (Figure 4) [65]. The final FUSION product
yielded a data set of vertically binned height returns for each plot. All plots were sampled using a fixed
grid with 10 × 10 m cells and all cells were summed for each height class. The proportion of total
points was calculated for all height bins within each plot for the final height bin data set.

Remote Sens. 2014, 6 10722
Figure 3. Renditions of 500 × 500 m (a) non-terraced and (b) terraced areas from Caracol.
Locations of these example areas are shown in Figure 2.
Figure 4. Example of a (a) 0.25 ha point cloud of rainforest canopy and (b) associated
histogram of proportions of returns binned into 3 m height intervals.
4.2. Statistical Analysis
The following forest structural characteristics were calculated using the LiDAR point height bins
for each sample plot: average canopy height, canopy openness, and a vertical diversity index. Average
canopy height was calculated by taking the average of the maximum heights for each 10 × 10 m
window in the 0.25 ha plot. The measure for canopy openness was calculated by taking the ratio of
ground returns divided by the sum of all other returns (ground returns/all non-ground returns) [66].
Jost diversity index was calculated for the proportion of returns that had been binned into 3-m height
classes for each plot and used as an approximation of vertical diversity [67].
a) b)
r = 28.25 m

Remote Sens. 2014, 6 10723
Permutational multivariate analysis of variance (PerMANOVA) was used to test for significant
differences in forest structure between non-terraced and terraced areas. PerMANOVA allows for a
non-parametric analysis of variance, which is ideal for non-normal data sets. PerMANOVA first
calculates a distance matrix using a user selected distance measure. The test statistic (F-ratio) is
calculated directly from the distance matrix. Permutations are then used to generate p-values to
determine significance [68]. The Adonis function in the vegan package in R was used to perform the
PerMANOVA analyses in our study [69].
For the first analysis, land use (terraced vs. non-terraced) was used as our factor, while slope,
aspect, and elevation were held as covariates. A distance matrix (response variable) was calculated
from the measured forest structural characteristics (i.e., average canopy height, canopy openness, and
vertical diversity index) using the vegdist routine in the vegan package [69] for the R statistical
software program. Vegdist uses the Bray-Curtis (Sorenson) distance measure, which is appropriate for
community ecology datasets [70]. In a second PerMANOVA, we used a distance matrix calculated
directly from the point return height bin data set for each plot. For the second analysis, land use was
retained as our factor, while slope, aspect, and elevation were held as covariates. A total of 9999
permutations were used for each analysis.
5. Results and Discussion
PerMANOVA results from the LiDAR derived forest measurements indicated significant
differences between terraced and non-terraced land uses (p = 0.016). Slope was also highly significant
in explaining the variation between samples (p = 0.001), as was elevation (p = 0.001). The interaction
of slope and aspect (p = 0.026), as well as the interaction of slope and elevation (p = 0.001), were also
considered significant in explaining the variation seen between samples (Table 1).
Table 1. Results from the PerMANOVA of the distance matrix constucted from
LiDAR-derived forest measurements.
Sources of Variation df Mean Square F r2 p Land Use Type * 1 0.024 5.04 0.013 0.016
Slope 1 0.134 50.82 0.134 0.001 Elevation 1 0.028 10.74 0.028 0.001
Slope: Aspect 1 0.022 4.54 0.012 0.026 Slope: Elevation 1 0.042 15.78 0.041 0.001
Residuals 284 0.005 0.748
* Factor, all other sources of variation calculated as covariates.
Using the LiDAR height bin distance matrix, PerMANOVA revealed a significant proportion
(p = 0.005) of the variation was explained by land use categories, i.e., terraced vs. not-terraced. Slope
was again found to be significant in explaining the variation in the proportion of points found in
each height bin (p = 0.001). In this analysis, aspect did not contribute significantly to the explanation
of variation. In addition, elevation did not explain a significant proportion of the variation, but the
interaction effects of slope: elevation and land use: slope were significant in explaining the variation of
height bin distributions (Table 2).

Remote Sens. 2014, 6 10724
Table 2. Results from the PerMANOVA of the distance matrix constructed from the height
bin LiDAR data.
Sources of Variation df Mean Square F r2 p Land Use Type * 1 0.227 5.02 0.015 0.005
Slope 1 1.048 23.21 0.068 0.001 Land Use Type: Slope 1 0.170 3.76 0.011 0.018
Slope: Elevation 1 0.482 10.68 0.031 0.001 Residuals 284 0.045 0.083
* Factor, all other sources of variation calculated as covariates.
When analyzed together as a distance matrix, the forest structure variables (canopy height, canopy
openness, and vertical diversity index) were significantly impacted by the presence of terraces. When
the individual trend lines of our three forest structural variables are graphed (Figure 5), a few patterns
emerged. On non-terraced plots there is a trend of vertical diversity decreasing as the slope increases;
however, this decrease occurs at a slower rate for terraced land use. A similar pattern exists with
average canopy height, with canopy height decreasing as slope increases, but this decrease occurs at a
slower rate on terraced land. Canopy openness increases as slope increase, with canopy openness on
terraces increasing at a slower rate compared to non-terraced land. At high slope conditions average
canopy height and vertical canopy diversity are the most pronounced.
Histograms generated from the LiDAR height bin data showed a similar trend, that is, non-terraced
bins showed a distinct gradient among low, medium, and high slopes, with medium slope point values
falling between the low and high slope. However, on terraced land there is a trend of reduced variation
among slope categories. Within a height bin, different slope categories do not show as steep “stair
step” pattern in terms of LiDAR point returns (Figure 6). This difference was most pronounced in the
0–3 m, 21–24 m, 24–27 m, and 27–30 m height bins. Another effect of terraces that can be deduced
from this figure is an upward shift in the height of median energy (i.e., HOME) [66] from non-terraced
to terraced plots which is indicative of higher AGB.
The shaping of forest structure by topographic variables may be explained by differences in tree
species and the effect of topographic position on tree growth. Observations from previous studies have
noted that terraces contain flora, such as palms, that are typically found in forest valleys [71]. A sister
study [72] showed how tree species composition varies across terraced and non-terraced areas, with
terraces acting as a type of environmental “bridge” between slope and non-sloped areas. Prior studies
in Mesoamerican forests have shown topography to strongly influence the composition of tree species,
with forests in valleys, along slopes, and along ridges forming distinct tree communities [73,74]. Tree
species with specific topographic requirements have a direct impact on forest structure. Furthermore,
though tree morphology is fairly plastic, different species with their specific architectural constraints,
to a certain degree, may contribute uniquely to the general canopy structure [31].

Remote Sens. 2014, 6 10725
Figure 5. Relationships of LiDAR-derived values of (a,b) average canopy height
(c,d) canopy openness, and (e,f) vertical canopy diversity from terraced and not terraced
plots as a function of topographic slope. Significant differences between terraced and
non-terraced areas in average values (detected with a t-test) for low (0°–10°), medium
(10°–20°), and high (>20°) slopes are designated with p-values.
Variation in species composition alone may not explain the difference observed in forest structure.
Edaphic factors related to topography, i.e., nutrient, water, and light availability, directly influence
tree growth [28,29]. Differences in forest structure over terraces can be explained by altered edaphic
conditions [55,56,59]. Steeper hillsides typically have thinner soils and reduced water availability;
terraces increase soil depth and water availability, which impacts forest structure [44,75]. Terraces also
retain nutrients that would otherwise be leached out of the soil [59,71]. This study identified a
significant interaction between slope and elevation on canopy structure (Tables 1 and 2). As position
upslope increases, nitrogen decreases, which can have an effect on the growth of trees, resulting in
reduced basal area and canopy cover [29]. Beyond the implications for human land use legacies, this

Remote Sens. 2014, 6 10726
study illustrates how relatively small changes in topography can result in long-lasting changes to
rainforest structure [44].
Figure 6. Histograms for average proportion of LiDAR point returns binned by 3-m height
classes for (a) non-terraced and (b) terraced plots divided into low (0°–10°), medium
(10°–20°), and high (>20°) sloped areas.
These results indicate that the terraces constructed by the Maya over 1000 years ago continue to
influence the forest structure at Caracol. The terraces have significantly altered the micro-topography
of the terrain, resulting in a corresponding echo in forest structure. While topography (i.e., slope,
elevation, and aspect) appears to act as the driving factor in forest structure variation, the addition of
terraces dilutes the topographic gradient, reducing the variation in forest structure from low-lying
valleys to highly-sloped hills.
6. Conclusions
Agricultural terracing transforms hillslope topography; these oft-hidden archaeological features can
last for millennia and are readily delineated with LiDAR [52,57,58]. While likely engineered for soil
and water conservation, here we used airborne LiDAR to reveal the persistent, unintentional impacts
that ancient Maya terracing has had on the structure of the tropical rainforest that regenerated after
agricultural abandonment [60]. This study showed that the presence of terraces dampened the effect of
topographic slope on structural variables (i.e., height, openness, and vertical diversity) that define a

Remote Sens. 2014, 6 10727
forest canopy. With steeper slopes, terraces yielded ~8% taller, ~20% more closed-canopy, and ~7%
more vertically-diverse forests. As canopy height decreased with an increase in slope on non-terraced
lands, height differences were muted with terracing (Figure 5a,b). Canopy openness, a measure related
to understory light penetration, increased as slope increased; however, on terraced areas, openness
varied less as a function of slope (Figure 5c,d). Vertical canopy diversity, an estimate of vertical spatial
heterogeneity that has been correlated to avian diversity [33], followed a similar pattern as average
canopy height; its variance decreased along the topographic gradient with terracing (Figure 5e,f).
Terraces mediated the effect of slope on the proportion of LiDAR returns in the vertical, 3-m height
bins, i.e., when terraces were present, forest structure did not differ as much with slope as when
terraces were absent (Figure 6). Though not directly measured, these canopy changes most likely
correspond to higher levels of aboveground biomass or stored carbon [66].
The ability of LiDAR to concurrently measure ground and canopy surfaces elucidated this
heretofore unknown, long-term anthropogenic impact on these forests. After Caracol was abandoned
ca. AD 900, ancient Maya agricultural practices continue to influence contemporary forest structure.
These effects should have consequences on ecosystem services (Figure 1) related to arboreal habitat
and carbon sequestration abilities of this biodiverse, high-biomass region, which is part of the
Mesoamerican Biological Corridor [76]. Though this study only examined terraces at Caracol, these
anthropogenic features are found throughout the Maya region [59,77], including the Petén in
Guatemala [78] and the southern Yucatán in Mexico [20]. With the prevalence of relic terraces
throughout Central American landscapes and elsewhere [79–81] comes the understanding that past
agriculture practices have left lasting legacies on ecosystem structure and function. LiDAR
demonstrated the synergy between landscape archaeology and landscape ecology. This approach can
be extended across other large expanses of temperate and tropical forests where humans have left
significant fingerprints from past land use [3,8,12,81] that currently lay obscured below vegetation.
Moreover, this remote sensing study gives us pause over our current land use practices [82] and
reminds us that today is tomorrow’s past.
Acknowledgments
This research was supported by NASA Grant #NNX08AM11G awarded to John Weishampel
through the Space Archaeology program and the University of Central Florida—University of
Florida—Space Research Initiative (UCF-UF-SRI). The authors would like to thank the ongoing efforts of
the Caracol Archaeological Project (PIs-Arlen and Diane Chase) which is administered through the
Belize Institute of Archaeology. We would also like to thank James Angelo and Kim Medley for
statistical assistance and Arlen Chase, Ross Hinkle, Pedro Quintana-Ascencio, Prasad Thenkabail and
anonymous reviewers for providing improvements to the manuscript.
Author Contributions
The research idea was conceived by and funded through a grant obtained by John Weishampel who
advised Jessica Hightower during her Master’s thesis on this topic. Jessica Hightower performed the
research and analyzed the data along with John Weishampel. All authors interpreted the results and
contributed to the writing of the manuscript.

Remote Sens. 2014, 6 10728
Conflicts of Interest
The authors declare no conflict of interest.
References
1. Chazdon, R.L. Tropical forest recovery: Legacies of human impact and natural disturbances.
Perspect. Plant Ecol. 2003, 6, 51–71.
2. Foster, D.R.; Swanson, F.; Aber, J.; Burke, I.; Brokaw, N.; Tilman, D.; Knapp, A. The importance
of land-use legacies to ecology and conservation. BioScience 2003, 53, 77–88.
3. Ruddiman, W.F. Earth Transformed; W.H. Freeman and Co.: New York, NY, USA, 2014.
4. Flinn, K.M.; Vellend, M. Recovery of forest plant communities in post-agricultural landscapes.
Front Ecol. Environ. 2005, 3, 243–250.
5. Sponsel, L.E.; Bailey, R.C.; Headland, T.N. Anthropological perspectives on the causes,
consequences, and solutions of deforestation. In Tropical Deforestation: The Human Dimension;
Sponsel, L.E., Headland, T.N., Bailey, R.C., Eds.; Columbia Univesity Press: New York, NY,
USA, 1996; pp. 3–52.
6. Laurance, W.F. Reflections of the tropical deforestation crisis. Biol. Conserv. 1999, 91, 109–117.
7. Achard, F.; Eva, H.D.; Stibig, H.; Mayaux, P.; Gallego, J.; Richards, T.; Malingreau, J.
Determination of deforestation rates of the world’s humid tropical forests. Science 2002, 297,
999–1002.
8. Bellemare, J.; Motzkin, G.; Foster, D.R. Legacies of the agricultural past in the forested present:
An assessment of historical land-use effects on rich mesic forests. J. Biogeogr. 2002, 29, 1401–1420.
9. Sanford, R.L., Jr.; Horn, S.P. Holocene rain-forest wilderness: A neotropical perspective on
humans as an exotic, invasive species. In USDA Forest Service RMRS-P-15-VOL-3, Proceedings
of Wilderness Science in a Time of Change; McCool, S.F., Cole, D.N., Eds.; Rocky Mountain
Research Station: Ogden, UT, USA, 2000; pp. 168–173.
10. Gomez-Pompa, A.; Allen, M.F.; Fedick, S.L.; Jimenez-Osornio, J.J. The Maya Lowlands: A case
study for the future? Conclusions. In The Lowland Maya Area: Three Millennia at the
Human-Wildland Interface; Gomez-Pompa, A., Allen, M.F., Fedick, S.L., Jimenez-Osornio, J.J., Eds.;
Hawthorn Press, Inc.: New York, NY, USA, 2003; pp. 623–631.
11. Clark, D.B. Abolishing virginity. J. Trop. Ecol. 1996, 12, 735–739.
12. Heckenberger, M.J.; Kuikuro, A.; Kuikuro, U.T.; Russell, J.C.; Schmidt, M.; Fausto, C.;
Franchetto, B. Amazonia 1492: Pristine forest or cultural parkland. Science 2003, 301, 1710–1714.
13. Delcourt, H.R. The impact of prehistoric agriculture and land occupation on natural vegetation.
Trends Ecol. Evol. 1987, 2, 39–44.
14. Butzer, K.W. Ecology in the long view: Settlement histories, agrosystemic strategies, and
ecological performance. J. Field Archaeol. 1996, 23, 141–150.
15. Mann, C.C. 1491: New Revelations of the Americas before Columbus; Knopf Press: New York,
NY, USA, 2005.
16. Peterken, G.F.; Game, M. Historical factors affecting the number and distribution of vascular
plant species in the woodlands of central Lincolnshire. J. Ecol. 1984, 72, 155–182.

Remote Sens. 2014, 6 10729
17. Motzkin, G.; Foster, D.; Allen, A.; Harrod, J.; Boone, R. Controlling site to evaluate history:
Vegetation patterns of a New England sand plain. Ecol. Monogr. 1996, 66, 345–365.
18. Briggs, J.M.; Spielmann, K.A.; Schaafsma, H.; Kintigh, K.W.; Kruse, M.; Morehouse, K.;
Schollmeyer, K. Why ecology needs archaeologists and archaeology needs ecologists.
Front. Ecol. Environ. 2006, 4, 180–188.
19. Dambrine, E.; Dupouey, J.L.; Laut, L.; Humbert, L.; Thinon, M.; Beaufils, T.; Richard, H.
Present forest biodiversity patterns in France related to former Roman agriculture. Ecology 2007,
88, 1430–1439.
20. Turner, B.L., II; Klepeis, P.; Schneider, L.C. Three millennia in southern Yucatan peninsula:
Implications for occupancy, use, and carrying capacity. In The Lowland Maya Area: Three Millennia
at the Human-Wildland Interface; Gomez-Pompa, A., Allen, M.F., Fedick, S.L., Jimenez-Osornio,
J.J., Eds.; Hawthorn Press, Inc.: New York, NY, USA, 2003; pp. 361–373.
21. Gómez-Pompa, A.; Flores, J.S.; Sosa, V. The “pet kot”: A man-made tropical forest of the Maya.
Interciencia 1987, 12, 10–15.
22. Lambert, J.D.H.; Arnason, T. Distribution of vegetation on Maya ruins and its relationship to
ancient land-use at Lamanai, Belize. Turrialba 1978, 28, 33–41.
23. Lambert, J.D.H.; Arnason, J.T. Rámon and Maya ruins: An ecological, not an economic, relation.
Science 1982, 216, 298–299.
24. Harper, K.A.; MacDonald, S.E.; Burton, P.J.; Chen, J.; Brosofske, K.D.; Saunders, S.C.;
Euskirchen, E.S.; Roberts, D.; Jaiteh, M.S.; Esseen, P. Edge influence on forest structure and
composition in fragmented landscapes. Conserv. Biol. 2005, 19, 768–782.
25. Turner, M.G. Disturbance and landscape dynamics in a changing world. Ecology 2010, 91,
2833–2849.
26. Aide, M.T.; Zimmerman, J.K.; Pascarella, J.B.; River, L.; Marcano-Vega, H. Forest regeneration
in a chronosequence of tropical abandoned pastures: Implication for restoration ecology. Restor.
Ecol. 2000, 8, 328–338.
27. Mueller, A.D.; Islebe, G.A.; Anselmetti, F.S.; Ariztegui, D.; Brenner, M.; Hodell, D.A.;
Hajdas, I.; Hamann, Y.; Haug, G.H.; Kennett, D.J. Recovery of the forest ecosystem in the
tropical lowlands of northern Guatemala after disintegration of Classic Maya polities. Geology
2010, 38, 523–526.
28. Clark, D.B.; Clark, D.B. Landscape-scale variation in forest structure and biomass in a tropical
rain forest. For. Ecol. Manag. 2000, 137, 185–198.
29. Tateno, R.; Takeda, H. Forest structure and tree species distribution in relation to
topography-mediated heterogeneity of soil nitrogen and light at the forest floor. Ecol. Res. 2003,
18, 559–571.
30. Spies, T.A. Forest structure: A key to the ecosystem. Northwest Sci. 1998, 72, 34–36.
31. Alves, L.F.; Vieira, S.A.; Scaranello, M.A.; Camargo, P.B.; Santos, F.A.M.; Joly, C.A.;
Martinelli, L.A. Forest structure and live aboveground biomass variation along an elevational
gradient of tropical Atlantic moist forest (Brazil). For. Ecol. Manag. 2010, 260, 679–691.
32. Turner, M.G. Landscape ecology: The effect of pattern on process. Annu. Rev. Ecol. Syst. 1989,
20, 171–197.
33. MacArthur, R.H.; MacArthur, J.W. On bird species diversity. Ecology 1961, 42, 594–598.

Remote Sens. 2014, 6 10730
34. Verschuyl, J.P.; Hansen, A.J.; McWethy, D.B.; Sallabanks, R.; Hutto, R.L. Is the effect of forest
structure on bird diversity modified by forest productivity. Ecol. Appl. 2008, 18, 1155–1170.
35. Müller, J.; Bae, S.; Röder, J.; Chao, A.; Didham, R.K. Airborne LiDAR reveals context
dependence in the effects of canopy architecture on arthropod diversity. For. Ecol. Manag. 2014,
312, 129–137.
36. Alvarez, E.; Duque, A.; Saldarriaga, J.; Cabrera, K.; de las Salas, G.; del Valle, I.; Lema, A.;
Moreno, F.; Orrego, S.; Rodríguez, L. Tree above-ground biomass allometries for carbon stocks
estimation in the natural forests of Columbia. For. Ecol. Manag. 2012, 267, 297–308.
37. Prentice, I.C.; Leemans, R. Pattern and process and the dynamics of forest structure: A simulation
approach. J. Ecol. 1990, 78, 340–355.
38. Brokaw, N.V.L. Gap-phase regeneration in a tropical forest. Ecology 1992, 66, 682–687.
39. Pacala, S.W.; Deutschman, D.H. Details that matter: The spatial distribution of individual trees
maintains forest ecosystem function. Oikos 1995, 74, 357–365.
40. Phillips, O.L.; Baker, T.R.; Arroyo, L.; Higuchi, N.; Killeen, T.; Laurance, W.F.; Lewis, S.L.;
Lloyd, J.; Malhi, Y.; Monteagudo, A.; et al. Pattern and process in Amazon forest dynamics,
1976–2001. Philos. Trans. R Soc. B 2004, 359, 381–407.
41. Shugart, H.H.; Saatchi, S.; Hall, F.G. Importance of structure and its measurement in quatifying
function of forest ecosystems. J. Geophys. Res. 2010, 115, G00E13, doi:10.1029/2009JG000993.
42. Urquiza-Haas, T.; Dolman, P.M.; Peres, C.A. Regional scale variation in forest structure and
biomass in the Yucatán Peninsula: Effects of forest disturbance. For. Ecol. Manag. 2007, 247, 80–90.
43. Holdridge, L.R.; Grenke, W.C.; Hatheway, W.H.; Liang, T.; Tosi, J.A. Forest Environments in
Tropical Life Zones: A Pilot Study; Pergamon: New York, NY, USA, 1971.
44. Detto, M.; Muller-Landau, H.C.; Mascaro, J.; Asner, G.P. Hydrological networks and associated
topographic variation as templates for the spatial organization of tropical forest vegetation.
PLoS One 2013, 8, e76296, doi:10.1371/journal.pone.0076296.
45. Homeier, J.; Breckle, S.W.; Günter, S.; Rollenbeck, R.T.; Leuschner, C. Tree diversity, forest
structure and productivity along altitudinal and topographical gradients in a species-rich
Ecuadorian montane rain forest. Biotropica 2010, 42, 140–148.
46. Weishampel, J.F.; Drake, J.B.; Cooper, A.; Blair, J.B.; Hofton, M. Forest canopy recovery from
the 1938 hurricane and subsequent damage measured with airborne LiDAR. Remote Sens.
Environ. 2007, 190, 142–153.
47. Laurance, W.F.; Ferreira, L.V.; Rankin-de Merona, J.M.; Laurance, S.G. Rain forest
fragmentation and the dynamics of Amazonian tree communities. Ecology 1998, 79, 2032–2040.
48. Coultas, C.L.; Collins, M.C.; Chase, A.F. Some soils common to Caracol, Belize and their
significance to ancient agriculture and land-use. In Studies in the Archaeology of Caracol, Belize;
Chase, D., Chase, A., Eds.; Pre-Columbian Art Research Institute: San Francisco, CA, USA,
1994; Monograph 7, pp. 21–33.
49. Chase, A.F.; Chase, D.Z. Scale and intensity in classic period Maya agriculture: Terracing and
settlement at the “Garden City” of Caracol, Belize. Cult. Agric. 1998, 20, 60–77.
50. Opitz, R.S.; Cowley, D.C. Interpreting Archaeological Topography: 3D Data; Visualisation and
Observation Oxbow Books: Oxford, UK, 2013.

Remote Sens. 2014, 6 10731
51. Chase, A.F.; Chase, D.Z.; Weishampel, J.F. Lasers in the jungle: Airborne sensors reveal a vast
Maya landscape. Archaeology 2010, 63, 27–29.
52. Weishampel, J.F.; Hightower, J.N.; Chase, A.F.; Chase, D.Z. Remote sensing of below canopy
land use features from the Maya polity of Caracol. In Understanding Landscapes, from Discovery to
Their Spatial Organization; British Archaeological Reports S2541; Djinjian, F., Robert, S., Eds.;
Archaeopress: Oxford, UK, 2013; pp. 131–136.
53. Friesner, J. Hurricanes and the Forests of Belize; Forest Department, Ministry of Natural
Resources and the Environment: Belmopan City, Belize, 1993; p. 20.
54. Weishampel, J.F.; Hightower, J.N.; Chase, A.F.; Chase, D.Z. Use of airborne LiDAR to delineate
canopy degradation and encroachment along the Guatemala—Belize border. Trop. Conserv. Biol.
2012, 5, 12–24.
55. Webb, E.A.; Schwarcz, H.P.; Healy, P.F. Detection of ancient maize in lowland Maya soils using
stable carbon isotopes: Evidence from Caracol, Belize. J. Archaeol. Sci. 2004, 31, 1039–1052.
56. Murtha, T. Land and Labor: Maya Terraced Agriculture: An Investigation of the Settlement
Economy and Intensive Agricultural Landscape of Caracol, Belize; Verlag, D.M., Ed.; Muller:
Saarbruckan, Germany, 2009.
57. Chase, A.F.; Chase, D.Z.; Weishampel, J.F.; Drake, J.B.; Shrestha, R.L.; Slatton, K.C.; Awe, J.J.;
Carter, W.E. Airborne LiDAR, archaeology, and the ancient Maya landscape at Caracol, Belize.
J. Archaeol. Sci. 2011, 38, 387–398.
58. Chase, A.F.; Chase, D.Z.; Fisher, C.T.; Leisz, S.J.; Weishampel, J.F. Geospatial revolution and
remote sensing LiDAR in Mesoamerican archaeology. PNAS 2012, 109, 12837–12838.
59. Beach, T.; Luzzadder-Beach, S.; Dunning, N.; Hageman, J.; Lohse, J. Upland agriculture in the
Maya lowlands: Ancient Maya soil conservation in northwestern Belize. Geogr. Rev. 2002, 92,
372–397.
60. Chase. A.S.Z.; Weishampel, J.F. Water capture and agricultural terracing at Caracol, Belize as
revealed through the 2009 LiDAR campaign. 2014, in revision.
61. Weishampel, J.F.; Chase, A.F.; Chase, D.Z.; Drake, J.B.; Shrestha, R.L.; Slatton, K.C.; Awe, J.J.;
Hightower, J.; Angelo, J. Remote sensing of ancient Maya land use features at Caracol, Belize
related to tropical rainforest structure. In Proceedings of the Space, Time, Place: Third
International Conference on Remote Sensing in Archaeology, Tamil Nadu, India, 17–21 August
2009; British Archaeological Reports S2118; Campana, S., Forte, M., Liuzza, C., Eds.;
Archaeopress: Oxford, UK, 2010; pp. 45–52.
62. Fernandez-Diaz, J.C.; Carter, W.E.; Shrestha, R.L.; Glennie, C.L. Now you see it…now you
don’t: Understanding airborne mapping LiDAR collection and data product generation for
archaeological research in Mesoamerica. Remote Sens. 2014, 6, 9951–10001. 63. Beyer, H.L. Hawth’s Analysis Tools for ArcGIS. Available online: http: //www.spatialecology.com/
htools (accessed on 21 March 2012).
64. McGaughey, R.J. FUSION/LDV: Software for LIDAR Data Analysis and Visualization;
US Department of Agriculture, Forest Service, Pacific Northwest Research Station: Seattle, WA,
USA, 2009; p. 123.
65. Angelo, J.J.; Duncan, B.W.; Weishampel, J.F. Using LiDAR-derived vegetation profiles to predict
time since fire in an oak scrub landscape in east-central Florida. Remote Sens. 2010, 2, 514–525.
Remote Sens. 2014, 6 10732
66. Drake, J.B.; Dubayah, R.O.; Clark, D.B.; Knox, R.G.; Blair, J.B.; Hofton, M.A.; Chazdon, R.L.;
Weishampel, J.F.; Prince, S. Estimation of tropical forest structural characteristics using
large-footprint lidar. Remote Sens. Environ. 2002, 79, 305–319.
67. Jost, L. Entropy and diversity. Oikos 2006, 113, 363–365.
68. Anderson, M.J. A new method for non-parametric multivariate analysis of variance. Austral. Ecol.
2001, 26, 32–46.
69. Oksanen, J.; Blanchet, F.G.; Kindt, R.; Legendre, P.; O’Hara, R.B.; Simpson, G.L.; Solymos, P.;
Stevens, M.H.H.; Wagner, H. Vegan: Community Ecology Package. R Package Version 1.17–9.
Available online: http://CRAN.R-project.org/package=vegan (accessed on 21 March 2012).
70. McCune, B.; Grace, J.B. Analysis of Ecological Communities; MjM Software Design:
Gleneden Beach, OR, USA, 2002.
71. Healy, P.F.; Lambert, J.D.H.; Arnason, J.T.; Hebda, R.J. Caracol, Belize: Evidence of ancient
Maya agricultural terraces. J. Field Archaeol. 1983, 10, 397–410.
72. Hightower, J.N. Relating Ancient Maya Land Use Legacies to the Contemporary Forest of
Caracol, Belize. Master’s Thesis, University of Central Florida, Orlando, FL, USA, 2012; p. 71.
73. Brewer, S.T.; Rejmanek, M.; Webb, A.H.; Fine, P.V.A. Relationship of phytogeagraphy and
diversity of tropical tree species with limestone topography in southern Belize. J. Biogeogr. 2003,
30, 1669–1688.
74. White, D.A.; Hood, C.S. Vegetation patterns and environmental gradients in tropical dry forests of
the northern Yucatan Peninsula. J. Veg. Sci. 2004, 15, 151–160.
75. Furley, P.A.; Newey, W.W. Variations in plant communities with topography over tropical
limestone soils. J. Biogeogr. 1979, 6, 1–15.
76. DeClerck, F.A.J.; Chazdon, R.; Holl, K.D.; Milder, J.C.; Finegan, B.; Martinez-Salinas, A.;
Imbach, P.; Canet, L.; Ramos, Z. Biodiversity conservation in human-modified landscapes of
Mesoamerica: Past, present, and future. Biol. Conserv. 2010, 143, 2301–2313.
77. Wyatt, A.R. Gardens on Hills: Ancient Maya Terracing and Agricultural Production at Chan,
Belize. PhD Dissertation, University of Illinois, Chicago, IL, USA, 2008; p. 449.
78. Beach, T.; Dunning, N.P. Ancient Maya terracing and modern conservation in the Peten rain
forest of Guatemala. J. Soil Water Conserv. 1995, 50, 138–145.
79. Ackermann, O.; Svoray, T.; Haiman, M. Nari (calcrete) outcrop contributions to ancient
agricultural terraces in the Southern Shephelah, Israel: Insights from digital terrain analysis and a
geoarchaeological field survey. J. Archaeol. Sci. 2008, 35, 930–941.
80. Pretto, F.; Celesti-Grapow, L.; Carli, E.; Blasi, C. Influence of past land use and current human
disturbance on non-native plants species on small Italian islands. Plant Ecol. 2010, 2010, 225–239.
81. McCoy, M.D.; Asner, G.P.; Graves, M.W. Airborne lidar survey of irrigated agricultural
landscapes: An application of the slope contrast method. J. Archaeol. Sci. 2011, 38, 2141–2154.
82. Nassauer, J.I.; Raskin, J. Urban vacancy and land use legacies: A frontier for urban ecological
research, design, and planning. Landsc. Urban Plan. 2014, 125, 245–253.
© 2014 by the authors; licensee MDPI, Basel, Switzerland. This article is an open access article
distributed under the terms and conditions of the Creative Commons Attribution license
(http://creativecommons.org/licenses/by/4.0/).
Related Documents


