Introduction European occupation of the Australian landscape has been accompanied by extensive clearing of forests and woodlands, with about 29% of 3.7 million square kilometres cleared during the past 200 years (data in Cofinas and Creighton 2001). Although it is self- evident to most biologists that a large proportion of the indigenous fauna depends on native vegetation for its survival, there has been little quantification of changes to faunal assemblages when forest is cleared and the land developed. While particular species may either decline or increase in abundance (e.g. Catterall et al. 1998), clearing has been a major cause of decline of many vertebrate species (e.g. Covacevitch and McDonald 1991, Garnett 1992). Processes that contribute to clearing-related declines include loss of habitat area, changes to the quality of remaining vegetation (for example, through loss of understorey or tree thinning), and fragmentation effects in the remaining small patches (Catterall et al. 1997, Laurance and Bierregaard 1997, Young 2000, Harrington et al. 2001). Quantifying the biodiversity values of reforestation: perspectives, design issues and outcomes in Australian rainforest landscapes Carla P. Catterall 1,2 , John Kanowski 1,2 , Grant W.Wardell-Johnson 1,2.3 , Heather Proctor 1,2 ,Terry Reis 1,2 , Debra Harrison 1,2 , and Nigel I. J.Tucker 1,4 1 Rainforest Cooperative Research Centre 2 Environmental Sciences, Griffith University, Nathan, Qld 4111 3 School of Natural and Rural Systems Management , University of Qld, Gatton, Qld 4343 4 Centre for Tropical Restoration, Qld. Parks and Wildlife Service, Yungaburra , Qld 4872 Corresponding author: Carla Catterall ([email protected]) ABSTRACT Following two centuries of land clearing, the past two decades have seen growing efforts to re- establish forest on formerly-cleared sites. While the immediate goals of reforestation vary, there is also a widespread expectation that one of its effects will be an improvement in “biodiversity value”. However, agreed standards concerning how this can be measured, and against what benchmarks it should be judged, are lacking. This paper describes a study of biodiversity development in different types of rainforest reforestation in tropical and subtropical eastern Australia. It provides information on the responses of rainforest fauna and also discusses key issues of survey design and methodology that, if ignored, may limit the effectiveness of monitoring programs. The nature of rainforest, its history within Australia, and its role as fauna habitat are briefly reviewed. Modern deforestation and human land use, and various reforestation pathways (including regrowth, timber plantation, and ecological restoration projects) are described. Then, design principles, biodiversity measurements, and issues relating to their choice are discussed.These include: spatial scale; site selection and replication in relation to environmental variation; reference sites; the array of potentially measurable biotic and process variables, and spatio-temporal measurement scales. Finally we explore analytical options and present selected findings, using univariate and multivariate approaches, and comparing simple species richness, functional groupings, and analyses of taxonomic composition. Rainforest biodiversity value is defined as the development of a rainforest-like set of biota and ecological processes. Reforested sites were generally intermediate between pasture and rainforest reference sites in the measured components of rainforest biodiversity value. Many components had been rapidly (by around 10 years) acquired by ecological restoration sites, although it is clear that some components will take decades or longer to develop. The results also show: (1) the existence of production/ biodiversity trade-offs, in that sites managed for timber production acquired less biodiversity value than those planted for ecological restoration; (2) moderate correspondence across different indicator taxa when they are analysed for assemblage composition; (3) very little agreement among indicator taxa when overall richness is used; (4) a likelihood of important landscape and context effects. Long-term conservation of rainforest fauna will require rainforest restoration over substantial areas of currently denuded land. However, although rainforest restoration may often show reasonable success, it should not be viewed as an alternative to conserving existing remnants and advanced regrowth. Key words: restoration, forest, vertebrate, bird, plant, invertebrate, ecological processes, monitoring, survey Pp 359 - 393 in the Conservation of Australia’s Forest Fauna (second edition) 2004, edited by Daniel Lunney. Royal Zoological Society of New South Wales, Mosman, NSW, Australia.

Welcome message from author
This document is posted to help you gain knowledge. Please leave a comment to let me know what you think about it! Share it to your friends and learn new things together.
Transcript
IntroductionEuropean occupation of the Australian landscape has been accompanied by extensive clearing of forests and woodlands, with about 29% of 3.7 million square kilometres cleared during the past 200 years (data in Cofinas and Creighton 2001). Although it is self-evident to most biologists that a large proportion of the indigenous fauna depends on native vegetation for its survival, there has been little quantification of changes to faunal assemblages when forest is cleared and the land developed. While particular species may either decline
or increase in abundance (e.g. Catterall et al. 1998), clearing has been a major cause of decline of many vertebrate species (e.g. Covacevitch and McDonald 1991, Garnett 1992). Processes that contribute to clearing-related declines include loss of habitat area, changes to the quality of remaining vegetation (for example, through loss of understorey or tree thinning), and fragmentation effects in the remaining small patches (Catterall et al. 1997, Laurance and Bierregaard 1997, Young 2000, Harrington et al. 2001).
Quantifying the biodiversity values of reforestation: perspectives, design issues and outcomes in Australian rainforest landscapesCarla P. Catterall1,2, John Kanowski1,2, Grant W. Wardell-Johnson1,2.3, Heather Proctor1,2, Terry Reis1,2, Debra Harrison1,2, and Nigel I. J. Tucker1,4 1 Rainforest Cooperative Research Centre2 Environmental Sciences, Griffith University, Nathan, Qld 41113 School of Natural and Rural Systems Management , University of Qld, Gatton, Qld 43434 Centre for Tropical Restoration, Qld. Parks and Wildlife Service, Yungaburra , Qld 4872
Corresponding author: Carla Catterall ([email protected])
AB
STR
AC
T
Following two centuries of land clearing, the past two decades have seen growing efforts to re-establish forest on formerly-cleared sites. While the immediate goals of reforestation vary, there is also a widespread expectation that one of its effects will be an improvement in “biodiversity value”. However, agreed standards concerning how this can be measured, and against what benchmarks it should be judged, are lacking. This paper describes a study of biodiversity development in different types of rainforest reforestation in tropical and subtropical eastern Australia. It provides information on the responses of rainforest fauna and also discusses key issues of survey design and methodology that, if ignored, may limit the effectiveness of monitoring programs.
The nature of rainforest, its history within Australia, and its role as fauna habitat are briefly reviewed. Modern deforestation and human land use, and various reforestation pathways (including regrowth, timber plantation, and ecological restoration projects) are described. Then, design principles, biodiversity measurements, and issues relating to their choice are discussed. These include: spatial scale; site selection and replication in relation to environmental variation; reference sites; the array of potentially measurable biotic and process variables, and spatio-temporal measurement scales. Finally we explore analytical options and present selected findings, using univariate and multivariate approaches, and comparing simple species richness, functional groupings, and analyses of taxonomic composition. Rainforest biodiversity value is defined as the development of a rainforest-like set of biota and ecological processes. Reforested sites were generally intermediate between pasture and rainforest reference sites in the measured components of rainforest biodiversity value. Many components had been rapidly (by around 10 years) acquired by ecological restoration sites, although it is clear that some components will take decades or longer to develop. The results also show: (1) the existence of production/ biodiversity trade-offs, in that sites managed for timber production acquired less biodiversity value than those planted for ecological restoration; (2) moderate correspondence across different indicator taxa when they are analysed for assemblage composition; (3) very little agreement among indicator taxa when overall richness is used; (4) a likelihood of important landscape and context effects. Long-term conservation of rainforest fauna will require rainforest restoration over substantial areas of currently denuded land. However, although rainforest restoration may often show reasonable success, it should not be viewed as an alternative to conserving existing remnants and advanced regrowth.
Key words: restoration, forest, vertebrate, bird, plant, invertebrate, ecological processes, monitoring, survey
Pp 359 - 393 in the Conservation of Australia’s Forest Fauna (second edition) 2004, edited by Daniel Lunney. Royal Zoological Society of New South Wales, Mosman, NSW, Australia.
Forest Fauna.indd 16/09/2004, 7:40 PM359

360 Conserving Australia’s Forest Fauna
Recognising the consequences of over-clearing, the past two decades have seen growing efforts to re-establish forest on formerly-cleared sites (Lamb 1994, 1998, Bennett et al. 2000, Tucker et al. 2004). The goals of individual reforestation projects have varied (Hobbs 1993, Emtage et al. 2001), encompassing soil stability, decreased salinity, water filtration, waterway management, flora or fauna habitat, and financial reward (including expected timber yield or cost-reduction by abandonment of unproductive land). Some of these goals may be incompatible or involve trade-offs (Harrison et al. 2001). Even if we consider only the role of a reforested site in providing fauna habitat, there may be different site-specific goals. For example, land may be reforested to subsidise existing remnants (by increasing their size, or providing movement corridors between them), or to construct a new habitat area in place of cleared land (Hobbs 1993). In all cases, there will also be a broader-scale contribution to the total regional habitat area, a factor that may ultimately prove more significant than any particular site-specific effects (Andren 1994).
Whatever the immediate goal of reforestation projects, there is also a widespread expectation that one effect will be an improvement in the quality (type of species) or quantity (number of species or individuals) of local fauna and flora, and also in the nature of ecological processes (Spellerberg and Sawyer 1997, Reay and Norton 1999, Armstrong 1993, Hobbs 1993, Young 2000). This is partly a value judgement, based on the notion that some species or processes are more desirable than others, and for convenience we term this broad notion the “biodiversity value” of a site. There has been little testing of the key factors and practices that lead to an increase in the biodiversity value of a reforested site.
Furthermore, agreed standards concerning how biodiversity value could be measured or monitored, and against what benchmarks it should be judged, are lacking. Accordingly, site assessments of restoration projects may rely on brief statements such as “Several species of birds were noted visiting the site... Evidence of wallaby scats was observed across the site” (Gleed 2002) in sections on fauna within reports to government funding agencies. If current ecological knowledge is taken into account in such projects, more carefully stated biodiversity targets could be specified, against which achievements might be evaluated. Targets would vary among projects, from a full reinstatement of all species, ecological relationships, and temporal dynamics to an assemblage that shares some specified proportion of species with a presumed former ecosystem (Lockwood and Pimm 1999).
Past condition and dynamics are an essential context for the assessment of biodiversity targets in ecological restoration, but the components of biodiversity value are naturally variable in both space and time (Parker and Pickett 1997). For example, natural spatial mosaics and disturbance regimes involve large fluctuations over time in the vegetation and fauna of a site, while at the same time the proportion of land occupied by any given stage or state of the biota may vary much less at the landscape level. This local variation has two consequences: first, it complicates the process of measurement, and second, it
broadens the envelope of potential biodiversity targets for any particular restoration site. A challenge for the practical measurement of biodiversity recovery is to obtain some meaningful and useful information in the face of this complexity, while also working within the constraints of the expertise, interests, and preferences of personnel, as well as a limited budget and time frame.
In this paper we describe an investigation of the development of biodiversity values in different types of rainforest reforestation in tropical and subtropical eastern Australia. Our aim is twofold: to provide new information on the responses of rainforest fauna to deforestation and reforestation, and to discuss issues of survey design and methodology that, if ignored, may render biodiversity monitoring projects of little use at best, and misleading at worst. We begin by considering the nature of rainforest and its history within Australia, then we document design considerations, biodiversity measurements, and issues relating to their choice. Finally we explore analytical options and present selected findings.
Rainforest and its history in Australia
Australian rainforest and its ancient historyRainforests are generally characterised by a closed canopy of broad-leaved tree species in combination with the presence of particular plant families, although their precise definition has been the subject of prolonged debate (Adam 1994, Bowman 2000). Present-day Australian rainforests occur in a landscape mosaic, interspersed with other native vegetation types, such as eucalypt forest, melaleuca forest and heathland (Webb and Tracey 1981, Bowman 2000). In “rainforest landscapes” or “rainforest regions”, rainforest patches are frequent or dominant. The most extensive regions lie in the “Wet Tropics” (far north Queensland, Townsville to Cooktown), subtropics (south-east Queensland and north-east New South Wales, from Bundaberg to Grafton), and temperate zone (western Tasmania) (Bowman 2000). This paper is concerned mainly with the Wet Tropics and subtropics. Rainforests vary greatly in both their plant taxa and physical structure, associated with soil type, temperature, moisture, topography, elevation and latitude (Webb and Tracey 1981, Adam 1994).
Most eastern Australian rainforests are now considered to be significant evolutionary remnants, with an unbroken history that stretches back at least 60 million years, prior to the break up of Gondwana (Webb and Tracey 1981, Archer et al. 1991, Adam 1994). While rainforests used to extend across much of Australia, increasing aridity during the past 20 million years has caused them to contract to eastern coastal regions, although scattered relicts remain in arid areas. About 20,000 years ago, during the peak of Pleistocene aridity, rainforest was restricted to fragments associated with microclimatic refugia, with largest patches in the north-east (Cairns to Cooktown) region (Webb and Tracey 1981, Archer et al. 1991, Adam 1994). The current geographical distributions of rainforest vertebrate fauna have been largely shaped by Pleistocene contractions, and subsequent re-expansions (Winter 1988, Williams
Catterall et al.
Forest Fauna.indd 16/09/2004, 7:40 PM360

361Conserving Australia’s Forest Fauna
and Pearson 1997). By the time of European settlement, rainforest had re-expanded to an area that has been variously estimated at 4 - 8 million hectares (Webb and Tracey 1981, Cofinas and Creighton 2001).
Fragmentation, extinction, partial recovery and re-assortment are therefore longstanding and recurrent processes within Australian rainforests. The fossil record shows repeated transitions between different rainforest sub-types, and between rainforest and eucalypt assemblages (Kershaw 1986, Adam 1994, Bowman 2000). Present-day Australian rainforests are generally less diverse than those of Asia and the Americas (Webb and Tracey 1981, Kikkawa 1990), probably a result of past fragmentation. The extensive rainforests of 5 - 20 million years ago supported a diverse marsupial meso- and mega-fauna that is now largely extinct (Archer et al. 1991). Nevertheless, it has been estimated that rainforests contain around half of this continent’s contemporary terrestrial biota, on 0.3% of its land area (Adam 1994).
Rainforest as fauna habitatTropical and subtropical rainforests possess structural, floristic and physical characteristics that distinguish them from other Australian vegetation types. These include: a high diversity of plant species; tall trees that are closely spaced, forming a closed but uneven canopy, beneath which sparser foliage is distributed throughout the available height range; the presence of characteristic forms of plant life such as vines, lianes, epiphytes, palms, strangler figs and trees with buttress roots; many plant species that bear fleshy fruit; a thick layer of litter on the ground; and a humid microclimate without extreme temperatures (Webb et al. 1976, Kikkawa 1990, Jones and Crome 1990). There is also considerable local spatial patchiness, due in part to succession following tree falls. Some types of rainforest (e.g. those in drier regions) lack some of these features.
In turn, the rainforest fauna includes many species that specialise in some way on the particular conditions and resources of rainforest (Winter et al. 1988, Kikkawa 1990, Jones and Crome 1990). For example, rose-crowned and wompoo fruit-doves depend on the fruits of rainforest plants, large-billed scrubwrens on the foraging substrate and shelter provided by its dense understorey stems and foliage, logrunners on the insects within the thick litter layer and red-legged pademelons on the leaves, fruits and shelter of the rainforest litter and understorey (see Appendix 1 for scientific names of animals whose common names are used in the text). Many species that are characteristic of eucalypt forest are absent or rare in rainforest, although there is also a suite of more generalised species that occur across both, for example the silvereye, golden whistler, Lewin’s honeyeater, common ringtail possum and bush rat (Kikkawa 1968, 1991, Winter 1988), although in eucalypt forest they may occur mainly in the moister gullies. Such patterns are best documented for birds and mammals, but there is abundant natural history information indicating that the same applies to most faunal groups. They also may vary between regions.
The likelihood that a patch of rainforest will support specialist fauna is also affected not only by the availability of particular resources, but also by its size. Reductions in the size of rainforest patches through land clearing are associated with losses of area-dependent vertebrate species that are common in large rainforest tracts. For example, some species (e.g. wompoo and rose-crowned fruit-doves, pale-yellow robin, logrunner, brown antechinus and lemuroid ringtail possum) rarely occur in small rainforest remnants, whereas others (e.g. golden whistler, Lewin’s honeyeater, bush rat and common ringtail possum) appear unaffected by fragmentation, at least in some areas (Howe et al. 1981, Warburton 1997, Laurance 1997, Pahl et al. 1988, Bentley et al. 2000, Harrington et al. 2001). While the specific area thresholds are not clearly established, there seems to be a cascading series of patch size effects, with some bird and mammal species lost from patches that are tens or even hundreds of hectares in size, while others may persist down to a few hectares; invertebrate species may survive in patches a fraction of a hectare in area. Similar area effects must have also occurred in the past, when rainforests were fragmented during arid climatic periods. For example, the smaller more scattered rainforest patches that occur in drier regions support a narrower range of rainforest specialist species, and contain more eucalypt forest species, than occur in the moister regions where forest cover has been more extensive over time (Kikkawa et al. 1981, Howe et al. 1981, Winter 1988). Species’ persistence in small patches may depend on the extent of forest cover in the surrounding landscape. For example, in the Northern Territory, where rainforest naturally exists only as small, scattered patches, rainforest-dependent frugivores such as the rose-crowned fruit-dove and pied imperial-pigeon persist in patches only if rainforest covers more than 0.4% of the land area within a radius of 50 km (Price et al. 1999)
These same factors, namely the presence of particular resources characteristic of rainforest habitats, patch size and spatial context, would affect the ability of replanted and regrowth forest to support rainforest fauna. The fauna of such reconstructed forest will be drawn from a regional pool of potential colonisers, that probably includes specialists of grassland, eucalypt forest and rainforest (some of which may occur mainly in early successional forest), as well as more generalised species (Crome 1990).
Human interactions with Australian rainforestAboriginal and European uses of rainforest
People have coexisted with Australian rainforests for at least 40,000 years, during times when both climate and rainforest distribution fluctuated. Historical accounts indicate that the Australian Aborigines obtained food, other resources, and medicines from rainforests (Horsfall and Hall 1990, Adam 1994). Aboriginal land management in eucalypt forest and woodlands included regular understorey burning, but the nature of its impact on adjacent rainforest boundaries and patches is complex, poorly understood, and controversial (Bowman 2000). Frequent burning will suppress the growth of rainforest plants, and Aboriginal burning probably caused some rainforest contractions. However, careful regular burning around rainforest edges might also have been used
Quantifying the biodiversity values of reforestation
Forest Fauna.indd 16/09/2004, 7:40 PM361

362 Conserving Australia’s Forest Fauna
to lower the probability that hot fires would enter rainforests, thereby protecting valued rainforest patches from shrinking in dry times (Webb and Tracey 1981, Bowman 2000).
Since European settlement, rainforests have been extensively cleared because they tend to occur on moist, fertile soils associated with basalt flows and alluvial plains (Bowman 2000). Estimates for the main regions are that about 20% of the Wet Tropics rainforests has been cleared since 1880, with about 750,000 ha remaining; and about 60% of the subtropical rainforests has been cleared since 1860, with around 340,000 ha remaining (Kanowski et al. 2003 and references therein; see also Rowston and Catterall 2004). The main limit to clearing is topography: remnants are mostly on steep mountain slopes and infertile soils; level plateaux and lowlands have been heavily cleared. Large level areas where rainforest on red basaltic soils was mostly converted to pasture include the Atherton Tablelands in north Queensland and Big Scrub in northern New South Wales (in the latter 99.6% of 75,000 ha was cleared, Floyd 1990). There has been no detailed quantitative assessment of rainforest clearing continent-wide, and estimates vary widely, from 75% of a former 8.0 million hectares (Webb and Tracey 1981) to 30% of 4.3 million ha (Cofinas and Creighton 2001).
The history of rainforest clearing, associated land uses, and their social, economic and political context were discussed by Webb (1966), Frawley (1991), Cassells et al. (1988), Adam (1994), and Lamb et al. (2001). Initial felling of timber species, especially red cedar Toona ciliata and hoop pine Araucaria cunninghamii, was rapidly followed by the establishment of cropland and dairy farms in the late 19th and early 20th centuries, even on soils that soon proved too infertile to support these activities. Throughout much of the 20th century, but particularly around 1920-1930, there was intense conflict between those interested in retaining the remaining rainforests as a long-term timber source and those concerned mainly with land development for agriculture. At this time, E.H.F. Swain, who at times led both the Queensland and New South Wales government forestry departments, pushed to establish plantations of native rainforest trees (especially Araucaria species) in suitable areas of rainforest. The plantation program escalated during the 1950’s and 1960’s, and continued until the 1980’s, during which time about 50,000 ha of rainforest was felled, mainly in subtropical Queensland, for the establishment of monoculture hoop pine plantations. These plantations continue to be used today, on a rotational harvesting system.
During the 1970’s-1990’s, the value of environmental conservation as a primary land use emerged as a significant political issue, with debate over whether state governments should continue harvesting the declining rainforest areas, or whether they should be protected from consumptive uses. By 2000, many large montane tracts of government-owned rainforest were in some form of conservation reserve: New South Wales Rainforests (1986); Central Eastern Rainforest Reserves World Heritage Area (1986, extended 1994); Wet Tropics World Heritage Area (1988); and the South East Queensland Forest Agreement (1999). However, the small patches
and strips of remnant and regrowth rainforest on privately owned land in the basalt plateaux and lowlands remain largely unprotected, and clearing of such areas in the tropics has continued (Erskine 2002).
Recent efforts in reforestation
In recent decades, some areas of cleared land within the tropics and subtropics have returned to forest cover, often following the abandonment or reduced stocking of former dairy farms. Especially in the subtropics, regrowth on abandoned pasture is often dominated by introduced plant species, notably the scrambling shrub lantana Lantana camara, and the trees camphor laurel Cinnamomum camphora, and privets Ligustrum lucidum and L. sinense. Nevertheless, treatment of the weedy regrowth can lead to the restoration of native forest cover in some situations (e.g., where the regrowth is adjacent to remnant forest; Woodford 2000).
Reforestation has also occurred through active planting. In some cases the main goal has been timber production (e.g., “farm forestry”), with plantations designed accordingly (typically, low density plantings of commercially valuable timber species; Table 1). However, since the 1980’s there have been increasing efforts to actively restore rainforest ecosystems to cleared land (Tables 1, 2, Tucker et al. 2004). This “ecological restoration” typically comprises high-density plantings of a diverse range of rainforest trees and shrubs (Goosem and Tucker 1995, Kooyman 1996, Freebody and Vize 1999), often conducted as small projects by individuals and local community groups. During the past decade a complex array of government-sponsored schemes has provided financial subsidies to encourage and assist these efforts.
The Wet Tropics region has a high concentration of rainforest replanting (Table 2). Following the 1988 declaration of the Wet Tropics World Heritage Area, two reforestation schemes were created with Commonwealth funding in collaboration with local government, to provide alternative employment for retrenched forestry workers: the Wet Tropics Tree Planting Scheme (WTTPS) in 1989, and the Community Rainforest Reafforestation Program (CRRP) in 1992. In 1994 the WTTPS scheme was transferred to a consortium of 10 local governments, previously formed to encourage tree planting (North Queensland Afforestation Association NQAA Inc., Freebody and Vize 1999). A community group (Trees for the Evelyn and Atherton Tablelands, TREAT) has also been active in the region since 1982 (Tucker et al. 2004). Many WTTPS and TREAT projects aimed to restore floristically diverse forest with closed canopy to degraded riparian strips and potential dispersal corridors (e.g., Tucker 2000). The CRRP scheme was established with mixed-species timber planting as a main focus (Lamb et al. 1997), and hence their plantings differed in structure, species and landscape position (e.g. Table 1, Tucker et al. 2004). Many plots were very small (<1.0 ha). Most CRRP planting ceased in 1996.
In recent years, nationally-focused tree planting schemes, in particular the Natural Heritage Trust (1997-2003) have both supported the activities in the
Catterall et al.
Forest Fauna.indd 16/09/2004, 7:40 PM362

363Conserving Australia’s Forest Fauna
Attribute Timber plantations Ecological restoration plantings Oldfield regrowthTree species diversity Low (typically 1-10) High (tens - over 100) Low
Species typesOften a large proportion of exotics, eucalypts, and wind-dispersed rainforest species
Few or no exotics; few eucalypts; many fleshy-fruited rainforest species
Often dominated (at least initially) by fleshy-fruited exotic weedy scramblers, shrubs and trees
Planting density Low (c. 1,000 stems/ ha) High (c. 6,000 stems/ha) Not applicable
Management
Grass and herb suppression by herbicide, slashing and/ or stock grazing, stems pruned and thinned
Initial grass and herb suppression by herbicide, heavy mulching, selective weeding; stock excluded
Neglect
Location Often on level ground, fertile soils
Often in areas not desired for production – e.g. steep slopes, creek banks.
Variable, common on unproductive land and steep slopes
Variation within category, and between regions
Mixed-species cabinet timber plots are typically small (few ha), monospecific timber plantations may occupy hundreds of ha. Intensity of management varies between sites and between regions.
Vary greatly in number of plant species, range of life-forms, and whether they represent site-matched local indigenous plants or include non-rainforest species, or species from other regions.Managed natural regrowth also tested in subtropics (e.g. Woodford 2000)
In tropics, regrowth is generally younger with many scramblers, native trees (especially pioneers) common; in subtropics regrowth is generally older and dominated by introduced trees.
a. Nature of effort Tropics: N Qld. – CRRP1 Tropics: N Qld. – others Subtropics: SE Qld Subtropics: NE NSWWorks commenced: <1990 0 9 17 2 1990-94 256 27 10 14 1995-99 85 100 82 14Stated main goal: farm forestry 1402 3 55 15 ecological planting 103 148 32 14 repair of remnants 0 13 14 35 other/mixed 87 20 24 5Stated project site area: 1.0-5.0 ha 261 78 56 19 5.1-10.0 ha 43 25 5 6 >10.0 ha 22 15 6 1Landscape position riparian - 88 33 15 floodplain - 7 10 0 other - 26 59 14Total number of sites4 341 184 137 70
1 Community Rainforest Reafforestation Program; CRRP data were compiled from a separate pre-existing database, courtesy of Queensland Dept. of Natural Resources.2 Recorded in database as “forest plot”3 Recorded in database as “wildlife habitat”4 Differences between category totals and no. of sites are due to missing data. Post-1999 sites and <1.0 ha sites omitted from time and area categories respectively due to lack of coverage.
b. Costs of ecological restoration projects. No. of projects Total area NHT funds Other support* All costs Unit cost $/ha
NHT@ completed projects 1997-99# 28 436 ha $4.2M $4.4M $8.6M $20,000
* all other estimated cash and in-kind costs, including labour.@ Funded by the Natural Heritage Trust – information compiled for completed projects only, from unpublished government data (see also Harrison et al. 2002)# During 1997-2002 there were 45 NHT-funded Bushcare projects in the Wet Tropics bioregion, receiving $9.0 million, hence covering an estimated total area of 900 ha.
Table 1. The spectrum of reforestation styles in tropical and subtropical Australia. Note that the two types of plantings may intergrade in practice.
Table 2. Characteristics of forest restoration efforts (a) types of project undertaken in three regions (data are number of sites in each category) (b) costs of ecological restoration in the tropics. Data in (a) other than CRRP1 are from 1999/2000 questionnaire survey (target was mainly sites > 1.0 ha), with further information for tropics (where survey coverage is greatest) added in 2001/02. Information not ground-truthed; field experience indicates that project areas are frequently over-estimated.
Quantifying the biodiversity values of reforestation
Forest Fauna.indd 16/09/2004, 7:40 PM363
364 Conserving Australia’s Forest Fauna
Wet Tropics and boosted efforts by a rapidly growing number of Landcare groups in the subtropical rainforest regions. Farm forestry has been promoted by the NHT scheme and by a range of government strategies aimed at encouraging private agroforestry, as well as by landholders’ perceptions that a mixed-species timber plot could provide both financial and environmental benefits (Vize and Creighton 2001). Establishment costs are much lower for timber plantations than for ecological restoration plantings (although maintenance costs may be higher). For example, estimates from NHT reporting data (1997-99) and other independent sources in the Wet Tropics, indicate that it costs around $15-25,000/ha to establish ecological restoration plantings, compared with $5-10,000/ ha for cabinet timber plantings (Table 2, Erskine 2002, see also Freebody and Vize 1999). In both the tropics and subtropics, a few individuals have funded their own restoration plots, but because of the high costs of establishment this is beyond the means of most landholders.
Large-scale monospecies rainforest timber plantations have been progressively established since 1920, often by clearing and planting rainforest areas. Most were projects by government forestry departments on publicly-owned land although, more recently, private land has been planted under joint venture (government-landholder) arrangements. Monospecies plantations aimed to produce timber for sale, although protection of the forest estate (from conversion to agriculture), job creation and attempts to stimulate regional economies also underpinned government funding. It has been argued that this subsidy has contributed to low timber prices (Vize and Creighton 2001).
Quantifying biodiversity values of reforestation: study design issues
ContextThe loss of rainforest cover from the tropics and subtropics of eastern Australia has lead to species declines and gross alterations of ecological processes. As people will continue to occupy and use these landscapes, conservation within them depends on identifying the type and extent of forest cover that will acceptably minimise loss of species and changes to ecological processes. This implies some balance between rates of forest loss and gain at the landscape level in terms of quantity, quality and location. However, more is currently known about patterns of faunal loss with deforestation than about gains with reforestation, and previous research into regeneration processes has related mainly to small-scale natural disturbances within large tracts of intact rainforest, or regrowth following timber logging from native rainforests. Much less is known about the development of biota with reforestation where there have been intervening decades of alternative land use, or where the reforested patches may be small and isolated.
Our study considered the following issues. How rapidly is biodiversity value acquired by different types of reforested sites? What factors affect this? Can this be quantitatively measured in a cost-effective manner? An opportunity provided by rainforest plantings is that they can be viewed
as experiments in which known habitat manipulations have been made, with expected outcomes. These outcomes can be tested, although there are limitations that arise because the plantations were not designed to answer scientific questions (see below). Our study design was aided by a database of reforestation sites, compiled in the early stages of the project.
Design issues and challengesComplex biotic interactions
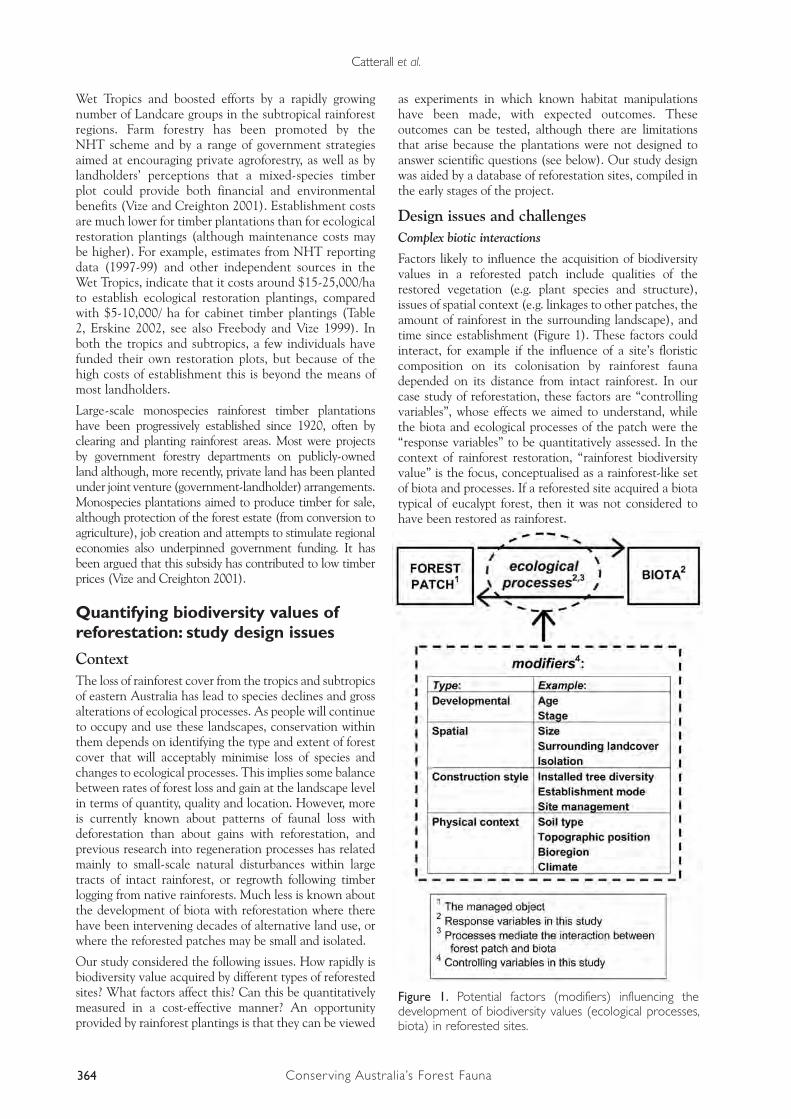
Factors likely to influence the acquisition of biodiversity values in a reforested patch include qualities of the restored vegetation (e.g. plant species and structure), issues of spatial context (e.g. linkages to other patches, the amount of rainforest in the surrounding landscape), and time since establishment (Figure 1). These factors could interact, for example if the influence of a site’s floristic composition on its colonisation by rainforest fauna depended on its distance from intact rainforest. In our case study of reforestation, these factors are “controlling variables”, whose effects we aimed to understand, while the biota and ecological processes of the patch were the “response variables” to be quantitatively assessed. In the context of rainforest restoration, “rainforest biodiversity value” is the focus, conceptualised as a rainforest-like set of biota and processes. If a reforested site acquired a biota typical of eucalypt forest, then it was not considered to have been restored as rainforest.
Figure 1. Potential factors (modifiers) influencing the development of biodiversity values (ecological processes, biota) in reforested sites.
Catterall et al.
Forest Fauna.indd 16/09/2004, 7:40 PM364
365Conserving Australia’s Forest Fauna
Ecological processes (for example dispersal, predation, reproduction and decomposition) are mediators (Figure 1) that determine the ability of the reforested patch to support the biota. The relationship between the forest patch and its biota is bidirectional, with feedback over time (Crome 1990). Rainforest biotas are characterised by complex co-evolved interdependencies, and a large proportion of rainforest plants depend on birds and bats to disperse their fleshy-fruited seeds (Jones and Crome 1990), a central process in forest regeneration (Crome 1990). Other plant-animal interactions such as pollination by insects, and predation of seeds and seedlings by rodents and macropods respectively, are also central to rainforest dynamics (Kanowski et al. 2004). The modifiers (e.g., composition or spatial context of a site) affect these processes. For example, a small isolated patch may not be visited by the types of frugivorous bird that disperse large-seeded rainforest plants (Moran et al. 2004); both the biotic attribute of the presence of frugivorous birds and the process of plant dispersal are being modified by the spatial properties of the site.
Spatial scaling and design issues
We distinguished three relevant spatial scales: landscape (tens of thousands of ha), site (a specific place with its surrounding closely-interacting ecological components – 1 to 100’s of ha in the present study), and sampling transect (a specific area within a site defined on the basis of pragmatic measurement considerations – a fraction of a ha). In some landscapes, a patch scale is also relevant (defined by disjunction in land cover type around a place, such as a forest patch surrounded by cropland – 1 to 100’s of ha). Patch and site may coincide exactly (for example, a five ha reforested plot surrounded by pasture), but in large tracts of continuous rainforest the term “patch” loses its meaning.
Much ecological research has involved intensive studies, at a single site, of the operation of a particular process or the dynamics of a species, or an assemblage of taxonomically-related species. This approach provides insight into processes, but little hint of their generality. For example, one replanted rainforest site in the tropics has been extensively monitored, giving useful information on its temporal changes (Jansen 1997, Grove and Tucker 2000, Tucker 2001), but since there are many factors which could alter the biodiversity outcomes of reforestation, it is unclear how much the results from that site can be generalised. General ecological conclusions require work at more sites, but within the same budget and resources the measurements at each site must be scaled back in time, space or complexity (Eberhart and Thomas 1991).
Many restoration goals may depend on achieving sufficient forest cover across landscapes or catchments (Ehrenfeld 2000). To investigate their effectiveness, measurements of biota and process would need to be made across otherwise-similar landscapes that differed in the extent of reforestation, or perhaps of overall forest cover. However rainforest restoration practitioners typically focus their manipulative efforts at single sites (hectares or less), and there is a need to build a better understanding of how effective these efforts have been. The site level is also the traditional measurement unit
for ecologists (MacNally and Quinn 1998), but a site’s biota is derived from its landscape context as well as the habitat properties of the site itself (Parker and Pickett 1997, Sewell and Catterall 1998).
Our project aimed to investigate factors affecting biota and process at the site level, but also to cover the landscape and gain a better “big picture” by taking “snapshot” measurements of an array of biota and processes across a large number of sites, that could vary in their local and landscape characteristics. Our budget could cover 50-100 sites, depending on the amount of work done at each. If we decided to investigate 10 of the modifying factors in Figure 1, and compared just two levels of difference within each (e.g. smaller/ larger for patch size or younger/ older for age), then 210 (1,024), sites would be needed to obtain one site that represented each combination of factors. However, replication of sites within site-types is also essential to show if the effect of any factor leads to significant variation in a site’s biota or process (issues of statistical power and Type II error: Green 1979, Eberhardt and Thomas 1991, Oliver et al. 1999, Burgman and Lindenmayer 2000). With replication of five sites for each combination of factors we would need to find 5,120 sites to conduct the study.
Apart from exceeding the survey budget, this design would be impossible because some factors occur only in particular combinations (or not in others) and are hence statistically confounded. For example, in our study area, there were no densely planted monocultures, or floristically diverse plantings that were both large and old (Table 1, 2), while low-diversity timber-oriented plantings were generally on fertile soils, and were less likely to occur in riparian areas than high-diversity restoration plantings. Dense woody regrowth patches of exotic species were rare in the tropical uplands, and so on.
Two approaches could be used to deal with this complexity (see also discussions in Eberhart and Thomas 1991, Michener 1997). One, a widespread survey approach, e.g. McKenzie et al. (1991), would select a large sample of sites, whose variation in factors such as size, reforestation style, and topographic position reflected the range of characteristics that occurred in the field. Thus, in our study, sites could be chosen randomly from our restoration sites database, perhaps stratified by geographical region, and probably modified by logistical factors such as accessibility. The values of controlling variables would be measured for each site, and statistical analyses could comprise both exploratory pattern analyses (such as multivariate ordination and cluster analysis) and statistical techniques designed to identify the most important predictors from a set of multiple independent variables (such as multiple or logistic regressions). A wide range of different site-types would be sampled, however our ability to infer causal processes or make generalisations would be restricted because we would lack replication across important factors, and in the subset of selected sites we would miss variation in some factors of particular interest.
A second, hypothesis testing, approach would focus on a few potentially controlling variables for which biological differences could reasonably be hypothesized. All
Quantifying the biodiversity values of reforestation
Forest Fauna.indd 16/09/2004, 7:40 PM365

366 Conserving Australia’s Forest Fauna
possible combinations of high and low values for each would be represented by replicate sites. For example, patch size (defined as small or large, based on specified area thresholds), reforestation type (e.g. ecological restoration plantings and monospecific timber plantings, but noting that the factors of floristic diversity and vegetation structure are inseparably confounded in these styles), and region (tropics, subtropics) would give eight different possible site-types. With 10 replicates of each, 80 sites would be needed. Levels of other factors (for example, site age) would be kept similar for all sites. This type of design is suited to the use of analysis of variance techniques to identify the effects of the selected factors and their interactions (see for example Bentley et al. 2000, Moran et al. 2004). Our design used this approach, with some modification.
Controlling variables targeted or standardised in our study
The effects of different planting styles on biodiversity is a key question for land managers, so our design aimed to achieve a sound comparison between planted timber plots (low floristic diversity, sparse) and ecological restoration plots (floristically diverse, dense). Landholders are interested in the biodiversity potential of timber plots (Herbohn et al. 2000, Emtage et al. 2001, Harrison et al. 2001), but we hypothesized that their wildlife habitat value would be reduced by the wider tree spacing, understorey removal, and lower floristic diversity.
Plot size and shape frequently arise in negotiations between conservation managers and land owners, and studies of rainforest fragmentation suggest that very small patches differ from larger forests in biota and process (see above). However we considered tests of the effects of plot area a lower priority due to the information already available, and instead restricted size effects by targeting only sites above four hectares (most replanted sites were much smaller, and few were above 10 ha). This was also near the minimum size into which we could fit a unit sample area that could adequately measure a sufficient range of biota, including vertebrates, in our design (a 100 x 30 m transect). To gain sufficient replicates, we were forced to include a few replanted sites down to 2 ha.
Age (time since reforestation commenced) will also be associated with substantial variation in biota and process. The timeframe of our study did not permit longitudinal monitoring and there were few available sites older than 10 years. In rainforest restoration, closure of the developing canopy is seen by practitioners as a key developmental stage (Kooyman 1996, Freebody and Vize 1999), supported by research into the development of litter invertebrate assemblages (Nakamura et al. 2003). Hence we also controlled for age of replanting, using only timber and ecological restoration plantings above five years of age, when canopy closure could be expected to have occurred, at least within the ecological plantings.
There were only two regions where sufficient sites were available: the Atherton Tablelands in the tropics, and the combined Big Scrub (northern New South Wales) and Maleny/ Imbil (south east Queensland) subregions in
the subtropics. The regions differed in latitude, elevation (higher in the tropics), extent of regional forest clearance, and extent to which eucalypt forests were represented in the landscape (both more in the subtropics). The latitude and elevation differences tend to offset each other, so that the climate of the two regions is similar. Reflecting this similarity, the pre-European rainforests of both regions contained large areas of the structurally-defined complex notophyll vine forest (Webb and Tracey 1981, Tracey 1982, Adam 1994), with a number of shared genera of common rainforest trees (including Argyrodendron, Castanospermum, Cryptocarya, Elaeocarpus, Ficus, Flindersia, Syzygium, Sloanea, Toona). In both regions, many plantings had taken place on basalt soils, on areas that were once rainforest, but which had been converted to pasture 80-120 years ago.
A core study design was duplicated in both regions. In each, we located 9-10 ecological restoration sites, 10-15 timber plantations (including at least five single-species, Araucaria cunninhamii, and five mixed-species timber plantations), and 10 old plantations (planted around 1930-60, mostly Araucaria, but in the tropics also Agathis, Flindersia and Toona). Since we had hypothesised that the younger timber plantations would have acquired relatively little rainforest biodiversity value, this provided an opportunity to assess their longer-term potential. In the tropics there were 10 ecological restoration, 5 young mixed species timber, 5 young monospecies timber, and 10 old monospecies timber sites (total 30). In the subtropics, the numbers were 9, 10, 5, and 10 (34).
The range of environmental conditions characterising the majority of selected sites in each region (soil type, elevation, rainfall) was restricted as far as possible, to screen out excess variation due to factors whose effects were not of primary interest. In the tropics, sites occupied basalt soils 500 – 850 m above sea level with rainfall 1300 – 3000 mm per annum. In the subtropics, they were located on a wider variety of substrates (with many on basalt), between sea-level and 400 m a.s.l., and with rainfall 1100 – 2000 mm p.a.
Reference conditions and sites
To identify the ecological changes associated with reforestation, it is necessary to compare the reforested sites with reference sites. These must be sufficiently replicated to encompass natural variation, while matching the reforested sites in aspects other than forest cover (Green 1979, Parker and Pickett 1997). In restoration, there are two reference conditions: the disturbed/deforested state (with replicates representing the range of starting points from which reforestation proceeds) and the forested state (representing the potential range of end conditions). In our study, pasture and remnant rainforest were the reference conditions. However, because the landscape had been selectively cleared, it was not possible to find many reference sites whose environmental attributes matched the reforested sites. For example, remnant forest was often on steep or rocky sites on the margins of land suitable for agriculture. In the subtropics, the forest reference sites were smaller in area than in the tropics, because lowland rainforests on fertile soils have largely been cleared. There were 10 forest and five
Catterall et al.
Forest Fauna.indd 16/09/2004, 7:40 PM366

367Conserving Australia’s Forest Fauna
pasture sites in each region; lower replication of pasture was tolerated because we knew that they showed relatively little variation in biotic attributes. Subtropical forest sites spanned a wider range of rainforest subtypes than in the tropics, to match the broader range of physical environments at which the reforested sites occurred.
Weedy oldfield regrowth following the removal of grazing stock provides a further reference condition. Alternatively, these sites could be considered to represent reforestation associated with land abandonment. Regrowth might provide an economical method of reforesting large areas (Young 2000), although the risk of ecological dysfunction or arrested succession may also be high (Lamb 1994). Five regrowth sites in each region were also included as a subsidiary aspect of our study design, although firm inferences regarding their progress would be unlikely. In the tropics these sites were younger (approx. 10-20 yr old) than in the subtropics (approx. 30-40 yr).
This brought the total number of sites to 50 in the tropics and 54 in the subtropics, with a core design of 10 forest and five pasture as reference sites, against which we could assess the comparative performance across 9-10 young ecological restoration and 10-15 young timber plantation sites. By removing sites at the data analysis stage, it would be possible to achieve a design balanced across regions for some statistical comparisons, each with five pasture, 10 forest, nine restoration and 10 timber plantations (five mono- and five mixed-species). A fully balanced design would require reducing the sample size in all categories to five, undesirably low given the variability and complexity of rainforest. We could also explore the biota of oldfield weedy regrowth (five sites) and old timber plantations (10) in each region.
Independence of sites and confounding of factors
Any conclusions reached about the biodiversity outcomes of different reforestation styles depend on showing that the variation within sites of the same style is less than the variation between those sites and the reference sites, and/or less than the variation between sites of one reforestation style and those of another. These conclusions are invalidated if the replicate sites do not represent independent situations and are hence “pseudo-replicates” (Green 1979, Eberhardt and Thomas 1991, Oliver et al. 1999, Quinn and Keough 2002). A basic precaution for achieving some level of independence is to specify a minimum degree of separation between sites of the same type. We aimed to separate sites from the same “treatment” (reforestation style or reference site) by a minimum of 1–10 km. However, not all monoculture plantations met this requirement, because accessible plantations occurred in only a few locations. Some of these sites were separated by a few hundred metres, and caution is therefore needed in drawing generalisations about them.
Spatial confounding between site type and unknown environmental factors could also occur if most sites of one type are located together in part of a study region, while those of another are located elsewhere. The Atherton Tablelands has a strong east-west rainfall gradient, so if most of our ecological restoration sites were towards the east and most timber plantations towards the west, any
apparent differences could simply be a result of climate, not planting style. Our sites were spatially interspersed as far as possible. However, in the subtropics, most monoculture plantations were located in the drier, western margins of the rainforest landscape, limiting study design options. Other cases of potentially confounded factors occurred because we were unable to keep all environmental conditions fully standardised between reference and replanted sites. Also, in the tropics, ecological restoration sites were more likely to occur in riparian areas than either the timber plantings or the forest reference sites.
Response variables: biota and process
The complexity of rainforest ecosystems presents many options for the choice of response variables. There has been considerable debate about the use of indicator taxa. Some authors have advocated their favourite taxa (e.g. King et al. 1998), while others argued that it is unreasonable to expect that one group of organisms could indicate the likely responses of another, and that the choice of indicators should also be influenced by the spatial scale of the target area (Burgman and Lindenmayer 2000). A useful practice would be to monitor a wide array of different ecosystem components, thereby establishing whether these behave in a similar manner, as well as providing a more robust estimate of the state of the system. If a few, relatively easily measured, components describe the pattern and process of rainforest recovery for other groups, the task will become more manageable for future monitoring programs. The questions then shift to “what is the minimum feasible set of attributes that should be measured?” and “is there a cost-effective way of monitoring each?”
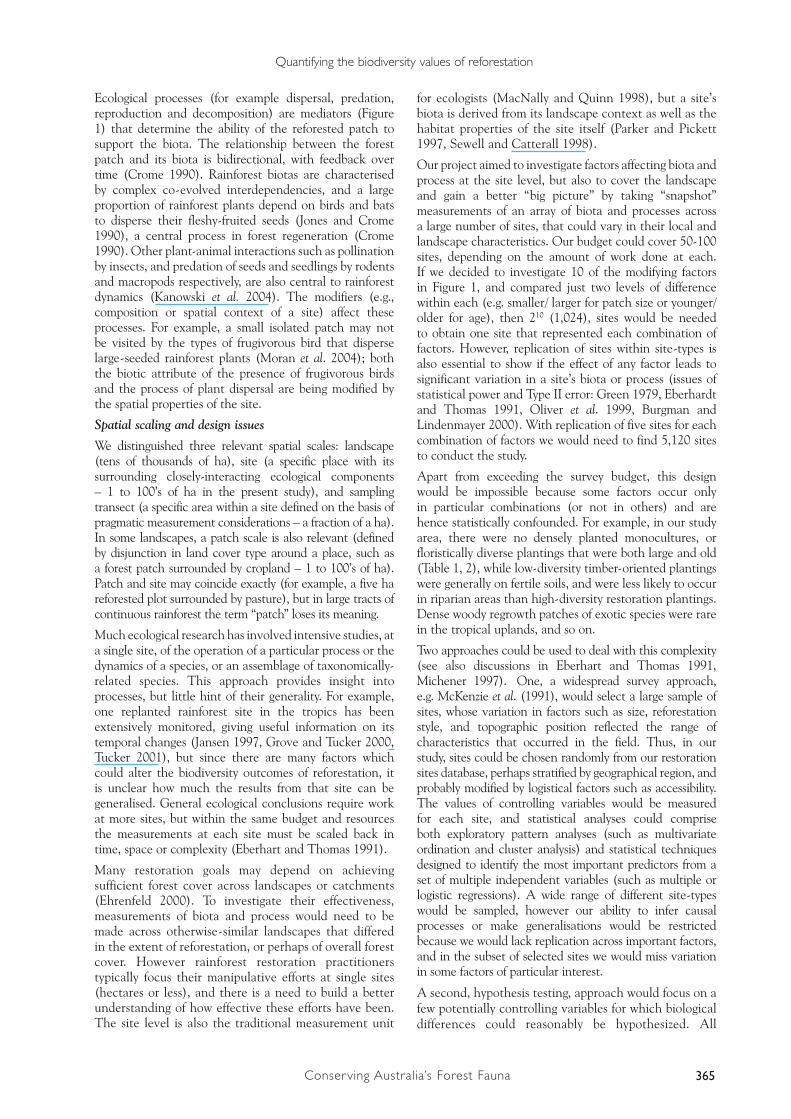
A combination of structure, composition and function has been suggested as a minimum set of attributes with which to measure the success of restoration projects (Spellerberg and Sawyer 1997, Reay and Norton 1999, Wardell-Johnson et al. 2001). Structure can be assessed with relative ease, such as by Kanowski et al. (2003). Compositional measures involve an array of choices, with plants, birds and invertebrates representing major groups that would be hard to exclude (Landsberg et al. 1999). Ecological processes are important (Armstrong 1993), but their monitoring is in its infancy (Erhenfeld 2000). Within each broad category there are many possible measurement targets (e.g. Table 3), each requiring a particular sampling method, resources and expertise (Landsberg et al. 1999, Oliver et al. 1999). We focused on the attributes in bold in Table 3, avoiding two of the charismatic vertebrate groups that are commonly the targets of site survey in environmental impact studies: mammals and amphibians. Both would have required a very large field sampling effort relative to the quantity and quality of the data that they would have provided (low within-taxon variety and functional diversity).
With the selected target variables, field sampling methods, and spatial dispersion of the site network, it proved possible for two people to cover most field activities (although not the flora surveys) in a group of 15 sites in six days. This design was also constrained by the availability of equipment (drying ovens and Tullgren funnels). Hence
Quantifying the biodiversity values of reforestation
Forest Fauna.indd 16/09/2004, 7:40 PM367
368 Conserving Australia’s Forest Fauna
a near-complete season’s field work in one region required about four weeks, after all sites had been selected and pre-checked. Floristic surveys involved another two weeks’ work for at least two people per region.
Some components (e.g. vegetation structure, bird and reptile surveys, seed predation) dominated the field time per site, but provided data that could be directly analysed.
Others (e.g. arthropod pitfall and litter extraction, flora surveys, decomposition) involved less field time but required further laboratory work to generate useful information. For arthropods, the most useful data may require a fine level (genus or morphospecies) of taxonomic identification, that involves skill, experience, and considerable laboratory time (see also Landsberg et al. 1999, Oliver et al. 1999).
Broad group Possible components* Measurement method# Per transect#
Physical structure
Vegetation architecture
Foliage cover in canopy and understorey, stem densities, by height and diameter; tree basal area
Detailed visual estimation using field structural proforma.
Various quantitative indices scored in each of five, 5.0 m radius circles, evenly spaced.
Special life forms
e.g. Vines, epiphytes, strangler figs, thorny scramblers, buttressed trees. Frequency score (field) Frequency in five, 10 m radius
circles, evenly spaced
Litter Litter depth or mass, litter type; woody debris.
Litter dried and weighed; woody debris scored in the field.
Ten 625 cm2 litter samples;occurrence score in wood diameter classes along five, 10 m lines
Soil Bulk density, particle size distribution, nutrients
Drying, sieving of field samples (retain samples)
Two bulk density samples, ten smaller samples
Biota
Vertebrates Mammals, birds, reptiles, amphibiaField transect counts (mammals, amphibia considered uneconomical)
Whole-transect searches: birds six or eight 30-minute surveys (visual and aural records); reptiles three 30-minute active diurnal searches.
Invertebrates
Arthropods (butterflies, beetles, ants, spiders, mites, crustaceans, others), annelids, molluscs, others. Specifically sampled from plants, air or soil and litter
Pitfall traps and litter extraction using Tullgren funnels; samples retained following initial sorting
Ten 5 cm diameter pitfall traps (evenly spaced) over 3 days; two 1 litre aggregations of leaf litter and upper layer of humus, from “grabs” along transect@.
Vascular plants Ferns, gymnosperms and angiosperms Field survey (frequency data)
Presence of species in canopy, mid-layer and ground, in each of five, 5.0 m radius circles (78.5 m2), evenly spaced.
Fungi/ microbes Wide variety All considered beyond available expertise
Ecological processes
PredationPredation on plant parts (seeds, seedlings, leaves), or animals (including birds’ nests)
(seedling predation trialled and abandoned)
Removal rates after 3 days of four seed types placed at 10 depots.
Decomposition Rate of decomposition of wood, cellulose
Weight loss of wood - (Pinus blocks 30 X 3 X 2 cm), breaking strength of cotton strips+ (Shirley brand).
Two large wooden blocks placed in field; ten soil samples pooled, returned to lab and incubated with cotton strips.
Movement Dispersal, feeding and other movements, migration
All considered beyond this study’s scope
Replenishment Reproduction, pollination, growth, survival, variability in population dynamics.
All considered beyond this study’s scope
* For biota, these could refer to measurements at a variety of taxonomic levels (species to Class), or to summary measurements across major taxa (e.g. taxonomic richness).# See Kanowski et al. (2003) for most structural measurements.+ Latter and Howson (1977).@ From various substrates (whose presence varied), e.g. leaf litter on the ground, beside surface roots, under logs.
Table 3. Potential response variables for measurement of biodiversity and ecological function. Components shown in bold were measured in this study; all measurements were within a 100 m X 30 m transect (see Figure 2).
Catterall et al.
Forest Fauna.indd 16/09/2004, 7:40 PM368
369Conserving Australia’s Forest Fauna
Synchrony and spatial scaling of sampling
Relatively few studies have assessed responses to environmental change by simultaneously measuring many different indicator variables across a range of sites (but see Landsberg et al. 1999, Arnold et al. 2002). Ecologists are trained to specialise in particular taxa, and rarely work in multi-skilled teams. There is also a lack of established methods for integrated sampling. Furthermore, different taxonomic groups are traditionally sampled at different spatial and temporal scales. An entomologist may sample ground-dwelling invertebrates by means of a small grid of pitfall traps, perhaps a few metres square, whereas a rainforest plant census may cover hundreds of square metres, and a bird survey plot would typically be thousands to tens of thousands of square metres. A bird survey within a very small plot would provide little, and hyper-variable data, whereas the intensive sampling of invertebrates across thousands of square metres could require hundreds of entomologists for a single site.
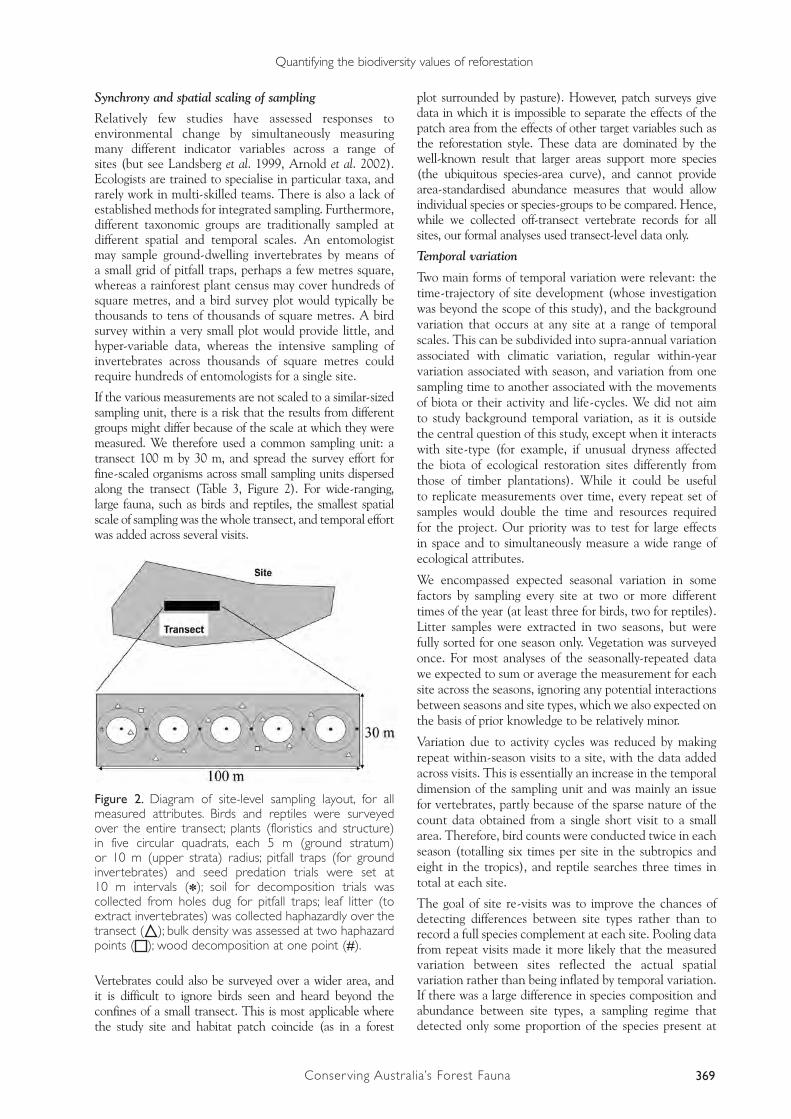
If the various measurements are not scaled to a similar-sized sampling unit, there is a risk that the results from different groups might differ because of the scale at which they were measured. We therefore used a common sampling unit: a transect 100 m by 30 m, and spread the survey effort for fine-scaled organisms across small sampling units dispersed along the transect (Table 3, Figure 2). For wide-ranging, large fauna, such as birds and reptiles, the smallest spatial scale of sampling was the whole transect, and temporal effort was added across several visits.
Vertebrates could also be surveyed over a wider area, and it is difficult to ignore birds seen and heard beyond the confines of a small transect. This is most applicable where the study site and habitat patch coincide (as in a forest
plot surrounded by pasture). However, patch surveys give data in which it is impossible to separate the effects of the patch area from the effects of other target variables such as the reforestation style. These data are dominated by the well-known result that larger areas support more species (the ubiquitous species-area curve), and cannot provide area-standardised abundance measures that would allow individual species or species-groups to be compared. Hence, while we collected off-transect vertebrate records for all sites, our formal analyses used transect-level data only.
Temporal variation
Two main forms of temporal variation were relevant: the time-trajectory of site development (whose investigation was beyond the scope of this study), and the background variation that occurs at any site at a range of temporal scales. This can be subdivided into supra-annual variation associated with climatic variation, regular within-year variation associated with season, and variation from one sampling time to another associated with the movements of biota or their activity and life-cycles. We did not aim to study background temporal variation, as it is outside the central question of this study, except when it interacts with site-type (for example, if unusual dryness affected the biota of ecological restoration sites differently from those of timber plantations). While it could be useful to replicate measurements over time, every repeat set of samples would double the time and resources required for the project. Our priority was to test for large effects in space and to simultaneously measure a wide range of ecological attributes.
We encompassed expected seasonal variation in some factors by sampling every site at two or more different times of the year (at least three for birds, two for reptiles). Litter samples were extracted in two seasons, but were fully sorted for one season only. Vegetation was surveyed once. For most analyses of the seasonally-repeated data we expected to sum or average the measurement for each site across the seasons, ignoring any potential interactions between seasons and site types, which we also expected on the basis of prior knowledge to be relatively minor.
Variation due to activity cycles was reduced by making repeat within-season visits to a site, with the data added across visits. This is essentially an increase in the temporal dimension of the sampling unit and was mainly an issue for vertebrates, partly because of the sparse nature of the count data obtained from a single short visit to a small area. Therefore, bird counts were conducted twice in each season (totalling six times per site in the subtropics and eight in the tropics), and reptile searches three times in total at each site.
The goal of site re-visits was to improve the chances of detecting differences between site types rather than to record a full species complement at each site. Pooling data from repeat visits made it more likely that the measured variation between sites reflected the actual spatial variation rather than being inflated by temporal variation. If there was a large difference in species composition and abundance between site types, a sampling regime that detected only some proportion of the species present at
Figure 2. Diagram of site-level sampling layout, for all measured attributes. Birds and reptiles were surveyed over the entire transect; plants (floristics and structure) in five circular quadrats, each 5 m (ground stratum) or 10 m (upper strata) radius; pitfall traps (for ground invertebrates) and seed predation trials were set at 10 m intervals (*); soil for decomposition trials was collected from holes dug for pitfall traps; leaf litter (to extract invertebrates) was collected haphazardly over the transect ( ); bulk density was assessed at two haphazard points ( ); wood decomposition at one point (#).
Quantifying the biodiversity values of reforestation
Forest Fauna.indd 16/09/2004, 7:40 PM369

370 Conserving Australia’s Forest Fauna
each site could still detect a difference between site types. To formally estimate the number of repeat visits that might be required to detect a specified amount of difference between site-types (with given numbers of replicate sites), would require a series of power analyses based on data acquired using different numbers of repeat visits (e.g. Oliver et al. 1999, Burgman and Lindemayer 2000), rather than the more common practice of constructing species-effort curves (e.g. Parris et al. 1999).
Selected findings and analytical perpectives Selected results from the case study are shown here to illustrate methodological issues, and to provide examples of our findings concerning the development of rainforest biodiversity values in revegetated sites. Further details will be presented elsewhere.
Our final survey design comprised seven site-types in each of the two regions (tropics and subtropics). There were two reference site-types, pasture (P, 5 sites per region) and intact rainforest tracts or remnants (R, 10); three types of young plantings (mainly around 7-10 years old, range 5-20), monospecies timber plantations (YP, 5), cabinet timber plantations (CT, 5 tropics, 10 subtropics), ecological restoration plantings (ER, 10 tropics, 9 subtropics); and two other types of re-acquired forest cover, regrowth (RG, 5; younger in the tropics than subtropics) and old (40-70 yr) monospecies plantations (OP, 10). At each site, we measured the attributes shown in Table 3, between October 2000 and December 2001.
StructureMeasurements of canopy cover, canopy height, and stem height diversity constitute a simple summary representation of forest habitat (Figure 3, see also Kanowski et al.
Figure 3. Structural attributes (mean, SE) of revegetation and reference sites in the tropics and subtropics. Site types are P pasture (5 sites per region), RG regrowth (5), YP young monospecies timber plantation (5), CT cabinet timber plantation (5 tropics, 10 subtropics), ER ecological restoration planting (10 tropics, 9 subtropics), OP old (40-70 yr) monospecies plantations (10), R intact rainforest tracts or remnants (10). Canopy cover is an estimate of projective foliage cover at 2 m above ground, mean of five estimates per site; canopy height is height of tallest vegetation, mean of five estimates per site; vertical diversity of stems is Shannon-Weaver diversity index (H) based on density of woody stems > 2.5 cm dbh in four height classes (2 – 5 m, 5 – 10 m, 10 – 20 m, > 20 m) in five 78 m2 quadrats per site. ANOVA P< 0.001 for each dataset. Superscripts represent site types different at P < 0.05 (Tukey test).
Catterall et al.
Forest Fauna.indd 16/09/2004, 7:40 PM370

371Conserving Australia’s Forest Fauna
2003, Tucker et al. 2004), with pasture and forest sites setting the extremes of structural difference. Canopy cover was low in young (tropical) regrowth and timber plantations, moderate to high in restoration plantings, old (subtropical) regrowth and old plantations, and high in intact rainforest. In terms of vertical structure, young revegetated sites were not only lower in stature than intact forest, but also tended to be less complex in the height distributions of trees and shrubs. While the trees in all young planted site-types had grown to around 10-15 m in the decade or so since planting, the ecological restoration sites generally achieved greater canopy closure and stem height diversities than similar-aged timber plantings. This is a consequence of higher establishment densities and less understorey suppression (through herbicides, grazing, slashing; see Table 1) at the ecological restoration sites.
The greatest differences between regions occurred in the regrowth and old plantation sites. The younger scrambler-dominated regrowth of the tropics had a much lower canopy cover, lower height, and less vertical layering than the older regrowth of the subtropics. Old timber plantations in the tropics were similar to intact forest in many structural attributes, largely because the plantations had recruited a well-developed rainforest understorey. However, old plantations in the subtropics had a lower canopy cover and stem height diversity; probably because they had been subject to more intensive management, and perhaps in part because they were located in drier areas.
BiotaThe taxa for which we had greatest taxonomic resolution were birds, reptiles, mites, ants and vascular plants. Birds, reptiles and vascular plants were identified wherever possible to species. Mites were identified to the finest taxonomic level
of resolution practical (some to suborder, others to family or genus; because of taxonomic difficulties, oribatid mites were not identified). Also, the mite superfamilies Uropodoidea and Trombidioidea could not readily be grouped into families, but their morphological variety allowed them to be classified into morphotaxa. Ants were identified to genus, and to species for some genera.
The simplest form of biodiversity measurement (taxon richness) for birds and mites is shown in Figure 4. There were background differences in bird species richness between the tropics and subtropics, which are partly attributable to survey effort (higher in tropics), but may also reflect differences in the regional bird fauna (more diverse in the tropics). In both tropics and subtropics, bird species richness increased from pasture to forest, with revegetated sites intermediate in richness. In contrast, mite taxon richness in pasture resembled that in forest.
However, the taxon richness did not vary greatly between the different site-types for either birds or mites (Figure 4), indicating that the dramatic changes in the quality and quantity of forest cover were not accompanied by large responses in taxon richness. This may occur because different forms of land cover (even the structurally simple pasture) support functionally different sets of species; the species present in one site-type may be replaced by a different suite of species in another site-type, while the species richness remains much the same. To overcome this problem requires finer-level analyses that discriminate species’ identities. We approached this in three ways: (1) by partitioning the total species richness into that attributable to different functional groups; (2) through multivariate analyses that assess patterns in the relative similarity of sites in relation to the biotic assemblages they support; and (3) by analysing each species’ response pattern individually.
Figure 4. Bird species richness and mite taxon richness (mean, SE) in revegetation and reference sites in the tropics and subtropics. Bird data were collected from six (subtropics) or eight (tropics) 30 minute surveys of a 100 x 30 m transect per site. Mites (identified to mainly to Family, some to Genus or Suborder) were extracted from 2l leaf litter collected in the wet season (subtropics) and dry season (tropics) from each site. Site-type abbreviations as in Fig. 3. ANOVA P value shown for each dataset. Superscripts represent site types different at P < 0.05 (Tukey test).
Quantifying the biodiversity values of reforestation
Forest Fauna.indd 16/09/2004, 7:40 PM371
372 Conserving Australia’s Forest Fauna
The allocation of species to functional groups requires background knowledge of their ecology, and among our study taxa this knowledge is best for birds. On the basis of independent literature accounts (Kikkawa 1968, 1991, Crome et al. 1994, supplemented by a variety of other sources), we allocated bird species to functional “habitat groups” according to their preference for different types of intact vegetation cover in uncleared landscapes. Here we use three categories: “rainforest” birds (largely confined to, or apparently dependent on, rainforest, although may also occur in non-rainforest habitat); “other forest” birds (regularly found across a variety of forested habitats from rainforest to eucalypt woodlands, some being largely confined to eucalypt assemblages); and “grassland/wetland” birds (found mainly in grassland, pasture, swamps, or unforested streams, sometimes in lightly timbered areas; includes aerial species).
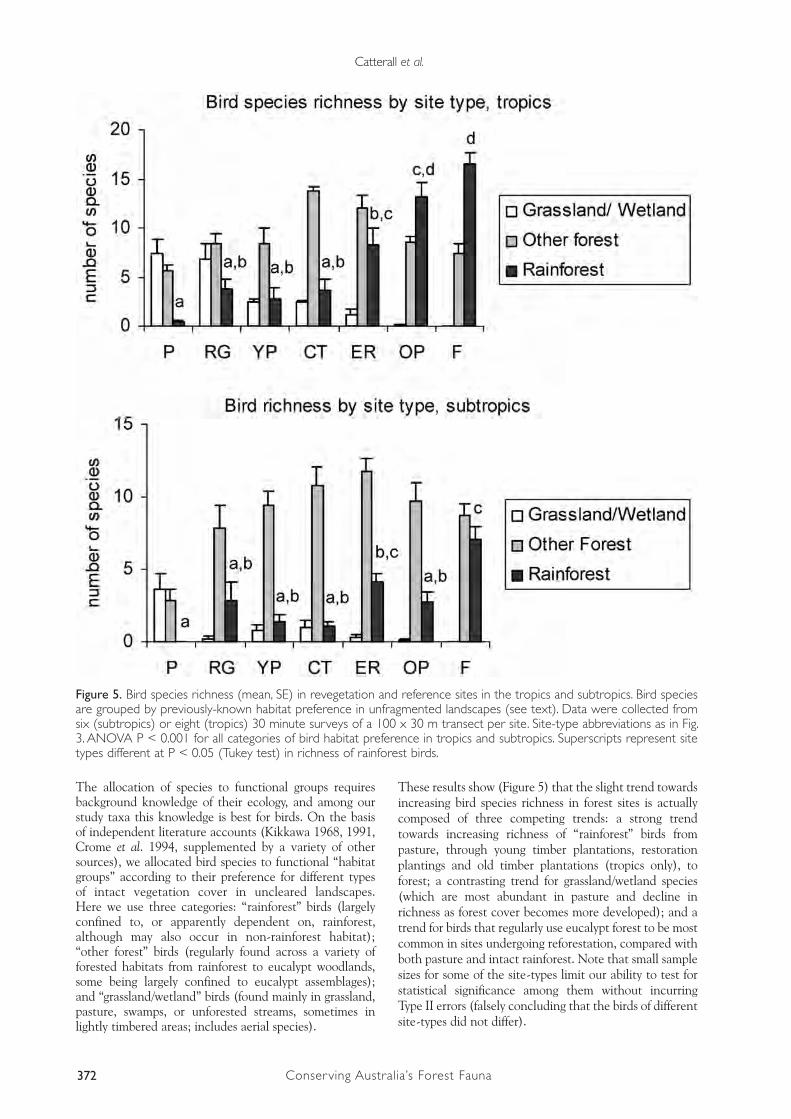
These results show (Figure 5) that the slight trend towards increasing bird species richness in forest sites is actually composed of three competing trends: a strong trend towards increasing richness of “rainforest” birds from pasture, through young timber plantations, restoration plantings and old timber plantations (tropics only), to forest; a contrasting trend for grassland/wetland species (which are most abundant in pasture and decline in richness as forest cover becomes more developed); and a trend for birds that regularly use eucalypt forest to be most common in sites undergoing reforestation, compared with both pasture and intact rainforest. Note that small sample sizes for some of the site-types limit our ability to test for statistical significance among them without incurring Type II errors (falsely concluding that the birds of different site-types did not differ).
Figure 5. Bird species richness (mean, SE) in revegetation and reference sites in the tropics and subtropics. Bird species are grouped by previously-known habitat preference in unfragmented landscapes (see text). Data were collected from six (subtropics) or eight (tropics) 30 minute surveys of a 100 x 30 m transect per site. Site-type abbreviations as in Fig. 3. ANOVA P < 0.001 for all categories of bird habitat preference in tropics and subtropics. Superscripts represent site types different at P < 0.05 (Tukey test) in richness of rainforest birds.
Catterall et al.
Forest Fauna.indd 16/09/2004, 7:40 PM372
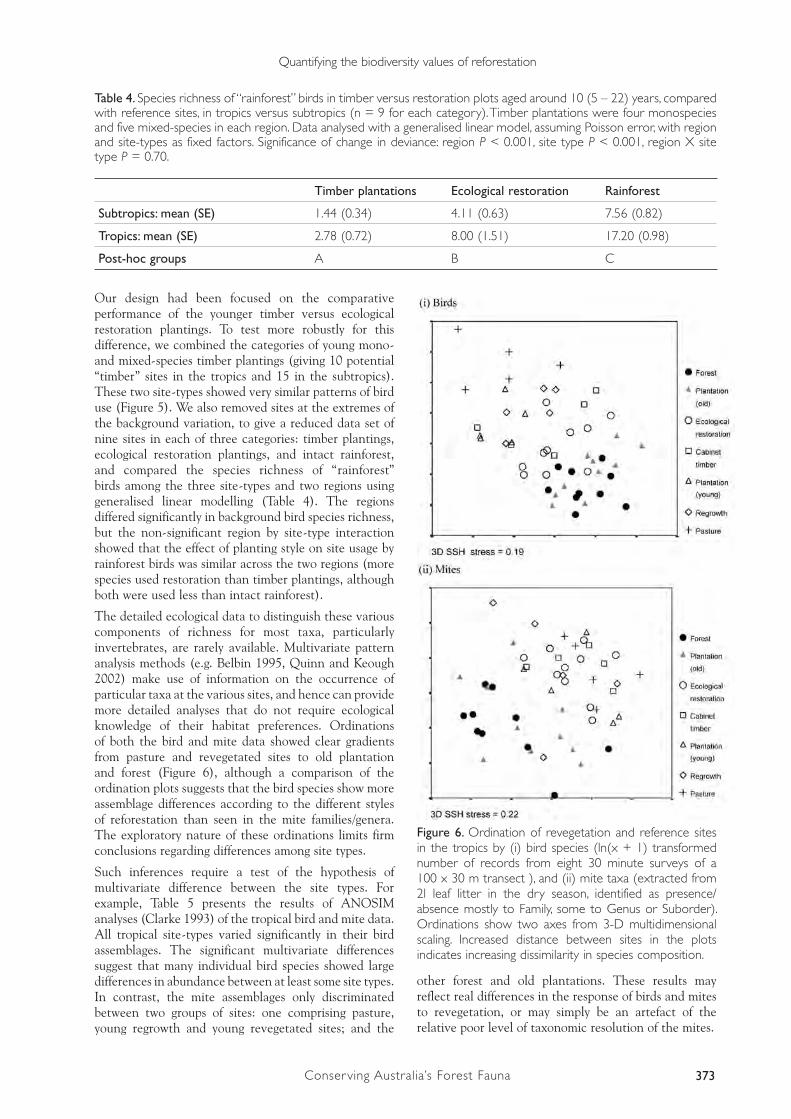
373Conserving Australia’s Forest Fauna
Our design had been focused on the comparative performance of the younger timber versus ecological restoration plantings. To test more robustly for this difference, we combined the categories of young mono- and mixed-species timber plantings (giving 10 potential “timber” sites in the tropics and 15 in the subtropics). These two site-types showed very similar patterns of bird use (Figure 5). We also removed sites at the extremes of the background variation, to give a reduced data set of nine sites in each of three categories: timber plantings, ecological restoration plantings, and intact rainforest, and compared the species richness of “rainforest” birds among the three site-types and two regions using generalised linear modelling (Table 4). The regions differed significantly in background bird species richness, but the non-significant region by site-type interaction showed that the effect of planting style on site usage by rainforest birds was similar across the two regions (more species used restoration than timber plantings, although both were used less than intact rainforest).
The detailed ecological data to distinguish these various components of richness for most taxa, particularly invertebrates, are rarely available. Multivariate pattern analysis methods (e.g. Belbin 1995, Quinn and Keough 2002) make use of information on the occurrence of particular taxa at the various sites, and hence can provide more detailed analyses that do not require ecological knowledge of their habitat preferences. Ordinations of both the bird and mite data showed clear gradients from pasture and revegetated sites to old plantation and forest (Figure 6), although a comparison of the ordination plots suggests that the bird species show more assemblage differences according to the different styles of reforestation than seen in the mite families/genera. The exploratory nature of these ordinations limits firm conclusions regarding differences among site types.
Such inferences require a test of the hypothesis of multivariate difference between the site types. For example, Table 5 presents the results of ANOSIM analyses (Clarke 1993) of the tropical bird and mite data. All tropical site-types varied significantly in their bird assemblages. The significant multivariate differences suggest that many individual bird species showed large differences in abundance between at least some site types. In contrast, the mite assemblages only discriminated between two groups of sites: one comprising pasture, young regrowth and young revegetated sites; and the
other forest and old plantations. These results may reflect real differences in the response of birds and mites to revegetation, or may simply be an artefact of the relative poor level of taxonomic resolution of the mites.
Timber plantations Ecological restoration Rainforest
Subtropics: mean (SE) 1.44 (0.34) 4.11 (0.63) 7.56 (0.82)
Tropics: mean (SE) 2.78 (0.72) 8.00 (1.51) 17.20 (0.98)
Post-hoc groups A B C
Table 4. Species richness of “rainforest” birds in timber versus restoration plots aged around 10 (5 – 22) years, compared with reference sites, in tropics versus subtropics (n = 9 for each category). Timber plantations were four monospecies and five mixed-species in each region. Data analysed with a generalised linear model, assuming Poisson error, with region and site-types as fixed factors. Significance of change in deviance: region P < 0.001, site type P < 0.001, region X site type P = 0.70.
Figure 6. Ordination of revegetation and reference sites in the tropics by (i) bird species (ln(x + 1) transformed number of records from eight 30 minute surveys of a 100 x 30 m transect ), and (ii) mite taxa (extracted from 2l leaf litter in the dry season, identified as presence/absence mostly to Family, some to Genus or Suborder). Ordinations show two axes from 3-D multidimensional scaling. Increased distance between sites in the plots indicates increasing dissimilarity in species composition.
Quantifying the biodiversity values of reforestation
Forest Fauna.indd 16/09/2004, 7:40 PM373

374 Conserving Australia’s Forest Fauna
Figures 7 and 8 show how the abundance of selected bird and reptile species varied among site types. Figure 7 shows “rainforest” species, while species in Figure 8 are those known to occur in both rainforest and eucalypt forest. Some individual “rainforest” birds (such as the wompoo fruit-dove, green catbird, Macleay’s honeyeater and Bower’s shrike-thrush) were clearly dependent on advanced rainforest growth, being more common in rainforests than in the old plantations, and mostly absent from other sites. Other “rainforest” species (such as the large-billed scrubwren) were less specialised. The Australian magpie (tropics) and willy wagtail (subtropics) are examples of “grassland/wetland” species, most common in pasture. Species that occur naturally in both rainforest and eucalypt forest also tended to be common across a range of reforestation styles (e.g. silvereye, Lewin’s honeyeater). The noisy miner and white-throated gerygone are both typically restricted to eucalypt forest, and were recorded mainly in mixed-species timber plantings (which often included some eucalypts).
Among reptiles, the tropical prickly forest skink seems to be a clear “forest indicator”. In undisturbed landscapes, this species is restricted to rainforest, and lives mainly beneath rocks and logs in areas that have abundant leaf litter (Sumner et al. 1999). Members of the genus Eulamprus showed a similar pattern. Individuals identified to species were mainly E. tigrinus in the tropics and were all E. murrayi in the subtropics, and these species are also considered rainforest specialists in undisturbed areas (Covacevitch and McDonald 1991). Both were commonly recorded on the trunks of trees, especially associated with strangler figs (whose braided trunks provided retreat sites), and hence the simpler plant species composition of the old plantations provided them with poor habitat. Examples of reptile species that, in undisturbed landscapes, occur both in rainforest and eucalypt forest, are Lampropholis skinks
in the subtropics, most of which were L. delicata, and Carlia skinks in the tropics (mainly C. rubrigularis); in our study these species were more common in the younger reforested sites.
Figure 9 shows response patterns for selected ground-dwelling insect taxa caught in pitfall traps. Most orders showed a pattern of generally higher (e.g. Orthoptera) or lower (e.g. Coleoptera, Amphipoda) abundance in pasture, compared with all types of forest cover. Amphipods are soft-bodied and moisture-dependent, and their low numbers in subtropical YP and OP sites are probably a consequence of these sites being in more seasonally dry areas. Ants tended to be more abundant in site-types with a more open canopy, and this pattern was also seen in some morphospecies (e.g. Prolasius sp. 1, Figure 9). Stronger patterns may appear if other invertebrates are identified to finer levels. Preliminary investigation of the mite data suggests that there appear to be some “rainforest” taxa (e.g. superfamilies Trombidioidea and Uropodoidea). It is also possible that many ground invertebrates respond to local microhabitat more strongly than to forest cover.
Relationships among ecosystem componentsA key question in ecological assessment and monitoring is the extent to which different taxa or attributes are concordant in their pattern of response to such factors as the controlling variables in our study (Figure 1). Answering this question is complicated by the many ways in which data from a survey and monitoring program may be derived and treated (see above). We used two forms of correlation analysis to test for concordance among attributes (see also Proctor et al. 2003). First, simple taxon richness estimates for plants, birds, and invertebrate orders were compared with one another, and with structural attributes such as the stem height diversity index, using Pearson’s correlation coefficients (Table 6). These showed a moderate ability for
(i) Birds Pasture (5) Regrowth Young plantation
Cabinet timber
Ecological restoration
Old plantation
Regrowth (5) 0.018Young plantation (5) 0.007 0.007Cabinet timber (5) 0.006 0.049 0.007Ecological restoration (10) 0.001 0.004 0.000 0.013Old plantation (10) 0.000 0.000 0.002 0.002 0.000Forest (10) 0.000 0.000 0.000 0.000 0.000 0.010
(ii) Mites Pasture Regrowth Young plantation
Cabinet timber
Ecological restoration
Old plantation
Regrowth 0.093Young plantation 0.053 0.112Cabinet timber 0.328 0.108 0.448Ecological restoration 0.119 0.001 0.006 0.265Old plantation 0.034 0.039 0.045 0.018 0.000Forest 0.004 0.002 0.050 0.024 0.000 0.364
Table 5. Pair-wise ANOSIM results (P values < 0.05 bold), indicating assemblage differences among revegetation and reference sites in the tropics, for (i) bird species (ln(x + 1) transformed no. of records from eight 30 minute surveys,, and (ii) mite taxa (extracted from 2l leaf litter in the dry season, identified as presence/absence mostly to Family, some to Genus or Suborder). Bracketed numbers are sample sizes. Global ANOSIM for both data sets gave P < 0.001.
Catterall et al.
Forest Fauna.indd 16/09/2004, 7:40 PM374

375Conserving Australia’s Forest Fauna
Figure 7. Occurrence (mean, SE) in reference and revegetated sites, of selected “rainforest” vertebrate species (5 bird, 3 reptile, rarely found in eucalypt forests). Frequency is the number of times a bird species was encountered during six 30-minute surveys of a 100 x 30 m transect (tropics data are numbers from eight surveys X 0.75). Abundance is the number of reptile individuals encountered during three, 30 minute searches).
Quantifying the biodiversity values of reforestation
Forest Fauna.indd 16/09/2004, 7:40 PM375
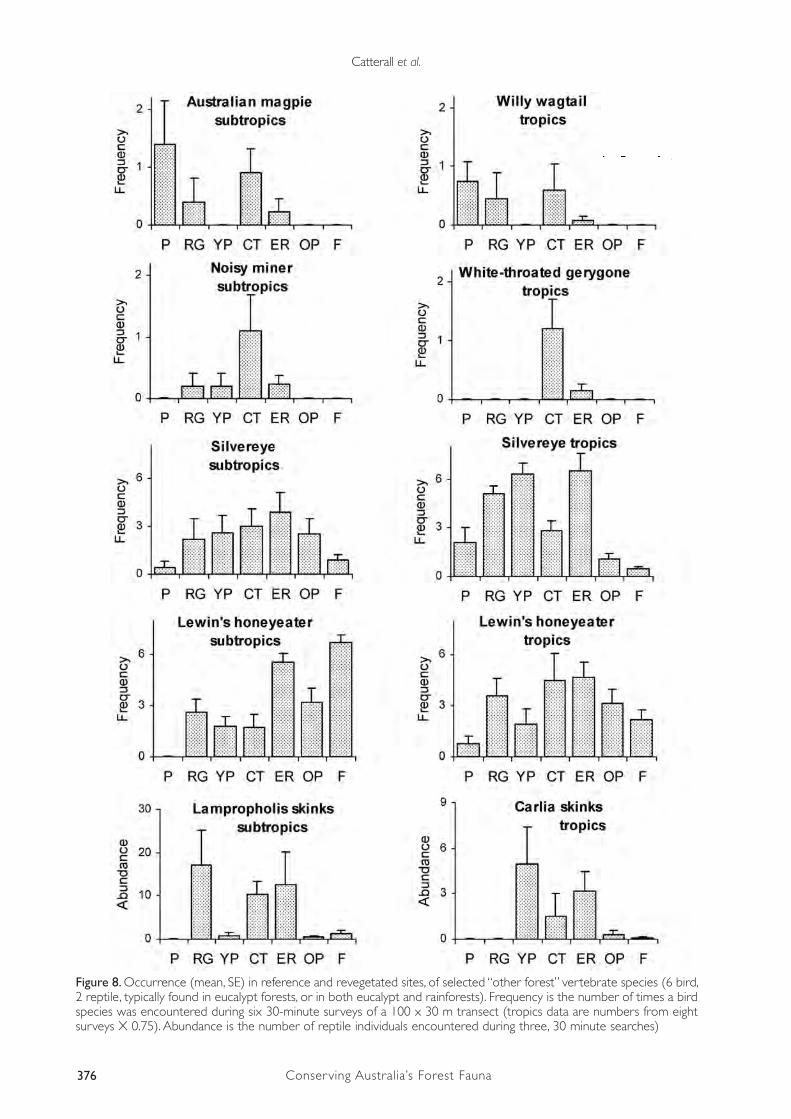
376 Conserving Australia’s Forest Fauna
Figure 8. Occurrence (mean, SE) in reference and revegetated sites, of selected “other forest” vertebrate species (6 bird, 2 reptile, typically found in eucalypt forests, or in both eucalypt and rainforests). Frequency is the number of times a bird species was encountered during six 30-minute surveys of a 100 x 30 m transect (tropics data are numbers from eight surveys X 0.75). Abundance is the number of reptile individuals encountered during three, 30 minute searches)
Catterall et al.
Forest Fauna.indd 16/09/2004, 7:40 PM376

377Conserving Australia’s Forest Fauna
Figure 9. Occurrence (mean, SE) in reference and revegetated sites, of selected invertebrate taxa. Frequency is the number of pitfall traps in which a taxon was recorded (5 cm diameter, 10 traps set for three days along 100 m). Abundance is the number of individuals recorded from all 10 traps.
Quantifying the biodiversity values of reforestation
Forest Fauna.indd 16/09/2004, 7:40 PM377

378 Conserving Australia’s Forest Fauna
bird species richness, plant species richness, and vegetation structure to predict each other (r values of 0.5-0.7 indicate that one variable can predict 25%-49% of the variation in the other). However, there was no relationship between these attributes and invertebrate diversity at the taxonomic scale of invertebrate order.
These richness measures overlook much meaningful biotic variation. Therefore, we used a second form of correlation analyses (Mantel tests) to assess the agreement between attributes (birds, invertebrates, plants, structure) of the measured similarity in composition across all possible site-pairs. When the specific component taxa within each broad group were considered, the level of concordance between the invertebrates and others was improved (Table 6). This agreement is driven to some extent by the extreme differences between pasture and intact
forest. When the same analyses were performed using only the young replanted sites (timber and restoration), the strength of the correlation was greatly reduced for the analyses based on simple species richness, while generally remaining significant for similarity in composition.
Ecological processesOne of the few ecological processes examined in the project was the rate of cellulose decomposition in soil. To survey this process we used a standard method (cotton strip assay), developed mostly for agricultural purposes (e.g. Latter and Howson 1977). Cotton strips were buried in moist soil, and incubated at 25oC for 2 weeks. The soil was collected in the wet season, from both tropical and subtropical sites. Decomposition was measured as the loss of breaking strength in the cotton strips after exposure to the soil, relative to unexposed controls.
(i) All sites: Pearson correlations Plant species richness Bird species richness Invertebrate order richness
Bird species richness
0.50< 0.001
Invertebrate Order richness
0.270.055
0.100.49
Vertical diversity of woody stems*
0.71< 0.001
0.55< 0.001
0.190.20
*Shannon-Weaver diversity of woody stems based on their sampled frequency of occurrence in four height classes: 2 – 5 m, 5 – 10 m, 10 – 20 m, > 20 m
(ii) All sites: Mantel correlations Plant species Bird species Invertebrate orders
Bird species 0.66< 0.001
Invertebrate Orders
0.30< 0.001
0.38< 0.001
Forest structure+ 0.67< 0.001
0.51< 0.001
0.29< 0.001
+ based on 25 variables present at two or more sites
(iii) Young planted sites:Pearson correlations Plant species richness Bird species richness Invertebrate order
richnessBird speciesrichness
0.500.026
Invertebrate Order richness
0.0640.79
0.0530.82
Vertical diversity of woody stems*
0.430.057
0.340.15
-0.260.27
*Shannon-Weaver diversity of woody stems based on their sampled frequency of occurrence in four height classes: 2 – 5 m, 5 – 10 m, 10 – 20 m, > 20 m
(iv) Young planted sites: Mantel correlations Plant species Bird species Invertebrate Orders
Bird species 0.66< 0.001
Invertebrate Orders 0.160.011
0.180.007
Forest structure+ 0.56< 0.001
0.27< 0.001
0.0690.18
+ based on 19 variables present at two or more sites
Table 6. Correlations (r upper; P lower, < 0.05 bolded) between selected attributes of 50 revegetation and reference sites in the tropics. (i) Univariate correlations between species richness of plants (sampled across canopy, midstorey and ground layers), birds and invertebrate Orders (plus Family Formicidae separated from other Hymenoptera), and an index of structural complexity; (ii) Mantel correlations (between site-pairs) of assemblage dissimilarities. (iii, iv) as for (i) and (ii), but across 20 young (5 – 20 years) timber and ecological restoration plantings.
Catterall et al.
Forest Fauna.indd 16/09/2004, 7:40 PM378
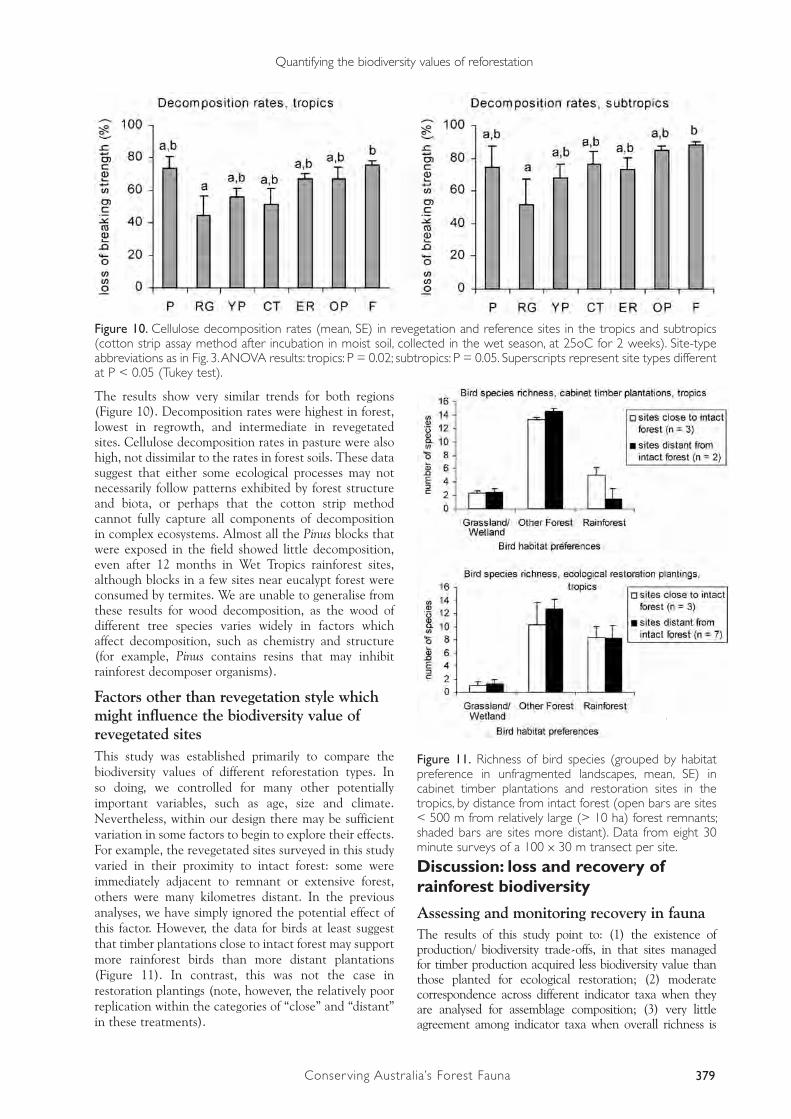
379Conserving Australia’s Forest Fauna
The results show very similar trends for both regions (Figure 10). Decomposition rates were highest in forest, lowest in regrowth, and intermediate in revegetated sites. Cellulose decomposition rates in pasture were also high, not dissimilar to the rates in forest soils. These data suggest that either some ecological processes may not necessarily follow patterns exhibited by forest structure and biota, or perhaps that the cotton strip method cannot fully capture all components of decomposition in complex ecosystems. Almost all the Pinus blocks that were exposed in the field showed little decomposition, even after 12 months in Wet Tropics rainforest sites, although blocks in a few sites near eucalypt forest were consumed by termites. We are unable to generalise from these results for wood decomposition, as the wood of different tree species varies widely in factors which affect decomposition, such as chemistry and structure (for example, Pinus contains resins that may inhibit rainforest decomposer organisms).
Factors other than revegetation style which might influence the biodiversity value of revegetated sitesThis study was established primarily to compare the biodiversity values of different reforestation types. In so doing, we controlled for many other potentially important variables, such as age, size and climate. Nevertheless, within our design there may be sufficient variation in some factors to begin to explore their effects. For example, the revegetated sites surveyed in this study varied in their proximity to intact forest: some were immediately adjacent to remnant or extensive forest, others were many kilometres distant. In the previous analyses, we have simply ignored the potential effect of this factor. However, the data for birds at least suggest that timber plantations close to intact forest may support more rainforest birds than more distant plantations (Figure 11). In contrast, this was not the case in restoration plantings (note, however, the relatively poor replication within the categories of “close” and “distant” in these treatments).
Discussion: loss and recovery of rainforest biodiversity
Assessing and monitoring recovery in faunaThe results of this study point to: (1) the existence of production/ biodiversity trade-offs, in that sites managed for timber production acquired less biodiversity value than those planted for ecological restoration; (2) moderate correspondence across different indicator taxa when they are analysed for assemblage composition; (3) very little agreement among indicator taxa when overall richness is
Figure 10. Cellulose decomposition rates (mean, SE) in revegetation and reference sites in the tropics and subtropics (cotton strip assay method after incubation in moist soil, collected in the wet season, at 25oC for 2 weeks). Site-type abbreviations as in Fig. 3. ANOVA results: tropics: P = 0.02; subtropics: P = 0.05. Superscripts represent site types different at P < 0.05 (Tukey test).
Figure 11. Richness of bird species (grouped by habitat preference in unfragmented landscapes, mean, SE) in cabinet timber plantations and restoration sites in the tropics, by distance from intact forest (open bars are sites < 500 m from relatively large (> 10 ha) forest remnants; shaded bars are sites more distant). Data from eight 30 minute surveys of a 100 x 30 m transect per site.
Quantifying the biodiversity values of reforestation
Forest Fauna.indd 16/09/2004, 7:40 PM379
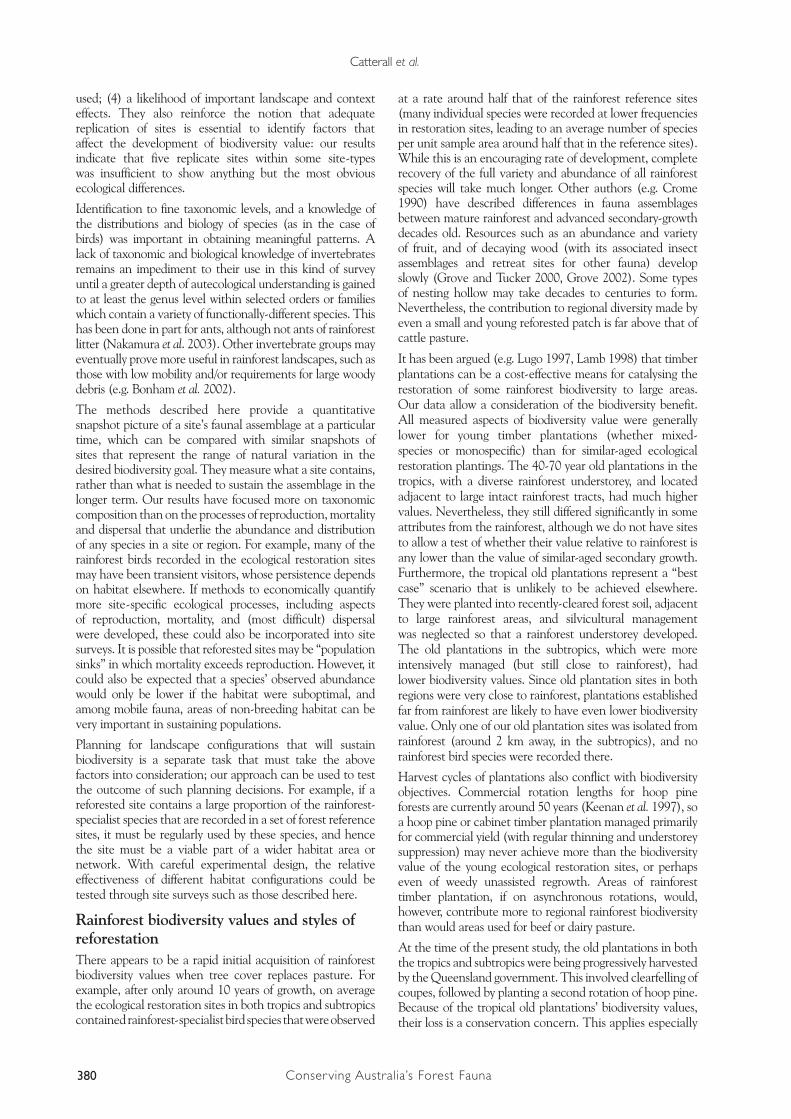
380 Conserving Australia’s Forest Fauna
used; (4) a likelihood of important landscape and context effects. They also reinforce the notion that adequate replication of sites is essential to identify factors that affect the development of biodiversity value: our results indicate that five replicate sites within some site-types was insufficient to show anything but the most obvious ecological differences.
Identification to fine taxonomic levels, and a knowledge of the distributions and biology of species (as in the case of birds) was important in obtaining meaningful patterns. A lack of taxonomic and biological knowledge of invertebrates remains an impediment to their use in this kind of survey until a greater depth of autecological understanding is gained to at least the genus level within selected orders or families which contain a variety of functionally-different species. This has been done in part for ants, although not ants of rainforest litter (Nakamura et al. 2003). Other invertebrate groups may eventually prove more useful in rainforest landscapes, such as those with low mobility and/or requirements for large woody debris (e.g. Bonham et al. 2002).
The methods described here provide a quantitative snapshot picture of a site’s faunal assemblage at a particular time, which can be compared with similar snapshots of sites that represent the range of natural variation in the desired biodiversity goal. They measure what a site contains, rather than what is needed to sustain the assemblage in the longer term. Our results have focused more on taxonomic composition than on the processes of reproduction, mortality and dispersal that underlie the abundance and distribution of any species in a site or region. For example, many of the rainforest birds recorded in the ecological restoration sites may have been transient visitors, whose persistence depends on habitat elsewhere. If methods to economically quantify more site-specific ecological processes, including aspects of reproduction, mortality, and (most difficult) dispersal were developed, these could also be incorporated into site surveys. It is possible that reforested sites may be “population sinks” in which mortality exceeds reproduction. However, it could also be expected that a species’ observed abundance would only be lower if the habitat were suboptimal, and among mobile fauna, areas of non-breeding habitat can be very important in sustaining populations.
Planning for landscape configurations that will sustain biodiversity is a separate task that must take the above factors into consideration; our approach can be used to test the outcome of such planning decisions. For example, if a reforested site contains a large proportion of the rainforest-specialist species that are recorded in a set of forest reference sites, it must be regularly used by these species, and hence the site must be a viable part of a wider habitat area or network. With careful experimental design, the relative effectiveness of different habitat configurations could be tested through site surveys such as those described here.
Rainforest biodiversity values and styles of reforestationThere appears to be a rapid initial acquisition of rainforest biodiversity values when tree cover replaces pasture. For example, after only around 10 years of growth, on average the ecological restoration sites in both tropics and subtropics contained rainforest-specialist bird species that were observed
at a rate around half that of the rainforest reference sites (many individual species were recorded at lower frequencies in restoration sites, leading to an average number of species per unit sample area around half that in the reference sites). While this is an encouraging rate of development, complete recovery of the full variety and abundance of all rainforest species will take much longer. Other authors (e.g. Crome 1990) have described differences in fauna assemblages between mature rainforest and advanced secondary-growth decades old. Resources such as an abundance and variety of fruit, and of decaying wood (with its associated insect assemblages and retreat sites for other fauna) develop slowly (Grove and Tucker 2000, Grove 2002). Some types of nesting hollow may take decades to centuries to form. Nevertheless, the contribution to regional diversity made by even a small and young reforested patch is far above that of cattle pasture.
It has been argued (e.g. Lugo 1997, Lamb 1998) that timber plantations can be a cost-effective means for catalysing the restoration of some rainforest biodiversity to large areas. Our data allow a consideration of the biodiversity benefit. All measured aspects of biodiversity value were generally lower for young timber plantations (whether mixed-species or monospecific) than for similar-aged ecological restoration plantings. The 40-70 year old plantations in the tropics, with a diverse rainforest understorey, and located adjacent to large intact rainforest tracts, had much higher values. Nevertheless, they still differed significantly in some attributes from the rainforest, although we do not have sites to allow a test of whether their value relative to rainforest is any lower than the value of similar-aged secondary growth. Furthermore, the tropical old plantations represent a “best case” scenario that is unlikely to be achieved elsewhere. They were planted into recently-cleared forest soil, adjacent to large rainforest areas, and silvicultural management was neglected so that a rainforest understorey developed. The old plantations in the subtropics, which were more intensively managed (but still close to rainforest), had lower biodiversity values. Since old plantation sites in both regions were very close to rainforest, plantations established far from rainforest are likely to have even lower biodiversity value. Only one of our old plantation sites was isolated from rainforest (around 2 km away, in the subtropics), and no rainforest bird species were recorded there.
Harvest cycles of plantations also conflict with biodiversity objectives. Commercial rotation lengths for hoop pine forests are currently around 50 years (Keenan et al. 1997), so a hoop pine or cabinet timber plantation managed primarily for commercial yield (with regular thinning and understorey suppression) may never achieve more than the biodiversity value of the young ecological restoration sites, or perhaps even of weedy unassisted regrowth. Areas of rainforest timber plantation, if on asynchronous rotations, would, however, contribute more to regional rainforest biodiversity than would areas used for beef or dairy pasture.
At the time of the present study, the old plantations in both the tropics and subtropics were being progressively harvested by the Queensland government. This involved clearfelling of coupes, followed by planting a second rotation of hoop pine. Because of the tropical old plantations’ biodiversity values, their loss is a conservation concern. This applies especially
Catterall et al.
Forest Fauna.indd 16/09/2004, 7:40 PM380
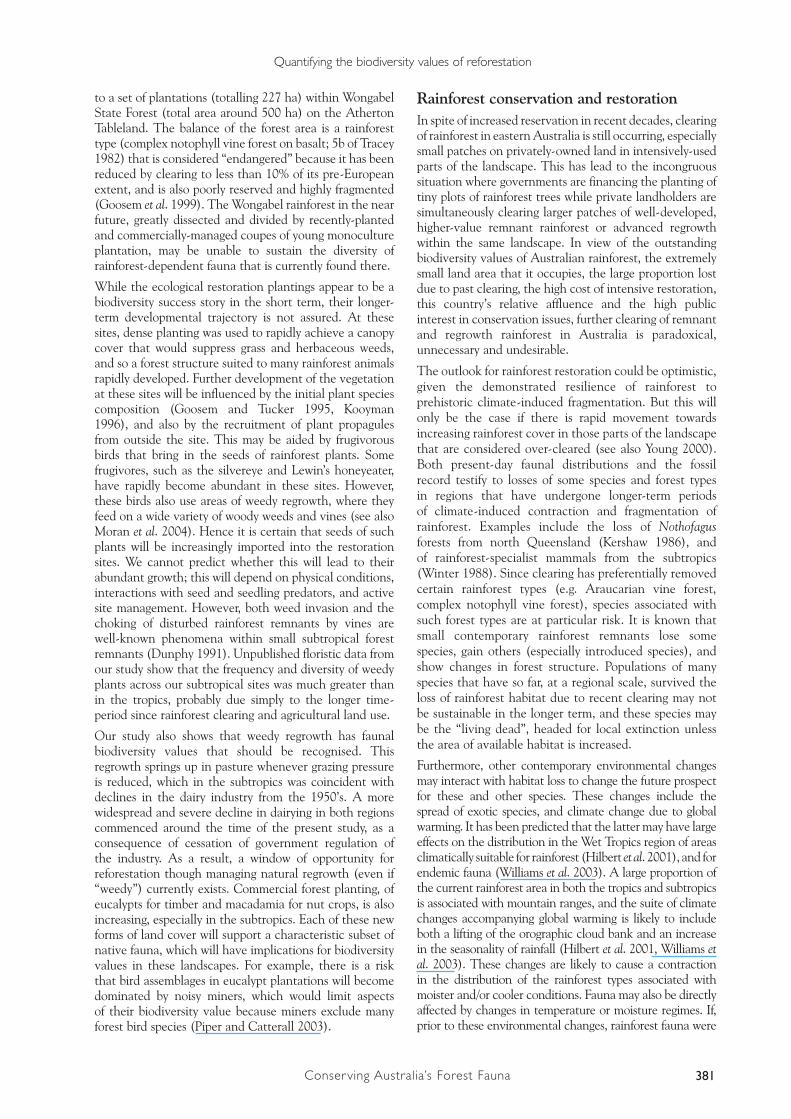
381Conserving Australia’s Forest Fauna
to a set of plantations (totalling 227 ha) within Wongabel State Forest (total area around 500 ha) on the Atherton Tableland. The balance of the forest area is a rainforest type (complex notophyll vine forest on basalt; 5b of Tracey 1982) that is considered “endangered” because it has been reduced by clearing to less than 10% of its pre-European extent, and is also poorly reserved and highly fragmented (Goosem et al. 1999). The Wongabel rainforest in the near future, greatly dissected and divided by recently-planted and commercially-managed coupes of young monoculture plantation, may be unable to sustain the diversity of rainforest-dependent fauna that is currently found there.
While the ecological restoration plantings appear to be a biodiversity success story in the short term, their longer-term developmental trajectory is not assured. At these sites, dense planting was used to rapidly achieve a canopy cover that would suppress grass and herbaceous weeds, and so a forest structure suited to many rainforest animals rapidly developed. Further development of the vegetation at these sites will be influenced by the initial plant species composition (Goosem and Tucker 1995, Kooyman 1996), and also by the recruitment of plant propagules from outside the site. This may be aided by frugivorous birds that bring in the seeds of rainforest plants. Some frugivores, such as the silvereye and Lewin’s honeyeater, have rapidly become abundant in these sites. However, these birds also use areas of weedy regrowth, where they feed on a wide variety of woody weeds and vines (see also Moran et al. 2004). Hence it is certain that seeds of such plants will be increasingly imported into the restoration sites. We cannot predict whether this will lead to their abundant growth; this will depend on physical conditions, interactions with seed and seedling predators, and active site management. However, both weed invasion and the choking of disturbed rainforest remnants by vines are well-known phenomena within small subtropical forest remnants (Dunphy 1991). Unpublished floristic data from our study show that the frequency and diversity of weedy plants across our subtropical sites was much greater than in the tropics, probably due simply to the longer time-period since rainforest clearing and agricultural land use.
Our study also shows that weedy regrowth has faunal biodiversity values that should be recognised. This regrowth springs up in pasture whenever grazing pressure is reduced, which in the subtropics was coincident with declines in the dairy industry from the 1950’s. A more widespread and severe decline in dairying in both regions commenced around the time of the present study, as a consequence of cessation of government regulation of the industry. As a result, a window of opportunity for reforestation though managing natural regrowth (even if “weedy”) currently exists. Commercial forest planting, of eucalypts for timber and macadamia for nut crops, is also increasing, especially in the subtropics. Each of these new forms of land cover will support a characteristic subset of native fauna, which will have implications for biodiversity values in these landscapes. For example, there is a risk that bird assemblages in eucalypt plantations will become dominated by noisy miners, which would limit aspects of their biodiversity value because miners exclude many forest bird species (Piper and Catterall 2003).
Rainforest conservation and restorationIn spite of increased reservation in recent decades, clearing of rainforest in eastern Australia is still occurring, especially small patches on privately-owned land in intensively-used parts of the landscape. This has lead to the incongruous situation where governments are financing the planting of tiny plots of rainforest trees while private landholders are simultaneously clearing larger patches of well-developed, higher-value remnant rainforest or advanced regrowth within the same landscape. In view of the outstanding biodiversity values of Australian rainforest, the extremely small land area that it occupies, the large proportion lost due to past clearing, the high cost of intensive restoration, this country’s relative affluence and the high public interest in conservation issues, further clearing of remnant and regrowth rainforest in Australia is paradoxical, unnecessary and undesirable.
The outlook for rainforest restoration could be optimistic, given the demonstrated resilience of rainforest to prehistoric climate-induced fragmentation. But this will only be the case if there is rapid movement towards increasing rainforest cover in those parts of the landscape that are considered over-cleared (see also Young 2000). Both present-day faunal distributions and the fossil record testify to losses of some species and forest types in regions that have undergone longer-term periods of climate-induced contraction and fragmentation of rainforest. Examples include the loss of Nothofagus forests from north Queensland (Kershaw 1986), and of rainforest-specialist mammals from the subtropics (Winter 1988). Since clearing has preferentially removed certain rainforest types (e.g. Araucarian vine forest, complex notophyll vine forest), species associated with such forest types are at particular risk. It is known that small contemporary rainforest remnants lose some species, gain others (especially introduced species), and show changes in forest structure. Populations of many species that have so far, at a regional scale, survived the loss of rainforest habitat due to recent clearing may not be sustainable in the longer term, and these species may be the “living dead”, headed for local extinction unless the area of available habitat is increased.
Furthermore, other contemporary environmental changes may interact with habitat loss to change the future prospect for these and other species. These changes include the spread of exotic species, and climate change due to global warming. It has been predicted that the latter may have large effects on the distribution in the Wet Tropics region of areas climatically suitable for rainforest (Hilbert et al. 2001), and for endemic fauna (Williams et al. 2003). A large proportion of the current rainforest area in both the tropics and subtropics is associated with mountain ranges, and the suite of climate changes accompanying global warming is likely to include both a lifting of the orographic cloud bank and an increase in the seasonality of rainfall (Hilbert et al. 2001, Williams et al. 2003). These changes are likely to cause a contraction in the distribution of the rainforest types associated with moister and/or cooler conditions. Fauna may also be directly affected by changes in temperature or moisture regimes. If, prior to these environmental changes, rainforest fauna were
Quantifying the biodiversity values of reforestation
Forest Fauna.indd 16/09/2004, 7:40 PM381

382 Conserving Australia’s Forest Fauna
conserved within habitat areas at or below the minimum threshold for their long-term persistence, their likelihood of surviving the further changes would be much lower than if the area of suitable habitat had been large, well-linked, and represented in many places.
For all these reasons, conservation of rainforest biota in landscapes now occupied and used by humans requires a rapid and substantial reconversion of land cover from production (or neglect) to rainforest. There is a time window of decades available, before time-lagged declines due to past clearing/fragmentation reach a fuller extent, and before the effects of global warming and introduced species’ expansion in unforested areas are more fully manifested. However, ecological replanting is costly, timber plantations are limited in biodiversity value, and volunteer regrowth encourages introduced plants. New approaches to the cost-effective restoration of rainforest cover are needed, that deal with these problems. Better management of mixed-purpose plantations for biodiversity goals (e.g. Tucker et al. 2004) could be one component.
Another may be management of natural regrowth (e.g. Woodford 2000), which is a largely untested and potentially cost-effective means of rainforest restoration.
Careful consideration of reforestation goals is also needed. Given the large changes to landscapes, including the presence of large areas of cropland, pasture or urban development, altered local nutrient and hydrological conditions, species introductions, and climate change, future forests cannot be an exact replica of the presumed past, especially at the site level. It is inevitable that there will be some local losses, gains and recombinations of species or forest types, even with a substantial net gain in rainforest cover at the landscape scale. A shift in approach is needed, from the current government focus on supporting the selection of restoration areas by individual landholders or local groups, to the use of scientifically-informed regional and national plans and strategies to identify priority areas and goals for restoration. The challenge is to identify what is an acceptable and feasible rainforest cover (in terms of quality, quantity and configuration), that will allow productive land use while also maximising the persistence of species and ecological relationships at both site and regional scales. Obtaining government and landholder support for the reallocation (e.g. from production to rainforest) of the necessarily large area of land is a further challenge.
Acknowledgments Funding was provided by the Rehabilitation and Restoration Program of the Rainforest Cooperative Research Centre (Rainforest CRC). Thanks to Elinor Scambler for help with bird surveys, Rob Kooyman and Stephen McKenna with plant surveys, and Coral Rowston, and Romeny Lynch with database of restoration sites. Annette Ritchie, Dave Walter, and Monique Shayne helped with invertebrate sorting and identification, and Scott Piper with data analyses. Biotrack Pty Ltd sorted and identified the ants. Thanks also to people who attended a design workshop: Cath Moran, Fran Hausmann, Aki Nakamura, Tony Clarke, Angela Arthington, Roger Kitching, David Lamb, Alan House, and Amanda Snell. We are grateful to Kirsti Hudson, Mark Dunphy, Mark Heaton and Gary Sexton for help with study site location.
CSIRO at Atherton provided laboratory access during fieldwork. Thanks to Kathy King and David Wilkinson (University of New England) respectively, for advice on testing decomposition activity in soil, and for breaking cotton strips. Funding for the project was provided by the Rehabilitation & Restoration Program of the Rainforest Cooperative Research Centre. This work was conducted under the following permits: Griffith University Ethics Committee AES/07/00/aec; Qld. Parks & Wildlife Service Scientific Purposes Permit F1/000365/00/SAA; Qld Dept. of Natural Resources Permits to Collect 1564, 1613; NSW National Parks & Wildlife Service Scientific Investigation Licence A2877; State Forests of NSW Special Purposes Permit 05553. Comments from Dan Lunney, David Paton and an anonymous referee greatly improved the MS.
ReferencesAdam, P. 1994. Australian Rainforests. Oxford University Press, Oxford.
Andrén H. 1994. Effects of habitat fragmentation on birds and mammals in landscapes with different proportions of suitable habitat: a review. Oikos 71:355-366.
Archer, M., Hand, S.J., and Godthelp, H. 1991. Riversleigh. The Story of Animals in Ancient Rainforests of Inland Australia. Reed Books, Balgowlah.
Armstrong, J.K. 1993. Restoration of function or diversity? Pp. 209-214 in Nature Conservation 3: Reconstruction of Fragmented Ecosystems, edited by D.A. Saunders, R.J. Hobbs and P.R. Ehrlich. Surrey Beatty & Sons, Chipping Norton.
Arnold, G.W., Abensperg-Traun, M., Hobbs, R.J., Steven, D.E., Atkins, L., Viveen, J.J. and Gutter, D.M. 2002. Recovery of shrubland communities on abandoned farmland in southwestern Australia: soils, plants, birds and arthropods. Pacific Conservation Biology 5: 163-178.
Belbin L. 1995. PATN Users Guide and PATN Technical Reference. CSIRO Division of Wildlife and Ecology, Canberra.
Bennett, A.F., Kimber, S.L and Ryan, P.A. 2000. Revegetation and Wildlife – A Guide to Enhancing Revegetated Habitats for Wildlife Conservation in Rural Environments. Bushcare National Projects Research and Developments Program Report 2/00, Canberra.
Bentley, J.M., Catterall, C.P. and Smith, G.C. 2000. Effects of fragmentation of araucarian vine forest on small mammal communities. Conservation Biology 14: 1075-1087.
Bonham, K.J., Mesibov, R. and Bashford, R. 2002. Diversity and abundance of some ground-dwelling invertebrates in plantation vs. native forests in Tasmania, Australia. Forest Ecology and Management 158: 237-247.
Bowman, D.M.J.S. 2000. Australian Rainforests. Islands of Green in a Land of Fire. Cambridge University Press, Cambridge.
Catterall et al.
Forest Fauna.indd 16/09/2004, 7:40 PM382

383Conserving Australia’s Forest Fauna
Burgman, M.A. and Lindenmayer, D.B. 2000. Conservation Biology for the Australian Environment. Surrey Beatty & Sons, Chipping Norton.
Cairns, J., Jr. 1993. Ecological restoration: replenishing our national and global ecological capital. Pp. 193-208 in Nature Conservation 3: Reconstruction of Fragmented Ecosystems, edited by D.A. Saunders, R.J. Hobbs and P.R. Ehrlich. Surrey Beatty & Sons, Chipping Norton.
Cassells, D.S., Bonell, M., Gilmour, D.A. and Valentine, P.S.1988. Conservation and management of Australia’s tropical rainforests: local realities and global responsibilities. Pp. 313-326 in Ecology of Australia’s Wet Tropics. Proceedings of the Ecological Society of Australia, Vol. 15, edited by R.L. Kitching. Surrey Beatty & Sons, Chipping Norton.
Catterall, C.P. 2000. Wildlife biodiversity challenges for tropical rainforest plantations. Pp. 191-195 in Opportunities for the New Millenium. Proceedings of the Australian Forest Growers Biennial Conference, edited by A. Snell and S. Vise. Australian Forest Growers, Canberra.
Catterall, C.P., Kingston, M.B. and Park, K. 1997. Use of remnant forest habitat by birds during winter in subtropical Australia: patterns and processes. Pacific Conservation Biology 3: 262-74.
Catterall, C.P., Kingston, M.B., Park, K. and Sewell, S. 1998. Effects of clearing lowland eucalypt forests on a regional bird assemblage. Biological Conservation 84: 65-81.
Clarke, K.R. 1993. Non-parametric multivariate analyses of change in community structure. Journal of Ecology 18: 117-43
Cofinas, M. and Creighton, C. 2001. Australian Native Vegetation Assessment 2001. National Land and Water Resources Audit, Commonwealth of Australia, Canberra.
Covacevich, J. and McDonald, K.R. 1991. Frogs and reptiles of tropical and subtropical eastern Australian rainforests: distribution patterns and conservation. Pp. 281-309 in The Rainforest Legacy. Volume 2 - Flora and Fauna of the Rainforests, edited by G. Werren and P. Kershaw. Australian Government Publishing Service, Canberra.
Crome, F. H. J. 1990. Rainforest successions and vertebrates. Pp. 53-64 in Australian Tropical Rainforest – Science, Values, Meaning, edited by L.J. Webb and J. Kikkawa. CSIRO, Australia.
Crome, F. H. J. 1997. Researching tropical forest fragmentation: shall we keep on doing what we’re doing? Pp. 485-501 in Tropical Forest Remnants. Ecology, Management and Conservation of Fragmented Communities, edited by W.F. Laurance and R.O. Bierregaard. University of Chicago Press, Chicago.
Crome, F., Isaacs, J. and Moore, L. 1994. The utility to birds and mammals of remnant riparian vegetation and associated windbreaks in the tropical Queensland uplands. Pacific Conservation Biology 1: 328-343.
Dunphy, M. 1991. Rainforest weeds of the Big Scrub. Pp 85-93 in Rainforest Remnants, edited by S. Phillips. New South Wales National Parks and Wildlife Service, Hurstville.
Eberhardt, L.L. and Thomas, J.M. 1991. Designing environmental field studies. Ecological Monographs 6: 53-73.
Ehrenfeld, J. G. 2000. Defining the limits of restoration: the need for realistic goals. Restoration Ecology 8: 2-9.
Emtage, N.F., Harrison, S.R. and Herbohn, J.L. 2001. Landholder attitudes to and participation in farm forestry activities in sub-tropical and tropical eastern Australia. Pp.195-210 in Sustainable Farm Forestry in the Tropics, edited by S.R Harrison and J.L Herbohn. Edward Elgar, Cheltenham.
Erskine, P.D. 2002. Land clearing and forest rehabilitation in the Wet Tropics of north Queensland, Australia. Ecological Managment and Restoration 3: 136-138.
Floyd, A. 1990. Australian Rainforests in New South Wales. Volume 2. Surrey Beatty and Sons, Chipping Norton.
Frawley, K. 1991. Past rainforest management in Queensland. Pp. 85-106 in The Rainforest Legacy. Volume 3 – Rainforest History, Dynamics and Management, edited by G. Werren and P. Kershaw. Australian Government Publishing Service, Canberra.
Freebody, K. and Vize, S. 1999. Local government’s role in rainforest establishment and management in north Queensland. Pp. 198-205 in Rainforest Recovery for the New Millennium, edited by B. Boyes. World Wide Fund for Nature 1998 South-East Queensland Rainforest Recovery Conference, WWF, Sydney.
Garnett, S. (ed.) 1992. Threatened and Extinct Birds of Australia. RAOU Report No. 82, RAOU and Aust. Nat. Parks & Wildlife Service, Melbourne.
Gleed, S. 2002. A Report on the On-ground Activities by the Wet Tropics Tree Planting Scheme for the Wet Tropics Vegetation and Biodiversity Management Program (a project funded under the Natural Heritage Trust). North Queensland Afforestation Association, Cairns.
Goosem., S.P and Tucker, N.I.J. 1995. Repairing the Rainforest. Theory and Practice of Rainforest Re-establishment in North Queenslands Wet Tropics. Wet Tropics Management Authority, Cairns.
Goosem, S., Morgan, G. and Kemp, J.E. 1999. Wet Tropics. Pp. 7/1-7/23 in The Conservation Status of Queensland’s Bioregional Ecosystems, edited by P.S. Sattler and R.D. Williams. Environmental Protection Agency, Brisbane.
Green, R.H. 1979. Sampling Design and Statistical Methods for Environmental Biologists. Wiley, New York.
Grove, S. 2002. The influence of forest management history on the integrity of the saproxylic beetle fauna in an Australian lowland tropical rainforest. Biological Conservation 104: 149-171.
Grove, S.J and Tucker, N.I.J. 2000. Importance of mature timber habitat in forest management and restoration: What can insects tell us? Ecological Management and Restoration 1: 62-64.
Harrington, G.N., Freeman, A.N.D and Crome, F.H.J. 2001. The effect of fragmentation of an Australian tropical rain forest on populations and assemblages of small mammals. Journal of Tropical Ecology 17: 225-240.
Harrison, D. A., Dorrington, B. and Catterall, C. P. 2002. Wet Tropics Regional Directory of Natural Resource Management Works. Natural Resource Management Board (Wet Tropics) Inc. Innisfail, Queensland. http://www.nrmboard.org.au/regionalDirectory.html
Harrison, S.R., Herbohn, J.L., Tisdell, C.A. and D. Lamb 2001. Timber production and biodiversity trade-offs in plantation forestry. Pp. 65-76 in Sustainable Small-scale Forestry, edited by S.R. Harrison, J.L. Herbohn and K.F. Herbohn. Edward Elgar, Cheltenham.
Herbohn, K.F., Harrison, S.R. and Herbohn, J.L. 2000. Lessons from small-scale forestry initiatives in Australia: the effective integration of environmental and commercial values. Forest Ecology and Management 128: 227-240.
Hilbert, D.W., Ostendorf, B. and Hopkins, M.S. 2001. Sensitivity of tropical forests to climate change in the humid tropics of north Queensland. Austral Ecology 26: 590-603.
Hobbs, R.J. 1993. Can revegetation assist in the conservation of biodiversity in agricultural areas? Pacific Conservation Biology 1: 29-38.
Quantifying the biodiversity values of reforestation
Forest Fauna.indd 16/09/2004, 7:40 PM383

384 Conserving Australia’s Forest Fauna
Horsfall, N. and Hall, J. 1990. People and the rainforest: an archaeological perspective. Pp. 33-39 in Australian Tropical Rainforest – Science, Values, Meaning, edited by L.J. Webb and J. Kikkawa. CSIRO, Australia.
Howe, R.W., Howe, T.D. and Ford, H.A. 1981. Bird distributions on small rainforest remnants in New South Wales. Australian Wildlife Research 8: 637-651.
Jansen A. 1997. Terrestrial invertebrate community structure as an indicator of the success of a tropical rainforest restoration project. Restoration Ecology 5: 115-124.
Jones, R. and Crome, F. H. J. 1990. The biological web – plant-animal interactions in the rainforest. Pp. 74-87 in Australian Tropical Rainforest – Science, Values, Meaning, edited by L.J. Webb and J. Kikkawa. CSIRO, Australia.
Kanowski, J., Catterall, C.P., Wardell-Johnson, G.W., Proctor, H. and Reis, T. 2003. Development of forest structure on cleared rainforest land in eastern Australia under different styles of reforestation. Forest Ecology and Management 183: 265-280.
Kanowski, J., Catterall, C.P., Dennis, A.J. and Westcott, D.A. 2004. Animal - Plant Interactions in Rainforest Conservation and Restoration. Rainforest CRC, Cairns.
Keenan, R., Lamb, D., Woldring, O, Irvine, A., Jensen, R. 1997. Restoration of plant biodiversity beneath tropical tree plantations in Northern Australia. Forest Ecology and Management 99: 117-131.
Kershaw, A.P. 1986. Climatic change and aboriginal burning in north-east Australia during the last two glacial-interglacial cycles. Nature 322: 47-49.
Kikkawa, J. 1968. Ecological association of bird species and habitats in eastern Australia: similarity analysis. Journal of Animal Ecology 37: 143-165.
Kikkawa, J. 1990. Specialisation in the tropical rainforest. Pp. 67-73 in Australian Tropical Rainforest – Science, Values, Meaning, edited by L.J. Webb and J. Kikkawa. CSIRO, Australia.
Kikkawa, J. 1991. Avifauna of Australian rainforests. Pp. 187-196 in The Rainforest Legacy. Volume 2 - Flora and Fauna of the Rainforests, edited by G. Werren and P. Kershaw. Australian Government Publishing Service, Canberra.
Kikkawa, J., Webb, L.J., Dale, M.B., Monteith, G.B., Tracey, J.G. and Williams, W.T. 1981. Gradients and boundaries of monsoon forests in Australia. Pp. 39-52 in Ecological Gradients and Boundaries. Proceedings of the Ecological Society of Australia, Vol. 11, edited by M.J. Littlejohn and P.Y. Ladiges.
King J. R., Andersen A. N. and Cutter A. D. 1998. Ants as bioindicators of habitat disturbance: validation of the functional group model for Australia’s humid tropics. Biodiversity and Conservation 7: 1627-1638.
Kooyman, R.M. 1996. Growing Rainforest. Rainforest Restoration and Regeneration Recommendations for the Humid Sub-tropical Region of Northern New South Wales and South East Queensland. Greening Australia, Brisbane.
Lamb, D. 1994. Restoration of degraded forest ecosystems for nature conservation. Pp. 101-114 in Conservation Biology in Australia and Oceania, edited by C. Moritz and J. Kikkawa. Surrey Beatty & Sons, Chipping Norton.
Lamb, D. 1998. Large scale restoration of degraded tropical lands: the role of timber plantations. Restoration Ecology 6: 271-279.
Lamb, D., Parrotta, J., Keenan, R., and Tucker, N. 1997. Rejoining habitat remnants: restoring degraded rainforest lands. Pp. 366-385 in Tropical Forest Remnants. Ecology, Management and Conservation of Fragmented Communities, edited by W.F. Laurance and R.O. Bierregaard. University of Chicago Press, Chicago.
Lamb, D. Keenan, R. and Gould, K. 2001. Historical background to plantation development in the tropics: a north Queensland case study. Pp. 9–20 in Sustainable Farm Forestry in the Tropics, edited by S.R. Harrison and J.L. Herbohn. Edward Elgar, Cheltenham.
Landsberg, J., Morton, S. and James, C. 1999. A comparison of the diversity and indicator potential of arthropods, vertebrates and plants in arid rangelands across Australia. Pp. 111-120 in The Other 99%: The Conservation and Biodiversity of Invertebrates, edited by W. Ponder and D. Lunney. Transactions of the Royal Zoological Society of New South Wales, Mosman.
Latter, P.M. and Howson, G. 1977. The use of cotton strips to indicate cellulose decomposition in the field. Pedobiologia 17: 145-155.
Laurance, W.F. 1997. Responses of mammals to rainforest fragmentation in tropical Queensland: a review and synthesis. Wildlife Research 24: 603-612.
Laurance, W.F. and Bierregaard, R.O. (eds) 1997. Tropical Forest Remnants. Ecology, Management and Conservation of Fragmented Communities. University of Chicago Press, Chicago.
Lockwood, J.L. and Pimm, S.I. 1999. When does restoration succeed? Pp. 363-392 in Ecological Assembly Rules: Perspectives, Advances, Retreats, edited by E. Weiher and P. Keddy. Cambridge University Press, New York.
Lugo, A.E. 1997. The apparent paradox of reestablishing species richness on degraded lands with tree monocultures. Forest Ecology and Management 99:9-19.
McKenzie, N. L. 1991. An ecological survey of tropical rainforests in Western Australia: background and methods. Pp. 1-26 in Kimberley Rainforests, edited by N.L. McKenzie, R.B. Johnston and P.G. Kendrick. Surrey Beatty and Sons, Chipping Norton.
Mac Nally, R. and Quinn, G.P. 1998. The importance of scale in ecology. Australian Journal of Ecology 23: 1-7.
Michener, W. K. 1997. Quantitatively evaluating restoration experiments: research design, statistical analysis, and data management considerations. Restoration Ecology 5: 324-337.
Moran, C., Catterall, C.P., Green, R.J. and Olsen, M.F. 2004. Fates of feathered fruit eaters in fragmented forests. Pp. 699-712 in Conservation of Australia’s Forest Fauna (second edition), edited by D. Lunney. Royal Zoological Society of New South Wales, Mosman, NSW.
Nakamura, A., Proctor, H. and Catterall, C.P. 2003. Using soil and litter arthropods to assess the state of rainforest restoration. Ecological Management and Restoration. 4: S20-S28
Oliver, I., Dangerfield, J.M. and York, A. 1999. When and how to conduct a biodiversity assessment of terrestrial invertebrates. Pp 8-18 in The Other 99%: The Conservation and Biodiversity of Invertebrates, edited by W. Ponder and D. Lunney. Transactions of the Royal Zoological Society of New South Wales, Mosman.
Pahl, L.I., Winter, J.W. and Heinsohn, G. 1988. Variation in responses of arboreal marsupials to fragmentation of tropical rainforest in North Eastern Australia. Biological Conservation 46: 71-82.
Parker, T. V. and S. T. A. Pickett 1997. Restoration as an ecosystem process: implications of the modern ecological paradigm. Pp. 17-32 in Restoration Ecology and Sustainable Development, edited by K. M. Urbanska, N. R. Webb and P. J. Edwards. Cambridge UK, Cambridge University Press.
Parris, K. M., Norton, T. W. and Cunningham, R. B. 1999. A comparison of techniques for sampling amphibians in the forests of south-east Queensland, Australia. Herpetologica 55: 271-283.
Catterall et al.
Forest Fauna.indd 16/09/2004, 7:40 PM384

385Conserving Australia’s Forest Fauna
Piper, S.D. and Catterall, C.P. 2003. A particular case and a general pattern: hyperaggressive behaviour by one species may mediate avifaunal decreases in fragmented Australian forests. Oikos 101: 602-614.
Price, O.F., Woinarski, J.C.Z. and Robinson, D. 1999. Very large area requirements for frugivorous birds in monsoon rainforests of the Northern Territory, Australia. Biological Conservation 91: 169-180.
Proctor, H.C., Kanowski, J., Wardell-Johnson, G., Reis, T. and Catterall, C.P. 2003. Does diversity beget diversity? A comparison between plant and leaf-litter invertebrate richness from pasture to rainforest. In Proceedings of the 5th Invertebrate Biodiversity & Conservation Conference, edited by A.D. Austin, D.A. Mackay and S. Cooper. Records of the South Australian Museum, Supplementary Series. In Press.
Quinn G.P. and Keogh M.J. 2002. Experimental Design and Data Analysis for Biologists. Cambridge University Press, Cambridge.
Reay, S.D. and Norton, D.A. 1999. Assessing the success of restoration plantings in a temperate New Zealand forest. Restoration Ecology 7: 298-308.
Rowston, C. and Catterall, C.P. 2004. Habitat segregation, competition and selective deforestation: effects on the conservation of two similar Petaurus gliders. Pp. 741-47 in Conservation of Australia’s Forest Fauna (second edition), edited by D. Lunney. Royal Zoological Society of New South Wales, Mosman, NSW.
Sewell, S. and Catterall, C.P. 1998. Bushland modification and styles of urban development: their impacts on birds in south east Queensland. Wildlife Research 25: 41-64.
Spellerberg, I. and Sawyer, J. 1997. Biological diversity in plantation forests. Pp. 516- 521 in Conservation Outside Nature Reserves, edited by P. Hale and D. Lamb. Centre for Conservation Biology, The University of Queensland..
Sumner, J., Moritz, C. and Shine, R. 1999. Shrinking forest shrinks skink: morphological change in response to rainforest fragmentation in the prickly forest skink (Gnypetoscincus queenslandiae). Biological Conservation 91: 159-167.
Tracey. J.G. 1982. The Vegetation of the Humid Tropical Region of North Queensland. CSIRO Publication, Melbourne: 124 pp.
Tucker, N.I.J. 2000. Linkage restoration: interpreting fragmentation theory for the design of a rainforest linkage in the humid Wet Tropics of north-eastern Queensland. Ecological Management and Restoration 1: 35-41.
Tucker, N.I.J. 2001. Wildlife colonisation on restored tropical lands: What can it do, how can we hasten it and what can we expect? Pp. 279-295 in Forest Restoration for Wildlife Conservation, edited by S. Elliott, J. Kerby, D. Blakesley, K. Hardwicke, K. Woods and V. Anusarnsunthorn. International Tropical Timber Organisation and the Forest Restoration Research Unit, Chiang Mai University, Thailand.
Tucker, N.I.J., Wardell-Johnson, G., Catterall, C.P. and Kanowski, J. 2004. Agroforestry and biodiversity: Improving the outcomes for conservation in tropical north-eastern Australia. In Agroforestry and Biodiversity Conservation in Tropical Landscapes, edited by G. Schroth, G. Fonseca, C.A. Harvey, C. Gascon, H. Vasconcelos and A.M.N. Izac. Island Press, Washington.
Warburton, N.H. 1997. Structure and conservation of forest avifauna in isolated rainforest remnants in tropical Australia. Pp. 190-206 in Tropical Forest Remnants. Ecology, Management and Conservation of Fragmented Communities, edited by W.F. Laurance and R.O. Bierregaard. University of Chicago Press, Chicago.
Wardell-Johnson,G., Kanowski, J., Catterall, C., Proctor, H. and Reis, T. 2001. Measuring the restoration of rainforest biodiversity: a case study in research design, and its implications for establishing monitoring frameworks. Pp. 72-81 in Biodiversity – The Big Picture. Proceedings of the Southern Queensland Biodiversity Recovery Conference, edited by B. Boyes. Southern Queensland Biodiversity Network, Lake Perseverance.
Webb, L.J. 1966. The rape of the forests. Pp. 156-205 in The Great Extermination. A Guide to Anglo-Australian Cupidity, Wickedness and Waste, edited by A.J. Marshall. Heinemann, London.
Webb L.J. & Tracey J.G. 1981. Australia’s Rainforests. Patterns & Change. Pp. 607-694 in Ecological Biogeography of Australia, edited by A. Keast. Junk, The Hague
Webb L.J., Tracey J.G. and Williams, W.T. 1976. The value of structural features in tropical forest typology. Australian Journal of Ecology 1: 3-28.
Williams, S.E. and Pearson, R.G. 1997. Historical rainforest contractions, localised extinctions and patterns of vertebrate endemism in the rainforests of Australia’s wet tropics. Proceedings of the Royal Society of London Series B 264: 709-716.
Williams, S.E., Bolitho E.E. and Fox, S. 2003. Climatic change in Australian tropical rainforests: an impending environmental catastrophe. Proceedings of the Royal Society of London Series B 264. In Press.
Winter, J.W. 1988. Ecological specialisation of mammals in Australian tropical and subtropical rainforest: refugial or ecological determinism? Pp. 127-138 in Ecology of Australia’s Wet Tropics, Proceedings of the Ecological Society of Australia Vol. 15, edited by R.L. Kitching. Surrey Beatty & Sons, Chipping Norton.
Woodford, R. 2000. Converting a dairy farm back to rainforest: the Rocky Creek Dam story. Ecological Management and Restoration 1: 83-92.
Vize, S.M. and Creighton, C. 2001. Institutional impediments to farm forestry. Pp. 241-255. in Sustainable Farm Forestry in the Tropics, edited by S.R. Harrison and J.L. Herbohn. Edward Elgar, Cheltenham.
Young T. P. 2000. Restoration ecology and conservation biology. Biological Conservation 92: 73-83
Quantifying the biodiversity values of reforestation
Forest Fauna.indd 16/09/2004, 7:40 PM385

386 Conserving Australia’s Forest Fauna
Common name Genus and species ClassAustralian magpie Gymnorhina tibicen AvesBower’s shrike-thrush Colluricincla boweri AvesBrown antechinus Antechinus stuartii MammaliaBush rat Rattus fuscipes MammaliaCommon ringtail possum Pseudocheirus peregrinus MammaliaGolden whistler Pachycephala pectoralis AvesGreen catbird Ailuroedus crassirostris AvesLarge-billed scrubwren Sericornis magnirostris AvesLemuroid ringtail possum Hemibelideus lemuroides MammaliaLewin’s honeyeater Meliphaga lewinii AvesLogrunner Orthonyx temminckii or O. spaldingii* AvesMacleay’s honeyeater Xanthotis macleayana AvesNoisy miner Manorina melanocephala AvesPale-yellow robin Tregellasia capito AvesPrickly forest skink Gnypetoscincus queenslandiae ReptiliaRed-legged pademelon Thylogale stigmatica MammaliaRose-crowned fruit-dove Ptilinopus regina AvesSilvereye Zosterops lateralis AvesWhite-throated gerygone Gerygone olivacea AvesWillie wagtail Rhipidura leucophrys AvesWompoo fruit-dove Ptilinopus magnificus Aves
* also called chowchilla
Appendix 1. Scientific names of vertebrate species whose common names are used in the text.
AP
PE
ND
IX 1
Catterall et al.
Forest Fauna.indd 16/09/2004, 7:40 PM386
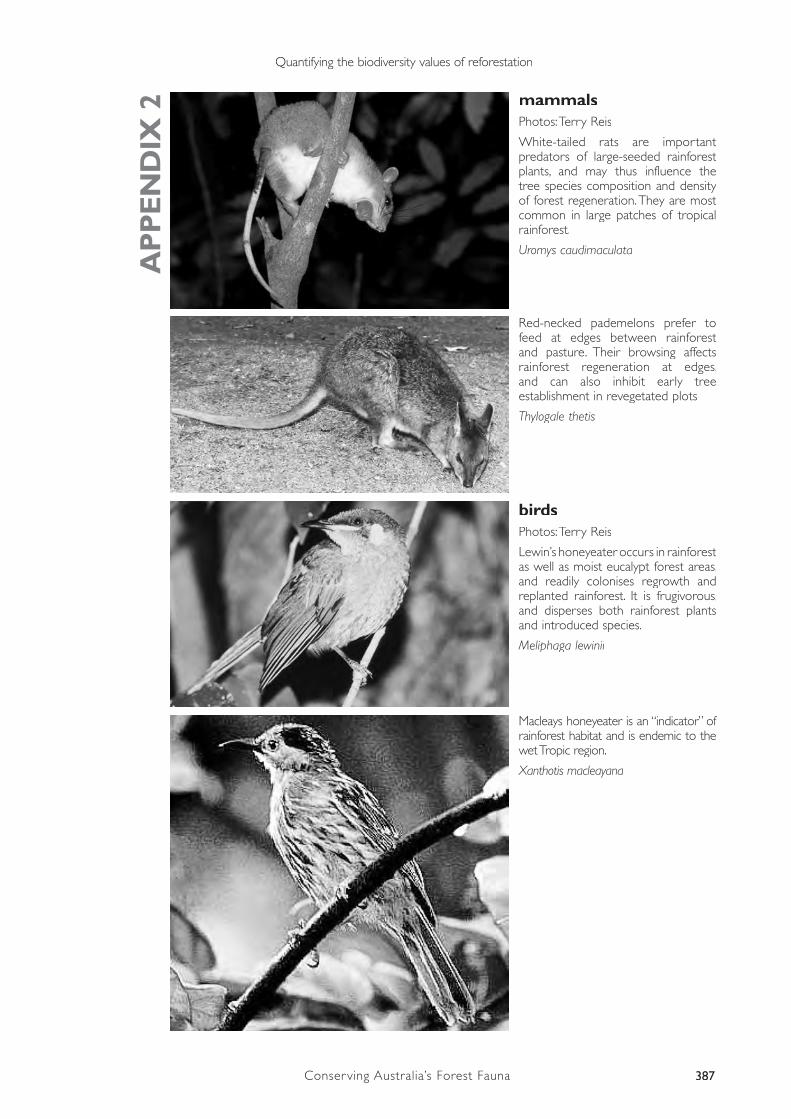
387Conserving Australia’s Forest Fauna
AP
PE
ND
IX 2 mammals
Photos: Terry Reis
White-tailed rats are important predators of large-seeded rainforest plants, and may thus influence the tree species composition and density of forest regeneration. They are most common in large patches of tropical rainforest.
Uromys caudimaculata
Red-necked pademelons prefer to feed at edges between rainforest and pasture. Their browsing affects rainforest regeneration at edges, and can also inhibit early tree establishment in revegetated plots
Thylogale thetis
birdsPhotos: Terry Reis
Lewin’s honeyeater occurs in rainforest as well as moist eucalypt forest areas, and readily colonises regrowth and replanted rainforest. It is frugivorous, and disperses both rainforest plants and introduced species.
Meliphaga lewinii
Macleays honeyeater is an “indicator” of rainforest habitat and is endemic to the wet Tropic region.
Xanthotis macleayana
Quantifying the biodiversity values of reforestation
Forest Fauna.indd 22/09/2004, 8:32 PM387

388 Conserving Australia’s Forest Fauna
reptilesPhotos by Terry Reis
Eulamprus murrayi, Conondales, SEQA
PP
EN
DIX
2
insectsPhotos: Heather Proctor
Most Leptomyrmex species are ants of rainforest and moist eucalypt forest, that forage alone or in small groups. In our study they occurred mainly in old plantations.
This tiny velvet mite (superfamily Trombidioidea) belongs to a “rainforest indicator” group.
Eulamprus tigrinus (tropics) and E. murrayi (subtropics) are rainforest-dependent skinks. They often live in the crevices associated with the roots of strangler figs, which are found only in well-developed rainforest.
The prickly forest skink lives under decaying logs in rainforests of the Wet tropics. It is largely restricted to larger remnants of mature rainforest.
Gnypetoscincus queenslandiae
Catterall et al.
Forest Fauna.indd 16/09/2004, 7:40 PM388
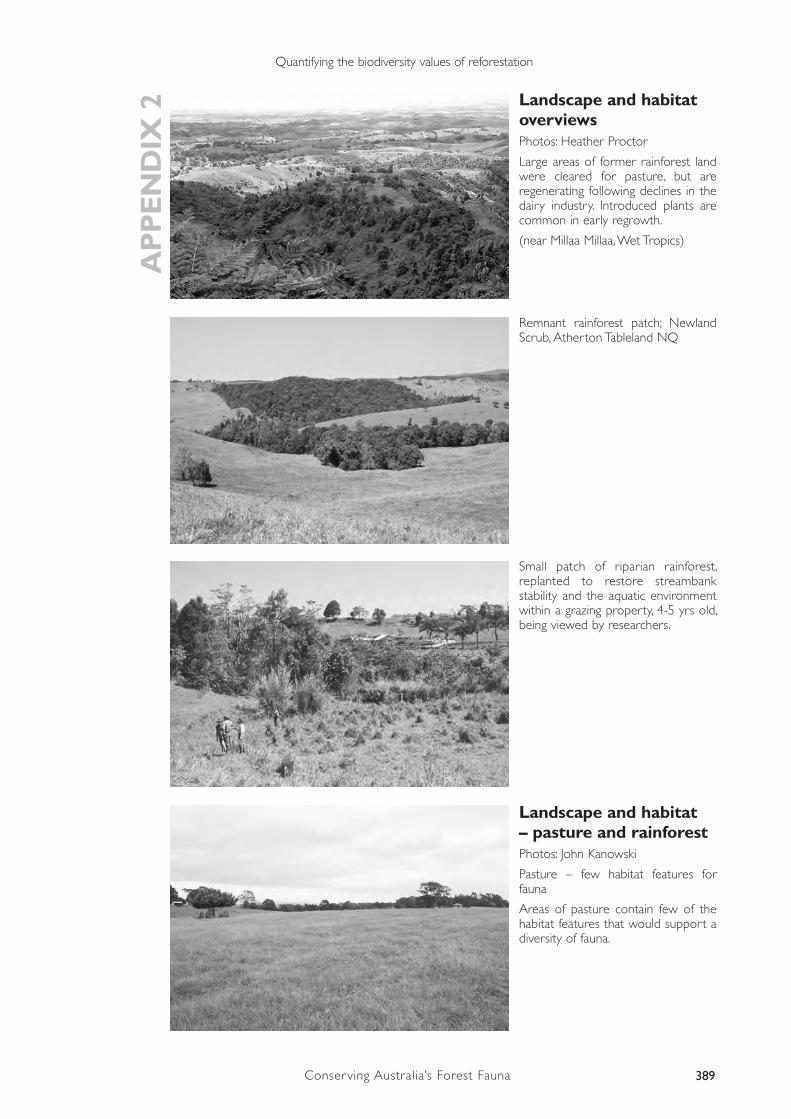
389Conserving Australia’s Forest Fauna
AP
PE
ND
IX 2 Landscape and habitat
overviewsPhotos: Heather Proctor
Large areas of former rainforest land were cleared for pasture, but are regenerating following declines in the dairy industry. Introduced plants are common in early regrowth.
(near Millaa Millaa, Wet Tropics)
Remnant rainforest patch; Newland Scrub, Atherton Tableland NQ
Small patch of riparian rainforest, replanted to restore streambank stability and the aquatic environment within a grazing property, 4-5 yrs old, being viewed by researchers.
Landscape and habitat – pasture and rainforestPhotos: John Kanowski
Pasture – few habitat features for fauna
Areas of pasture contain few of the habitat features that would support a diversity of fauna.
Quantifying the biodiversity values of reforestation
Forest Fauna.indd 16/09/2004, 7:40 PM389

390 Conserving Australia’s Forest Fauna
Mature rainforest is characterised by dense foliage in a complex, multi-layered structure, and by special life forms such as strangler figs and epiphytes. Lamin’s Hill, Atherton Tableland, Tropics
Big Scrub Flora reserve, subtropics
AP
PE
ND
IX 2
Catterall et al.
Forest Fauna.indd 16/09/2004, 7:40 PM390
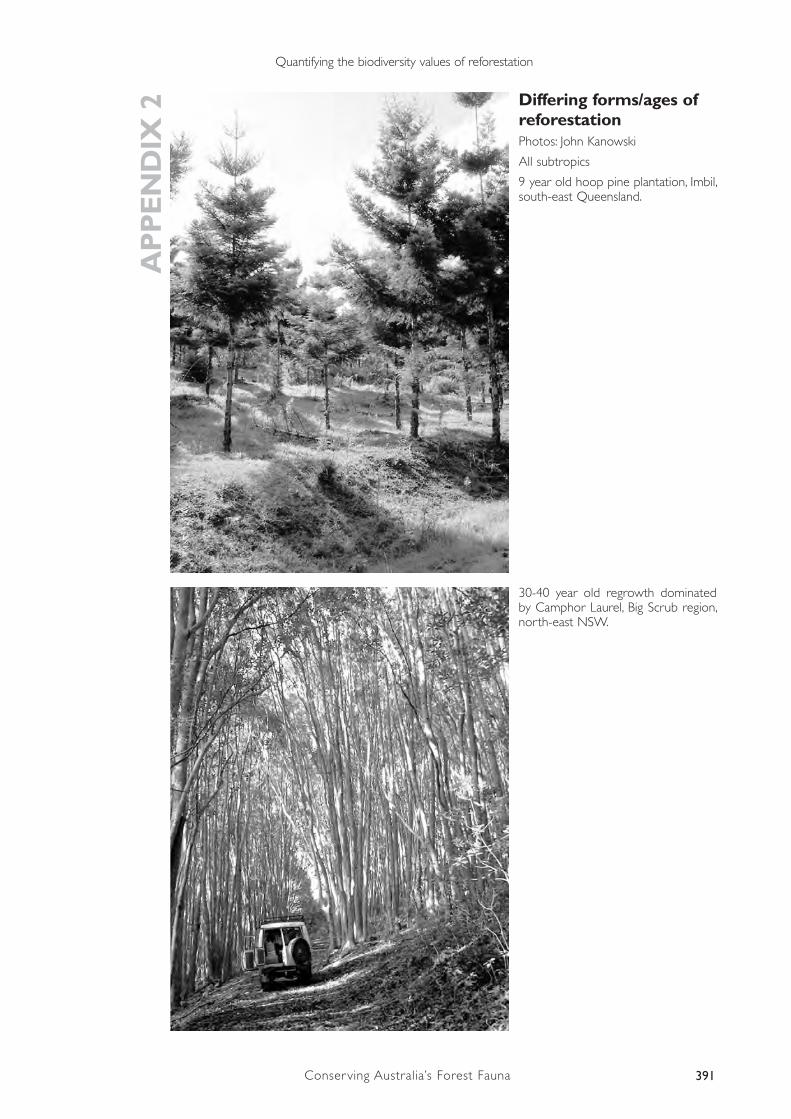
391Conserving Australia’s Forest Fauna
Differing forms/ages of reforestationPhotos: John Kanowski
All subtropics
9 year old hoop pine plantation, Imbil, south-east Queensland.
30-40 year old regrowth dominated by Camphor Laurel, Big Scrub region, north-east NSW.
AP
PE
ND
IX 2
Quantifying the biodiversity values of reforestation
Forest Fauna.indd 16/09/2004, 7:40 PM391
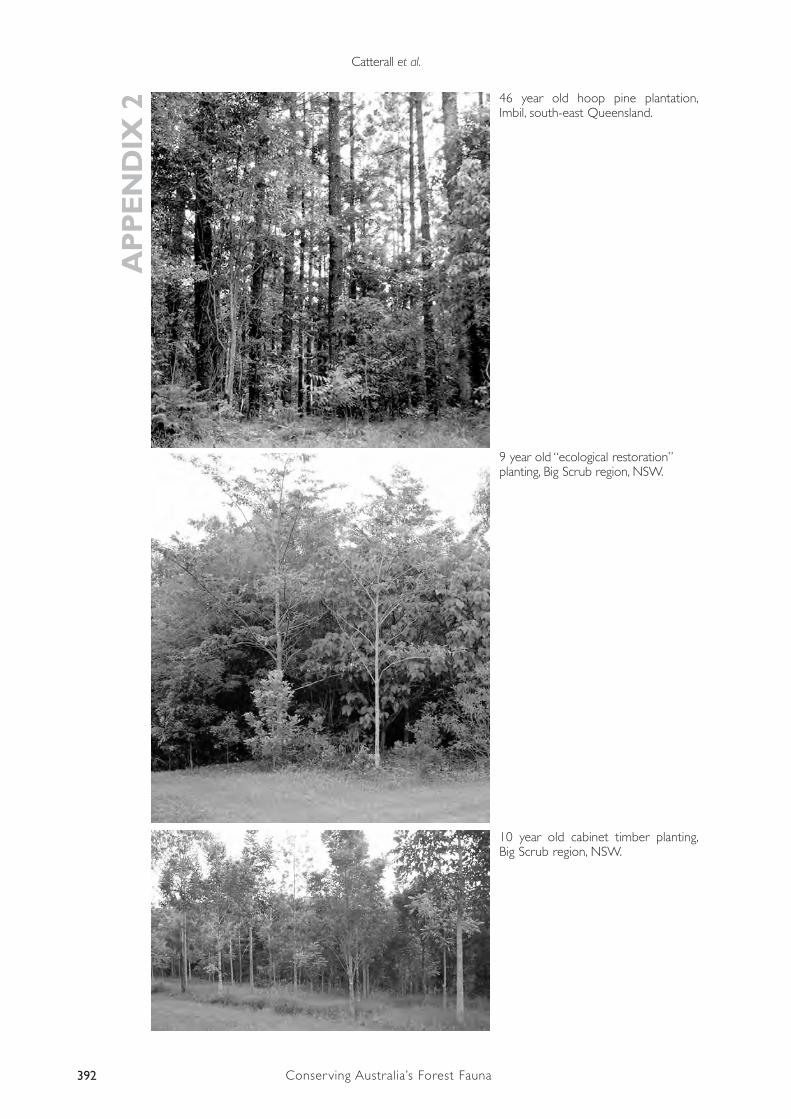
392 Conserving Australia’s Forest Fauna
AP
PE
ND
IX 2
10 year old cabinet timber planting, Big Scrub region, NSW.
9 year old “ecological restoration” planting, Big Scrub region, NSW.
46 year old hoop pine plantation, Imbil, south-east Queensland.
Catterall et al.
Forest Fauna.indd 16/09/2004, 7:40 PM392

393Conserving Australia’s Forest Fauna
Revegetation character shotsPhotos: Heather Proctor
Tropics
Mark Heaton (Wet Tropics Tree Planting Scheme) discussing the pros, cons and possible long-term outcomes of different tree-planting practices with Grant Wardell-Johnson.
Winfield Park restoration planting, Atherton Tableland, north Queensland
During a planning-stage site visit, Grant Wardell-Johnson expresses his reaction to rapid tree growth as evidenced by the development of buttress roots on Elaeocarpus grandis. 15 year old privately-owned riparian restoration on a grazing property, Atherton Tableland, north Queensland.
AP
PE
ND
IX 2
Quantifying the biodiversity values of reforestation
Forest Fauna.indd 16/09/2004, 7:40 PM393
Related Documents