Quantification ofthe Modifications in the Dominant Frequency of Ventricular Fihrillation under Conditions of Ischemia and Reperfusion: An Experimental Study i FRANCISCO J. CHORRO, JUAN GUERRERO,* JOAQUIN CANOVES, MARCELINO MARTINEZ-SOBER,* LUIS MAINAR, JUAN SANCHIS, JAVIER CALFE,* ESTEBAN LLAVADOR, JOSE ESPI,* and VICENTE LOPEZ-MERINO ! From tbe Service of Gardiology, Valencia University Clinic Hospital, and the *Department of Electronics, Valencia University, Valencia, Spain i CHORRO, F.J., ET AL.: Quantification ofthe Modifications in the Dominant Frequency of Ventricular Fib- rillation under Conditions of Ischemia and Reperfusion: An Experimental Study. The characteristics of ventricular fibriliatory signals vary as a function ofthe time elapsed from the onset of arrhythmia and the maneuvers used to maintain coronary perfusion. The dominant frequency (FrD) of the power spectrum of ventricular fibrillation (VF) is known to decrease after interrupting coronary perfusion, though the corre- sponding recovery process upon reestablishing coronary flow has not been quantified to date. With the aim of investigating the recovery of the FrD during reperfusion after a brief ischemic period, 11 isolated and perfused rabbit heart preparations were used to analyze the signals obtained with three unipolar epi- cardial electrodes (E1-E3) and a bipolar electrode immersed in the thermostatized organ bath (E4), fol- lowing the electrical induction of VF. Recordings were mode under conditions of maintained coronary perfusion (5 min), upon interrupting perfusion (15 min), and after reperfusion (5 min). FrD was deter- mined using Welch's method. The variations in FrD were quantified during both ischemia and reperfu- sion. based on an exponential model AFrD = A exp (-t/C). During ischemia AFrD is the difference be- tween FrD and the minimum value, while t is the time elapsed from the interruption of coronary perfusion. During reperfusion AFrD is the difference between the maximum value and FrD, while t is the time elapsed from the restoration of perfusion. A is one of the constants of the model, and C is the time constant. FrD exhibited respective initial values of 16.20 ± 1.67, 16.03 ± 1.38, and 16.03 ± 1.30 Hz in the epicardial leads, and 15.09 ± 1.07 Hz in the bipolar lead within the bath. No significant variations were observed during maintained coronary perfusion. The fit of the FrD variations to the model during ischemia and reperfusion proved significant in nine experiments. The mean time constants C obtained on fitting to the model daring ischemia were as follows: El =294.4 ± 75.6, E2 = 225.7 ± 48.5. E3 =327.4 ± 79.7, and E4 = 298.7 ± 43.9 seconds. The mean values of C obtained during reperfusion, and the significance ofthe differences with respect to the ischemic period were: El - 57.5 ± 8.4 (P < 0.01), E2 = 64.5 ± 11.2 (P < 0.01). E3 = 80.7 ± 13.3 (P < 0.01), and E4 = 74.9 ± 13.6 (P < 0.0001). The time course variations ofthe FrD of the VF power spectrum fit an exponential model during ischemia and reperfusion. The time con- stants ofthe model during reperfusion after a brief ischemic period are significantly shorter than those ob- tained during ischemia. (PACE 1998; 21:1716-1723) ventricular fibrillation, spectral analysis, ischemia, reperfusion This work has been supported in part by a Research & Devel- IntrOQUCtiOll opment Grant from thfi IMPIVA, Generalital Valenciana. . • r.i .. , , . ^, ., ^ ^ . . . The spectral analysis ol the ventricular tibril- Address for reprints: Francisco J. Chorro, M.D., Servicio de , . ,.,J^ . , i i -^i • i i j Cardiologia, Hospital Clinico Universitario, Avda. Btasco lation (VF) Signals recordfid With peripheral and Ibanez 17.46010 Valencia. Spain. Fax: 34-9-6386-4767. endocardial or epicardial electrodes reveals a Received June 30,1997; accepted August 20,1997. grouping of frequencies into a narrow hand during 1716 September 1998 PAGE, Vol. 21

Welcome message from author
This document is posted to help you gain knowledge. Please leave a comment to let me know what you think about it! Share it to your friends and learn new things together.
Transcript
Quantification ofthe Modifications in theDominant Frequency of Ventricular Fihrillationunder Conditions of Ischemia and Reperfusion:An Experimental Study i
FRANCISCO J. CHORRO, JUAN GUERRERO,* JOAQUIN C A N O V E S ,
MARCELINO MARTINEZ-SOBER,* LUIS MAINAR, JUAN SANCHIS,JAVIER CALFE,* ESTEBAN LLAVADOR, JOSE ESPI,*and VICENTE LOPEZ-MERINO !
From tbe Service of Gardiology, Valencia University Clinic Hospital, and the *Department of Electronics, ValenciaUniversity, Valencia, Spain i
CHORRO, F.J., ET AL.: Quantification ofthe Modifications in the Dominant Frequency of Ventricular Fib-rillation under Conditions of Ischemia and Reperfusion: An Experimental Study. The characteristics ofventricular fibriliatory signals vary as a function ofthe time elapsed from the onset of arrhythmia and themaneuvers used to maintain coronary perfusion. The dominant frequency (FrD) of the power spectrum ofventricular fibrillation (VF) is known to decrease after interrupting coronary perfusion, though the corre-sponding recovery process upon reestablishing coronary flow has not been quantified to date. With theaim of investigating the recovery of the FrD during reperfusion after a brief ischemic period, 11 isolatedand perfused rabbit heart preparations were used to analyze the signals obtained with three unipolar epi-cardial electrodes (E1-E3) and a bipolar electrode immersed in the thermostatized organ bath (E4), fol-lowing the electrical induction of VF. Recordings were mode under conditions of maintained coronaryperfusion (5 min), upon interrupting perfusion (15 min), and after reperfusion (5 min). FrD was deter-mined using Welch's method. The variations in FrD were quantified during both ischemia and reperfu-sion. based on an exponential model AFrD = A exp (-t/C). During ischemia AFrD is the difference be-tween FrD and the minimum value, while t is the time elapsed from the interruption of coronary perfusion.During reperfusion AFrD is the difference between the maximum value and FrD, while t is the time elapsedfrom the restoration of perfusion. A is one of the constants of the model, and C is the time constant. FrDexhibited respective initial values of 16.20 ± 1.67, 16.03 ± 1.38, and 16.03 ± 1.30 Hz in the epicardialleads, and 15.09 ± 1.07 Hz in the bipolar lead within the bath. No significant variations were observedduring maintained coronary perfusion. The fit of the FrD variations to the model during ischemia andreperfusion proved significant in nine experiments. The mean time constants C obtained on fitting to themodel daring ischemia were as follows: El =294.4 ± 75.6, E2 = 225.7 ± 48.5. E3 =327.4 ± 79.7, and E4= 298.7 ± 43.9 seconds. The mean values of C obtained during reperfusion, and the significance ofthedifferences with respect to the ischemic period were: El - 57.5 ± 8.4 (P < 0.01), E2 = 64.5 ± 11.2 (P <0.01). E3 = 80.7 ± 13.3 (P < 0.01), and E4 = 74.9 ± 13.6 (P < 0.0001). The time course variations oftheFrD of the VF power spectrum fit an exponential model during ischemia and reperfusion. The time con-stants ofthe model during reperfusion after a brief ischemic period are significantly shorter than those ob-tained during ischemia. (PACE 1998; 21:1716-1723)
ventricular fibrillation, spectral analysis, ischemia, reperfusion
This work has been supported in part by a Research & Devel- IntrOQUCtiOllopment Grant from thfi IMPIVA, Generalital Valenciana. . • r.i ..
, , . ^, . , ̂ ^ . . . The spectral analysis ol the ventricular tibril-Address for reprints: Francisco J. Chorro, M.D., Servicio de , . ,.,J^ . , i i -̂ i • i i jCardiologia, Hospital Clinico Universitario, Avda. Btasco lation (VF) Signals recordfid With peripheral andIbanez 17.46010 Valencia. Spain. Fax: 34-9-6386-4767. endocardial or epicardial electrodes reveals aReceived June 30,1997; accepted August 20,1997. grouping of frequencies into a narrow hand during
1716 September 1998 PAGE, Vol. 21
VENTRICULAR FIBRILLATION AND CORONARY PERFUSION
the initial stages of the arrhythmia.' °̂ The powerspectrum of VF modifies as a function of differentfactors, including: (a) the time elapsed from the in-terruption of myocardial perfusion induced by theonset of the arrhythmia,'*''"" (b) the action ofdrugs that modify the metaholic deterioration orelectrophysiological properties of the myocardial
"̂' and (c) the maneuvers used to main-tain systemic and coronary perfusion.''''*'^"
Although studies have boon made of the VFpower spectrum modifications following the on-set of the arrhythmia, little information is avail-ahle on the recovery process of the fihrillatory pat-tern once myocardial reperfusion is restored. Noquantifications have heen made of the time coursechanges of the power spectrum in this situationand their comparison with those recorded afterthe onset of arrhythmia, on interrupting coronaryperfusion. The present study investigates the timecourse of VF in the isolated rahhit heart usingspectral techniques under three different condi-tions: (a) during maintained coronary perfusion,(h) upon interrupting perfusion, and (c) at reper-fusion after 15 minutes of ischemia, with the pur-pose of quantifying the variation pattern of thedominant frequency (FrD) of the ventricular fibril-latory signals under these three conditions.
Materials and Methods
Experimental Preparation
Eleven isolated and perfused California rabbithearts were used. After heparinization, the rabbits(weighing 3.5-4 kg each) were killed, and thehearts were removed and immersed in cold (4°C)Tyrode solution. Following isolation, the aortawas connected to a Langendorff system for perfus-ing Tyrode solution at a pressure of 50 mmHg anda temperature of 37° ± 0.5°C. The millimolar com-position of the perfusion fluid was: NaCI 130,NaHCOs 24.2, KCl 4.7, CaCl^ 2.2, NaHsPO^ 1.2,MgCl2 0.6, and glucose 12. Oxygenation was car-ried out with a mixture of 95% O2 and 5% CO2.The perfused heart was immersed in a cylindricalthermostatized bath 12 cm in diameter and 14 cmin height. The effluent Tyrode in the hath wasmaintained at 37° ± 0.5°C throughout the experi-ment.
Left ventricle unipolar electrograms wererecorded with three stainless steel electrodes
(diameter = 0.125 mm, interelectrode distance =5 mm). The electrodes (E1-E3) were embedded ina silicone matrix positioned at the epicardial sur-face of the posterior wall of the left ventricle. Theindifferent electrode was a 4 x 6 mm silver plaquelocated over the cannulated aorta. A bipolar elec-trogram (E4) was obtained with two stainless steelelectrodes 0.5 mm in diameter positioned at op-posite sides of the bath containing the perfusedheart. A hipolar electrode (diameter ^ 0.125 mm,interelectrode distance = 1 mm) positioned at theleft ventricle epicardial free wall was used for pac-ing with a GRASS S88 stimulator (Grass Instru-ments Inc., Quincy, MA, USA) equipped with astimulus isolation unit (SIU5). Stimuli were rect-angular pulses of 4-ms duration and an intensitytwice the diastolic threshold. VF was induced hypacing at increasing frequencies from 4-20 Hz.Recordings were ohtained with a cardiac electricalactivity mapping system (MAPTEGH, Waalre, TheNetherlands) . The electrograms were amplifiedwith a gain of 100-300, broad-hand (1-400 Hz) fil-tered, and multiplexed with analog to digital con-version at a sampling rate of 1 kHz. The data ob-tained throughout the experiment were stored onmagnetic tapes for analysis.
Experimental Protocol
Thirty minutes after positioning the elec-trodes, and following a stabilization period, VFwas induced under maintained coronary perfu-sion with Tyrode solution. Five minutes later, per-fusion was interrupted for 15 minutes. This wasfollowed hy coronary reperfusion for a further 5minutes. In the event that VF was spontaneouslyinterrupted during the ischemic period, fihrilla-tion was again electrically induced at the end ofischemia, prior to reperfusion. In all three periods(perfusion, ischemia, and reperfusion), continu-ous recordings were made of the unipolar epicar-dial electrograms and of the bipolar electrogramwithin the hath.
Data Analysis and Statistical Calculations
Welch's method was used to ohtain the powerspectrum of the signals recorded with each elec-trode every 30 seconds during the perfusion andischemic periods, and every 15 seconds duringreperfusion. Spectral analysis was performed at
PACE, Vol. 21 September 1998 1717
GHORRO, ET AL.
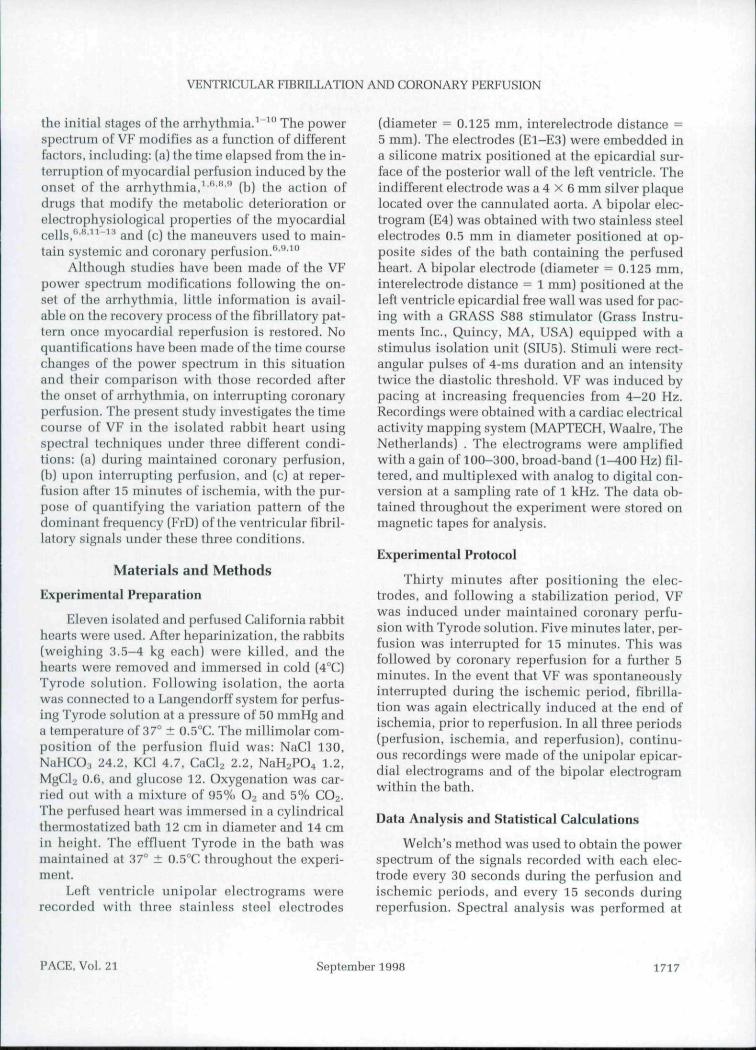
data blocks of 2,048 points [sampling rate = 1kHz), dividing each block into segments of 256nonoverlapping points, eliminating tendencies,and applying tbe Hanning window (Fig. 1). Theperiodogram of each block of 2,048 points corre-sponds to tbe average of tbe periodograms of eachsegment. Tbe FrD, i.e., tbe frequency correspond-ing to tbe spectral maximum, was obtained foreach block. Data processing was performed witbMatlab software (Matbworks Inc., Natick, MA,USA) on an HP-712/80 platform (Hewlett-PackardCo.,PaloAlto, CA, USA).
An exponential model, AFrD = A exp ( - t/C),was used to quantify tbe FrD variations during is-cbemia and reperfnsion. During iscbemia, AFrDrepresents tbe difference between FrD and tbeminimum value, wbile t is tbe time elapsed fromtbe interruption of coronary perfusion (in s). Dur-ing reperfusion, AFrD is tbe difference betweentbe maximum value and FrD, wbile t Is tbe timeelapsed from tbe restoration of perfusion. A is oneof tbe constants of tbe model, and C is tbe timeconstant, i.e.. tbe time elapsed until one-tbird oftbe initial value is reacbed. Tbe matbematicalfunction was fitted to data by determining tbeleast square residuals.
3000
2000
1000
EPIC-3
MilIrifirfiiin'JI'MIl' pi'l| 1|1000 1500{msl
20 30 40 50H7
Figure 1. Recordings obtained during ventricularfibrillation (left) and power spectrum analysis of thesignals (righ t) in experitvent 1. EPIC-1. EPlC-2, an d EPIC-3 correspond to the epicardia! electrodes. A^ — moduleas absolute value to the second power; Hz = Hertz; u.o.- amplitude (in arbitrary units).
Data are presented as mean ± s.e.m. Compar-isons between two sets oi data were made witbStudent's Mest. Multiple comparisons were per-formed by analysis of variance (ANOVA). apply-ing tbe Student-Newmann-Keul's test. Differenceswere considered significant lor P < 0.05.
Results
VF during Maintained Coronary Perfusion
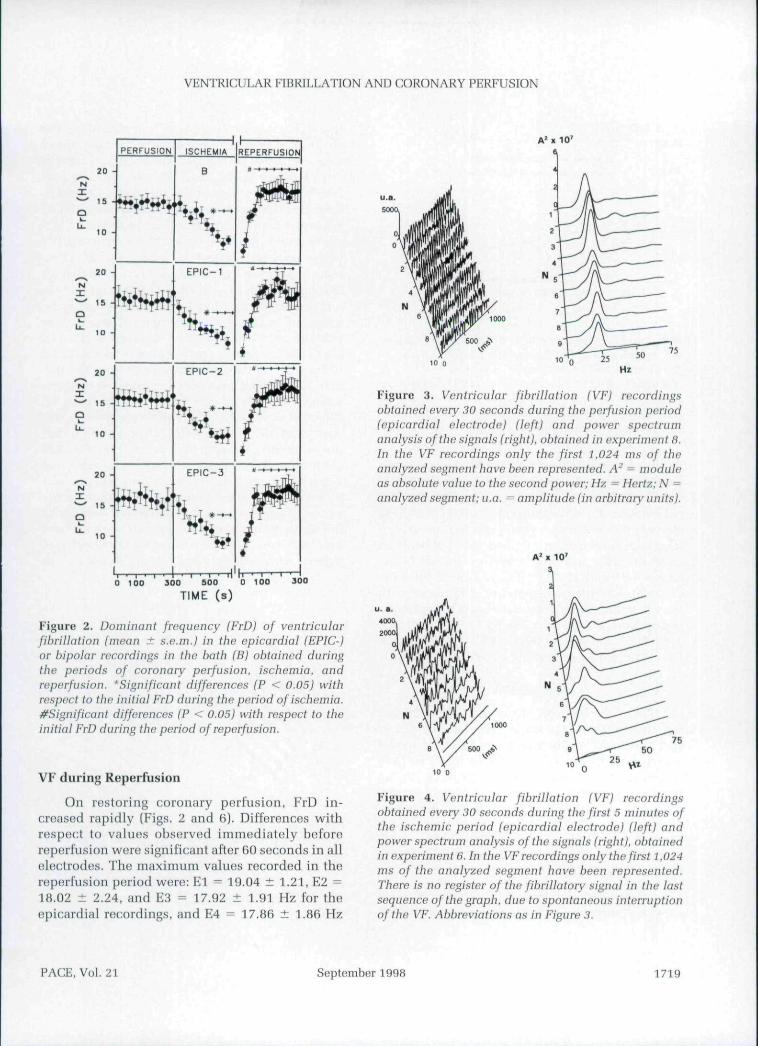
Tbe FrD values corresponding to eacb elec-trode remained stable during maintained coro-nary perfusion. Tbe initial values were: El =16.20 ± 1.67, E2 = 16.03 ± 1.38, E3 = 16.03 ±1.80, and E4 = 15.09 ± 1.07 Hz. No significantvariations were observed '^mth respect to tbe ini-tial values in any of tbe recorded sequences (Figs.2 and 3). Tbus, tbe values obtained at tbe end oftbe perfusion period were: El = 16.69 ± 1.94. E2= 16.26 ± 1.64. E3 = 16.62 ± 1.77, and E4 = 14.65± 1.56 Hz. Tbe differences among tbe electrodeswere not statistically significant.
VF during Ischemia ' I
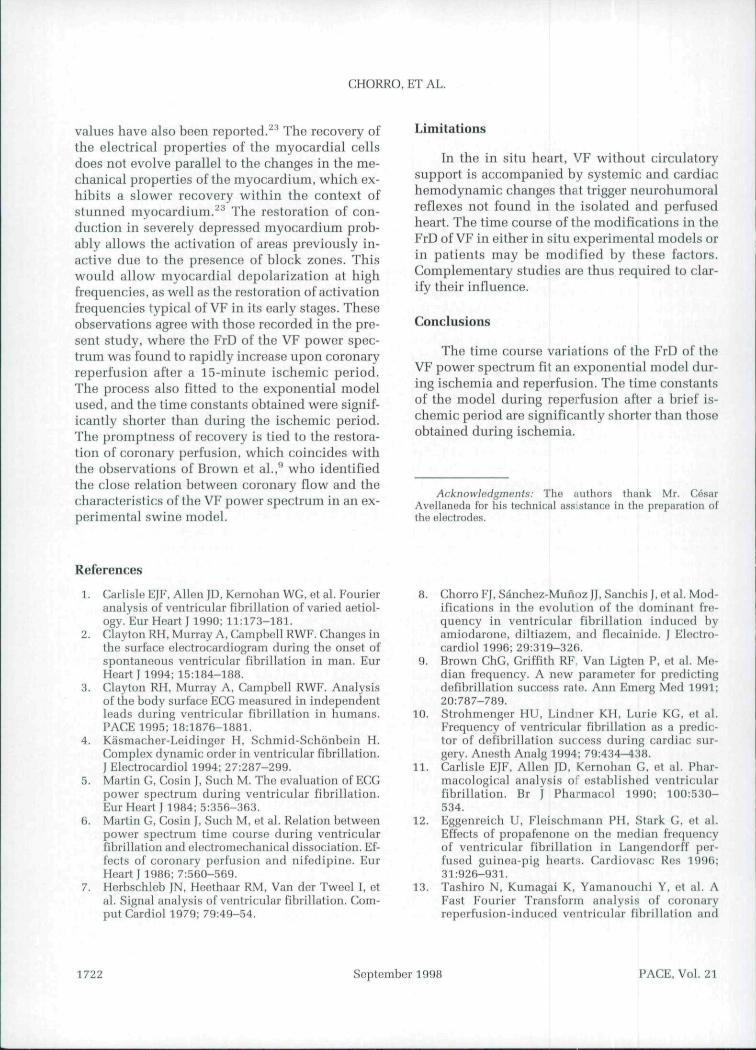
VF was spontaneously interrupted in sevenexperiments during the period of iscbemia. Tbisinterruption occurred more tban 5 minutes afterbaiting coronary perfusion in four experiments,and in under 5 minutes in tbe remaining tbree ex-periments (4 min 30 s in one case. 1 min 30 s inanotber, and after 1 min in tbe tbird). Upon inter-rupting coronary perfusion, FrD decreased pro-gressively in tbe epicardial electrodes and in tbebipolar lead located in tbe batb (Figs. 2 and 4). Af-ter 5 minutes of iscbemia, FrD in tbe epicardialrecordings was; El - 8.37 ± 0.93. E2 = 9.77 ±1.30, and E3 - 9.34 ± 0.97 Hz. FrD in tbe elec-trode witbin tbe batb was: E4 = 9.03 ± 0.65 Hz.As before, tbere were no significant differencesamong tbe electrodes. Tbe fit of tbe time course ofFrD to tbe exponential model proved significantin nine experiments, witb correlation coefficients(r) of between 0.43 and (1.98, and mean squareresiduals of between 0.01 and 1.2 Hz^ (Figure 5).Tbe means of the time constants obtained witbeacb electrode were: El = 294.4 ± 75.6. E2 =225.7 ± 48.5. E3 = 327.4 ± 79.7, and E4 = 298.7± 43.9 seconds.
1718 September 1998 PAGE, Vol. 21
VENTRICULAR FIBRILLATION AND CORONARY PERFUSION
20 -NX
20 •
15 •
15 -
a
PERFUSION ISCHEMIA
EPIC-1
EPIC-2
EPIC-3
IREPERFUStON
A' X 10'
300 500 0 100TIME (s)
300
Figure 2. Dominant frequency {FrD] of ventricularfihrillation (mean ± s.e.m.) in the f^ipicardial (EPIC-)or bipolar recordings in the bath (B) obtained duringthe periods of coronary perfusion, ischemia, andreperfusion. *Significant differences (P < 0.05) withraspact to the initial FrD during tho period of ischemia.^Significant differences (P < 0.05) with respect to theinitial FrD during the period of reperfusion.
VF during Reperfusion
On restoring coronary perfusion, FrD in-creased rapidly (Figs. 2 and 6). Differences withrespect to values observed immediately beforereperfusion were significant after BO seconds in allelectrodes. Tho maximum vahies recorded in thereperfusion period were: El = 19.04 ± 1.21. E2 =18.02 ± 2.24, and E3 = 17.92 ± 1.91 Hz for theepicardial recordings, aud E4 = 17.86 ± 1.86 Hz
10 0
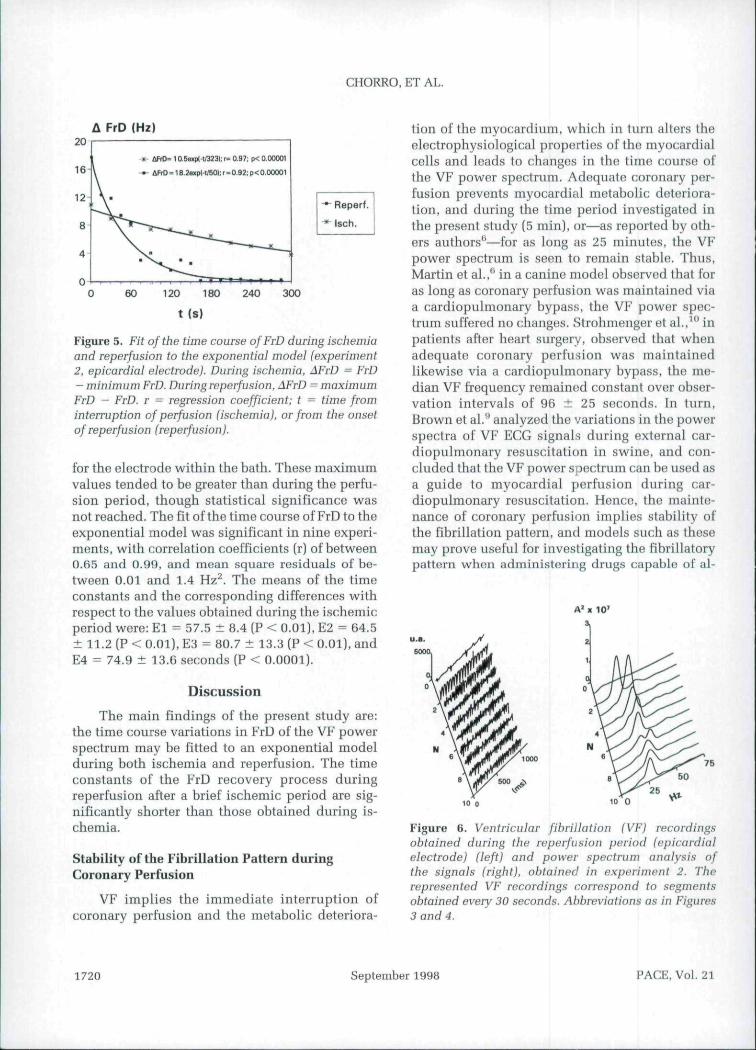
Figure 3. Ventricular fibrillation (VF) recordingsobtained every 30 seconds during the perfusion period(epicardial electrode) (left) and power spectrumanalysis of the signals (right), obtained in experiment 8.In the VF recordings only the first 1,024 ms of theanalyzed segment have been represented. A- = moduleas absolute value to the second power: Hz = Hertz; N -analyzed segment: u.a. = amplitude (in arbitrary units).
10 0
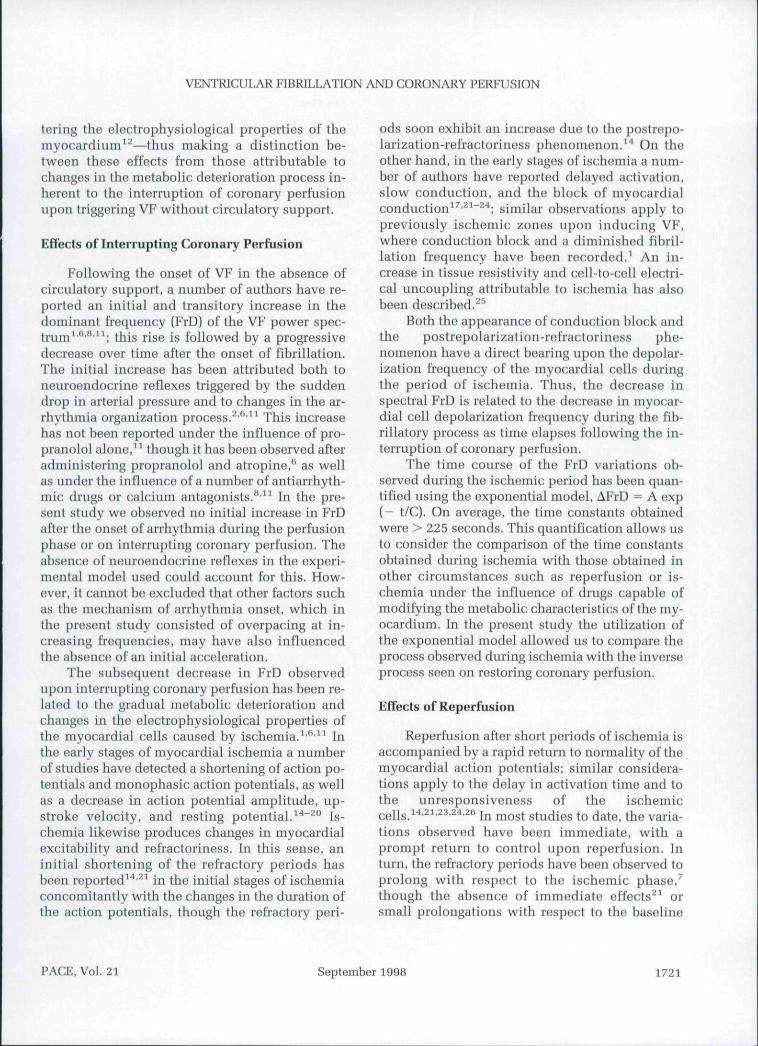
Figure 4. Ventricular fibrillation (VF) recordingsobtained every 30 seconds during the first 5 minutes ofthe ischemic period (epicardial electrode) (left) andpower spectrum anniy.->is of the signals (right), obtainedin experiment 6. In the VF recordings only the first t.O24ms of the analyzed segment have been represented.There is no register of the fibrillatory signal in the lastsequence of the graph, due to spontaneous interruptionof the VF, Abbreviations as in Figure 3.
PACE, Vol. 21 September 1998 1719
CHORRO, ET AL.
A FrD (Hz)
16
12
8
4-
X- AFrD= 10.6sxp(-t/323): r̂ 0.97: p< 0.00001
\ ^ A R D = 1 B . . ^ P . . . 5 0 , : . = 0 .92 :P<0,00001
\ • "^ Reparf.
* Isch.
60 120 180
t (Si
240 300
Figure 5. Fit of the time course of FrD during ischemiaand reperfusion to the exponential model (experiment2, epicardial electrode). During ischemia, AFrD — FrD- minimum FrD. During reperfusion, AFrD = maximumFrD - FrD. r ^ regression coefficient; t = time frominterruption of perfusion (ischemia), or from the onsetof reperfusion (reperfusion}.
for the electrode within the bath. These maximumvalues tended to be greater thau during the perfu-sion period, though statistical significance wasnot reached. The fit of the time course of FrD to theexponential model was significant iu niue experi-ments, with correlation coefficients (r) of between0.65 and 0.99, and mean square residuals of be-tween 0.01 and 1.4 Hz^. The means of the timeconstants and the corresponding differences withrespect to the values obtained during the ischemicperiod were: El = 57.5 ± 8.4 (P < 0.01). E2 = 64.5± 11.2 (P < 0.01), E3 = 80.7 ± 13.3 (P < 0.01), andE4 = 74.9 ± 13.6 seconds (P < 0.0001).
Discussion
The main findings of the present study are:the time course variations in FrD of the VF powerspectrum may be fitted to an exponential modelduring both ischemia and reperfusion. The timeconstants of the FrD recovery process duringreperfusion after a brief ischemic period are sig-nificantly shorter than those obtained during is-chemia.
Stability of the Fibrillation Pattern duringCoronary Perfusion
VF implies the immediate interruption ofcoronary perfusion and the metabolic deteriora-
tion of the myocardium, which in turn alters theelectrophysiological properties of the myocardialcells and leads to changes in the time course ofthe VF power spectrum. Adequate coronary per-fusion prevents myocardial metabolic deteriora-tion, and duriug the time period investigated inthe present study (5 min], or—as reported by oth-ers authors''—for as long as 25 minutes, the VFpower spectrum is seen tt) remain stahle. Thus,Martin et al.,^ in a canine model observed that foras long as coronary perfusion was maintained viaa cardiopulmonary bypass, the VF power spec-trum suffered no changes. Strohmeuger et al.,'° inpatients after heart surgery, observed that whenadequate coronary perfusion was maintainedlikewise via a cardiopulmonary bypass, the me-dian VF frequency remaintid constant over obser-vation intervals of 96 ± 25 seconds. In turn,Brown et al.^ analyzed the variations in the powerspectra of VF ECG signals during external car-diopulmonary resuscitation in swine, and con-cluded that the VF power spectrum can be used asa guide to myocardial perfusiou during car-diopulmonary resuscitation. Hence, the mainte-nance of coronary perfusion implies stability ofthe fibrillation pattern, and models such as thesemay prove useful for investigating the fibrillatorypattern when administering drugs capable of al-
10* 10 0
Figure 6. Ventricular fibrillation (VF) recordingsobtained during the reperfusion period (epicardialelectrode) (left) and power spectrum analysis ofthe signals (right), obtained in experiment 2. Therepresented VF recordings correspond to segmentsobtained every 30 seconds. Abbreviations as in Figures3 and 4. \ i
1720 September 1998 PACE, Vol. 21
VENTRICULAR FIBRILLATION AND CORONARY PERFUSION
tering the electrophysiological properties of themyocardium^^—thus making a distinction be-tween these effects from those attributahle tochanges in the metaholic deterioration process in-herent to the interruption of coronary perfnsionupon triggering VF without circulatory support.
Effects of Interrupting Coronary Perfusion
Following the onset of VF in the ahsence ofcirculatory support, a numher of authors have re-ported an initial and transitory increase in thedominant frequency (FrD) of the VF power spec-trum^*'*''^^ this rise is followed hy a progressivedecrease over time after the onset of fibrillation.The initial increase has been attributed both toneuroendocrine reflexes triggered by the suddendrop in arterial pressure and to changes in the ar-rhythmia organization process.̂ •^•^* This increasehas not heen reported under the influence of pro-pranolol alone,'' though it has been observed afteradministering propranolol and atropine,*^ as wellas under the influence of a number of antiarrhyth-mic: drugs or calcium antagonists."'^^ In the pre-sent study we ohserved no initial increase in FrDafter the onset of arrhythmia during the perfusionphase or on interrupting coronary perfusion. Theabsence of neuroendocrine reflexes in the experi-mental model used conld account for this. How-ever, it cannot be excluded that other factors suchas the mechanism of arrhythmia onset, which inthe present study consisted of overpacing at in-creasing frequencies, may have also influencedthe ahsence of an initial acceleration.
The subsequent decrease in FrD ohservedupon interrupting coronary perfusion has heen re-lated to the gradual metabolic deterioration andchanges in the electrophysiological properties ofthe myocardial cells caused hy ischemia.'•^'•" Inthe early stages of myocardial ischemia a numherof studies have detected a shortening of action po-tentials and monophasic action potentials, as wellas a decrease in action potential amplitude, up-stroke velocity, and resting potential.''**^° Is-chemia likewise produces changes in myocardialexcitability and refractoriness. In this sense, aninitial shortening of the refractory periods hasbeen reported^^*^^ in the initial stages of ischemiaconcomitantly with the changes in the duration ofthe action potentials, though the refractory peri-
ods soon exhibit an increase due to the postrepo-larization-refractoriness phenomenon.^* On theother hand, in the early stages of ischemia a num-ber of authors have reported delayed activation,slow conduction, and the block of myocardialconduction^^'^^"^''; similar observations apply topreviously ischemic zones upon inducing VF,where conduction block and a diminished fihril-lation frequency bave heen recorded.' An in-crease in tissue resistivity and cell-to-cell electri-cal uncoupling attrihutahle to ischemia has alsobeen described.^^
Both the appearance of conduction block andthe postrepolarization-refractoriness phe-nomenon have a direct bearing upon the depolar-ization frequency of the myocardial cells duringthe period of ischemia. Thus, the decrease inspectral FrD is related to the decrease in myocar-dial cell depolarization frequency during the fib-rillatory process as time elapses following the in-terruption of coronary perfusion.
The time course of the FrD variations ob-served during the ischemic period has heen quan-tified using the exponential model, AFrD = A exp[- t/C). On average, the time constants ohtainedwere > 225 seconds. This quantification allows usto consider the comparison of the time constantsohtained during ischemia with those ohtained inother circumstances such as reperfusion or is-chemia under the influence of drugs capable ofmodifying the metaholic characteristics of the my-ocardium. In the present study the utilization ofthe exponential model allowed us to compare theprocess ohserved during Ischemia with the inverseprocess seen on restoring coronary perfusion.
Effects of Reperfusion
Reperfusion after short periods of ischemia isaccompanied hy a rapid return to normality of themyocardial action potentials; similar considera-tions apply to the delay in activation time and tothe unresponsiveness of the ischemiccells.̂ '*'̂ -̂̂ '̂̂ '*-̂ ** In most studies to date, the varia-tions observed have been immediate, with aprompt return to control upon reperfusion. Inturn, tbe refractory periods have been ohserved toprolong with respect to the ischemic phase/though the absence of immediate effects^^ orsmall prolongations with respect to the haseline
PACE, Vol. 21 September 1998 1721
CHORRO, ET AL.
values have also been reported.^^ The recovery ofthe electrical properties of the myocardial cellsdoes not evolve parallel to the changes in the me-chanical properties of the myocardium, which ex-liihits a slower recovery within the context ofstunned myocardium.^^ The restoration of con-duction in severely depressed myocardium prob-ably allows the activation of areas previously in-active due to the presence of block zones. Thiswould allow myocardial depolarization at highfrequencies, as well as the restoration of activationfrequencies typical of VF in its early stages. Theseobservations agree with those recorded in the pre-sent study, where the FrD of the VF power spec-trum was found to rapidly increase upon coronaryreperfusion after a 15-minute ischemic period.The process also fitted to the exponential modelused, and the time constants obtained were signif-ic:antly shorter than during the ischemic period.The promptness of recovery is tied to the restora-tion of coronary perfusion. which coincides withthe observations of Brown et al.,'̂ who identifiedthe close relation between coronary flow and thecharacteristics of the VF power spectrum in an ex-perimental swine model.
References
1. Carlisle EJF, Alit;n JD. Kurnohan WG, et al. Fourieranalysis of ventricular fibrillation of varied aetiol-ogy. Eur Heart J 1990; 11:173-181.
2. Clayton RH. Murray A. Campbell RWF. Changes inthe surface olectrocardiogram during tht; onset ofspontaneous ventricular fibrillation in man. EurHeart J 1994; 15:184-188.
3. Clayton RH, Murray A, Campbell RWF. Analysisof the body surface ECC measured in independentleads during ventricular fibrillation in humans.PACE 1995; 18:1876-1881.
4. Kasmacher-Leidingor H, Schmid-Schonbein H.Complex dynamic order in ventricular fibrillation.J Electrocardiol 1994; 27:287-299.
5. Martin C, Cosin |. Such M. The evaluation of ECCpower spectrum during ventricular fibrillation.Eur Heart | 1984; 5:356-363.
6. Martin G. Cosin |. Such M. et al. Relation betweenpower spectrum time course during ventricularfibrillation and electromechanical dissociation, Ef-fects of coronary perfusion and nifedipine. EurHeart J 1986; 7:560-569.
7. Herbschleb JN, Heethaar RM. Van der Twee! I. etal. Signal analysis of ventricular fibrillation. Com-put Cardiol 1979; 79:49-54.
Limitations |
In the in situ heart, VF without circulatorysupport is accompanied by systemic and cardiachemodynamic changes that trigger neurohumoralreflexes not found in tho isolated and perfusedheart. Tbe time course of tlie modifications in theFrD of VF in either in situ experimental models orin patients may be modified by these factors.Complementary studies are thus required to clar-ify their influence.
Conclusions
The time course variations of the FrD of theVF power spectrum fit an exponential model dur-ing ischemia and reperfusion. The time constantsof the model during reperfusion after a brief is-cbemic period are significantly shorter than thoseobtained during ischemia.
Acknowledgments: The iiuthors thank Mr. CesarAvelianeda for his tec:hnical ass stance in the preparation ofthe
8. Chorro EJ. Sancbez-Munoz JJ. Saiicliis J, et al. Mod-ifications in the evolution of the dominant fre-quency in ventricular fibrillation induced byamiodarone, diltiazem, and flecainide. J Electro-carriiol 1996; 29:319-326.
9. Brown ChG. Griffith RE. Van Ligten F, et al. Me-dian frequency. A new parameter for predictingdefibrillation success rale. Ann Emerg Med 1991;20:787-789.
10. Strohmenger HU, Lindner KH. Lurie KG, et al.Frequency of ventricular fibrillation as a predic-tor of defibrillotion success during cardiac sur-gery. Anesth Analg 1994; 79:434-438.
11. Carlisle EJF, Alien JD, Kernohan G. et al. Phar-macological analysis oJ' established ventricularfibrillation. Br j Pharmacol 1990; 100:530-534.
12. Eggenreich U, Fleischmann PH, Stark C, et al.Effects of propafenone on the median frequencyof ventricular fibrillation in Langondorff per-fused guinea-pig hearts. Cardiovasc Res 1996;31:926-931.
13. Tashiro N, Kumagai K. Yamanouchi Y. et al. AFast Fourier Transform analysis of coronaryreperfusion-induced ventricular fibrillation and
1722 September 1998 PACE, Vol. 21
VENTRICULAR FIBRILLATION AND CORONARY PERFUSION
the modificalion by dibutyryl cyclic AMP ina cat model. Clin C;irdiol 1992; 15:733-738.
14. Downar E, Janse MJ. Durrer D. The effect of acutecoronary artery occlusion on subepicardial trans-membrane potentials in the intact porcine heart. 21.Circulation 1977; 56:217-224.
15. Horner SM, Lab MJ, Murphy CF, et al. Mechanicallyinduced changes in action potential duration andleft ventricular segment length in acute regional is- 22.chemia in the in situ porcine heart. Cardiovasc Res1994; 28:528-534.
1(). Mohabir R. Franz MR, Clusin WT. In vivo electro-physiological detection of myocardial ischemia 23.through monophasic action polnntial recording.Prog Cardiovasc Dis 1991; :i4:15-28,
17. Kleber AG, (anse MJ, WilmH-Schopmann FJ. ot al.Changes in conduction velocity dnring acute is- 24.chemia in ventricular myocardium of the isolatedporcine heart. Circulation 1986; 73;189-198.
18. Wikmsky RL, Tranum-Jonson J, Coronel R. et al. Tbesubendocardial border zone during acute ischemia 25.of the rabbit beart: An electrophysiologic,metabolic:, and morpbologic correlative study. Cir-culation 1986; 74:1137-1146.
19. Rosenbaum DS. Kaplan DT, Kanai A. et al. Repolar-ization inhomogeneities in ventricular myocardium 26.change dynamically with abrupt cyclo longth short-ening. Circulation 1991; 84;1333-i345.
20. Aiello EA, Jabr RI, Cole WC. Arrhythmia and de-
layed recovery of cardiac action potential duringreperfusion after ischemia. Role of oxygen radical-induced no-reOow phenomenon. Circ Res 1995;77:153-162.Penkoske PA. Sobel BE, Corr PB. Disparate electro-physiological alterations accompanying dysrbyth-mia due to coronary occlusion and reperfiision inthe cat. Circulation 1978; 58:1023-1035.Arenal A, Villemairtj Cb, Nattel S. Mechanism of se-lective npicardial activation delay during acute my-ocardial ischnmia in dogs. Circulation 1993;88:2381-2388.Hanich RF, Levine JH, Prood Ch, et al. Electropbys-iologic recovery in postiscbemic, stunned my-ocartiium despite persistent systolic dysfunction.Am Hoiirt J 1993: 125:23-32.Murdock DK, Loob JM. Euler DE. et al. Eleclro-I physiology of coronary reperfusion. A mecba-nism for reperfusion arrhythmias. Circulation 1980;61:175-182.Smitb WT, Fleet WF, Johnson TA, et al. The lhphase of ventricular arrhythmias in ischemic insitu porcine beart is related to changes in cell-to-ce!l electrical coupling. Circulation 1995;92:3051-3060.Cinca J, Worner F. Carreno A, et al. T-Q, S-T seg-ment mapping and byperemia in reperfused pigheart with ischemic preconditioning. Am } Pbysiol1992; 263 (Heart Circ Physio! 32):H1732-H1738.
PACE, Vol. 21 September 1998 1723

Related Documents