Ohio’s deer program goal has always been to provide enough deer to hunt and enjoy, but not so many that they cause undo economic hardship. In other words, social tolerances for deer, rather than biological consider- ations have largely driven individual county deer popu- lation goals. However, our deer program goal was writ- ten when Ohio’s deer herd was small and high quality habitat was everywhere. As a result, herd condition was not a concern at that time. However, deer numbers have increased dramatically since 1961, and the information presented in the following discussion begs the question: “In addition to public opinion, should biologists begin considering deer herd condition when setting population goals?” A Closer Look at Deer Herd Condition Trends in Ohio OHIO DEPARTMENT OF NATURAL RESOURCES DIVISION OF WILDLIFE Quality vs. Quantity

Welcome message from author
This document is posted to help you gain knowledge. Please leave a comment to let me know what you think about it! Share it to your friends and learn new things together.
Transcript

Ohio’s deer program goal has always been to provide enough deer to hunt and enjoy, but not so many that they cause undo economic hardship. In other words, social tolerances for deer, rather than biological consider-ations have largely driven individual county deer popu-lation goals. However, our deer program goal was writ-ten when Ohio’s deer herd was small and high quality habitat was everywhere. As a result, herd condition was not a concern at that time. However, deer numbers have increased dramatically since 1961, and the information presented in the following discussion begs the question:
“In addition to public opinion, should biologists begin considering deer herd condition when
setting population goals?”
A Closer Look at Deer Herd Condition Trends in Ohio
OHIO DEPARTMENT OF NATURAL RESOURCES
DIVISION OF WILDLIFE
Quality vs. Quantity
2
IN THIS BOOK
Reproductive Performance.......................2
Yearling Antler Beam Diameter.................4
Trophy Buck Potential...............................4
Buck Age Structure...................................6
Hunter Bias...............................................6
Non-resident Hunters...............................7
National Record-keeping Organizations............................7
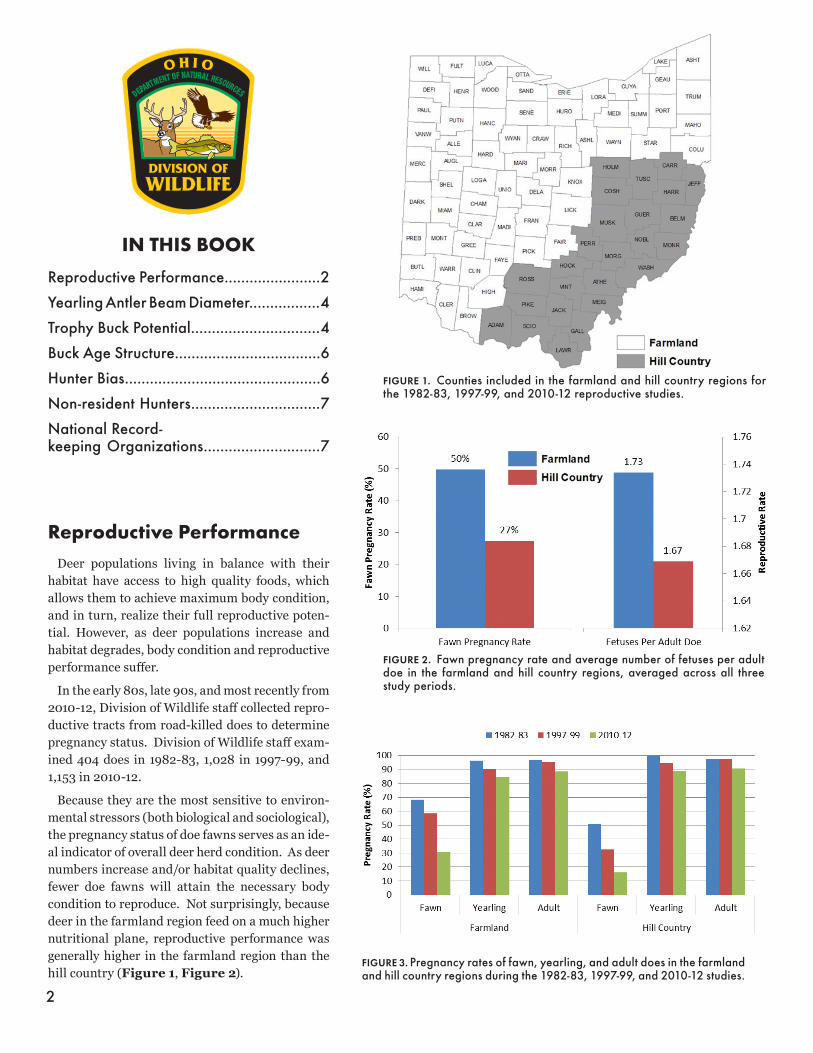
Reproductive PerformanceDeer populations living in balance with their
habitat have access to high quality foods, which allows them to achieve maximum body condition, and in turn, realize their full reproductive poten-tial. However, as deer populations increase and habitat degrades, body condition and reproductive performance suffer.
In the early 80s, late 90s, and most recently from 2010-12, Division of Wildlife staff collected repro-ductive tracts from road-killed does to determine pregnancy status. Division of Wildlife staff exam-ined 404 does in 1982-83, 1,028 in 1997-99, and 1,153 in 2010-12.
Because they are the most sensitive to environ-mental stressors (both biological and sociological), the pregnancy status of doe fawns serves as an ide-al indicator of overall deer herd condition. As deer numbers increase and/or habitat quality declines, fewer doe fawns will attain the necessary body condition to reproduce. Not surprisingly, because deer in the farmland region feed on a much higher nutritional plane, reproductive performance was generally higher in the farmland region than the hill country (Figure 1, Figure 2).
FIGURE 1. Counties included in the farmland and hill country regions for the 1982-83, 1997-99, and 2010-12 reproductive studies.
FIGURE 2. Fawn pregnancy rate and average number of fetuses per adult doe in the farmland and hill country regions, averaged across all three study periods.
FIGURE 3. Pregnancy rates of fawn, yearling, and adult does in the farmland and hill country regions during the 1982-83, 1997-99, and 2010-12 studies.

3
In the early 1980s, 68% of fawns in farmland and 51% of fawns in the hill country were preg-nant (Figure 3). Fawn pregnancy rates dropped to 58% in the farmland and 32% in the hill country by the late 1990s, and we observed our lowest fawn pregnancy rates to date in the 2010-12 study, where only 31% of farmland and 16% of hill country fawns bred. Pregnancy rates also declined for yearling and adult does over the course of the three studies (Figure 3).
Examining regional trends in the buck harvest, an indirect measure of total deer population size, suggests that growth in the deer herd likely contrib-uted to the observed declines in fawn pregnancy rate (Figure 4).
While pregnancy rates are the most direct mea-sure of herd health and productivity, they are also costly and time consuming to estimate. The num-ber of fawns harvested per adult doe is a product of reproductive performance as well as fawn survival, and may provide a useful measure of herd condition when viewed over time. If fewer fawns are born as a result of declining herd health, fewer fawns will be harvested, all-else being equal. If we assume that hunter selectivity and survival rates are relatively constant over time, a decline in the number of fawns per doe in the harvest is likely a product of declin-ing herd condition. Figure 5 provides strong evi-dence that, indeed, the number of fawns harvested per doe is a good indicator of herd productivity. The decline in fawns per doe in the harvest (an index of herd health) mirrored the decline in fawn pregnan-cy rates (a direct measure of herd health) for both the farmland and hill country regions.
From the early 1980s through 2011, the number of fawns harvested per adult doe has steadily de-clined (Figure 6). It is interesting to note that it has remained stable or has slightly increased since 2011. Several factors may explain this trend. First, recent attempts to reduce deer numbers have been successful, possibly creating improved habitat con-ditions, which in turn, has increased or maintained reproductive performance. Second, with fewer harvest opportunities, hunters may have become less selective, harvesting a greater proportion of fawns than in years prior.
FIGURE 4. Relationship between the decline in fawn pregnancy rate (grey bars) and growth of the deer population (red lines) in both the farmland and hill country regions.
FIGURE 5. Relationship between the decline in fawn pregnancy rate (grey bars) and the associated decline in fawns harvested per doe (red lines) for both the farmland and hill country regions.
FIGURE 6. Long-term trend in fawns harvested per doe, 1977-2013.

4
Yearling Antler Beam Diameter Because body growth and maintenance takes precedence over antler development, nutrients must first be allocated to meet the
demands of increasing body size before they can be used for developing antlers. Numerous studies have shown that antler size, particularly among bucks growing their first set of antlers, is heavily influenced by habitat quality – as habitat quality declines, so too does yearling antler size.
With the exception of the Western farmland region, yearling antler beam diameter has steadily declined statewide since the early 1970s (Figure 7). Given the growth of our deer population over the period of these declines, it is very likely that – similar to reproductive performance – antler development has also suffered due to declining habitat quality. However, in Hancock and Williams counties, and presumably in most of the farmland region, where deer feed on a much higher nutritional plane, it appears that deer populations have not grown large enough to affect yearling antler beam diameters.
Trophy Buck PotentialAs previous analyses illustrate, herd condition has slowly deteriorated over the past several decades. Despite efforts to educate
Ohio’s hunters on the relationship between increasing herd size and decreasing herd quality, there doesn’t seem to be much sup-port for reducing deer populations. Part of the reluctance to embrace lower deer numbers is likely due to the fact that the changes in herd condition have been very subtle, to the point of being unnoticeable. Furthermore, as long as hunters continue to harvest record book bucks, the hunting community will continue to believe that “all is well.” Indeed, the popular media certainly leaves you with this impression, as Ohio bucks have graced magazine covers and many media outlets have touted Ohio as a top destina-tion for trophy hunters. However, the combination of more deer on lower quality habitat has impacted trophy buck production.
FIGURE 7. Long-term trends in average yearling antler beam diameter, 1973-2013.

5
In 1977, 12,390 antlered bucks were harvested statewide. Of these, 151 would be inducted into Ohio’s Buckeye Big Buck Club (BBBC). With the ex-ception of a dip about once every decade beginning with the early to mid-1980s, the number of bucks added to the BBBC has grown steadily from the late 1970s through 2012 (Figure 9). At first glance, this trend would seem to contradict findings that point to declining herd condition. If herd and hab-itat health is supposedly suffering, how do we con-tinue to add record numbers of bucks to the BBBC each year? The number of bucks entered into the BBBC is largely a function of population size. Larg-er deer populations lead to larger buck harvests, and ultimately more BBBC entries, up to a point. To gain a clearer picture of how declining habitat quality has impacted the trophy buck harvest, we have to consider whether the number of trophy entries have actually kept pace with the buck har-vest. In other words, we must consider the number of BBBC entries in proportion to the total number of bucks harvested each year. For example, 41,076 bucks were harvested in 1990. Of those, 414, or ap-proximately 10 of every 1,000 ((414/41,076)*1,000) bucks harvested that year qualified for the Club. Al-though the average number of BBBC entries from 2004-2012 (530 entries per year) was slightly high-er than in 1990, the average buck harvest over the same time period (87,000) was more than twice that of the harvest in 1990! By the 2012 season, only five of every 1,000 bucks harvested qualified for the Club (Figure 10). Simply put, the odds of a buck qualifying for the BBBC in 2012 were half what they were in 1990!
Despite the increases in BBBC entries from 1977-2012, the decline in the proportion of the buck har-vest qualifying for the BBBC is consistent with the downward trend in herd condition noted above.
The number of BBBC entries consistently tracked the annual buck harvest (about 1% of the harvest was entered into the BBBC) up until the early 2000s (Figure 11). As deer populations approached all-time highs in the mid-2000s, the number of re-cord-book entries no longer kept pace with the buck harvest (Figure 11).
The number of bucks entered into the BBBC each year is not only a function of the absolute number of bucks harvested, but also a host of other factors in-cluding the availability of scorers, number of scor-ing events, hunter selectivity, and the age structure of the population. Below we address these and other competing explanations for the observed decline in trophy production.
FIGURE 9. Buckeye Big Buck Club (BBBC) entries, 1977-2012.
FIGURE 10. Number of bucks entered into the Buckeye Big Buck Club (BBBC) for every 1,000 bucks harvested, 1990-2012.
FIGURE 11. Long term trends in buck harvest and BBBC entries, 1977-2012.

6
FIGURE 13. Trends in the age structure of harvested bucks, 1980 – 2013.
FIGURE 14. Average B&C score (inches) for typical and non-typical bucks entered in the Buckeye Big Buck Club, 1990-2012.
Buck Age StructureIt is well established that as a buck ages, its antlers
get larger each year until approximately 5 ½ to 6 ½ years of age (Figure 12). If our herd was getting younger rather than older over the period in ques-tion, average antler size would naturally be getting smaller, all else being equal.
However, as is evident from Figure 13, our herd was actually getting older, not younger. More bucks are reaching the older age classes than ever before, and if antler size was keeping pace, we would ex-pect an increase in average antler size and, in turn, an increase in the number of BBBC entries rather than a decrease. The age structure of our buck pop-ulation is not a contributing factor to the declining trend in BBBC entries.
Hunter BiasCould hunter biases be contributing to the decline
in the number of BBBC entries? Hunters that have already entered a buck into the Club may not choose to enter another, especially if it didn’t score as high as the first. Second, with the increased popularity and awareness of large antlered bucks, quality deer management, and the use of game cameras, hunters today are likely more selective in their buck harvest than ever before. Many now hunt a specific buck and may pass on other opportunities. However, if either or both of these factors were contributing to the de-cline in BBBC entries, only the “cream of the crop” would be entered into the Club, and, as a result, the average score of those going into the Club should in-crease over time, all else being equal. However, this has not happened, as the average score for typical and non-typical entries has remained stable since 1990 (Figure 14).
Furthermore, considering that non-typicals have accounted for a significantly larger proportion of the entries from 2002-2012 than the years 1990-2001, and the minimum score for a non-typical entry (160 B&C) is 20 inches more than a typical (140 B&C), the average score of all entries should have increased in recent years. However, the average score from 2002-2012 (156 B&C) was only slightly higher than the 154 B&C average from 1990-2001 (Figure 15). Changes in hunter selectivity do not appear to be a factor in the observed decline in the BBBC entries.
FIGURE 12. Percent of eventual maximum score achieved by bucks at each age. Data points adapted from research conducted at Mississippi State and Texas A&M-Kingsville Universities.

7
FIGURE 15. Average antler score of all Buckeye Big Buck Club entries (black line) and proportion of entries that were non-typical (blue bars) from 1990-2012.
FIGURE 16. Non-resident license sales from 2001-2013 (black line), and per-centage of the annual buck harvest attributed to non-residents, 2005-2013 (blue bars).
FIGURE 17. Percent of resident and non-resident buck harvests entered in the Buckeye Big Buck Club (BBBC), 2005-2012. Both residents and non-residents exhibited the same pattern over time.
Non-resident HuntersAnother potential bias is a change in the composi-
tion of the hunting population in Ohio, specifically the growth of the non-resident component. Without that “Ohio connection”, non-resident hunters may be less likely to enter their deer in the BBBC, instead opting for a national organization. In 2001, Ohio sold 13,670 non-resident hunting licenses. By 2013, sales had increased to almost 40,000 (Figure 16).
In 2005, non-residents accounted for just shy of 7% of the total antlered buck harvest. By 2013, non-residents accounted for 12% of the antlered buck harvest, and presumably more of the re-cord-book bucks harvested each year. Thus, it is conceivable that the decline in BBBC entries could be due to a greater non-resident hunting popula-tion, provided that they were less likely to enter their deer into the BBBC than resident hunters. As is evident in Figure 17, this clearly is not the case. The proportion of the non-resident buck harvest entered in the Club from 2005-2012 has remained relatively stable, between 0.2 and 0.4% (Figure 17). Moreover, non-resident entries follow nearly the exact same pattern as resident entries over the same time period. Thus, while non-residents are taking more bucks each year, and more trophies, there is no evidence to suggest that this is contrib-uting to the decline in BBBC entries.
National Record-KeepingOrganizations
Finally, we revisit the issue of hunter bias, both resident and non-resident, and the potential effect that national record-keeping organizations may have on a hunter’s decision to enter their deer in the BBBC. While entry into a national organization doesn’t preclude one from also entering their deer in a state organization, hunters opting for national recognition in the Pope and Young (P&Y) or Boone and Crockett (B&C) Clubs rather than the BBBC could be contributing to the decline in BBBC en-tries. Figure 18 shows that this is indeed the case; hunters have become more likely to forgo the BBBC for entry into the national record books. In 1990, there was only one P&Y or B&C entry for every five BBBC entries. By 2012, there was one national en-try for every two BBBC entries. Clearly, from 1990 through 2012, there was a growing tendency for hunters to opt for national rather than state recog-nition. While this shift could provide at least a par-tial explanation for the decline in the number of BBBC entries, it fails to address the larger issue of declining herd condition.

If a decline in the proportion of the annual antlered buck harvest qualifying for the “record books” – the combination of national and state – is in fact a manifestation of declining herd quality, the combination of state and national entries leave little room for doubt. The number of record book entries, as a proportion of total bucks harvested, has declined in Ohio as a result of increases in population size and changes in habitat quality (Figure 19).
Despite the overwhelming increases in the popularity of deer management and the focus on large-antlered bucks in recent years that would generate more interest by hunters to have their bucks recognized by a record-keeping organi-zation, fewer bucks as a percentage of the an-nual antlered buck harvest sport large enough antlers to qualify for the record books. Our analyses of long term condition, productivity, and antler size data confirm that the quality of Ohio’s deer herd, while still relatively good, has declined due to increases in deer population size and changes in habitat quality across most of our state over the past several decades. Not only have we seen significant declines in fawn preg-nancy rate, adult reproductive rate, and yearling beam diameter, but our analysis of record book entries shows a decline in trophy buck entries as well. Efforts by the Division of Wildlife to re-duce populations to goal, albeit successful, have not been well received by all. Social tolerances aside, the time is upon us to integrate herd and habitat health into our deer management goal. Perhaps our analysis of declining trophy buck potential will provide a fresh perspective as we go into the population goal setting process in the summer of 2015. FIGURE 19. Number of bucks entered into any record book (Pope and Young,
Boone and Crockett, and Buckeye Big Buck Club) for every 1,000 bucks harvested (black line), and population trend (red line) from 1990-2012.
FIGURE 18. Combined Pope and Young (P&Y) and Boone and Crockett (B&C) entries per Buckeye Big Buck Club (BBBC) entry, 1990-2012. The likelihood of hunters entering their trophy in a national record book in lieu of the BBBC increased over time.
PRODUCT ID 3120
Related Documents