QTL mapping of fire blight resistance in apple Muhammad A. Khan 1 , Brion Duffy 2 , Cesare Gessler 1 and Andrea Patocchi 1, * 1 Plant Pathology, Institute of Integrative Biology (IBZ), ETH Zurich, 8092, Zurich, Switzerland; 2 Agroscope FAW Wa ¨denswil, Swiss National Competence Center for Fire Blight, CH-8820 Wa ¨denswil, Switzerland; *Author for correspondence (e-mail: [email protected]; fax: +41-1-632-15-72) Received 3 May 2005; accepted in revised form 11 January 2006 Key words: Disease resistance, Erwinia amylovora, Malus, Marker assisted selection, Quantitative trait loci Abstract Fire blight caused by the bacterium Erwinia amylovora is a severe threat to apple and pear orchards worldwide. Apple varieties exhibit a wide range of relative susceptibility/tolerance to fire blight. Although, no monogenic resistance against fire blight has been identified yet, recent evidence indicates the existence of quantitative resistance. Potential sources of fire blight resistance include several wild Malus species and some apple cultivars. F1 progenies of ‘Fiesta’‘Discovery’ were inoculated with the Swiss strain Ea 610 and studied under controlled conditions to identify quantitative trait loci (QTLs) for fire blight resistance. Disease was evaluated at four time points after inoculation. Shoot lesion length and the area under disease progress curve (AUDPC) values were used for QTL analysis. One significant (LOD score of 7.5 –8.1, p<0.001) QTL was identified on the linkage group 7 of ‘Fiesta’ (F7). The F7 QTL explained about 37.5 –38.6% of the phenotypic variation. Abbreviations: AUDPC – Area under disease progress curve; DAI – Days after inoculation; F7 – Linkage group 7 of Fiesta; LOD – Logarithm of odds; MQM – Multiple QTL Model; PLL – Percent lesion length; QTL – Quantitative trait loci Introduction Fire blight, caused by the Gram-negative enterobacterium Erwinia amylovora, infects many members of the Rosaceae family and is a major economic threat to apple, pear and quince pro- duction worldwide. Since first being described in the Eastern USA in 1780, fire blight has spread throughout North America, and to, New Zea- land, Western and Central Europe and the Middle East (Bonn and Van der Zwet 2000). Fire blight attacks flowers, leaves, branches, roots and fruits and in severe cases entire trees and orch- ards can be devastated within a season. The pathogen invades through natural openings and wounds. The occurrence and severity of fire blight is determined by the interaction between the pathogen, favorable weather conditions and host plant susceptibility/tolerance (Thomson 2000). Control options are largely limited to exclusion (quarantine), eradication, and antibi- otics (banned in many countries) (McManus et al. 2002; Norelli et al. 2003). Some success has been achieved using growth regulators (Radem- acher and Kober 2003) and biocontrol (Johnson and Stockwell 1998). Molecular Breeding (2006) Ó Springer 2006 DOI 10.1007/s11032-006-9000-y

Welcome message from author
This document is posted to help you gain knowledge. Please leave a comment to let me know what you think about it! Share it to your friends and learn new things together.
Transcript
QTL mapping of fire blight resistance in apple
Muhammad A. Khan1, Brion Duffy2, Cesare Gessler1 and Andrea Patocchi1,*1Plant Pathology, Institute of Integrative Biology (IBZ), ETH Zurich, 8092, Zurich, Switzerland;2Agroscope FAW Wadenswil, Swiss National Competence Center for Fire Blight, CH-8820 Wadenswil,Switzerland; *Author for correspondence (e-mail: [email protected]; fax: +41-1-632-15-72)
Received 3 May 2005; accepted in revised form 11 January 2006
Key words: Disease resistance, Erwinia amylovora, Malus, Marker assisted selection, Quantitative trait loci
Abstract
Fire blight caused by the bacterium Erwinia amylovora is a severe threat to apple and pear orchardsworldwide. Apple varieties exhibit a wide range of relative susceptibility/tolerance to fire blight. Although,no monogenic resistance against fire blight has been identified yet, recent evidence indicates the existence ofquantitative resistance. Potential sources of fire blight resistance include several wild Malus species andsome apple cultivars. F1 progenies of ‘Fiesta’�‘Discovery’ were inoculated with the Swiss strain Ea 610 andstudied under controlled conditions to identify quantitative trait loci (QTLs) for fire blight resistance.Disease was evaluated at four time points after inoculation. Shoot lesion length and the area under diseaseprogress curve (AUDPC) values were used for QTL analysis. One significant (LOD score of 7.5 –8.1,p<0.001) QTL was identified on the linkage group 7 of ‘Fiesta’ (F7). The F7 QTL explained about37.5 –38.6% of the phenotypic variation.
Abbreviations: AUDPC – Area under disease progress curve; DAI – Days after inoculation; F7 – Linkagegroup 7 of Fiesta; LOD – Logarithm of odds; MQM – Multiple QTL Model; PLL – Percent lesion length;QTL – Quantitative trait loci
Introduction
Fire blight, caused by the Gram-negativeenterobacterium Erwinia amylovora, infects manymembers of the Rosaceae family and is a majoreconomic threat to apple, pear and quince pro-duction worldwide. Since first being described inthe Eastern USA in 1780, fire blight has spreadthroughout North America, and to, New Zea-land, Western and Central Europe and theMiddle East (Bonn and Van der Zwet 2000). Fireblight attacks flowers, leaves, branches, roots andfruits and in severe cases entire trees and orch-
ards can be devastated within a season. Thepathogen invades through natural openings andwounds. The occurrence and severity of fireblight is determined by the interaction betweenthe pathogen, favorable weather conditions andhost plant susceptibility/tolerance (Thomson2000). Control options are largely limited toexclusion (quarantine), eradication, and antibi-otics (banned in many countries) (McManuset al. 2002; Norelli et al. 2003). Some success hasbeen achieved using growth regulators (Radem-acher and Kober 2003) and biocontrol (Johnsonand Stockwell 1998).
Molecular Breeding (2006) � Springer 2006
DOI 10.1007/s11032-006-9000-y
No fire blight resistant commercial cultivarsare available although there are reports of a largevariability among apple genotypes regarding fireblight susceptibility/tolerance. Little is knownabout the genetic basis of this tolerance (Norelliet al. 1987). Several wild Malus species have beenidentified as potential sources for fire blightresistance, including M. robusta, M. sublobata,M. atrosanguinea, M. prunifolia and M. fusca(Aldwinckle and Beer 1979). A promising levelof resistance has also been observed in someMalus�domestica cultivars, such as ‘Nova Easy-gro’ and ‘Florina’ (Aldwinckle and van der Zwet1979; Keck et al. 1997; Fischer and Fischer1999). Monogenic resistance to fire blight has notbeen identified in apple and it is thought thatdisease resistance is a quantitative trait (Korbanet al. 1988; Brisset et al. 2002; Dondini et al.2004).
Quantitative Trait Loci (QTL) mapping canidentify chromosomal regions controlling quanti-tative traits. This approach has been successfullyused to study many agronomic traits includingdisease resistance in many plant species includingtomato (Goldman et al. 1995; Mangin et al.1999), maize (Berke and Rocheford 1995;Krakowsky et al. 2004), rice (Ishimaru et al.2001; Zenbayashi et al. 2002) and wheat(Anderson et al. 1993; Otto et al. 2002). Geneticlinkage maps, which are an essential foundationfor QTL analysis, are now available for apple(Conner et al. 1998; Maliepaard et al. 1998; Kinget al. 2001; Liebhard et al. 2003b; Kenis andKeulemans 2005). Conner et al. (1998) identifiedQTLs for growth and development characteristicsin juvenile apple trees. King et al. (2000, 2001)reported the mapping of QTLs for fruit fleshfirmness and fruit texture. Liebhard et al. (2003a)mapped several quantitative physiological traits,such as stem diameter, height, leaf size, numberof flowers, sugar content of fruit and fruit acidity.QTLs have also been found for apple scab resis-tance (Durel et al. 2003; Liebhard et al. 2003c).Recently the QTL mapping approach has beenused to study fire blight resistance in pear(Dondini et al. 2004) and apple (Calenge et al.2004a, 2005). In this study, we applied theavailable linkage map data for the apple cross‘Fiesta’� ‘Discovery’ to identify QTLs for fireblight resistance (Liebhard et al. 2003b).
Materials and methods
Plant material
Eighty-six F1 progeny plants from the‘Fiesta’�‘Discovery’ cross previously used byLiebhard et al. (2003a) were chosen at random. Sixreplications for each of theses 86 progenies alongwith 12 replications of each parent were whip-grafted on ‘virus-free M.9 T337’ rootstocks. Plantswere grown in the quarantine greenhouse facilityat Agroscope FAW Wadenswil (Swiss FederalResearch Station for Horticulture). Space limita-tion necessitated splitting the replications into twoadjacent greenhouse cabins (three replications/greenhouse cabin). Temperature and humiditywere controlled throughout the experiment (rela-tive humidity was 70% and temperature wasmaintained at 21 –25 �C).
Inoculation and evaluation of disease resistance
Inoculation was performed using the SwissE. amylovora strain Ea 610. Inoculum was pre-pared by growing Ea 610 on plates of King’smedium B (KB) for 24 –36 h at 27 �C, scraping thebacterial lawn into tubes with phosphate-bufferedsaline (PBS, pH 7.2), and adjusting the concen-tration to approximately 1 � 109 cfu/ml based onoptical absorbance at 600 nm. After 4 –5 weeks,plants with minimum shoot length of 13.5 cm wereinoculated as described by Momol et al. (1998).Inoculum was introduced to the shoot tip byinserting a syringe of 1.3-mm diameter (18-gauge)needle through the stem just above the youngestunfolded leaf. Plants in the two greenhouse cabinswere inoculated two days apart. The first necroticsymptoms were visible at 3 days after inoculation.Lesion length (cm) was measured at four timepoints after inoculation (i.e., 6, 13, 20 and 27 daysafter inoculation (DAI)). After 27 days, diseaseprogress completely ceased.
Statistical analysis
Statistical analysis was performed using SYSTATsoftware (SPSS 2000) (version 10; SPSS Corp.,Chicago, IL). Prior to analysis, percent lesion
length (PLL) was calculated by dividing the lesionlength (cm) by the shoot length (cm; measured at6 DAI) (Norelli et al. 1984). An area under diseaseprogress curve (AUDPC) value was calculated foreach progeny (Campbell and Madden 1990). PLLmeasurements at 6, 13, 20 and 27 DAI were inte-grated using the formula
AUDPC ¼Xn�1
i¼1½ðtiþ1 � tiÞðyi þ yiþ1Þ=2�
where t is time in days of each measurement, y isthe PLL at each measurement and n is the numberof measurements.
Data were checked for outliers, normal distri-bution and progeny�greenhouse cabin interac-tions. Outlying data from two progeny weredetected and removed. Differences between green-house cabins were significant for all measurements(6, 13, 20 and 27 DAI) and AUDPC. Plants ingreenhouse cabin 1 consistently had longer PLLthan plants in greenhouse cabin 2, however noprogeny�greenhouse cabin interaction was found.Finally, data for both greenhouse cabins werepooled together. PLL for each progeny was aver-aged and used to calculate mean, range, standarddeviation, and 95% confidence interval (CI). Datawere not normally distributed and shoot length(cm), absolute lesion length (cm), PLL andAUDPC for each progeny was log transformed.Log transformed and non-transformed PLL andAUDPC were used to perform analysis of varianceand to estimate broad sense heritability. Broadsense heritability was estimated by the formula,
h2 ¼ r2g=r2p and r2p ¼ ðr2g þ r2e=nÞ
where, r2g is genetic variance, r2p is phenotypicvariance; r2e is environmental variance and n is themean number of replicates per genotype (Calengeet al. 2004b).
QTL mapping
Only log transformed data were used for furtheranalysis. Least Square mean values were calculatedfor PLL at four different intervals and AUDPC foreach progeny using the GLM procedure of SY-STAT and then used for QTL analysis (Krakowskyet al. 2004). Least Square mean values for shootlength and absolute lesion length were also esti-
mated and used in QTL mapping. The maps usedin QTL analysis were those already used by Lieb-hard et al. (2003b) for both ‘Fiesta’ and ‘Discov-ery’. Maps consisted of a total of 734 markers,whereas ‘Fiesta’ had 345 markers including 137AFLP, 108 SSR, and 100 RAPD markers, and‘Discovery’ had 389 markers including 160 AFLP,103 SSR, 1 SCAR and 125 RAPD markers with 91SSRs in common on both maps (Liebhard et al.2003b). The maps were calculated with 251 indi-viduals of each parent. The average linkage grouplength was 66.96 cM for ‘Fiesta’ and 84.36 cM for‘Discovery’. Logarithm of odds (LOD) thresholdvalue was calculated following Van Ooijen (1999).Significant (LOD>4.5) threshold was set to declarea QTL significant at the 95% confidence level (Kinget al. 2000).
MapQTL version 4 (Van Ooijen et al. 2000) wasused for QTL mapping. Preliminary QTL analysiswas done by interval mapping and Kruskal –Wallis test. Multiple QTL mapping (MQM) wasperformed only for QTL with LOD score exceed-ing the significant LOD threshold by intervalmapping (Van Ooijan, personal communication).For MQM, marker with highest LOD value wastaken as a co-factor (Hunt et al. 1998). The 2-LOD support interval was calculated to estimatethe position of significant QTL with �95% confi-dence (King et al. 2000; Durel et al. 2003). Intervalmapping, Kruskal –Wallis test and MQM resultswere used to characterize the QTL (Atienza et al.2004). Phenotypic variation explained by QTL wasestimated by the multiple regression method(Lauter and Doebley 2002).
The ‘Fiesta’�‘Discovery’ population was di-vided into sub-populations based upon the allelesof marker closest to the significant QTL at 6, 13,20 and 27 DAI and AUDPC and then the averagePLL was calculated for these sub-populations.Analysis of variance was performed to verifystatistical differences between the two sub-popu-lations at 6, 13, 20 and 27 DAI and AUDPC.
Results
Phenotypic evaluation of fire blight
Shoot length at the time of inoculation rangedfrom 13.7 to 48.4 cm with the average length of25.7, 26.2 and 29.0 cm for ‘Fiesta’, ‘Discovery’ and
their progenies (‘Fiesta’�‘Discovery’), respectively(Table 1). At 6 DAI, most of the plants showeddisease symptoms and the average PLL was almostdouble at 13 DAI while it remained constant after20 days (Table 1). The mean PLL of the progeniesranged from 2.6 to 26.4% at 6 DAI, from 4.2 to49.4% at 13 DAI and from 4 to 51.9% for both 20and 27 DAI. The 95% CI for mean PLL at 6 DAIdid not overlap the 95% CI for average PLL at 13,20 and 27 DAI, which means that PLL at 6 DAI
was significantly different from PLL at 13, 20 and27 DAI. The data was positively skewed andtransformation of the data normalized the distri-bution (Table 2). Genetic variation among theprogenies in our population were significant(p<0.001) for all measurements (6, 13, 20 and27 DAI) andAUDPC. Variance was less for 6 DAIthan 13, 20 and 27 DAI; however these latter threehad almost the same variance. Broad sense herita-bility ranged from 0.90 to 0.94 (Table 2).
Table 2. Comparison among PLL and log transformed PLL data for population of ‘Fiesta’�‘Discovery’.
Trait 6 DAI 13 DAI 20 DAI 27 DAI AUDPC
PLL Log trans.a PLL Log trans. PLL Log trans. PLL Log trans. PLL Log trans.
df 85
Variance components 42.2 0.06 147.0 0.08 174.0 0.08 177.3 0.08 54737.5 0.07
Broad sense heritability 0.90 0.91 0.92 0.94 0.92 0.94 0.92 0.94 0.92 0.94
Variance components, F-test results of corresponding mean squares and broad sense heritability at 6, 13, 20, 27 DAI and AUDPC.
F-test results in all cases were significant at p<0.001.aLog-transformed PLL data.
Table 1. Basic statistics for the mean PLL of parental cultivars and progeny plant of ‘Fiesta’�‘Discovery’.
Trait Basic statisticsa Fiesta Discovery Fiesta�Discovery
Shoot length Mean 25.70 26.22 29.01
Standard deviation 4.54 4.63 6.29
Range 18 –31 18 –34.50 13.75 –48.42
95% CI 22.46 –28.94 22.91 –29.53 27.66 –30.36
6 DAI Mean 10.78 13.14 12.56
Standard deviation 7.08 6.93 5.13
Range 2.00 –24.50 4.30 –25.90 2.64 –26.40
95% CI 5.72 –15.84 8.19 –18.10 11.46 –13.66
13 DAI Mean 17.33 19.58 23.26
Standard deviation 12.88 12.39 10.50
Range 2.00 –40.70 6.40 –46.40 4.25 –49.38
95% CI 8.12 –26.54 10.71 –28.44 21.01 –25.51
20 DAI Mean 18.87 20.63 25.19
Standard deviation 13.71 12.47 11.55
Range 2.00 –42.40 6.40 –47.80 4.04 –51.73
95% CI 9.06 –28.68 11.71 –29.55 22.71 –27.66
27 DAI Mean 19.04 21.49 25.69
Standard deviation 13.59 12.25 11.54
Range 2.00 –42.40 6.40 –47.80 4.04 –51.95
95% CI 9.32 –28.76 12.73 –30.25 23.22 –28.16
AUDPC Mean 357.73 402.80 472.98
Standard deviation 253.36 229.62 201.80
Range 42.00 –794.90 126.60 –867.40 88.23 –949.53
95% CI 176.48 –538.98 238.54 –567.06 429.71 –516.24
aMean, range, standard deviation, and 95% CI were calculated for the mean shoot length (cm), mean PLL at 6, 13, 20, 27 DAI and
mean AUDPC for parental cultivars and progeny plant of ‘Fiesta’�‘Discovery’ separately.
QTL mapping
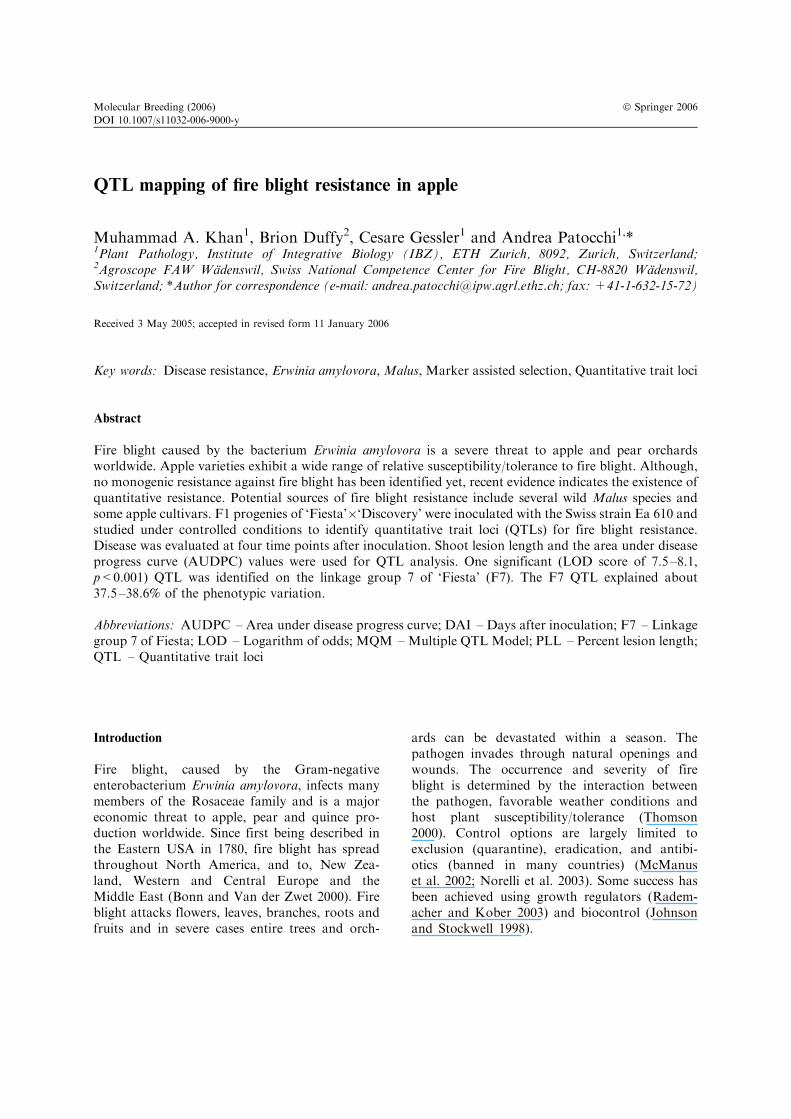
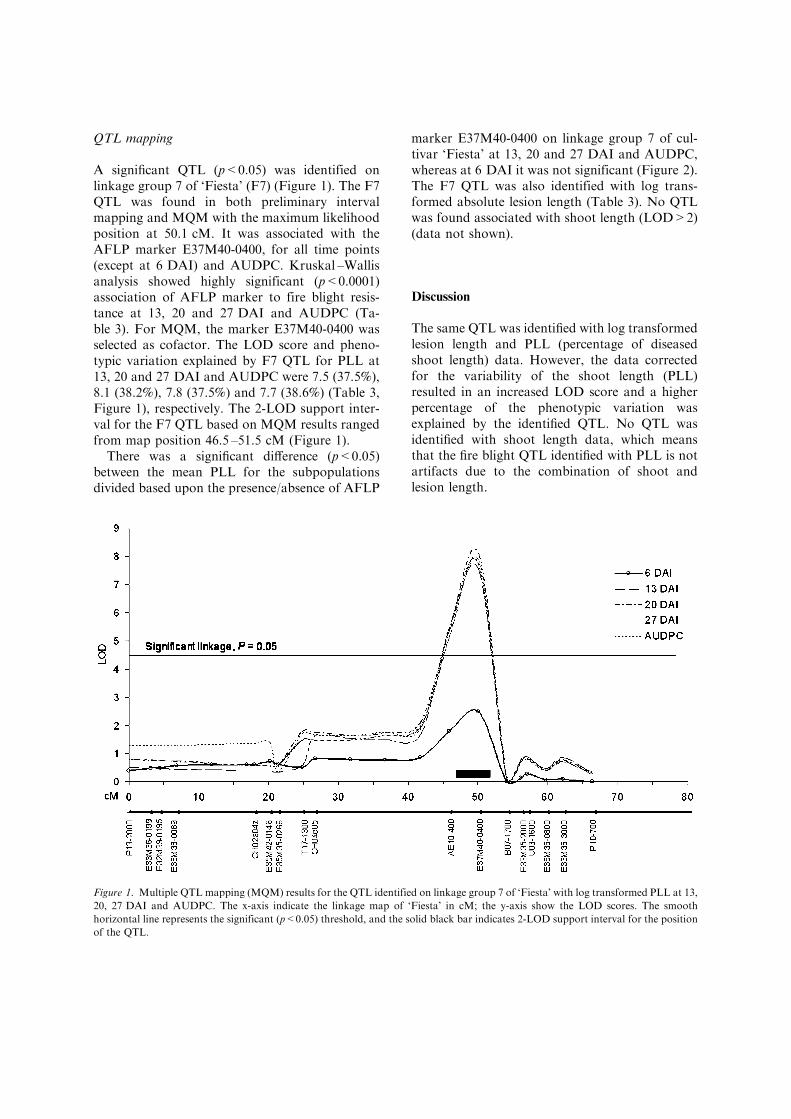
A significant QTL (p<0.05) was identified onlinkage group 7 of ‘Fiesta’ (F7) (Figure 1). The F7QTL was found in both preliminary intervalmapping and MQM with the maximum likelihoodposition at 50.1 cM. It was associated with theAFLP marker E37M40-0400, for all time points(except at 6 DAI) and AUDPC. Kruskal –Wallisanalysis showed highly significant (p<0.0001)association of AFLP marker to fire blight resis-tance at 13, 20 and 27 DAI and AUDPC (Ta-ble 3). For MQM, the marker E37M40-0400 wasselected as cofactor. The LOD score and pheno-typic variation explained by F7 QTL for PLL at13, 20 and 27 DAI and AUDPC were 7.5 (37.5%),8.1 (38.2%), 7.8 (37.5%) and 7.7 (38.6%) (Table 3,Figure 1), respectively. The 2-LOD support inter-val for the F7 QTL based on MQM results rangedfrom map position 46.5 –51.5 cM (Figure 1).
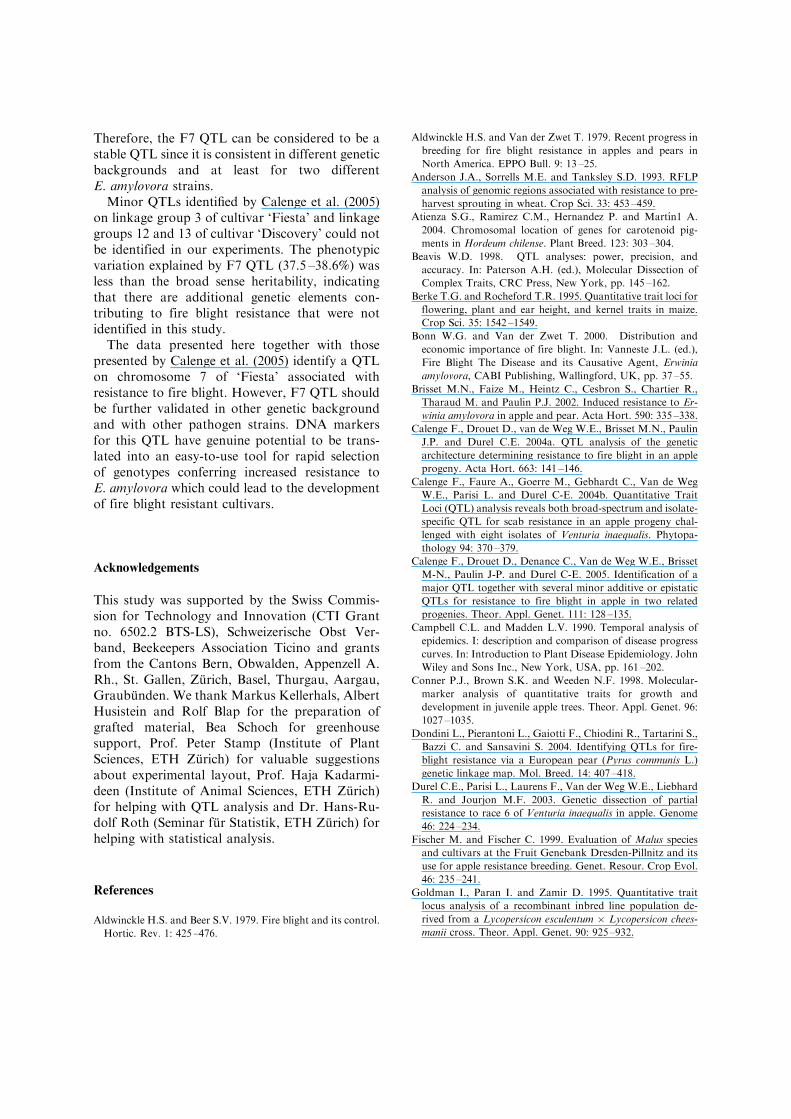
There was a significant difference (p<0.05)between the mean PLL for the subpopulationsdivided based upon the presence/absence of AFLP
marker E37M40-0400 on linkage group 7 of cul-tivar ‘Fiesta’ at 13, 20 and 27 DAI and AUDPC,whereas at 6 DAI it was not significant (Figure 2).The F7 QTL was also identified with log trans-formed absolute lesion length (Table 3). No QTLwas found associated with shoot length (LOD>2)(data not shown).
Discussion
The same QTL was identified with log transformedlesion length and PLL (percentage of diseasedshoot length) data. However, the data correctedfor the variability of the shoot length (PLL)resulted in an increased LOD score and a higherpercentage of the phenotypic variation wasexplained by the identified QTL. No QTL wasidentified with shoot length data, which meansthat the fire blight QTL identified with PLL is notartifacts due to the combination of shoot andlesion length.
Figure 1. Multiple QTL mapping (MQM) results for the QTL identified on linkage group 7 of ‘Fiesta’ with log transformed PLL at 13,
20, 27 DAI and AUDPC. The x-axis indicate the linkage map of ‘Fiesta’ in cM; the y-axis show the LOD scores. The smooth
horizontal line represents the significant (p<0.05) threshold, and the solid black bar indicates 2-LOD support interval for the position
of the QTL.
The QTL identified on linkage group 7 of‘Fiesta’ (F7) explained approximately 38% of thephenotypic variation. Kruskal –Wallis test alsoshowed highly significant association between themarker E37M40-0400 and this QTL. The F7 QTLwas identified at 13, 20 and 27 DAI, and the sameQTL could also be identified with AUDPC valueswhich might be explained by the strong correlationbetween PLL measurements and AUDPC. Incontrast to Calenge et al. (2005), we could notidentify any QTL at one week after inoculationwhich could be due to different strains or may bedue to different methods of inoculation used inboth studies (cutting vs. injection). Lesion mea-surements and PLL at 6, 13, 20 and 27 DAIshowed significant differences (p<0.05) betweenprogenies therefore, different intervals after inoc-ulation (6, 13, 20 and 27 DAI) can be very infor-mative about the disease development and couldbe used to calculate the AUDPC (Jorge and Ver-dier 2002). One possible explanation for the largeamount of phenotypic variation attributed to the
F7 QTL is the relatively small size of the progenypopulation. Beavis (1998) reported that whenpopulation size is small, QTLs with small effectcould be overestimated and vice versa for QTLswith large effect. In this study, the reduced popu-lation size may have led to underestimation of anumber of QTLs, overestimation of QTL effects,and a failure to quantify QTL interactions (Mel-chinger et al. 1998). More likely, however, F7 is areal QTL for fire blight resistance. This explana-tion is supported by the results of Calenge et al.(2004a, 2005), who identified a QTL in Fiesta inthe same region of chromosome 7 using thebacterial strain CFBP 1430 in two different geneticbackgrounds. The results reported here and thework of Calenge et al. (2004a, 2005), shared acommon SSR (CH04e05) on linkage group 7 ofthe map of cultivar ‘Fiesta’. The distance of thisSSR marker and the 2-LOD support intervalof the QTL identified in both studies overlapsuggesting they may be the same. Interestingly, theF7 QTL was identified with two different strains.
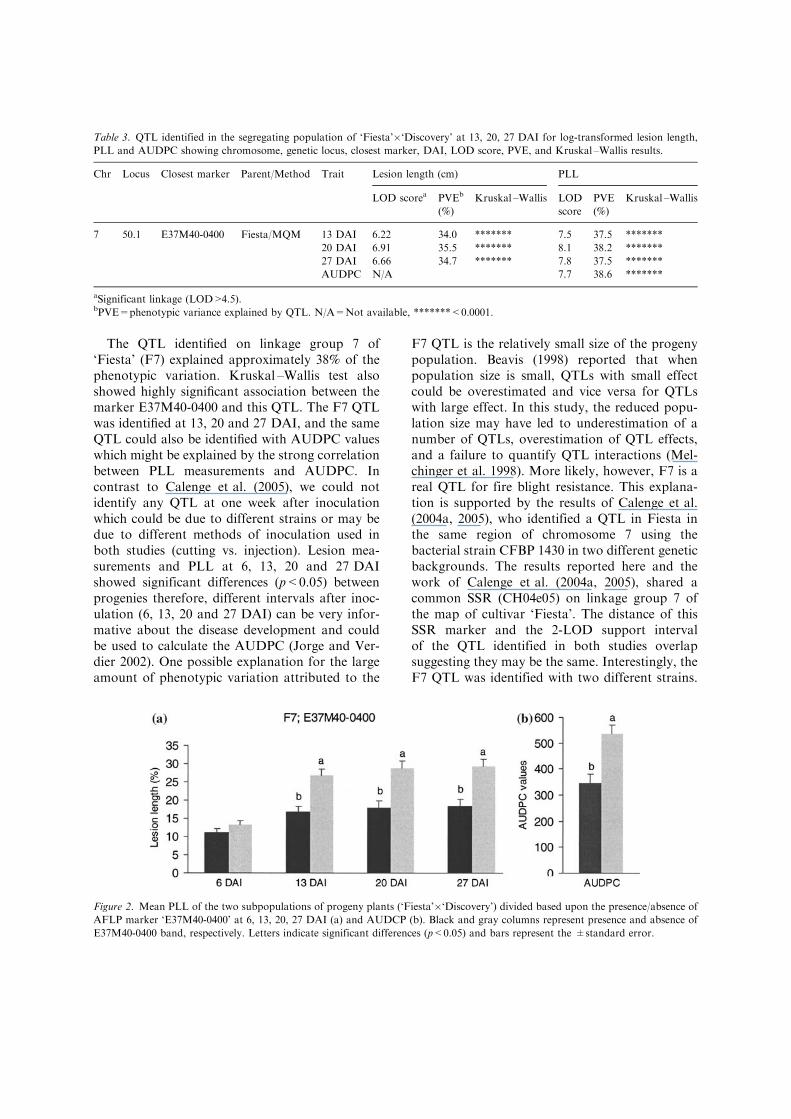
Table 3. QTL identified in the segregating population of ‘Fiesta’�‘Discovery’ at 13, 20, 27 DAI for log-transformed lesion length,
PLL and AUDPC showing chromosome, genetic locus, closest marker, DAI, LOD score, PVE, and Kruskal –Wallis results.
Chr Locus Closest marker Parent/Method Trait Lesion length (cm) PLL
LOD scorea PVEb
(%)
Kruskal –Wallis LOD
score
PVE
(%)
Kruskal –Wallis
7 50.1 E37M40-0400 Fiesta/MQM 13 DAI 6.22 34.0 ******* 7.5 37.5 *******
20 DAI 6.91 35.5 ******* 8.1 38.2 *******
27 DAI 6.66 34.7 ******* 7.8 37.5 *******
AUDPC N/A 7.7 38.6 *******
aSignificant linkage (LOD>4.5).bPVE=phenotypic variance explained by QTL. N/A=Not available, *******<0.0001.
Figure 2. Mean PLL of the two subpopulations of progeny plants (‘Fiesta’�‘Discovery’) divided based upon the presence/absence of
AFLP marker ‘E37M40-0400’ at 6, 13, 20, 27 DAI (a) and AUDCP (b). Black and gray columns represent presence and absence of
E37M40-0400 band, respectively. Letters indicate significant differences (p<0.05) and bars represent the ±standard error.
Therefore, the F7 QTL can be considered to be astable QTL since it is consistent in different geneticbackgrounds and at least for two differentE. amylovora strains.
Minor QTLs identified by Calenge et al. (2005)on linkage group 3 of cultivar ‘Fiesta’ and linkagegroups 12 and 13 of cultivar ‘Discovery’ could notbe identified in our experiments. The phenotypicvariation explained by F7 QTL (37.5 –38.6%) wasless than the broad sense heritability, indicatingthat there are additional genetic elements con-tributing to fire blight resistance that were notidentified in this study.
The data presented here together with thosepresented by Calenge et al. (2005) identify a QTLon chromosome 7 of ‘Fiesta’ associated withresistance to fire blight. However, F7 QTL shouldbe further validated in other genetic backgroundand with other pathogen strains. DNA markersfor this QTL have genuine potential to be trans-lated into an easy-to-use tool for rapid selectionof genotypes conferring increased resistance toE. amylovora which could lead to the developmentof fire blight resistant cultivars.
Acknowledgements
This study was supported by the Swiss Commis-sion for Technology and Innovation (CTI Grantno. 6502.2 BTS-LS), Schweizerische Obst Ver-band, Beekeepers Association Ticino and grantsfrom the Cantons Bern, Obwalden, Appenzell A.Rh., St. Gallen, Zurich, Basel, Thurgau, Aargau,Graubunden. We thank Markus Kellerhals, AlbertHusistein and Rolf Blap for the preparation ofgrafted material, Bea Schoch for greenhousesupport, Prof. Peter Stamp (Institute of PlantSciences, ETH Zurich) for valuable suggestionsabout experimental layout, Prof. Haja Kadarmi-deen (Institute of Animal Sciences, ETH Zurich)for helping with QTL analysis and Dr. Hans-Ru-dolf Roth (Seminar fur Statistik, ETH Zurich) forhelping with statistical analysis.
References
Aldwinckle H.S. and Beer S.V. 1979. Fire blight and its control.
Hortic. Rev. 1: 425 –476.
Aldwinckle H.S. and Van der Zwet T. 1979. Recent progress in
breeding for fire blight resistance in apples and pears in
North America. EPPO Bull. 9: 13 –25.
Anderson J.A., Sorrells M.E. and Tanksley S.D. 1993. RFLP
analysis of genomic regions associated with resistance to pre-
harvest sprouting in wheat. Crop Sci. 33: 453 –459.
Atienza S.G., Ramirez C.M., Hernandez P. and Martın1 A.
2004. Chromosomal location of genes for carotenoid pig-
ments in Hordeum chilense. Plant Breed. 123: 303 –304.
Beavis W.D. 1998. QTL analyses: power, precision, and
accuracy. In: Paterson A.H. (ed.), Molecular Dissection of
Complex Traits, CRC Press, New York, pp. 145 –162.
Berke T.G. and Rocheford T.R. 1995. Quantitative trait loci for
flowering, plant and ear height, and kernel traits in maize.
Crop Sci. 35: 1542 –1549.
Bonn W.G. and Van der Zwet T. 2000. Distribution and
economic importance of fire blight. In: Vanneste J.L. (ed.),
Fire Blight The Disease and its Causative Agent, Erwinia
amylovora, CABI Publishing, Wallingford, UK, pp. 37 –55.
Brisset M.N., Faize M., Heintz C., Cesbron S., Chartier R.,
Tharaud M. and Paulin P.J. 2002. Induced resistance to Er-
winia amylovora in apple and pear. Acta Hort. 590: 335 –338.
Calenge F., Drouet D., van de Weg W.E., Brisset M.N., Paulin
J.P. and Durel C.E. 2004a. QTL analysis of the genetic
architecture determining resistance to fire blight in an apple
progeny. Acta Hort. 663: 141 –146.
Calenge F., Faure A., Goerre M., Gebhardt C., Van de Weg
W.E., Parisi L. and Durel C-E. 2004b. Quantitative Trait
Loci (QTL) analysis reveals both broad-spectrum and isolate-
specific QTL for scab resistance in an apple progeny chal-
lenged with eight isolates of Venturia inaequalis. Phytopa-
thology 94: 370 –379.
Calenge F., Drouet D., Denance C., Van de Weg W.E., Brisset
M-N., Paulin J-P. and Durel C-E. 2005. Identification of a
major QTL together with several minor additive or epistatic
QTLs for resistance to fire blight in apple in two related
progenies. Theor. Appl. Genet. 111: 128 –135.
Campbell C.L. and Madden L.V. 1990. Temporal analysis of
epidemics. I: description and comparison of disease progress
curves. In: Introduction to Plant Disease Epidemiology. John
Wiley and Sons Inc., New York, USA, pp. 161 –202.
Conner P.J., Brown S.K. and Weeden N.F. 1998. Molecular-
marker analysis of quantitative traits for growth and
development in juvenile apple trees. Theor. Appl. Genet. 96:
1027 –1035.
Dondini L., Pierantoni L., Gaiotti F., Chiodini R., Tartarini S.,
Bazzi C. and Sansavini S. 2004. Identifying QTLs for fire-
blight resistance via a European pear (Pyrus communis L.)
genetic linkage map. Mol. Breed. 14: 407 –418.
Durel C.E., Parisi L., Laurens F., Van der Weg W.E., Liebhard
R. and Jourjon M.F. 2003. Genetic dissection of partial
resistance to race 6 of Venturia inaequalis in apple. Genome
46: 224 –234.
Fischer M. and Fischer C. 1999. Evaluation of Malus species
and cultivars at the Fruit Genebank Dresden-Pillnitz and its
use for apple resistance breeding. Genet. Resour. Crop Evol.
46: 235 –241.
Goldman I., Paran I. and Zamir D. 1995. Quantitative trait
locus analysis of a recombinant inbred line population de-
rived from a Lycopersicon esculentum � Lycopersicon chees-
manii cross. Theor. Appl. Genet. 90: 925 –932.
Hunt G.J., Guzman-Novoa E., Fondrk M.K. and Page R.E.
1998. Quantitative trait loci for honeybee stinging behavior
and body size. Genetics 148: 1203 –1213.
Ishimaru K., Yano M., Aoki N., Ono K., Hirose T., Lin S.Y.,
Monna L., Sasaki T. and Ohsugi R. 2001. Toward the
mapping of physiological and agronomic characters on a rice
function map: QTL analysis and comparison between QTLs
and expressed sequence tags. Theor. Appl. Genet. 102: 793 –
800.
Johnson K.B. and Stockwell V.O. 1998. Management of fire
blight: a case study in microbial ecology. Annu. Rev. Phy-
topathol. 36: 227 –248.
Jorge V. and Verdier V. 2002. Qualitative and quantitative
evaluation of cassava bacterial blight resistance in F1 prog-
eny of a cross between elite cassava clones. Euphytica 123:
41 –48.
Keck M., Chartier R., Lecomte P., Reich H. and Paulin J.P.
1997. First characterization of Erwinia amylovora isolates
from Australia and fire blight susceptibility of some apple
genotypes from Central Europe. Pflanzenkrank. Pflanzens-
chutz 104: 17 –22.
Kenis K. and Keulemans J. 2005. Genetic linkage maps of two
apple cultivars (Malus � domestica Borkh.) based on AFLP
and microsatellite markers. Mol. Breed. 15: 205 –219.
King G.J., Maliepaard C., Lynn J.R., Alston F.H., Durel C.E.,
Evans K.M., Griffon B., Laurens F., Manganaris A.G.,
Schrevens E. and Tartarini S. 2000. Quantitative genetic
analysis and comparison of physical and sensory descriptors
relating to fruit flesh firmness in apple (Malus pumila Mill.).
Theor. Appl. Genet. 100: 1074 –1084.
King G.J., Lynn J.R., Dover C.J., Evans K.M. and Seymour
G.B. 2001. Resolution of quantitative trait loci for mechan-
ical measures accounting for genetic variation in fruit texture
of apple (Malus pumila Mill.). Theor. Appl. Genet. 102:
1227 –1235.
Korban S.S., Ries S.M., Klopmeyer M.J., Morrisey J.F. and
Hattermann D.R. 1988. Genotypic response of scab-resistant
apple cultivars/selections to two strains of Erwinia amylovora
and the inheritance of resistance to fire blight. Ann. Appl.
Biol. 113: 101 –105.
Krakowsky M.D., Lee M., Woodman-Clikeman W.L., Long
M.J. and Sharopova N. 2004. QTL mapping of resistance to
stalk tunneling by the European corn borer in RILs of maize
population B73 � De811. Crop Sci. 44: 274 –282.
Lauter N. and Doebley J. 2002. Genetic variation for pheno-
typically invariant traits detected in teosinte: implications for
the evolution of novel forms. Genetics 160(1): 333 –342.
Liebhard R., Kellerhals M., Pfammatter W., Jertmini M. and
Gessler C. 2003a. Mapping quantitative physiological traits
in apple (Malus � domestica Borkh.). Plant Mol. Biol. 52:
511 –526.
Liebhard R., Koller B., Gianfranceschi L. and Gessler C.
2003b. Creating a saturated reference map for the apple
(Malus � domestica Borkh) genome. Theor. Appl. Genet.
106: 1497 –1508.
Liebhard R., Koller B., Patocchi A., Kellerhals M., Pfammatter
W., Jermini M. and Gessler C. 2003c. Mapping quantitative
field resistance in apple against scab. Phytopathology 93:
493 –501.
Maliepaard C., Alston F.H., Van Arkel G., Brown L.M.,
Chevreau E., Dunemann F., Evans K.M., Garddiner S.,
Guilford P., Van Heusden A.W., Janse J., Laurens F., Lynn
J.R., Manganaries A.G., Den Nijs A.P.M., Periam N., Rik-
kerink E., Roche P., Ryder C., Sansavini S., Schmidt H.,
Tartarini S., Verhaegh J.J., Vrielink-van Ginkel M. and King
G.J. 1998. Aligning male and female linkage maps of apple
(Malus pumila Mill.) using multi-allelic markers. Theor.
Appl. Genet. 97: 60 –73.
Mangin B., Thoquet P., Olivier J. and Grimsley N.H. 1999.
Temporal and multiple quantitative trait loci analyses of
resistance to bacterial wilt in tomato permit the resolution of
linked loci. Genetics 151: 1165 –1172.
McManus P.S., Stockwell V.O., Sundin G.W. and Jones A.L.
2002. Antibiotic use in plant agriculture. Annu. Rev. Phy-
topathol. 40: 443 –465.
Melchinger A.E., Utz H.F. and Schon C.C. 1998. Quantitative
trait locus analysis (QTL) mapping using different testers and
independent population samples in maize reveals low power
of QTL detection and large bias in estimates of QTL effects.
Genetics 149: 383 –403.
Momol M.T., Norelli J.L., Piccioni D.E., Momol E.A., Gus-
tafson H.L., Cummins J.N. and Aldwinkle H.S. 1998.
Internal movement of Erwinia amylovora through symp-
tomless apple scion tissues into the rootstock. Plant Dis. 82:
646 –650.
Norelli J.L., Aldwinkle H.S. and Beer S.V. 1984. Differential
host X pathogen interactions among cultivars of apple and
strains of Erwinia amylovora. Phytopathology 74: 136 –139.
Norelli J.L., Aldwinckle H.S., Lamb R.C. and Beer S.V. 1987.
Evaluation and selection of fire blight resistance in apple with
reference to differential virulence in Erwinia amylovora. Acta
Hort. 217: 263 –264.
Norelli J.L., Jones A.L. and Aldwinckle H.S. 2003. Fire blight
management in the twenty-first century. Plant Dis. 87: 756 –
765.
Otto C.D., Kianian S.F., Elias E.M., Stack R.W. and Joppa
L.R. 2002. Genetic dissection of a major Fusarium head
blight QTL in tetraploid wheat. Plant Mol. Biol. 48: 625 –632.
Rademacher W. and Kober R. 2003. Efficient use of Prohex-
adione-Ca in pome fruits. Eur. J. Hort. Sci. 68(3): 101 –107.
SPSS 2000. SYSTAT 100. SPSS, Chicago, Illinois, USA.
Thomson S.V. 2000. Epidemiology of fire blight. In: Vanneste
J.L. (ed.), Fire Blight: The Disease and its Causative Agent,
Erwinia amylovora, CABI Publishing, Wallingford, UK, pp.
9 –37.
Van Ooijen J.W. 1999. LOD significance thresholds for QTL
analysis in experimental populations of diploid species.
Heredity 83: 613 –624.
Van Ooijen J.W., Boer M.P., Jansen J.W. and Maliepaard C.
2000. MapQTL (r) Version 4.0, Software for the calculation
of QTL Positions on Genetic Maps. Plant Research Inter-
national, Wageningen, The Netherlands.
Zenbayashi K., Ashizawa T., Tani T. and Koizumi S. 2002.
Mapping of the QTL (quantitative trait locus) conferring
partial resistance to leaf blast in rice cultivar Chubu 32.
Theor. Appl. Genet. 104: 547 –552.
Related Documents