rstb.royalsocietypublishing.org Research Cite this article: Wessinger CA, Hileman LC, Rausher MD. 2014 Identification of major quantitative trait loci underlying floral polli- nation syndrome divergence in Penstemon. Phil. Trans. R. Soc. B 369: 20130349. http://dx.doi.org/10.1098/rstb.2013.0349 One contribution of 14 to a Theme Issue ‘Contemporary and future studies in plant speciation, morphological/floral evolution and polyploidy: honouring the scientific contributions of Leslie D. Gottlieb to plant evolutionary biology’. Subject Areas: evolution, genetics, genomics Keywords: Penstemon, pollination syndrome, QTL, genetics of adaptation, phenotypic correlation Author for correspondence: Mark D. Rausher e-mail: [email protected] † These authors contributed equally to this study. Electronic supplementary material is available at http://dx.doi.org/10.1098/rstb.2013.0349 or via http://rstb.royalsocietypublishing.org. Identification of major quantitative trait loci underlying floral pollination syndrome divergence in Penstemon Carolyn A. Wessinger 1 , Lena C. Hileman 1,† and Mark D. Rausher 2,† 1 Department of Ecology and Evolutionary Biology, University of Kansas, Lawrence, KS 66045, USA 2 Department of Biology, Duke University, Durham, NC 27708, USA Distinct floral pollination syndromes have emerged multiple times during the diversification of flowering plants. For example, in western North America, a hummingbird pollination syndrome has evolved more than 100 times, gen- erally from within insect-pollinated lineages. The hummingbird syndrome is characterized by a suite of floral traits that attracts and facilitates pollen move- ment by hummingbirds, while at the same time discourages bee visitation. These floral traits generally include large nectar volume, red flower colour, elongated and narrow corolla tubes and reproductive organs that are exerted from the corolla. A handful of studies have examined the genetic architecture of hummingbird pollination syndrome evolution. These studies find that mutations of relatively large effect often explain increased nectar volume and transition to red flower colour. In addition, they suggest that adaptive suites of floral traits may often exhibit a high degree of genetic linkage, which could facilitate their fixation during pollination syndrome evolution. Here, we explore these emerging generalities by investigating the genetic basis of floral pollination syndrome divergence between two related Penstemon species with different pollination syndromes—bee-pollinated P. neomexicanus and closely related hummingbird-pollinated P. barbatus. In an F 2 mapping population derived from a cross between these two species, we characterized the effect size of genetic loci underlying floral trait divergence associated with the transition to bird pollination, as well as correlation structure of floral trait variation. We find the effect sizes of quantitative trait loci for adaptive floral traits are in line with patterns observed in previous studies, and find strong evidence that suites of floral traits are genetically linked. This linkage may be due to genetic proximity or pleiotropic effects of single causative loci. Inter- estingly, our data suggest that the evolution of floral traits critical for hummingbird pollination was not constrained by negative pleiotropy at loci that show co-localization for multiple traits. 1. Introduction Flowering plants rely on pollen vectors for their reproductive success, which has led to evolutionary diversification in floral phenotypes. This diversification includes the repeated emergence of distinct floral pollination syndromes— stereotypical combinations of floral traits that attract and facilitate pollination by a particular functional group of pollinators [1–3]. These floral traits include floral morphology (flower shape and the morphology or orientation of reproductive structures), nectar characteristics, scent and colour. In western North America, the hummingbird pollination syndrome has evolved at least 129 times in a variety of angiosperm lineages, generally from an ancestral bee pollination syndrome [4]. Many of these hummingbird-adapted species have close relatives or even sister species that are bee-pollinated. Thus, shifts from bee to hummingbird pollination syndrome occur relatively frequently and rapidly, and, interestingly, seem to be unidirectional in most taxa. Bee-to- hummingbird pollinator shifts involve stereotypical changes in a variety of floral traits, some of which are adaptations to attract hummingbird pollinators & 2014 The Author(s) Published by the Royal Society. All rights reserved. on November 21, 2014 http://rstb.royalsocietypublishing.org/ Downloaded from

Welcome message from author
This document is posted to help you gain knowledge. Please leave a comment to let me know what you think about it! Share it to your friends and learn new things together.
Transcript

http:Downloaded from
rstb.royalsocietypublishing.org
ResearchCite this article: Wessinger CA, Hileman LC,
Rausher MD. 2014 Identification of major
quantitative trait loci underlying floral polli-
nation syndrome divergence in Penstemon.
Phil. Trans. R. Soc. B 369: 20130349.
http://dx.doi.org/10.1098/rstb.2013.0349
One contribution of 14 to a Theme Issue
‘Contemporary and future studies in plant
speciation, morphological/floral evolution
and polyploidy: honouring the scientific
contributions of Leslie D. Gottlieb to plant
evolutionary biology’.
Subject Areas:evolution, genetics, genomics
Keywords:Penstemon, pollination syndrome, QTL,
genetics of adaptation, phenotypic correlation
Author for correspondence:Mark D. Rausher
e-mail: [email protected]
& 2014 The Author(s) Published by the Royal Society. All rights reserved.
†These authors contributed equally to this
study.
Electronic supplementary material is available
at http://dx.doi.org/10.1098/rstb.2013.0349 or
via http://rstb.royalsocietypublishing.org.
Identification of major quantitative traitloci underlying floral pollination syndromedivergence in Penstemon
Carolyn A. Wessinger1, Lena C. Hileman1,† and Mark D. Rausher2,†
1Department of Ecology and Evolutionary Biology, University of Kansas, Lawrence, KS 66045, USA2Department of Biology, Duke University, Durham, NC 27708, USA
Distinct floral pollination syndromes have emerged multiple times during the
diversification of flowering plants. For example, in western North America,
a hummingbird pollination syndrome has evolved more than 100 times, gen-
erally from within insect-pollinated lineages. The hummingbird syndrome is
characterized by a suite of floral traits that attracts and facilitates pollen move-
ment by hummingbirds, while at the same time discourages bee visitation.
These floral traits generally include large nectar volume, red flower colour,
elongated and narrow corolla tubes and reproductive organs that are exerted
from the corolla. A handful of studies have examined the genetic architecture
of hummingbird pollination syndrome evolution. These studies find that
mutations of relatively large effect often explain increased nectar volume
and transition to red flower colour. In addition, they suggest that adaptive
suites of floral traits may often exhibit a high degree of genetic linkage,
which could facilitate their fixation during pollination syndrome evolution.
Here, we explore these emerging generalities by investigating the genetic
basis of floral pollination syndrome divergence between two related Penstemonspecies with different pollination syndromes—bee-pollinated P. neomexicanusand closely related hummingbird-pollinated P. barbatus. In an F2 mapping
population derived from a cross between these two species, we characterized
the effect size of genetic loci underlying floral trait divergence associated with
the transition to bird pollination, as well as correlation structure of floral trait
variation. We find the effect sizes of quantitative trait loci for adaptive floral
traits are in line with patterns observed in previous studies, and find strong
evidence that suites of floral traits are genetically linked. This linkage may
be due to genetic proximity or pleiotropic effects of single causative loci. Inter-
estingly, our data suggest that the evolution of floral traits critical for
hummingbird pollination was not constrained by negative pleiotropy at loci
that show co-localization for multiple traits.
on November 21, 2014//rstb.royalsocietypublishing.org/
1. IntroductionFlowering plants rely on pollen vectors for their reproductive success, which has
led to evolutionary diversification in floral phenotypes. This diversification
includes the repeated emergence of distinct floral pollination syndromes—
stereotypical combinations of floral traits that attract and facilitate pollination
by a particular functional group of pollinators [1–3]. These floral traits include
floral morphology (flower shape and the morphology or orientation of
reproductive structures), nectar characteristics, scent and colour.
In western North America, the hummingbird pollination syndrome has
evolved at least 129 times in a variety of angiosperm lineages, generally from
an ancestral bee pollination syndrome [4]. Many of these hummingbird-adapted
species have close relatives or even sister species that are bee-pollinated. Thus,
shifts from bee to hummingbird pollination syndrome occur relatively frequently
and rapidly, and, interestingly, seem to be unidirectional in most taxa. Bee-to-
hummingbird pollinator shifts involve stereotypical changes in a variety of
floral traits, some of which are adaptations to attract hummingbird pollinators

rstb.royalsocietypublishing.orgPhil.Trans.R.Soc.B
369:20130349
2
on November 21, 2014http://rstb.royalsocietypublishing.org/Downloaded from
and facilitate pollination by them, others of which are adap-
tations to exclude bee pollinators [5]. The most dramatic case
of repeated adaptation from bee to hummingbird pollination
in North America comes from the genus Penstemon [4]. There
are approximately 284 species in this group, the majority
of which display the ancestral bee pollination syndrome.
However, there have been an estimated 10–21 independent
evolutionary transitions to the hummingbird pollination
syndrome, with no cases of reversals [6,7]. These transitions
are highly convergent and involve a shift from blue, purple
or pink flowers to red flowers, an increase in nectar volume,
a decrease in nectar sugar concentration, loss of a ‘landing plat-
form’ formed by the lower petals, lengthening and narrowing
of the corolla tube, and lengthening of the stamens and style
yielding exsertion of the reproductive organs [8].
While parallel evolutionary transitions between bee and
hummingbird pollination syndromes are common, little is
known about the molecular identity of the underlying genetic
changes. Yet, some empirical evidence from quantitative trait
locus (QTL) studies on pollination syndrome divergence
suggests that there may be common patterns at the genetic
level. For example, previous QTL studies have suggested
that traits such as flower colour and nectar volume often
involve few substitutions of medium to large effect [9–13],
while changes in morphological characters tend to involve
more loci with smaller effects [12,14,15]. In addition, these
studies have revealed that QTLs for different traits sometimes
co-localize (e.g. [9,14–18], reviewed by Hermann &
Kuhlemeier [19]), suggesting either that some adaptive
substitutions have pleiotropic effects on more than one trait
or that multiple adaptive substitutions, each affecting a
single trait, are tightly linked. Exceptions to these general
patterns exist [15,19], and because the genetic architecture
of floral syndrome transitions has been examined in only
a few species it is unclear to what degree these patterns
are representative.
Developmental constraints on the evolution of complex
phenotypes such as pollination syndromes arise when pleiotro-
pic adaptive substitutions generate mutational covariance
among multiple component traits. When this pattern of covari-
ance fortuitously causes adaptive change in each trait,
adaptation towards the optimal multi-trait phenotype will be
accelerated. However, a potential constraint arises when the
pattern of mutational covariance causes adaptive change in
one trait, but maladaptive change in a second trait. This type
of antagonistic pleiotropy will reduce the net selective coeffi-
cient for the adaptive substitution, slowing the rate of
evolution. Moreover, evolution to the optimum multi-trait phe-
notype will require additional substitutions that ‘correct’ the
effects of fixing mutations with antagonistic pleiotropy. In
this situation, a QTL analysis would be likely to identify, for
some pairs of traits, co-localizing QTLs that exhibit antagonistic
pleiotropy, unless for some a priori reason developmental con-
straints largely prevent the fixation of such mutations. For
example, adaptation to hummingbird pollination can include
increased floral tube length and decreased floral tube width
compared with bee-pollinated flowers. Antagonistic pleiotropy
would be evident if QTLs for these traits co-localize to the same
genomic region and the alleles derived from the hummingbird-
pollinated lineage have the effect of increasing both tube length
and tube width. In the absence of pleiotropy, adaptive substi-
tutions will affect only one trait and each character can evolve
independently towards the optimal phenotype. In this
situation, one should not see substitutions that are counter to
the direction of selection, i.e. substitutions that decrease a
character when it is advantageous to increase it.
In this study, we begin to address these issues by conduct-
ing a preliminary QTL analysis of differences in floral traits
between two closely related species of Penstemon with contrast-
ing pollination syndromes. One species, P. neomexicanus, is
pollinated primarily by bees and displays floral characteristics
typical of the bee pollination syndrome (see below). The other
species, P. barbatus, is pollinated primarily by hummingbirds
and displays characters typical of the hummingbird pollination
syndrome. Using this system, we characterized QTLs for trait
differences between the two species and asked two questions:
(i) whether the effect sizes of QTLs conform to the patterns seen
in previous studies of other systems and (ii) whether there is
evidence of antagonistic pleiotropy in co-localizing QTLs.
This comprises a first step towards the molecular dissection and
characterization of major QTLs underlying trait divergence in
this study system.
2. Material and methods(a) Study systemPenstemon barbatus (figure 1b) occurs throughout the American
Southwest at high elevations and displays a hummingbird pollina-
tion syndrome: bright red flowers with a long narrow tube, sharply
reflexed lower petals, exserted style and stamens, and large amounts
of dilute nectar. Penstemon neomexicanus (figure 1a) is a closely
related species [6] that occurs in the Sacramento mountains of
New Mexico. This species retains the ancestral bee pollination syn-
drome: blue-purple flowers that are shorter and wider, having
lower petals that form a landing platform for bees, and producing
small amounts of concentrated nectar. Penstemon species have four
fertile stamens: one pair that are longer and one pair that are shorter.
In P. barbatus, both sets of stamens are relatively long compared with
those in P. neomexicanus flowers, as are the styles (figure 1c).
Seeds from each species, a generous gift from Prof. Paul Wilson
(California State University, Northridge), were germinated after
two months of cold stratification. We generated an F2 mapping
population of approximately 180 individuals by crossing these
two species and intercrossing three F1 individuals. The F2 plants,
along with the parental and F1 individuals, were grown in the
Duke University greenhouses under controlled conditions and
supplemental light (18 h daylight).
(b) Phenotypic measurementsWe measured floral traits on five P. neomexicanus individuals, three
P. barbatus individuals, three F1 hybrids and 157 F2 individuals. We
measured six morphological traits (figure 1c) on three flowers per
individual on the day the flower opened. First, we measured style
length using digital callipers, which allowed us to let the entire
gynoecium remain attached to the plant for potential seed pro-
duction. We carefully removed the rest of the flower (petals and
stamens) and digitally photographed the exterior (side and head-
on views) and cross section of each flower using a small stage.
We included rulers at the same focal distance as the flowers for cali-
bration. We used IMAGEJ [20] to determine the following five
morphological measurements: floral tube length, floral tube
width, the angle formed by the lower petal and the lengths of
the long and short stamens.
We measured two nectar traits, volume and sugar concen-
tration, for three to five flowers per individual. Nectar was
collected by contacting nectaries with 2 ml glass capillary tubes
(Drummond Scientific, Broomall, PA, USA). Nectar volume was

tube length
tube length
tube width tube width
stamen lengths
stamen lengths
style length
style lengthpetal angle
petal angle
(a) (b)
(c)
Figure 1. Floral phenotypes of (a) P. neomexicanus and (b) P. barbatus. (c) Floral morphological traits measured.
rstb.royalsocietypublishing.orgPhil.Trans.R.Soc.B
369:20130349
3
on November 21, 2014http://rstb.royalsocietypublishing.org/Downloaded from
measured by counting the number of completely filled capillary
tubes and multiplying by 2 ml; partially filled tubes were measured
with digital callipers and this length was converted into micro-
litres. Nectar concentration was measured using a Master-53M
refractometer (Atago, Bellevue, WA, USA).
Flower colour segregated as a binary trait in this F2 population,
with individuals having either blue-purple or red flowers. Pre-
viously, we characterized the genetic basis of the flower colour
difference between P. neomexicanus and P. barbatus [13]. We deter-
mined that the shift to red flowers in the lineage leading to
P. barbatus is due to redundant loss-of-function mutations in the
enzyme flavonoid 30,50-hydroxylase (F3050h). Genetic substitutions
to this locus in P. barbatus are sufficient for producing a shift
from blue-purple to red flowers. However, a second locus that
acts epistatically to F3050h determines flower colour in individuals
that are heterozygous at F3050h. For our analyses here, flower
colour was coded as a binary trait, with ‘0’ denoting red flowers
and ‘1’ denoting blue-purple flowers.
(c) Statistical analysesTrait values were averaged for each individual. We assessed
whether parental trait values differed significantly using t-tests
implemented in JMP PRO 11 (SAS Institute, Cary, NC, USA).
We calculated Spearman’s correlations between all pairwise
combinations of traits in the F2 population using R v. 2.13.0,
and assessed significance using a Bonferroni correction.
(d) Multiplexed shotgun genotypingTo generate genotyping markers for QTL mapping, we per-
formed a modified form of multiplexed shotgun genotyping
(MSG) [21] on parental DNA and DNA from 96 F2 individuals.
We extracted genomic DNA from frozen leaf tissue using a
CTAB–chloroform extraction protocol [22] and quantified DNA
concentration using a Qubit BR kit (Invitrogen, Carlsbad, CA,
USA). We digested 50 ng of DNA from each individual in separ-
ate reactions using AseI (New England Biolabs, Ipswich, MA,
USA), ligated unique barcoded adapters to each sample and
pooled samples, yielding two pools each containing 96 samples.
The first pool consisted of the 96 F2 individuals. The second pool
contained 12 replicate samples of each of the two parental DNA
samples, along with the first 72 F2 individual samples. We puri-
fied the pooled samples using AMPure beads (Beckman Coulter,
Danvers, MA, USA) at 1.5� volume and size selected DNA frag-
ments of 250–300 bp from an agarose gel using a Pippen Prep
(Sage Science, Beverly, MA, USA). DNA from this gel fragment
was extracted using the Qiaquick kit (Invitrogen). For each
DNA sample, we amplified eight replicate reactions containing
2 ng library DNA for 14 cycles each using Illumina sequencing

rstb.royalsocietypublishing.orgPhil.Trans.R.Soc.B
369:20130349
4
on November 21, 2014http://rstb.royalsocietypublishing.org/Downloaded from
primers, then each set of eight replicate PCR reactions was
pooled. Each library was sequenced on an Illumina Hi-Seq
2500 lane (100 base-pair single-end reads; Illumina, San Diego,
CA, USA) at the University of Kansas Genome Sequencing
Core using standard Illumina protocols.
(e) Construction of linkage mapWe processed the raw sequencing reads using STACKS [23]. First, we
de-multiplexed reads from each lane, removed low-quality reads
and removed reads with ambiguous barcodes. We then concate-
nated duplicate samples (i.e. for parental samples and those F2
samples that were represented in both sequencing lanes). We used
the STACKS pipeline denovo_map.pl to identify unique loci within
each individual, produce a catalog of homologous loci found in
the two parental samples, and assign hard genotypes for each indi-
vidual at each locus present in the catalogue. We enforced a
minimum of three reads to create a ‘stack’ (genetic locus) in each
parent, a minimum of eight reads per stack for a genotype to be
called in any individual and a maximum distance of four nucleo-
tides between alleles of a particular stack. Highly repetitive stacks
(greater than 2 s.d. from the mean) were removed. We then extracted
markers that met two critiera: (i) they had fixed differences between
the two parental samples (i.e. AA in P. neomexicanus and BB in
P. barbatus) and (ii) they were genotyped in at least 88 of the 96 F2
individuals. Details of the sequencing output are reported in the
electronic supplementary material, table S1.
We used R/QTL [24] to construct a linkage map. We identified
markers with identical genotypes across all individuals and
removed the duplicates. We used a x2-test implemented in R/QTL
to identify markers with distorted segregation patterns and
removed markers with p , 0.000001. This filtering step removed
markers with true severe segregation distortion, but also remo-
ved markers that had been incorrectly genotyped. Markers were
then separated into linkage groups (LGs) as suggested by Broman
[25] using a maximum recombination frequency threshold of
0.35 and a minimum logarithm of odds (LOD) threshold of 6.0.
Markers were ordered along each LG using the ripple function in
R/QTL. We added CAPS marker data at F3050h to our marker dataset
to determine where this locus resides in the linkage map.
( f ) QTL mappingWe performed QTL analysis of floral traits using the Haley–Knott
method in R/QTL. Flower colour was treated as a binary trait in
all analyses. We identified QTL positions as locations where the
log-ratio (LR) statistic was greatest comparing a model of the pres-
ence of a QTL at that position to a model of no QTL present using
the scanone function and assessed significance using LOD scores.
For each trait, we calculated a genome-wide significance LOD
threshold corresponding to a false discovery rate of 0.05 by
performing 1000 permutations of the data. We tested for the pres-
ence of multiple QTL peaks on a single LG and for interactions
between identified QTL using the scantwo function. For each sig-
nificant QTL, we obtained 1.5-LOD confidence intervals (CIs),
as well as estimates of additive allelic effects and dominance
deviations. QTL effect sizes were reported as the proportion of
variation explained (PVE) and relative homozygous effect (the
homozygous additive effect divided by the mean phenotypic
difference between P. neomexicanus and P. barbatus). We fit a
model containing all main QTL effects and, for each trait, obtained
an estimate of the total phenotypic variation explained by the
model. The degree of dominance for each QTL was calculated as
jdominance deviationj/jadditive effectj.To explore how well our recovered QTLs explained the
observed correlations among traits in the F2 individuals, we cal-
culated expected correlations based on the effect sizes and
dominance deviations of each QTL and compared them with
the observed phenotypic correlations. We first calculated the
genotypic value for each genotype at a QTL in the following
way: if the three genotypes at the QTL are BB, NB and NN, cor-
responding to the homozygote for the P. barbatus allele,
heterozygote and homozygote for the P. neomexicanus allele,
then the respective genotypic values were –a, d and a, where ais the estimated additive effect of the QTL and d is the estimated
dominance deviation. When a QTL did not significantly influ-
ence a trait, all three values were set to 0. Next, for a pair of
traits, the set of QTLs affecting one or both traits was chosen.
QTLs that co-localized for the two traits were considered to be
the same QTL, with the criterion for co-localization being overlap
of the 1.5-LOD CIs. However, we assumed the QTLs for tube
width and style length on LG 3 were not co-localized because
of their broad CIs and because their most likely positions were
at opposite ends of the LG. From this set of QTLs, the genotypic
values for all multi-locus genotypes were calculated by summing
the estimated genotypic values over loci.
We then calculated the covariance of the expected genotypic
values for the two traits across multi-locus genotypes, weighted
by their expected frequencies in the F2 individuals, as well as the
variances of the expected genotypic values. We assumed the phe-
notypic covariance was equal to the expected genetic covariance,
i.e. that environmental deviations for the two characters were
uncorrelated. However, we did not assume the environmental var-
iances were zero. We therefore calculated the expected phenotypic
variance of a trait by dividing the expected genetic variance by the
summed per cent variance explained for all QTLs affecting
the trait. Finally, the expected phenotypic correlation was calcu-
lated by dividing the expected covariance by the square root of
the product of the expected phenotypic variances. This procedure
assumes that there are no epistatic effects between QTLs and there-
fore that genotypic values are additive across loci. This assumption
was required because epistatic interactions are difficult to estimate
using a small population of F2 individuals because many multi-
locus genotypes have little replication. As long as epistatic effects
are small compared with additive and dominance effects, how-
ever, our procedure should provide a good approximation of the
correlations expected from the identified QTLs.
3. Results(a) Phenotypic distributionsPenstemon neomexicanus and P. barbatus differed significantly for
all measured phenotypic traits (table 1), despite high levels of
variance in nectar traits. Flower colour segregated as a binary
trait with 123 individuals having blue-purple flowers and
39 individuals having red flowers. The phenotypic distribu-
tions for the remaining traits were continuous and unimodal
(figure 2), suggesting a polygenic basis. For all traits except
colour, the F1 phenotype was intermediate between the two
parental phenotypes.
(b) Phenotypic correlationsWe identified several phenotypic correlations among traits in the
F2 population (figure 3). Interestingly, the direction of all signifi-
cant correlations was consistent with the floral trait combinations
found in the parent species. The most strongly correlated traits
were tube length, and short and long stamen lengths, with an
average pairwise correlation of 0.79. These strong correlations
suggest that pleiotropic loci may affect all three of these traits
in the same direction and that QTLs for these traits should co-
localize. We designate this set of traits ‘TLS’. The set of TLS
traits is more weakly correlated with style length (mean
correlation ¼ 0.35), suggesting some overlap in loci influencing
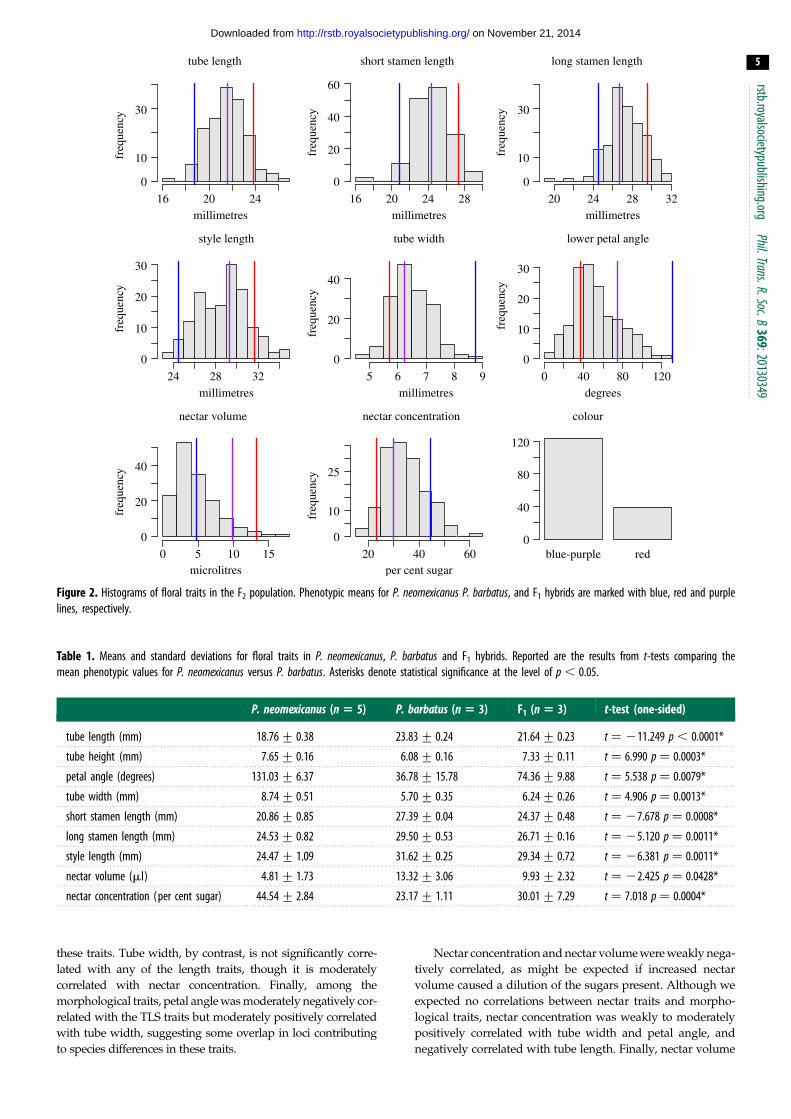
Table 1. Means and standard deviations for floral traits in P. neomexicanus, P. barbatus and F1 hybrids. Reported are the results from t-tests comparing themean phenotypic values for P. neomexicanus versus P. barbatus. Asterisks denote statistical significance at the level of p , 0.05.
P. neomexicanus (n 5 5) P. barbatus (n 5 3) F1 (n 5 3) t-test (one-sided)
tube length (mm) 18.76+ 0.38 23.83+ 0.24 21.64+ 0.23 t ¼ 211.249 p , 0.0001*
tube height (mm) 7.65+ 0.16 6.08+ 0.16 7.33+ 0.11 t ¼ 6.990 p ¼ 0.0003*
petal angle (degrees) 131.03+ 6.37 36.78+ 15.78 74.36+ 9.88 t ¼ 5.538 p ¼ 0.0079*
tube width (mm) 8.74+ 0.51 5.70+ 0.35 6.24+ 0.26 t ¼ 4.906 p ¼ 0.0013*
short stamen length (mm) 20.86+ 0.85 27.39+ 0.04 24.37+ 0.48 t ¼ 27.678 p ¼ 0.0008*
long stamen length (mm) 24.53+ 0.82 29.50+ 0.53 26.71+ 0.16 t ¼ 25.120 p ¼ 0.0011*
style length (mm) 24.47+ 1.09 31.62+ 0.25 29.34+ 0.72 t ¼ 26.381 p ¼ 0.0011*
nectar volume (ml) 4.81+ 1.73 13.32+ 3.06 9.93+ 2.32 t ¼ 22.425 p ¼ 0.0428*
nectar concentration ( per cent sugar) 44.54+ 2.84 23.17+ 1.11 30.01+ 7.29 t ¼ 7.018 p ¼ 0.0004*
tube length
millimetres
freq
uenc
y
16 20 24
0
10
30
short stamen length
millimetres
freq
uenc
y
16 20 24 28
0
20
40
60
long stamen length
millimetres
freq
uenc
y
20 24 28 32
0
10
30
style length
millimetres
freq
uenc
y
24 28 32
0
10
20
30
tube width
millimetres
freq
uenc
y
5 6 7 8 9
0
20
40
lower petal angle
degrees
freq
uenc
y
0 40 80 120
0
10
20
30
nectar volume
microlitres
freq
uenc
y
0 5 10 15
0
20
40
nectar concentration
per cent sugar
freq
uenc
y
20 40 60
0
10
25
blue-purple red
colour
0
40
80
120
Figure 2. Histograms of floral traits in the F2 population. Phenotypic means for P. neomexicanus P. barbatus, and F1 hybrids are marked with blue, red and purplelines, respectively.
rstb.royalsocietypublishing.orgPhil.Trans.R.Soc.B
369:20130349
5
on November 21, 2014http://rstb.royalsocietypublishing.org/Downloaded from
these traits. Tube width, by contrast, is not significantly corre-
lated with any of the length traits, though it is moderately
correlated with nectar concentration. Finally, among the
morphological traits, petal angle was moderately negatively cor-
related with the TLS traits but moderately positively correlated
with tube width, suggesting some overlap in loci contributing
to species differences in these traits.
Nectar concentration and nectar volume were weakly nega-
tively correlated, as might be expected if increased nectar
volume caused a dilution of the sugars present. Although we
expected no correlations between nectar traits and morpho-
logical traits, nectar concentration was weakly to moderately
positively correlated with tube width and petal angle, and
negatively correlated with tube length. Finally, nectar volume

tube length
16 22 28
r = 0.77
p < 0.001
r = 0.70
p < 0.001
24 28 32
r = 0.37
p < 0.001
r = –0.25
p = 0.002
20 60 120
r = –0.37
p < 0.001
r = 0.18
p = 0.026
20 40 60
r = –0.31
p < 0.00118
24r = –0.13
p = 0.104
16
24 short stamenr = 0.89
p < 0.001
r = 0.38
p < 0.001
r = –0.20
p = 0.013
r = –0.35
p < 0.001
r = 0.18
p = 0.028
r = –0.22
p = 0.009
r = –0.17
p = 0.034
long stamenr = 0.30
p < 0.001
r = –0.0066
p = 0.934
r = –0.22
p = 0.006
r = 0.15
p = 0.077
r = –0.15
p = 0.07920
26r = –0.14
p = 0.089
24
30 styler = –0.19
p = 0.019
r = –0.23
p = 0.005
r = 0.18
p = 0.031
r = –0.16
p = 0.063
r = –0.10
p = 0.227
tube widthr = 0.35
p < 0.001
r = –0.12
p = 0.16
r = 0.39
p < 0.0015
7r = 0.24
p = 0.002
20
80 petal angler = 0.016
p = 0.848
r = 0.28
p = 0.001
r = 0.042
p = 0.601
nectar volume
r = –0.27
p = 0.0010
10r = –0.35
p < 0.001
20
50 nectar concentration
r = 0.11
p = 0.177
18 22 26 20 24 28 5 6 7 8 0 5 10 0 0.4 0.80.0
0.6colour
Figure 3. Floral trait correlations in the F2 population. Scatterplots of all traits are given below the diagonal and Spearman’s correlation coefficients and associatedp-values are given above the diagonal. Statistically significant correlations after a Bonferroni correction ( p , 0.00139) are in bold and outlined in red.
rstb.royalsocietypublishing.orgPhil.Trans.R.Soc.B
369:20130349
6
on November 21, 2014http://rstb.royalsocietypublishing.org/Downloaded from
was correlated with flower colour, with greater nectar volumes
associated with red flowers.
(c) Multiplexed shotgun genotyping and linkagemap results
We obtained an average of 180 million high-quality reads per
sequencing lane from our MSG library preparation. We chose
876 markers that had fixed differences between the two par-
ental samples and that could be confidently genotyped
(using a minimum of eight reads per locus) in at least 88 of
the 96 F2 individuals. One F2 individual that had an unusually
low proportion of typed markers was removed; it was likely
that this individual had low representation in the set of
pooled MSG libraries. After removing duplicate markers, we
removed markers displaying significant segregation distortion
at p , 0.000001. This filtering step removed markers displaying
true severe segregation distortion, and also markers we suspect
having genotyping error. Even with a minimum of eight reads
to genotype a given locus, stochasticity in the sequencing data
could cause a true heterozygote to be genotyped as a homozy-
gote, and many of the markers discarded at this step were
deficient in heterozygotes (electronic supplementary material,
table S2). We constructed a linkage map using a final set of 642
MSG markers. We added the previously genotyped locus
F3050h [13] to this dataset.
We obtained eight LGs (figure 4), the expected chromo-
some number in these species [26]. The mean number of
markers per LG was 80 (minimum ¼ 23, maximum ¼ 138).
The total map distance was 1372.2 cM, with a mean distance
of 2.2 cM between markers (maximum 38.4 cM). We suspect
the excessive length of certain LGs (i.e. 2, 3, 4 and 7) may reflect
genotyping errors in our marker dataset not removed through
our filtering process. Markers were not distributed as evenly
as expected across the linkage map (figure 4). This was prob-
ably due to the small size of our mapping population, which
contains limited recombination events. If such patterns persist
in future studies with larger mapping populations, it could
suggest regions of low recombination, perhaps due to genomic
inversions between these two species. Nevertheless, given the
small mapping population used to generate this linkage map,
we consider it to be adequate for the preliminary QTL mapping
described here.
(d) QTL mapping resultsWe identified 23 total QTLs for the nine analysed traits (table
2). For nectar volume, there was one major QTL that explained
greater than 51% of the trait variation and 67% of the difference
between parental values. Similarly, there was one QTL for
colour, which explained nearly two-thirds of the total flower
colour variation in the F2 population and 100% of the difference
between parents. This QTL corresponds to F3050h, which
resides directly under the peak LOD (figure 4). We have pre-
viously shown that this gene is responsible for the difference
in colour between the two species [13]. For each of the remain-
ing traits, there were three significant QTLs, explaining a total
of 45–65% of the total proportion of trait variation. Assuming

300
250
200
150
100
50
0lo
catio
n (c
M)
LG 1 LG 2 LG 3 LG 4 LG 5 LG 6 LG 7 LG 8
tube length
short stamen length
long stamen length
style length
tube width
petal angle
nectar volume
nectar concentration
colour
Figure 4. Linkage map and QTL positions marked with 1.5-LOD CIs. Small arrow indicates position of F3050h on LG 1 at 75.5 cM.
rstb.royalsocietypublishing.orgPhil.Trans.R.Soc.B
369:20130349
7
on November 21, 2014http://rstb.royalsocietypublishing.org/Downloaded from
homozygous effects are additive across loci, the QTLs explain
between 65 and 100% (mean ¼ 80.7; colour excluded) of the
differences between parental values. Given our small mapping
population, these values may be somewhat inflated and we
cannot rule out the existence of many additional QTLs with
small effect.
All QTLs were in the direction of divergence between
the two species, i.e. if the trait is larger in P. barbatus, the
P. barbatus allele increases the value of the trait. Degree of
dominance ranged from near absence of dominance to over-
dominance (table 2), though for none of the QTLs with
nominal overdominance was the degree of dominance signifi-
cantly greater than 1.0. Only tube width and style length
exhibited directional dominance, with dominance deviation
for all three QTLs having the same sign. This is consistent
with the observation that for both traits the F1 value was sub-
stantially shifted away from the parental mean towards the
mean for P. barbatus (figure 2).
We found many areas of the genome where QTLs co-
localize (figure 4). QTLs underlying length (TLS) traits were
markedly coincident, with nearly identical QTLs for TLS
traits on LG 1, 6 and 8. Significant QTLs for style length over-
lapped with these other length traits on LG 1 and 8. This is
consistent with the highly significant pairwise correlations
found among these length traits (figure 3). The large effect
QTL for flower colour overlapped with the QTLs for length
on LG 1, and, although it did not overlap, the large effect
QTL for nectar volume was proximal to this cluster of QTLs
as well. This clustering may explain the observed significant
correlation between flower colour and nectar volume. Further-
more, floral tube width co-localized with lower petal angle on
LG 2 and LG 4, along with nectar concentration, perhaps con-
tributing to the observed correlations among these traits.
Finally, the LOD CIs for style length and floral tube width
overlapped on LG 3, however the peak LOD positions are on
different ends of the chromosome.
The expected phenotypic correlations between traits, cal-
culated from the estimated additive effects and dominance
values of overlapping QTLs, are strongly correlated with
the observed phenotypic correlations (figure 5). In calculating
this correlation, we included the pairwise correlations among
the TLS traits. However, since these appear to be highly co-
localized and highly correlated, for other traits we used the
average correlation with each TLS trait. The relationship
between expected and observed trait correlation has a corre-
lation coefficient of 0.92 and explains 85% of the variation in
the observed correlations. Therefore, the identified QTLs cap-
ture the main features of segregating genetic variation among
F2 individuals. This suggests that we have not missed many
QTLs with more than negligible effects, in agreement with
the finding that the QTLs cumulatively explain most of the
differences between parental values. However, the slope of
the relationship is 1.88 (figure 5), whereas if the QTLs were
a perfect predictor of observed phenotypes the slope would
be 1.0. This difference is due largely to higher observed cor-
relations among the TLS traits than expected from the QTL
models. This suggests either that we may have failed to ident-
ify some important QTLs for these highly correlated traits, or
that there was a positive environmental correlation that we
were unable to account for (e.g. bigger flowers make values
of all three TLS traits higher).
4. Discussion(a) Genetic basis of pollination syndrome traits in
PenstemonOur study constitutes a preliminary examination of the genetic
basis of floral trait divergence between P. neomexicanus and
P. barbatus. Although our F2 mapping population was of
modest size, several patterns emerged. First, floral trait vari-
ation appears to be due to relatively few genetic loci of
medium to large phenotypic effect. Two of the floral traits,
flower colour and nectar volume, were each controlled by a
single QTL of large effect, with the flower colour QTL comple-
tely explaining the between-species difference in floral colour
and the nectar volume accounting for 67% of the difference

Table 2. Significant QTL positions, CIs and effect size estimates.
trait
QTLpeakposition
PeakLOD 1.5-LOD CI
additiveeffect (s.e.)
dominancedeviation(s.e.) PVE
relativehomozygouseffect
degree ofdominance
tube length 1, 65.5 6.93 42.0 – 83.5 0.70 (0.15) 0.72 (0.22) 17.80 0.27 1.03
tube length 6, 2.1 4.44 0 – 8 0.59 (0.15) 20.43 (0.23) 10.68 0.23 0.73
tube length 8, 5.7 8.97 3.36 – 10 0.90 (0.17) 20.52 (0.24) 24.33 0.35 0.58
petal angle 2, 55.1 4.111 36.7 – 65.2 29.92 (2.56) 28.28 (3.98) 11.871 0.21 0.83
petal angle 4, 46 2.646 36 – 60 29.75 (3.18) 2.97 (4.64) 7.361 0.20 0.30
petal angle 4, 160.8 4.443 152 – 166.7 211.35 (2.91) 212.88 (4.04) 12.94 0.24 1.13
tube width 2, 18.6 5.90 0 – 50.4 20.30 (0.08) 20.34 (0.11) 15.68 0.20 1.13
tube width 3, 44 4.93 10 – 265.4 20.38 (0.08) 20.10 (0.11) 12.76 0.25 0.26
tube width 4, 113.8 5.32 70 – 191.3 20.38 (0.07) 20.07 (0.10) 13.91 0.25 0.18
short stamen 1, 79.1 6.02 42.0 – 83.5 0.84 (0.18) 0.58 (0.26) 17.01 0.26 0.69
short stamen 6, 2.1 3.86 0 – 13.3 0.70 (0.18) 20.26 (0.27) 10.31 0.21 0.37
short stamen 8, 12.2 5.94 3.4 – 16 0.79 (0.20) 20.53 (0.29) 16.76 0.24 0.67
long stamen 1, 79.1 5.384 39.5 – 83.5 0.68 (0.19) 0.78 (0.27) 16.74 0.27 1.15
long stamen 6, 8 3.651 0 – 13.3 0.70 (0.18) 20.36 (0.27) 10.86 0.28 0.51
long stamen 8, 6 4.974 0 – 22 0.89 (0.20) 20.08 (0.29) 15.3 0.36 0.09
style length 1, 49.0 4.21 39.5 – 52 1.08 (0.24) 20.20 (0.35) 11.88 0.30 0.19
style length 3, 270 4.47 20 – 280 1.07 (0.24) 20.37 (0.34) 12.69 0.30 0.35
style length 8, 14.3 4.62 8 – 24 0.88 (0.27) 20.71 (0.37) 13.17 0.25 0.81
nectar volume 1, 97.5 14.29 91.5 – 99.5 2.83 (0.34) 22.24 (0.53) 51.47 0.67 0.79
nectar
concentration
4, 38 4.25 0 – 126 24.36 (1.03) 0.74 (1.49) 12.14 0.41 0.17
nectar
concentration
6, 119.6 4.59 114 – 119.6 24.35 (1.35) 27.69 (1.65) 13.23 0.41 1.77
nectar
concentration
7, 180.5 4.82 118 – 195.6 23.34 (0.85) 24.79 (1.53) 13.99 0.31 1.43
colour 1, 75.46 21.6 72.5 – 79.1 65.67
0 0.1 0.2 0.3 0.4 0.5
1.0
0.8
0.6
0.4
0.2
0
0.2
0.4
expected phenotypic correlation
obse
rved
phe
noty
pic
corr
elat
ion
Figure 5. Relationship between observed phenotypic correlation andexpected phenotypic correlation. Expected correlation is based on estimatedadditive effect and dominance deviation of QTLs. Each point represents apair of traits (black and blue circles) or the average correlation between atrait and the three TLS traits (red circles). The blue circle represents eightpoints superimposed.
rstb.royalsocietypublishing.orgPhil.Trans.R.Soc.B
369:20130349
8
on November 21, 2014http://rstb.royalsocietypublishing.org/Downloaded from
between the parental species. However, since the F1 and F2
mean nectar volumes do not fit the expected pattern under a
single-locus model (figure 2), there may be additional QTLs
for nectar volume that our analysis was too weak to identify
or epistatic effects for which our analysis did not control. The
remaining seven traits were each controlled by three QTLs of
medium effect sizes. Assuming additivity of effect sizes,
the QTLs for these traits account for between 65 and 91%
(mean 78%) of the differences between parental means. Since
the effect sizes of small effect QTLs can be overestimated
in small mapping populations such as ours [27], we must inter-
pret our results cautiously. Nevertheless, these results suggest
that for all traits examined, evolutionary divergence was
achieved largely by substitutions of medium to large effect.
Presumably, there are additional loci of small effect involved,
but these will be more difficult to detect. We also note that
because a given QTL may harbour multiple loci affecting a
trait, our estimate of the number of loci is a minimum. How-
ever, we believe this is unlikely for at least some of the traits
(see below).
(b) QTLs of large effect size for colour andnectar volume
Nectar is a primary reward for pollinators and the amount pro-
duced varies with type of pollinator. As is true for P. barbatus,

rstb.royalsocietypublishing.orgPhil.Trans.R.Soc.B
369:20130349
9
on November 21, 2014http://rstb.royalsocietypublishing.org/Downloaded from
hummingbird-pollinated flowers typically produce larger volu-
mes of more dilute nectar compared with insect-pollinated
plants [4]. This difference between P. barbatus and P. neomexicanusis due largely to a single QTL that explains about two-thirds
of the difference between the parental species. Large effect
QTLs have also been found to contribute to differences in
nectar volume between bee- and hawkmoth-pollinated
species of Petunia [11] and between bee- and hummingbird-
pollinated species of Mimulus [9]. However, variation in
nectar volume between insect- and hummingbird-pollinated
species of Ipomopsis seems to be controlled by several small
effect QTLs [15].
Nectar volume in particular may be an important first step in
attracting a novel pollinator, particularly for hummingbirds [28].
The large effect QTL for nectar volume in Mimulus by itself
influences pollinator attraction [29,30]. Moreover, addition of
artificial nectar to Penstemon spectabilis (bee syndrome) flowers
significantly increased hummingbird visitation [31]. Although
this has not been experimentally tested, we expect that attraction
of hummingbird pollinators requires a quantum jump in nectar
volume and that incremental increases would not be likely to be
detected by hummingbirds and hence would probably not
affect hummingbird visitation or increase pollen export by
bird pollinators. If true, this would explain the predominance
of large effect QTLs involved in the evolution of increased
nectar production in species pollinated by hummingbirds.
This argument assumes that bird pollination is derived from
insect pollination, as appears to be the case in Penstemon [6,7]
and Mimulus [32]. However, bird pollination is considered
derived in Ipomopsis [15], in which QTL effects on nectar
volume are small. Experiments testing the effect of nectar
volume on hummingbird visitation as well as additional infor-
mation from other species are clearly needed to evaluate this
explanation for large effect nectar volume QTLs.
Bradshaw et al. [9] found that the QTL with large effect on
nectar volume also substantially decreased nectar sugar con-
centration. This pattern could be explained by a dilution
effect if the causal locus simply determined how much water
was secreted with a constant amount of sugar. In P. barbatus,however, we did not find this pattern. Although we detected
three QTLs of moderately large effect influencing nectar
concentration, none of them co-localized with the QTL for
nectar volume. These two traits thus evolved independently.
Although we cannot be sure of the order in which these two
traits evolved, we believe the most reasonable expectation is
that increased volume evolved first to attract and maintain
visits by hummingbirds. It remains unclear whether decreased
nectar sugar concentration is a positive adaptation for
hummingbird pollination, functions to deter bee pollination
or is an adaptation to favour energy savings for the plant,
allowing reallocation to other fitness-enhancing functions
[33,34]. Regardless, hummingbird pollinators continue to
visit P. barbatus even though sugar concentration is relatively
low. We suggest that once a large nectar volume had evolved,
bird pollinators could be retained despite reductions in sugar
concentration. Mutations that reduced allocation of sugars to
nectar might then be favoured.
A single QTL of large effect was identified for the colour
difference between P. neomexicanus and P. barbatus. This QTL
corresponds to the gene F3050h. Wessinger & Rausher [13]
demonstrated using co-segregation and functional analyses
that this gene is redundantly non-functional in P. barbatusand completely explains the difference in flower colour
between the two species. Similar large effect flower colour
QTLs have been reported frequently for adaptation to differ-
ent pollinators between pairs of species within Aquilegia [35],
Ipomopsis [15], Iris [14,17], Iochroma [36], Mimulus [9,37] and
Petunia [10,18]. One partial explanation for this pattern is
that many flower colour transitions involve deactivation
of parts or all of the anthocyanin pathway, which can be
accomplished by inactivating mutations in one or a few
genes [10,13,36–38]. In cases involving gain of function
(e.g. Ipomopsis), a simple reversal of an inactivating substi-
tution, particularly in a cis-regulatory region, might also be
achieved by a single mutation and thus produce a QTL of
large effect. Another, not mutually exclusive explanation for
large effect flower colour QTLs is that small changes in
colour may not substantially affect pollinator visitation. For
example, in bird syndrome flowers, one primary function of
red coloration is believed to be exclusion of bee pollinators
because bees cannot easily distinguish red against a back-
ground of green vegetation [39]. Small shifts away from a
blue, pink, purple or white ancestral state may not reduce
contrast sufficiently to reduce bee visitation, whereas a
major change to red is known to reduce visitation by bees
and other insects [29,30,40,41].
(c) QTLs of small to medium effect for other charactersThe remaining morphological characters examined each
exhibited three QTLs of small to medium effect sizes (mean
effect size as proportion of difference between species
means ¼ 0.26+0.05). This result is consistent with studies
in other systems identifying multiple QTLs with small to
medium effect for similar traits [11,14,15].
(d) Phenotypic correlations and QTL colocalizationWe observed several interesting phenotypic correlations that
generally corresponded to co-localization of QTLs. First, vari-
ation in TLS traits was highly correlated in the F2 population,
indicating the presence of shared or linked genetic control,
and QTLs for these traits co-localized in a striking pattern.
We identified three significant QTLs at nearly identical pos-
itions on LG 1, 6 and 8. For all three cases, the QTLs on LG
1 and 8 explained a larger proportion of the variation than
the QTL on LG 6. Furthermore, the additive allelic effects
and dominance deviations for each of these QTLs were simi-
lar across the different traits (table 2). Given these similarities,
it is likely that each of these QTLs corresponds to a single
locus affecting all three traits pleiotropically. It is theoretically
possible that selection for strong character correlations could
bring loci affecting different traits into tight linkage in geno-
mic inversions [42], but we find it difficult to believe that this
would occur in three different genomic locations. This infer-
ence is supported by the existence of loci affecting lengths
of multiple floral characters identified in Petunia [18,43],
Solanum [44] and other model systems [19].
There was greater variation for style length in the F2 popu-
lation and also weaker correlations between this trait and the
other length traits. This may be the biological reality, or it may
be due in part to measurement error. This trait was measured
with digital callipers unlike the remaining traits that were
measured in IMAGEJ from digital photographs. However, QTLs
for this trait overlapped with the TLS QTLs on LGs 1 and 8,
suggesting the presence of underlying loci that pleiotropically

rstb.royalsocietypublishing.orgPhil.Trans.R.Soc.B
369:20130349
10
on November 21, 2014http://rstb.royalsocietypublishing.org/Downloaded from
affect both style length and TLS characters, which would give
rise to the observed positive phenotypic correlations.
We identified several other correlations among floral traits
and corresponding QTL co-localization. One interesting find-
ing was the significant correlation between nectar volume
and flower colour (r ¼ 0.35, p , 0.001), with red flowers associ-
ating with higher nectar volumes. As discussed, both traits are
due to major loci with large phenotypic effects. This correlation
is probably due to modest genetic linkage of the two major
QTLs underlying these traits. We suspect that several other
character correlations are due to QTL linkage rather than pleio-
tropy, because the QTLs do not entirely overlap and different
developmental systems are probably involved (e.g. petal
angle and nectar concentration, tube width and nectar concen-
tration). Overall, the high correlation between observed trait
correlations and correlations expected from QTL co-localization
suggests that the observed phenotypic correlations are largely
explained by co-localization. Future fine-mapping experiments
may elucidate whether the co-localization is due to pleiotropy
or tight linkage.
(e) Lack of antagonistic pleiotropyA striking pattern to emerge from our analysis is that all
observed correlations are in the direction of adaptation. By
this we mean that when two traits have higher values in
P. barbatus, if those two traits are correlated in the F2s, they
have a positive correlation (e.g. positive correlations among
TLS traits). By contrast, if one trait has a higher value in
P. barbatus while a second has a lower value, then the corre-
lation is negative (e.g. negative correlations between nectar
volume and nectar concentration, and between tube length
and tube width). Moreover, the same pattern is seen for co-
localized QTLs: the sign of the additive effect of both traits
is always in the direction of the sign of the change from
P. neomexicanus to P. barbatus.
This pattern is easy to understand if co-localization of QTLs
for two traits is due to tight linkage of two loci, each of which
affects only one of the traits. In this situation, presumably adap-
tive mutations occurred and were fixed independently at the
two loci. In a moderately sized F2 population, the QTLs for
these two loci would co-localize and the effects at both loci
would be adaptive. By contrast, if co-localization is due largely
to pleiotropic effects at individual loci, then the question arises
as to why none of the QTLs exhibit antagonistic pleiotropy,
i.e. exhibit effects in the direction of adaptation for one trait
but opposite the direction of adaptation for another trait.
Two answers to this question seem possible. One is that devel-
opmental constraint is such that mutational covariance is
almost always in the direction of adaptation. We believe that
this may be likely for the TLS traits because mutations that
alter overall floral length may also affect the lengths of other
floral organs in the same direction. The second explanation is
that mutations exhibiting antagonistic pleiotropy are less
favoured by natural selection. Such mutations have a lower
net selective coefficient than mutations without antagonistic
pleiotropy, because there is a deleterious effect on one of the
traits. Since the probability of fixation of a mutation is pro-
portional to the selection coefficient, pleiotropic mutations
without antagonistic pleiotropy will therefore have a greater
probability of fixation.
We suspect that both of these possibilities account for our
failure to find evidence of antagonistic pleiotropy among
QTLs that co-localize. On the one hand, for the reasons
described above, we suspect that the mutation spectrum is
highly constrained for the TLS traits, such that most mutations
affecting one of these traits will affect the others in the same
direction. On the other hand, for the correlations involving
one morphological trait and one non-morphological trait
(e.g. nectar volume and flower colour), we suspect that co-
localizations arise from linkage of separate, trait-specific loci
because we know of no obvious functional or developmental
connections among the correlated traits. Finally, co-localization
of loci affecting tube width and petal angle, or TLS traits and
petal angle, are conceivably due to pleiotropy arising because
each of these traits is determined by a common process of
development. Clearly, additional work is needed to evaluate
these hypotheses. Taken at face value, though, the absence of
antagonistic pleiotropy suggests that most hummingbird syn-
drome traits evolve independently and are not constrained
by pleiotropy.
Acknowledgements. We are grateful to Paul Wilson for seeds and DukeUniversity Greenhouse for excellent plant care. We thank NickMcCool for assistance generating the MSG libraries and JohnK. Kelly for bioinformatic and QTL mapping advice.
Funding statement. This study was supported by research funds from theUniversity of Kansas to L.C.H., including a GRF award, and NFS-IOS-1255808 and also by research funds from an NSF GrantDEB0841521 to M.D.R.
References
1. Grant V. 1949 Pollination systems as isolatingmechanisms in angiosperms. Evolution 3, 82 – 97.(doi:10.2307/2405454)
2. Baker HG. 1963 Evolutionary mechanisms inpollination biology. Science 139, 877 – 883. (doi:10.1126/science.139.3558.877)
3. Stebbins GL. 1970 Adaptive radiation ofreproductive characteristics in angiosperms, I:pollination mechanisms. Annu. Rev. Ecol. Syst. 1,307 – 326. (doi:10.1146/annurev.es.01.110170.001515)
4. Grant KA, Grant V. 1968 Hummingbirds and theirflowers. New York, NY: Columbia University Press.
5. Castellanos MC, Wilson P, Thomson JD. 2004 ‘Anti-bee’ and ‘pro-bird’ changes during the evolution ofhummingbird pollination in Penstemon flowers.J. Evol. Biol. 17, 876 – 885. (doi:10.1111/j.1420-9101.2004.00729.x)
6. Wolfe AD, Randle CP, Datwyler SL, Morawetz JJ,Arguedas N, Diaz J. 2006 Phylogeny, taxonomicaffinities, and biogeography of Penstemon(Plantaginaceae) based on ITS and cpDNA sequencedata. Am. J. Bot. 93, 1699 – 1713. (doi:10.3732/ajb.93.11.1699)
7. Wilson P, Wolfe AD, Armbruster WS, Thomson JD.2007 Constrained lability in floral evolution: counting
convergent origins of hummingbird pollination inPenstemon and Keckiella. New Phytol. 176, 883 – 890.(doi:10.1111/j.1469-8137.2007.02219.x)
8. Wilson P, Castellanos MC, Hogue JN, Thomson JD,Armbruster WS. 2004 A multivariate search forpollination syndromes among penstemons. Oikos104, 345 – 361. (doi:10.1111/j.0030-1299.2004.12819.x)
9. Bradshaw Jr HD, Wilbert SM, Otto KG, SchemskeDW. 1995 Genetic mapping of floral traits associatedwith reproductive isolation in monkeyflowers(Mimulus). Nature 376, 762 – 765. (doi:10.1038/376762a0)

rstb.royalsocietypublishing.orgPhil.Trans.R.Soc.B
369:20130349
11
on November 21, 2014http://rstb.royalsocietypublishing.org/Downloaded from
10. Quattrocchio F, Wing J, van der Woude K, Souer E,de Vetten N, Mol J, Koes R. 1999 Molecular analysisof the anthocyanin2 gene of petunia and its role inthe evolution of flower color. Plant Cell 11,1433 – 1444. (doi:10.1105/tpc.11.8.1433)
11. Stuurman J, Hobollah ME, Broger L, Moore J, BastenC, Kuhlemeier C. 2004 Dissection of floral pollinationsyndromes in petunia. Genetics 168, 1585 – 1599.(doi:10.1534/genetics.104.031138)
12. Galliot C, Stuurman J, Kuhlemeier C. 2006 Thegenetic dissection of floral pollination syndromes.Curr. Opin. Plant Biol. 9, 78 – 82. (doi:10.1016/j.pbi.2005.11.003)
13. Wessinger CA, Rausher MD. 2014 Predictability andirreversibility of genetic changes underlying flowercolor evolution in Penstemon barbatus. Evolution 68,1058 – 1070. (doi:10.1111/evo.12340)
14. Brothers AN, Barb JG, Ballerini ES, Drury DW, KnappSJ, Arnold ML. 2013 Genetic architecture of floraltraits in Iris hexagona and Iris fulva. J. Hered. 104,853 – 861. (doi:10.1093/jhered/est059)
15. Nakazato T, Rieseberg LH, Wood TE. 2013 Thegenetic basis of speciation in the Giliopsis lineage ofIpomopsis (Polemoniaceae). Heredity 111,227 – 237. (doi:10.1038/hdy.2013.41)
16. Bradshaw Jr HD, Otto KG, Frewen BE, McKay JK,Schemske DW. 1998 Quantitative trait loci affectingdifferences in floral morphology between twospecies of monkeyflower (Mimulus). Genetics 149,367 – 382.
17. Bouck A, Wessler SR, Arnold ML. 2007 QTLanalysis of floral traits in Lousiana Iris hybrids.Evolution 61, 2308 – 2319. (doi:10.1111/j.1558-5646.2007.00214.x)
18. Hermann K, Klahre U, Moser M, Sheehan H, MandelT, Kuhlemeier C. 2013 Tight genetic linkage ofprezygotic barrier loci creates a multifunctionalspeciation island in Petunia. Curr. Biol. 23,873 – 877. (doi:10.1016/j.cub.2013.03.069)
19. Hermann K, Kuhlemeier C. 2011 The geneticarchitecture of natural variation in flowermorphology. Curr. Opin. Plant Biol. 14, 60 – 65.(doi:10.1016/j.pbi.2010.09.012)
20. Abramoff MD, Magalhaes PJ, Ram SJ. 2004 Imageprocessing with ImageJ. Biophotonics Int. 11, 36 – 42.
21. Andolfatto P, Davison D, Erezyilmaz D, Hu TT, MastJ, Sunayama-Morita T, Stern DL. 2011 Multiplexedshotgun genotyping for rapid and efficient genetic
mapping. Genome Res. 21, 610 – 617. (doi:10.1101/gr.115402.110)
22. Doyle JJ, Doyle JL. 1987 A rapid DNA isolationprocedure for small quantities of fresh leaf tissue.Phytochem. Bull. 19, 11 – 15.
23. Catchen JM, Amores A, Hohenlohe P, Cresko W,Postlethwait JH. 2011 Stacks: building andgenotyping loci de novo from short-read sequences.G3: Genes, Genomes Genet. 1, 171 – 182.
24. Broman KW, Wu H, Sen S, Churchill GA. 2003 R/qtl:QTL mapping in experimental crosses. Bioinformatics19, 889 – 890. (doi:10.1093/bioinformatics/btg112)
25. Broman K. 2010 Genetic map construction with R/qtl. Technical Report #214, University of Wisconsin-Madison, Department of Biostatistics and MedicalInformatics.
26. Freeman CC. 1983 Chromosome numbers in GreatPlains species of Penstemon (Scrophulariaceae).Brittonia 35, 232 – 238. (doi:10.2307/2806022)
27. Beavis WD. 1994 The power and deceit of QTLexperiments: lessons from comparative QTL studies.In Proc. 49th Annual Corn and Sorghum ResearchConference (ed. DB Wilkinson), pp. 250 – 266.Washington, DC: American Seed Trade Organization.
28. Thomson JD, Wilson P. 2008 Explaining evolutionaryshifts between bee and hummingbird pollination:convergence, divergence, and directionality.Int. J. Plant Sci. 169, 23 – 38. (doi:10.1086/523361)
29. Schemske DW, Bradshaw Jr HD. 1999 Pollinatorpreference and the evolution of floral traits inmonkeyflowers (Mimulus). Proc. Natl Acad. Sci. USA96, 11 910 – 11 915. (doi:10.1073/pnas.96.21.11910)
30. Bradshaw Jr HD, Schemske DW. 2003 Allelesubstitution at a flower color locus produces apollinator shift in monkeyflowers. Nature 426,176 – 178. (doi:10.1038/nature02106)
31. Wilson P, Jordan EA. 2009 Hybrid intermediacybetween pollination syndromes in Penstemon, andthe role of nectar in affecting hummingbird visitation.Botany 87, 272 – 282. (doi:10.1139/B08-140)
32. Beardsley PM, Payette S, Fortin MJ, Olmstead RG.2003 AFLP phylogeny of Mimulus sectionErythranthe and the evolution of hummingbirdpollination. Evolution 57, 1397 – 1410. (doi:10.1111/j.0014-3820.2003.tb00347.x)
33. Baker HG. 1975 Sugar concentrations in nectarsfrom hummingbird flowers. Biotropica 7, 37 – 41.(doi:10.2307/2989798)
34. Bolten AB, Feinsinger P. 1978 Why do hummingbirdflowers secrete dilute nectar? Biotropica 10,307 – 309. (doi:10.2307/2387684)
35. Hodges SA, Whittall JB, Fulton M, Yang JY. 2002Genetics of floral traits influencing reproductiveisolation between Aquilegia formosa and Aquilegiapubescens. Am. Nat. 159, S51 – S60. (doi:10.1086/338372)
36. Smith SD, Rausher MD. 2011 Gene loss and parallelevolution contribute to species difference in flowercolor. Mol. Biol. Evol. 28, 2799 – 2810. (doi:10.1093/molbev/msr109)
37. Streisfeld MA, Rausher MD. 2009 Altered trans-regulatory control of gene expression in multipleanthocyanin genes contributes to adaptive flowercolor evolution in Mimulus aurantiacus. Mol.Biol. Evol. 26, 433 – 444. (doi:10.1093/molbev/msn268)
38. Des Marais DL, Rausher MD. 2010 Parallel evolutionat multiple levels in the origin of hummingbirdpollinated flowers in Ipomoea. Evolution 64,2044 – 2054.
39. Spaethe J, Tautz J, Chittka L. 2001 Visual constraintsin foraging bumblebees: flower size and color affectsearch time and flight behavior. Proc. Natl Acad.USA 98, 3898 – 3903. (doi:10.1073/pnas.071053098)
40. Streisfeld MA, Kohn JR. 2007 Environment andpollinator-mediated selection on parapatric floralraces of Mimulus aurantiacus. J. Evol. Biol. 20,122 – 132. (doi:10.1111/j.1420-9101.2006.01216.x)
41. Streisfeld MA, Young WN, Sobel JM. 2013 Divergentselection drives genetic differentiation in an R2R3-MYB transcription factor that contributes toincipient speciation in Mimulus aurantiacus. PLOSGenet. 9, e1003385. (doi:10.1371/journal.pgen.1003385)
42. Feldman MW. 1972 Selection for linkagemodification: I. Random mating populations.Theoret. Popul. Biol. 3, 324 – 346. (doi:10.1016/0040-5809(72)90007-X)
43. Venail J, Dell’Olivo A, Kuhlemeier C. 2010 Speciationgenes in the genus Petunia. Phil. Trans. R. Soc. B365, 461 – 468. (doi:10.1098/rstb.2009.0242)
44. Chen KY, Cong B, Wing R, Vrebalov J, Tanksley SD.2007 Changes in regulation of a transcription factorlead to autogamy in cultivated tomatoes. Science318, 643 – 645. (doi:10.1126/science.1148428)
Related Documents