ORIGINAL PAPER QTL Analysis Coupled with PTR-ToF-MS and Candidate Gene-Based Association Mapping Validate the Role of Md-AAT1 as a Major Gene in the Control of Flavor in Apple Fruit Luca Cappellin & Brian Farneti & Mario Di Guardo & Nicola Busatto & Iuliia Khomenko & Andrea Romano & Riccardo Velasco & Guglielmo Costa & Franco Biasioli & Fabrizio Costa # Springer Science+Business Media New York 2014 Abstract Volatile organic compounds (VOCs) are funda- mental elements of flavor, one of the most important fruit- quality traits. Despite its importance, this aspect is still poorly considered in assisted breeding programs, due to the lack of suitable and fast detection systems as well as validated func- tional markers. In this work, a full-sib parental mapping population (‘Fuji×Delearly’) was initially employed to per- form a comprehensive quantitative trait locus (QTL) survey, to assess the VOC segregation detected by a novel proton- transfer-reaction time-of-flight mass spectrometry (PTR- ToF-MS) on fruit collected after a 2-month period of posthar- vest storage. Among this set of genomic regions, on chromo- some 2 was also verified the coincident location between a group of QTLs, mainly associated to esters and alcohols, with a functional marker designed for Md-AAT1, a gene involved in the last step of the ester biosynthetic pathway. The allelic effect of this marker (here named Md-AAT1 SSR ) was further validated by candidate gene association mapping approach in a collection of 124 apple accessions. In this case, the volatile profiling was performed on peeled fruit flesh, as an important fraction of the aromatic blend of apple is released only after cutting. This work proposed a new and fast method for aroma phenotyping as well as a novel marker for an easy and widely applicable apple fruit quality advanced selection. Keywords Fruit quality . Volatile organic compounds . Apple flavor . QTL analysis . Candidate gene-based association mapping Introduction The term “quality” is generally thought as a synonymous of an extraordinary feature of a product, guiding the consumers’ preference toward a specific type of food. The quality of a fruit is nowadays composed by four main principal quality factors (PQF) among which flavor is one of the most impor- tant (Bourne 2002; Costa et al. 2011), together with appear- ance, texture, and nutritional compounds. These traits, in all fruit types, are the result of the complex and high genetically coordinated process of fruit ripening, originally programmed to render the fruit organs more attractive and palatable (Giovannoni 2001; Klee and Giovannoni 2011; Gapper et al. 2013). During the breeding history of several climacteric fleshy fruit species, in particular apple and tomato, most efforts were addressed to traits directly involved with posthar- vest performance, such as fruit texture. In the last decade, in fact, a series of studies have been published about the dissec- tion of this trait (Harker et al. 2002, 2006; Costa et al. 2011, 2012) as well as the development of important markers suit- able to assist the selection of new accessions characterized by high texture behavior (Oraguzie et al. 2004, 2007; Costa et al. 2005, 2008, 2010; Zhu and Barritt 2008; Cevik et al. 2009; Longhi et al. 2012, 2013). This breeding philosophy, focused on a limited and important set of traits, however, had the drawback of decreasing the flavor components, leading to a Electronic supplementary material The online version of this article (doi:10.1007/s11105-014-0744-y) contains supplementary material, which is available to authorized users. L. Cappellin : M. Di Guardo : I. Khomenko : A. Romano : R. Velasco : F. Biasioli : F. Costa (*) Research and Innovation Centre, Fondazione Edmund Mach, Via Mach 1, 38010 San Michele all’Adige (Trento), Italy e-mail: [email protected] B. Farneti : N. Busatto : G. Costa Department of Agricultural Sciences, Bologna University, Via Fanin 46, 40127 Bologna, Italy Plant Mol Biol Rep DOI 10.1007/s11105-014-0744-y

Welcome message from author
This document is posted to help you gain knowledge. Please leave a comment to let me know what you think about it! Share it to your friends and learn new things together.
Transcript

ORIGINAL PAPER
QTL Analysis Coupled with PTR-ToF-MS and CandidateGene-Based Association Mapping Validate the Role of Md-AAT1as a Major Gene in the Control of Flavor in Apple Fruit
Luca Cappellin & Brian Farneti & Mario Di Guardo & Nicola Busatto &
Iuliia Khomenko & Andrea Romano & Riccardo Velasco &
Guglielmo Costa & Franco Biasioli & Fabrizio Costa
# Springer Science+Business Media New York 2014
Abstract Volatile organic compounds (VOCs) are funda-mental elements of flavor, one of the most important fruit-quality traits. Despite its importance, this aspect is still poorlyconsidered in assisted breeding programs, due to the lack ofsuitable and fast detection systems as well as validated func-tional markers. In this work, a full-sib parental mappingpopulation (‘Fuji×Delearly’) was initially employed to per-form a comprehensive quantitative trait locus (QTL) survey, toassess the VOC segregation detected by a novel proton-transfer-reaction time-of-flight mass spectrometry (PTR-ToF-MS) on fruit collected after a 2-month period of posthar-vest storage. Among this set of genomic regions, on chromo-some 2 was also verified the coincident location between agroup of QTLs, mainly associated to esters and alcohols, witha functional marker designed for Md-AAT1, a gene involvedin the last step of the ester biosynthetic pathway. The alleliceffect of this marker (here named Md-AAT1SSR) was furthervalidated by candidate gene association mapping approach ina collection of 124 apple accessions. In this case, the volatileprofiling was performed on peeled fruit flesh, as an importantfraction of the aromatic blend of apple is released only aftercutting. This work proposed a new and fast method for aroma
phenotyping as well as a novel marker for an easy and widelyapplicable apple fruit quality advanced selection.
Keywords Fruit quality . Volatile organic compounds .Appleflavor . QTL analysis . Candidate gene-based associationmapping
Introduction
The term “quality” is generally thought as a synonymous of anextraordinary feature of a product, guiding the consumers’preference toward a specific type of food. The quality of afruit is nowadays composed by four main principal qualityfactors (PQF) among which flavor is one of the most impor-tant (Bourne 2002; Costa et al. 2011), together with appear-ance, texture, and nutritional compounds. These traits, in allfruit types, are the result of the complex and high geneticallycoordinated process of fruit ripening, originally programmedto render the fruit organs more attractive and palatable(Giovannoni 2001; Klee and Giovannoni 2011; Gapper et al.2013). During the breeding history of several climactericfleshy fruit species, in particular apple and tomato, mostefforts were addressed to traits directly involved with posthar-vest performance, such as fruit texture. In the last decade, infact, a series of studies have been published about the dissec-tion of this trait (Harker et al. 2002, 2006; Costa et al. 2011,2012) as well as the development of important markers suit-able to assist the selection of new accessions characterized byhigh texture behavior (Oraguzie et al. 2004, 2007; Costa et al.2005, 2008, 2010; Zhu and Barritt 2008; Cevik et al. 2009;Longhi et al. 2012, 2013). This breeding philosophy, focusedon a limited and important set of traits, however, had thedrawback of decreasing the flavor components, leading to a
Electronic supplementary material The online version of this article(doi:10.1007/s11105-014-0744-y) contains supplementary material,which is available to authorized users.
L. Cappellin :M. Di Guardo : I. Khomenko :A. Romano :R. Velasco : F. Biasioli : F. Costa (*)Research and Innovation Centre, Fondazione Edmund Mach,Via Mach 1, 38010 San Michele all’Adige (Trento), Italye-mail: [email protected]
B. Farneti :N. Busatto :G. CostaDepartment of Agricultural Sciences, Bologna University,Via Fanin 46, 40127 Bologna, Italy
Plant Mol Biol RepDOI 10.1007/s11105-014-0744-y
general fruit quality drop-off (Klee 2010). To solve this situ-ation, in modern breeding programs, the improvement offlavor attributes turned out to be a priority, not only to improvefruit attractiveness but also for the role of these micronutrientsin human health (Beyesr and Perry 1992; DellaPenna 1999;Welch and Graham 2004; Klee 2010). To initiate breedingactivities toward this goal, two are the aspects that need to beconsidered: the full understanding of volatile complexity andthe availability of tools suitable for a reliable and fast pheno-type screening and selection.
To date, flavor in apple has been widely documented in thescientific literature, and it is thought to be represented byapproximately 370 compounds (Berger 1991; Fuhrmann andGrosch 2002; Nijssen et al. 2011; Ulrich and Dunemann2012). The blend of volatiles produced during fruit ripeningincludes alcohols, aldehydes, ketons, sesquiterpens,phenylpropanoids, and esters (Newcomb et al. 2006;Schaffer et al. 2007), which are produced from primary me-tabolites via four principal pathways (Schaffer et al. 2007;Dunemann et al. 2009; Dudareva and Klempien 2013).Among this myriad of compounds, esters are to date recog-nized as the most relevant volatile in apple aroma (Hollandet al. 2005), which includes both straight and branched chainesters (Ulrich and Dunemann 2012). For straight chain esters,linolenic and linoleic acid serve as precursor, whereas the finalstep is catalyzed by the alcohol acyltransferase (AAT) en-zyme. The impact of this gene in flavor formation has beenalready demonstrated in several agronomical important spe-cies, such as strawberry (Aharoni et al. 2000), banana(Beekwilder et al. 2004), and melon (El-Sharkawy et al.2005). The genetic regulation of this complex trait has beenalready investigated by QTL mapping approach, whichallowed the identification of a set of genomic regions puta-tively involved in the control of relevant alcohols, esters, andterpens (Dunemann et al. 2009). A further analysis carried outfrom this initial study, identified an AAT member in appleassociated to ester production (Dunemann et al. 2012). Allthese studies, however, were carried out by using a SPME-GC-MS equipment, which represents a valuable analyticalinstrument but laborious and time consuming. These con-strains can strongly limit the phenotyping power in case ofcontinuous assessments of large-scale samples, making thusunrealistic the volatile characterization of large germplasmcollection as well as breeding materials. In recent years, anew equipment was presented to the scientific community inorder to overcome these limitations: the proton-transfer-reaction mass spectrometry (PTR-MS; Lindinger et al.1998). The first instruments were characterized by a quadru-pole mass analyzer, having high time resolution (a few sec-onds) but suffering from lack of analytical power, due to unitmass resolution. Despite this, some attempts were made toemploy PTR-MS for QTLmapping purposes (Zini et al. 2005;Costa et al. 2013). Recently, a new generation of instruments
was developed and commercialized (Jordan et al. 2009), cou-pling PTR-MS with a time-of-flight mass analyzer (ToF),hence the name PTR-ToF-MS. The latter further enhancedthe time resolution (a complete spectrum is acquired in a splitsecond) and, more remarkably, the analytical power, thanks tothe mass resolution improved by about 6,000 times withrespect to quadrupole-based instruments.
PTR-ToF-MS has already been exploited in apple, validat-ing the capacity of this technique to characterize the aromaprofile in apple (Cappellin et al. 2012a), but to date, it has notbeen employed for QTL studies yet. In order to step forward inthe comprehension of the genetic control of apple fruit flavor,we employed this novel PTR-ToF-MS to fingerprint thevolatile organic compound (VOC) array of both an applepopulation (‘Fuji×Delearly’) and a collection of 124 differentapple cultivars.
In addition to this, the study described in this work wasperformed following an experimental design closer to a com-mercial scenario, thus after a postharvest storage. Finally, theeffect of a novel functional marker based on a microsatellitemotif and here named Md-AAT1SSR, was validated on cutapple fruit, which can present a different volatile profile withrespect to the whole fruit, as suggested by Ting et al. (2012)and Contreras and Beaudry (2013). VOCs can be classified as“primary” or “secondary,” indicating whether they are presentin intact fruit tissue or produced as a result of tissue disruption.VOCs generated by cut apples, for instance, may better rep-resent the flavor perception during eating (Song and Forney2008).
Taking these information into consideration, we proposedthis equipment together with the novel functional microsatel-lite marker as novel potential tools to enhance the general estercontent in apple.
Materials and Methods
Plant Materials
The VOC profiling was performed on two types of plantmaterials, a bi-parental full-sib mapping population (‘Fuji×Delearly’), and a collection represented by 124 apple acces-sions, composed by old and new cultivars, respectively. Bothtype of plant materials were planted and grown at the exper-imental orchard of the Fondazione EdmundMach in NorthernItaly (Province of Trento). In this experimental design, seed-lings from the progeny are represented by single plant, whileeach accession present in the collection is planted in tripli-cates. Each plant was maintained following standardagronomical management for pruning, thinning, and diseasecontrol. Apples form 94 individuals of the ‘Fuji×Delearly’population and 124 accessions of the germplasm collectionwere sampled at commercial harvest, analytically determined
Plant Mol Biol Rep

with a DA-meter device, a portable vis spectrometer able todetect chlorophyll variation in a nondestructive manner (Ziosiet al. 2008). A minimum of five homogeneous apples/accession and seedling were collected and immediately storedfor 2 months in a cold cellar (2–4 °C with ~95 % RH). Afterthis period, fruit were removed from cold storage and main-tained at room temperature (~20 °C) overnight before VOCfingerprinting.
VOC Analysis by PTR-ToF-MS
Fruits from both ‘Fuji×Delearly’ population and apple germ-plasm collection were assessed for VOC fingerprinting by acommercial PTR-ToF-MS 8000 apparatus (Ionicon AnalytikGmbH, Innsbruck, Austria).
VOC measurements of 124 apple accessions were per-formed in triplicate on the headspace produced by five cylin-der discs (1.7 cm diameter and 1 cm thickness) of apple fleshleft to equilibrate for 2 min inside a 250-mL glass jar. In thecase of ‘Fuji×Delearly’ population, three apples per individ-ual were analyzed, and each single intact fruit was placed intoa glass jar (1,000 mL), provided with two teflon/silicone septaon opposite sides. To standardize the measurements, sampleswere equilibrated at 37 °C for 30 min in a water bath prior toanalysis (Cappellin et al. 2012a).
In both cases, VOCs were then measured by direct injec-tion of the head space mixture into the PTR-ToF-MS drifttube. The conditions in the PTR-ToF-MS drift tube were thefollowing: 110 °C drift tube temperature, 2.25 mbar driftpressure, and 550 V drift voltage. This leads to an E/N ratioof about 140 Townsend (Td; 1 Td=10−17 V cm2), where Ecorrespond to the electric field strength while N to the gasnumber density. The sampling time per channel of ToF acqui-sition was 0.1 ns, amounting to 350,000 channels for a massspectrum ranging up tom/z=400. Every single spectrum is thesum of about 28.600 acquisitions lasting 35 μs each, resultingin a time resolution of 1 s. Sampling measurement wasperformed in 60 cycles resulting in an analysis time of60 s/sample.
In order to depict the difference existing in terms of volatileproduction between the different experimental conditions ap-plied here, fruit from two reference apple cultivars, such as‘Golden Delicious’ and ‘Fuji’ were assessed, both at harvestand after storage (2 months in cold cellar). In addition to this,the same comparison was also carried out between whole andcut apples.
PTR-ToF-MS Data Analysis
The analysis of PTR-ToF-MS spectral data proceeded asfollows. Count losses due to the ion detector dead time werecorrected off-line via a methodology based on Poisson statis-tics (Cappellin et al. 2011a). As the external calibration
provided by the acquisition software did not allow to reach agood mass accuracy, internal calibration was performed ac-cording to a procedure described by Cappellin et al. (2011b).Such a method generally allows a mass accuracy better than0.001 Th, which is sufficient for sum formula determination inour case. Compound annotation was then carried out uponcomparison of spectral data with fragmentation data ofcompound reference standards. Noise reduction, baselineremoval, and peak intensity extraction were performedaccording to Cappellin et al. (2011b), using modifiedGaussians to fit the peaks. Absolute headspace VOC concen-trations expressed in parts per billion by volume (ppbv) werecalculated from peak intensities according to the formuladescribed by Lindinger et al. (1998). A constant reaction ratecoefficient of 2×10⁻⁹ cm3/s was used in the calculations,introducing a systematic error of up to 30 % that can beaccounted for the actual rate if the coefficient is known(Cappellin et al. 2012b).
QTL Mapping on the ‘Fuji×Delearly’ Population
To target the genomic regions putatively involved in thecontrol of apple aroma compounds, 94 individuals of the‘Fuji×Delearly’ population were selected to build up a geneticmap. DNA was isolated from young leaves with the QiagenDNeasy Plant Kit and further quantified by a Nanodrop ND-8000 (Thermo Scientific, USA). In total, the map was realizedgrouping and ordering 494 markers, of both single-nucleotidepolymorphism (SNP) and simple-sequence repeat (SSR)types, as previously described by Longhi et al. (2012).Among them, one SSR was the functional marker related toa member of the AAT gene family investigated here and usedto map this gene into the genetic map (Md-AAT1SSR). Thisfunctional marker was amplified in a PCR reaction mix of20 μL, with 5 ng DNA, 10× buffer, 0.25 mM of dNTP,0.075 μM of forward and reverse primer (pf: 5′-ACGCTCGAGTGATGCAGAGT-3′, pr: 5′-GGCTGAAGTGCTTTGGAATG-3′), and 0.625 U of Eppendorf Taq polymerase.Amplification thermal conditions were as follow: initial dena-turation at 94 °C for 30 s, 32 cycles of 94 °C for 30 s, 58 °C for30 s, and 72 °C for 1 m and a final extension at 72 °C for5 min. PCR fragments were finally separated by an ABI Prism3730 capillary sequencer (Applied Biosystem by LifeTechnologies). Markers were grouped and ordered by a limitof detection (LOD) value of 5, a recombination frequency of0.45, and a Kosambi mapping function, implemented in thesoftware JoinMap 4.0 (Van Ooijen 2006). Marker data withphase information were further used to compute QTL intervals(with the software MapQTL 6.0; Van Ooijen 2009) togetherwith phenotype data represented by the VOC mass detectedby the PTR-ToF-MS. Apple spectral data were normalized bytotal spectral intensity not considering the signals related toprimary ions and not to VOCs.
Plant Mol Biol Rep

QTL regions were initially detected by employing thenonparametric statistic algorithm Kruskal–Wallis. These re-gions were subsequently confirmed by the parametric algo-rithm of Interval Mapping, choosing a LOD value of 3.5(established after running 1,000 permutations) as thresholdvalue to call true QTL, taking into consideration a type I errorα=0.05. Linkage group and LOD-QTL profile were visualizedthrough an ad hoc compiled R script (http://www.r-project.org)and MapChart (Vorrips 2002). Each genomic interval, corre-sponding to significant QTL regions, were anchored andaligned on the assembled contigs of the ‘Golden Delicious’apple genome. Within each QTL, the set of predicted geneswere retrieved and annotated interrogating theUniprot databaseby BLASTP algorithm. The functional marker investigatedhere (Md-AAT1SSR) was designed around a microsatellitemotif identified on the same contig (MDC018196.110) onwhich the AAT gene (MDP0000214714) was annotated(Fig. S1) by the software SPUTNIK (http://espressosoftware.com/sputnik/index.html).
Population Structure and Association Mapping
To infer the population structure of the collection implement-ed in this study, 124 apple accession were initially tested witha set of unrelated markers. For this purpose, 17 SSR markers(one per each chromosome) were specifically selected on theHiDRAS database (www.hidras.unimi.it) such as CH05G08,CH05E03, CH03G07, Hi23G02, CH04E03, CH03D12,Hi03A10, CH01C06, CH01F03b, CH02B03b, CH02D08,CH01G12, CH05E05, CH01G05, NZ02B1, CH04F10, andGD96. The posterior probability based on genetic data for agiven specific number of K (Pr(X|K)) was used as parameterto cluster the individuals into K groups. The number of pop-ulations (defined as K) was determined with STRUCTUREv2.3.1 (Pritchard et al. 2000), adopting an admixture model,with the assumption of an independent segregation of allelesand considering a range of population from K=2 to K=8. Thecomputation was carried out performing five independent runsof 100,000 Markov Chain Monte Carlo (MCMC) simulationsand 100,000 burn-in generations. Finally, the most probablenumber of K was defined by assessing the posterior probabil-ity [lnP(D)] and the ad hoc statistic ΔK, based on the rate ofchange in the log probability of data between successive Kvalues, as reported by Evanno et al. (2005). This analysis wasperformed by the Python based program STRUCTUREHARVESTER (Earl and vonHoldt 2012). The Q matrix ofthe population estimates was further used as covariates in thegeneral linear model (GLM) implemented in TASSEL v3.0(Bradbury et al. 2007), in order to calculate possible associationbetween theMd-AAT1SSR alleles and the phenotype representedby the VOC amount as detected by PTR-ToF-MS. P value werefinally adjusted by running 1,000 permutations. To calculate theallelic variability of Md-AAT1SSR microsatellite, its allelic
scoring was processed with CONVERT (Glaubitz 2004), asoftware dedicated for the conversion of diploid genetic datainto formats accepted by other programs for population geneticanalysis. In the specific case of Md-AAT1SSR, the softwareArlequin (Excoffier et al. 2005) was employed to calculateallelic frequency, allelic diversity under infinite-allele model(θ) and the evaluation of heterozigosity to test the Hardy–Weinberg equilibrium.
Results and Discussion
QTL Identification on the bi-parental Mapping Population‘Fuji×Delearly’
The set of markers implemented in the mapping procedurewere sufficient to assemble the 17 linkage groups (haploidchromosome number in apple) of the ‘Fuji×Delearly’ ge-nome, covering a total length of 1,053.24 cM with an averagedistance between adjacent markers of 2.3 cM. This markerdistribution was considered favourable for a high resolutionQTL detection, as already demonstrated in the fruit texturesurvey described by Longhi et al. (2012). Each individual ofthis population was phenotyped for VOC production, emittedby fruit after a period of 2 months of cold postharvest storage,with the novel PTR-ToF-MS. The general phenotype variabil-ity was analyzed by the multivariate statistical approach ofprincipal component analysis (PCA). The nonredundant plot-ting of data confirms that aroma is composed by a differentand segregating complex of volatiles (Fig. 1a). This behavioris also validated by the ‘Fuji×Delearly’ seedling distributionover the PCA hyperspace, reflecting the aromatic properties ofeach individual (Fig. 1b).
The combined analysis of markers together with phenotyp-ic data (VOC array), allowed the identification of a set ofQTLs distributed over ten chromosomes of the ‘Fuji×Delearly’ population, such as linkage group (LG) 2, LG_3,LG_4, LG_5, LG_11, LG_13, LG_14, LG_15, LG_16, andLG_17 (Fig. 2; Table 1). The QTLs identified in these regionsshowed a LOD value spanning from 3.52 to 14.2, with arespective percentage of expressed variance from 26 to68.9 %, respectively. The annotation of the masses related tothe VOCs profiled by PTR-ToF-MS revealed as most of thedetected QTLs were associated to sesquiterpenes, alcoholsand esters (Table 1). It is worth noting the coincidence be-tween a set of QTL identified on LG_2 and mainly associatedwith esters (m/z=44.0213, 61.0276, 62.0319, 72.0530,79.0392, and 80.0425), with the genetic position of Md-AAT1SSR (Table 2), the functional marker designed on theAAT gene (MDP0000214714; Fig. 3). This linkage group,together with LG_3 and LG_15, was also reported in the QTLsurvey performed by Dunemann et al. (2009) and Zini et al.
Plant Mol Biol Rep

(2005). Moreover, the QTLs found in other four LGs (LG_5,LG_11, LG_16, and LG_17) were also shared withDunemann et al. (2009), which used a GC-SPME equipment
to characterize the VOC set produced by the full-sib progeny‘Discovery×Prima’. This result validates the high confidenceand reliability of the novel PTR-ToF-MS with regards to more
Fig. 1 Distribution of a selection of VOC data among the individuals ofthe ‘Fuji×Delearly’ population, illustrated by means of the multivariatestatistics of principal component analysis (PCA). a The projection of the
significant VOCs; b the seedling distribution over the 2D-PCA hyper-space defined by the first two dimensions
LG
2LG
3LG
4LG
5LG
11
LG
13
LG
14
LG
15
LG
16
LG
17
28.0
175
29.0
387
30.0
422
44.0
213
45.0
335
46.0
370
53.0
387
55.0
553
56.0
616
57.0
336
57.0
698
58.0
378
58.0
732
61.0
276
62.0
319
63.0
436
70.0
407
70.0
767
71.0
491
71.0
855
72.0
530
72.0
890
73.0
288
73.0
646
74.0
359
74.0
639
75.0
439
76.0
476
77.0
489
79.0
392
80.0
425
84.0
921
85.0
650
85.1
015
86.0
682
86.1
050
88.0
523
89.0
598
90.0
636
93.0
553
93.0
912
102.0
660
103.0
756
104.0
790
107.0
713
113.0
965
115.0
759
116.0
817
125.0
246
129.0
914
130.0
982
131.1
067
132.1
106
133.1
081
139.1
465
143.1
060
144.1
105
149.0
967
154.1
318
155.1
089
159.1
380
160.1
414
187.1
692
188.1
727
208.2
061
LOD
Fig. 2 LOD-heat map representation of the entire set of QTL identifiedover the ‘Fuji×Delearly’ population (filtered by a LOD value thresh-old of 3.5). Each block represents a single linkage group, indicated
on the left side, while on the bottom is reported the list of VOCs forwhich a QTL was discovered. The QTL-LOD color scale is plottedaccording to the legend shown on the right side
Plant Mol Biol Rep

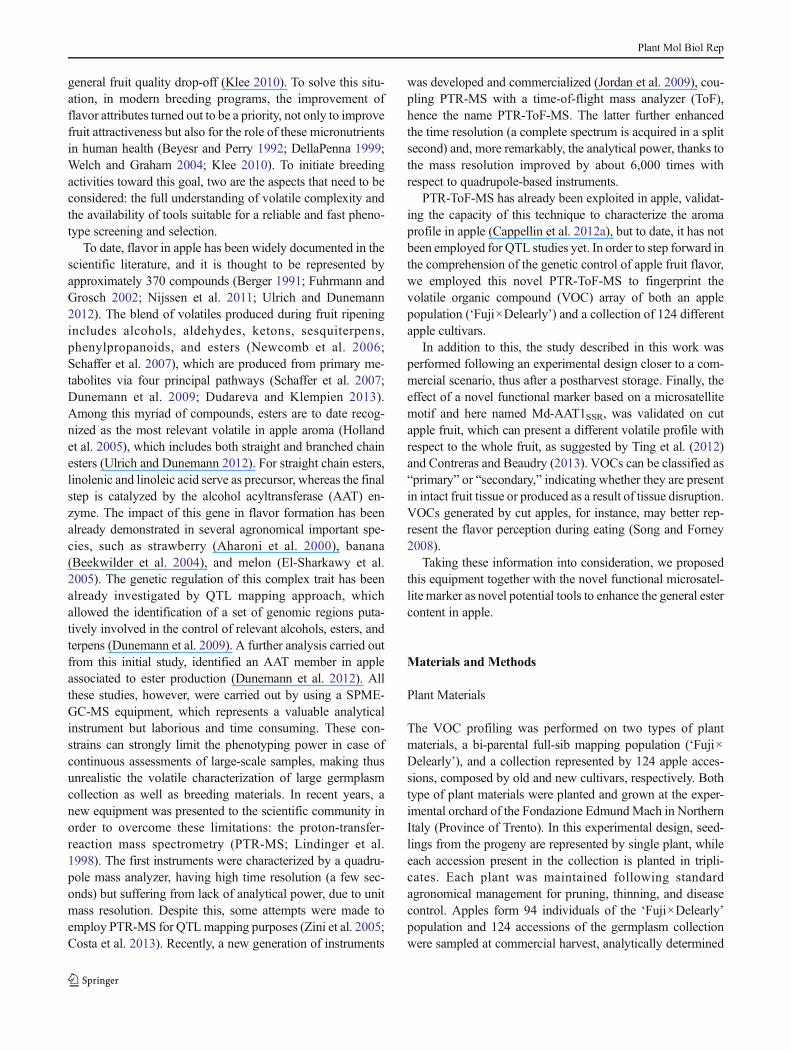
Table 1 List of QTL associated to the VOCs assessed over the ‘Fuji x Delearly’ genome
m/za Markerb LGc Positiond LODe Percentf Kg Kconfh Formulai IDj Annotationk
187.1692 CH02C02_a 2 3.367 4.66 31.8 13.322 –**** C11H23O2+ Esters Esters (pentyl hexanoate)
188.1727 CH02C02_a 2 3.367 4.67 31.9 13.178 –**** C11H23O2+ Esters Isotopes: esters (pentylhexanoate)
55.0553 AT000400 2 12.609 4.79 32.6 11.71 –**** C4H7+ n.a.
71.0491 AT000400 2 12.609 3.98 27.9 10.959 –**** C4H7O1+ Esters Esters (ethyl butanoate,ethyl hexanoate, propylbutanoate, butyl butanoate,2-methylbutyl acetate, andisoamyl acetate)
107.0713 AT000400 2 12.609 5.56 36.7 13.886 –***** C4H11O3+ n.a.
53.0387 GDsnp00799 2 18.505 5.24 35 11.925 –**** C4H5+ n.a.
57.0698 GDsnp00799 2 18.505 3.65 25.9 10.799 –**** C4H9+ General fragment
58.0732 GDsnp00799 2 18.505 3.66 26 10.604 –**** C4H9+ General fragment
73.0646 GDsnp00799 2 18.505 8.16 48.9 19.463 –******* C4H9O1+ Carbonyl compounds Carbonyl compounds (butanal)
74.0639 GDsnp00799 2 18.505 3.59 25.6 12.9 –**** C4H9O1+ Carbonyl compounds Isotope: carbonyl compounds(butanal)
93.0912 GDsnp00799 2 18.505 4.17 29.1 15.112 –***** n.a.
29.0387 GDsnp00203 2 19.343 6.5 41.4 19.934 –******* C2H5+ Ethylene
30.0422 GDsnp00203 2 19.343 6.58 41.8 18.969 –******* C2H5+ Ethylene
72.0530 CH02F06 2 24.232 7.94 48 19.451 –****** C4H7O1+ Esters Isotope: esters (ethyl butanoate,ethyl hexanoate, propylbutanoate, butyl butanoate,2-methylbutyl acetate, andisoamyl acetate)
44.0213 GDsnp01134 2 25.22 12.47 64.1 30.973 –******* C2H3O1+ Acetate esters Isotope
61.0276 GDsnp01134 2 25.22 11.31 60.6 28.336 –******* C2H5O2+ Acetate esters Acetate esters (ethyl acetate,butyl acetate, 2-methylbutylacetate, and hexyl acetate)
62.0319 GDsnp01134 2 25.22 11.29 60.5 28.687 –******* C2H5O2+ Acetate esters Isotope: acetate esters (ethylacetate, butyl acetate, 2-methylbutyl acetate, andhexyl acetate)
79.0392 GDsnp01134 2 25.22 11.36 60.7 29.328 –******* C2H7O3+ n.a.
80.0425 GDsnp01134 2 25.22 10.58 58.1 28.509 –******* C2H7O3+ n.a. Isotope
149.0967 snpEB148130 3 42.411 3.63 25.8 15.172 –******* C10H13O1+ Phenyls Phenyls (estragole andanethole)
70.0407 Hi21E04_B 4 8.278 4.25 29.5 13.358 –**** C4H5O1+ n.a.
116.0817 GDsnp00324 4 23.636 3.72 26.4 13.328 –****** C6H11O2+ Furanes Isotopes: furanes(5-ethyldihydro-2(3H)-furanone)
56.0616 GDsnp00881 4 27.178 5.79 37.9 10.709 –**** C4H8+ Esters Esters (isoamyl butanoate)
88.0523 GDsnp00881 4 27.178 7.15 44.4 15.021 –***** C4H7O2+ Esters Esters (ethyl butanoate andother esters)
89.0598 GDsnp00881 4 27.178 7.19 44.6 17.135 –****** C4H9O2+ Esters Esters (ethyl butanoate andother esters)
90.0636 GDsnp00881 4 27.178 6.91 43.3 16.393 –****** C4H9O2+ Esters Isotope: esters (ethyl butanoateand other esters)
45.0335 GDsnp01965 4 32.361 4.22 29.3 15.855 –******* C2H5O1+ Carbonyl compound Carbonyl compounds(acetaldehyde)
46.0370 GDsnp01965 4 32.361 3.77 26.7 16.925 –******* C2H5O1+ Carbonyl compound Isotope: carbonyl compounds(acetaldehyde)
63.0436 GDsnp01965 4 32.361 4.41 30.4 16.157 –******* C2H7O2+ n.a.
84.0921 GDsnp01965 4 32.361 5.18 34.7 14.531 –****** C6H11+ Alcohols and esters Alcohols (1-hexanol andnonanol) and esters (hexylacetate)
Plant Mol Biol Rep
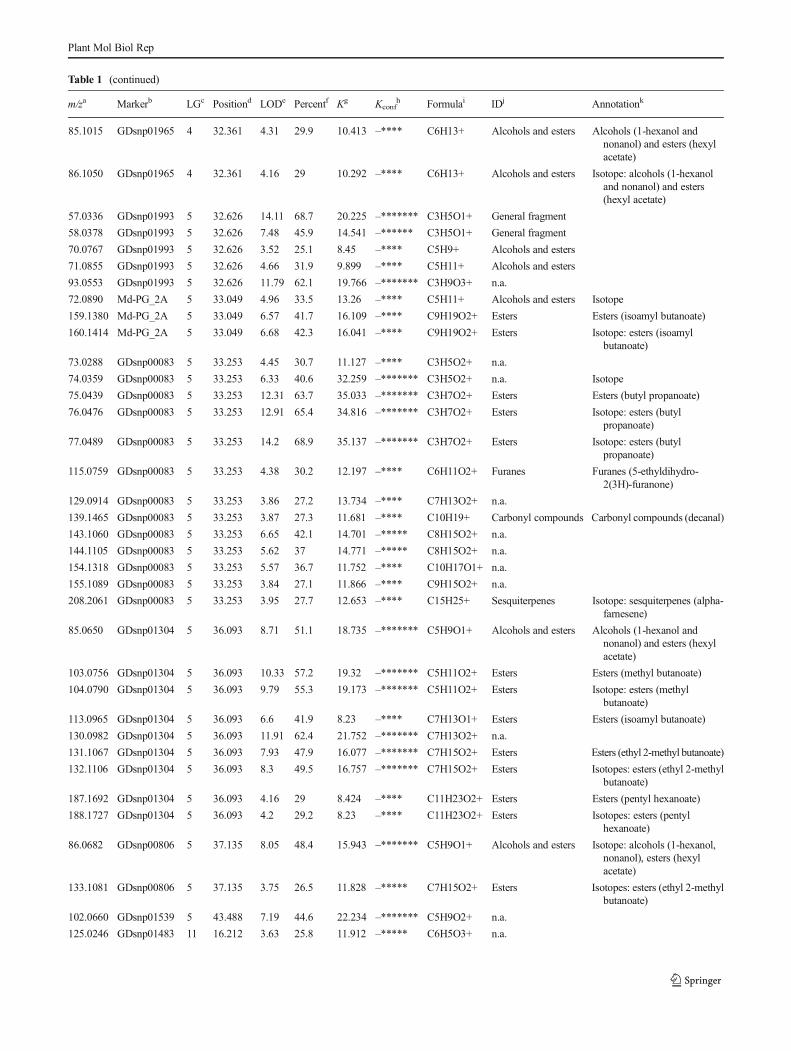
Table 1 (continued)
m/za Markerb LGc Positiond LODe Percentf Kg Kconfh Formulai IDj Annotationk
85.1015 GDsnp01965 4 32.361 4.31 29.9 10.413 –**** C6H13+ Alcohols and esters Alcohols (1-hexanol andnonanol) and esters (hexylacetate)
86.1050 GDsnp01965 4 32.361 4.16 29 10.292 –**** C6H13+ Alcohols and esters Isotope: alcohols (1-hexanoland nonanol) and esters(hexyl acetate)
57.0336 GDsnp01993 5 32.626 14.11 68.7 20.225 –******* C3H5O1+ General fragment
58.0378 GDsnp01993 5 32.626 7.48 45.9 14.541 –****** C3H5O1+ General fragment
70.0767 GDsnp01993 5 32.626 3.52 25.1 8.45 –**** C5H9+ Alcohols and esters
71.0855 GDsnp01993 5 32.626 4.66 31.9 9.899 –**** C5H11+ Alcohols and esters
93.0553 GDsnp01993 5 32.626 11.79 62.1 19.766 –******* C3H9O3+ n.a.
72.0890 Md-PG_2A 5 33.049 4.96 33.5 13.26 –**** C5H11+ Alcohols and esters Isotope
159.1380 Md-PG_2A 5 33.049 6.57 41.7 16.109 –**** C9H19O2+ Esters Esters (isoamyl butanoate)
160.1414 Md-PG_2A 5 33.049 6.68 42.3 16.041 –**** C9H19O2+ Esters Isotope: esters (isoamylbutanoate)
73.0288 GDsnp00083 5 33.253 4.45 30.7 11.127 –**** C3H5O2+ n.a.
74.0359 GDsnp00083 5 33.253 6.33 40.6 32.259 –******* C3H5O2+ n.a. Isotope
75.0439 GDsnp00083 5 33.253 12.31 63.7 35.033 –******* C3H7O2+ Esters Esters (butyl propanoate)
76.0476 GDsnp00083 5 33.253 12.91 65.4 34.816 –******* C3H7O2+ Esters Isotope: esters (butylpropanoate)
77.0489 GDsnp00083 5 33.253 14.2 68.9 35.137 –******* C3H7O2+ Esters Isotope: esters (butylpropanoate)
115.0759 GDsnp00083 5 33.253 4.38 30.2 12.197 –**** C6H11O2+ Furanes Furanes (5-ethyldihydro-2(3H)-furanone)
129.0914 GDsnp00083 5 33.253 3.86 27.2 13.734 –**** C7H13O2+ n.a.
139.1465 GDsnp00083 5 33.253 3.87 27.3 11.681 –**** C10H19+ Carbonyl compounds Carbonyl compounds (decanal)
143.1060 GDsnp00083 5 33.253 6.65 42.1 14.701 –***** C8H15O2+ n.a.
144.1105 GDsnp00083 5 33.253 5.62 37 14.771 –***** C8H15O2+ n.a.
154.1318 GDsnp00083 5 33.253 5.57 36.7 11.752 –**** C10H17O1+ n.a.
155.1089 GDsnp00083 5 33.253 3.84 27.1 11.866 –**** C9H15O2+ n.a.
208.2061 GDsnp00083 5 33.253 3.95 27.7 12.653 –**** C15H25+ Sesquiterpenes Isotope: sesquiterpenes (alpha-farnesene)
85.0650 GDsnp01304 5 36.093 8.71 51.1 18.735 –******* C5H9O1+ Alcohols and esters Alcohols (1-hexanol andnonanol) and esters (hexylacetate)
103.0756 GDsnp01304 5 36.093 10.33 57.2 19.32 –******* C5H11O2+ Esters Esters (methyl butanoate)
104.0790 GDsnp01304 5 36.093 9.79 55.3 19.173 –******* C5H11O2+ Esters Isotope: esters (methylbutanoate)
113.0965 GDsnp01304 5 36.093 6.6 41.9 8.23 –**** C7H13O1+ Esters Esters (isoamyl butanoate)
130.0982 GDsnp01304 5 36.093 11.91 62.4 21.752 –******* C7H13O2+ n.a.
131.1067 GDsnp01304 5 36.093 7.93 47.9 16.077 –******* C7H15O2+ Esters Esters (ethyl 2-methyl butanoate)
132.1106 GDsnp01304 5 36.093 8.3 49.5 16.757 –******* C7H15O2+ Esters Isotopes: esters (ethyl 2-methylbutanoate)
187.1692 GDsnp01304 5 36.093 4.16 29 8.424 –**** C11H23O2+ Esters Esters (pentyl hexanoate)
188.1727 GDsnp01304 5 36.093 4.2 29.2 8.23 –**** C11H23O2+ Esters Isotopes: esters (pentylhexanoate)
86.0682 GDsnp00806 5 37.135 8.05 48.4 15.943 –******* C5H9O1+ Alcohols and esters Isotope: alcohols (1-hexanol,nonanol), esters (hexylacetate)
133.1081 GDsnp00806 5 37.135 3.75 26.5 11.828 –***** C7H15O2+ Esters Isotopes: esters (ethyl 2-methylbutanoate)
102.0660 GDsnp01539 5 43.488 7.19 44.6 22.234 –******* C5H9O2+ n.a.
125.0246 GDsnp01483 11 16.212 3.63 25.8 11.912 –***** C6H5O3+ n.a.
Plant Mol Biol Rep
standard procedures usually employed to assess volatile pro-duction. The difference observed in the comparison of thesetwo investigations, besides the distinct genetic backgroundrepresented by the pedigrees of the two progenies, might be
due to the different physiological moments on which theassessment was performed. Dunemann and colleagues, in fact,profiled VOCs after harvest, while in this investigation theapples were stored for two months in a cold cellar prior
Table 1 (continued)
m/za Markerb LGc Positiond LODe Percentf Kg Kconfh Formulai IDj Annotationk
116.0817 GDsnp00195 13 0.068 3.73 26.4 11.792 –**** C6H11O2+ Furanes Isotopes: furanes(5-ethyldihydro-2(3H)-furanone)
29.0387 Hi21E04_A 14 18.679 3.95 27.7 12.796 –****** C2H5+ Ethylene
30.0422 Hi21E04_A 14 18.679 4.14 28.9 12.063 –***** C2H5+ Ethylene
70.0767 GDsnp02859 15 63.513 3.92 27.5 9.755 –**** C5H9+ Alcohols and esters
61.0276 GDsnp00692 15 64.578 4.44 30.6 10.797 –**** C2H5O2+ Acetate esters Acetate esters (ethyl acetate,butyl acetate, 2-methylbutylacetate, and hexyl acetate)
62.0319 GDsnp00962 15 69.423 3.9 27.4 14.63 –****** C2H5O2+ Acetate esters Isotope: acetate esters (ethylacetate, butyl acetate, 2-methylbutyl acetate, andhexyl acetate)
79.0392 GDsnp00962 15 69.423 3.59 25.6 12.476 –****** C2H7O3+ n.a.
80.0425 GDsnp00962 15 69.423 3.98 27.9 14.076 –****** C2H7O3+ n.a. Isotope
84.0921 GDsnp02823 15 70.682 3.77 26.7 12.753 –**** C6H11+ Alcohols and esters Isotope: alcohols (1-hexanoland nonanol) and esters(hexyl acetate)
102.0660 GDsnp00200 16 13.923 3.55 25.3 13.943 –***** C5H9O2+ n.a.
130.0982 GDsnp01467 17 64.873 3.88 27.3 13.556 –****** C7H13O2+ n.a.
**0.05 to *******0.0001, Kruskal–Wallis significance levelaMass-over-charge ratio of each volatile for which a QTL was detected (reported for each QTL)bMarker coincident with the highest LOD value within the QTL interval (reported for each QTL)c Chromosome on which the QTL was detected (reported for each QTL)dDistance of the marker, expressed in centiMorgan, from the top if the linkage group (reported for each QTL)e LOD value (reported for each QTL)f Expressed phenotypic variance (reported for each QTL)gKruskal–Wallis K value (reported for each QTL)hKruskal–Wallis significance level (reported for each QTL)i Chemical formula associated to each m/zj Compound classk Compound characterization
Table 2 QTL result for the volatile associated with the Md-AAT1SSR marker
Mass LOD Percent K Kconf Formula ID Annotation
44.0213 11.65 61.6 15.274 –******* C2H3O1+ Fragment of esters Isotope
44.0576 3.11 22.6 8.54 –**** C3H7+ General fragment Isotope
61.0276 10.78 58.8 14.061 –****** C2H5O2+ Acetate esters Esters (ethyl acetate)
62.0319 10.64 58.3 13.28 –****** C2H5O2+ Acetate esters Isotope: esters (ethyl acetate
72.0530 5.56 36.7 10.722 –**** C4H7O1+ Fragment of alcohols and esters Isotope: alcohols (2-methyl-butanol)
79.0392 10.83 58.9 14.729 –****** C2H7O3+ Unknown Unknown
80.0425 10.19 56.7 14.864 –****** C2H7O3+ Unknown Isotope
The details reported in the table are the same as those described in Table 1
Plant Mol Biol Rep

analysis. The higher efficiency of the novel instrumentequipped with a ToF, with regards to the first-generationinstruments based on a quadrupole mass spectrometer, wasalso supported by the findings that most of the QTLs reportedin this work are new with respect to Zini et al. (2005),such as LG_4 and LG_14. The higher resolution of theToF spectrometer, besides the detection of a higher num-ber of genomic intervals, also lead to the higher LODvalues showed by the QTL survey described in this work,as compared with other references. This higher confidenceadditionally supported the use of this equipment in fruitquality assessment.
To additionally verify and further validate the associationobserved between the QTL set identified over the genome of‘Fuji×Delearly’ progeny and the identified VOC set, an insilico gene mining was performed for each QTL detected(Table S1).
In total, 104 genes, distributed over 10 chromosomes, wereannotated and defined as fundamental for VOC production(Table 3). This gene set was grouped according to the origi-nating pathway (Dudareva and Klempien 2013), such as fattyacid, benzenoid and phenylpropanoid, terpenoid andbranched-chain aminoacid. Chromosome 2 showed one ofthe highest concentrations of VOC-related genes. On this
GDsnp008330,0
GDsnp004831,9
CH02C02_a3,4
AJ251165,5
GDsnp002145,9
GDsnp001598,4
GDsnp0122310,8
GDsnp0050512,1
GDsnp0028912,3
GDsnp0098512,5
AT00040012,6
GDsnp0030813,0
GDsnp00366
GDsnp0116213,3
GDsnp0166314,8
GDsnp0149815,5
GDsnp0014615,6
GDsnp0024316,1
GDsnp0015816,5
GDsnp0003517,5
GDsnp0194518,2
GDsnp0079918,5
GDsnp0020319,3
GDsnp0164120,0
Md-AAT1_SSR22,2
snpEB156780
snpCO903605
GDsnp00408
22,9
GDsnp0034823,5
GDsnp0156523,6
CH02F0624,2
GDsnp0173524,7
GDsnp0113425,2
GDsnp0022229,9
GDsnp0209338,5
CH03D1039,8
GDsnp0002241,4
GDsnp0182942,4
GDsnp0065544,5
GDsnp0153251,6
GDsnp0132252,7
0
1
2
3
4
5
6
7
8
9
10
11
12
13
LG_2Fig. 3 LOD profile of a set ofQTLs identified on thechromosome 2 of the ‘Fuji×Delearly’ population. On thislinkage group, the functionalmarker Md-AAT1SSR is depictedin red text. The colored lines inthe box on the right side define theLOD profile of the seven QTLassociated to m/z=44.0213(black), m/z=44.0576 (red),m/z=61.0276 (dark green),m/z=62.0319 (blue),m/z=72.0530 (brown),m/z=79.0392 (pink), andm/z=80.0425 (light green)
Plant Mol Biol Rep
chromosome, a cluster of AAT genes was annotated (inagreement with Dunemann et al. 2012), including the AATelement exploited here for the association with the volatileproduction in both mapping population and apple collection.It is also worth noting that three genes (MDP0000300836,MDP0000619822, and MDP0000388537), belonging to theAAT gene family, were annotated and positioned onchromosome 15, in contrast to what was previously reportedby Dunemann et al. (2012), which assigned them to chromo-some 8. The reason of this inconsistency was probably due toa poor resolution in the contig assembling of this region (onchromosome 15) in the first release of the apple genome. Thefact that all the three genes were miss assembled is becausethey are positioned in cluster, thus at a close distance.Chromosomes 8 and 15, moreover, are homoeologous, thusoriginated by the recent genome duplication occurred in apple(Velasco et al. 2010). The high synteny shared by these twochromosomes, together with the low sequencing coverage,might have been the cause of the previous erroneous position-ing of these genes, with respect to the current genome assem-bly version (www.rosaceae.org).
VOC Profiling on a Germplasm Apple Collection
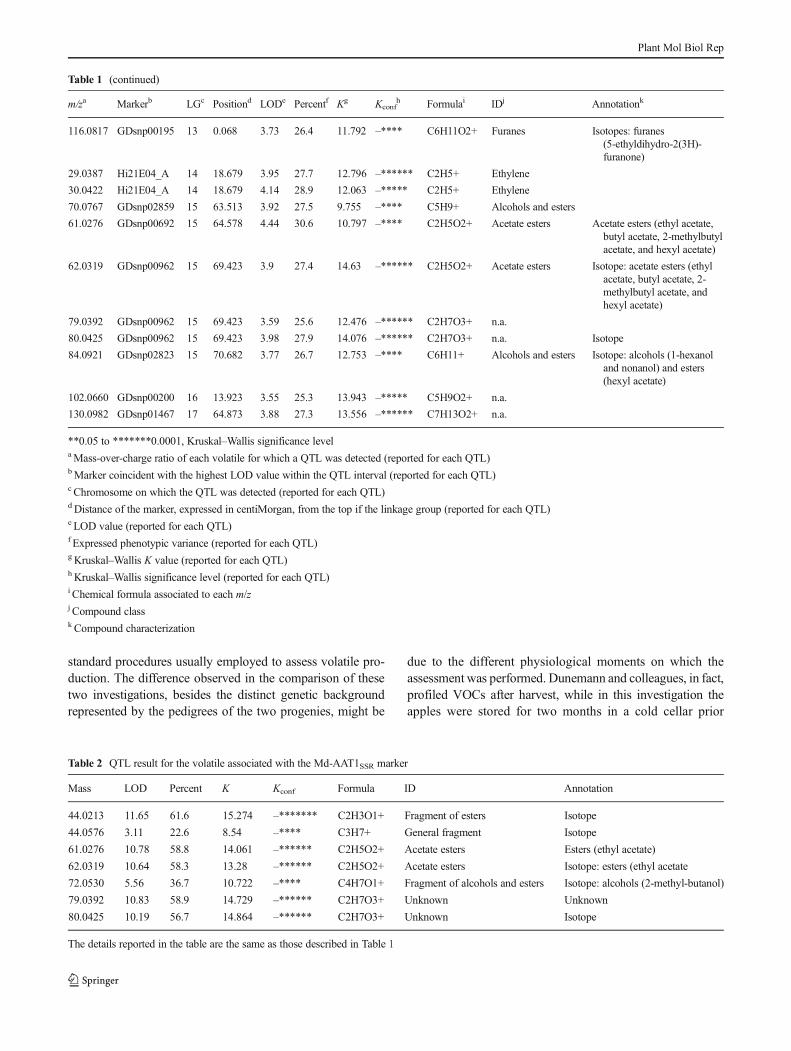
The blend of aroma compounds in apple is subjected toimportant modifications of several fold change during thefinal phase of fruit ripening, as well as in postharvest, asreported by Fellman et al. (2003), Newcomb et al. (2006),and Schaffer et al. (2007). As aroma is an important trait forconsumer appreciation, and thus marketability, we also per-formed a VOC survey over an apple collection represented by124 accessions analyzing cut fruit instead of whole intactapples. To have a better idea of volatile change among theseconditions, fruits from two apple cultivars (such as ‘GoldenDelicious’ and ‘Fuji’) were initially assessed at harvest as wellas after two months on both whole and cut fruit (Fig. 4). Thisanalysis showed that cut apples stored for two months pro-duced the highest amount of VOCs, suggesting this as themost valuable type of sample to analyze. It is in fact interestingto note that fruit cutting highly stimulates changes in both theconcentration and composition of volatile flavor compoundsin the headspace. After cutting, or even more evidently afterchewing, the food surface area exposed to air increases (deRoos 2003; Arvisenet et al. 2008), and several chemical
reactions start as consequence of the cell disruption. Forinstance in a cell-disrupted system, the rate of production ofaldehydes, such as hexanal or cis-3-hexenal, may consider-ably increase as a result of action of substrates released bycell disruption and lipoxigenase pathway enzymes (e.g.,
Table 3 Number of VOC related genes annotated per each chromosome
Chr2 Chr3 Chr4 Chr5 Chr11 Chr13 Chr14 Chr15 Chr16 Chr17
Fatty acid-derived VOCs 6 – 3 13 – 5 2 5 2 –
Benzenoid and phenylpropanoid VOCs 10 1 2 5 13 7 3 – – 1
Terpenoid VOCs 3 – 2 3 2 1 1 6 4 3
Branched-chain amino acids-derived VOCs – – 1 – – – – – – –
Fig. 4 VOC production of two apple cultivars, ‘Golden Delicious’ and‘Fuji’. a The difference in ester production between harvest and after2 months of cold storage of whole apples, for both cultivars, respectively.b The same comparison described for (a) but on cut fruit. Each singlemass, measured by PTR-ToF-MS, and expressed in parts per billion byvolume, is reported in the legend under the figure
Plant Mol Biol Rep
lipoxygenase, lipase, and fatty acid hydroperoxide lyase;Contreras and Beaudry 2013).
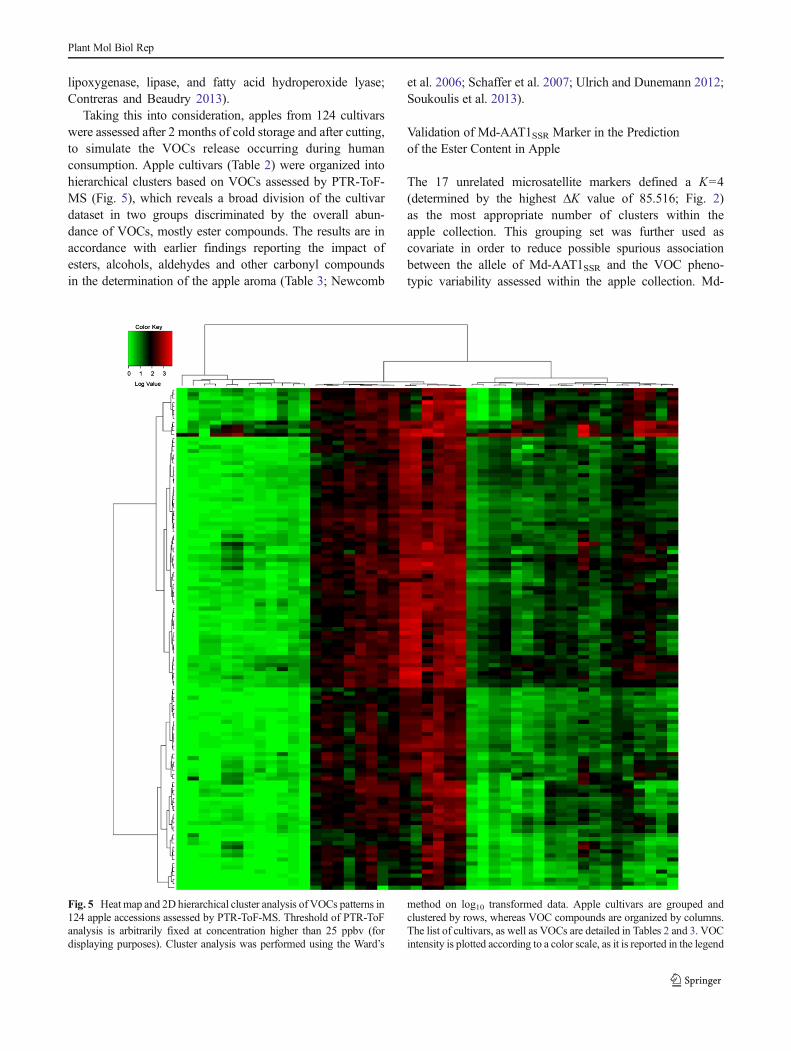
Taking this into consideration, apples from 124 cultivarswere assessed after 2 months of cold storage and after cutting,to simulate the VOCs release occurring during humanconsumption. Apple cultivars (Table 2) were organized intohierarchical clusters based on VOCs assessed by PTR-ToF-MS (Fig. 5), which reveals a broad division of the cultivardataset in two groups discriminated by the overall abun-dance of VOCs, mostly ester compounds. The results are inaccordance with earlier findings reporting the impact ofesters, alcohols, aldehydes and other carbonyl compoundsin the determination of the apple aroma (Table 3; Newcomb
et al. 2006; Schaffer et al. 2007; Ulrich and Dunemann 2012;Soukoulis et al. 2013).
Validation of Md-AAT1SSR Marker in the Predictionof the Ester Content in Apple
The 17 unrelated microsatellite markers defined a K=4(determined by the highest ΔK value of 85.516; Fig. 2)as the most appropriate number of clusters within theapple collection. This grouping set was further used ascovariate in order to reduce possible spurious associationbetween the allele of Md-AAT1SSR and the VOC pheno-typic variability assessed within the apple collection. Md-
Fig. 5 Heat map and 2D hierarchical cluster analysis of VOCs patterns in124 apple accessions assessed by PTR-ToF-MS. Threshold of PTR-ToFanalysis is arbitrarily fixed at concentration higher than 25 ppbv (fordisplaying purposes). Cluster analysis was performed using the Ward’s
method on log10 transformed data. Apple cultivars are grouped andclustered by rows, whereas VOC compounds are organized by columns.The list of cultivars, as well as VOCs are detailed in Tables 2 and 3. VOCintensity is plotted according to a color scale, as it is reported in the legend
Plant Mol Biol Rep

AAT1SSR is based on a microsatellite type of marker,located at 36.2 kb downstream the MDP0000214714 gene,of which eight alleles (119, 201, 203, 210, 212, 216, 218,and 226) were detected. Among them, the first three (199,201, and 203) represented the highest proportion of thefrequency rate detected (0.95), with allele 199 as the mostrepresented (0.81), followed by alleles 203 (0.09) and 201(0.05). Overall, the genetic diversity (θ) for Md-AAT1SSRwas 0.49, with an expected heterozygosity (He=0.33) notsignificantly different from the observed one (Ho=0.30),hypothesizing that the selection process occurred in appletill now did not strongly affect the segregation ratio of thistrait, in support of the abovementioned theory that thearoma trait has not been strongly selected. A markerrelated to Md-AAT1 was already published and presentedto the scientific community. However, it was based onhaplotype structure defined by four SNPs. To make aneasier-to-use and generally applicable type of marker, wedecided to design a novel functional marker based on amicrosatellite variation, also considering the fact that SSRmarker are still the most informative type of molecularmarker at the level of a single unit (Yang et al. 2011;Singh et al. 2013).
The association analysis performed employing the GLMalgorithm with Q matrix, was preferred to the MLMmodel, asthe latter one, for this specific case, might have a reduceddetection power in finding association, because of the imple-mentation of both structure and kinship matrix (Stich et al.2008; Yu and Buckler 2006). The candidate gene associationanalysis established a significant association (at the levelof P value ≤0.05) between the allele 201 and major VOCs(m/z=43.0177, 43.0541, 61.0281, 71.0491, 72.0548,83.0856, and 89.0595; Table 4). The annotation of thesespectrometric peaks shows that four are related to alcoholsand three correspond to esters. The association valuesspanned between a P value of 0.00005 to 0.04, with arate of expressed variance from a minimum of R2=0.04 to amaximum of 0.14. The same volatiles, with the exception of the
ones corresponding to m/z=89.0595, were also identified dur-ing QTL mapping computation performed on the ‘Fuji×Delearly’ population, pointing a common and reliable set ofvolatiles produced by both whole and cut fruit from differentgenetic backgrounds. As additional validation of the associa-tion, 124 apple cultivars of the collection were divided in twogroups according to the presence/absence ofMd-AAT1SSR_201allele. The phenotype distribution for these VOCs in two cate-gories resulted always statistically significant, based on LSD-ANOVA test (P value ≤0.05). As a general trend, the presenceof 201 allele (Fig. 3) determined a relevant enhancement of thevolatile production, besides acetate esters (m/z 43.0177 and61.0281), which showed an opposite trend. The presence ofMd-AAT1SSR_201, in fact, determined a reduction in the con-centration of these volatiles. This observation finds consistencywith the complexity of the volatile compounds composingaroma. This was also validated by correlation values, obtainedbetween the pairwise analysis performed within the set ofVOCs targeted by association analysis (Table 4). The Pearsoncorrelation values, in fact, spanned from a minimum of0.04 (m/z=83.0856/m/z=43.0177) to a maximum of 0.98(m/z=61.0281/m/z=43.0177; Table 4), suggesting that betweenalcohol and ester, as well between different type of esters(acetate and butanoate), a specific and distinct regulation oc-curs. It has been already proposed, in fact, that esters mightdiffer in concentration level upon different cultivars (Dixon andHewett 2000; Berger 2007). Esters can be distinguished inseveral categories, and in this case, the m/z=61.0281 belongsto acetate type, while 89.0595 and 71.0491 belong to thebutanoate type, which are specifically accumulated in ‘Fuji’,‘Elstar’, and ‘Cox Orange’ (Berger 2007).
Conclusions
The present results support the implementation of PTR-ToF-MS as a new, reliable, and fast approach to profile VOCs in
Table 4 List of VOCs associated with the allele Md-AAT1SSR_201
m/z VOC Marker_F Marker_p Marker_R2
83.0856 Alcohols ((Z)-3-hexen-1-ol, (E)-2-hexen-1-ol, 5-hexen-1-ol) 16.9274 0.0001 0.1486
43.0541 Alcohols 9.1233 0.0033 0.0853
72.0548 Isotopes of esters 5.8646 0.0174 0.0588
61.0281 Acetate esters (ethyl acetate, butyl acetate, 2-methylbutyl acetate, and hexyl acetate) 5.1475 0.0256 0.0477
71.0491 Esters (ethyl butanoate, ethyl hexanoate, propyl butanoate, butyl butanoate, 2-methylbutyl acetate,and isoamyl acetate)
5.0736 0.0267 0.0509
43.0177 Acetate esters 4.8714 0.0298 0.0453
89.0595 Esters (ethyl butanoate, propyl butanoate, and butyl butanoate) 4.3721 0.0393 0.0438
For each compound (identified as m/z) is reported the VOC annotation, the marker F statistic, the corresponding P value and the percentage ofphenotypic variation expressed (R2 )
Plant Mol Biol Rep
apple, also for QTL mapping purposes. The functional markerMd-AAT1SSR, identified as result of this investigation, wasfurther validated by a candidate gene association mappingapproach, confirming its suitability to assist the selection ofnew high-quality apple accession. However, it is also true thateven if esters represent the majority of the aromatic volatilearray produced by apple, further studies need to be planned inorder to better dissect the other minor genetic determinantsimpacting this trait. The QTL intervals presented here, and theunderlying set of annotated genes can represent the startingpoint for a new series of candidate genes based associationanalysis, towards the definition of additional markers to beused for the improvement of the fruit aroma in apple. In aclose future, this molecular toolbox should be also coupledwith sensorial analysis carried out by trained panelist, tofinally elucidate which are the most important and favorablecompounds appreciated by consumers, thus the most relevantattribute for the definition of the apple fruit quality make-up.
Acknowledgments The authors would like to thank Pierluigi Magnagoand his team for the maintenance of the apple population and collectionand Marco Fontanari for fruit sampling. This research was granted by theAgroalimentare research AGER project (grant no. 2010-2119).
References
Aharoni A, Keizer LCP, Bouwmeester HJ, Sun Z, Alvarez- Huerta M,Harrie A, Verhoeven HA, Blaas J, van Houwelingen AMML, DeVos RCH, van der Voet H, Jansen RC, Guis M, Mol J, Davis RW,SchenaM, van TunenAJ, O’Connell AP (2000) Identification of theSAAT gene involved in strawberry flavor biogenesis by use of DNAmicroarrays. Plant Cell 12:647–661
Arvisenet G, Billy L, Poinot P, Vigneau E, Bertrand D, Prost C (2008)Effect of apple particle state on the release of volatile compounds ina new artificial mouth device. J Agric Food Chem 56:3245–3253
Beekwilder J, Alvarez-Huerta M, Neef E, Verstappen FWA,Bouwmeester HJ, Aharoni A (2004) Functional characterization ofenzymes forming volatile esters from strawberry and banana. PlantPhysiol 135:1865–1878
Berger RG (1991) In volatile compounds in food and beverages, H.Maarse (ed.). Marcel Dekker: New York, pp. 283–297
Berger RG (2007) Flavours and Fragrances—chemistry, bioprocessingand suistainability. Springer-Verlag, Berlin, Germany
Beyesr T, Perry G (1992) Dietary carotenes, vitamin C, and vitaminE as protective antioxidants in human cancers. Annu Rev Nutr12:139–159
Bourne M (2002) Food Texture and Viscosity: Concept and measure-ment, 2nd edn. Academic Press, San Diego
Bradbury PJ, Zhang Z, Kroon DE, Casstevens TM, Ramdoss Y, BucklerES (2007) TASSEL: software for association mapping of complextraits in diverse samples. Bioinformatics 23:2633–2635
Cappellin L, Biasioli F, Schuhfried E, Soukoulis C, Märk TD, Gasperi F(2011a) Extending the dynamic range of proton transfer reactiontime-of-flight mass spectrometers by a novel dead time correction.Rapid Commun Mass Spectrom RCM 25:179–183
Cappellin L, Biasioli F, Granitto PM, Schuhfried E, Soukoulis C, Costa F,Märk TD, Gasperi F (2011b) On data analysis in PTR-TOF-MS:
From raw spectra to data mining. Sens. Actuators B Chem155:183–190
Cappellin L, Soukoulis C, Aprea E, Granitto P, Dallabetta N, Costa F,Viola R, Märk TD, Gasperi F, Biasioli F (2012a) PTR-ToF-MSand data mining methods: a new tool for fruit metabolomics.Metabolomics 8:761–770
Cappellin L, Karl T, Probst M, Ismailova O, Winkler PM, Soukoulis C,Aprea E, Märk TD, Gasperi F, Biasioli F (2012b) On quantitativedetermination of volatile organic compound concentrations usingproton transfer reaction time-of-flight mass spectrometry. EnvironSci Technol 46:2283–2290
Cevik V, Ryder CD, Popovich A, Manning K, King GJ, Seymour GB(2009) A FRUITFULL-like gene is associated with genetic variationfor fruit flesh firmness in apple (Malus domestica Borkh.). TreeGenet Genome 6:271–279
Contreras C, Beaudry R (2013) Lipoxygenase-associated apple volatilesand their relationship with aroma perception during ripening.Postharvest Biol Technol 82:28–38
Costa F, Stella S, Van de Weg WE, Guerra W, Cecchinel M, Dallavia J,Koller B, Sansavini S (2005) Role of the genes Md-ACO1 andMd-ACS1 in ethylene production and shelf life of apple (Malusdomestica Borkh). Euphytica 141:181–190
Costa F, Van de Weg WE, Stella S, Dondini L, Pratesi D, Musacchi S,Sansavini S (2008) Map position and functional allelic diversity ofMd-Exp7, a new putative expansin gene associated with fruit soft-ening in apple (Malus 9 domestica Borkh.) and pear (Pyruscommunis). Tree Genet Genome 4:575–586
Costa F, Peace CP, Stella S, Serra S,Musacchi S, BazzaniM, Sansavini S,Van de Weg WE (2010) QTL dynamics for fruit firmness andsoftening around an ethylene-dependent polygalacturonase gene inapple (Malus 9 domestica Borkh.). J Exp Bot 11:2029–3039
Costa F, Cappellin L, Longhi S, Guerra W, Magnano P, Porro D,Soukoulis C, Salvi S, Velasco R, Biasioli F, Gasperi F (2011)Assessment of apple (Malus×domestica Borkh.) fruit texture by acombined acoustic-mechanical profiling strategy. Postharvest BiolTechnol 6:21–28
Costa F, Cappellin L, Fontanari M, Longhi S, Guerra W, Magnago P,Gasperi F, Biasioli F (2012) Texture dynamics during postharvestcold storage ripening in apple (Malus x domestica Borkh.).Postharvest Biol Technol 69:54–63
Costa F, Cappellin L, Zini E, Patocchi A, Kellerhals M, Komjanc M,Gessler C, Biasioli F (2013) QTL validation and stability for volatileorganic compounds (VOCs) in apple. Plant Sci 211:1–7
De Roos KB (2003) Effect of texture and microstructure on flavourretention and release. Int Dairy J 13:593–605
DellaPenna D (1999) Nutritional genomics: manipulating plantmicronutrients to improve human health. Science 285:375
Dixon J, Hewett EW (2000) Factors affecting apple aroma/flavor volatileconcentration: a review. NZJ Crop Hortic Sci 28:155–173
Dudareva N, Klempien A (2013) Biosynthesis, function and metabolicengineering of plant volatile organic compounds. New Phytol 198:16–32
Dunemann F, Ulrich D, Boudichevskaia A, Grafe C, Weber WE (2009)QTL mapping of aroma compounds analysed by headspace solid-phase microextraction gas chromatography in the apple progeny‘Discovery’בPrima’. Mol Breeding 23:501–521
Dunemann F, Ulrich D, Malysheva-Otto L, Weber WE, Longhi S,Velasco R, Costa F (2012) Functional allelic diversity of the applealcohol acyl-transferase gene MdAAT1 associated with fruit estervolatile contents in apple cultivars. Mol Breeding 29:609–625
Earl D, vonHoldt BM (2012) STRUCTUREHARVESTER: aWebsite andprogram for visualizing STRUCTURE output and implementing theEvanno method. Conserv Genet Resour 4(2):359–361. doi:10.1007/s12686-011-9548-7
El-Sharkawy I, Manriques D, Flores FB, Regad F, Bouzayen M, LatcheA, Pech JC (2005) Functional characterization of a melon alcohol
Plant Mol Biol Rep
acyl-transferase gene family involved in the biosynthesis of estervolatiles. Identification of the crucial role of a threonine residue forenzyme activity. Plant Mol Biol 59:345–362
Evanno G, Regnaut S, Goudet J (2005) Detecting the number of clustersof individuals using the software STRUCTURE: a simulation study.Mol Ecol 14:2611–2620
Excoffier L, Laval G, Schneider S (2005) Arlequin ver. 3.0: An integratedsoftware package for population genetics data analysis. EvolBioinformatics Online 1:47–50
Fellman JK, Rudell DR, Mattinson DS, Mattheis JP (2003) Relationshipof harvest maturity to flavor regeneration after CA storage of“Delicious” apples. Postharvest Biol Technol 27:39–51
Fuhrmann E, Grosch W (2002) Character impact odorants of the applecultivars Elstar and Cox Orange. Nahrung/Food 46(3):187–193
Gapper NE, McQuinn RP, Giovannoni JJ (2013) Molecular and geneticregulation of fruit ripening. Plant Mol Biol 82:575–591
Giovannoni JJ (2001)Molecular biology of fruit maturation and ripening.Annu Rev Plant Physiol Plant Mol Biol 52:725–749
Glaubitz JC (2004) CONVERT: A user-friendly program to reformatdiploid genotypic data for commonly used population genetic soft-ware packages. Mol Ecol Notes 4:309–310
Harker FR,Maindonald J,Murray SH, Gunson FA,Hallett IC,Walker SB(2002) Sensory interpretation of instrumental measurements 1: tex-ture of apple fruit. Postharvest Biol Technol 24:225–239
Harker FR, White A, Gunson FA, Hallett IC, De Silva HN (2006)Instrumental measurement of apple texture: a comparison of thesingle-edge notched test and the penetrometer. Postharvest BiolTechnol 39:185–192
Holland D, Larkov O, Bar-Yaákov I, Bar E, Zax A, Brandeis E (2005)Developmental and varietal differences in volatiles ester formationand acetyl-CoA:alcohol acetyl transferase activities in apple (Malusdomestica Borkh.) fruit. J Agric Food Chem 53:7198–7203
Jordan A, Haidacher S, Hanel G, Hartungen E, Mark L, Seehauser H,Schottkowsky R, Sulzer P, Mark T (2009) A high resolution andhigh sensitivity proton-transfer-reaction time-of-flight mass spec-trometer (PTR-TOF-MS). Int J Mass Spectrom 286:122–128
Klee HJ (2010) Improving the flavor of fresh fruits: genomics, biochem-istry, and biotechnology. New Phytol 187:44–56
Klee HJ, Giovannoni JJ (2011) Genetics and control of tomato fruitripening and quality attributes. Annu Rev Genet 45:41–59
Lindinger W, Hansel A, Jordan A (1998) On-line monitoring of volatileorganic compounds at pptv levels by means of proton-transfer-reaction mass spectrometry (PTR-MS)—medical applications, foodcontrol and environmental research. Int J Mass Spectrom Ion Phys173:191–241
Longhi S, Moretto M, Viola R, Velasco R, Costa F (2012) ComprehensiveQTLmapping survey dissects the complex fruit texture physiology inapple (Malus x domestica Borkh.). J Exp Bot 63(3):1107–1121
Longhi S, Cappellin L, Guerra W, Costa F (2013) Validation of afunctional molecular marker suitable for marker-assisted breedingfor fruit texture in apple (Malus 3 domestica Borkh.). Mol Breeding32:841–852
Newcomb RD, Crowhurst RN, Gleave AP, Rikkerink EHA, Allan AC,Beuning LL, Bowen JH, Gera E, Jamieson KR, Janssen BJ, LaingWA, McArtney S, Nain B, Ross GS, Snowden KC, Souleyre EJF,Walton EF, Yauk YK (2006) Analyses of expressed sequence tagsfrom apple. Plant Physiol 141:147–166
Nijssen LM, van Ingen-Visscher CA, Donders JJH (2011) VCFVolatile Compounds in Food: database (version 13.1). Zeist(The Netherlands)
Oraguzie NC, Iwanami H, Soejima J, Harada T, Hall A (2004) Inheritanceof the Md-ACS1 gene and its relationship to fruit softening in apple(Malus × domestica Borkh.). Theor Appl Genet 108:1526–1533
Oraguzie NC, Volz RK, Whitworth CJ, Bassett HCM, Hall AJ, GardinerSE (2007) Influence of Md-ACS1 allelotype and harvest seasonwithin an apple germplesm collection on fruit softening during coldair storage. Postharvest Biol Technol 44:212–219
Pritchard JK, Stephens M, Donnelly P (2000) Inference of populationstructure using multilocus genotype data. Genetics 155:945–959
Schaffer RJ, Friel EN, Souleyre EJF, Bolitho K, Thodey K, Ledger S,Bowen JH, Ma JH, Nain B, Cohen D, Gleave AP, Crowhurst RN,Janssen BJ, Yao JL, Newcomb RD (2007) A genomics approachreveals that aroma production in apple is controlled by ethylenepredominantly at the final step in each biosynthetic pathway. PlantPhysiol 144:1899–1912
Singh N, Choudhury DR, Singh AK, Kumar S, Srinivasan K, Tyagi RK,Singh NK, Singh R (2013) Comparison of SSR and SNP markers inestimation of genetic diversity and population structure of Indianrice varieties. Plos ONE 8(12):e84136
Song J, Forney CF (2008) Flavour volatile production and regulation infruit. Can J Plant Sci 88:537–550
Soukoulis C, Cappellin L, Aprea E, Costa F, Viola R, Märk TD, GasperiF, Biasioli F (2013) PTR-ToF-MS, a novel, rapid, high sensitivityand non-invasive tool to monitor volatile compound release duringfruit post-harvest storage: the case study of apple ripening. FoodBioproc Technol 6:2831–2843
Stich B, Möhring J, Piepho HP, Heckenberger M, Buckler ES,Melchinger AE (2008) Comparison of mixed-model approachesfor association mapping. Genetics 178:1745–1754
Ting VJL, Soukoulis C, Silcock P, Cappellin L, Romano A, Aprea E,Bremer PJ, Märk T, Gasperi F, Biasioli F (2012) In vitro and in vivoflavour release from intact and freshcut apple in relation withgenetic, textural, and physicochemical parameters. J Food Sci77:1226–1233
Ulrich D, Dunemann F (2012) Towards the development of molecularmarkers for apple volatiles. Flavour Fragr J 27:286–289
Van Ooijen JW (2006) Joinmap 4®, software for the calculation of geneticlinkage maps in experimental populations. Kyazma BV,Wageningen,Netherlands
Van Ooijen JW (2009) MAPQTL 6®, Software for the mapping ofquantitative trait loci in experimental populations of diploid species.Kyazma BV, Wageningen, Netherlands
Velasco R, ZharkikhA, Affourtit J, Dhingra A, Cestaro A et al (2010) Thegenome of the domesticated apple (Malus x domestica Borkh.). NatGenet 42(10):833–839. doi:10.1038/ng.654
Vorrips RE (2002) MapChart: software for the graphical presentation oflinkage maps and QTLs. J Hered 93:77–78
Welch RM, Graham RD (2004) Breeding for micronutrients in staplefood crops from a human nutrition perspective. J Exp Bot 55(396):353–364
Yang X, Xu Y, Shah T, Li H, Han Z, Li J, Yan J (2011) Comparison ofSSR and SNPs in assessment of genetic relatedness in maize.Genetica 139:1045–1054
Yu J, Buckler ES (2006) Genetic association mapping and genomeorganization of maize. Curr Opin Biotechnol 17:155–160
Zhu YM, Barritt BH (2008) Md-ACS1 and Md-ACO1 geno- typing ofapple (Malus 9 domestica Borkh.) breeding parents and suitabilityfor marker-assisted selection. Tree Genet Genome 4:555–562
Zini E, Biasioli F, Gasperi F, Mott D, Aprea E, Mark TD, Patocchi A,Gessler C, KomjancM (2005) QTLmapping of volatile compoundsin ripe apples detected by proton transfer reaction-mass spectrome-try. Euphytica 145:269–279
Ziosi V, Noferini M, Fiori G, Tadiello A, Trainotti L, Casadoro G, CostaG (2008) A new index based on Vis spectroscopy to characterize theprogression of ripening in peach fruit. Postharvest Biol Technol 49:319–329
Plant Mol Biol Rep
Related Documents