SWS Profile FINAL REVISION FOR CONSENSUS STATUS VOTE BSG Final Review-final edits all accepted 3- 15-21 - clean copy.docx QIBA Profile: Ultrasound Measurement of Shear Wave Speed for Estimation of Liver Fibrosis 5 Stage: 2. Consensus 10

Welcome message from author
This document is posted to help you gain knowledge. Please leave a comment to let me know what you think about it! Share it to your friends and learn new things together.
Transcript
SWS Profile FINAL REVISION FOR CONSENSUS STATUS VOTE BSG Final Review-final edits all accepted 3-15-21 - clean copy.docx
QIBA Profile: Ultrasound Measurement of Shear Wave
Speed for Estimation of Liver Fibrosis 5
Stage: 2. Consensus 10
SWS Profile FINAL REVISION FOR CONSENSUS STATUS VOTE BSG Final Review-final edits all accepted 3-15-21 - clean copy.docx
Table of Contents 15 1. Executive Summary ....................................................................................................................................4
2. Clinical Context and Claims ........................................................................................................................5
2.1 Clinical Interpretation ..........................................................................................................................8
2.2 Discussion .............................................................................................................................................9 20 3. Profile Activities .......................................................................................................................................11
3.0. Site Conformance Check ...................................................................................................................12
3.0.1 Discussion ....................................................................................................................................12
3.0.2 Specification ................................................................................................................................12
3.1. Staff Qualification..............................................................................................................................12 25 3.1.1 Discussion ....................................................................................................................................13
3.1.2 Specification ................................................................................................................................13
3.2. Product Validation.............................................................................................................................13
3.3. Pre-delivery .......................................................................................................................................13
3.3.1 Discussion ....................................................................................... Error! Bookmark not defined. 30 3.3.2 Specification ................................................................................................................................14
3.4. Installation .........................................................................................................................................14
3.4.1 Discussion ....................................................................................................................................14
3.4.2 Specification ................................................................................................................................15
3.5. Periodic QA ........................................................................................................................................15 35 3.5.1 Discussion ....................................................................................................................................15
3.5.2 Specification ................................................................................................................................15
3.6. Protocol Design .................................................................................................................................16
3.7. Subject Selection ...............................................................................................................................16
3.7.1 Discussion ....................................................................................................................................16 40 3.7.2 Specification ................................................................................................................................17
3.8. Subject Handling ...............................................................................................................................18
3.8.1 Discussion ....................................................................................................................................18
3.8.2 SPECIFICATION ............................................................................................................................18
3.9. SWS Image Acquisition (SWEI) and Point SWS Measurement .........................................................19 45 3.9.1 Discussion ....................................................................................................................................19
3.9.2 Specification ................................................................................................................................22
3.10. Image Data Reconstruction .............................................................................................................24
3.11. Image QA .........................................................................................................................................24
3.11.1 Discussion ..................................................................................................................................24 50 3.11.2 Specification ..............................................................................................................................25
3.12. Image Distribution ...........................................................................................................................25
3.13. Image Analysis .................................................................................................................................25
3.14. Image Interpretation .......................................................................................................................25
4. Assessment Procedures ...........................................................................................................................26 55 4.1. Assessment Procedure: Imaging Performance .................................................................................26
4.1.1 OBTAINING AND MAINTAINING THE IMAGING PHANTOMS ......................................................26
4.1.2 ASSESSING IMAGING PERFORMANCE.........................................................................................29
4.2. Assessment Procedures: SWS Measurement Consistency ...............................................................29
4.2.1 SITE ASSESSMENT TOOLS AND TESTS. .......................................................................................30 60
SWS Profile FINAL REVISION FOR CONSENSUS STATUS VOTE BSG Final Review-final edits all accepted 3-15-21 - clean copy.docx
4.2.2 ASSESSING SWS CONSISTENCY COMPARED WITH PHANTOM SPECIFICATIONS--- SEE THIS TOPIC IN SECTION 3.4.1 .......................................................................................................................34
4.2.3 INDIVIDUAL ACTOR TOOLS AND TESTS .......................................................................................34
4.3. Assessment Procedure: SWS Measurement Concordance ..............................................................34
5. Conformance ............................................................................................................................................35 65 Appendix A: Acknowledgements and Attributions ......................................................................................37
Appendix B: Background Information ..........................................................................................................40
Appendix C: Conventions and Definitions....................................................................................................40
Appendix D: Model-specific Instructions and Parameters ..........................................................................40
D.1 Canon .................................................................................................................................................40 70 D.2 ESAOTE ...............................................................................................................................................43
D.3 General Electric ..................................................................................................................................45
D.4 Hitachi ................................................................................................................................................46
D.5 Philips .................................................................................................................................................47
D.6 Samsung .............................................................................................................................................48 75 D.7 Siemens ..............................................................................................................................................51
D.8 Supersonic Imagine ............................................................................................................................53
Appendix E: Primary Checklists for Profile Execution and Conformance ....................................................55
Appendix F: Secondary Checklists for Profile Execution and Conformance ................................................55
Appendix G: Patient information sheet and Data collection .......................................................................56 80 References ....................................................................................................................................................58
SWS Profile FINAL REVISION FOR CONSENSUS STATUS VOTE BSG Final Review-final edits all accepted 3-15-21 - clean copy.docx
1. Executive Summary 85
The goal of a QIBA Profile is to help achieve a useful level of performance for a given biomarker.
Profile development is an evolutionary, phased process; this Profile is in the consensus stage. The performance claims represent expert consensus and will be empirically demonstrated at a subsequent stage. Users of this Profile are encouraged to refer to the following site to understand the document’s context: http://qibawiki.rsna.org/index.php/QIBA_Profile_Stages. 90
The Claim (Section 2) describes the biomarker performance. The Activities (Section 3) contribute to generating the biomarker. Requirements are placed on the Actors that participate in those activities as necessary to achieve the Claim. Assessment Procedures (Section 4) for evaluating specific requirements are defined as needed. Conformance (Section 5) regroups Section 3 requirements by Actor to conveniently check Conformance. 95
This QIBA Profile (Ultrasound Measurement of Shear Wave Speed for Estimation of Liver Fibrosis) addresses estimation of liver fibrosis, which is often used to determine when and how to treat patients with diffuse liver disease, and also monitor progression or response to treatment. It places requirements on ultrasound scanners (acquisition devices), Scanner Manufacturer/Vendor, 100 Technologists/Sonographers, QA (Quality Assurance) Manager, Radiologists, and Image Analysis Tools involved in pre-delivery steps, scanner installation, site QA procedures, subject selection and handling, image data acquisition, image and other QA and image analysis. The requirements are focused on achieving sufficient accuracy and avoiding unnecessary variability of the estimation of liver fibrosis. Estimates of liver fibrosis are based on the stiffness of the liver tissue which in turn is based on a 105 measurement of shear wave speed (SWS) in the tissue using ultrasound.
The clinical performance target is to achieve SWS measurements with a bias of the mean value of ≤ 5% and an overall coefficient of variation of 5% (SD/mean). The standard against which to measure bias has not yet been fully defined, so currently there is no bias claim. At the present time, bias is determined by comparison to the measured shear wave speed and stiffness using a Verasonics ultrasound system in a 110 calibrated QIBA SWS phantom. Currently bias and precision vary depending on the magnitude of measured shear wave speed (as determined in phantom studies) so bias and variance claims are given for three ranges of measured shear wave speed values. Also, bias and precision vary depending on the conditions under which the measurements are made. Bias and precision claims are therefore also given for various measurement conditions. 115
This document is intended to help clinicians basing decisions on this biomarker, imaging staff generating this biomarker, vendor staff developing related products, purchasers of such products and investigators designing trials with imaging endpoints.
Note that this document only states requirements to achieve the claim, not “requirements on standard of care.” Conformance to this Profile is secondary to properly caring for the patient. 120
QIBA Profiles addressing other imaging biomarkers using CT, MRI, PET and Ultrasound can be found at qibawiki.rsna.org.
SWS Profile FINAL REVISION FOR CONSENSUS STATUS VOTE BSG Final Review-final edits all accepted 3-15-21 - clean copy.docx
2. Clinical Context and Claims
Elastography is a technique for measuring tissue stiffness or elasticity. Stiffness or elasticity of all 125 materials including tissue is defined by a parameter known as the elastic (or Young’s) modulus typically given in units of pressure (Pascals or kilopascals). The elastic modulus may be measured directly by mechanical testing where pressure is applied to a sample of material and the deformation (loss of height or thickness) is measured. The slope of the plot of thickness change vs. pressure is the elastic modulus. For a given amount of pressure, the change in thickness of the overall block of material, or at any 130 location in the material, is defined as the “strain”. Samples of tissue are not usually available for mechanical testing, so elastography was developed as a means to estimate tissue elasticity non-invasively. Tissue elasticity may be calculated in two ways: 1) From an image of the strain of a region of tissue in response to external or internal compression force (known as strain elastography), and 2) by measuring the speed of propagation of a shear wave as it traverses a region of tissue (known as shear 135 wave elastography). For the second technique, the shear wave speed (SWS) may be used as a surrogate for tissue stiffness which serves as a biomarker for level of fibrosis since it has been shown that fibrosis is the major cause of increased liver stiffness.
Clinical Context
Shear wave speed (SWS) is a biomarker to identify patients with moderate but significant liver fibrosis, 140 defined as ≥ F2 fibrosis in the METAVIR system (or equivalent for other scoring systems) of staging liver fibrosis. This might be used to monitor progression of fibrosis or to monitor regression of fibrosis during anti-fibrosis therapy.
SWS also serves as a biomarker for the evaluation of cirrhosis, defined as F4 stage of fibrosis of the METAVIR system of staging liver fibrosis. As noted in the discussion below, the SWS biomarker may be 145 referred to as the “measurand” elsewhere in this document.
Intended Clinical Application: SWS is measured in the liver of patients with suspected diffuse liver disease, with or without fatty infiltration of the liver and with suspected fibrosis or cirrhosis.
Multiple Claims: Ground work studies conducted by the QIBA SWS Biomarker Committee have indicated that the key measures of biomarker performance, Bias and Precision, depend on the level of 150 fibrosis present and upon other variables such as whether or not the measurements are taken with a single machine at a single site (hospital or clinic) or not. Accordingly, several claims for bias and precision are made depending on the situation and estimated level of fibrosis. Strictly speaking, the claims of the profile only apply to purely elastic materials and phantoms. This is because visco-elastic phantoms are generally not available for sites to verify the profile claims and the committee must 155 further verify the profile claims for a clinically relevant range of visco-elastic materials. Claims for visco-elastic phantoms and tissues will appear in the next version of the profile. The claims are presented below.
In the claims presented below, the term “imaging system” refers to both the ultrasound scanner (machine) and the operator using the machine to perform SWS measurements. Changing either the 160 operator or ultrasound scanner therefore results in a different imaging system.
Conformance to this Profile by all relevant staff and equipment supports the following claim(s):
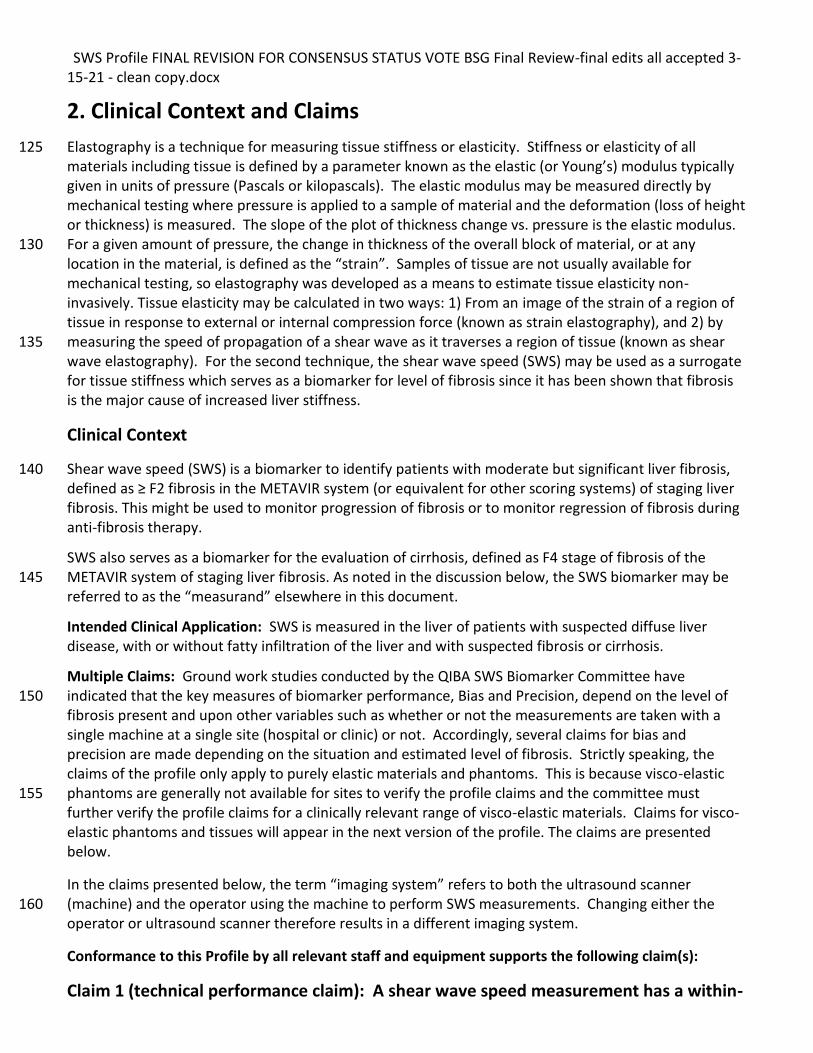
Claim 1 (technical performance claim): A shear wave speed measurement has a within-
SWS Profile FINAL REVISION FOR CONSENSUS STATUS VOTE BSG Final Review-final edits all accepted 3-15-21 - clean copy.docx
subject coefficient of variation (wCV) depending on the measured SWS and depth of acquisition according to Table 2-1. 165
Table 2-1 Coefficient of Variation (wCV)
Measured SWS (m/s) Depth=4.5cm* Depth=7.0cm
0.9 < SWS <= 1.2 5% 8%
1.2 < SWS <= 2.2 4% 5%
2.2 < SWS <= 5.0 10% 12%
*For measurements taken at depths other than the two listed, the SWS Committee has determined that
linear interpolation of the Coefficients of Variation (wCV) is appropriate. Although large changes in wCV are seen between the middle and high SWS ranges, those ranges have different clinical uses. The committee has insufficient phantom data to make a recommendation regarding interpolation of wCV 170 based on SWS.
Claim 2 (cross-sectional claim): A 95% confidence interval for the true SWS is Y ± (1.96
Y wCV/100), where Y is the measured SWS and wCV is the within-subject coefficient of variation from Table 2-1.
175
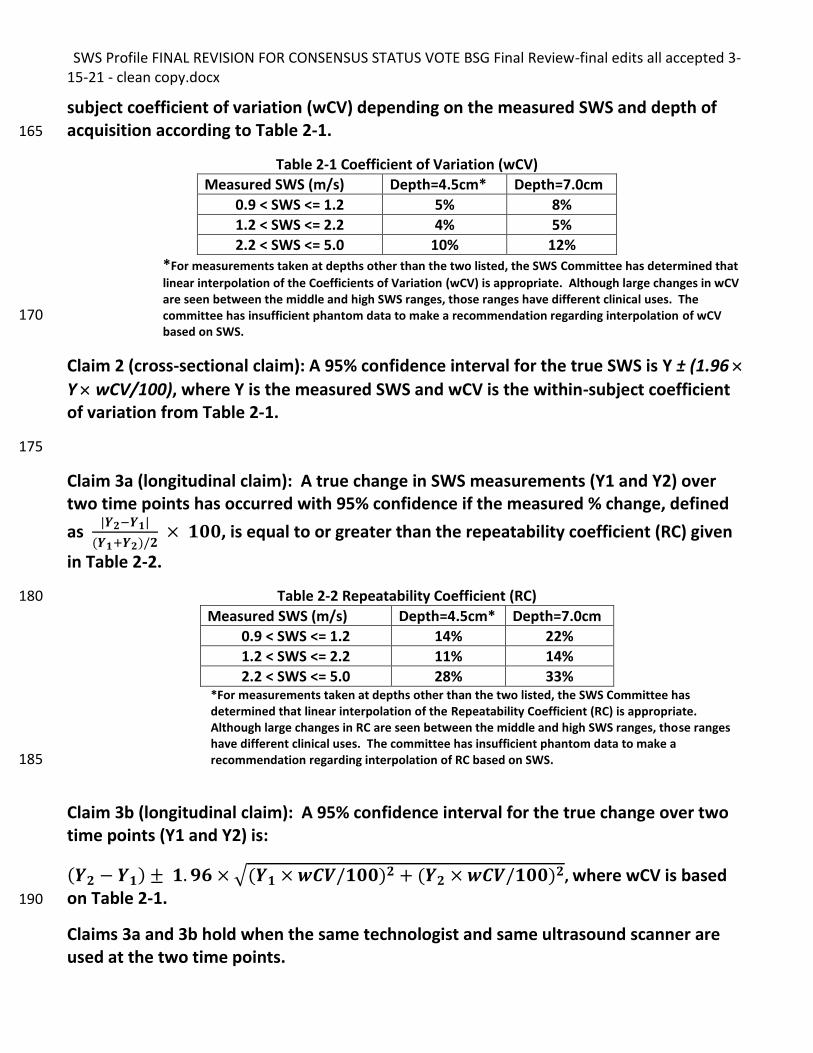
Claim 3a (longitudinal claim): A true change in SWS measurements (Y1 and Y2) over two time points has occurred with 95% confidence if the measured % change, defined
as |𝒀𝟐−𝒀𝟏|
(𝒀𝟏+𝒀𝟐)/𝟐 × 𝟏𝟎𝟎, is equal to or greater than the repeatability coefficient (RC) given
in Table 2-2.
Table 2-2 Repeatability Coefficient (RC) 180
Measured SWS (m/s) Depth=4.5cm* Depth=7.0cm
0.9 < SWS <= 1.2 14% 22%
1.2 < SWS <= 2.2 11% 14%
2.2 < SWS <= 5.0 28% 33% *For measurements taken at depths other than the two listed, the SWS Committee has determined that linear interpolation of the Repeatability Coefficient (RC) is appropriate. Although large changes in RC are seen between the middle and high SWS ranges, those ranges have different clinical uses. The committee has insufficient phantom data to make a recommendation regarding interpolation of RC based on SWS. 185
Claim 3b (longitudinal claim): A 95% confidence interval for the true change over two time points (Y1 and Y2) is:
(𝒀𝟐 − 𝒀𝟏) ± 𝟏. 𝟗𝟔 × √(𝒀𝟏 × 𝒘𝑪𝑽/𝟏𝟎𝟎)𝟐 + (𝒀𝟐 × 𝒘𝑪𝑽/𝟏𝟎𝟎)𝟐, where wCV is based on Table 2-1. 190
Claims 3a and 3b hold when the same technologist and same ultrasound scanner are used at the two time points.
SWS Profile FINAL REVISION FOR CONSENSUS STATUS VOTE BSG Final Review-final edits all accepted 3-15-21 - clean copy.docx
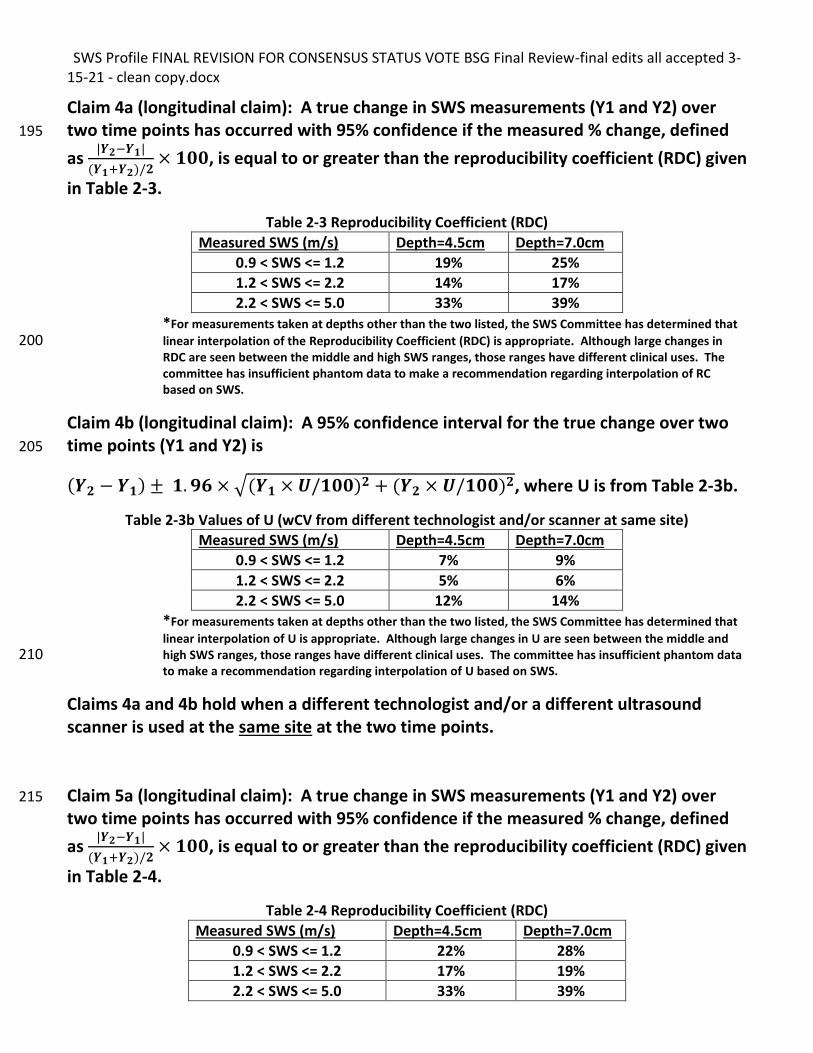
Claim 4a (longitudinal claim): A true change in SWS measurements (Y1 and Y2) over two time points has occurred with 95% confidence if the measured % change, defined 195
as |𝒀𝟐−𝒀𝟏|
(𝒀𝟏+𝒀𝟐)/𝟐× 𝟏𝟎𝟎, is equal to or greater than the reproducibility coefficient (RDC) given
in Table 2-3.
Table 2-3 Reproducibility Coefficient (RDC)
Measured SWS (m/s) Depth=4.5cm Depth=7.0cm
0.9 < SWS <= 1.2 19% 25%
1.2 < SWS <= 2.2 14% 17%
2.2 < SWS <= 5.0 33% 39%
*For measurements taken at depths other than the two listed, the SWS Committee has determined that
linear interpolation of the Reproducibility Coefficient (RDC) is appropriate. Although large changes in 200 RDC are seen between the middle and high SWS ranges, those ranges have different clinical uses. The committee has insufficient phantom data to make a recommendation regarding interpolation of RC based on SWS.
Claim 4b (longitudinal claim): A 95% confidence interval for the true change over two time points (Y1 and Y2) is 205
(𝒀𝟐 − 𝒀𝟏) ± 𝟏. 𝟗𝟔 × √(𝒀𝟏 × 𝑼/𝟏𝟎𝟎)𝟐 + (𝒀𝟐 × 𝑼/𝟏𝟎𝟎)𝟐, where U is from Table 2-3b.
Table 2-3b Values of U (wCV from different technologist and/or scanner at same site)
Measured SWS (m/s) Depth=4.5cm Depth=7.0cm
0.9 < SWS <= 1.2 7% 9%
1.2 < SWS <= 2.2 5% 6%
2.2 < SWS <= 5.0 12% 14%
*For measurements taken at depths other than the two listed, the SWS Committee has determined that
linear interpolation of U is appropriate. Although large changes in U are seen between the middle and high SWS ranges, those ranges have different clinical uses. The committee has insufficient phantom data 210 to make a recommendation regarding interpolation of U based on SWS.
Claims 4a and 4b hold when a different technologist and/or a different ultrasound scanner is used at the same site at the two time points.
Claim 5a (longitudinal claim): A true change in SWS measurements (Y1 and Y2) over 215
two time points has occurred with 95% confidence if the measured % change, defined
as |𝒀𝟐−𝒀𝟏|
(𝒀𝟏+𝒀𝟐)/𝟐× 𝟏𝟎𝟎, is equal to or greater than the reproducibility coefficient (RDC) given
in Table 2-4.
Table 2-4 Reproducibility Coefficient (RDC)
Measured SWS (m/s) Depth=4.5cm Depth=7.0cm
0.9 < SWS <= 1.2 22% 28%
1.2 < SWS <= 2.2 17% 19%
2.2 < SWS <= 5.0 33% 39%
SWS Profile FINAL REVISION FOR CONSENSUS STATUS VOTE BSG Final Review-final edits all accepted 3-15-21 - clean copy.docx
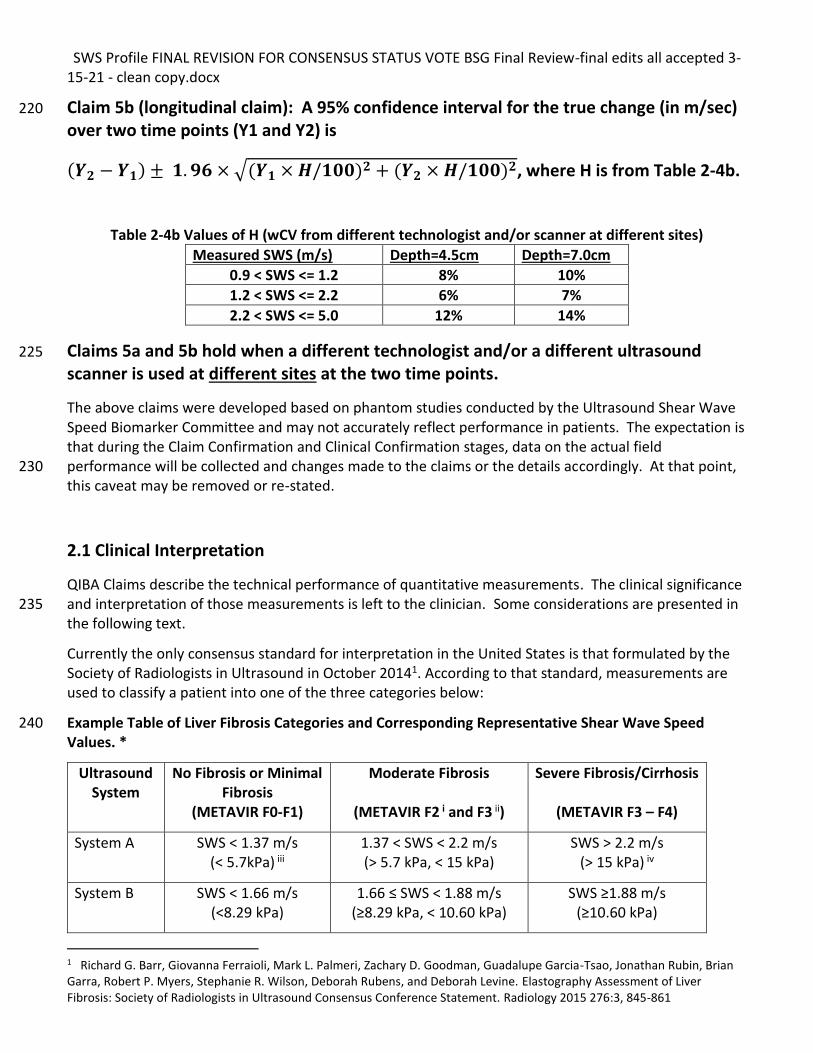
Claim 5b (longitudinal claim): A 95% confidence interval for the true change (in m/sec) 220
over two time points (Y1 and Y2) is
(𝒀𝟐 − 𝒀𝟏) ± 𝟏. 𝟗𝟔 × √(𝒀𝟏 × 𝑯/𝟏𝟎𝟎)𝟐 + (𝒀𝟐 × 𝑯/𝟏𝟎𝟎)𝟐, where H is from Table 2-4b.
Table 2-4b Values of H (wCV from different technologist and/or scanner at different sites)
Measured SWS (m/s) Depth=4.5cm Depth=7.0cm
0.9 < SWS <= 1.2 8% 10%
1.2 < SWS <= 2.2 6% 7%
2.2 < SWS <= 5.0 12% 14%
Claims 5a and 5b hold when a different technologist and/or a different ultrasound 225
scanner is used at different sites at the two time points.
The above claims were developed based on phantom studies conducted by the Ultrasound Shear Wave Speed Biomarker Committee and may not accurately reflect performance in patients. The expectation is that during the Claim Confirmation and Clinical Confirmation stages, data on the actual field performance will be collected and changes made to the claims or the details accordingly. At that point, 230 this caveat may be removed or re-stated.
2.1 Clinical Interpretation
QIBA Claims describe the technical performance of quantitative measurements. The clinical significance and interpretation of those measurements is left to the clinician. Some considerations are presented in 235 the following text.
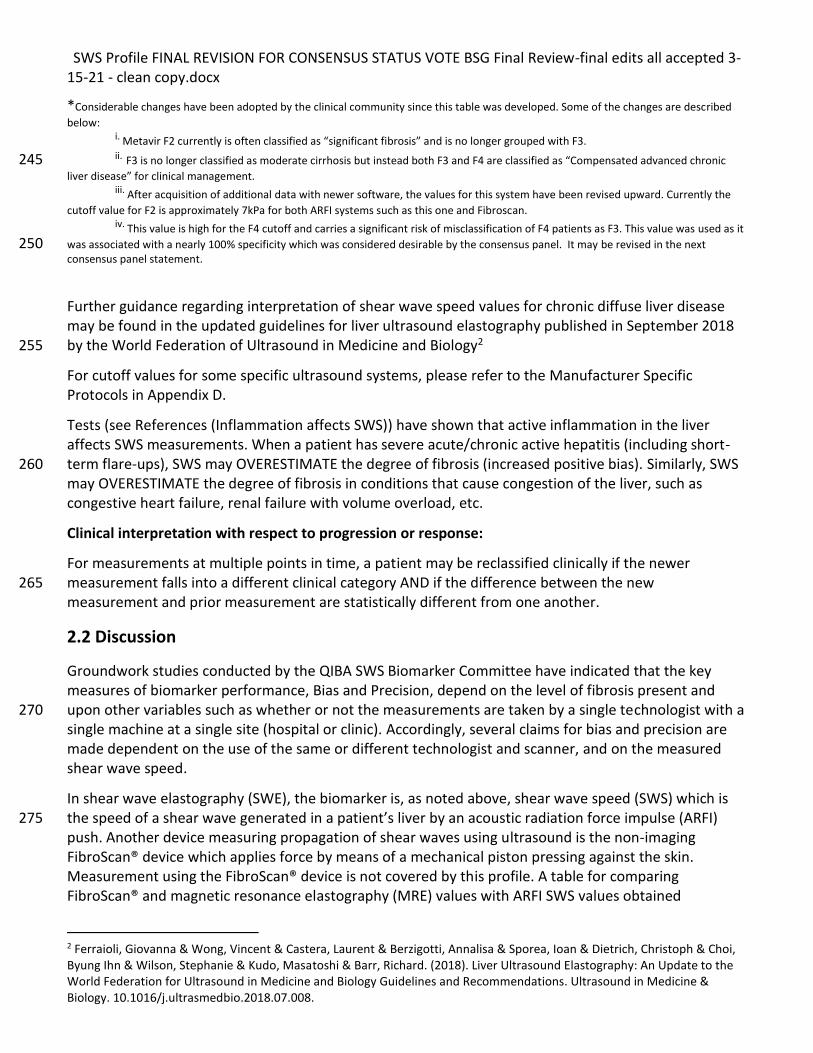
Currently the only consensus standard for interpretation in the United States is that formulated by the Society of Radiologists in Ultrasound in October 20141. According to that standard, measurements are used to classify a patient into one of the three categories below:
Example Table of Liver Fibrosis Categories and Corresponding Representative Shear Wave Speed 240 Values. *
Ultrasound System
No Fibrosis or Minimal Fibrosis
(METAVIR F0-F1)
Moderate Fibrosis
(METAVIR F2 i and F3 ii)
Severe Fibrosis/Cirrhosis
(METAVIR F3 – F4)
System A SWS < 1.37 m/s (< 5.7kPa) iii
1.37 < SWS < 2.2 m/s (> 5.7 kPa, < 15 kPa)
SWS > 2.2 m/s (> 15 kPa) iv
System B SWS < 1.66 m/s (<8.29 kPa)
1.66 ≤ SWS < 1.88 m/s (≥8.29 kPa, < 10.60 kPa)
SWS ≥1.88 m/s (≥10.60 kPa)
1 Richard G. Barr, Giovanna Ferraioli, Mark L. Palmeri, Zachary D. Goodman, Guadalupe Garcia-Tsao, Jonathan Rubin, Brian Garra, Robert P. Myers, Stephanie R. Wilson, Deborah Rubens, and Deborah Levine. Elastography Assessment of Liver Fibrosis: Society of Radiologists in Ultrasound Consensus Conference Statement. Radiology 2015 276:3, 845-861
SWS Profile FINAL REVISION FOR CONSENSUS STATUS VOTE BSG Final Review-final edits all accepted 3-15-21 - clean copy.docx
*Considerable changes have been adopted by the clinical community since this table was developed. Some of the changes are described
below:
i. Metavir F2 currently is often classified as “significant fibrosis” and is no longer grouped with F3. ii. F3 is no longer classified as moderate cirrhosis but instead both F3 and F4 are classified as “Compensated advanced chronic 245
liver disease” for clinical management. iii. After acquisition of additional data with newer software, the values for this system have been revised upward. Currently the
cutoff value for F2 is approximately 7kPa for both ARFI systems such as this one and Fibroscan. iv. This value is high for the F4 cutoff and carries a significant risk of misclassification of F4 patients as F3. This value was used as it
was associated with a nearly 100% specificity which was considered desirable by the consensus panel. It may be revised in the next 250 consensus panel statement.
Further guidance regarding interpretation of shear wave speed values for chronic diffuse liver disease may be found in the updated guidelines for liver ultrasound elastography published in September 2018 by the World Federation of Ultrasound in Medicine and Biology2 255
For cutoff values for some specific ultrasound systems, please refer to the Manufacturer Specific Protocols in Appendix D.
Tests (see References (Inflammation affects SWS)) have shown that active inflammation in the liver affects SWS measurements. When a patient has severe acute/chronic active hepatitis (including short-term flare-ups), SWS may OVERESTIMATE the degree of fibrosis (increased positive bias). Similarly, SWS 260 may OVERESTIMATE the degree of fibrosis in conditions that cause congestion of the liver, such as congestive heart failure, renal failure with volume overload, etc.
Clinical interpretation with respect to progression or response:
For measurements at multiple points in time, a patient may be reclassified clinically if the newer measurement falls into a different clinical category AND if the difference between the new 265 measurement and prior measurement are statistically different from one another.
2.2 Discussion
Groundwork studies conducted by the QIBA SWS Biomarker Committee have indicated that the key measures of biomarker performance, Bias and Precision, depend on the level of fibrosis present and upon other variables such as whether or not the measurements are taken by a single technologist with a 270 single machine at a single site (hospital or clinic). Accordingly, several claims for bias and precision are made dependent on the use of the same or different technologist and scanner, and on the measured shear wave speed.
In shear wave elastography (SWE), the biomarker is, as noted above, shear wave speed (SWS) which is the speed of a shear wave generated in a patient’s liver by an acoustic radiation force impulse (ARFI) 275 push. Another device measuring propagation of shear waves using ultrasound is the non-imaging FibroScan® device which applies force by means of a mechanical piston pressing against the skin. Measurement using the FibroScan® device is not covered by this profile. A table for comparing FibroScan® and magnetic resonance elastography (MRE) values with ARFI SWS values obtained
2 Ferraioli, Giovanna & Wong, Vincent & Castera, Laurent & Berzigotti, Annalisa & Sporea, Ioan & Dietrich, Christoph & Choi, Byung Ihn & Wilson, Stephanie & Kudo, Masatoshi & Barr, Richard. (2018). Liver Ultrasound Elastography: An Update to the World Federation for Ultrasound in Medicine and Biology Guidelines and Recommendations. Ultrasound in Medicine & Biology. 10.1016/j.ultrasmedbio.2018.07.008.
SWS Profile FINAL REVISION FOR CONSENSUS STATUS VOTE BSG Final Review-final edits all accepted 3-15-21 - clean copy.docx
according to this profile will be listed at the end of this section when validated comparisons become 280 available. The SWS biomarker is used for measurement at a single point in time intended to classify liver tissue according to fibrosis grade and also for monitoring shear wave speed (and corresponding fibrosis) changes over time.
Claim 1 describes the expected variability in terms of the coefficient of variation (%wCV) of measurements made at approximately the same time in the same patient and acquisition depth for 285 several depths and for several ranges of SWS. These two variables (depth and SWS range) have been determined by the committee to have significant effects on technical performance but which can be controlled for by acquisition technique and data analysis. The claim is based on results from a phantom study, where 10 repeat measurements were performed at each focus, within a phantom at each site.
Claim 2 is a cross-sectional claim describing the 95% confidence interval of the true SWS measurement 290 for several depths and for several ranges of SWS. These two variables (depth and SWS range) have been determined by the committee to have significant effects on technical performance but which can be controlled for by acquisition technique and data analysis. The claim is based on two results from the phantom study: first, that the within-subject CV is as described in Claim 1; second, that the bias is negligible for most systems. 295
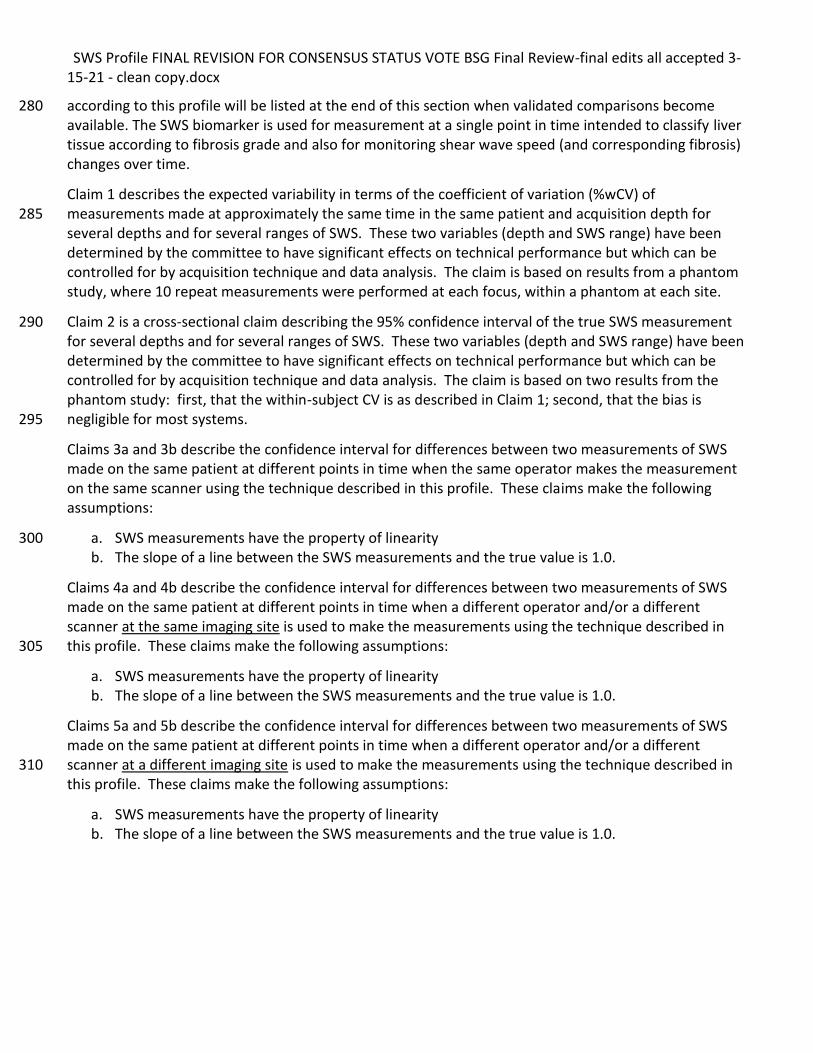
Claims 3a and 3b describe the confidence interval for differences between two measurements of SWS made on the same patient at different points in time when the same operator makes the measurement on the same scanner using the technique described in this profile. These claims make the following assumptions:
a. SWS measurements have the property of linearity 300 b. The slope of a line between the SWS measurements and the true value is 1.0.
Claims 4a and 4b describe the confidence interval for differences between two measurements of SWS made on the same patient at different points in time when a different operator and/or a different scanner at the same imaging site is used to make the measurements using the technique described in this profile. These claims make the following assumptions: 305
a. SWS measurements have the property of linearity b. The slope of a line between the SWS measurements and the true value is 1.0.
Claims 5a and 5b describe the confidence interval for differences between two measurements of SWS made on the same patient at different points in time when a different operator and/or a different scanner at a different imaging site is used to make the measurements using the technique described in 310 this profile. These claims make the following assumptions:
a. SWS measurements have the property of linearity b. The slope of a line between the SWS measurements and the true value is 1.0.
SWS Profile FINAL REVISION FOR CONSENSUS STATUS VOTE BSG Final Review-final edits all accepted 3-15-21 - clean copy.docx
3. Profile Activities 315
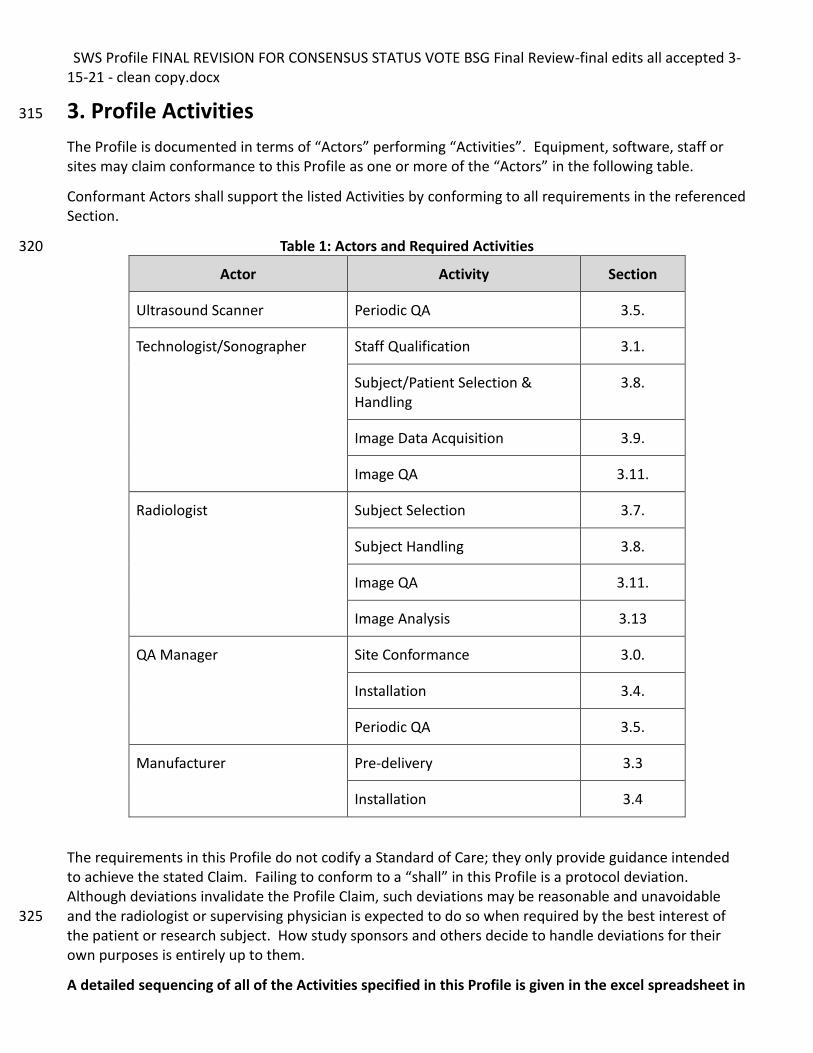
The Profile is documented in terms of “Actors” performing “Activities”. Equipment, software, staff or sites may claim conformance to this Profile as one or more of the “Actors” in the following table.
Conformant Actors shall support the listed Activities by conforming to all requirements in the referenced Section.
Table 1: Actors and Required Activities 320
Actor Activity Section
Ultrasound Scanner Periodic QA 3.5.
Technologist/Sonographer Staff Qualification 3.1.
Subject/Patient Selection & Handling
3.8.
Image Data Acquisition 3.9.
Image QA 3.11.
Radiologist Subject Selection 3.7.
Subject Handling 3.8.
Image QA 3.11.
Image Analysis 3.13
QA Manager Site Conformance 3.0.
Installation 3.4.
Periodic QA 3.5.
Manufacturer Pre-delivery 3.3
Installation 3.4
The requirements in this Profile do not codify a Standard of Care; they only provide guidance intended to achieve the stated Claim. Failing to conform to a “shall” in this Profile is a protocol deviation. Although deviations invalidate the Profile Claim, such deviations may be reasonable and unavoidable and the radiologist or supervising physician is expected to do so when required by the best interest of 325 the patient or research subject. How study sponsors and others decide to handle deviations for their own purposes is entirely up to them.
A detailed sequencing of all of the Activities specified in this Profile is given in the excel spreadsheet in
SWS Profile FINAL REVISION FOR CONSENSUS STATUS VOTE BSG Final Review-final edits all accepted 3-15-21 - clean copy.docx
Appendix E in a format that can be reproduced for use on site during the generation of the biomarker.
330
3.0. Site Conformance Check
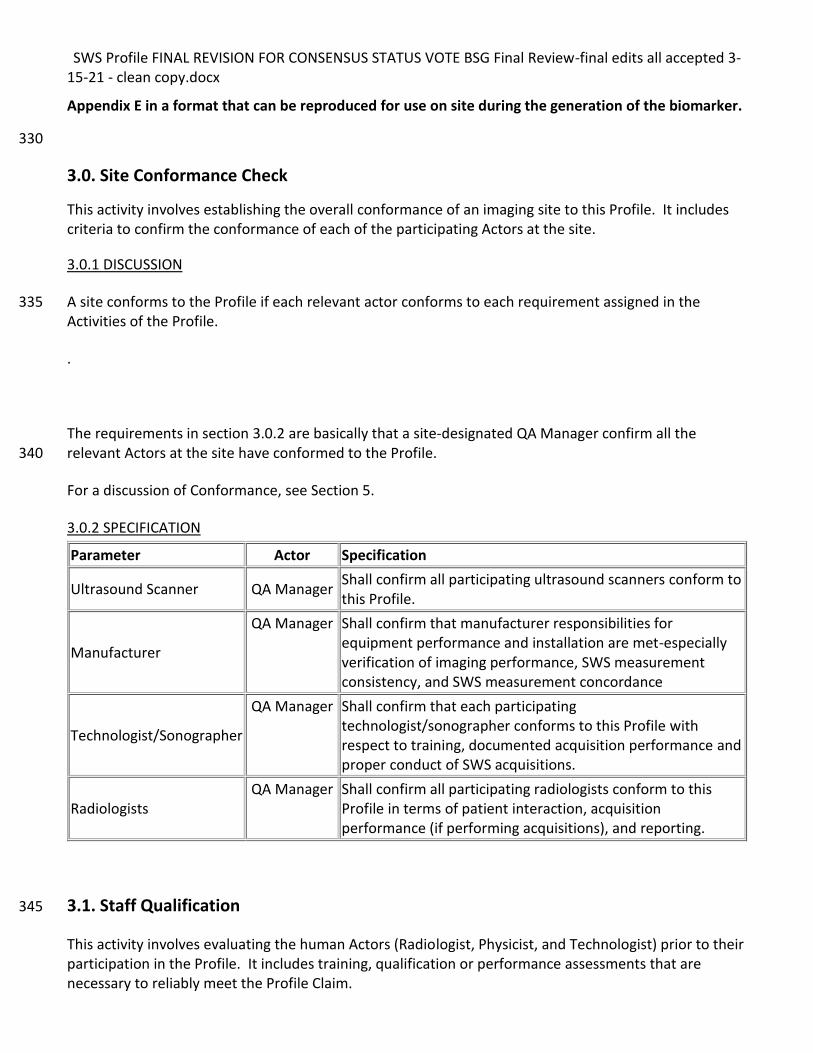
This activity involves establishing the overall conformance of an imaging site to this Profile. It includes criteria to confirm the conformance of each of the participating Actors at the site.
3.0.1 DISCUSSION
A site conforms to the Profile if each relevant actor conforms to each requirement assigned in the 335 Activities of the Profile.
.
The requirements in section 3.0.2 are basically that a site-designated QA Manager confirm all the relevant Actors at the site have conformed to the Profile. 340
For a discussion of Conformance, see Section 5.
3.0.2 SPECIFICATION
Parameter Actor Specification
Ultrasound Scanner QA Manager Shall confirm all participating ultrasound scanners conform to this Profile.
Manufacturer
QA Manager Shall confirm that manufacturer responsibilities for equipment performance and installation are met-especially verification of imaging performance, SWS measurement consistency, and SWS measurement concordance
Technologist/Sonographer
QA Manager Shall confirm that each participating technologist/sonographer conforms to this Profile with respect to training, documented acquisition performance and proper conduct of SWS acquisitions.
Radiologists QA Manager Shall confirm all participating radiologists conform to this
Profile in terms of patient interaction, acquisition performance (if performing acquisitions), and reporting.
3.1. Staff Qualification 345
This activity involves evaluating the human Actors (Radiologist, Physicist, and Technologist) prior to their participation in the Profile. It includes training, qualification or performance assessments that are necessary to reliably meet the Profile Claim.
SWS Profile FINAL REVISION FOR CONSENSUS STATUS VOTE BSG Final Review-final edits all accepted 3-15-21 - clean copy.docx
3.1.1 DISCUSSION
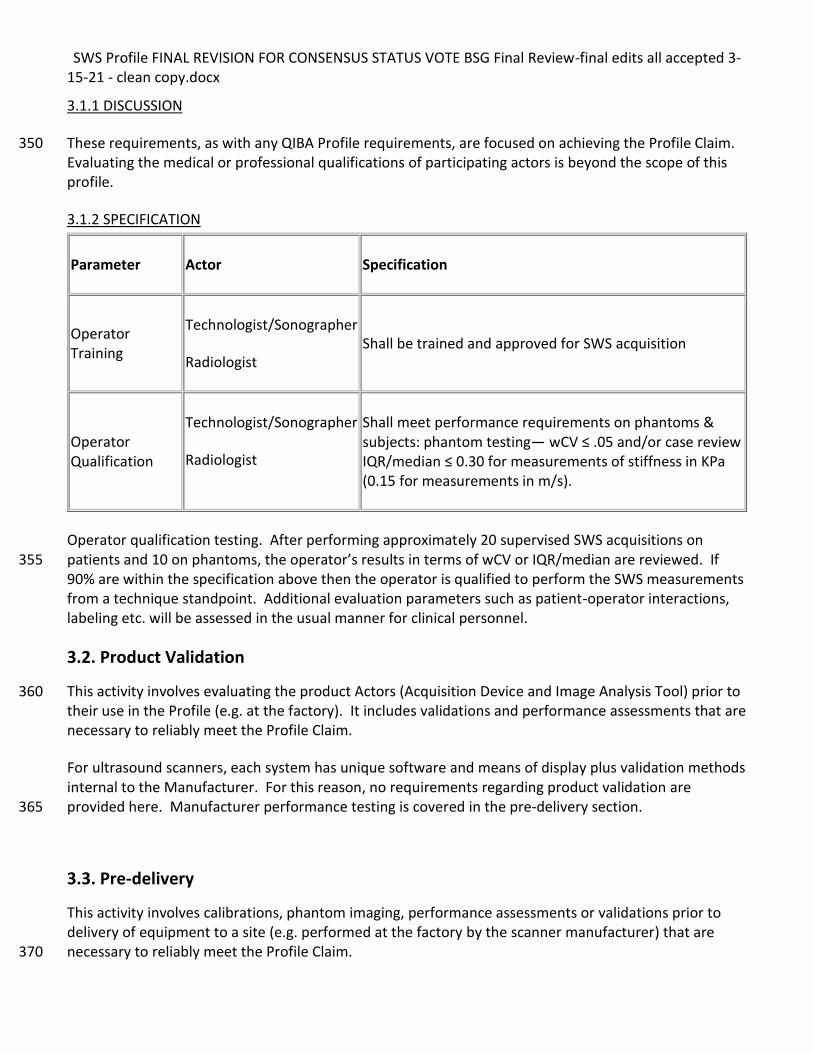
These requirements, as with any QIBA Profile requirements, are focused on achieving the Profile Claim. 350 Evaluating the medical or professional qualifications of participating actors is beyond the scope of this profile.
3.1.2 SPECIFICATION
Parameter Actor Specification
Operator Training
Technologist/Sonographer
Radiologist Shall be trained and approved for SWS acquisition
Operator Qualification
Technologist/Sonographer
Radiologist
Shall meet performance requirements on phantoms & subjects: phantom testing— wCV ≤ .05 and/or case review IQR/median ≤ 0.30 for measurements of stiffness in KPa (0.15 for measurements in m/s).
Operator qualification testing. After performing approximately 20 supervised SWS acquisitions on patients and 10 on phantoms, the operator’s results in terms of wCV or IQR/median are reviewed. If 355 90% are within the specification above then the operator is qualified to perform the SWS measurements from a technique standpoint. Additional evaluation parameters such as patient-operator interactions, labeling etc. will be assessed in the usual manner for clinical personnel.
3.2. Product Validation
This activity involves evaluating the product Actors (Acquisition Device and Image Analysis Tool) prior to 360 their use in the Profile (e.g. at the factory). It includes validations and performance assessments that are necessary to reliably meet the Profile Claim.
For ultrasound scanners, each system has unique software and means of display plus validation methods internal to the Manufacturer. For this reason, no requirements regarding product validation are provided here. Manufacturer performance testing is covered in the pre-delivery section. 365
3.3. Pre-delivery
This activity involves calibrations, phantom imaging, performance assessments or validations prior to delivery of equipment to a site (e.g. performed at the factory by the scanner manufacturer) that are necessary to reliably meet the Profile Claim. 370
SWS Profile FINAL REVISION FOR CONSENSUS STATUS VOTE BSG Final Review-final edits all accepted 3-15-21 - clean copy.docx
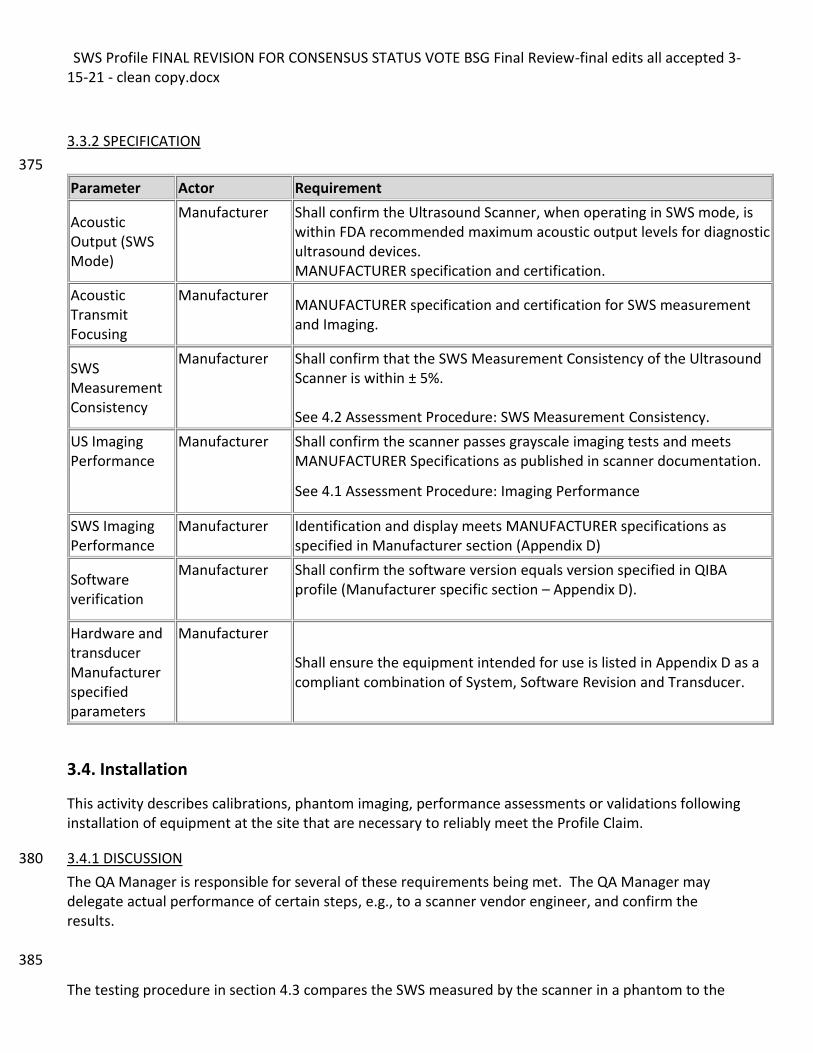
3.3.2 SPECIFICATION
375
Parameter Actor Requirement
Acoustic Output (SWS Mode)
Manufacturer
Shall confirm the Ultrasound Scanner, when operating in SWS mode, is within FDA recommended maximum acoustic output levels for diagnostic ultrasound devices. MANUFACTURER specification and certification.
Acoustic Transmit Focusing
Manufacturer MANUFACTURER specification and certification for SWS measurement and Imaging.
SWS Measurement Consistency
Manufacturer Shall confirm that the SWS Measurement Consistency of the Ultrasound Scanner is within ± 5%. See 4.2 Assessment Procedure: SWS Measurement Consistency.
US Imaging Performance
Manufacturer Shall confirm the scanner passes grayscale imaging tests and meets MANUFACTURER Specifications as published in scanner documentation.
See 4.1 Assessment Procedure: Imaging Performance
SWS Imaging Performance
Manufacturer
Identification and display meets MANUFACTURER specifications as specified in Manufacturer section (Appendix D)
Software verification
Manufacturer Shall confirm the software version equals version specified in QIBA profile (Manufacturer specific section – Appendix D).
Hardware and transducer Manufacturer specified parameters
Manufacturer
Shall ensure the equipment intended for use is listed in Appendix D as a compliant combination of System, Software Revision and Transducer.
3.4. Installation
This activity describes calibrations, phantom imaging, performance assessments or validations following installation of equipment at the site that are necessary to reliably meet the Profile Claim.
3.4.1 DISCUSSION 380
The QA Manager is responsible for several of these requirements being met. The QA Manager may delegate actual performance of certain steps, e.g., to a scanner vendor engineer, and confirm the results. 385
The testing procedure in section 4.3 compares the SWS measured by the scanner in a phantom to the
SWS Profile FINAL REVISION FOR CONSENSUS STATUS VOTE BSG Final Review-final edits all accepted 3-15-21 - clean copy.docx
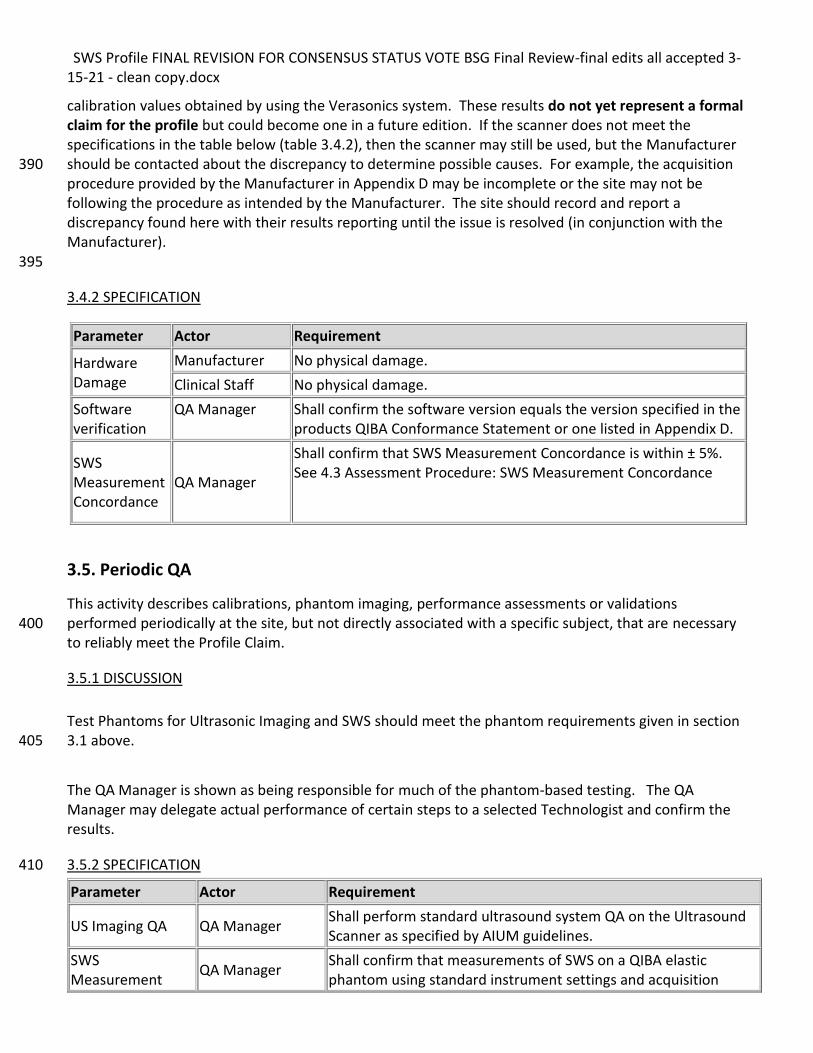
calibration values obtained by using the Verasonics system. These results do not yet represent a formal claim for the profile but could become one in a future edition. If the scanner does not meet the specifications in the table below (table 3.4.2), then the scanner may still be used, but the Manufacturer should be contacted about the discrepancy to determine possible causes. For example, the acquisition 390 procedure provided by the Manufacturer in Appendix D may be incomplete or the site may not be following the procedure as intended by the Manufacturer. The site should record and report a discrepancy found here with their results reporting until the issue is resolved (in conjunction with the Manufacturer). 395
3.4.2 SPECIFICATION
3.5. Periodic QA
This activity describes calibrations, phantom imaging, performance assessments or validations performed periodically at the site, but not directly associated with a specific subject, that are necessary 400 to reliably meet the Profile Claim.
3.5.1 DISCUSSION
Test Phantoms for Ultrasonic Imaging and SWS should meet the phantom requirements given in section 3.1 above. 405
The QA Manager is shown as being responsible for much of the phantom-based testing. The QA Manager may delegate actual performance of certain steps to a selected Technologist and confirm the results.
3.5.2 SPECIFICATION 410
Parameter Actor Requirement
US Imaging QA QA Manager Shall perform standard ultrasound system QA on the Ultrasound Scanner as specified by AIUM guidelines.
SWS Measurement
QA Manager Shall confirm that measurements of SWS on a QIBA elastic phantom using standard instrument settings and acquisition
Parameter Actor Requirement
Hardware Damage
Manufacturer No physical damage.
Clinical Staff No physical damage.
Software verification
QA Manager Shall confirm the software version equals the version specified in the products QIBA Conformance Statement or one listed in Appendix D.
SWS Measurement Concordance
QA Manager
Shall confirm that SWS Measurement Concordance is within ± 5%. See 4.3 Assessment Procedure: SWS Measurement Concordance
SWS Profile FINAL REVISION FOR CONSENSUS STATUS VOTE BSG Final Review-final edits all accepted 3-15-21 - clean copy.docx
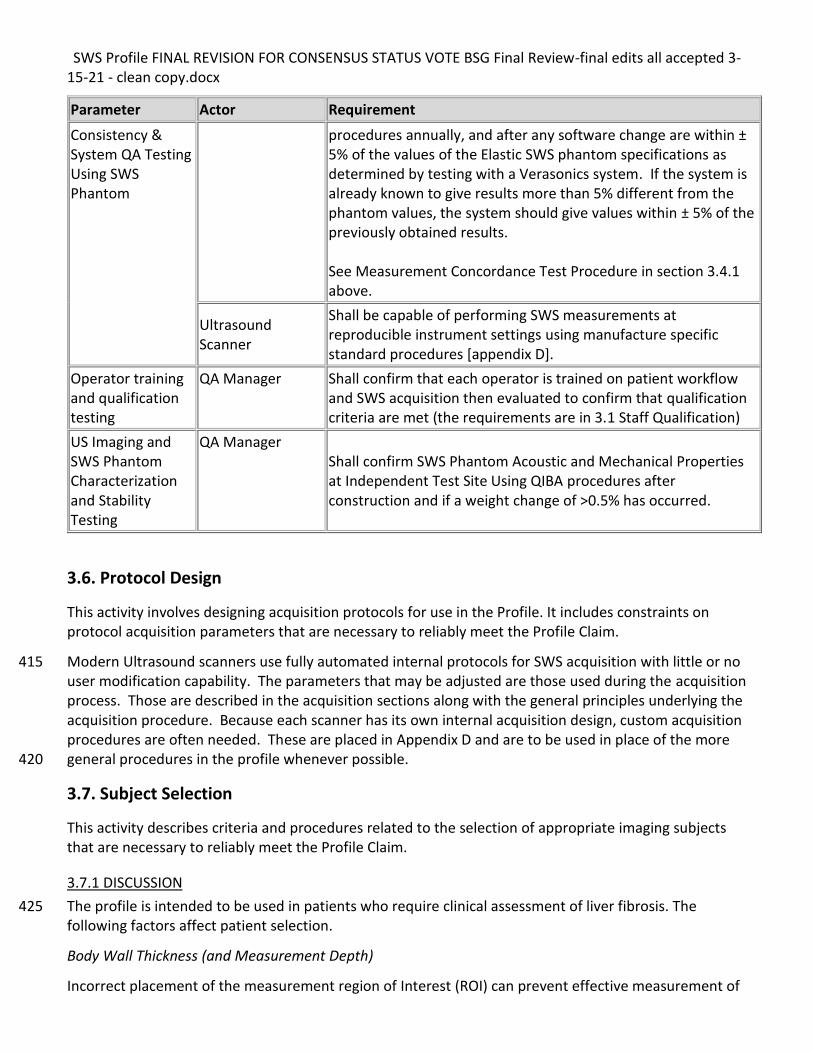
Parameter Actor Requirement
Consistency & System QA Testing Using SWS Phantom
procedures annually, and after any software change are within ± 5% of the values of the Elastic SWS phantom specifications as determined by testing with a Verasonics system. If the system is already known to give results more than 5% different from the phantom values, the system should give values within ± 5% of the previously obtained results.
See Measurement Concordance Test Procedure in section 3.4.1 above.
Ultrasound Scanner
Shall be capable of performing SWS measurements at reproducible instrument settings using manufacture specific standard procedures [appendix D].
Operator training and qualification testing
QA Manager Shall confirm that each operator is trained on patient workflow and SWS acquisition then evaluated to confirm that qualification criteria are met (the requirements are in 3.1 Staff Qualification)
US Imaging and SWS Phantom Characterization and Stability Testing
QA Manager Shall confirm SWS Phantom Acoustic and Mechanical Properties at Independent Test Site Using QIBA procedures after construction and if a weight change of >0.5% has occurred.
3.6. Protocol Design
This activity involves designing acquisition protocols for use in the Profile. It includes constraints on protocol acquisition parameters that are necessary to reliably meet the Profile Claim.
Modern Ultrasound scanners use fully automated internal protocols for SWS acquisition with little or no 415 user modification capability. The parameters that may be adjusted are those used during the acquisition process. Those are described in the acquisition sections along with the general principles underlying the acquisition procedure. Because each scanner has its own internal acquisition design, custom acquisition procedures are often needed. These are placed in Appendix D and are to be used in place of the more general procedures in the profile whenever possible. 420
3.7. Subject Selection
This activity describes criteria and procedures related to the selection of appropriate imaging subjects that are necessary to reliably meet the Profile Claim.
3.7.1 DISCUSSION
The profile is intended to be used in patients who require clinical assessment of liver fibrosis. The 425 following factors affect patient selection.
Body Wall Thickness (and Measurement Depth)
Incorrect placement of the measurement region of Interest (ROI) can prevent effective measurement of
SWS Profile FINAL REVISION FOR CONSENSUS STATUS VOTE BSG Final Review-final edits all accepted 3-15-21 - clean copy.docx
SWS. Placement of the ROI too close to the liver capsule may result in artificially elevated SWS values as the liver is naturally somewhat stiffer near the capsule. Placement of the ROI too deep will result in 430 noisy estimates due to attenuation of the acoustic radiation force push pulse and resulting weak, hard to measure shear waves. This can cause increased measurement error and increased numbers of technical failures. Therefore, the region being measured should be a minimum of 2cm deep to the liver capsule and a maximum of 6.5 cm deep to the skin. This means placing the center of the ROI between 2cm and 6.5cm in depth. 435
Because of measurement depth requirements, such as those discussed in 3.9.1, if the body wall thickness is greater than 4cm correct depth placement of the acquisition region of interest will not be possible and the measurement may not meet the claims of the profile.
Intercostal Space (and COPD)
A narrow intercostal space and/or COPD may make SWS data acquisition more difficult. 440
If an intercostal approach is not feasible, consider a subcostal approach. However, a note to document this should be made in the patient/subject note or study report. The claims in this profile have not been validated for a subcostal approach but maybe validated in a later version of the profile. Consider MRE as an alternative.
Prior Surgery 445
Prior liver surgery can interfere with SWS data acquisition. If subjects have had a surgical resection of all or portions of right lobe of the liver that prevents an intercostal measurement in the right liver lobe, then the patient should be considered for exclusion. Consider MRE as an alternative. The claims in this profile have not been validated for measurements other than the right lobe of the liver, but may be validated in later versions of the profile. 450
Informed Consent
Obtain informed consent as needed per institutional policy. HIPAA authorization shall be obtained for research or other purposes as outlined in institutional policies.
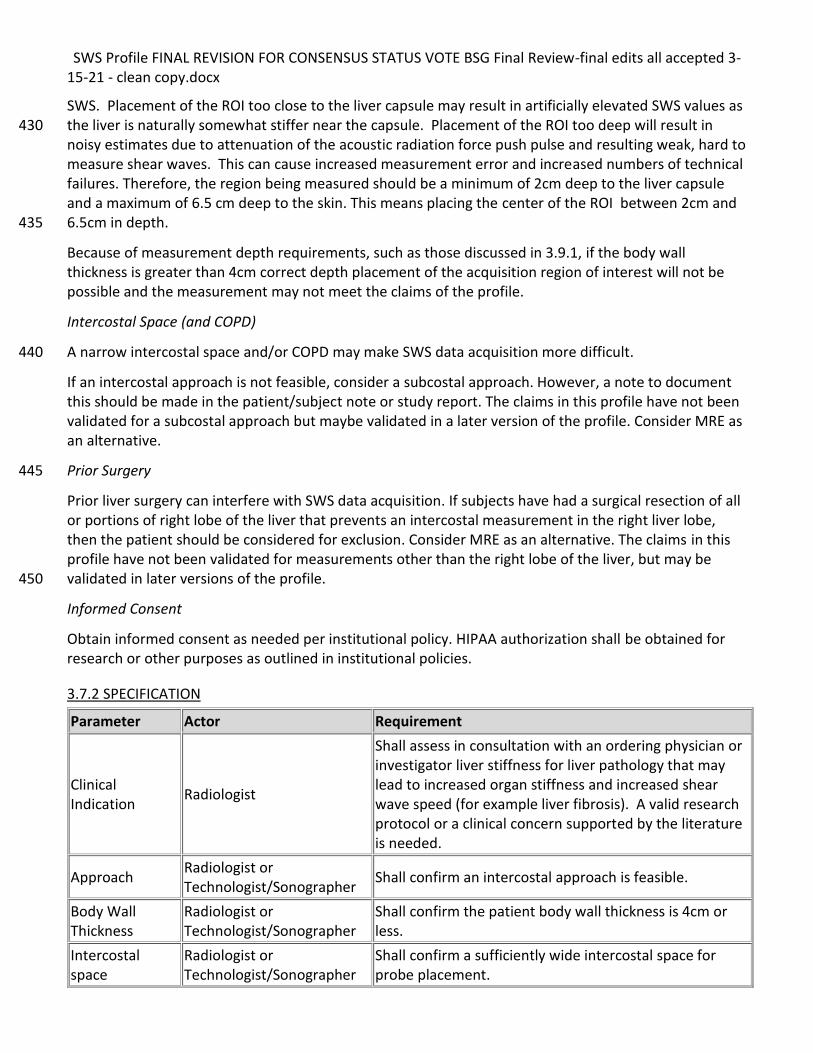
3.7.2 SPECIFICATION
Parameter Actor Requirement
Clinical Indication
Radiologist
Shall assess in consultation with an ordering physician or investigator liver stiffness for liver pathology that may lead to increased organ stiffness and increased shear wave speed (for example liver fibrosis). A valid research protocol or a clinical concern supported by the literature is needed.
Approach Radiologist or Technologist/Sonographer
Shall confirm an intercostal approach is feasible.
Body Wall Thickness
Radiologist or Technologist/Sonographer
Shall confirm the patient body wall thickness is 4cm or less.
Intercostal space
Radiologist or Technologist/Sonographer
Shall confirm a sufficiently wide intercostal space for probe placement.
SWS Profile FINAL REVISION FOR CONSENSUS STATUS VOTE BSG Final Review-final edits all accepted 3-15-21 - clean copy.docx
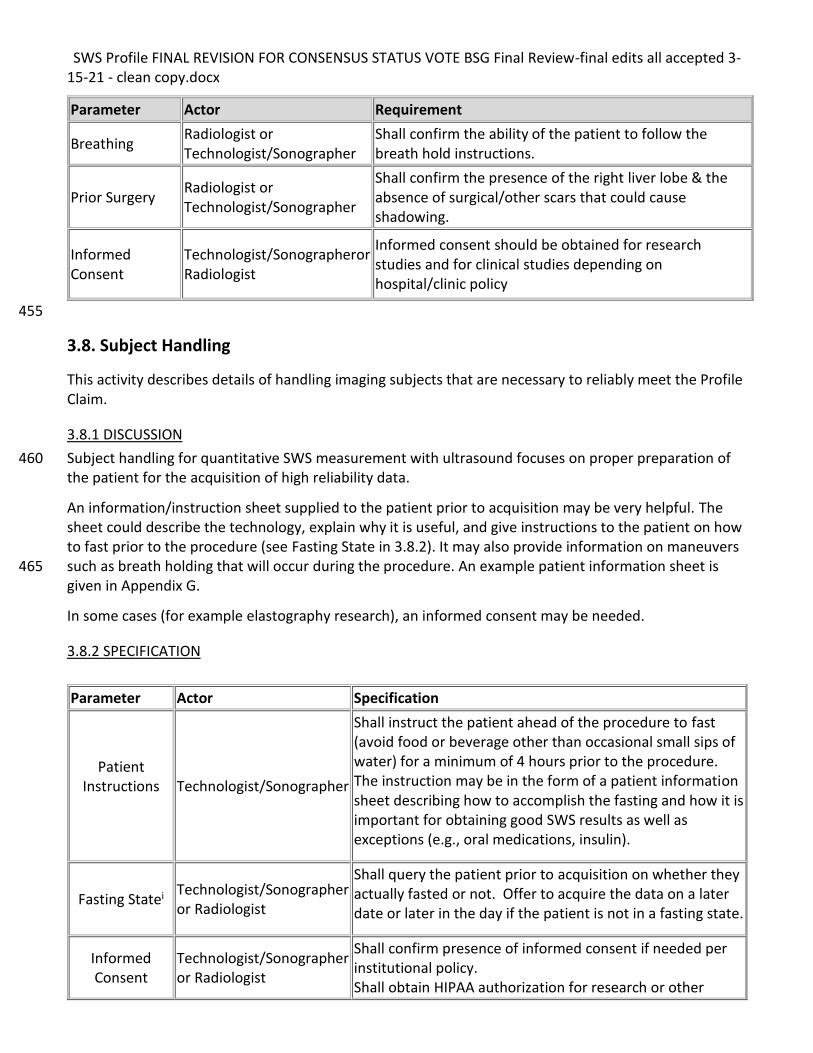
Parameter Actor Requirement
Breathing Radiologist or Technologist/Sonographer
Shall confirm the ability of the patient to follow the breath hold instructions.
Prior Surgery Radiologist or Technologist/Sonographer
Shall confirm the presence of the right liver lobe & the absence of surgical/other scars that could cause shadowing.
Informed Consent
Technologist/Sonographeror Radiologist
Informed consent should be obtained for research studies and for clinical studies depending on hospital/clinic policy
455
3.8. Subject Handling
This activity describes details of handling imaging subjects that are necessary to reliably meet the Profile Claim.
3.8.1 DISCUSSION
Subject handling for quantitative SWS measurement with ultrasound focuses on proper preparation of 460 the patient for the acquisition of high reliability data.
An information/instruction sheet supplied to the patient prior to acquisition may be very helpful. The sheet could describe the technology, explain why it is useful, and give instructions to the patient on how to fast prior to the procedure (see Fasting State in 3.8.2). It may also provide information on maneuvers such as breath holding that will occur during the procedure. An example patient information sheet is 465 given in Appendix G.
In some cases (for example elastography research), an informed consent may be needed.
3.8.2 SPECIFICATION
Parameter Actor Specification
Patient Instructions
Technologist/Sonographer
Shall instruct the patient ahead of the procedure to fast (avoid food or beverage other than occasional small sips of water) for a minimum of 4 hours prior to the procedure. The instruction may be in the form of a patient information sheet describing how to accomplish the fasting and how it is important for obtaining good SWS results as well as exceptions (e.g., oral medications, insulin).
Fasting Statei Technologist/Sonographer or Radiologist
Shall query the patient prior to acquisition on whether they actually fasted or not. Offer to acquire the data on a later date or later in the day if the patient is not in a fasting state.
Informed Consent
Technologist/Sonographer or Radiologist
Shall confirm presence of informed consent if needed per institutional policy. Shall obtain HIPAA authorization for research or other
SWS Profile FINAL REVISION FOR CONSENSUS STATUS VOTE BSG Final Review-final edits all accepted 3-15-21 - clean copy.docx
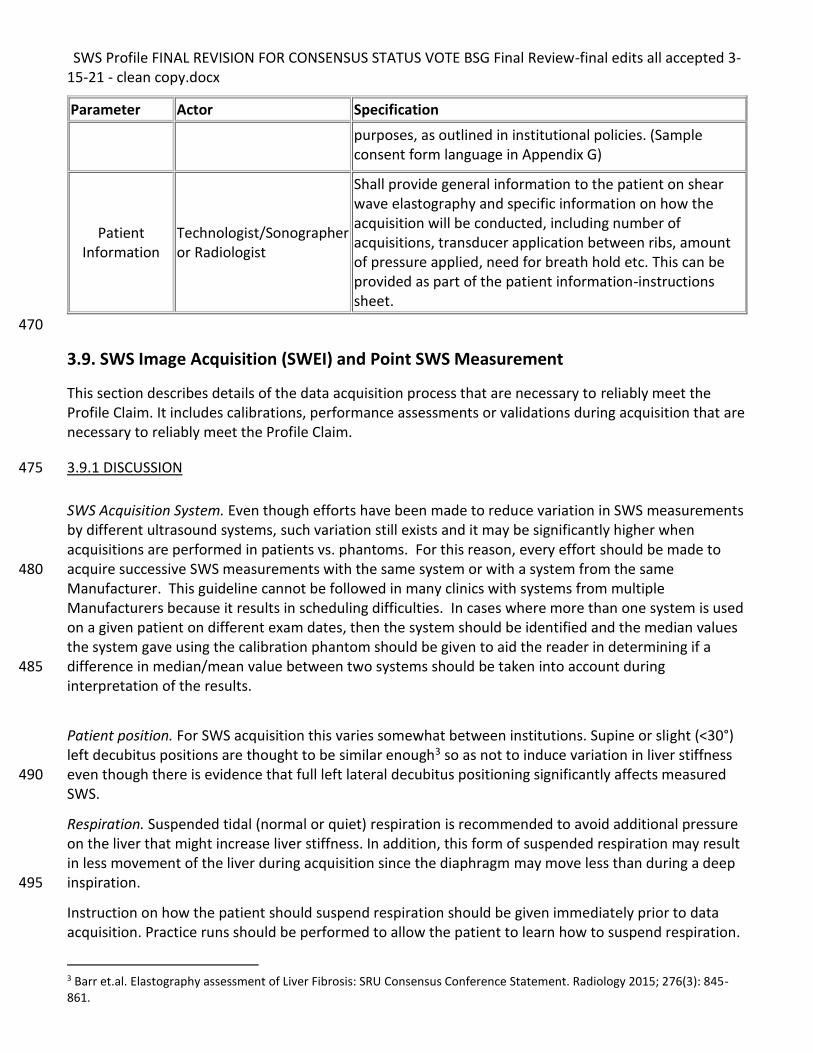
Parameter Actor Specification
purposes, as outlined in institutional policies. (Sample consent form language in Appendix G)
Patient Information
Technologist/Sonographer or Radiologist
Shall provide general information to the patient on shear wave elastography and specific information on how the acquisition will be conducted, including number of acquisitions, transducer application between ribs, amount of pressure applied, need for breath hold etc. This can be provided as part of the patient information-instructions sheet.
470
3.9. SWS Image Acquisition (SWEI) and Point SWS Measurement
This section describes details of the data acquisition process that are necessary to reliably meet the Profile Claim. It includes calibrations, performance assessments or validations during acquisition that are necessary to reliably meet the Profile Claim.
3.9.1 DISCUSSION 475
SWS Acquisition System. Even though efforts have been made to reduce variation in SWS measurements by different ultrasound systems, such variation still exists and it may be significantly higher when acquisitions are performed in patients vs. phantoms. For this reason, every effort should be made to acquire successive SWS measurements with the same system or with a system from the same 480 Manufacturer. This guideline cannot be followed in many clinics with systems from multiple Manufacturers because it results in scheduling difficulties. In cases where more than one system is used on a given patient on different exam dates, then the system should be identified and the median values the system gave using the calibration phantom should be given to aid the reader in determining if a difference in median/mean value between two systems should be taken into account during 485 interpretation of the results.
Patient position. For SWS acquisition this varies somewhat between institutions. Supine or slight (<30°) left decubitus positions are thought to be similar enough3 so as not to induce variation in liver stiffness even though there is evidence that full left lateral decubitus positioning significantly affects measured 490 SWS.
Respiration. Suspended tidal (normal or quiet) respiration is recommended to avoid additional pressure on the liver that might increase liver stiffness. In addition, this form of suspended respiration may result in less movement of the liver during acquisition since the diaphragm may move less than during a deep inspiration. 495
Instruction on how the patient should suspend respiration should be given immediately prior to data acquisition. Practice runs should be performed to allow the patient to learn how to suspend respiration.
3 Barr et.al. Elastography assessment of Liver Fibrosis: SRU Consensus Conference Statement. Radiology 2015; 276(3): 845-861.
SWS Profile FINAL REVISION FOR CONSENSUS STATUS VOTE BSG Final Review-final edits all accepted 3-15-21 - clean copy.docx
This will provide the patient or subject with useful information on what the ultrasound probe feels like and how long they will be asked to hold their breath.
Transducer Position. Intercostal transducer positioning has been shown to reduce variability in 500 measurements. However, there are situations where intercostal acquisition is not feasible. For example, smaller patients may not have wide enough intercostal spaces to allow intercostal positioning of the transducer without partial blockage of transducer elements resulting either in obvious shadowing or loss of transmit power on the shear wave push pulse. Either will likely result in poor quality shear wave speed estimates. Another problem arises when the subject has COPD and the hyper-expanded lung 505 pushes the liver below the costal margin. Consider subcostal only if intercostal is not feasible. The claims in this profile have not been validated for a subcostal approach. Where necessary, consider excluding the subject, and using MRE and/or liver biopsy for evaluation.
To avoid additional power loss of acoustic push for SWE acquisitions, keep the liver capsule parallel to the transducer face in both planes (transverse and elevational planes). For the same reason, the 510 acquisition ROI placement should be in the center of the image.
Please refer to Manufacturers’ instructions on acquisition techniques, procedures and machine specific pitfalls for additional information. Appendix D contains this material for a number of Manufacturers.
Liver Movement. Absence of motion during SWS acquisition is critical to obtain accurate and precise SWS measurements. Even though challenging in some patients, it is critical to ensure that no appreciable 515 motion occurs during acquisition. Otherwise, the acquisition should not be included in the analysis. Having the patient practice breath holds (suspended tidal respiration) may be helpful but avoid practicing so much that patient becomes fatigued.
Transducer Pressure. Too much transducer pressure can increase the stiffness of underlying tissue. Only light transducer pressure should be applied during shear wave imaging and point quantification. Slightly 520 increased pressure may be applied if it is needed to compress the abdominal wall sufficiently to enable SWS acquisition at an appropriate depth in the liver.
Point Shear Wave Speed Measurement
The above considerations in image acquisition also apply to the measurement of shear wave speed from a single location with or without SWS imaging, often referred to as point SWS measurement. The 525 following are some additional specifics to point SWS measurement.
Measurement Region of Interest (ROI) Placement. ROI placement with respect to depth and lateral positioning is critical. Positioning the ROI center at a depth greater than 2cm deep to the liver capsule will avoid the slightly stiffer subcapsular liver tissue. A depth <6.5 cm will help to ensure that the shear wave amplitude is sufficient for reliable estimates of shear wave speed. Positioning away from discrete 530 structures (e.g., vessels) is important as the algorithms used to estimate SWS assume homogeneous isotropic tissue, not heterogeneous tissue containing specific structures or lesions. An image should be acquired to document the ROI location relative to vessels so as to allow future acquisition at the same location for additional measurements, either at the same time or on follow-up examinations.
Positioning the ROI away from the centerline of the image may introduce variation in SWS estimates as 535 may changing the ROI size. The effects of changing ROI size have not yet been systematically examined.
Please refer to Manufacturer specific instructions and specifications for guidance on additional steps to take during point shear wave speed acquisition (see Appendix D).
SWS Profile FINAL REVISION FOR CONSENSUS STATUS VOTE BSG Final Review-final edits all accepted 3-15-21 - clean copy.docx
Positioning the ROI at a constant depth as close as practicable from measurement to measurement and from one patient visit to another is important because SWS estimates are known to decline as a function 540 of depth with many current SWS software implementations. Measuring at a constant depth will help to minimize variations.
Shear Wave Speed Imaging
This section deals with imaging settings that may be operator controlled which may affect diagnosis and ROI placement for point measurements 545
SWS Imaging Color Map. If control of the color map used for imaging is possible, the operator (technologist or radiologist) should ensure that a map is used that is consistent from patient to patient and exam to exam. An agreed upon standard (i.e., blue is stiff or soft) has not yet been devised but the operator is encouraged to use the standard once it is agreed upon.
SWS Imaging Color Transparency. When color is overlaid upon the grayscale b-mode image, the amount 550 of b-mode image that shows through the color image should be adjusted so that grayscale landmarks may be seen but changes in color are still clearly identifiable. Follow the Manufacturer’s recommendation as a starting point (see appendix D).
SWS Imaging Frame Averaging. The color display may be averaged over several frames to reduce flicker and rapidly changing colors. This should be set to manufacturer’s specifications unless the 555 Manufacturer provides guidance for the use of other settings.
SWS Imaging Frame Rate and Color Box Size. If the size of the box within which color is displayed is controllable the operator should select the largest box that provides an acceptable frame rate. Until a standard emerges the Manufacturer’s specification and guidance may be used (see appendix D).
Point Shear Wave Speed Measurements from Shear Wave Images 560
This section describes criteria and procedures related to producing quantitative measurements from the SWS images that are necessary to reliably meet the Profile Claim.
SWS Image Point Measurement ROI Location. The location in the shear wave speed image for point measurements may depend on the type of pathology of concern. For example, for diffuse organ disease a global assessment may require positioning some ROI’s in the largest homogeneous areas showing the 565 predominant SWS in the images. Some ROI’s may also be placed in the areas of high SWS for estimates of SWS in areas of greatest pathological change. Values from these ROI’s should be identified as maximum SWS values to distinguish them from predominate SWS values so that the reader may provide an interpretation based on complete information.
For some focal lesions (such as breast cancers), the literature supports positioning ROI’s in only areas of 570 maximum SWS identified in the images. This is because most values in a cancer may be artificially decreased due (probably) to artifacts from shear wave reflection at lesion boundaries. Please also refer to Manufacturers guidance regarding ROI positioning based on SWS image appearance. Some Manufacturers have begun to supply additional images related to SWS quality and variability estimates. These images can be used to help position the ROI in the manner specified by the Manufacturer. 575
SWS Imaging Point Measurement ROI size. The ROI size may be pre-selected by the Manufacturer. If adjustable use the default setting for suspected diffuse disease and consider decreasing ROI size if small areas of increased SWS speed on the SWE image are being evaluated. Check Manufacturer guidance
SWS Profile FINAL REVISION FOR CONSENSUS STATUS VOTE BSG Final Review-final edits all accepted 3-15-21 - clean copy.docx
regarding reduction of ROI size and potential problems that may result.
SWS Imaging Point Measurement Data Transfer. Follow Manufacturer’s instructions and/or institutional 580 guidelines for this. Transfer may include capture of the measurement screens into PACS and/or recording of values on a worksheet. Transfer to PACS or a report via DICOM SR (structured reporting) is another option.
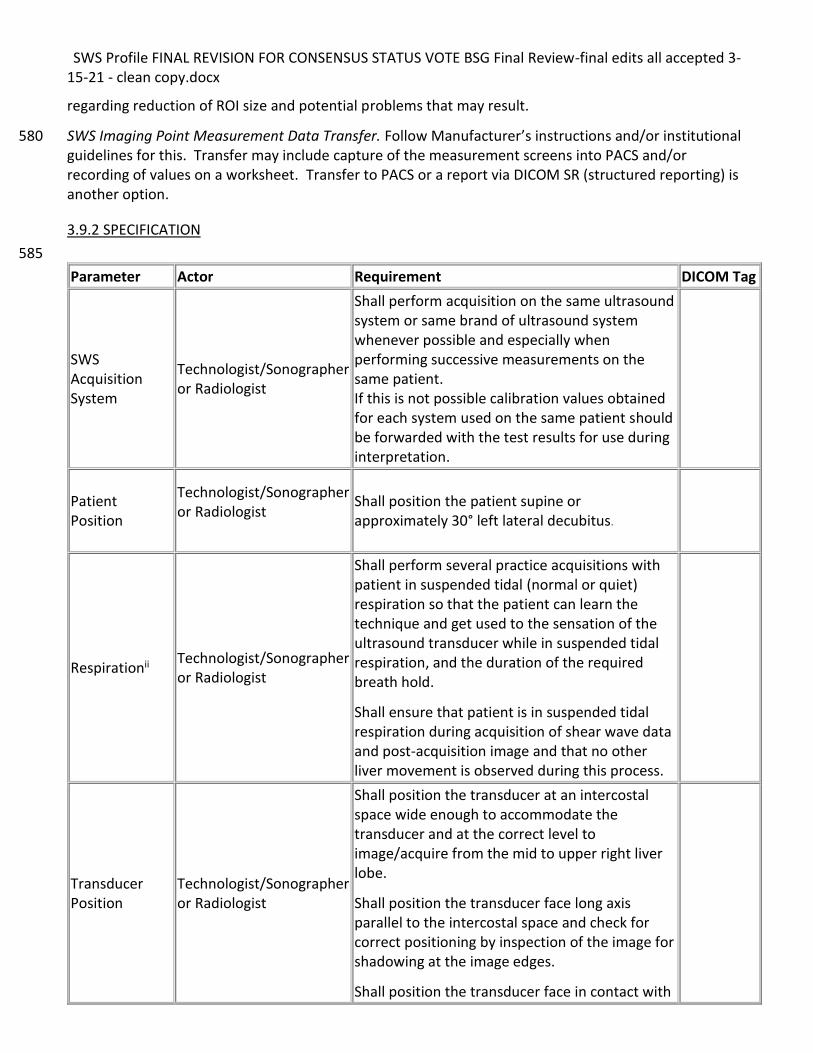
3.9.2 SPECIFICATION
585
Parameter Actor Requirement DICOM Tag
SWS Acquisition System
Technologist/Sonographer or Radiologist
Shall perform acquisition on the same ultrasound system or same brand of ultrasound system whenever possible and especially when performing successive measurements on the same patient. If this is not possible calibration values obtained for each system used on the same patient should be forwarded with the test results for use during interpretation.
Patient Position
Technologist/Sonographer or Radiologist
Shall position the patient supine or approximately 30° left lateral decubitus.
Respirationii Technologist/Sonographer or Radiologist
Shall perform several practice acquisitions with patient in suspended tidal (normal or quiet) respiration so that the patient can learn the technique and get used to the sensation of the ultrasound transducer while in suspended tidal respiration, and the duration of the required breath hold.
Shall ensure that patient is in suspended tidal respiration during acquisition of shear wave data and post-acquisition image and that no other liver movement is observed during this process.
Transducer Position
Technologist/Sonographer or Radiologist
Shall position the transducer at an intercostal space wide enough to accommodate the transducer and at the correct level to image/acquire from the mid to upper right liver lobe.
Shall position the transducer face long axis parallel to the intercostal space and check for correct positioning by inspection of the image for shadowing at the image edges.
Shall position the transducer face in contact with
SWS Profile FINAL REVISION FOR CONSENSUS STATUS VOTE BSG Final Review-final edits all accepted 3-15-21 - clean copy.docx
Parameter Actor Requirement DICOM Tag
the skin and parallel to the liver capsule so that the acoustic waves travel perpendicular to the capsule.
Transducer Pressure
Technologist/Sonographer or Radiologist
Shall use only light pressure during SWS acquisition –just enough to maintain skin contact. May use slightly more pressure to compress body wall when needed to enable ROI to be positioned in proper position in Liver.
Ultrasound image – location confirmation
Technologist/Sonographer or Radiologist
Shall confirm the absence of focal structures near image center and confirm no acoustic shadowing from the ribs.
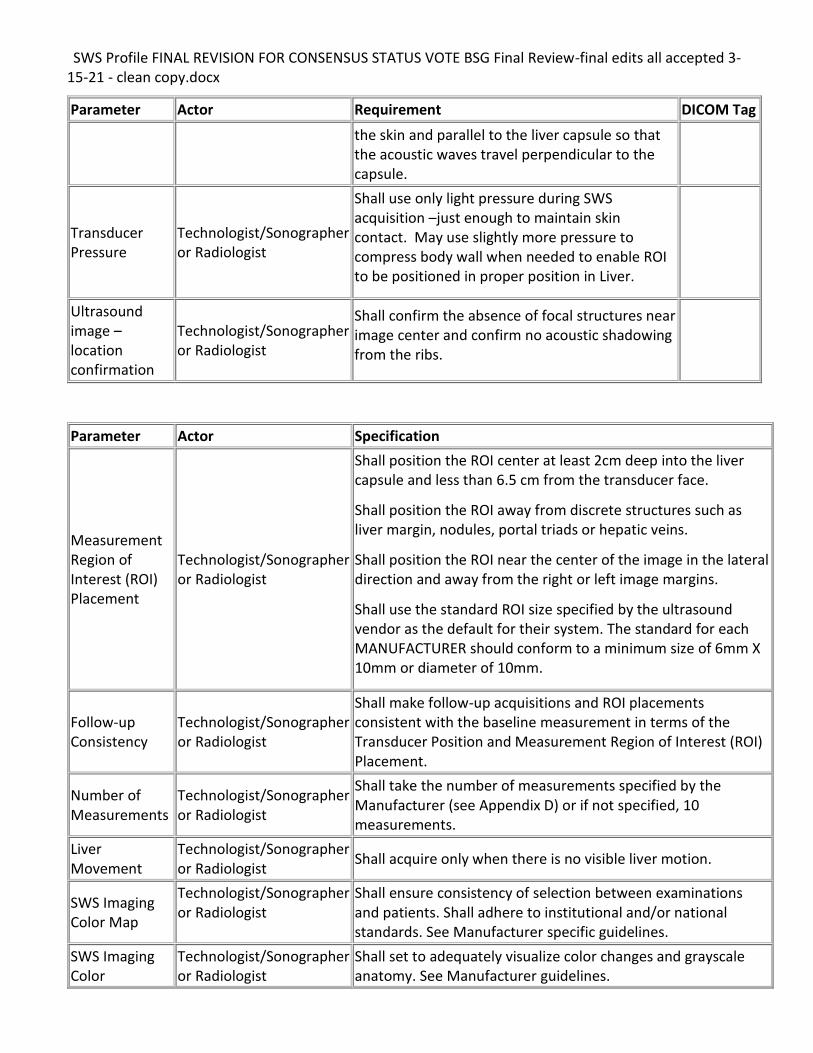
Parameter Actor Specification
Measurement Region of Interest (ROI) Placement
Technologist/Sonographer or Radiologist
Shall position the ROI center at least 2cm deep into the liver capsule and less than 6.5 cm from the transducer face.
Shall position the ROI away from discrete structures such as liver margin, nodules, portal triads or hepatic veins.
Shall position the ROI near the center of the image in the lateral direction and away from the right or left image margins.
Shall use the standard ROI size specified by the ultrasound vendor as the default for their system. The standard for each MANUFACTURER should conform to a minimum size of 6mm X 10mm or diameter of 10mm.
Follow-up Consistency
Technologist/Sonographer or Radiologist
Shall make follow-up acquisitions and ROI placements consistent with the baseline measurement in terms of the Transducer Position and Measurement Region of Interest (ROI) Placement.
Number of Measurements
Technologist/Sonographer or Radiologist
Shall take the number of measurements specified by the Manufacturer (see Appendix D) or if not specified, 10 measurements.
Liver Movement
Technologist/Sonographer or Radiologist
Shall acquire only when there is no visible liver motion.
SWS Imaging Color Map
Technologist/Sonographer or Radiologist
Shall ensure consistency of selection between examinations and patients. Shall adhere to institutional and/or national standards. See Manufacturer specific guidelines.
SWS Imaging Color
Technologist/Sonographer or Radiologist
Shall set to adequately visualize color changes and grayscale anatomy. See Manufacturer guidelines.
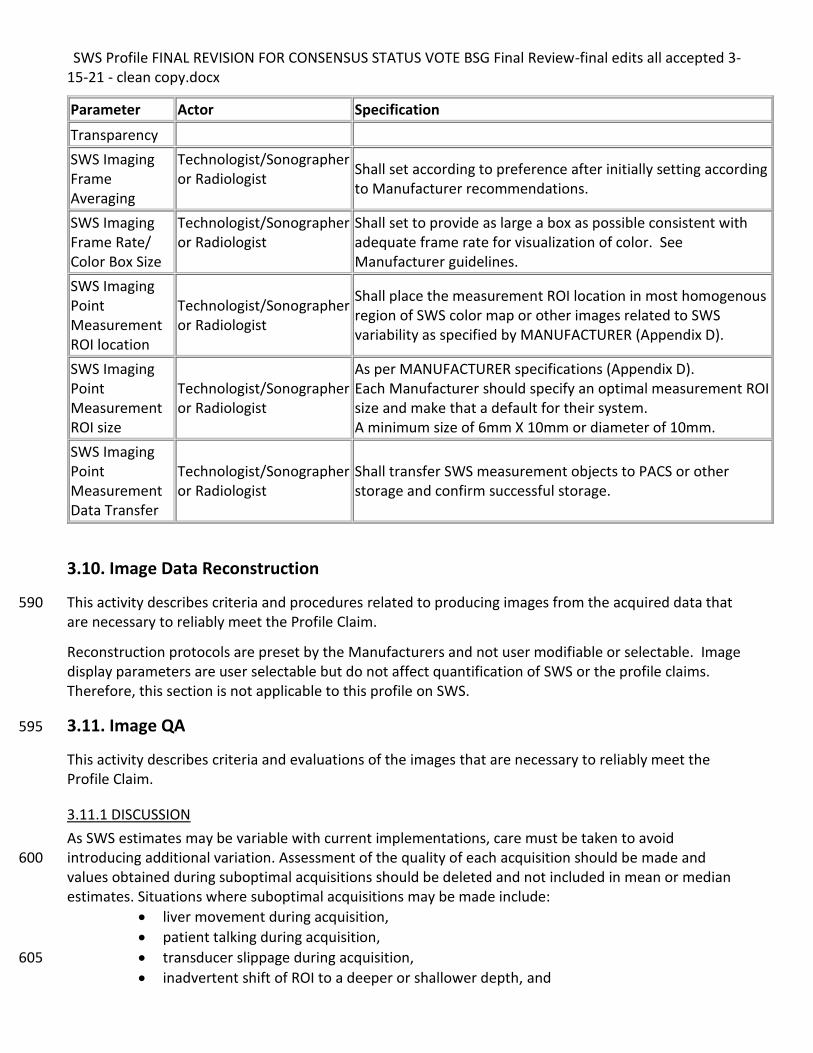
SWS Profile FINAL REVISION FOR CONSENSUS STATUS VOTE BSG Final Review-final edits all accepted 3-15-21 - clean copy.docx
Parameter Actor Specification
Transparency
SWS Imaging Frame Averaging
Technologist/Sonographer or Radiologist
Shall set according to preference after initially setting according to Manufacturer recommendations.
SWS Imaging Frame Rate/ Color Box Size
Technologist/Sonographer or Radiologist
Shall set to provide as large a box as possible consistent with adequate frame rate for visualization of color. See Manufacturer guidelines.
SWS Imaging Point Measurement ROI location
Technologist/Sonographer or Radiologist
Shall place the measurement ROI location in most homogenous region of SWS color map or other images related to SWS variability as specified by MANUFACTURER (Appendix D).
SWS Imaging Point Measurement ROI size
Technologist/Sonographer or Radiologist
As per MANUFACTURER specifications (Appendix D). Each Manufacturer should specify an optimal measurement ROI size and make that a default for their system. A minimum size of 6mm X 10mm or diameter of 10mm.
SWS Imaging Point Measurement Data Transfer
Technologist/Sonographer or Radiologist
Shall transfer SWS measurement objects to PACS or other storage and confirm successful storage.
3.10. Image Data Reconstruction
This activity describes criteria and procedures related to producing images from the acquired data that 590 are necessary to reliably meet the Profile Claim.
Reconstruction protocols are preset by the Manufacturers and not user modifiable or selectable. Image display parameters are user selectable but do not affect quantification of SWS or the profile claims. Therefore, this section is not applicable to this profile on SWS.
3.11. Image QA 595
This activity describes criteria and evaluations of the images that are necessary to reliably meet the Profile Claim.
3.11.1 DISCUSSION
As SWS estimates may be variable with current implementations, care must be taken to avoid introducing additional variation. Assessment of the quality of each acquisition should be made and 600 values obtained during suboptimal acquisitions should be deleted and not included in mean or median estimates. Situations where suboptimal acquisitions may be made include:
• liver movement during acquisition,
• patient talking during acquisition,
• transducer slippage during acquisition, 605
• inadvertent shift of ROI to a deeper or shallower depth, and
SWS Profile FINAL REVISION FOR CONSENSUS STATUS VOTE BSG Final Review-final edits all accepted 3-15-21 - clean copy.docx
• placement of the ROI near to a vessel or other discrete structure.
Images acquired immediately prior to and immediately after SWS acquisition may be used to confirm lack of liver movement during the acquisition. Different ultrasound systems vary greatly in their ability to 610 save pre-acquisition and post-acquisition images in close temporal proximity to the SWS acquisition. Experimentation to determine the best procedure for this may be necessary and often, practice to make the images quickly is needed.
Subjective assessment of motion is sufficient at this stage since the amount of motion that can be tolerated is not known. If upon further study, acquisition is extremely motion sensitive, measures to 615 quantify motion and automatically discard suboptimal acquisitions may be required in future profile versions.
The operator should discard the acquisition if movement is detected by any method.
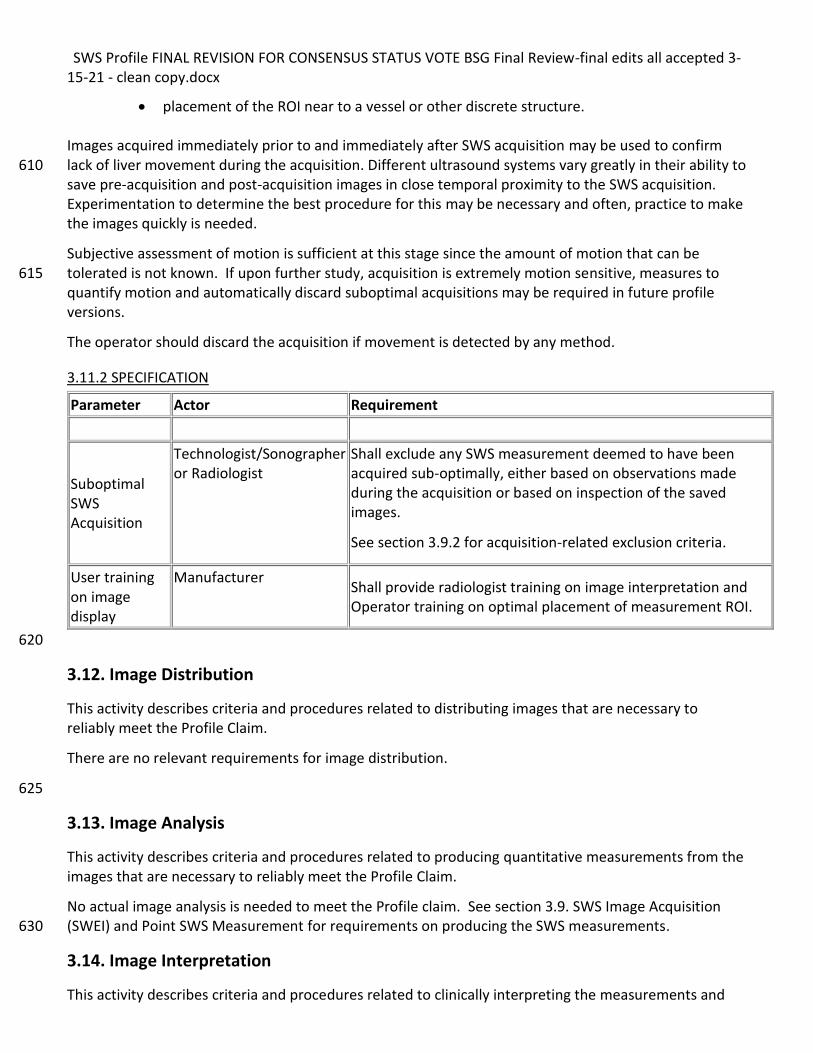
3.11.2 SPECIFICATION
Parameter Actor Requirement
Suboptimal SWS Acquisition
Technologist/Sonographer or Radiologist
Shall exclude any SWS measurement deemed to have been acquired sub-optimally, either based on observations made during the acquisition or based on inspection of the saved images.
See section 3.9.2 for acquisition-related exclusion criteria.
User training on image display
Manufacturer Shall provide radiologist training on image interpretation and Operator training on optimal placement of measurement ROI.
620
3.12. Image Distribution
This activity describes criteria and procedures related to distributing images that are necessary to reliably meet the Profile Claim.
There are no relevant requirements for image distribution.
625
3.13. Image Analysis
This activity describes criteria and procedures related to producing quantitative measurements from the images that are necessary to reliably meet the Profile Claim.
No actual image analysis is needed to meet the Profile claim. See section 3.9. SWS Image Acquisition (SWEI) and Point SWS Measurement for requirements on producing the SWS measurements. 630
3.14. Image Interpretation
This activity describes criteria and procedures related to clinically interpreting the measurements and
SWS Profile FINAL REVISION FOR CONSENSUS STATUS VOTE BSG Final Review-final edits all accepted 3-15-21 - clean copy.docx
images that are necessary to reliably meet the Profile Claim.
No clinical interpretation is required to meet the profile claim
635
4. Assessment Procedures
Most of the requirements described in Section 3 can be assessed for conformance by direct observation, however some of the performance-oriented requirements are assessed using a procedure. When a specific assessment procedure is required or to provide clarity, those procedures are defined in subsections here in Section 4 and the subsection is referenced from the corresponding requirement in 640 Section 3.
4.1. Assessment Procedure: Imaging Performance
This procedure can be used by a scanner vendor or an imaging site to assess the imaging performance of an ultrasound system. Imaging performance is assessed in terms of change compared to specifications and/or initial testing of most recent prior QA testing when imaging a phantom. 645
4.1.1 OBTAINING AND MAINTAINING THE IMAGING PHANTOMS
Ultrasonic Imaging and SWS Phantoms Used for Testing: A commercially available standard ultrasound imaging phantom may be used to confirm imaging performance of the ultrasound systems used for SWS acquisition. 650 For testing of instrument (scanner) SWS performance, an elastic phantom will be used since it is both affordable and practical. A viscoelastic phantom may be used for testing in later versions of the profile to better address possible bias (bias is not part of the claims in this version). A Simple phantom rather than a complex structured phantom will be used since the liver is a relatively homogenous organ. 655 The phantoms selected for instrument pre-delivery testing by Manufacturer should meet the following specifications: Ultrasonic Imaging Phantom Specifications: 660
a. Attenuation: 0.5 ± 0.1 dB/cm/MHz b. Back Scatter: Approximately 10-4 – 10-3 cm-1Str-1 at 3 MHz or sufficient to create mean speckle
brightness comparable to a human liver-mimicking phantom (± 3 dB) c. Speed of Sound: 1540 ± 30 m/sec d. Volume and Shape: 665
i. Cylindrical or rectangular ii. Height: 15 ± 3 cm iii. Diameter: 12.5 ± 3cm in inner diameter (ID)
Shear Wave Speed Phantom Specifications: a. Attenuation: 0.5 dB/cm/MHz (± 0.1 dB/cm/MHz) 670 b. Back Scatter: Approximately 10-4 – 10-3 cm-1Str-1 at 3 MHz or sufficient to create mean speckle
SWS Profile FINAL REVISION FOR CONSENSUS STATUS VOTE BSG Final Review-final edits all accepted 3-15-21 - clean copy.docx
brightness comparable to a human liver-mimicking phantom (± 3 dB)4 c. Speed of Sound: 1520-1540 m/sec d. Stiffness: Two phantoms can be used or a single phantom with two different components:
Normal Liver Equivalent & Fibrotic F3 Liver equivalent. ± 5% of the specified values. Stiffness 675 verified using Verasonics system and software from Duke University and Mayo Clinic. See https://github.com/RSNA-QIBA-US-SWS/QIBA-DigitalPhantoms.
e. Volume and Shape – Cylindrical, 20 cm tall, 12.5 cm in diameter. (Cylindrical preferred, rectangular is acceptable if width and depth are 12.5 cm and 20cm tall)
680 Ultrasonic Imaging Phantom Characterization:
Phantom is weighed upon construction. It is then tested following procedures in the AIUM Guidance document.5
Pass Fail Tolerances for Site-Phantom Characterization and/or Retesting (these are the same specifications as the phantoms used for pre-delivery instrument testing) 685
Testing to be performed at 21±1 °C.
• Method to verify temperature of phantoms prior to testing. Temperature measurement method: TBD [open issue]
Attenuation: ± 20% 690
• 0.5 dB/cm/MHz± 0.1 dB/cm/MHz Back Scatter: ± 3dB
• Approximately 10-4 – 10-3 cm-1Str-1 at 3 MHz or sufficient to create mean speckle brightness comparable to a human liver-mimicking phantom (± 3 dB)] 695
Speed of Sound: ± 2%
• 1540 ± 30 m/sec [1510-1570 m/sec] *Phantoms failing these tolerance tests shall be refused or replaced if already acquired. 700 Ultrasonic Imaging Phantom Temporal Stability testing:
The phantoms should be re-weighed every six months (using a scale with accuracy of ± .1% or better) and if the phantom weight changes by more than 0.5%, the phantom should be retested to confirm that acoustic properties are within the specifications above prior to next use.
If the phantom Manufacturer has other criteria for stability testing prior to acoustic property testing, 705 those should be used instead.
Testing of phantom acoustic properties shall be as specified by the AIUM guidelines noted previously and the phantom supplier’s recommendations.
4 Reference - IEC 61391-2: Ultrasonics – Pulse-echo scanners – Part 2: Measurement of maximum depth of penetration and local dynamic range. 2010, Int Electrotechnical Comm: Geneva. 5 Methods for Specifying Acoustic Properties of Tissue-Mimicking Phantoms and Objects 2nd Edition. AIUM Technical Standards Committee. American Institute of Ultrasound in Medicine. 2015.
SWS Profile FINAL REVISION FOR CONSENSUS STATUS VOTE BSG Final Review-final edits all accepted 3-15-21 - clean copy.docx
*If the values are changing faster than the rates above, sites should consider replacement or testing more frequently than every 6 months. 710 SWS Phantom (pre-delivery and on-site phantoms)
The initial characterization of the phantoms will be performed and verified by the QIBA committee, the phantom Manufacturer, Verasonics or another party using measurements obtained from Verasonics research ultrasound systems. Independent verification of phantom properties to ensure that the 715 phantom meets the SWS Phantom specifications above is strongly recommended. If a newly procured phantom has already been independently tested within six months of the date of manufacture and those results are available then additional independent testing prior to use is not necessary. The phantom Manufacturer may be contacted for assistance in finding a site that will perform independent testing. 720
SWS Phantom Temporal Stability Testing (pre-delivery and site-phantoms)
Weigh the SWS phantom monthly and if the weight changes more than 0.5% over a six-month period the following parameters will be checked by sending the phantom to a testing facility capable of 725 performing the tests using a Verasonics system. The phantom Manufacturer may be contacted for assistance with obtaining the tests. Alternatively, a calibrated replacement phantom may be procured.
SWS Phantom Stability Tolerances:
(1) SWS: <5% change in both hard and soft components over 6 months. (2) Speed of Sound: <1% change over 6 months. 730
If SWS Phantom stability is demonstrated at six months, then the timeline can be changed to annual testing. SWS Phantom Temperature Sensitivity and Shipping Considerations 735
SWS Phantom stiffness may change as a function of temperature. For this reason, the temperature of the phantom should be recorded at the time of use. The phantom should be used at the temperature specified by the Manufacturer. Very cold or hot temperatures may damage the phantom and permanently change its acoustic and mechanical properties. Please ship according the Manufacturer’s recommendations and contact the Manufacturer if shipping in extreme heat or cold is not discussed in 740 the instructions.
Ultrasound System Phantom Testing
a. Grayscale imaging tests as normally conducted by the ultrasound system Manufacturer or as described in the AIUM document “AIUM Quality Assurance Manual for Gray Scale Ultrasound Scanners”6. 745
b. Shear Wave Speed Estimations are obtained from the SWS phantom using the Manufacturer specified
6 AIUM Quality Assurance Manual for Gray Scale Ultrasound Scanners, AIUM Technical Standards Committee, American Institute of Ultrasound in Medicine, www.aium.org, 2014 (ISBN 1-932962-31-X)
SWS Profile FINAL REVISION FOR CONSENSUS STATUS VOTE BSG Final Review-final edits all accepted 3-15-21 - clean copy.docx
procedures as defined in Appendix D of the QIBA SWS Profile.
Shear Wave Speed (SWS) Tolerance: ± 5% of the Verasonics system calibration value for the phantom as determined by the QIBA calibration site.
750
4.1.2 ASSESSING IMAGING PERFORMANCE
The assessor shall perform grayscale imaging tests as normally conducted by the ultrasound system manufacturer or as described in the AIUM document “AIUM Quality Assurance Manual for Gray Scale Ultrasound Scanners”7. 755 A link to the QA Tests and expected results recommended by AIUM is given here (login required): http://aium.s3.amazonaws.com/resourceLibrary/14qa.pdf
4.2. Assessment Procedures: SWS Measurement Consistency 760
This section describes a group of procedures for assessing the performance of a site or of individual actors to determine if pre-established quantification performance specifications are met. For a site, those pre-established quantification performance specifications are the claims made in the claims section of the profile. For the individual actors, the performance specifications are those that have been shown, or are likely to be necessary for the site to meet the performance claims of the profile. The 765 performance specifications for actors are based on the results of the technical and claims confirmation studies performed during the QIBA profile development process (see the QIBA wiki: https://qibawiki.rsna.org/index.php/Process ) and/or on typical acceptable performance achieved in clinical practice worldwide.
The overall performance of a site (and its ability to meet the profile claims) depends upon multiple 770 actors meeting or exceeding their performance specifications, even if they already meet the procedural performance expectations of the profile (checklist compliance – see section 5). Clearly if an actor’s performance does not meet specification, the profile claim may be invalidated for that site but inadequate performance on the part of one actor may be compensated for by better-than-expected performance of another actor. The described assessment procedures are designed to test the 775 hypothesis that an Actor’s wCV meets the Profile requirement at a specified type I error rate (usually 5%). It is not sufficient to show that the observed wCV is <10% for only a sample of cases.
Therefore, two types of assessment procedures and performance specifications are described: A) those for assessment of composite performance of a site and B) those for testing individual actors. The 780 assessment procedures for types a and b may be the same or very similar to one another but different performance specifications will be given.
Cross-sectional claims (for a given patient at a single time point) require testing of within subject precision, often termed “repeatability” as well as bias. Longitudinal claims (for a given patient at
7 AIUM Quality Assurance Manual for Gray Scale Ultrasound Scanners, AIUM Technical Standards Committee, American Institute of Ultrasound in Medicine, www.aium.org, 2014 (ISBN 1-932962-31-X)
SWS Profile FINAL REVISION FOR CONSENSUS STATUS VOTE BSG Final Review-final edits all accepted 3-15-21 - clean copy.docx
different time points or for different imaging methods at one or more time points require testing of 785 repeatability, bias, linearity and regression slope. As this profile makes multiple longitudinal claims and one cross-sectional claim, numerous testing procedures are described below along with the claim that each applies to. 790
4.2.1 SITE ASSESSMENT TOOLS AND TESTS.
4.2.1.0 Site assessment dataset. The dataset (or “parts being measured” in six sigma measurement system analysis) are livers of patients 795 and two test phantoms, a b-mode imaging test phantom and a calibrated elastography phantom.
4.2.1.1. Site assessment data acquisition
4.2.1.1.A. B-mode imaging:
For Ultrasound b-mode imaging assessment a standard ultrasound test phantom shall be used to acquire test images and measurement values that will be evaluated according to the methods described in the 800 AIUM quality assurance manual. The specification for the phantom is given in section 4.1.1 above.
4.2.1.1.B. Phantom SWS:
For assessment of SWS performance and conformance in phantoms, calibrated SWS phantoms shall be used. These phantoms can be obtained from phantom manufacturers and consist of either two phantoms, one with stiffness approximating normal liver and the other with a stiffness approximating a 805 liver with F3 fibrosis, or a single two-part phantom containing regions with each of the two stiffnesses. The specifications of the phantoms are given in section 3.3.1 above along with instructions for periodic phantom stability checks.
The site assessment phantom data will consist of SWS acquisitions obtained by each operator who has been qualified by training and testing to acquire SWS data according to the following criteria: 810
• Twenty (20) distinct SWS measurements will be collected from each of the two phantoms at both 4.5cm and 7 cm depths, by each operator. For these tests a measurement is defined as completed when the scanner outputs a SWS to the screen or to the data collection table within the machine. A system may acquire multiple SWS values and then report an overall SWS value (i.e., mean and median). The individual SWS values are the measurements, not this summary result. So, for each 815 operator a total of 80 measurements, 20 for each of the two phantoms and for each of two different depths.
• If a site has ultrasound systems from more than one manufacturer, the test measurements must be performed for each manufacturer’s system (only one set of test measurements per manufacturer unless the manufacturer notes that different models of their systems give different 820 SWS results). So, for multiple different ultrasound systems being used to acquire SWS, the total number of measurements taken per operator will be 80 x n where n = the number of ultrasound systems. It is expected that acquisition of these phantom measurements will take approximately 20 minutes per machine.
• Depth is defined as the distance from the transducer surface to the center of the region of interest 825
SWS Profile FINAL REVISION FOR CONSENSUS STATUS VOTE BSG Final Review-final edits all accepted 3-15-21 - clean copy.docx
from which the point SWS is acquired.
• Between each measurement, the transducer will be removed from contact with the phantom and the phantom will be shifted so that each measurement is performed with the transducer oriented differently relative to the phantom in a random manner. NO effort to reposition the transducer in the same exact spot as the previous measurement should be made. 830
• The temperature at which the testing was performed at should be recorded. It is strongly recommended that the measurements be performed at the temperature at which the phantom was calibrated by the QIBA test site or manufacturer using approved QIBA instrumentation and methodology.
• Each ultrasound scanner will have different specific instructions that should be followed as noted 835 above, but one important requirement is that the transducer should remain motionless during each measurement. If transducer movement is detected by any method during measurement, that value should be discarded and another measurement taken.
• The operators will be blinded with respect to the actual SWS values represented in the phantom(s). The operator will however see a large number of SWS measurements from each 840 phantom since the phantom(s) will be used repeatedly. Therefore, the operator must NOT discard a SWS measurement solely because it appears different from the others or from the assumed “true” value for the phantom
4.2.1.1.C. In-vivo SWS data:
Six volunteers having no history of liver disease and with normal AST, ALT, Alkaline Phosphatase and 845 Total Bilirubin values will be recruited. The volunteers should cover a range of BMI values from 20 to 35 and ideally will be available for at least several rounds of testing (months to years). The site assessment in-vivo data set will consist of ten (10) measurements by each operator on each of the six volunteers and at two different depths made according to the following criteria:
* Ten (10) distinct SWS measurements at each of two depths (4.5cm and 7cm) will be made from 850 each volunteer by each operator. Depth is defined as the distance from the transducer face to the center of the region of interest used for acquisition of the SWS value (not the region defined for shear wave imaging display).
* The measurements will be performed with the volunteer having fasted for at least six hours
* The measurements will be made according to the instructions provided by the scanner 855 manufacturer and according to the guidelines in section 3.9 of this profile.
* The measurements should be performed for each brand of ultrasound scanner if scanners from multiple manufacturers are used to acquire SWS data. All scanners from a given manufacturer are assumed to give identical results unless otherwise specified by the manufacturer.
* Between each measurement, the transducer should be removed from contact with the 860 volunteer, and the volunteer should get up from the scan table between each measurement. If this is not feasible due to time limitations or physical condition of the volunteer, the measurements should be divided into groups of five (5) measurements and the volunteer should get up from the scan table before lying down for the next measurement group.
* As for the phantom data collection, a SWS measurement is defined as whenever a SWS value 865 appears on the scanner screen, NOT the mean value or median value reported by the scanner after several measurements.
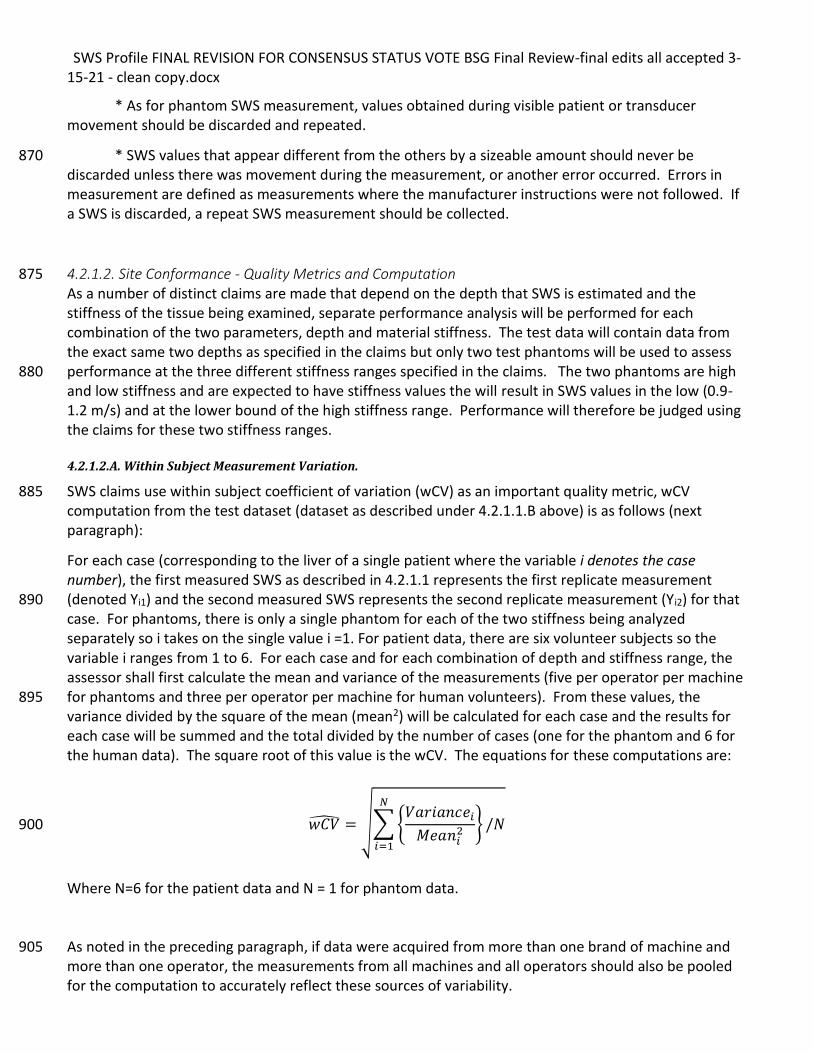
SWS Profile FINAL REVISION FOR CONSENSUS STATUS VOTE BSG Final Review-final edits all accepted 3-15-21 - clean copy.docx
* As for phantom SWS measurement, values obtained during visible patient or transducer movement should be discarded and repeated.
* SWS values that appear different from the others by a sizeable amount should never be 870 discarded unless there was movement during the measurement, or another error occurred. Errors in measurement are defined as measurements where the manufacturer instructions were not followed. If a SWS is discarded, a repeat SWS measurement should be collected.
4.2.1.2. Site Conformance - Quality Metrics and Computation 875 As a number of distinct claims are made that depend on the depth that SWS is estimated and the stiffness of the tissue being examined, separate performance analysis will be performed for each combination of the two parameters, depth and material stiffness. The test data will contain data from the exact same two depths as specified in the claims but only two test phantoms will be used to assess performance at the three different stiffness ranges specified in the claims. The two phantoms are high 880 and low stiffness and are expected to have stiffness values the will result in SWS values in the low (0.9-1.2 m/s) and at the lower bound of the high stiffness range. Performance will therefore be judged using the claims for these two stiffness ranges.
4.2.1.2.A. Within Subject Measurement Variation.
SWS claims use within subject coefficient of variation (wCV) as an important quality metric, wCV 885 computation from the test dataset (dataset as described under 4.2.1.1.B above) is as follows (next paragraph):
For each case (corresponding to the liver of a single patient where the variable i denotes the case number), the first measured SWS as described in 4.2.1.1 represents the first replicate measurement (denoted Yi1) and the second measured SWS represents the second replicate measurement (Yi2) for that 890 case. For phantoms, there is only a single phantom for each of the two stiffness being analyzed separately so i takes on the single value i =1. For patient data, there are six volunteer subjects so the variable i ranges from 1 to 6. For each case and for each combination of depth and stiffness range, the assessor shall first calculate the mean and variance of the measurements (five per operator per machine for phantoms and three per operator per machine for human volunteers). From these values, the 895 variance divided by the square of the mean (mean2) will be calculated for each case and the results for each case will be summed and the total divided by the number of cases (one for the phantom and 6 for the human data). The square root of this value is the wCV. The equations for these computations are:
𝑤𝐶�̂� = √∑ {𝑉𝑎𝑟𝑖𝑎𝑛𝑐𝑒𝑖
𝑀𝑒𝑎𝑛𝑖2 } /𝑁
𝑁
𝑖=1
900
Where N=6 for the patient data and N = 1 for phantom data. As noted in the preceding paragraph, if data were acquired from more than one brand of machine and 905 more than one operator, the measurements from all machines and all operators should also be pooled for the computation to accurately reflect these sources of variability.
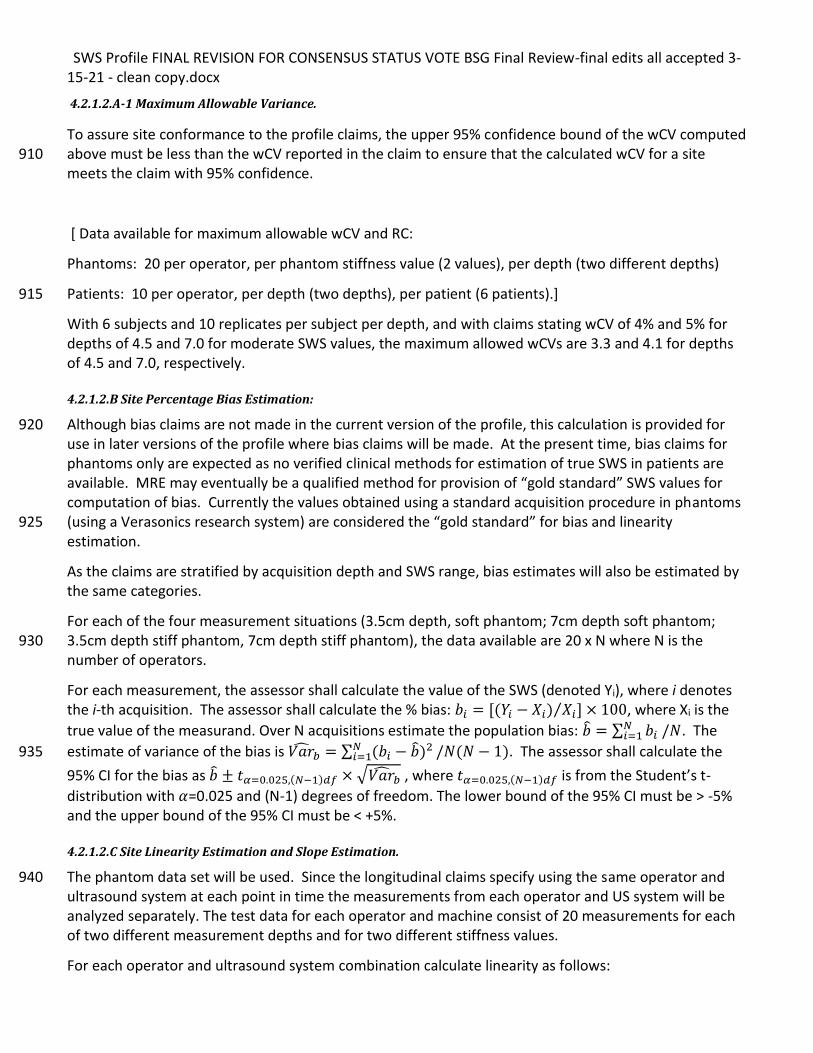
SWS Profile FINAL REVISION FOR CONSENSUS STATUS VOTE BSG Final Review-final edits all accepted 3-15-21 - clean copy.docx
4.2.1.2.A-1 Maximum Allowable Variance.
To assure site conformance to the profile claims, the upper 95% confidence bound of the wCV computed above must be less than the wCV reported in the claim to ensure that the calculated wCV for a site 910 meets the claim with 95% confidence.
[ Data available for maximum allowable wCV and RC:
Phantoms: 20 per operator, per phantom stiffness value (2 values), per depth (two different depths)
Patients: 10 per operator, per depth (two depths), per patient (6 patients).] 915
With 6 subjects and 10 replicates per subject per depth, and with claims stating wCV of 4% and 5% for depths of 4.5 and 7.0 for moderate SWS values, the maximum allowed wCVs are 3.3 and 4.1 for depths of 4.5 and 7.0, respectively.
4.2.1.2.B Site Percentage Bias Estimation:
Although bias claims are not made in the current version of the profile, this calculation is provided for 920 use in later versions of the profile where bias claims will be made. At the present time, bias claims for phantoms only are expected as no verified clinical methods for estimation of true SWS in patients are available. MRE may eventually be a qualified method for provision of “gold standard” SWS values for computation of bias. Currently the values obtained using a standard acquisition procedure in phantoms (using a Verasonics research system) are considered the “gold standard” for bias and linearity 925 estimation.
As the claims are stratified by acquisition depth and SWS range, bias estimates will also be estimated by the same categories.
For each of the four measurement situations (3.5cm depth, soft phantom; 7cm depth soft phantom; 3.5cm depth stiff phantom, 7cm depth stiff phantom), the data available are 20 x N where N is the 930 number of operators.
For each measurement, the assessor shall calculate the value of the SWS (denoted Yi), where i denotes the i-th acquisition. The assessor shall calculate the % bias: 𝑏𝑖 = [(𝑌𝑖 − 𝑋𝑖) 𝑋𝑖] × 100⁄ , where Xi is the
true value of the measurand. Over N acquisitions estimate the population bias: �̂� = ∑ 𝑏𝑖 /𝑁𝑁𝑖=1 . The
estimate of variance of the bias is 𝑉𝑎�̂�𝑏 = ∑ (𝑏𝑖 − �̂�)2𝑁𝑖=1 /𝑁(𝑁 − 1). The assessor shall calculate the 935
95% CI for the bias as �̂� ± 𝑡𝛼=0.025,(𝑁−1)𝑑𝑓 × √𝑉𝑎�̂�𝑏 , where 𝑡𝛼=0.025,(𝑁−1)𝑑𝑓 is from the Student’s t-
distribution with 𝛼=0.025 and (N-1) degrees of freedom. The lower bound of the 95% CI must be > -5% and the upper bound of the 95% CI must be < +5%.
4.2.1.2.C Site Linearity Estimation and Slope Estimation.
The phantom data set will be used. Since the longitudinal claims specify using the same operator and 940 ultrasound system at each point in time the measurements from each operator and US system will be analyzed separately. The test data for each operator and machine consist of 20 measurements for each of two different measurement depths and for two different stiffness values.
For each operator and ultrasound system combination calculate linearity as follows:
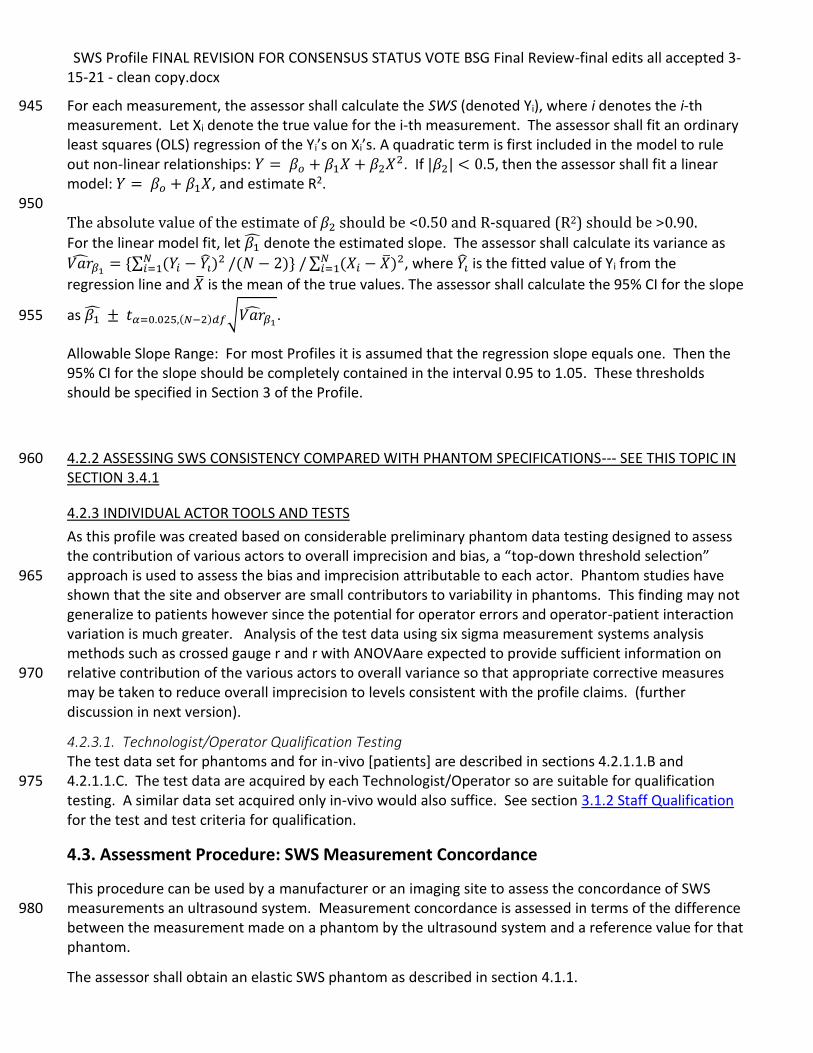
SWS Profile FINAL REVISION FOR CONSENSUS STATUS VOTE BSG Final Review-final edits all accepted 3-15-21 - clean copy.docx
For each measurement, the assessor shall calculate the SWS (denoted Yi), where i denotes the i-th 945 measurement. Let Xi denote the true value for the i-th measurement. The assessor shall fit an ordinary least squares (OLS) regression of the Yi’s on Xi’s. A quadratic term is first included in the model to rule out non-linear relationships: 𝑌 = 𝛽𝑜 + 𝛽1𝑋 + 𝛽2𝑋2. If |𝛽2| < 0.5, then the assessor shall fit a linear model: 𝑌 = 𝛽𝑜 + 𝛽1𝑋, and estimate R2. 950 The absolute value of the estimate of 𝛽2 should be <0.50 and R-squared (R2) should be >0.90.
For the linear model fit, let 𝛽1̂ denote the estimated slope. The assessor shall calculate its variance as
𝑉𝑎�̂�𝛽1= {∑ (𝑌𝑖 − 𝑌�̂�)
2𝑁𝑖=1 /(𝑁 − 2)} / ∑ (𝑋𝑖 − �̅�)2𝑁
𝑖=1 , where 𝑌�̂� is the fitted value of Yi from the
regression line and �̅� is the mean of the true values. The assessor shall calculate the 95% CI for the slope
as 𝛽1̂ ± 𝑡𝛼=0.025,(𝑁−2)𝑑𝑓√𝑉𝑎�̂�𝛽1. 955
Allowable Slope Range: For most Profiles it is assumed that the regression slope equals one. Then the 95% CI for the slope should be completely contained in the interval 0.95 to 1.05. These thresholds should be specified in Section 3 of the Profile.
4.2.2 ASSESSING SWS CONSISTENCY COMPARED WITH PHANTOM SPECIFICATIONS--- SEE THIS TOPIC IN 960 SECTION 3.4.1
4.2.3 INDIVIDUAL ACTOR TOOLS AND TESTS
As this profile was created based on considerable preliminary phantom data testing designed to assess the contribution of various actors to overall imprecision and bias, a “top-down threshold selection” approach is used to assess the bias and imprecision attributable to each actor. Phantom studies have 965 shown that the site and observer are small contributors to variability in phantoms. This finding may not generalize to patients however since the potential for operator errors and operator-patient interaction variation is much greater. Analysis of the test data using six sigma measurement systems analysis methods such as crossed gauge r and r with ANOVAare expected to provide sufficient information on relative contribution of the various actors to overall variance so that appropriate corrective measures 970 may be taken to reduce overall imprecision to levels consistent with the profile claims. (further discussion in next version).
4.2.3.1. Technologist/Operator Qualification Testing The test data set for phantoms and for in-vivo [patients] are described in sections 4.2.1.1.B and 4.2.1.1.C. The test data are acquired by each Technologist/Operator so are suitable for qualification 975 testing. A similar data set acquired only in-vivo would also suffice. See section 3.1.2 Staff Qualification for the test and test criteria for qualification.
4.3. Assessment Procedure: SWS Measurement Concordance
This procedure can be used by a manufacturer or an imaging site to assess the concordance of SWS measurements an ultrasound system. Measurement concordance is assessed in terms of the difference 980 between the measurement made on a phantom by the ultrasound system and a reference value for that phantom.
The assessor shall obtain an elastic SWS phantom as described in section 4.1.1.
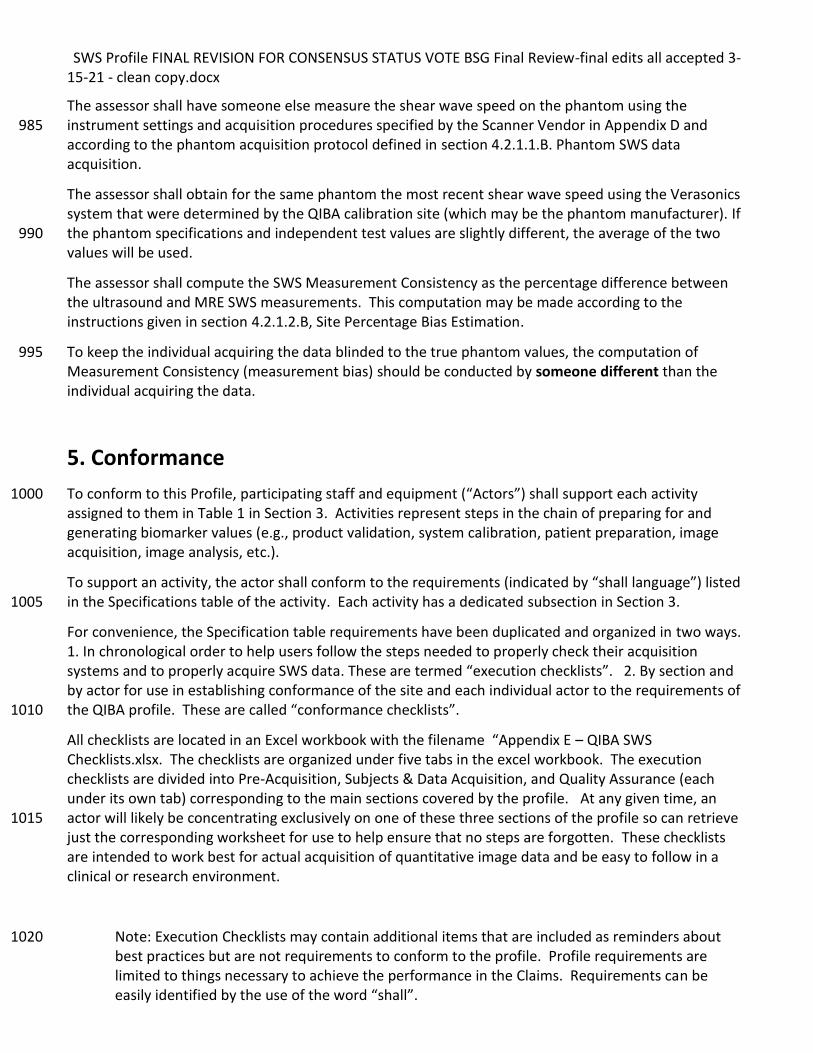
SWS Profile FINAL REVISION FOR CONSENSUS STATUS VOTE BSG Final Review-final edits all accepted 3-15-21 - clean copy.docx
The assessor shall have someone else measure the shear wave speed on the phantom using the instrument settings and acquisition procedures specified by the Scanner Vendor in Appendix D and 985 according to the phantom acquisition protocol defined in section 4.2.1.1.B. Phantom SWS data acquisition.
The assessor shall obtain for the same phantom the most recent shear wave speed using the Verasonics system that were determined by the QIBA calibration site (which may be the phantom manufacturer). If the phantom specifications and independent test values are slightly different, the average of the two 990 values will be used.
The assessor shall compute the SWS Measurement Consistency as the percentage difference between the ultrasound and MRE SWS measurements. This computation may be made according to the instructions given in section 4.2.1.2.B, Site Percentage Bias Estimation.
To keep the individual acquiring the data blinded to the true phantom values, the computation of 995 Measurement Consistency (measurement bias) should be conducted by someone different than the individual acquiring the data.
5. Conformance
To conform to this Profile, participating staff and equipment (“Actors”) shall support each activity 1000 assigned to them in Table 1 in Section 3. Activities represent steps in the chain of preparing for and generating biomarker values (e.g., product validation, system calibration, patient preparation, image acquisition, image analysis, etc.).
To support an activity, the actor shall conform to the requirements (indicated by “shall language”) listed in the Specifications table of the activity. Each activity has a dedicated subsection in Section 3. 1005
For convenience, the Specification table requirements have been duplicated and organized in two ways. 1. In chronological order to help users follow the steps needed to properly check their acquisition systems and to properly acquire SWS data. These are termed “execution checklists”. 2. By section and by actor for use in establishing conformance of the site and each individual actor to the requirements of the QIBA profile. These are called “conformance checklists”. 1010
All checklists are located in an Excel workbook with the filename “Appendix E – QIBA SWS Checklists.xlsx. The checklists are organized under five tabs in the excel workbook. The execution checklists are divided into Pre-Acquisition, Subjects & Data Acquisition, and Quality Assurance (each under its own tab) corresponding to the main sections covered by the profile. At any given time, an actor will likely be concentrating exclusively on one of these three sections of the profile so can retrieve 1015 just the corresponding worksheet for use to help ensure that no steps are forgotten. These checklists are intended to work best for actual acquisition of quantitative image data and be easy to follow in a clinical or research environment.
Note: Execution Checklists may contain additional items that are included as reminders about 1020 best practices but are not requirements to conform to the profile. Profile requirements are limited to things necessary to achieve the performance in the Claims. Requirements can be easily identified by the use of the word “shall”.
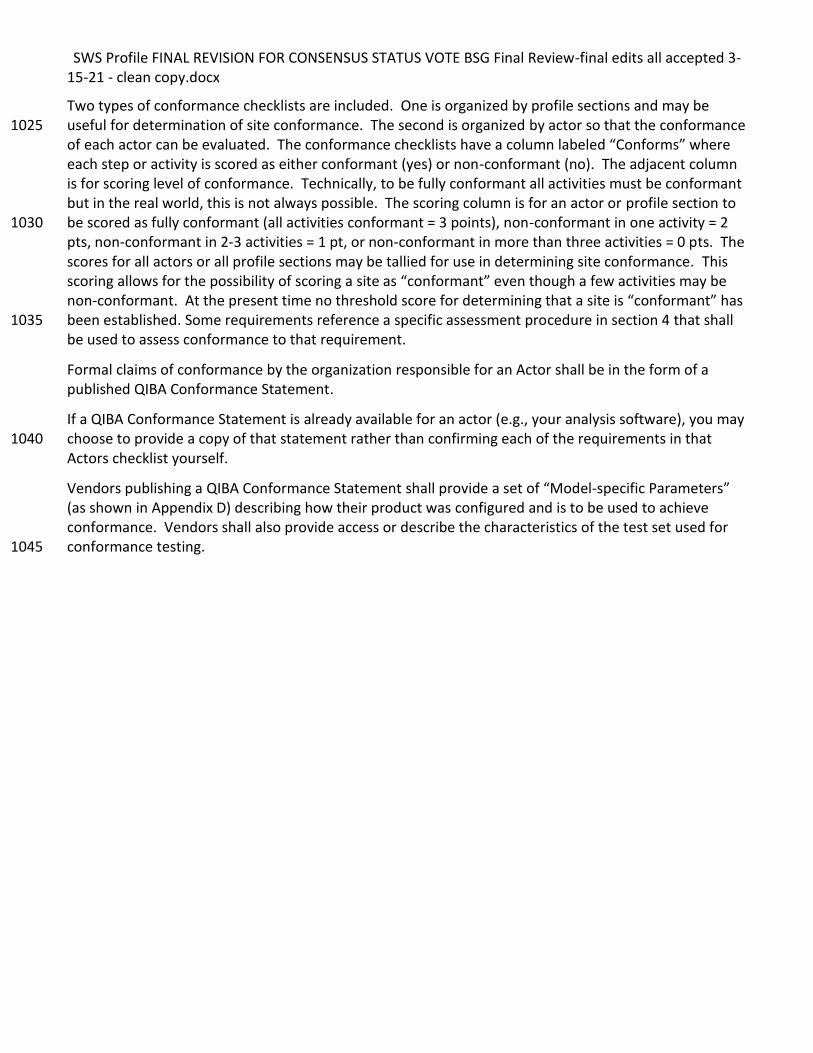
SWS Profile FINAL REVISION FOR CONSENSUS STATUS VOTE BSG Final Review-final edits all accepted 3-15-21 - clean copy.docx
Two types of conformance checklists are included. One is organized by profile sections and may be useful for determination of site conformance. The second is organized by actor so that the conformance 1025 of each actor can be evaluated. The conformance checklists have a column labeled “Conforms” where each step or activity is scored as either conformant (yes) or non-conformant (no). The adjacent column is for scoring level of conformance. Technically, to be fully conformant all activities must be conformant but in the real world, this is not always possible. The scoring column is for an actor or profile section to be scored as fully conformant (all activities conformant = 3 points), non-conformant in one activity = 2 1030 pts, non-conformant in 2-3 activities = 1 pt, or non-conformant in more than three activities = 0 pts. The scores for all actors or all profile sections may be tallied for use in determining site conformance. This scoring allows for the possibility of scoring a site as “conformant” even though a few activities may be non-conformant. At the present time no threshold score for determining that a site is “conformant” has been established. Some requirements reference a specific assessment procedure in section 4 that shall 1035 be used to assess conformance to that requirement.
Formal claims of conformance by the organization responsible for an Actor shall be in the form of a published QIBA Conformance Statement.
If a QIBA Conformance Statement is already available for an actor (e.g., your analysis software), you may choose to provide a copy of that statement rather than confirming each of the requirements in that 1040 Actors checklist yourself.
Vendors publishing a QIBA Conformance Statement shall provide a set of “Model-specific Parameters” (as shown in Appendix D) describing how their product was configured and is to be used to achieve conformance. Vendors shall also provide access or describe the characteristics of the test set used for conformance testing. 1045
SWS Profile FINAL REVISION FOR CONSENSUS STATUS VOTE BSG Final Review-final edits all accepted 3-15-21 - clean copy.docx
Appendix A: Acknowledgements and Attributions
This document is proffered by the Radiological Society of North America (RSNA) Quantitative Imaging 1050 Biomarker Alliance (QIBA), The QIBA Ultrasound Coordinating Committee and the QIBA Ultrasound Shear Wave Speed Biomarker Committee* (US SWS BC) under the leadership of Brian Garra, Tim Hall and Andy Milkowski. Paul Carson served as QIBA Ultrasound Coordinator. Profile Editor and leading coauthor was Brian Garra. Manish Dhyani, M.D. was a major coauthor and 1055 initial editor. Special contributions in conduct of groundwork studies and their publication were made by Mark Palmeri and his colleagues at Duke University. Other leaders of groundwork studies included Anthony Samir and colleagues at Massachusetts General Hospital, Tim Hall and colleagues at the Univ. of Wisconsin, Matthew Urban and colleagues at the Mayo Clinic, Stephen McAleavey and colleagues at The University of Rochester, and Jingfeng Jiang and colleagues at Michigan Technical University. Andy 1060 Milkowski performed an initial analysis. Discussions and contributions from Nancy Obuchowski greatly improved the statistical methods used in the analysis. Proofreading and guidance on structure of the profile were provided by Kevin O'Donnell. Cooperation of the MR Elastography Biomarker Committee, through Richard Ehman’s team at the Mayo Clinic, was much appreciated for their testing in phantoms for comparison with ultrasound. The 15 ultrasound system companies mentioned below were helpful in 1065 their contributions. In particular, those included in Appendix D. provided systems and/or performed studies for the groundwork. Also participating were companies producing phantoms, test equipment, contrast agents and drug studies and volunteers from government and many academic and clinical institutions. 1070 *Biomarker Committee members at the time of this publication: Brian Garra, MD (co-chair) Center for Devices and Radiological Health, FDA Tim J. Hall, PhD (co-chair) University of Wisconsin, School of Medicine & Public Health Andy Milkowski, MS (co-chair) Siemens Healthineers USA, Inc. S. Kaisar Alam, PhD Institute of Electrical and Electronics Engineers (IEEE) 1075 Karen Alton, MS, RDMS, RVT Karen Alton Consulting, LLC Michael André, PhD San Diego VA Healthcare/University of California, San Diego (UCSD) Brian Anthony, PhD MIT John J. Antol BK Ultrasound Michalakis (Mike) A. Averkiou, PhD University of Washington, Seattle 1080 Paul Barbone, PhD Boston University Felipe Barjud Pereira do Nascimento, MD Albert Einstein Hospital (São Paulo, Brazil) Richard G. Barr, MD, PhD Northeastern Ohio Medical University Tharakeswara K. Bathala, MBBS, MD University of Texas, MD Anderson Cancer Center Parviz Behfarin, MD Plainview Hospital 1085 John Benson Siemens Matt Berger, BS Samsung Electronics Co., Ltd. (South Korea) Laura Brattain, PhD Massachusetts General Hospital Paul L. Carson, PhD University of Michigan Medical Center Huan Wee Chan, MB ChB The National Hospital for Neurology and Neurosurgery 1090 Anil Chauhan, MD University of Pennsylvania Jun Chen, PhD Mayo Clinic Shigao Chen, PhD Mayo Clinic
SWS Profile FINAL REVISION FOR CONSENSUS STATUS VOTE BSG Final Review-final edits all accepted 3-15-21 - clean copy.docx
Yuling Chen, PhD Mindray (Zonare) Hyo-Min Cho, PhD Korea Research Institute of Standards and Science 1095 Wui K. Chong, MD University of Texas, MD Anderson Cancer Center Yi Hong Chou, MD Taipei Veterans General Hospital A Jung Chu, MD Seoul National University Hospital (South Korea) Claude Cohen-Bacrie, MS e-Scopics Elaine Collins, RDMS PAREXEL International 1100 Ron Daigle, PhD Verasonics Jonathan R. Dillman, MD, MSc Cincinnati Children's Hospital Marina Doliner, MD Ann and Robert H. Lurie Children's Hospital of Chicago John Donlon Philips Marvin M. Doyley, PhD University of Rochester (NY) 1105 Shuyan Du, PhD Bristol-Myers Squibb Richard L. Ehman, MD Mayo Clinic Todd Erpelding, PhD, MSE Canon Medical Systems USA Alex Exposito SuperSonic Imagine Steven E. Fick, PhD National Institute of Standards and Technology (NIST) 1110 Caterina M. Gallippi, PhD University of North Carolina at Chapel Hill Joel Gay, MSc Supersonic Imagine (SSI) - (Aix-en-Provence, France) Albert Gee Zonare Medical Systems Gilles Guenette, RDMS, RDCS, RVT Siemens Alexander Guimaraes, MD, PhD Oregon Health & Science University 1115 Zaegyoo (Jay) Hah, PhD, MBA Samsung Electronics Co., Ltd. (South Korea) Hendrik Hansen, PhD Radboud University Medical Center (Nijmegen, The Netherlands) Alpana Harisinghani, MD PAREXEL International Peggy Harrigan, PhD PAREXEL International Christopher Hazard, PhD GE Corporate R&D (NY) 1120 Anis Hadj Henni, PhD Rheolution, Inc. (Montréal, Canada) Yasunori Honjo, PhD Canon Medical Systems Kenneth (Ken) Hoyt, PhD University of Texas at Dallas Yu Igarashi, PhD Canon Medical Systems Edward F. Jackson, PhD University of Wisconsin, School of Medicine & Public Health 1125 Jingfeng Jiang, PhD Michigan Technical University Thiago Julio, MD Hospital Israelita Albert Einstein (São Paulo, Brazil) Muneki Kataguchi, PhD Canon Medical Systems Tetsuya, Kawagishi, PhD Canon Medical Systems So Yeon Kim, MD Adan Medical Center, Korea 1130 Riwa Kishimoto, MD, PhD National Institute of Radiological Sciences Sonal Krishan, MD Medanta (India) Viksit Kumar, PhD Massachusetts General Hospital Koichiro Kurita, PhD Canon Medical Systems Hyoung Ki Lee, PhD Samsung Electronics Co., Ltd. (South Korea) 1135 Julian Lee Alpinion Medical Systems Mi-Jung Lee MD, PhD Severance Children's Hospital, Yonsei University College of Medicine Eleni Liapi, MD, MSc Johns Hopkins University Ken Linkhart Verasonics
SWS Profile FINAL REVISION FOR CONSENSUS STATUS VOTE BSG Final Review-final edits all accepted 3-15-21 - clean copy.docx
Jianwen Luo, PhD Tsinghua University (China) 1140 Ted Lynch, PhD Computerized Imaging Reference Systems, Incorporated (CIRS, Inc.) Andrej Lyshchik, MD, PhD Thomas Jefferson University Hospital Jerry Mabary Echosens (US operations) Michael MacDonald, PhD GE Healthcare (Ultrasound) Ravi A. Managuli, PhD, RDMS Hitachi Medical Corporation; University of Washington 1145 Stephen McAleavey, PhD University of Rochester (NY) Glen McLaughlin, PhD Zonare Medical Systems Martha G. Menchaca, MD University of Illinois (UIC) Chicago Wayne L. Monsky, MD, PhD University of Washington Jaime Morales, MD Instituto Nacional de Perinatología (INPER) (Mexico) 1150 Thomas (Tom) R. Nelson, PhD Retired Kathryn Nightingale, PhD Duke University Svetoslav Nikolov, PhD BK Ultrasound Marcello H. Nogueira-Barbosa, MD, PhD University of São Paulo - Ribeirão Preto School of Medicine (Brazil) 1155 Adrian D. Nunn, PhD Bracco Research USA Nancy Obuchowski, PhD Cleveland Clinic Foundation Arinc Ozturk, MD Harvard-Massachusetts General Hospital Hugo José Paladini, MD Hospital Universitario Fundación Favaloro Mark Palmeri, MD, PhD Duke University 1160 Seong-Hoon Park, MD Wonkwang University School of Medicine (South Korea) Kevin Parker, PhD University of Rochester (NY) Patrick Ploc Gammex, Inc. Nicolas Rognin, MSc, PhD Moffitt Cancer Center Stephen Rosenzweig, PhD Siemens 1165 Jonathan Rubin, MD, PhD University of Michigan Anthony Samir, MD, MPH Massachusetts General Hospital Leah E. Schafer, MD Partners Healthcare Mark Schafer II, PhD Sonic Tech, Inc. Cedric Schmitt, PhD Rheolution, Inc. (Montréal, Canada) 1170 Vijay Shamdasani, PhD Philips James Shin, MD Stony Brook University Medical Center Claude Sirlin, MD University of California, San Diego (UCSD) Gale Sisney, MD University of Wisconsin Bob Spaulding ATS Laboratories, Inc. 1175 Daniel C. Sullivan, MD Duke University Joon Sunwoo, MD, MBA Samsung Electronics Co., Ltd. (South Korea) Mihra S. Taljanovic, MD, PhD University of Arizona Kai E. Thomenius, PhD Consultant Ronald Tosh, PhD National Institute of Standards and Technology (NIST) 1180 Gregg Trahey, PhD Duke University Yao-Sheng Tung, PhD Verasonics Theresa Tuthill, PhD Pfizer Matthew Urban, PhD Mayo Clinic College of Medicine Tomy Varghese, PhD University of Wisconsin, Dept of Medical Physics 1185

SWS Profile FINAL REVISION FOR CONSENSUS STATUS VOTE BSG Final Review-final edits all accepted 3-15-21 - clean copy.docx
Sudhakar Venkatesh, MD Mayo Clinic Michael Wang, PhD, MASc GE Healthcare (Ultrasound) Masaki Watanabe, PhD Canon Medical Systems Keith A. Wear, PhD U.S. Food and Drug Administration (FDA) Thaddeus (Thad) Wilson, PhD, MS* The University of Tennessee Health Science Center 1190 Russ Witte, PhD University of Arizona Hua Xie, PhD Philips Tadashi Yamaguchi, PhD Chiba University, Graduate School of Engineering Dept. of Medical Engineering Shuji Yamamoto, PhD National Cancer Center (Japan) 1195 Zhi Yang Binzhou Medical University Hospital Terry S. Yoo, PhD Center for Drug Evaluation and Research (CDER) Kwon-Ha Yoon, MD, PhD Wonkwang University School of Medicine (South Korea) James A. Zagzebski, PhD University of Wisconsin, School of Medicine & Public Health Heng Zhao, MS, PhD GE Healthcare (Ultrasound) 1200 Haoyan Zhou, MS Case Western University Many of the published papers, proceedings articles and abstracts produced in this effort are referenced in http://qibawiki.rsna.org/index.php/QIBA_in_the_Literature_Citations under the link “QIBA Literature References”. Major contributors to the primary manuscript reporting 1205 much of the SWS US Biomarker Committee’s work were, Mark L. Palmeri and, in alphabetical order, Richard Barr, Paul Carson, Mathieu Couade, Jun Chen, Shigao Chen, Manish Dhyani, Richard Ehman, Brian Garra, Albert Gee , Gilles Guenette , Zaegyoo Hah , Ted Lynch, Michael Macdonald , Ravi Managuli, Veronique Miette , Kathryn R. Nightingale, Nancy Obuchowski, Ned C. Rouze, Anthony E. Samir, Vijay Shamdasani, Matthew Urban, Keith Wear, Hua Xie, Timothy J. Hall. Not in order, they are from: 1210 Duke University, Durham, NC, USA, CIRS, Norfolk, VA, USA, Mayo Clinic, Rochester, MN, USA, Philips Research, Cambridge, MA, USA, Food and Drug Administration, Silver Spring, MD, USA, Siemens Ultrasound, Issaquah, WA, USA, University of Michigan, Ann Arbor, MI, USA, The Surgical Hospital at Southwoods, Boardman, OH, USA, Philips Ultrasound, Bothell, WA, USA, General Electric, Milwaukee, WI, USA, Toshiba Medical Research Institute, Redmond, WA, USA, 1215 Massachusetts General Hospital, Boston, MA, USA, Samsung Medison, Seoul, South Korea, Zonare Medical Systems, Mountain View, CA, USA, The Cleveland Clinic, Cleveland, OH, USA, University of Wisconsin, Madison, WI, USA SuperSonic Imagine, Aix-En-Provence, France Echosens, Paris, France Hitachi Healthcare, Seattle, WA, USA 1220
Appendix B: Background Information
Appendix C: Conventions and Definitions
Appendix D: Model-specific Instructions and Parameters
1225
D.1 Canon
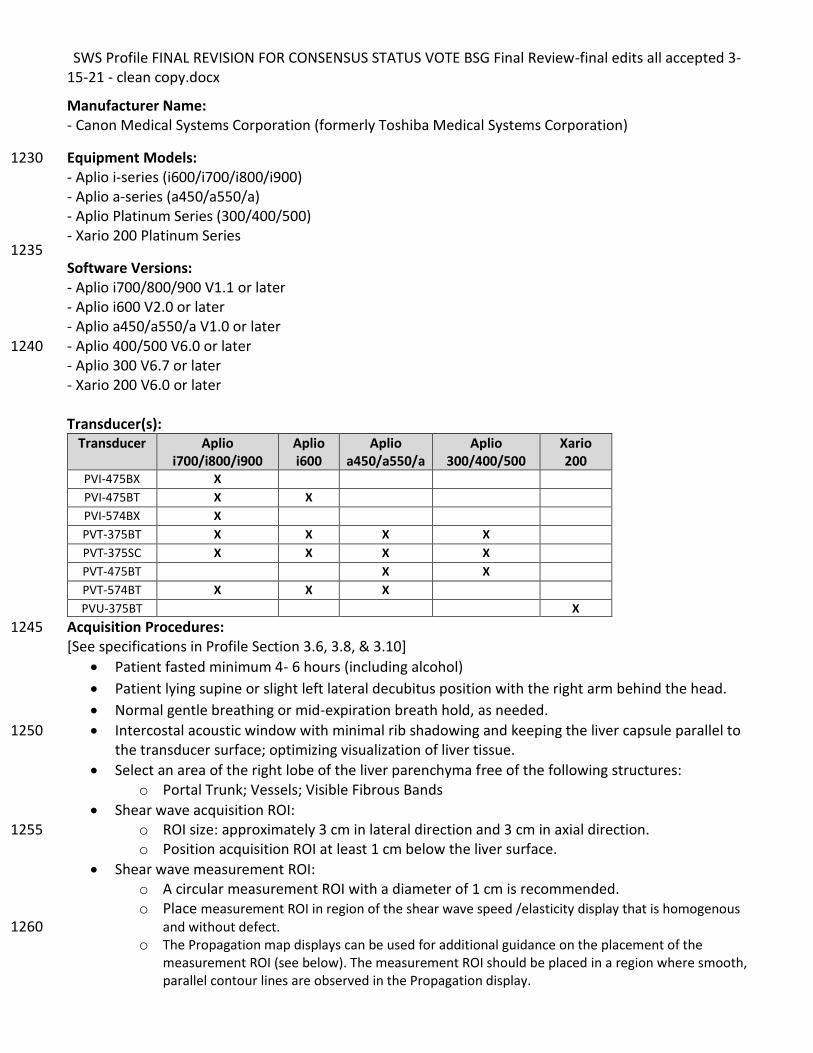
SWS Profile FINAL REVISION FOR CONSENSUS STATUS VOTE BSG Final Review-final edits all accepted 3-15-21 - clean copy.docx
Manufacturer Name: - Canon Medical Systems Corporation (formerly Toshiba Medical Systems Corporation)
Equipment Models: 1230 - Aplio i-series (i600/i700/i800/i900) - Aplio a-series (a450/a550/a) - Aplio Platinum Series (300/400/500) - Xario 200 Platinum Series 1235 Software Versions: - Aplio i700/800/900 V1.1 or later - Aplio i600 V2.0 or later - Aplio a450/a550/a V1.0 or later - Aplio 400/500 V6.0 or later 1240 - Aplio 300 V6.7 or later - Xario 200 V6.0 or later Transducer(s):
Transducer Aplio i700/i800/i900
Aplio i600
Aplio a450/a550/a
Aplio 300/400/500
Xario 200
PVI-475BX X PVI-475BT X X PVI-574BX X PVT-375BT X X X X PVT-375SC X X X X PVT-475BT X X PVT-574BT X X X PVU-375BT X
Acquisition Procedures: 1245 [See specifications in Profile Section 3.6, 3.8, & 3.10]
• Patient fasted minimum 4- 6 hours (including alcohol)
• Patient lying supine or slight left lateral decubitus position with the right arm behind the head.
• Normal gentle breathing or mid-expiration breath hold, as needed.
• Intercostal acoustic window with minimal rib shadowing and keeping the liver capsule parallel to 1250 the transducer surface; optimizing visualization of liver tissue.
• Select an area of the right lobe of the liver parenchyma free of the following structures: o Portal Trunk; Vessels; Visible Fibrous Bands
• Shear wave acquisition ROI: o ROI size: approximately 3 cm in lateral direction and 3 cm in axial direction. 1255 o Position acquisition ROI at least 1 cm below the liver surface.
• Shear wave measurement ROI: o A circular measurement ROI with a diameter of 1 cm is recommended. o Place measurement ROI in region of the shear wave speed /elasticity display that is homogenous
and without defect. 1260 o The Propagation map displays can be used for additional guidance on the placement of the
measurement ROI (see below). The measurement ROI should be placed in a region where smooth, parallel contour lines are observed in the Propagation display.
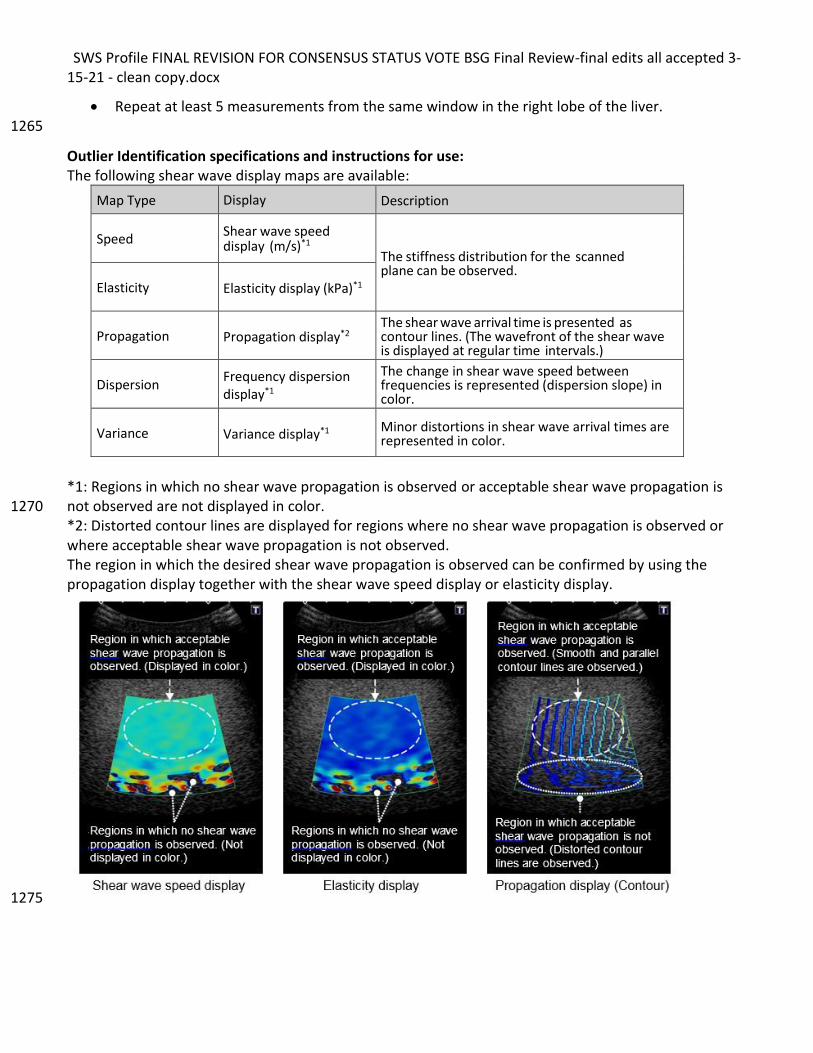
SWS Profile FINAL REVISION FOR CONSENSUS STATUS VOTE BSG Final Review-final edits all accepted 3-15-21 - clean copy.docx
• Repeat at least 5 measurements from the same window in the right lobe of the liver. 1265
Outlier Identification specifications and instructions for use: The following shear wave display maps are available:
Map Type Display Description
Speed Shear wave speed display (m/s)*1
The stiffness distribution for the scanned plane can be observed.
Elasticity Elasticity display (kPa)*1
Propagation Propagation display*2 The shear wave arrival time is presented as contour lines. (The wavefront of the shear wave is displayed at regular time intervals.)
Dispersion Frequency dispersion display*1
The change in shear wave speed between frequencies is represented (dispersion slope) in color.
Variance Variance display*1 Minor distortions in shear wave arrival times are represented in color.
*1: Regions in which no shear wave propagation is observed or acceptable shear wave propagation is not observed are not displayed in color. 1270 *2: Distorted contour lines are displayed for regions where no shear wave propagation is observed or where acceptable shear wave propagation is not observed. The region in which the desired shear wave propagation is observed can be confirmed by using the propagation display together with the shear wave speed display or elasticity display.
1275
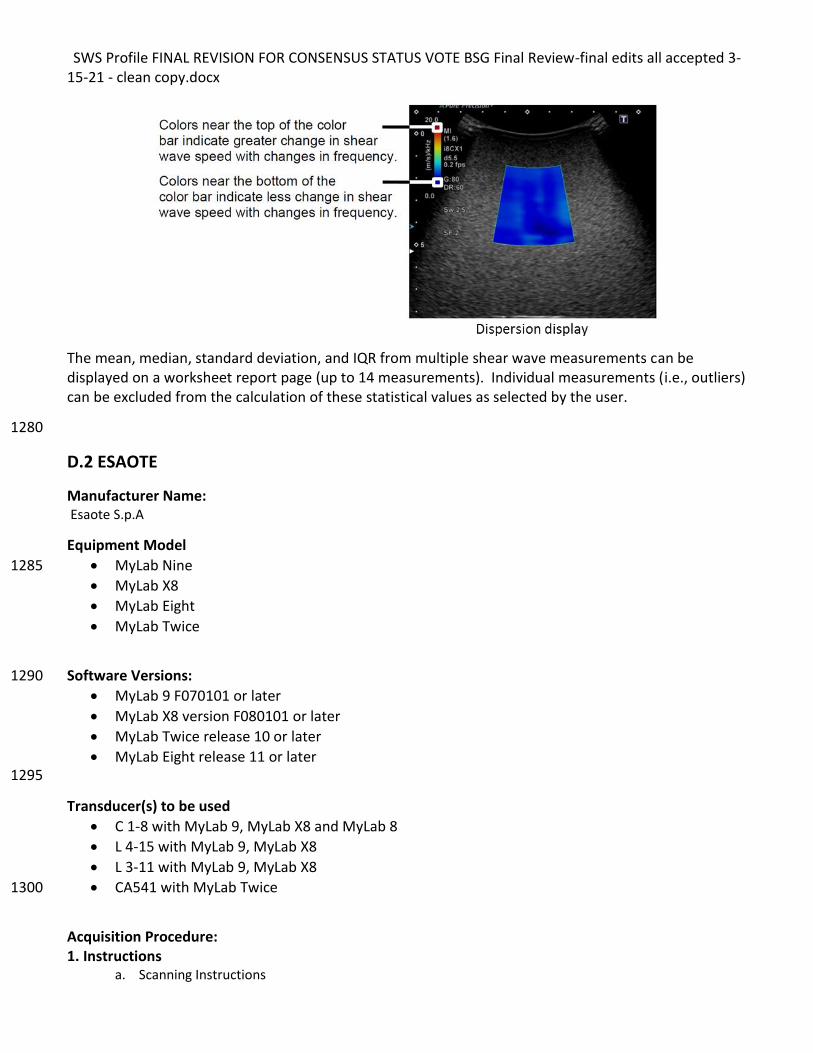
SWS Profile FINAL REVISION FOR CONSENSUS STATUS VOTE BSG Final Review-final edits all accepted 3-15-21 - clean copy.docx
The mean, median, standard deviation, and IQR from multiple shear wave measurements can be displayed on a worksheet report page (up to 14 measurements). Individual measurements (i.e., outliers) can be excluded from the calculation of these statistical values as selected by the user.
1280
D.2 ESAOTE
Manufacturer Name: Esaote S.p.A
Equipment Model
• MyLab Nine 1285
• MyLab X8
• MyLab Eight
• MyLab Twice
Software Versions: 1290
• MyLab 9 F070101 or later
• MyLab X8 version F080101 or later
• MyLab Twice release 10 or later
• MyLab Eight release 11 or later 1295
Transducer(s) to be used
• C 1-8 with MyLab 9, MyLab X8 and MyLab 8
• L 4-15 with MyLab 9, MyLab X8
• L 3-11 with MyLab 9, MyLab X8
• CA541 with MyLab Twice 1300
Acquisition Procedure: 1. Instructions
a. Scanning Instructions
SWS Profile FINAL REVISION FOR CONSENSUS STATUS VOTE BSG Final Review-final edits all accepted 3-15-21 - clean copy.docx
- Recommended fasting of 4 -6 hours 1305 - Right intercostal access has to be used, with the patient in the dorsal decubitus position,
examining the right lobe of the liver (VI/VII segments) .by using the Convex array
- Put the right arm of the patient behind his/her head in order to maximize the intercostal
space.
- The coupling between probe and liver has to be complete (the whole echo image has to be 1310 properly visible) - a correct amount of gel has to be used. Dark areas of the echo image have
to be avoided.
- A correct pressure has to be applied, in order to be stable and to be properly coupled with the
skin over the liver - the pressure shouldn’t be not excessive in order to not compress the liver.
- No respiration during the acquisition, the patient should be asked to stop breathing just for 1315 few seconds in neutral respiratory phase.
b. ROI Positioning
- The ROI has to be positioned in an area free of vessels, bile ducts or nodules. It is
recommended to check also the adjacent planes, not only the one of the ROI. 1320 - The ROI should be positioned about 1 cm below the Glisson capsule to avoid reverberation
artefacts. The optimized depths are between 3 cm and 5 cm.
c. ROI Size
- Point Shear Wave ~ 1.0cm x 1.0 cm 1325 - 2D Shear Wave ~ 2 x 2.5 cm
d. Number of measurements
- Point Shear Wave 10 measurements or more
- 2D Shear Wave 5 measurements or more 1330
2. Pitfalls - Low echogenicity and thick abdominal wall could make weak shear waves
- Modification of the acquisition liver window
- ROI axis not perpendicular to the liver capsule 1335 - Reverberations could generate artefacts
- Some liver diseases may affect the stiffness assessment with SWE technique
Outlier Identification specifications and instruction for use: 1340 Outliers are excluded based on a statistical signal analysis
The users have the possibility to discard some unreliable measurements and proceed to a new acquisition.
In pSWE stiffness assessment, a quality index is indicated side the measurement with a capital letter H for High, M
for Medium and L for Low giving some indication to the user about the reliability of the measurement.
In 2D SWE stiffness assessment, a reliability color map is available, indicating to the user, the areas where the 1345 measurement values are more stable and affordable.
SWS Profile FINAL REVISION FOR CONSENSUS STATUS VOTE BSG Final Review-final edits all accepted 3-15-21 - clean copy.docx
Ultrasound System No fibrosis (F0 – F1) Moderate fibrosis (F 2- F3) Severe Fibrosis (> F4)
MyLab 9 / X8
MyLab Twice / Eight
D.3 General Electric 1350
Manufacturer Name: GE Healthcare Equipment Model: LOGIQ E9, LOGIQ S8 1355 Software Version: R5 and higher on LOGIQ E9, R3 and higher on LOGIQ S8 Transducer(s) to be used: C1-6-D, 9L-D 1360 Acquisition Procedures:
1. Instructions a. ROI positioning: Place Top of Shear Wave box 1-2cm below liver capsule with
middle of the Shear wave box between 3-6cm b. Measurement ROI size: Default measurement caliper size is recommended (Size 1365
= 1.25 cm diameter) c. Number of measurements: 10 measurements
2. Pitfalls: Avoid rib shadows and vessels within the SWE ROI
Outlier Identification specifications and instructions for use: 1370 Scanning Technique for best Shear Wave Results:
• Fasting 4-6 hours
• Patient in supine position
• Elevate Right arm above head 1375 • Scan intercostally with enough pressure to maintain stable contact
• Take measurements in Segment 7 and/or 8 of the liver
• Place Top of Shear Wave box 1-2cm below liver capsule with
• middle of the Shear wave box between 3-6cm for best results o Avoid rib shadows 1380 o Avoid vessels in the Shear Wave region of interest
• Obtain measurement on suspended breath hold, not inspiration
• Acquire at least 10 measurements using caliper tool Locations with inaccurate measurement are not displayed in the SWE color image, and do not 1385 contribute to the quantitative measurement. Best Practice Tips for Acquisition: 1390
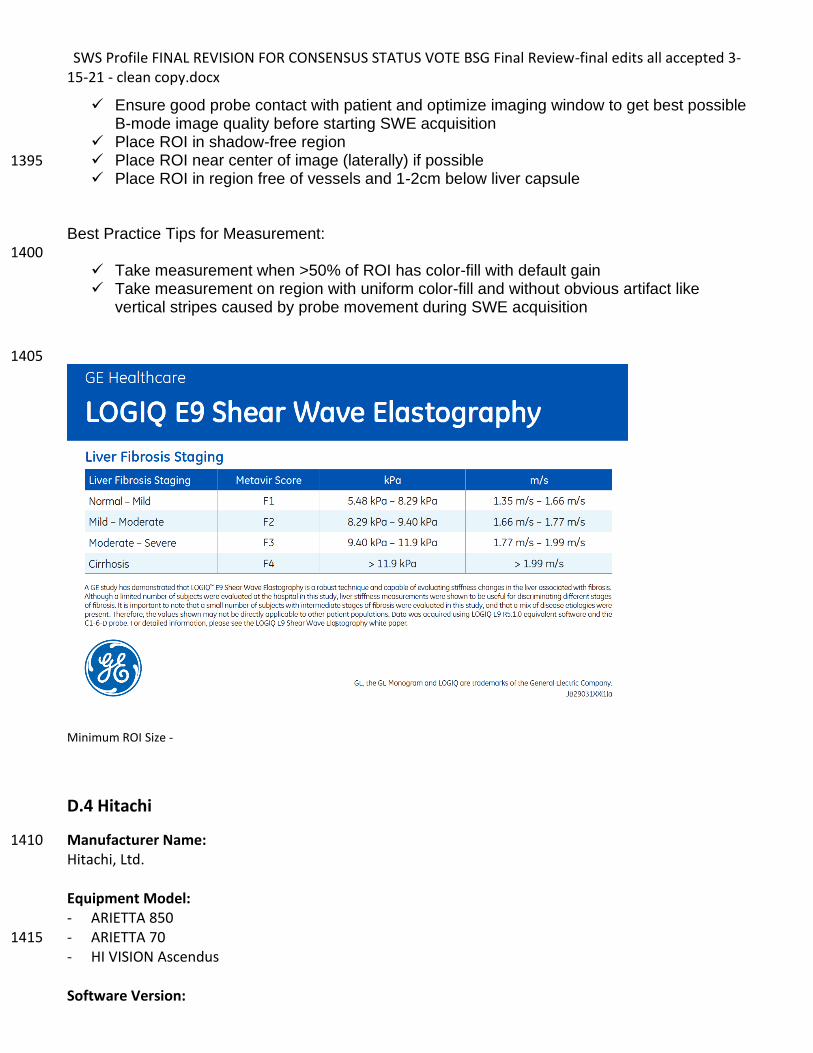
SWS Profile FINAL REVISION FOR CONSENSUS STATUS VOTE BSG Final Review-final edits all accepted 3-15-21 - clean copy.docx
✓ Ensure good probe contact with patient and optimize imaging window to get best possible B-mode image quality before starting SWE acquisition
✓ Place ROI in shadow-free region ✓ Place ROI near center of image (laterally) if possible 1395 ✓ Place ROI in region free of vessels and 1-2cm below liver capsule
Best Practice Tips for Measurement: 1400
✓ Take measurement when >50% of ROI has color-fill with default gain ✓ Take measurement on region with uniform color-fill and without obvious artifact like
vertical stripes caused by probe movement during SWE acquisition
1405
Minimum ROI Size -
D.4 Hitachi
Manufacturer Name: 1410 Hitachi, Ltd. Equipment Model: - ARIETTA 850 - ARIETTA 70 1415 - HI VISION Ascendus Software Version:
SWS Profile FINAL REVISION FOR CONSENSUS STATUS VOTE BSG Final Review-final edits all accepted 3-15-21 - clean copy.docx
- ARIETTA 850 Ver.1 or later - ARIETTA 70 Ver.3 or later 1420 - HI VISION Ascendus Step 4 or later Transducer(s) to be used: - C252 and C251 with ARIETTA 850 - C251 with ARIETTA 70 1425 - C715 with HI VISION Ascendus Acquisition Procedures: 1. Instructions
a. ROI positioning 1430 Same as QIBA profile. See below. • Position the ROI at least 2cm deep to the liver capsule and less than 6.5 cm from the transducer
face. • Position the ROI away from discrete structures such as liver margin, nodules, portal triads or
hepatic veins for acquisition of SWS estimates. 1435 • Position the ROI near the center of the image in the lateral direction and away from the right or
left image margins. b. Measurement ROI size
Fixed ROI size with 10mm width and 15mm depth. c. Number of measurements 1440
10 measurements 2. Pitfalls
Under the following conditions, the generation and/or detection of shear wave will be insufficient. - Low echogenicity - Thick abdominal wall 1445 - Liver capsule non parallel to the abdominal wall or not perpendicular to beams - Place the ROI on rib shadows and/or near the liver capsule - Large body motion by respiration
Outlier Identification specifications and instructions for use: 1450 - Hitachi has a reliability index (VsN). Outliers are excluded using specific Vs range and/or shear wave
signal quality. If VsN equals 0%, all data are outliers and error message is displayed. - IQR/Median is displayed. Users can exclude individual measurements and the statistical values (i.e.
IQR/Median) are automatically updated. (only for ARIETTA 850) 1455
D.5 Philips
Manufacturer Name: Philips Equipment Model: EPIQ 1460 Software Version: Evolution 3.0 Transducer(s) to be used: C5-1 Curvilinear Transducer
SWS Profile FINAL REVISION FOR CONSENSUS STATUS VOTE BSG Final Review-final edits all accepted 3-15-21 - clean copy.docx
1465 Acquisition Procedures: Please refer to Philips “Quick Guide EPIQ Series ElastQ Imaging” for complete instruction
1. Instructions a. ROI positioning
i. Ensure good transducer contact 1470 ii. Before starting shear wave elastography, always scan the region of interest in 2D
mode to assess tissue consistency • Do not position the shear wave imaging region of interest (ROI) box over fetal tissue, tissue with gas pockets (lung, stomach, bowels), a bone tissue boundary, gallstones, metal, or the borders of the image. 1475 • Avoid rib shadow in the image, when possible. • Position the ElastQ Imaging ROI box in the center of the image. • Do not place the ElastQ Imaging ROI box on or near a rib shadow or liver capsule. • Place the top of the ROI box 1.0 to 1.5 cm below the liver capsule, to avoid reverberation artifacts 1480 • Do not place the circle caliper on a rib shadow, blood vessels • Position the circle caliper in the area of the ROI box that displays the majority of the uniform color
• ROI size iii. ElastQ Imaging ROI: maximum size ~5cm (height) x 7 cm (width) 1485 iv. Making stiffness measurement and calculations
1. Default circle caliper size: dimeter 1cm 2. User has the option to calculate the average stiffness in the entire ElastQ
Imaging ROI 3. User has the option to make single point measurements in the ROI 1490 4. Stiffness measurement is also available for areas defined by the user in the
form of ellipse and continuous trace b. Number of measurements
• Take a minimum of 8 to 10 liver stiffness measurements 2. Pitfalls 1495
Outlier Identification specifications and instructions for use: To ensure high quality stiffness measurement, a concurrent real-time confidence map that combines multiple image quality metrics is also available along with the stiffness image. Outliers in stiffness measurement are automatically detected and excluded from subsequent quantification and statistical 1500 analysis. In addition, users are provided with the ratio of stiffness interquartile range (IQR) to median as a measure of variability for further measurement quality control.
D.6 Samsung
Manufacturer Name: 1505 Samsung Medison Co., Ltd. Equipment Model:
SWS Profile FINAL REVISION FOR CONSENSUS STATUS VOTE BSG Final Review-final edits all accepted 3-15-21 - clean copy.docx
- RS80A - RS85 1510
Software Version:
- RS80A v2.0 or later - RS85 v1.0 or later
1515 Transducer(s) to be used:
- RS80A CA1-7A LA2-9A - RS85 1520
CA1-7A LA2-9A
Acquisition Procedures: 1525
Patient position - Supine / oblique left decubitus position is recommended - The right arm would better be elevated to make the intercostal spaces wider - Scan while patients’ holding a normal breath (If not possible, ask the patient to breath as
shallowly as possible) 1530 - Prolonged breath holding should be avoided - Patients should not move during the measurements
Liver segment
- Right hepatic lobe (between 5 and 8 segments from the right intercostal space) is 1535 recommended.
- Avoid the left hepatic lobe because the measurement is affected by cardiac movements. - Segment 4 of the liver is sensitive to the motion artifact. There are more chances of the
failure of measurement. 1540 ROI positioning
- Position the ROI Box neat the homogeneous region
- Position the ROI Box at the suspected lesion without obscuring vessels.
- The ROI must be positioned at least 1.5 cm below the liver capsule.
- To obtain a stable measurements, position the ROI on the same locations and repeat the measurements 1545
- The depth of ROI is recommended 6cm or less (if the depth is more than 6cm, the result may not be
reliable). The bottommost depth should be less than 7cm.
- ROI is recommended to be positioned near the center line.
ROI size 1550
Point shear wave: 1.0cm X 1.0cm S shear wave: 2.5cm X 3.0cm
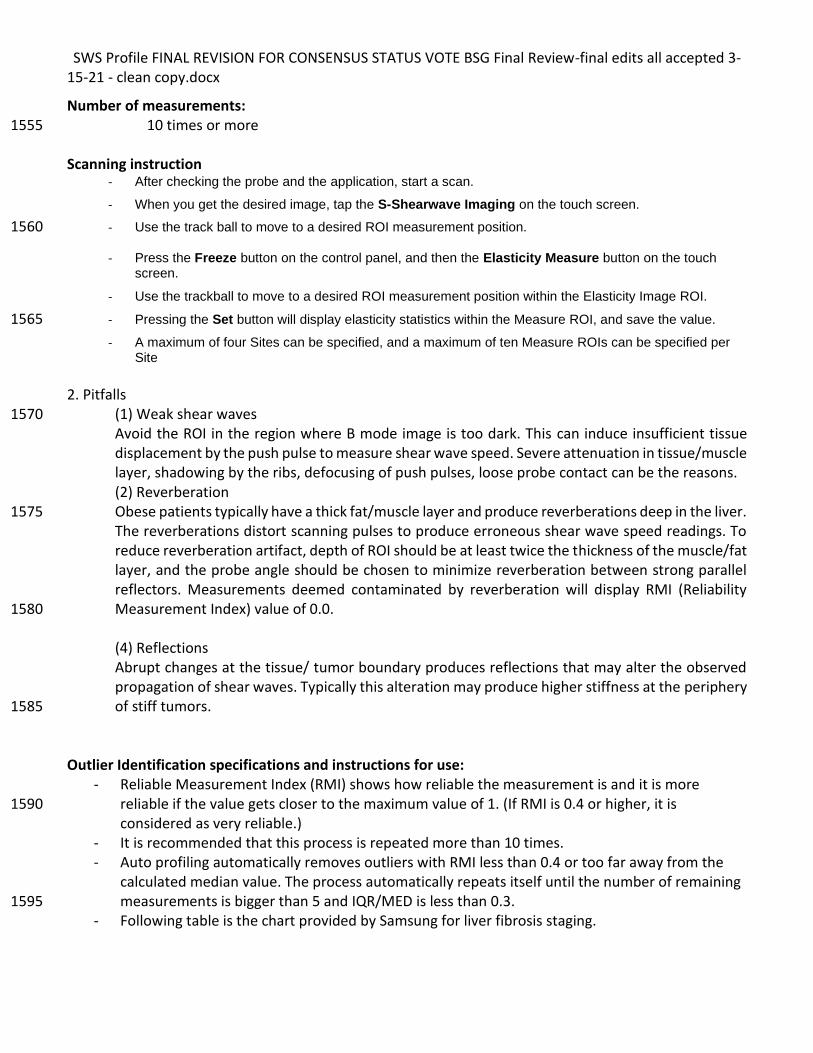
SWS Profile FINAL REVISION FOR CONSENSUS STATUS VOTE BSG Final Review-final edits all accepted 3-15-21 - clean copy.docx
Number of measurements: 10 times or more 1555
Scanning instruction - After checking the probe and the application, start a scan.
- When you get the desired image, tap the S-Shearwave Imaging on the touch screen.
- Use the track ball to move to a desired ROI measurement position. 1560
- Press the Freeze button on the control panel, and then the Elasticity Measure button on the touch screen.
- Use the trackball to move to a desired ROI measurement position within the Elasticity Image ROI.
- Pressing the Set button will display elasticity statistics within the Measure ROI, and save the value. 1565
- A maximum of four Sites can be specified, and a maximum of ten Measure ROIs can be specified per Site
2. Pitfalls
(1) Weak shear waves 1570 Avoid the ROI in the region where B mode image is too dark. This can induce insufficient tissue displacement by the push pulse to measure shear wave speed. Severe attenuation in tissue/muscle layer, shadowing by the ribs, defocusing of push pulses, loose probe contact can be the reasons. (2) Reverberation Obese patients typically have a thick fat/muscle layer and produce reverberations deep in the liver. 1575 The reverberations distort scanning pulses to produce erroneous shear wave speed readings. To reduce reverberation artifact, depth of ROI should be at least twice the thickness of the muscle/fat layer, and the probe angle should be chosen to minimize reverberation between strong parallel reflectors. Measurements deemed contaminated by reverberation will display RMI (Reliability Measurement Index) value of 0.0. 1580 (4) Reflections Abrupt changes at the tissue/ tumor boundary produces reflections that may alter the observed propagation of shear waves. Typically this alteration may produce higher stiffness at the periphery of stiff tumors. 1585
Outlier Identification specifications and instructions for use:
- Reliable Measurement Index (RMI) shows how reliable the measurement is and it is more reliable if the value gets closer to the maximum value of 1. (If RMI is 0.4 or higher, it is 1590 considered as very reliable.)
- It is recommended that this process is repeated more than 10 times. - Auto profiling automatically removes outliers with RMI less than 0.4 or too far away from the
calculated median value. The process automatically repeats itself until the number of remaining measurements is bigger than 5 and IQR/MED is less than 0.3. 1595
- Following table is the chart provided by Samsung for liver fibrosis staging.
SWS Profile FINAL REVISION FOR CONSENSUS STATUS VOTE BSG Final Review-final edits all accepted 3-15-21 - clean copy.docx
1600
D.7 Siemens
Manufacturer Name: Siemens Medical Solutions, USA, Inc. Equipment Model: 1605 ACUSON Sequoia ACUSON S2000, S3000 Software Version: ACUSON Sequoia: VA10A or later 1610 ACUSON Redwood ACUSON Juniper VA10A or later ACUSON S2000, S3000: VC20A or later Transducer(s) to be used: 1615 ACUSON Sequoia: 5C1, DAX, 4V1, 10L4 ACUSON S2000, S3000: 6C1HD, 4C1, 4V1 Acquisition Procedures: Follow cross-vendor recommendations in Profile 1620 Best Practice Techniques
• Patient has fasted for a minimum of 4-6 hours
• Position patient supine or slight (30°) left lateral decubitus position with right arm raised above head 1625
• Scan with the transducer parallel to ribs and in an intercostal space in the right lobe of the liver (segments 5 or 8)
• Optimize B-mode image so liver parenchyma is bright and large vessels, bile ducts and rib shadows are avoided
1630 Activate Virtual Touch from the Abdomen exam preset
• ACUSON Sequoia o Press VT button on control panel o Select pSWE for point Shear Wave Elastography or SWE for 2D Shear Wave
Elastography 1635
• ACUSON S2000 and S3000 systems
SWS Profile FINAL REVISION FOR CONSENSUS STATUS VOTE BSG Final Review-final edits all accepted 3-15-21 - clean copy.docx
o Press E button on control panel o Select VTQ (Virtual Touch Quantification) on the touch screen
Position the Region of Interest (ROI) 1640
• Position the ROI between 3–6 cm deep and at least 1–2 cm below liver capsule
• To position the ROI, roll the trackball
• In SWE, if desired, press Set key and roll trackball to resize the ROI Perform Acquisition 1645
• Perform acquisition during suspended respiration, neither deep inspiration nor expiration; patient may resume normal breathing after audible “beep” is heard
• To begin acquisition, press Update on the control panel; an audible tone indicates when the acquisition ends
1650 Store Measurement Result
• ACUSON Sequoia pSWE o The Liver Site 1 label is automatically selected; change the measurement
label if desired on the touch screen o Press Image to store an image, or Press right or left Set key to store the 1655
measurement without storing an image
• ACUSON Sequoia SWE o Press Caliper to enter measurement workflow o Select desired measurement label on the touch screen o Roll the trackball to position measurement caliper 1660 o If needed, rotate ROI Diameter control to resize measurement caliper o Press Image to store an image, or Press right or left Set key to store the
measurement without storing an image
• ACUSON S2000 and S3000 systems o Select desired measurement label on the touch screen 1665 o Press Image to store an image, or Press right or left Set key to store the
measurement without storing an image Study Conclusion
• Acquire and store 10 total valid measurements at the same imaging location 1670
• Select Report on left side of touch screen
• Ensure IQR/Median is less than 0.3 Outlier Identification specifications and instructions for use: The ACUSON Sequoia pSWE and ACUSON S2000/S3000 VTQ measurements display X.XX m/s when the 1675 threshold for measurement quality was not reached. Users should discard those measurements and repeat the acquisition until the system displays a numerical value. The ACUSON Sequoia SWE image provides a Quality map to confirm that shear wave generation was adequate and identify regions of the shear wave image where shear wave velocity or elasticity 1680 estimations may be incorrect due to poor shear wave signal quality. To view the quality map, rotate the Shear Wave control from Velocity to Quality. The measurement caliper should be placed in regions of
SWS Profile FINAL REVISION FOR CONSENSUS STATUS VOTE BSG Final Review-final edits all accepted 3-15-21 - clean copy.docx
the highest visible quality and near the center of the acquisition ROI. Ensure overall IQR/Median ratio for acquired measurements is less than 0.3 as provided in the patient 1685 report.
D.8 Supersonic Imagine
Manufacturer Name: SuperSonic Imagine 1690 Equipment Model: Aixplorer® Software Version: 1695 Most recent version released: V11.1.1 Transducer(s) to be used: SC6-1 from version V3.0 to V11.1 XC6-1 from version V9.3.1 to V11.1 1700
1. Number of values averaged for each pixel in the color image: The number of values averaged for each pixel depends on imaging parameters. Operator-adjustable parameters are: 1705 - Map persistence: the operator can change the number of frames averaged from 1 to 3 - Map smoothing: this spatial filtering uses sizeable 2D areas to calculate and display one pixel
value on the color image. The size of this 2D area ranges from 3x3 to 19x19, the default size being 11x11 values.
1710 2. Average Variance per pixel:
Acquisition Procedures:
3. Instructions – Pre-requisites 1715 Optimal acoustic window should be found, assessed on grayscale imaging, prior to engaging SWE™ Mode by appropriate patient’s positioning and proper probe holding.
a. Patient’s positioning: i. Patient is placed in supine position to favor acquisitions and measurements on the
right liver lobe 1720 ii. Right arm in maximum abduction
iii. Change to left lateral decubitus only when necessary b. Probe holding
i. Acquisitions and measurements should be preferably performed on the right liver lobe via intercostal access 1725
ii. Probe should be placed parallel to the intercostal space to avoid shadowing from the ribs
SWS Profile FINAL REVISION FOR CONSENSUS STATUS VOTE BSG Final Review-final edits all accepted 3-15-21 - clean copy.docx
iii. Probe should be held orthogonal to the liver capsule to maximize ultrasound transmission, shear wave generation and shear wave propagation recording
iv. When scanning intercostally, extra pressure should be applied on the probe to: 1730 1. Enlarge intercostal space 2. Decrease subcutaneous fat thickness 3. Ensure optimal contact between the probe and patient’s thoracic wall
Image stabilization must be achieved before freezing the image 1735 - Motion from the operator and the probe must be avoided - Appropriate patient’s normal breath hold for 3-4 seconds must be achieved
4. Instructions – SWE Acquisition
a. ROI positioning 1740 i. The colored SWE Box should be positioned:
1. At a minimum depth of 2 cm from the liver capsule, 2. Ideally enabling measurements between 3 to 7 cm in depth, 3. Over morphologically homogeneous, vessel-free, liver parenchyma
ii. The Q-Box™ ROI should be placed: 1745 1. In the central area of the SWE Box; borders of the SWE Box should be
avoided. 2. Over an area of relative homogeneous elasticity, avoiding recognizable
artifacts 3. From V10.0, use the stability index to reject any location for which the SI 1750
would be < 90%
b. ROI size [See specifications in Profile Section 3.10.2] The SWE default settings have been optimized for the assessment of liver fibrosis. Default settings should be used first, and adjusted only when necessary. 1755
i. The default size of the SWE Box is 2 cm in height and 3 cm in width. ii. The default size of the Q-Box ROI may be enlarged to encompass the largest
quantification area possible, while ensuring no vessels, no parenchyma heterogeneity and no artifact are included.
1760 c. Number of measurements
i. Because of the large amount of SWS measurements included in 1 Q-Box ROI, a total number of 3 valid measurements* performed on 3 independent valid acquisitions are recommended.
ii. The average value of 3 valid measurements* can be considered as the estimation 1765 of SWS for a given patient.
* Invalid measurements obtained with XC6-1 probe from V10.0 must be defined as measurements obtained with a Stability Index < 90%. Invalid measurements obtained with SC6-1, regardless of software version, or XC6-1 probe before V10.0 software release must be defined as measurements obtained from unstable SWE map evaluated as non-reliable acquisitions. 1770
5. Pitfalls a. Usual limitations of conventional ultrasound apply to SWE™ mode
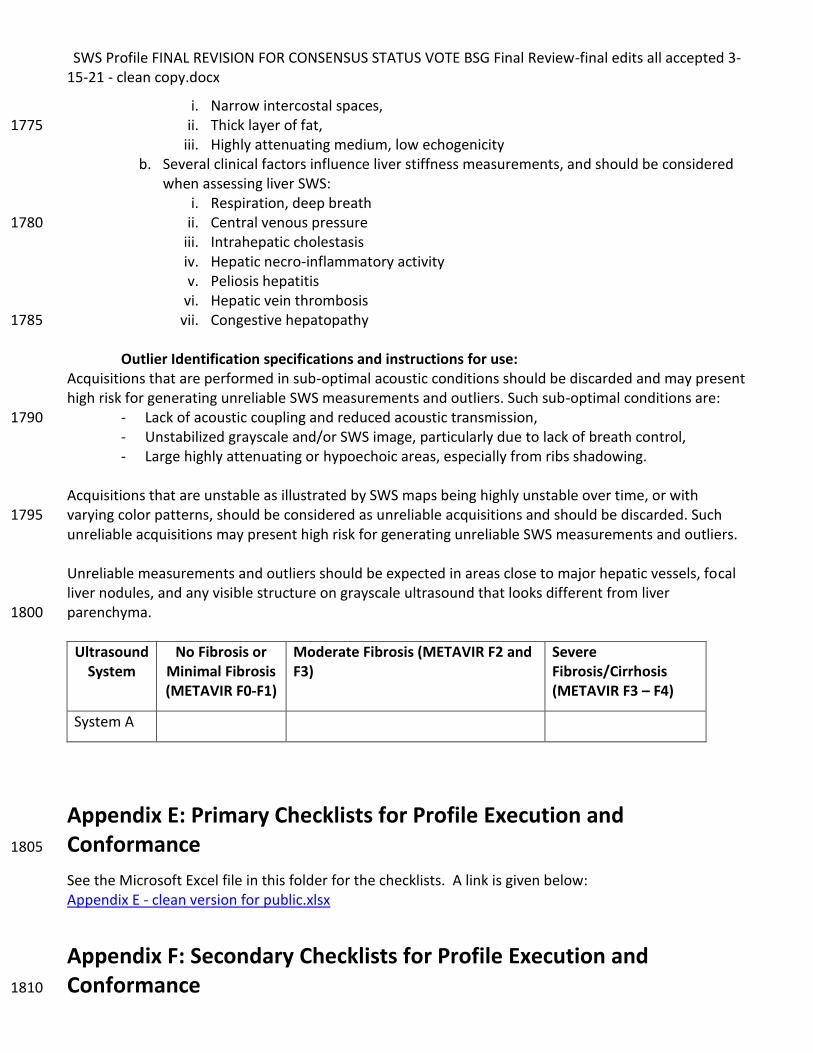
SWS Profile FINAL REVISION FOR CONSENSUS STATUS VOTE BSG Final Review-final edits all accepted 3-15-21 - clean copy.docx
i. Narrow intercostal spaces, ii. Thick layer of fat, 1775
iii. Highly attenuating medium, low echogenicity b. Several clinical factors influence liver stiffness measurements, and should be considered
when assessing liver SWS: i. Respiration, deep breath
ii. Central venous pressure 1780 iii. Intrahepatic cholestasis iv. Hepatic necro-inflammatory activity v. Peliosis hepatitis
vi. Hepatic vein thrombosis vii. Congestive hepatopathy 1785
Outlier Identification specifications and instructions for use:
Acquisitions that are performed in sub-optimal acoustic conditions should be discarded and may present high risk for generating unreliable SWS measurements and outliers. Such sub-optimal conditions are:
- Lack of acoustic coupling and reduced acoustic transmission, 1790 - Unstabilized grayscale and/or SWS image, particularly due to lack of breath control, - Large highly attenuating or hypoechoic areas, especially from ribs shadowing.
Acquisitions that are unstable as illustrated by SWS maps being highly unstable over time, or with varying color patterns, should be considered as unreliable acquisitions and should be discarded. Such 1795 unreliable acquisitions may present high risk for generating unreliable SWS measurements and outliers. Unreliable measurements and outliers should be expected in areas close to major hepatic vessels, focal liver nodules, and any visible structure on grayscale ultrasound that looks different from liver parenchyma. 1800
Ultrasound System
No Fibrosis or Minimal Fibrosis (METAVIR F0-F1)
Moderate Fibrosis (METAVIR F2 and F3)
Severe Fibrosis/Cirrhosis (METAVIR F3 – F4)
System A
Appendix E: Primary Checklists for Profile Execution and Conformance 1805
See the Microsoft Excel file in this folder for the checklists. A link is given below: Appendix E - clean version for public.xlsx
Appendix F: Secondary Checklists for Profile Execution and Conformance 1810
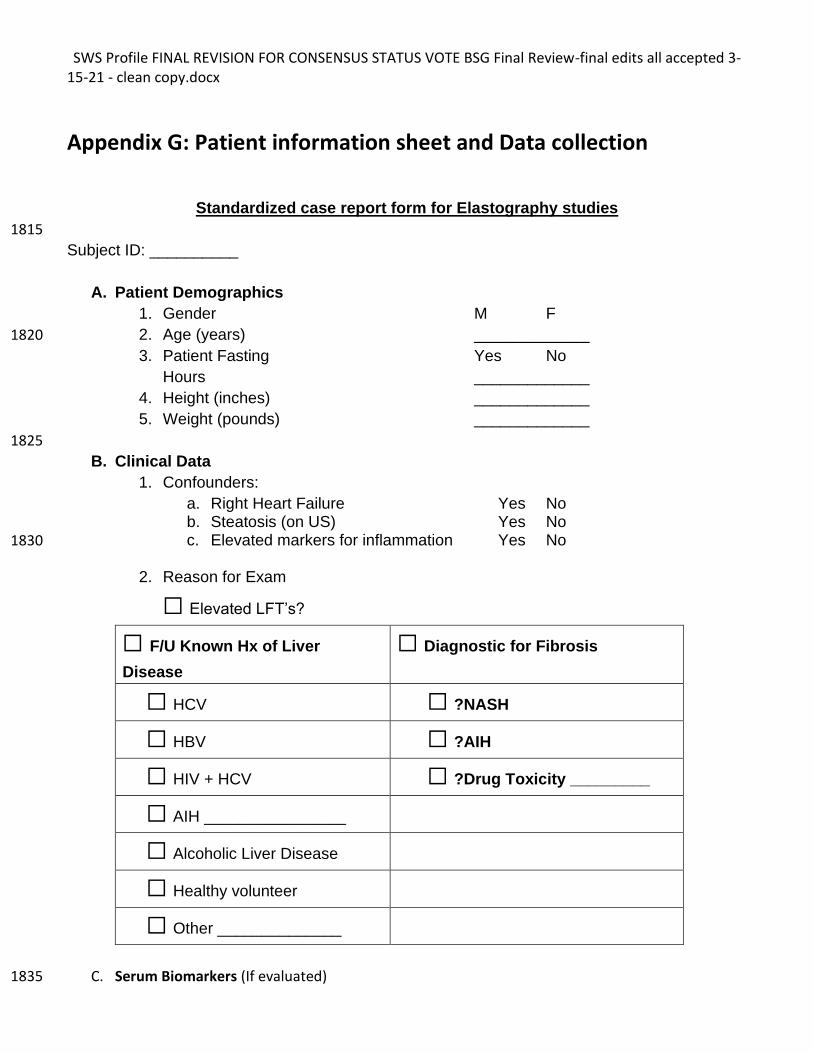
SWS Profile FINAL REVISION FOR CONSENSUS STATUS VOTE BSG Final Review-final edits all accepted 3-15-21 - clean copy.docx
Appendix G: Patient information sheet and Data collection
Standardized case report form for Elastography studies
1815
Subject ID: __________
A. Patient Demographics
1. Gender M F
2. Age (years) _____________ 1820
3. Patient Fasting Yes No
Hours _____________
4. Height (inches) _____________
5. Weight (pounds) _____________
1825
B. Clinical Data
1. Confounders:
a. Right Heart Failure Yes No b. Steatosis (on US) Yes No c. Elevated markers for inflammation Yes No 1830
2. Reason for Exam
☐ Elevated LFT’s?
☐ F/U Known Hx of Liver
Disease
☐ Diagnostic for Fibrosis
☐ HCV ☐ ?NASH
☐ HBV ☐ ?AIH
☐ HIV + HCV ☐ ?Drug Toxicity _________
☐ AIH ________________
☐ Alcoholic Liver Disease
☐ Healthy volunteer
☐ Other ______________
C. Serum Biomarkers (If evaluated) 1835
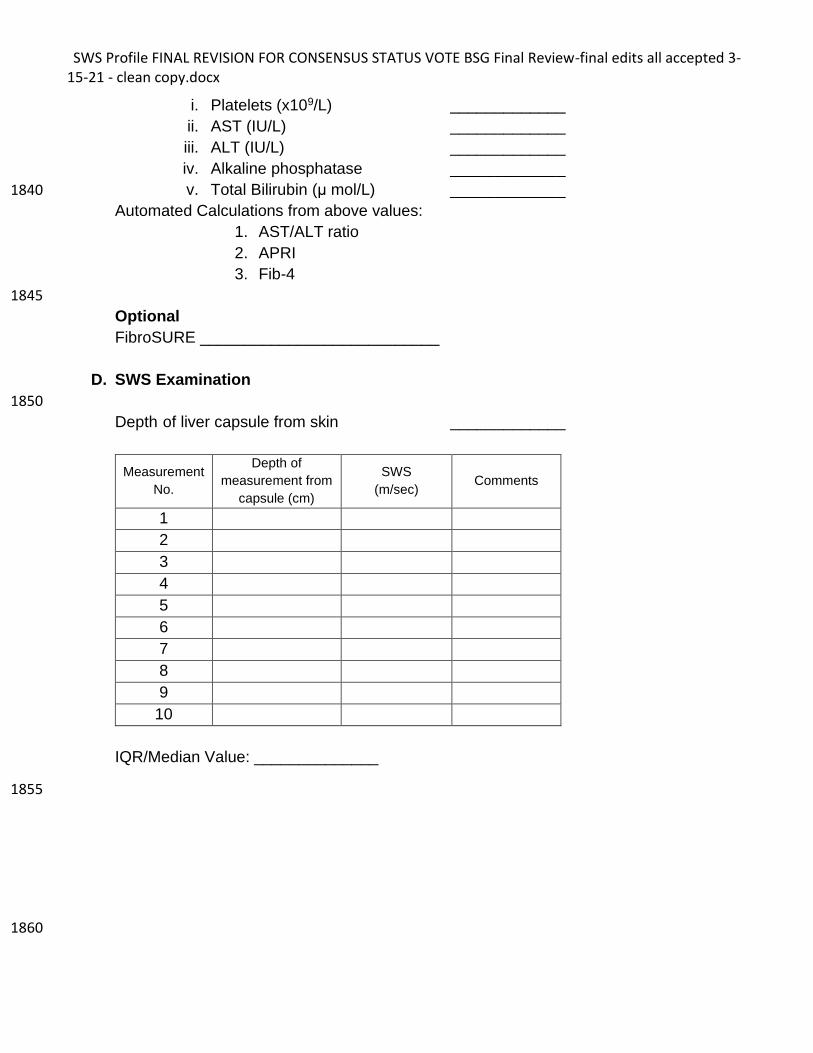
SWS Profile FINAL REVISION FOR CONSENSUS STATUS VOTE BSG Final Review-final edits all accepted 3-15-21 - clean copy.docx
i. Platelets (x109/L) _____________
ii. AST (IU/L) _____________
iii. ALT (IU/L) _____________
iv. Alkaline phosphatase _____________
v. Total Bilirubin (μ mol/L) _____________ 1840
Automated Calculations from above values:
1. AST/ALT ratio
2. APRI
3. Fib-4
1845
Optional
FibroSURE ___________________________
D. SWS Examination
1850
Depth of liver capsule from skin _____________
Measurement
No.
Depth of
measurement from
capsule (cm)
SWS
(m/sec) Comments
1
2
3
4
5
6
7
8
9
10
IQR/Median Value: ______________
1855
1860
SWS Profile FINAL REVISION FOR CONSENSUS STATUS VOTE BSG Final Review-final edits all accepted 3-15-21 - clean copy.docx
References
References (Steatosis has no effect): 1. Yoneda M, Mawatari H, Fujita K, Endo H, Nozaki Y, Yonemitsu K, et al. Noninvasive
assessment of liver fibrosis by measurement of stiffness in patients with nonalcoholic fatty liver disease (NAFLD). Dig Liver Dis [Internet]. 2008 May; 40(5):371–8. Available from:http://eutils.ncbi.nlm.nih.gov/entrez/eutils/elink.fcgi?dbfrom=pubmed&id=18083083&retmode=ref&cmd=prlinks
2. Friedrich-Rust M, Wunder K, Kriener S, Sotoudeh F, Richter S, Bojunga J, et al. Liver fibrosis in viral hepatitis: noninvasive assessment with acoustic radiation force impulse imaging versus transient elastography. Radiology. 2009 Aug;252(2):595–604.
3. Lupsor M, Badea R, Stefanescu H, Sparchez Z, Branda H, Serban A, et al. Performance of a new elastographic method (ARFI technology) compared to unidimensional transient elastography in the noninvasive assessment of chronic hepatitis C. Preliminary results. J Gastrointestin Liver Dis. 2009 Sep;18(3):303–10.
4. Fierbinteanu-Braticevici C, Andronescu D, Usvat R, Cretoiu D, Baicus C, Marinoschi G. Acoustic radiation force imaging sonoelastography for noninvasive staging of liver fibrosis. World J Gastroenterol [Internet]. 2009 ed. 2009 Nov 28;15(44):5525–32. Availablefrom:http://eutils.ncbi.nlm.nih.gov/entrez/eutils/elink.fcgi?dbfrom=pubmed&id=19938190&retmode=ref&cmd=prlinks
5. Bota S, Sporea I, Sirli R, Popescu A, Danila M, Sendroiu M. Factors that influence the correlation of acoustic radiation force impulse (ARFI), elastography with liver fibrosis. Medical ultrasonography. 2011 Jun;13(2):135–40.
6. Rifai K, Cornberg J, Mederacke I, Bahr MJ, Wedemeyer H, Malinski P, et al. Clinical feasibility of liver elastography by acoustic radiation force impulse imaging (ARFI). Dig Liver Dis [Internet]. 2011 Jun;43(6):491–7. Available from: http://linkinghub.elsevier.com/retrieve/pii/S1590865811000752
7. Palmeri ML, Wang MH, Rouze NC, Abdelmalek MF, Guy CD, Moser B, et al. Noninvasive evaluation of hepatic fibrosis using acoustic radiation force-based shear stiffness in patients with nonalcoholic fatty liver disease. J Hepatol. 2011 Sep;55(3):666–72.
8. Motosugi U, Ichikawa T, Niitsuma Y, Araki T. Acoustic radiation force impulse elastography of the liver: can fat deposition in the liver affect the measurement of liver stiffness? Japanese journal of radiology. 2011 Sep 29;29(9):639–43.
9. Ebinuma H, Saito H, Komuta M, Ojiro K, Wakabayashi K, Usui S, et al. Evaluation of liver fibrosis by transient elastography using acoustic radiation force impulse: comparison with Fibroscan((R)). J Gastroenterol. 2011 Oct;46(10):1238–48.
10. Rizzo L, Calvaruso V, Cacopardo B, Alessi N, Attanasio M, Petta S, et al. Comparison
SWS Profile FINAL REVISION FOR CONSENSUS STATUS VOTE BSG Final Review-final edits all accepted 3-15-21 - clean copy.docx
of transient elastography and acoustic radiation force impulse for non-invasive staging of liver fibrosis in patients with chronic hepatitis C. Am J Gastroenterol. 2011 Dec;106(12):2112–20.
11. Chen S-H, Li Y-F, Lai H-C, Kao J-T, Peng C-Y, Chuang P-H, et al. Effects of patient factors on noninvasive liver stiffness measurement using acoustic radiation force impulse elastography in patients with chronic hepatitis C. BMC Gastroenterology [Internet]. 2012;12(105):105. Available from: http://eutils.ncbi.nlm.nih.gov/entrez/eutils/elink.fcgi?dbfrom=pubmed&id=22877310&retmode=ref&cmd=prlinks
12. Guzmán-Aroca F, Frutos-Bernal MD, Bas A, Luján-Mompeán JA, Reus M, Berná-Serna J de D, et al. Detection of non-alcoholic steatohepatitis in patients with morbid obesity before bariatric surgery: preliminary evaluation with acoustic radiation force impulse imaging. Eur Radiol. 2012 Nov;22(11):2525–32.
13. Ferraioli G, Tinelli C, Dal Bello B, Zicchetti M, Filice G, Filice C, et al. Accuracy of real-time shear wave elastography for assessing liver fibrosis in chronic hepatitis C: a pilot study. Hepatology. 2012 Dec;56(6):2125–33.
14. Bota S, Sporea I, Sirli R, Popescu A, Jurchis A. Factors which influence the accuracy of acoustic radiation force impulse (ARFI) elastography for the diagnosis of liver fibrosis in patients with chronic hepatitis C. Ultrasound Med Biol. 2013 Mar;39(3):407–12.
15. Friedrich-Rust M, Buggisch P, de Knegt RJ, Dries V, Shi Y, Matschenz K, et al. Acoustic radiation force impulse imaging for non-invasive assessment of liver fibrosis in chronic hepatitis B. J Viral Hepat. 2013 Apr;20(4):240–7.
16. Poynard T, Munteanu M, Luckina E, Perazzo H, Ngo Y, Royer L, et al. Liver fibrosis evaluation using real-time shear wave elastography: applicability and diagnostic performance using methods without a gold standard. J Hepatol. 2013 May;58(5):928–35.
17. Tomita H, Hoshino K, Fuchimoto Y, Ebinuma H, Ohkuma K, Tanami Y, et al. Acoustic radiation force impulse imaging for assessing graft fibrosis after pediatric living donor liver transplantation: A pilot study. Liver transplantation: official publication of the American Association for the Study of Liver Diseases and the International Liver Transplantation Society. 2013 Sep 21;19(11):1202–13.
References (Inflammation affects SWS):
1. Friedrich-Rust M, Wunder K, Kriener S, Sotoudeh F, Richter S, Bojunga J, et al. Liver fibrosis in viral hepatitis: noninvasive assessment with acoustic radiation force impulse imaging versus transient elastography. Radiology. 2009 Aug;252(2):595–604.
2. Lupsor M, Badea R, Stefanescu H, Sparchez Z, Branda H, Serban A, et al. Performance of a new elastographic method (ARFI technology) compared to unidimensional transient elastography in the noninvasive assessment of chronic hepatitis C. Preliminary results. J Gastrointestin Liver Dis. 2009 Sep;18(3):303–10.
SWS Profile FINAL REVISION FOR CONSENSUS STATUS VOTE BSG Final Review-final edits all accepted 3-15-21 - clean copy.docx
3. Takahashi H, Ono N, Eguchi Y, Eguchi T, Kitajima Y, Kawaguchi Y, et al. Evaluation
of acoustic radiation force impulse elastography for fibrosis staging of chronic liver disease: a pilot study. Liver Int. Blackwell Publishing Ltd; 2010 Apr;30(4):538–45.
4. Rifai K, Cornberg J, Mederacke I, Bahr MJ, Wedemeyer H, Malinski P, et al. Clinical feasibility of liver elastography by acoustic radiation force impulse imaging (ARFI). Dig Liver Dis. 2011 Jun;43(6):491–7.
5. Ebinuma H, Saito H, Komuta M, Ojiro K, Wakabayashi K, Usui S, et al. Evaluation of liver fibrosis by transient elastography using acoustic radiation force impulse: comparison with FibroScan(®). J Gastroenterol. 2011 Oct;46(10):1238–48.
6. Chen S-H, Li Y-F, Lai H-C, Kao J-T, Peng C-Y, Chuang P-H, et al. Effects of patient factors on noninvasive liver stiffness measurement using acoustic radiation force impulse elastography in patients with chronic hepatitis C. BMC Gastroenterology. BioMed Central Ltd; 2012;12(1):105.
7. Yoon KT, Lim SM, Park JY, Kim DY, Ahn SH, Han K-H, et al. Liver stiffness measurement using acoustic radiation force impulse (ARFI) elastography and effect of necroinflammation. Dig Dis Sci. Springer US; 2012 Jun;57(6):1682–91.
8. Guzmán-Aroca F, Frutos-Bernal MD, Bas A, Luján-Mompeán JA, Reus M, Berná-Serna J de D, et al. Detection of non-alcoholic steatohepatitis in patients with morbid obesity before bariatric surgery: preliminary evaluation with acoustic radiation force impulse imaging. Eur Radiol. Springer-Verlag; 2012 Nov;22(11):2525–32.
9. Sporea I, Bota S, Peck-Radosavljevic M, Sirli R, Tanaka H, Iijima H, et al. Acoustic Radiation Force Impulse elastography for fibrosis evaluation in patients with chronic hepatitis C: an international multicenter study. Eur J Radiol. 2012 Dec;81(12):4112–8.
10. Potthoff A, Attia D, Pischke S, Kirschner J, Mederacke I, Wedemeyer H, et al. Influence of different frequencies and insertion depths on the diagnostic accuracy of liver elastography by acoustic radiation force impulse imaging (ARFI). Eur J Radiol. 2013 Aug;82(8):1207–12.
11. Bota S, Sporea I, Peck-Radosavljevic M, Sirli R, Tanaka H, Iijima H, et al. The influence of aminotransferase levels on liver stiffness assessed by Acoustic Radiation Force Impulse Elastography: a retrospective multicentre study. Dig Liver Dis. 2013 Sep;45(9):762–8.
12. Fierbinteanu-Braticevici C, Sporea I, Panaitescu E, Tribus L. Value of acoustic radiation force impulse imaging elastography for non-invasive evaluation of patients with nonalcoholic fatty liver disease. Ultrasound Med Biol. 2013 Nov;39(11):1942–50.
13. Takaki S, Kawakami Y, Miyaki D, Nakahara T, Naeshiro N, Murakami E, et al. Non-invasive liver fibrosis score calculated by combination of virtual touch tissue quantification and serum liver functional tests in chronic hepatitis C patients. Hepatol Res. 2014 Mar;44(3):280–7.
14. [Reference - IEC 61391-2: Ultrasonics – Pulse-echo scanners – Part 2:

SWS Profile FINAL REVISION FOR CONSENSUS STATUS VOTE BSG Final Review-final edits all accepted 3-15-21 - clean copy.docx
Measurement of maximum depth of penetration and local dynamic range. 2010, Int Electrotechnical Comm: Geneva.]
<Not sure how to do two TOC, so left this one out and made vendors Heading 2 so they appear in the overall TOC>
Related Documents

![Ultrasound shear wave elastography for assessing diaphragm ......ultrasound (US) as it provides direct visualization of muscle structure and functioning [15]. Diaphragm US is an interesting](https://static.cupdf.com/doc/110x72/611e5e1c752520518346b7c6/ultrasound-shear-wave-elastography-for-assessing-diaphragm-ultrasound-us.jpg)


