4/11/2012 1 QIBA Elastography a Clinical Perspective QIBA Elastography a Clinical Perspective David Cosgrove Imaging Sciences Imperial College London 2 Breast and Liver

Welcome message from author
This document is posted to help you gain knowledge. Please leave a comment to let me know what you think about it! Share it to your friends and learn new things together.
Transcript

4/11/2012
1
QIBA Elastography
a Clinical Perspective
QIBA Elastography
a Clinical Perspective
David CosgroveImaging SciencesImperial College
London
2
Breast and Liver

4/11/2012
2
3
Strain Elastography Breast
extensively studied
essentially qualitative
quantitation of stiffness relative to adjacent fat
concern on reproducibility
4

4/11/2012
3
5
Hitachi
6
Kiel Group129 B, 64 M
Hitachi system
Tsukuba score 1–5
FNA cytology
M 4.1±0.9
B 2.1±1.0
Spec 96%
Sens 58%
Schaefer et al, Eu J Radiol 2009

4/11/2012
4
Carcinoma
Schaefer et al, Eu J Radiol 2009
Elasto Az 0.884
B-mode Az 0.820
(p<0.001) Schaefer et al, Eu J Radiol 2009

4/11/2012
5
9
Conclusion
•“elastography has not the potential
to replace conventional B-mode for
the detection of breast cancer, but
can complement conventional US to
improve the diagnostic
performance.”
Schaefer et al, Eu J Radiol 2009
10
SWE Breast
images are quantitative
ROI give values in m/s or kPa
minimal operator input
good reproducibility
currently SuperSonic Imagine only
Siemens liver system in beta
other companies have work in progress

4/11/2012
6
11
BE 1 Study
1800 patients
multicentre, USA and Europe
initial analysis for reproducibilityand power to regrade BI-RADS 3 and 4a
rich data base for additional analysis
12
Carcinoma
7

4/11/2012
7
13
Fibro-cystic ChangeANDI
14
Scatterplot of E Mean
20 30 40 50 60 70 80 90 100age (years)

4/11/2012
8
15
Fat Stiffness Changes
trend to an increase in stiffness with age
c 10% per decade
small increase close to cancers
c 3%
16
BE1 Reproducibility758 masses
qualitative: 3 images ≥ “reasonably similar” for 88%
intra-observer reliabilities for mass diameter, perimeter, and area “almost perfect” (ICC ≥ 0.94)
intra-observer reliability for Emax and Emean “almost perfect” (ICC = 0.84 and 0.87) and “substantial” for the mass-to-fat SWE ratio (ICC = 0.77)
inter-observer agreement “moderate” for SWE homogeneity (κ = 0.57) and “substantial” for visual assessment of maximum elasticity (κ = 0.66)
Caroline Doré, biomedical statistician

4/11/2012
9
19
BE1 Resultssingle SWE features added to
BI-RADS scores
SWE feature Az
None (Reference test) 0.7159
SWE shape 0.8103
SWE vs B Shape similarity 0.8196
SWE homogeneity 0.8473
SWE/B size ratio 0.8286
SWE ratio 0.8647
SWE Min value 0.8559
SWE Max value 0.8647
SWE Mean value 0.8660
BI-RADS aloneBI-RADS alone 0.71590.7159
Berg et al. Radiol 2012
18
Reproducibility of E Mode measurements
Measurement(log tranformed)
Measurement(log tranformed)
Distance 0.89
Perimeter 0.85
Area 0.91
E Min 0.78
E Max 0.87
E Mean 0.90
E ratio 0.81
all measurements but E Min have almost perfect agreement

4/11/2012
10
19
BE1 Main Study939 masses, 289 Ca
use visual colour SWE to upgrade BI-RADS 3 and downgrade 4a masses
AUC BI-RADS:US 0.950 ↑ 0.962, p = .005 without loss of sensitivity
specificity ↑ from 61.1% to 78.5%, p<.0001
20
BE1 Subjective Results939 masses, 289 Ca
AUC BI-RADS:US AUC 0.950
use visual blue/green threshold
upgrade BI-RADS 3 and downgrade 4a: specificity ↑ from 61.1% to 78.5% (p<.0001)
AUC ↑ to 0.962 (p= .005)
no loss of sensitivity
Berg et al. Radiol 2012

4/11/2012
11
21
Liverdiffuse diseases
most experience with Fibroscan
non-imaging
m/s readout
quality control
12% failure rate
22
Fibroscan vs. Histology
prospective study
711 patients chronic liver disease
correlates with METAVIR fibrosis stage
r = 0.73; P < 0.0001
Foucher J, et al. Gut 2006;55:403-408. Courtesy of Prof Taylor-Robinson
Fibrosis Stage
Liver
stiffness
Moderate
(F ≥ 2)
Severe
(F ≥ 3)
Cirrhosis
(F = 4)
Cut-off
values (kPa)7.2 12.5 17.6
Az 0.80 0.90 0.96
Fibrosis Stage
Liver
stiffness
Moderate
(F ≥ 2)
Severe
(F ≥ 3)
Cirrhosis
(F = 4)
Cut-off
values (kPa)7.2 12.5 17.6
Az 0.80 0.90 0.96

4/11/2012
12
23
Fibrotest and FibroScan183 Prospective Patients with Chronic HepC
Castera L, et al. Gastroenterology 2005;128:343
Fibrosis Stage Fibrotest % Fibroscan %Fibrotest +
Fibroscan %
F≥ 2 80 73 84
F≥ 3 81 83 95
F = 4 80 90 94
Agreement with Liver Biopsy
24
Comparison TE, RTE and ARFI45 biopsied mixed diffuse liver disease
and 27 controls
TE with Fibroscan
readout in kPa
Real Time Elasto with Hitachi
multivariate anlaysis for Elasticity Index
ARFI with Siemens 2000 virtual touch
readout in m/s
Metavir fibrosis and necro-inflammatory score
F1 = normal, F2 & 3 = increasing fibrosis, F4 = cirrhosis
Colombo et al. J Gastroenterol, 2012

4/11/2012
13
25
Haed-to-head Comparison
all performed well for severe fibrosis
poor for necro-inflammatory score
TE marginally best
Colombo et al. J Gastroenterol, 2012
26
FibrosisAz of ROCs F1 vs F2-4
Colombo et al. J Gastroenterol, 2012

4/11/2012
14
27
Comparisons
Colombo et al. J Gastroenterol, 2012
28
Caveat re FibroscanMeta-analysis
40 of 1280 studies selected
QUADAS tool for report quality
Tsochatzis et al. J Hepatol 2011, 54:650–659

4/11/2012
15
29
30
Caveat re FibroscanMeta-analysis
Tsochatzis et al. J Hepatol 2011, 54:650–659
Fibrosis # Studies Sensitivity Specificity
≥1 10 0.78 0.83
≥2 31 0.79 0.79
≥3 24 0.82 0.86
4 30 0.83 0.89

4/11/2012
16
31
Criteria for Fibrosis
cut offs varied widely
for F4, 9–26.5 kPa
no prospective study
negative TE of limited value
F2 in 20%
F4 in 16%
Tsochatzis et al. J Hepatol 2011, 54:650–659
32
Fatty LiversNASH (non-alcoholic steato-hepatitis)
and NAFLD (non-alcoholic fatty liver disease)
61 biopsy-proven cases
fat and fibrosis score
Fibroscan
ARFI Siemens S-2000

4/11/2012
17
33
Fibroscan XL in Obesity210 patients with chronic liver disease, BMI >28 kg/m2
liver biopsy
viral hepatitis 45%
non-alcoholic fatty liver disease (NAFLD) 55%
XL probe wider piston with greater excursion, lower interrogating frequency
11% overestimated by ≥ 2 F levels
~ “poor quaity acquisitions”
~ BMI
~ stiffness > 7 kPa
Myers et al., J Hepatol 2012, 56:564
34
Siemens ARFIQuantification
acoustic radiation force push
high MI (but within AIUM limits)
shear wave travels laterally
multiple pulses track shear wave
velocity converted to kPa
quantitative readout

4/11/2012
18
35
ARFI Quantification
siemens.com/strain
Vs=2.79m/s
36
Quantitative ARFI
Vs=2.03m/s
siemens.com/strain
4/11/2012
19
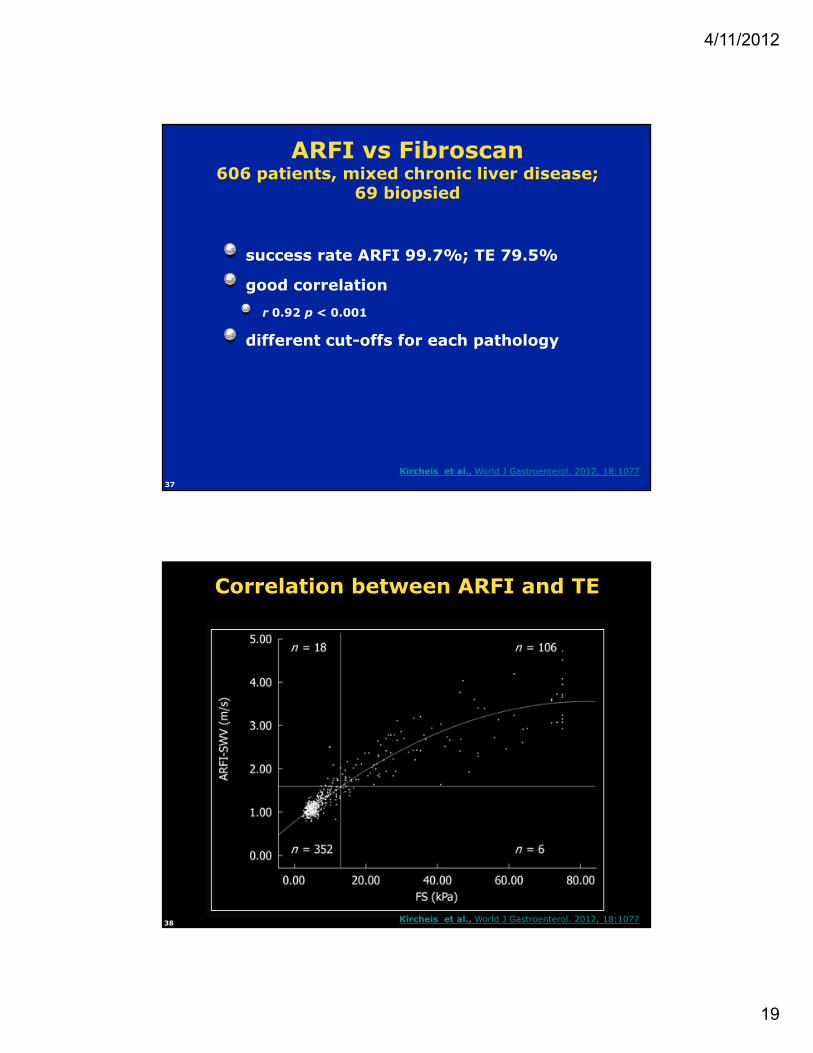
37
ARFI vs Fibroscan606 patients, mixed chronic liver disease;
69 biopsied
success rate ARFI 99.7%; TE 79.5%
good correlation
r 0.92 p < 0.001
different cut-offs for each pathology
Kircheis et al., World J Gastroenterol. 2012, 18:1077
38
Correlation between ARFI and TE
Kircheis et al., World J Gastroenterol. 2012, 18:1077
4/11/2012
20
39
ARFI vs TEbiopsied cases
• Comparison with liver biopsy [ARFI-SWV (n = 68) and FS-LS (n = 59)]
• Non significant liver fibrosis
• ARFI (n = 23)
• 0.929
• 1.32 m/s
• 0.83
• 0.91
• 87.0
• 80.0
•
Kircheis et al., World J Gastroenterol. 2012, 18:1077
40
qARFI in Chronic Liver DiseasesProf. Bill Lees
300 subjects
100 normal
mainly HBV, HCV and fatty livers
75 biopsied
1 technical failure
morbid obesity

4/11/2012
21
41
ARFI in Chronic Liver DiseaseProf. Bill Lees
sound s
peed m
/s
normal score 2–5 score 6 abnormal
LFTs
42
ARFI
elasto alongside B-mode
mainly for liver
fast and simple to learn
user independent
can be quantitative

4/11/2012
22
43
ARFI
transducer heats up
intermittent imaging
small elasto box
8cm depth limitation
abdomen only
44
SWE in Liver Fibrosis113 HBC patients
Fibroscan, SWE and blood tests
39 had biopsies also
2.5 MHz curved array
C2-4
prototype of Aixplorer
7 excluded Fibroscan/SWE unreliable
Bavu et al. UMB 2011, 37, 1361-1538
4/11/2012
23
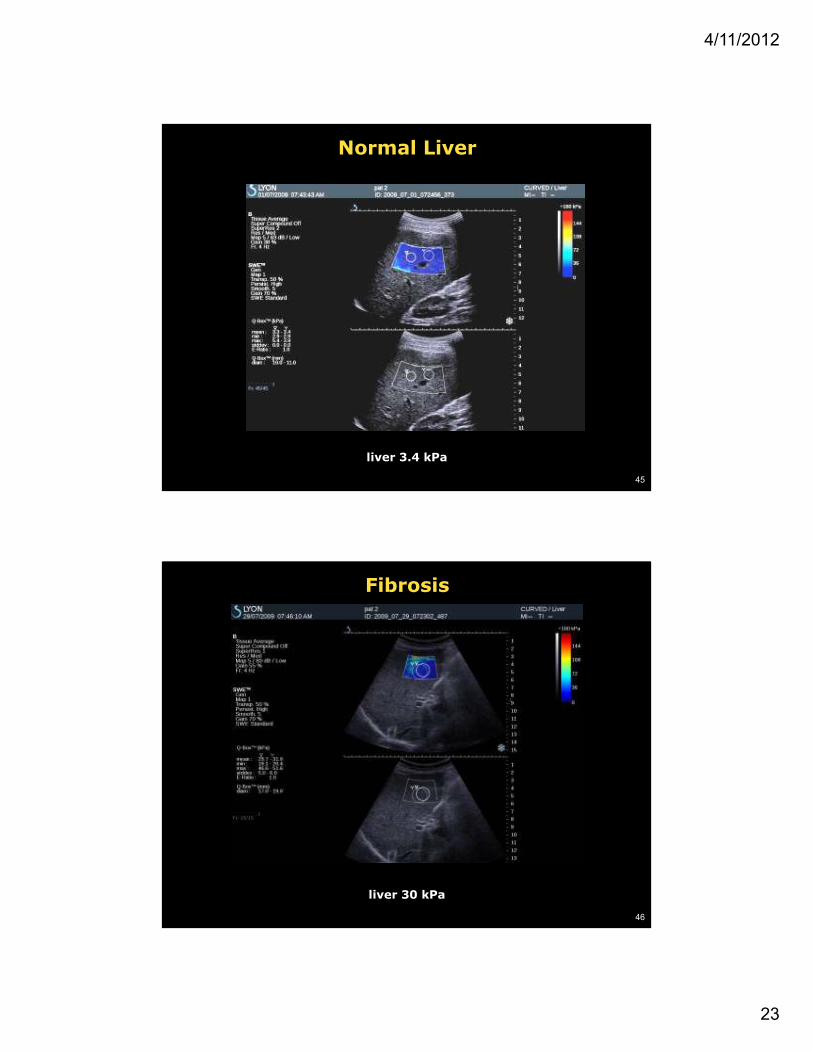
45
Normal Liver
liver 3.4 kPa
46
Fibrosis
liver 30 kPa

4/11/2012
24
47
Cirrhosis Portal Hypertension
liver 43 kPa
48
Mean SWE and Fibroscan vsMetavir Score
Bavu et al. UMB 2011, 37, 1361-1538
Good Agreement p<0.0001

4/11/2012
25
49
F0-3 vs F4
ROC curvesRed = SWE, Blue = Fibroscan
F0-1 vs F2-4
Bavu et al. UMB 2011, 37, 1361-1538
50
SWE Heterogeneityσ, kPa
Bavu et al. UMB 2011, 37, 1361-1538

4/11/2012
26
51
QIBA Criteria:Breast Masses
degree of fit
transformative √
translational √
feasible √
practical √
collaborative √
numbers: potentially large
QUALYs: could be large
implementation: only one but certain to change
clinical demand: great
52
QIBA Criteria:Diffuse Liver Disease
degree of fit
transformative √
translational √
feasible √
practical √
collaborative √
numbers: potentially large
QUALYs: could be large
implementation: several
clinical demand: great

4/11/2012
27
Related Documents


