Interim report January-September 2016 July–September 2016 • Net sales of SEK 34,343 million (37,519) for Total Vattenfall 1 , of which SEK 29,746 million (30,939) for continuing operations • Underlying operating profit 2,3 of SEK 3,706 million (3,388) for Total Vattenfall 1 , of which SEK 2,602 million (2,680) for continuing operations • Operating profit 3 of SEK 2,419 million (3,001) for Total Vattenfall 1 , of which SEK 2,251 million (2,340) for continuing operations • Profit after tax of SEK 188 million (1,600) for Total Vattenfall 1 , of which SEK 787 million (41) for continuing operations • Electricity generation of 38.6 TWh (41.2) for Total Vattenfall 1 , of which 25.2 TWh (26.2) for continuing operations January–September 2016 • Net sales of SEK 114,754 million (119,011) for Total Vattenfall 1 , of which SEK 101,412 million (101,208) for continuing operations • Underlying operating profit 2,3 of SEK 14,750 million (14,092) for Total Vattenfall 1 , of which SEK 14,602 million (14,123) for continuing operations • Operating profit 3 of SEK -18,183 million (-26,657) for Total Vattenfall 1 , of which SEK 4,178 million (-8,710) for continuing operations • Profit after tax of SEK -21,852 million (-22,225) for Total Vattenfall 1 , of which SEK 1,790 million (-9,737) for the period for continuing operations • Electricity generation of 127.3 TWh (127.2) for Total Vattenfall 1 , of which 86.4 TWh (85.5) for continuing operations 1) Total Vattenfall, including lignite operations. 2) Underlying operating profit is defined as operating profit excluding items affecting comparability. For a specification of items affecting comparability, see page 9. 3) See Definitions and calculations of key ratios for definitions of Alternative Performance Measures. The financial performance that is reported and commented on in this interim report pertains to Vattenfall’s continuing operations, unless indicated otherwise. In view of the divestment of Vattenfall’s lignite operations, these are classified and reported as a discontinued operation, see Note 4 on page 35. Text shadowed in light blue pertains to the divestment of Vattenfall's lignite operations. Vattenfall discloses the information provided in this interim report pursuant to the Swedish Securities Market Act. Rounding differences may occur in this document.

Welcome message from author
This document is posted to help you gain knowledge. Please leave a comment to let me know what you think about it! Share it to your friends and learn new things together.
Transcript
Interim report January-September 2016 July–September 2016
• Net sales of SEK 34,343 million (37,519) for Total Vattenfall1, of which SEK 29,746 million (30,939) for continuing operations
• Underlying operating profit2,3 of SEK 3,706 million (3,388) for Total Vattenfall1, of which SEK 2,602 million (2,680) for continuing operations
• Operating profit3 of SEK 2,419 million (3,001) for Total Vattenfall1, of which SEK 2,251 million (2,340) for continuing operations
• Profit after tax of SEK 188 million (1,600) for Total Vattenfall1, of which SEK 787 million (41) for continuing operations
• Electricity generation of 38.6 TWh (41.2) for Total Vattenfall1, of which 25.2 TWh (26.2) for continuing operations
January–September 2016
• Net sales of SEK 114,754 million (119,011) for Total Vattenfall1, of which SEK 101,412 million (101,208) for continuing operations
• Underlying operating profit2,3 of SEK 14,750 million (14,092) for Total Vattenfall1, of which SEK 14,602 million (14,123) for continuing operations
• Operating profit3 of SEK -18,183 million (-26,657) for Total Vattenfall1, of which SEK 4,178 million (-8,710) for continuing operations
• Profit after tax of SEK -21,852 million (-22,225) for Total Vattenfall1, of which SEK 1,790 million (-9,737) for the period for continuing operations
• Electricity generation of 127.3 TWh (127.2) for Total Vattenfall1, of which 86.4 TWh (85.5) for continuing operations
1) Total Vattenfall, including lignite operations. 2) Underlying operating profit is defined as operating profit excluding items affecting comparability. For a specification of items affecting comparability, see page 9. 3) See Definitions and calculations of key ratios for definitions of Alternative Performance Measures.
The financial performance that is reported and commented on in this interim report pertains to Vattenfall’s continuing operations, unless indicated otherwise. In view of the divestment of Vattenfall’s lignite operations, these are classified and reported as a discontinued operation, see Note 4 on page 35. Text shadowed in light blue pertains to the divestment of Vattenfall's lignite operations.
Vattenfall discloses the information provided in this interim report pursuant to the Swedish Securities Market Act.
Rounding differences may occur in this document.
Vattenfall Interim Report January-September 2016 2
CEO’s comments “The end of the third quarter marked an important milestone in Vattenfall’s development. We have now completed the sale of the German lignite operations to the Czech energy group EPH and its financial partner PPF Investments. The sale was an important step in adapting the portfolio to new market conditions and a long-term sustainable energy system. We are now forming the new Vattenfall – a customer-oriented company that combines efficient, large-scale production with decentralised solutions and renewable forms of energy.
Vattenfall reports an underlying operating profit of SEK 14.6 billion for its continuing operations for the period January–September, which is an increase of SEK 0.5 billion compared with a year ago. Our focus on lowering costs has been a key contributing factor. In addition, the recognition of previous impairment losses has led to lower depreciation and amortisation. However, the underlying operating profit decreased during the third quarter, mainly due to lower volumes and production margins. Drier weather conditions have led to a recovery of electricity prices in the Nordic region, however, low commodity prices continue to put pressure on electricity prices on the Continent.
Profit after tax for the period was weighed down heavily by the impairment losses recognised during the second quarter, mainly as a result of lower electricity prices, and totalled SEK 1.8 billion for continuing operations and SEK -21.9 billion for Total Vattenfall, including the lignite operations.
The business we conduct for our customers is a central part of Vattenfall’s development, and since the start of the year Vattenfall’s customer base has grown by nearly 120,000 contracts. We are pleased to note the positive trend in our key ratios, where a growing number of customers choose to recommend Vattenfall as their provider of energy solutions. At the same time, we are showing our strength in wind power. In September the Danish government announced that Vattenfall had won the tendering process for the construction of near shore wind power at two sites off Jutland’s west coast. As a result of the winning bid for these two wind farms totalling 350 MW in capacity, Vattenfall will be Denmark’s largest wind power operator. We are waiting for final approval from the Danish government before any more work can begin.
We are already generating electricity from our Sandbank wind farm off the German coast, even though only 50% of the turbines have been installed. Through focused development work we have managed to shorten the commissioning phase and thereby lower our overall project costs. This experience is important for future wind power projects.
Vattenfall is working actively to reduce CO2 emissions in its portfolio of continuing operations. The phase-out of coal is a cornerstone in Vattenfall’s partnership with the city of Berlin. Over time we have invested nearly SEK 1 billion in an initiative whereby in May next year we will convert the Klingenberg lignite-fired power plant in Berlin to a gas-fired plant, which will lower our annual CO2 emissions by 600,000 tonnes. Parallel with this, work is in progress on enabling us to use surplus heat from the Moorburg power plant outside Hamburg and on getting the plant classified as a combined heat and power plant. By using this surplus heat, other production can be reduced.
In Sweden the government’s budget bill was presented, which secures the energy accord with improved conditions for continued operation of hydro and nuclear power in the country. This is a welcome contribution, however, the work on cost-cutting must continue to ensure that our plants remain competitive and profitable for a long time to come.”
Magnus Hall President and CEO
Vattenfall Interim Report January-September 2016 3
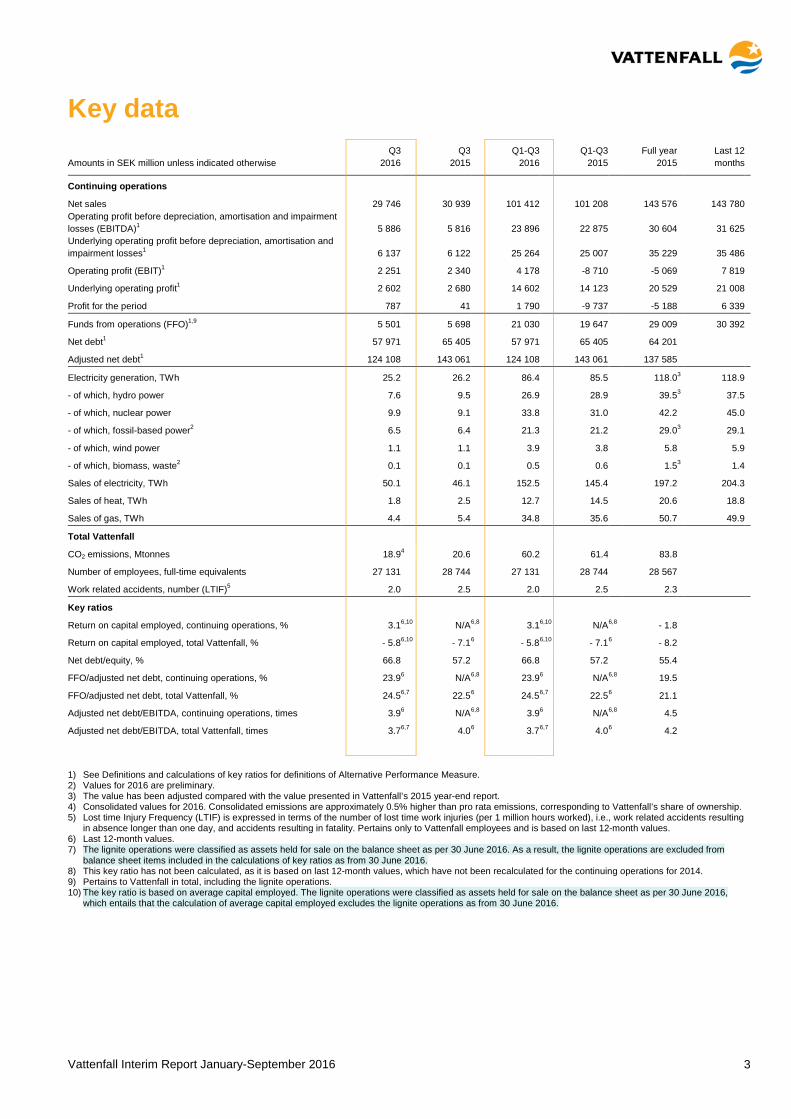
Key data Q3 Q3 Q1-Q3 Q1-Q3 Full year Last 12 Amounts in SEK million unless indicated otherwise 2016 2015 2016 2015 2015 months Continuing operations Net sales 29 746 30 939 101 412 101 208 143 576 143 780 Operating profit before depreciation, amortisation and impairment losses (EBITDA)1 5 886 5 816 23 896 22 875 30 604 31 625
Underlying operating profit before depreciation, amortisation and impairment losses1 6 137 6 122 25 264 25 007 35 229 35 486
Operating profit (EBIT)1 2 251 2 340 4 178 -8 710 -5 069 7 819 Underlying operating profit1 2 602 2 680 14 602 14 123 20 529 21 008 Profit for the period 787 41 1 790 -9 737 -5 188 6 339
Funds from operations (FFO)1,9 5 501 5 698 21 030 19 647 29 009 30 392 Net debt1 57 971 65 405 57 971 65 405 64 201 Adjusted net debt1 124 108 143 061 124 108 143 061 137 585
Electricity generation, TWh 25.2 26.2 86.4 85.5 118.0 3 118.9 - of which, hydro power 7.6 9.5 26.9 28.9 39.5 3 37.5 - of which, nuclear power 9.9 9.1 33.8 31.0 42.2 45.0 - of which, fossil-based power2 6.5 6.4 21.3 21.2 29.0 3 29.1 - of which, wind power 1.1 1.1 3.9 3.8 5.8 5.9 - of which, biomass, waste2 0.1 0.1 0.5 0.6 1.5 3 1.4 Sales of electricity, TWh 50.1 46.1 152.5 145.4 197.2 204.3 Sales of heat, TWh 1.8 2.5 12.7 14.5 20.6 18.8 Sales of gas, TWh 4.4 5.4 34.8 35.6 50.7 49.9
Total Vattenfall CO2 emissions, Mtonnes 18.9 4 20.6 60.2 61.4 83.8 Number of employees, full-time equivalents 27 131 28 744 27 131 28 744 28 567 Work related accidents, number (LTIF)5 2.0 2.5 2.0 2.5 2.3 Key ratios
Return on capital employed, continuing operations, % 3.1 6,10 N/A 6,8 3.1 6,10 N/A 6,8 - 1.8 Return on capital employed, total Vattenfall, % - 5.8 6,10 - 7.1 6 - 5.8 6,10 - 7.1 6 - 8.2 Net debt/equity, % 66.8 57.2 66.8 57.2 55.4 FFO/adjusted net debt, continuing operations, % 23.9 6 N/A 6,8 23.9 6 N/A 6,8 19.5 FFO/adjusted net debt, total Vattenfall, % 24.5 6,7 22.5 6 24.5 6,7 22.5 6 21.1 Adjusted net debt/EBITDA, continuing operations, times 3.9 6 N/A 6,8 3.9 6 N/A 6,8 4.5 Adjusted net debt/EBITDA, total Vattenfall, times 3.7 6,7 4.0 6 3.7 6,7 4.0 6 4.2
1) See Definitions and calculations of key ratios for definitions of Alternative Performance Measure. 2) Values for 2016 are preliminary. 3) The value has been adjusted compared with the value presented in Vattenfall’s 2015 year-end report. 4) Consolidated values for 2016. Consolidated emissions are approximately 0.5% higher than pro rata emissions, corresponding to Vattenfall’s share of ownership. 5) Lost time Injury Frequency (LTIF) is expressed in terms of the number of lost time work injuries (per 1 million hours worked), i.e., work related accidents resulting
in absence longer than one day, and accidents resulting in fatality. Pertains only to Vattenfall employees and is based on last 12-month values. 6) Last 12-month values. 7) The lignite operations were classified as assets held for sale on the balance sheet as per 30 June 2016. As a result, the lignite operations are excluded from
balance sheet items included in the calculations of key ratios as from 30 June 2016. 8) This key ratio has not been calculated, as it is based on last 12-month values, which have not been recalculated for the continuing operations for 2014. 9) Pertains to Vattenfall in total, including the lignite operations. 10) The key ratio is based on average capital employed. The lignite operations were classified as assets held for sale on the balance sheet as per 30 June 2016,
which entails that the calculation of average capital employed excludes the lignite operations as from 30 June 2016.
Vattenfall Interim Report January-September 2016 4
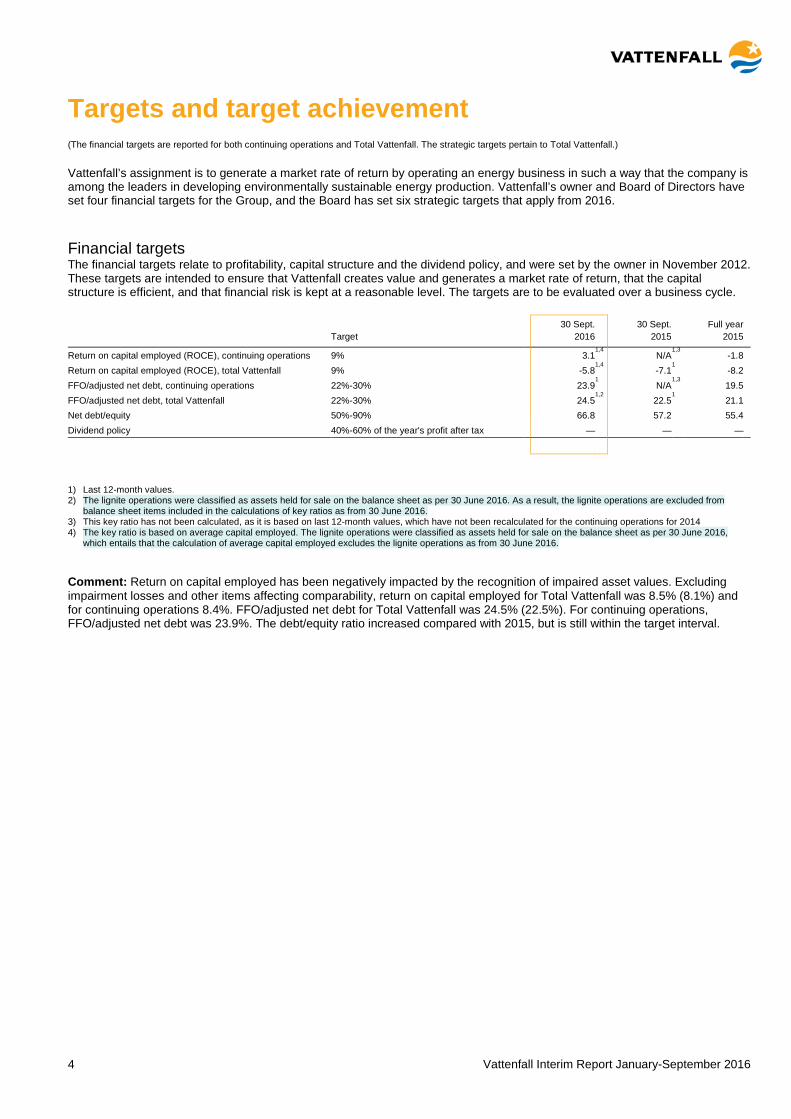
Targets and target achievement (The financial targets are reported for both continuing operations and Total Vattenfall. The strategic targets pertain to Total Vattenfall.)
Vattenfall’s assignment is to generate a market rate of return by operating an energy business in such a way that the company is among the leaders in developing environmentally sustainable energy production. Vattenfall’s owner and Board of Directors have set four financial targets for the Group, and the Board has set six strategic targets that apply from 2016.
Financial targets The financial targets relate to profitability, capital structure and the dividend policy, and were set by the owner in November 2012. These targets are intended to ensure that Vattenfall creates value and generates a market rate of return, that the capital structure is efficient, and that financial risk is kept at a reasonable level. The targets are to be evaluated over a business cycle.
30 Sept. 30 Sept. Full year Target 2016 2015 2015
Return on capital employed (ROCE), continuing operations 9% 3.1
1,4 N/A 1,3 -1.8
Return on capital employed (ROCE), total Vattenfall 9% -5.8 1,4 -7.1
1 -8.2 FFO/adjusted net debt, continuing operations 22%-30% 23.9
1 N/A 1,3 19.5
FFO/adjusted net debt, total Vattenfall 22%-30% 24.5 1,2 22.5
1 21.1 Net debt/equity 50%-90% 66.8 57.2 55.4 Dividend policy 40%-60% of the year's profit after tax — — —
1) Last 12-month values. 2) The lignite operations were classified as assets held for sale on the balance sheet as per 30 June 2016. As a result, the lignite operations are excluded from
balance sheet items included in the calculations of key ratios as from 30 June 2016. 3) This key ratio has not been calculated, as it is based on last 12-month values, which have not been recalculated for the continuing operations for 2014 4) The key ratio is based on average capital employed. The lignite operations were classified as assets held for sale on the balance sheet as per 30 June 2016,
which entails that the calculation of average capital employed excludes the lignite operations as from 30 June 2016.
Comment: Return on capital employed has been negatively impacted by the recognition of impaired asset values. Excluding impairment losses and other items affecting comparability, return on capital employed for Total Vattenfall was 8.5% (8.1%) and for continuing operations 8.4%. FFO/adjusted net debt for Total Vattenfall was 24.5% (22.5%). For continuing operations, FFO/adjusted net debt was 23.9%. The debt/equity ratio increased compared with 2015, but is still within the target interval.
Vattenfall Interim Report January-September 2016 5
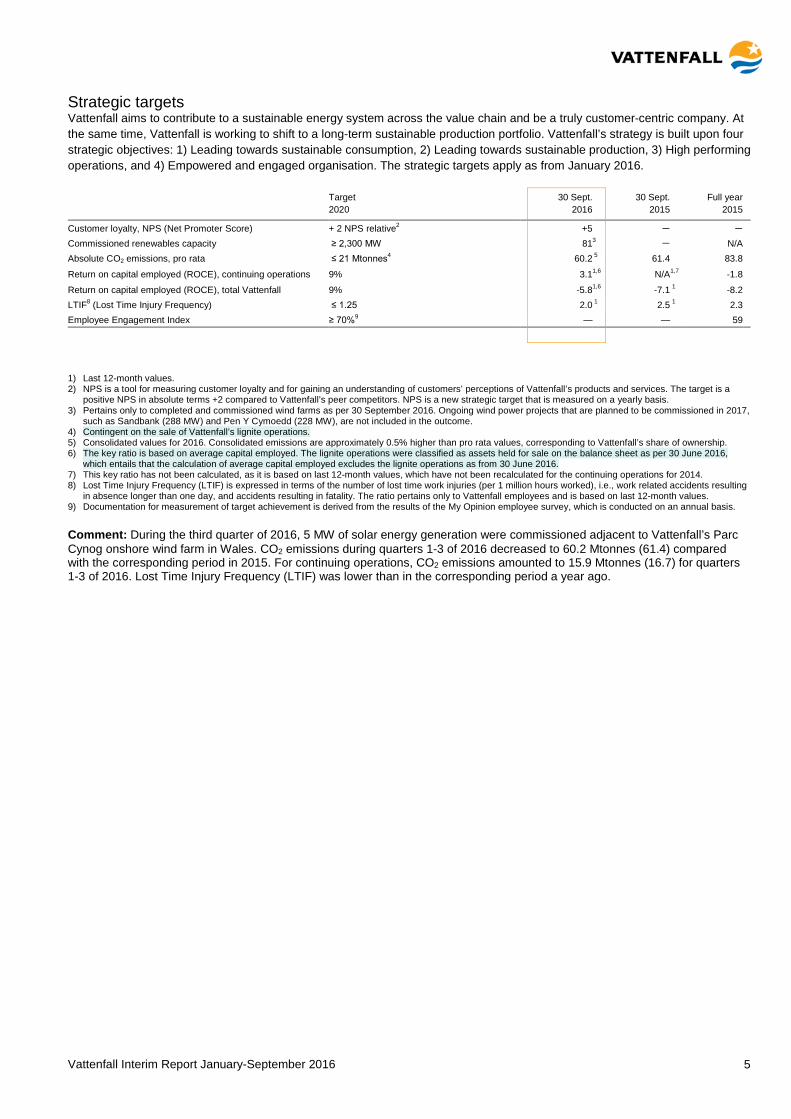
Strategic targets Vattenfall aims to contribute to a sustainable energy system across the value chain and be a truly customer-centric company. At the same time, Vattenfall is working to shift to a long-term sustainable production portfolio. Vattenfall’s strategy is built upon four strategic objectives: 1) Leading towards sustainable consumption, 2) Leading towards sustainable production, 3) High performing operations, and 4) Empowered and engaged organisation. The strategic targets apply as from January 2016.
Target 30 Sept. 30 Sept. Full year 2020 2016 2015 2015
Customer loyalty, NPS (Net Promoter Score) + 2 NPS relative2 +5 — —
Commissioned renewables capacity ≥ 2,300 MW 81 3 — N/A Absolute CO2 emissions, pro rata ≤ 21 Mtonnes4 60.2 5 61.4 83.8
Return on capital employed (ROCE), continuing operations 9% 3.1 1,6 N/A 1,7 -1.8
Return on capital employed (ROCE), total Vattenfall 9% -5.8 1,6 -7.1 1 -8.2 LTIF8 (Lost Time Injury Frequency) ≤ 1.25 2.0 1 2.5 1 2.3 Employee Engagement Index ≥ 70%9 — — 59
1) Last 12-month values. 2) NPS is a tool for measuring customer loyalty and for gaining an understanding of customers’ perceptions of Vattenfall’s products and services. The target is a
positive NPS in absolute terms +2 compared to Vattenfall’s peer competitors. NPS is a new strategic target that is measured on a yearly basis. 3) Pertains only to completed and commissioned wind farms as per 30 September 2016. Ongoing wind power projects that are planned to be commissioned in 2017,
such as Sandbank (288 MW) and Pen Y Cymoedd (228 MW), are not included in the outcome. 4) Contingent on the sale of Vattenfall’s lignite operations. 5) Consolidated values for 2016. Consolidated emissions are approximately 0.5% higher than pro rata values, corresponding to Vattenfall’s share of ownership. 6) The key ratio is based on average capital employed. The lignite operations were classified as assets held for sale on the balance sheet as per 30 June 2016,
which entails that the calculation of average capital employed excludes the lignite operations as from 30 June 2016. 7) This key ratio has not been calculated, as it is based on last 12-month values, which have not been recalculated for the continuing operations for 2014. 8) Lost Time Injury Frequency (LTIF) is expressed in terms of the number of lost time work injuries (per 1 million hours worked), i.e., work related accidents resulting
in absence longer than one day, and accidents resulting in fatality. The ratio pertains only to Vattenfall employees and is based on last 12-month values. 9) Documentation for measurement of target achievement is derived from the results of the My Opinion employee survey, which is conducted on an annual basis.
Comment: During the third quarter of 2016, 5 MW of solar energy generation were commissioned adjacent to Vattenfall’s Parc Cynog onshore wind farm in Wales. CO2 emissions during quarters 1-3 of 2016 decreased to 60.2 Mtonnes (61.4) compared with the corresponding period in 2015. For continuing operations, CO2 emissions amounted to 15.9 Mtonnes (16.7) for quarters 1-3 of 2016. Lost Time Injury Frequency (LTIF) was lower than in the corresponding period a year ago.
Vattenfall Interim Report January-September 2016 6
Important events Q3 2016 Decision to invest in offshore wind farm outside Aberdeen On 20 July Vattenfall took the decision to invest approximately GBP 300 million (corresponding to approximately SEK 3 billion) in an offshore wind farm (92.4 MW) outside Aberdeen, Scotland. The wind farm is expected to be operational in 2018.
Acquisition of offshore wind project in Germany In August Vattenfall acquired a German offshore wind project in the North Sea (known as the Global Tech II Offshore Wind Project) from Erste Nordsee-Offshore-Holding GbmH, with the ultimate goal of building up to 79 wind turbines. Vattenfall’s goal is to further develop and prepare the project, and make it competitive in the tendering process for subsidies and permits for offshore projects, which is expected to be initiated in March 2017.
Sandbank supplies its first power Vattenfall’s Sandbank offshore wind farm in Germany began generating its first wind power in September. The wind farm is expected to be delivering at full capacity in early spring 2017.
Winning bid for Danish wind power Vattenfall won the Danish Near Shore Wind Tender (DNS). The bid covers two sites, Vesterhav Nord and Vesterhav Syd off Jutland’s west coast, where Vattenfall plans to build two wind farms with combined capacity of 350 MW, corresponding to the electricity use of 375,000 Danish households. The aim is to start construction in 2019 and begin supplying electricity in 2020, however, final approval from the Danish government is required first.
Stefan Dohler new CFO of Vattenfall Stefan Dohler was appointed as new CFO of Vattenfall, effective 1 December 2016. He is currently Senior Vice President for the Markets Business Area and a member of Vattenfall’s Executive Group Management. Stefan Dohler succeeds Ingrid Bonde, who has decided to leave Vattenfall.
Decision to phase-out coal at combined heat and power plant in Berlin Vattenfall decided to replace coal with natural gas at the Klingenberg combined heat and power plant in Berlin three years ahead of plan, which will result in a reduction of CO2 emissions by 600,000 tonnes per year. The change will entail a total investment of approximately EUR 100 million (corresponding to approximately SEK 1 billion).
Application for re-extension of grid concession in Berlin The tendering process for new concessions for Berlin’s electricity grid was suspended in 2014. In October 2015 Berlin’s Senate Administration for Finance decided to resume the process. At the end of August Vattenfall submitted an application for a re-extension of its grid concession in Berlin.
Vattenfall completed sale of German lignite operations On 30 September Vattenfall completed the sale of its German lignite operations to the Czech energy group EPH and its financial partner PPF Investments, after gaining clearance for the sale from the European Commission earlier in September.
Vattenfall Interim Report January-September 2016 7
Important events after the balance sheet date
SSM presents proposal for changed calculation of nuclear waste fees in Sweden In a statement to the government, the Swedish Radiation Safety Authority (SSM) has proposed that the nuclear waste fee for nuclear reactors shall be calculated on the basis of an operating lifetime of 50 years instead of 40 years, as currently. The government will decide on the fees for the period 2018-2020 during the autumn of 2017.
Permit to restart Ringhals 2 reactor The Swedish Radiation Safety Authority (SSM) has decided to grant Ringhals AB dispensation from the Authority’s regulations and, contingent upon the fulfilment of certain requirements, that the Ringhals 2 reactor may be restarted after repair of a bottom liner in the reactor containment. Following an extensive audit, SSM is of the opinion that Ringhals has shown that there is an adequate margin of safety during the continued operating period through the end of 2019.
Changed price hedging strategy as a result of sale of lignite operations Following the sale of the lignite operations, Vattenfall’s portfolio and risk exposure have changed radically. After conducting a review of the price hedging strategy, Vattenfall has decided to contract its hedges closer to the delivery date and to reduce price hedges over the long term. Read more on page 14.
Approved draft law for nuclear waste fund in Germany On 19 October the German federal cabinet approved a draft law under which the country’s largest nuclear power operators will shift their liability for the transport, intermediate storage and permanent storage of nuclear waste through payment of a total of EUR 23.6 billion into a public fund. According to the draft law, Vattenfall’s payment to the fund will be EUR 1.75 billion, which includes a 35.5% risk premium. Vattenfall is now analysing the law from technical, commercial and legal perspectives. The German law governing nuclear waste storage must be approved by Germany’s parliament before taking force, which is expected to take place in early 2017.
Negotiations with ICSID in Washington, D.C. On 6 October, negotiations were started in Vattenfall's suit against the German government with the International Center for Settlement of Investment Disputes (ICSID) in Washington, D.C. As a result of the federal decision in Germany to phase out nuclear power in the country by 2022, Vattenfall is demanding compensation from the German government for lost revenue from the company's nuclear power plants in the country. The negotiations were open and public, and were held through 21 October. Vattenfall's request for arbitration was registered with the ICSID on 31 May 2012, and a ruling is expected in 2017.
Vattenfall Interim Report January-September 2016 8
Sales, profit and cash flow (Reporting of figures and comments pertains to continuing operations, unless indicated otherwise)
Net sales Q3 Q3 Q1-Q3 Q1-Q3 Full year Last 12 Continuing operations, amounts in SEK million 2016 2015 2016 2015 2015 months Net sales 29 746 30 939 101 412 101 208 143 576 143 780
Comment Q3: Consolidated net sales decreased by SEK 1.2 billion compared with the corresponding period in 2015. This is mainly attributable to lower sales volumes and negative price effects.
Comment Q1-3: Consolidated net sales increased by SEK 0.2 billion compared with the corresponding period in 2015.
Earnings Q3 Q3 Q1-Q3 Q1-Q3 Full year Last 12 Continuing operations, amounts in SEK million 2016 2015 2016 2015 2015 months Operating profit (EBIT)1 2 251 2 340 4 178 -8 710 -5 069 7 819 Depreciation, amortisation and impairment losses 3 635 3 476 19 718 31 585 35 673 23 806 Operating profit before depreciation, amortisation and impairment losses (EBITDA)1 5 886 5 816 23 896 22 875 30 604 31 625
Items affecting comparability excl. impairment losses and reversed impairment losses 251 306 1 368 2 132 4 625 3 861 Underlying operating profit before depreciation, amortisation and impairment losses1 6 137 6 122 25 264 25 007 35 229 35 486
Operating profit (EBIT) 2 251 2 340 4 178 - 8 710 - 5 069 7 819 Items affecting comparability1 351 340 10 424 22 833 25 598 13 189 Underlying operating profit1 2 602 2 680 14 602 14 123 20 529 21 008
1) See Definitions and calculations of key ratios for definitions of Alternative Performance Measures.
Comment Q3: The underlying operating profit decreased by SEK 0.1 billion, which is explained by the following:
• Lower production volumes in the Nordic countries, mainly from hydro power due to lower levels in the Nordic reservoirs (SEK -0.4 billion)
• Lower production margins, mainly owing to lower electricity prices achieved (SEK -0.3 billion) • Lower operating expenses (SEK 0.2 billion) • Other items, net (SEK 0.4 billion), of which SEK 0.3 billion is attributable to lower earnings in 2015 as a result of
adjusted property tax for hydro power for the years 2013-2015
Comment Q1-3: The underlying operating profit increased by SEK 0.5 million, which is explained by the following:
• Higher production volumes in the Nordic countries, mainly in nuclear power, as a result of higher availability (SEK 0.2 billion)
• Negative price effects (SEK -1.0 billion) • Lower operating expenses, and lower depreciation and amortisation as a result of recognition of impairment of asset
values (SEK 0.8 billion) • Other items, net (SEK 0.5 billion)
Vattenfall Interim Report January-September 2016 9
Items affecting comparability affecting operating profit (EBIT) Q3 Q3 Q1-Q3 Q1-Q3 Full year Last 12 Continuing operations, amounts in SEK million 2016 2015 2016 2015 2015 months Capital gains 25 - 131 2 069 174 249 2 144 Capital losses - 3 130 - 99 - 243 - 369 - 225 Impairment losses - 100 - 36 - 9 056 - 21 194 - 21 507 - 9 369 Reversed impairment losses — 2 — 493 534 41 Provisions 123 - 7 123 - 1 313 - 3 463 - 2 027 Unrealised changes in the fair value of energy derivatives - 59 107 - 3 432 1 018 1 558 - 2 892 Unrealised changes in the fair value of inventories - 10 - 215 598 - 258 - 657 199 Restructuring costs - 1 - 190 - 275 - 1 059 - 1 105 - 321 Other non-recurring items affecting comparability - 326 — - 352 - 451 - 838 - 739
Total - 351 - 340 - 10 424 - 22 833 - 25 598 - 13 189
Comment Q3: Items affecting comparability amounted to SEK -0.4 billion (-0.3).
Comment Q1-3: Items affecting comparability amounted to SEK -10.4 billion (-22.8). Capital gains pertain mainly to the sale of the network services operation in Hamburg (SEK 1.2 billion) and the sale of real estate in Bramfeld and Berlin (SEK 0.7 billion). Impairment of asset values amounted to SEK -9.1 billion and pertained primarily to the Moorburg power plan in Hamburg, hydro power assets in Germany, and fossil-based assets in the Netherlands. Other items affecting comparability pertain to capital losses (SEK -0.1 billion) unrealised changes in the fair value of energy derivatives and inventories (SEK -2.8 billion), restructuring costs ( SEK -0.3 billion) and other nonrecurring items affecting comparability attributable to the direct expensing of investments in Ringhals 1 and 2 (SEK -0.4 billion).
Items affecting comparability for the corresponding period in 2015 consisted mainly of impairment of asset values. These pertain mainly to impairment of goodwill in the Trading operation and impairment of fossil-based assets in Germany and the Netherlands.
For further information about impairment losses attributable to the lignite operations, see Note 4, Divested operations, on page 35.
Profit for the period Q3 Q3 Q1-Q3 Q1-Q3 Full year Last 12 Continuing operations, amounts in SEK million 2016 2015 2016 2015 2015 months Profit for the period 787 41 1 790 - 9 737 - 5 188 6 339
Comment Q3: Profit for the period amounted to SEK 0.8 billion (0.0).
Comment Q1-3: Profit for the period amounted to SEK 1.8 billion (-9.7).
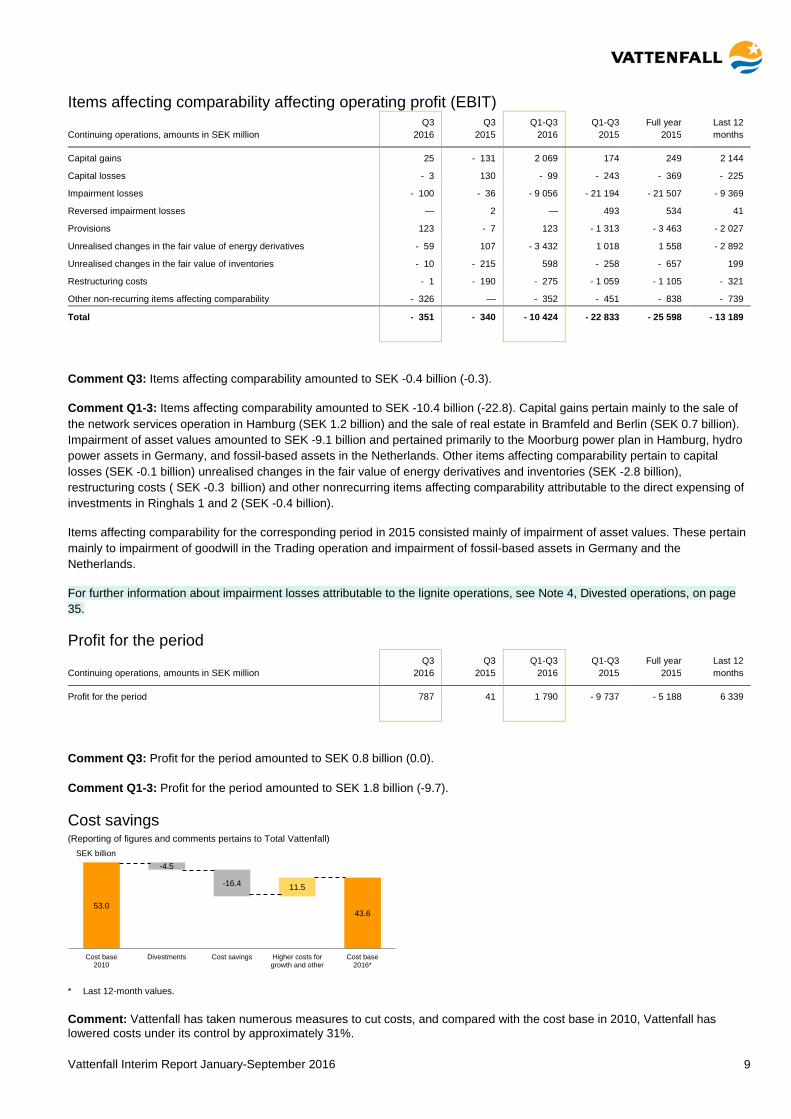
Cost savings (Reporting of figures and comments pertains to Total Vattenfall)
* Last 12-month values.
Comment: Vattenfall has taken numerous measures to cut costs, and compared with the cost base in 2010, Vattenfall has lowered costs under its control by approximately 31%.
53.043.6
-4.5
-16.4 11.5
Cost base2010
Divestments Cost savings Higher costs forgrowth and other
Cost base2016*
SEK billion
Vattenfall Interim Report January-September 2016 10
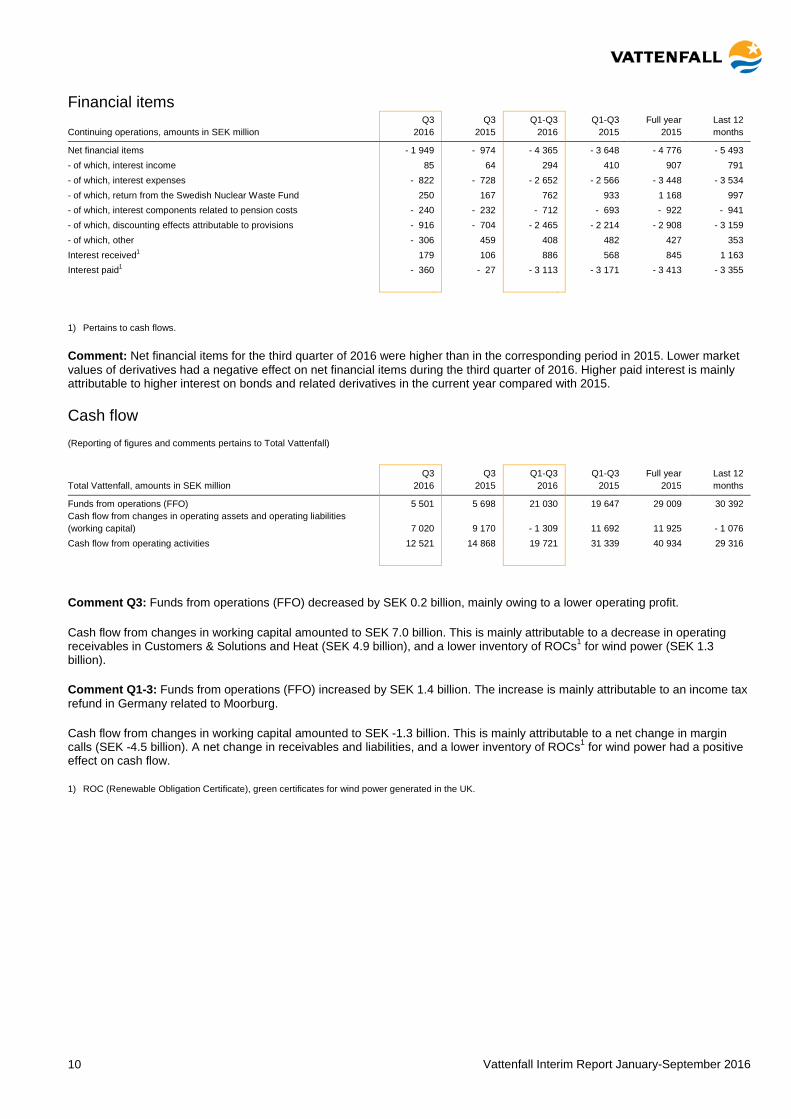
Financial items Q3 Q3 Q1-Q3 Q1-Q3 Full year Last 12 Continuing operations, amounts in SEK million 2016 2015 2016 2015 2015 months
Net financial items - 1 949 - 974 - 4 365 - 3 648 - 4 776 - 5 493 - of which, interest income 85 64 294 410 907 791 - of which, interest expenses - 822 - 728 - 2 652 - 2 566 - 3 448 - 3 534 - of which, return from the Swedish Nuclear Waste Fund 250 167 762 933 1 168 997 - of which, interest components related to pension costs - 240 - 232 - 712 - 693 - 922 - 941 - of which, discounting effects attributable to provisions - 916 - 704 - 2 465 - 2 214 - 2 908 - 3 159 - of which, other - 306 459 408 482 427 353 Interest received1 179 106 886 568 845 1 163 Interest paid1 - 360 - 27 - 3 113 - 3 171 - 3 413 - 3 355
1) Pertains to cash flows.
Comment: Net financial items for the third quarter of 2016 were higher than in the corresponding period in 2015. Lower market values of derivatives had a negative effect on net financial items during the third quarter of 2016. Higher paid interest is mainly attributable to higher interest on bonds and related derivatives in the current year compared with 2015.
Cash flow (Reporting of figures and comments pertains to Total Vattenfall)
Q3 Q3 Q1-Q3 Q1-Q3 Full year Last 12 Total Vattenfall, amounts in SEK million 2016 2015 2016 2015 2015 months
Funds from operations (FFO) 5 501 5 698 21 030 19 647 29 009 30 392 Cash flow from changes in operating assets and operating liabilities (working capital) 7 020 9 170 - 1 309 11 692 11 925 - 1 076 Cash flow from operating activities 12 521 14 868 19 721 31 339 40 934 29 316
Comment Q3: Funds from operations (FFO) decreased by SEK 0.2 billion, mainly owing to a lower operating profit.
Cash flow from changes in working capital amounted to SEK 7.0 billion. This is mainly attributable to a decrease in operating receivables in Customers & Solutions and Heat (SEK 4.9 billion), and a lower inventory of ROCs1 for wind power (SEK 1.3 billion).
Comment Q1-3: Funds from operations (FFO) increased by SEK 1.4 billion. The increase is mainly attributable to an income tax refund in Germany related to Moorburg.
Cash flow from changes in working capital amounted to SEK -1.3 billion. This is mainly attributable to a net change in margin calls (SEK -4.5 billion). A net change in receivables and liabilities, and a lower inventory of ROCs1 for wind power had a positive effect on cash flow.
1) ROC (Renewable Obligation Certificate), green certificates for wind power generated in the UK.

Vattenfall Interim Report January-September 2016 11
Financial position 30 Sept. 31 Dec. Amounts in SEK million 2016 2015 Change, %
Cash and cash equivalents, and short-term investments 38 548 1 44 256 1 -12.9
Committed credit facilities (unutilised) 19 242 18 379 4.7
1) The amounts as of 30 September 2016 pertains to continuing operations, and the amounts as of 31 December 2015 pertains to Total Vattenfall.
Comment: Cash and cash equivalents, and short-term investments decreased by SEK 5.7 billion compared with the level at 31 December 2015, mainly as an effect of the sale of the lignite operations and repayment of a large bond loan.
Committed credit facilities consist of a EUR 2.0 billion Revolving Credit Facility that expires on 10 December 2020, with an option for a one-year extension. As per 30 September 2016, available liquid assets and/or committed credit facilities amounted to 35% of net sales for continuing operations. Vattenfall’s target is to maintain a level of no less than 10% of the Group’s net sales, but at least the equivalent of the next 90 days’ maturities.
30 Sept. 31 Dec. Amounts in SEK million 2016 2015 Change, %
Interest-bearing liabilities1 98 572 3 110 585 3 -10.9
Net debt1 57 971 3 64 201 3 -9.7
Adjusted net debt1 (see page 25) 124 108 3 137 585 3 -9.8
Average interest rate, %2 4.0 3.9 —
Duration, years2 5.9 3.9 —
Average time to maturity, years2 8.6 8.1 —
1) See Definitions and calculations of key ratios for definitions of Alternative Performance Measures. 2) Including Hybrid Capital and loans from owners with non-controlling interests and associated companies. 3) The amounts as per 30 September 2016 pertain to Continuing operations, and the amounts as per 31 December 2015 pertain to Total Vattenfall.
Comment: Total interest-bearing liabilities decreased by SEK 12 billion compared with the level at 31 December 2015. This is mainly attributable to repurchases and maturity of bonds.
Net debt decreased by SEK 6.2 billion compared with the level at 31 December 2015. This is mainly attributable to a positive cash flow after investments and effects of the sale of the lignite operations, which reduced cash holdings.
Adjusted net debt decreased by SEK 13.5 billion compared with the level at 31 December 2015. The decrease is attributable to a lower level of net debt and to effects of the sale of the lignite operations, which reduced provisions for future obligations for pensions and mining operations.
Credit ratings On 13 May 2016, Moody’s affirmed Vattenfall’s long-term A3 rating and Baa2 rating for hybrid bonds. The outlook for Vattenfall’s rating is negative. On 19 May 2016 Standard & Poor’s affirmed Vattenfall’s long-term BBB+ rating. At the same time, Standard & Poor’s affirmed Vattenfall’s short-term A-2 rating. The outlook for Vattenfall’s rating is negative.

Vattenfall Interim Report January-September 2016 12
Investments and divestments Q3 Q3 Q1-Q3 Q1-Q3 Full year Last 12 Amounts in SEK million 2016 2015 2016 2015 2015 months
Maintenance investments 2 344 3 398 6 534 8 496 12 329 10 367 Growth investments 4 539 3 010 7 792 9 001 12 709 11 500
Total investments from continuing operations 6 883 6 408 14 326 17 497 25 038 21 867 Accrued investments (-)/release of accrued investments (+) - 149 931 29 741 738 26
Total investments with cash flow effect from continuing operations 6 734 7 339 14 355 18 238 25 776 21 893 Investments with cash flow effect from discontinued operations 8 658 1 139 2 041 2 950 2 048
Total investments with cash flow effect 6 742 7 997 15 494 20 279 28 726 23 941 Divestments total Vattenfall 242 117 4 262 2 349 2 814 4 727 - of which, shares 13 - 10 1 279 217 206 1 268
Comment: Investments are specified in the table below. Divestments in 2016 pertain mainly to Vattenfall’s network services operation in Hamburg, Germany, the sale of real estate in Bramfeld (Hamburg) and Berlin, and the Nordjylland combined heat and power station in Denmark. Divestments during the corresponding period in 2015 pertained primarily to combined heat and power assets in Utrecht, the Netherlands.
Specification of investments Q3 Q3 Q1-Q3 Q1-Q3 Full year Last 12 Amounts in SEK million 2016 2015 2016 2015 2015 months
Electricity generation Hydro power 300 417 964 1 001 1 706 1 669 Nuclear power 682 1 359 1 768 3 191 4 219 2 796 Coal power 150 248 330 1 089 1 292 533 Gas 12 29 128 59 174 243 Wind power 3 793 2 564 6 171 6 655 8 629 8 145 Biomass, waste 12 2 16 9 25 32
Total electricity generation 4 949 4 619 9 377 12 004 16 045 13 418 CHP/heat Fossil-based power 405 615 1 017 1 274 1 949 1 692 Biomass, waste 58 41 95 73 145 167 Other 255 315 561 696 1 242 1 107
Total CHP/heat 718 971 1 673 2 043 3 336 2 966 Electricity networks Electricity networks 1 058 1 029 3 007 2 840 4 671 4 838 Total electricity networks 1 058 1 029 3 007 2 840 4 671 4 838 Purchases of shares, shareholder contributions - 155 - 50 - 392 - 208 - 267 - 451 Other 313 - 161 661 818 1 253 1 096 Total investments from continuing operations 6 883 6 408 14 326 17 497 25 038 21 867 Accrued investments (-)/release of accrued investments (+) - 149 931 29 741 738 26
Total investments with cash flow effect from continuing operations 6 734 7 339 14 355 18 238 25 776 21 893 Investments with cash flow effect from discontinued operations 8 658 1 139 2 041 2 950 2 048 Total investments with cash flow effect 6 742 7 997 15 494 20 279 28 726 23 941

Vattenfall Interim Report January-September 2016 13
Wholesale price trend Spot prices – electricity Compared with the third quarter of 2015, average Nordic spot prices increased by 90%, mainly as a result of drier weather and a lower hydrological balance. Average spot prices in Germany and the Netherlands were 14% and 22% lower, respectively, as a result of lower commodity prices. For the period January–September 2016, average spot prices were 18% higher in the Nordic countries, 16% lower in Germany, and 29% lower in the Netherlands, compared with the corresponding period in 2015.
Time period Nord Pool Spot EPEX APX
EUR/MWh (Nordic countries) (Germany) (Netherlands)
Q3 2016 25.2 28.2 31.4
Q3 2015 13.3 32.8 40.2
% 90% -14% -22%
Q2 2016 23.9 24.7 28.3
% 6% 14% 11%
Q1-3 2016 24.4 26.1 29.2
Q1-3 2015 20.7 31.1 40.8
% 18% -16% -29%
Electricity spot prices in the Nordic countries, Germany and the Netherlands, monthly averages
Futures prices – electricity Electricity futures prices were 11%-19% lower than in the third quarter of 2015, mainly owing to continued expectations for low commodity prices. During the third quarter of 2016, commodity prices improved at the same time that the hydrological balance deteriorated, and as a result, electricity futures prices were 3%-8% higher in the Nordic countries than in the preceding quarter. Germany and the Netherlands, electricity futures prices were 4%-10% higher than in the preceding quarter as a result of higher commodity prices. Compared with the period January–September 2015, electricity futures prices were 20%-27% lower.
Time period Nordic countries Germany Netherlands
(NPX) (EEX) (ICE)
EUR/MWh 2017 2018 2017 2018 2017 2018
Q3 2016 22.9 21.0 26.9 25.7 32.0 30.0
Q3 2015 25.8 26.0 30.2 30.4 36.0 35.9
% -11% -19% -11% -15% -11% -16%
Q2 2016 21.2 20.5 25.1 24.7 29.2 28.0
% 8% 3% 7% 4% 10% 7%
Q1-3 2016 20.8 19.8 24.9 24.1 29.3 27.8
Q1-3 2015 27.0 27.0 31.1 31.0 37.5 37.6
% -23% -27% -20% -22% -22% -26%
Electricity futures prices in the Nordic countries, Germany and the Netherlands
Commodity prices Oil prices (Brent crude) were an average of 8% lower than in the third quarter of 2015, mainly owing to the stronger U.S. dollar. Coal prices did not follow the trend in oil prices and were an average of 9% higher than in the third quarter of 2015. Gas prices were 20% lower. Prices of CO2 emission allowances were an average of 43% lower than in the third quarter of 2015. For the period January–September 2016, oil prices were 24% lower, coal prices were 14% lower, gas prices were 29% lower, and prices of CO2 emission allowances were 29% lower than in the corresponding period in 2015.
Price trend for oil, coal, gas and CO2 emission allowances
5
10
15
20
25
30
35
40
45
50
55
2014 2015 2016EPEX APX NordPool
EUR/MWh
10
15
20
25
30
35
40
45
50
2014 2015 2016EEX 2017 EEX 2018 ICE 2017
ICE 2018 NPX 2017 NPX 2018
EUR/MWh
0
5
10
15
20
25
30
35
40
45
50
20
30
40
50
60
70
80
90
100
110
120
2014 2015 2016Coal (USD/t), API2, Front Year Oil (USD/bbl), Brent Front Month
Emission allowances CO2 (EUR/t), MidDec Gas (EUR/MWh), NBP, Front Year
USD EUR
Vattenfall Interim Report January-September 2016 14
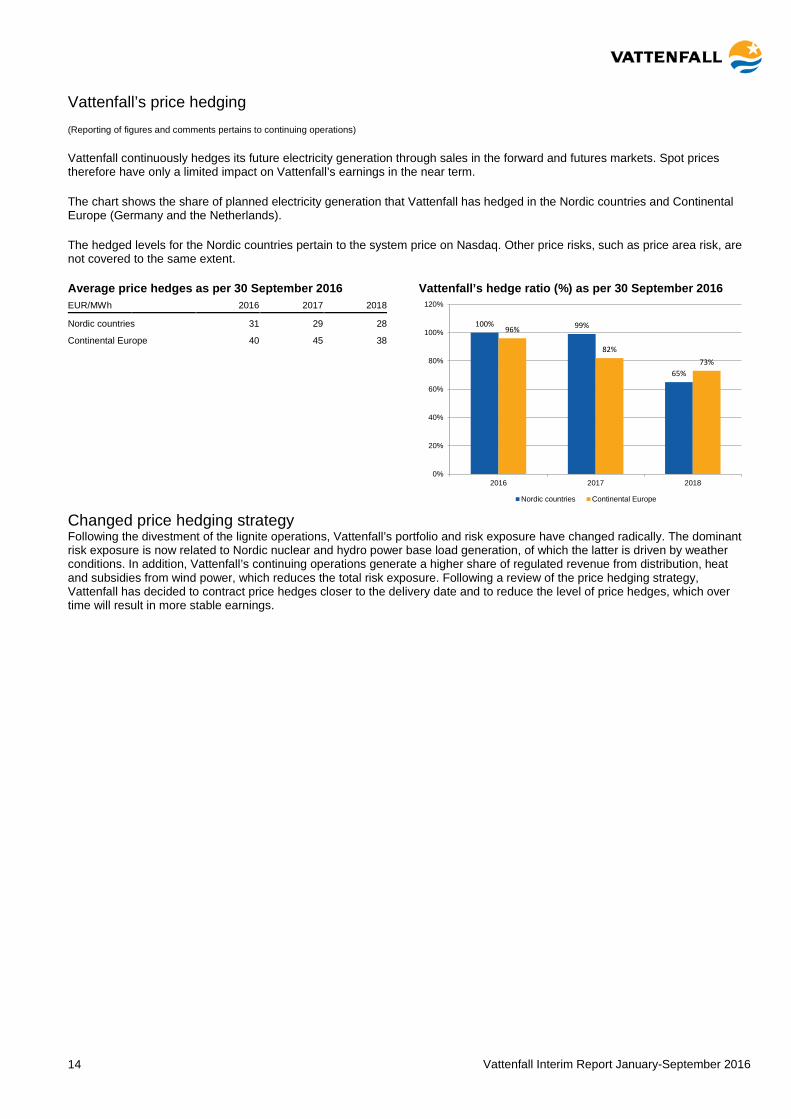
Vattenfall’s price hedging (Reporting of figures and comments pertains to continuing operations)
Vattenfall continuously hedges its future electricity generation through sales in the forward and futures markets. Spot prices therefore have only a limited impact on Vattenfall’s earnings in the near term.
The chart shows the share of planned electricity generation that Vattenfall has hedged in the Nordic countries and Continental Europe (Germany and the Netherlands).
The hedged levels for the Nordic countries pertain to the system price on Nasdaq. Other price risks, such as price area risk, are not covered to the same extent.
Average price hedges as per 30 September 2016 EUR/MWh 2016 2017 2018
Nordic countries 31 29 28
Continental Europe 40 45 38
Vattenfall’s hedge ratio (%) as per 30 September 2016
Changed price hedging strategy Following the divestment of the lignite operations, Vattenfall’s portfolio and risk exposure have changed radically. The dominant risk exposure is now related to Nordic nuclear and hydro power base load generation, of which the latter is driven by weather conditions. In addition, Vattenfall’s continuing operations generate a higher share of regulated revenue from distribution, heat and subsidies from wind power, which reduces the total risk exposure. Following a review of the price hedging strategy, Vattenfall has decided to contract price hedges closer to the delivery date and to reduce the level of price hedges, which over time will result in more stable earnings.
100% 99%
65%
96%
82%73%
0%
20%
40%
60%
80%
100%
120%
2016 2017 2018
Nordic countries Continental Europe
Vattenfall Interim Report January-September 2016 15
Operating segments (Reporting of figures and comments pertains to continuing operations, unless indicated otherwise)
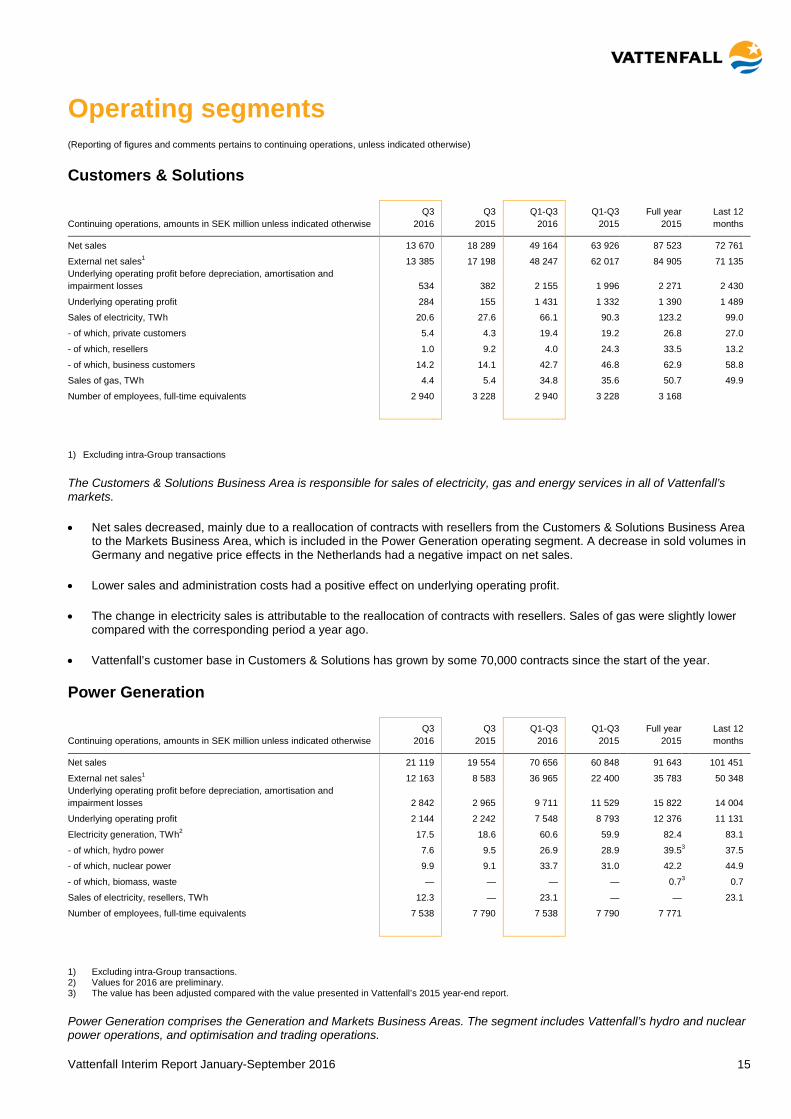
Customers & Solutions
Q3 Q3 Q1-Q3 Q1-Q3 Full year Last 12 Continuing operations, amounts in SEK million unless indicated otherwise 2016 2015 2016 2015 2015 months Net sales 13 670 18 289 49 164 63 926 87 523 72 761
External net sales1 13 385 17 198 48 247 62 017 84 905 71 135 Underlying operating profit before depreciation, amortisation and impairment losses 534 382 2 155 1 996 2 271 2 430
Underlying operating profit 284 155 1 431 1 332 1 390 1 489
Sales of electricity, TWh 20.6 27.6 66.1 90.3 123.2 99.0
- of which, private customers 5.4 4.3 19.4 19.2 26.8 27.0
- of which, resellers 1.0 9.2 4.0 24.3 33.5 13.2
- of which, business customers 14.2 14.1 42.7 46.8 62.9 58.8
Sales of gas, TWh 4.4 5.4 34.8 35.6 50.7 49.9
Number of employees, full-time equivalents 2 940 3 228 2 940 3 228 3 168
1) Excluding intra-Group transactions
The Customers & Solutions Business Area is responsible for sales of electricity, gas and energy services in all of Vattenfall’s markets.
• Net sales decreased, mainly due to a reallocation of contracts with resellers from the Customers & Solutions Business Area to the Markets Business Area, which is included in the Power Generation operating segment. A decrease in sold volumes in Germany and negative price effects in the Netherlands had a negative impact on net sales.
• Lower sales and administration costs had a positive effect on underlying operating profit.
• The change in electricity sales is attributable to the reallocation of contracts with resellers. Sales of gas were slightly lower compared with the corresponding period a year ago.
• Vattenfall’s customer base in Customers & Solutions has grown by some 70,000 contracts since the start of the year.
Power Generation
Q3 Q3 Q1-Q3 Q1-Q3 Full year Last 12 Continuing operations, amounts in SEK million unless indicated otherwise 2016 2015 2016 2015 2015 months Net sales 21 119 19 554 70 656 60 848 91 643 101 451
External net sales1 12 163 8 583 36 965 22 400 35 783 50 348 Underlying operating profit before depreciation, amortisation and impairment losses 2 842 2 965 9 711 11 529 15 822 14 004
Underlying operating profit 2 144 2 242 7 548 8 793 12 376 11 131
Electricity generation, TWh2 17.5 18.6 60.6 59.9 82.4 83.1
- of which, hydro power 7.6 9.5 26.9 28.9 39.5 3 37.5
- of which, nuclear power 9.9 9.1 33.7 31.0 42.2 44.9
- of which, biomass, waste — — — — 0.7 3 0.7
Sales of electricity, resellers, TWh 12.3 — 23.1 — — 23.1
Number of employees, full-time equivalents 7 538 7 790 7 538 7 790 7 771
1) Excluding intra-Group transactions. 2) Values for 2016 are preliminary. 3) The value has been adjusted compared with the value presented in Vattenfall’s 2015 year-end report.
Power Generation comprises the Generation and Markets Business Areas. The segment includes Vattenfall’s hydro and nuclear power operations, and optimisation and trading operations.
Vattenfall Interim Report January-September 2016 16
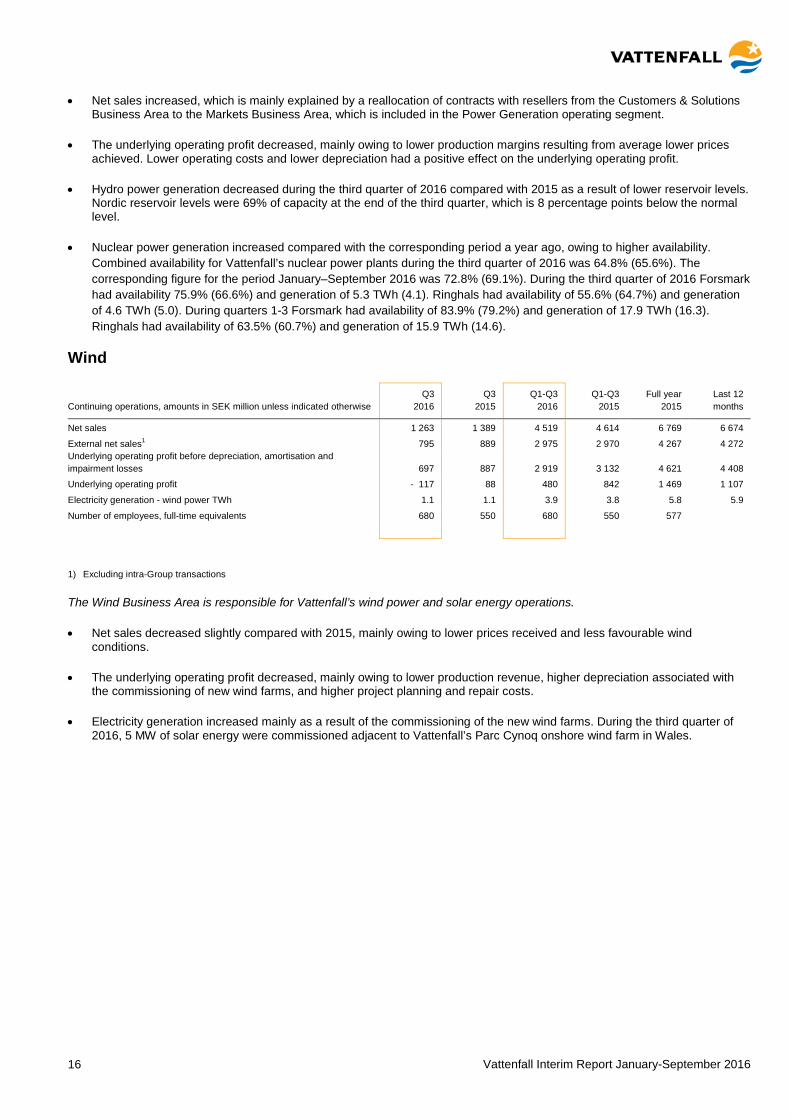
• Net sales increased, which is mainly explained by a reallocation of contracts with resellers from the Customers & Solutions Business Area to the Markets Business Area, which is included in the Power Generation operating segment.
• The underlying operating profit decreased, mainly owing to lower production margins resulting from average lower prices achieved. Lower operating costs and lower depreciation had a positive effect on the underlying operating profit.
• Hydro power generation decreased during the third quarter of 2016 compared with 2015 as a result of lower reservoir levels. Nordic reservoir levels were 69% of capacity at the end of the third quarter, which is 8 percentage points below the normal level.
• Nuclear power generation increased compared with the corresponding period a year ago, owing to higher availability. Combined availability for Vattenfall’s nuclear power plants during the third quarter of 2016 was 64.8% (65.6%). The corresponding figure for the period January–September 2016 was 72.8% (69.1%). During the third quarter of 2016 Forsmark had availability 75.9% (66.6%) and generation of 5.3 TWh (4.1). Ringhals had availability of 55.6% (64.7%) and generation of 4.6 TWh (5.0). During quarters 1-3 Forsmark had availability of 83.9% (79.2%) and generation of 17.9 TWh (16.3). Ringhals had availability of 63.5% (60.7%) and generation of 15.9 TWh (14.6).
Wind
Q3 Q3 Q1-Q3 Q1-Q3 Full year Last 12 Continuing operations, amounts in SEK million unless indicated otherwise 2016 2015 2016 2015 2015 months Net sales 1 263 1 389 4 519 4 614 6 769 6 674
External net sales1 795 889 2 975 2 970 4 267 4 272 Underlying operating profit before depreciation, amortisation and impairment losses 697 887 2 919 3 132 4 621 4 408
Underlying operating profit - 117 88 480 842 1 469 1 107
Electricity generation - wind power TWh 1.1 1.1 3.9 3.8 5.8 5.9
Number of employees, full-time equivalents 680 550 680 550 577
1) Excluding intra-Group transactions
The Wind Business Area is responsible for Vattenfall’s wind power and solar energy operations.
• Net sales decreased slightly compared with 2015, mainly owing to lower prices received and less favourable wind conditions.
• The underlying operating profit decreased, mainly owing to lower production revenue, higher depreciation associated with the commissioning of new wind farms, and higher project planning and repair costs.
• Electricity generation increased mainly as a result of the commissioning of the new wind farms. During the third quarter of 2016, 5 MW of solar energy were commissioned adjacent to Vattenfall’s Parc Cynoq onshore wind farm in Wales.
Vattenfall Interim Report January-September 2016 17
Heat
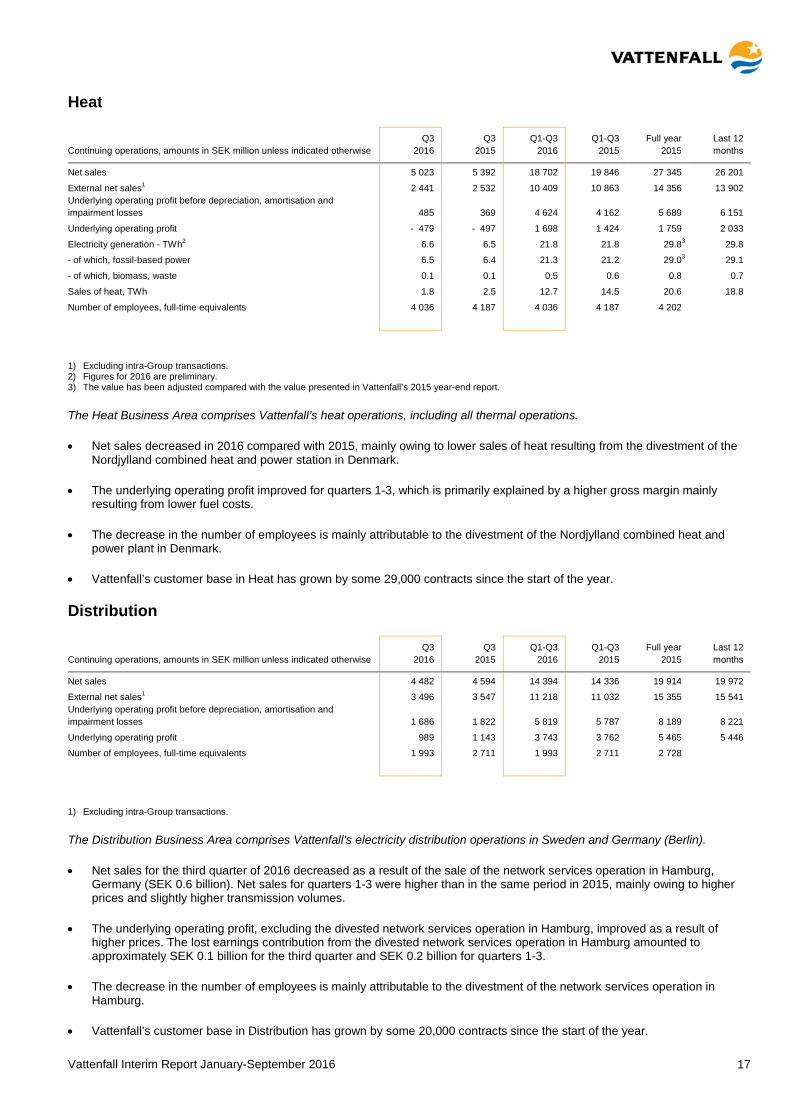
Q3 Q3 Q1-Q3 Q1-Q3 Full year Last 12 Continuing operations, amounts in SEK million unless indicated otherwise 2016 2015 2016 2015 2015 months Net sales 5 023 5 392 18 702 19 846 27 345 26 201
External net sales1 2 441 2 532 10 409 10 863 14 356 13 902 Underlying operating profit before depreciation, amortisation and impairment losses 485 369 4 624 4 162 5 689 6 151
Underlying operating profit - 479 - 497 1 698 1 424 1 759 2 033
Electricity generation - TWh2 6.6 6.5 21.8 21.8 29.8 3 29.8
- of which, fossil-based power 6.5 6.4 21.3 21.2 29.0 3 29.1
- of which, biomass, waste 0.1 0.1 0.5 0.6 0.8 0.7
Sales of heat, TWh 1.8 2.5 12.7 14.5 20.6 18.8
Number of employees, full-time equivalents 4 036 4 187 4 036 4 187 4 202
1) Excluding intra-Group transactions. 2) Figures for 2016 are preliminary. 3) The value has been adjusted compared with the value presented in Vattenfall’s 2015 year-end report.
The Heat Business Area comprises Vattenfall’s heat operations, including all thermal operations.
• Net sales decreased in 2016 compared with 2015, mainly owing to lower sales of heat resulting from the divestment of the Nordjylland combined heat and power station in Denmark.
• The underlying operating profit improved for quarters 1-3, which is primarily explained by a higher gross margin mainly resulting from lower fuel costs.
• The decrease in the number of employees is mainly attributable to the divestment of the Nordjylland combined heat and power plant in Denmark.
• Vattenfall’s customer base in Heat has grown by some 29,000 contracts since the start of the year.
Distribution
Q3 Q3 Q1-Q3 Q1-Q3 Full year Last 12 Continuing operations, amounts in SEK million unless indicated otherwise 2016 2015 2016 2015 2015 months Net sales 4 482 4 594 14 394 14 336 19 914 19 972
External net sales1 3 496 3 547 11 218 11 032 15 355 15 541 Underlying operating profit before depreciation, amortisation and impairment losses 1 686 1 822 5 819 5 787 8 189 8 221
Underlying operating profit 989 1 143 3 743 3 762 5 465 5 446
Number of employees, full-time equivalents 1 993 2 711 1 993 2 711 2 728
1) Excluding intra-Group transactions.
The Distribution Business Area comprises Vattenfall’s electricity distribution operations in Sweden and Germany (Berlin).
• Net sales for the third quarter of 2016 decreased as a result of the sale of the network services operation in Hamburg, Germany (SEK 0.6 billion). Net sales for quarters 1-3 were higher than in the same period in 2015, mainly owing to higher prices and slightly higher transmission volumes.
• The underlying operating profit, excluding the divested network services operation in Hamburg, improved as a result of higher prices. The lost earnings contribution from the divested network services operation in Hamburg amounted to approximately SEK 0.1 billion for the third quarter and SEK 0.2 billion for quarters 1-3.
• The decrease in the number of employees is mainly attributable to the divestment of the network services operation in Hamburg.
• Vattenfall’s customer base in Distribution has grown by some 20,000 contracts since the start of the year.
Vattenfall Interim Report January-September 2016 18
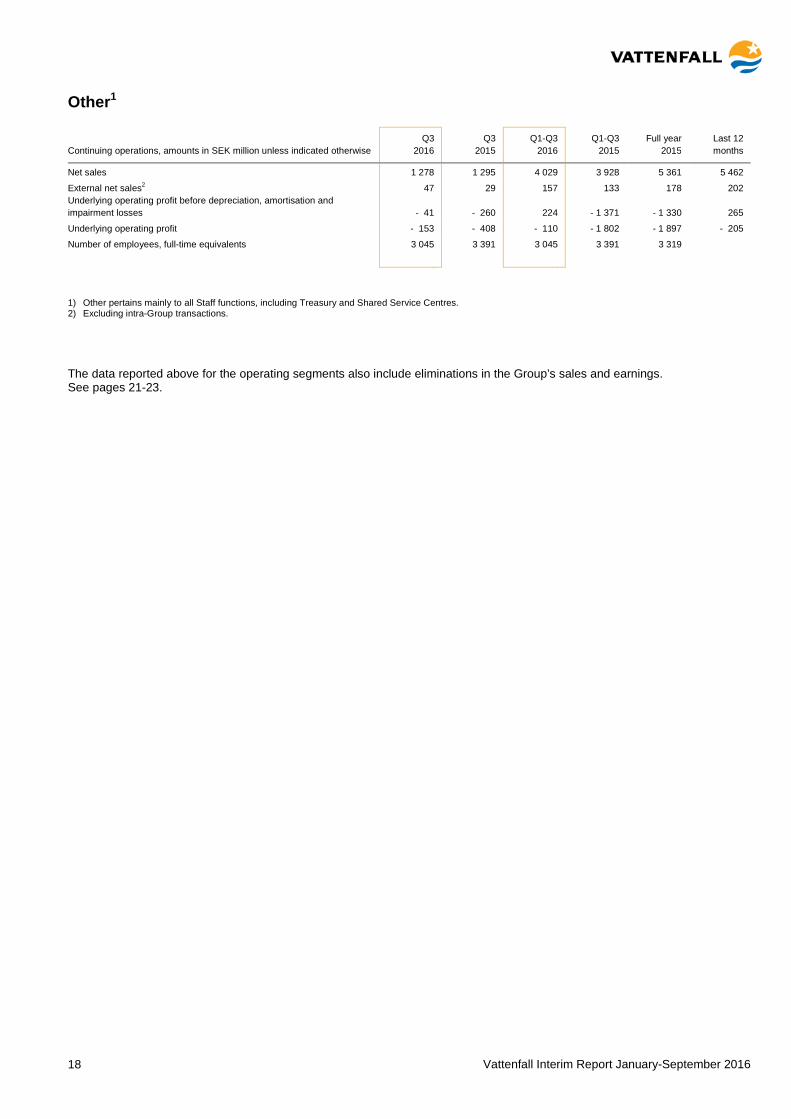
Other1
Q3 Q3 Q1-Q3 Q1-Q3 Full year Last 12 Continuing operations, amounts in SEK million unless indicated otherwise 2016 2015 2016 2015 2015 months Net sales 1 278 1 295 4 029 3 928 5 361 5 462
External net sales2 47 29 157 133 178 202 Underlying operating profit before depreciation, amortisation and impairment losses - 41 - 260 224 - 1 371 - 1 330 265
Underlying operating profit - 153 - 408 - 110 - 1 802 - 1 897 - 205
Number of employees, full-time equivalents 3 045 3 391 3 045 3 391 3 319
1) Other pertains mainly to all Staff functions, including Treasury and Shared Service Centres. 2) Excluding intra-Group transactions.
The data reported above for the operating segments also include eliminations in the Group’s sales and earnings. See pages 21-23.
Vattenfall Interim Report January-September 2016 19
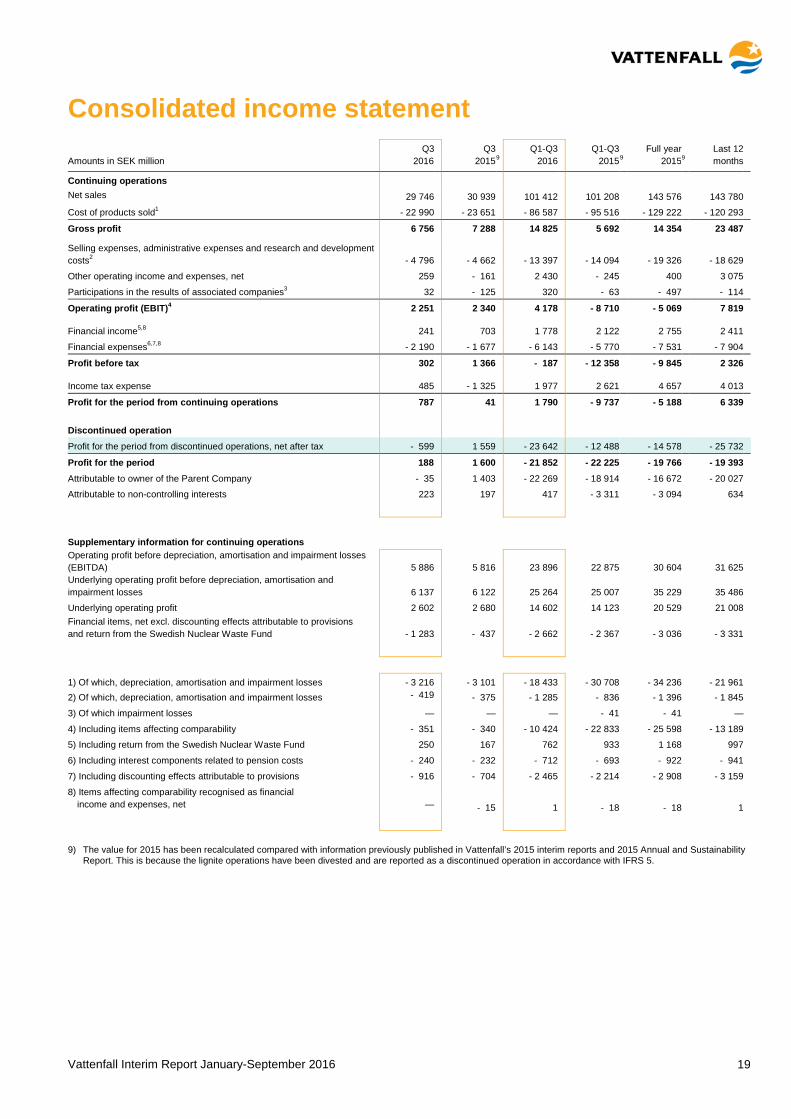
Consolidated income statement Q3 Q3 Q1-Q3 Q1-Q3 Full year Last 12 Amounts in SEK million 2016 2015 9 2016 2015 9 2015 9 months
Continuing operations
Net sales 29 746 30 939 101 412 101 208 143 576 143 780
Cost of products sold1 - 22 990 - 23 651 - 86 587 - 95 516 - 129 222 - 120 293
Gross profit 6 756 7 288 14 825 5 692 14 354 23 487
Selling expenses, administrative expenses and research and development costs2 - 4 796 - 4 662 - 13 397 - 14 094 - 19 326 - 18 629
Other operating income and expenses, net 259 - 161 2 430 - 245 400 3 075
Participations in the results of associated companies3 32 - 125 320 - 63 - 497 - 114
Operating profit (EBIT)4 2 251 2 340 4 178 - 8 710 - 5 069 7 819
Financial income5,8 241 703 1 778 2 122 2 755 2 411
Financial expenses6,7,8 - 2 190 - 1 677 - 6 143 - 5 770 - 7 531 - 7 904
Profit before tax 302 1 366 - 187 - 12 358 - 9 845 2 326
Income tax expense 485 - 1 325 1 977 2 621 4 657 4 013
Profit for the period from continuing operations 787 41 1 790 - 9 737 - 5 188 6 339 Discontinued operation Profit for the period from discontinued operations, net after tax - 599 1 559 - 23 642 - 12 488 - 14 578 - 25 732
Profit for the period 188 1 600 - 21 852 - 22 225 - 19 766 - 19 393 Attributable to owner of the Parent Company - 35 1 403 - 22 269 - 18 914 - 16 672 - 20 027
Attributable to non-controlling interests 223 197 417 - 3 311 - 3 094 634
Supplementary information for continuing operations Operating profit before depreciation, amortisation and impairment losses (EBITDA) 5 886 5 816 23 896 22 875 30 604 31 625 Underlying operating profit before depreciation, amortisation and impairment losses 6 137 6 122 25 264 25 007 35 229 35 486 Underlying operating profit 2 602 2 680 14 602 14 123 20 529 21 008 Financial items, net excl. discounting effects attributable to provisions and return from the Swedish Nuclear Waste Fund - 1 283 - 437 - 2 662 - 2 367 - 3 036 - 3 331
1) Of which, depreciation, amortisation and impairment losses - 3 216 - 3 101 - 18 433 - 30 708 - 34 236 - 21 961
2) Of which, depreciation, amortisation and impairment losses - 419 - 375 - 1 285 - 836 - 1 396 - 1 845
3) Of which impairment losses — — — - 41 - 41 —
4) Including items affecting comparability - 351 - 340 - 10 424 - 22 833 - 25 598 - 13 189
5) Including return from the Swedish Nuclear Waste Fund 250 167 762 933 1 168 997
6) Including interest components related to pension costs - 240 - 232 - 712 - 693 - 922 - 941
7) Including discounting effects attributable to provisions - 916 - 704 - 2 465 - 2 214 - 2 908 - 3 159
8) Items affecting comparability recognised as financial income and expenses, net — - 15 1 - 18 - 18 1
9) The value for 2015 has been recalculated compared with information previously published in Vattenfall’s 2015 interim reports and 2015 Annual and Sustainability Report. This is because the lignite operations have been divested and are reported as a discontinued operation in accordance with IFRS 5.

Vattenfall Interim Report January-September 2016 20
Consolidated statement of comprehensive income (Reporting of figures and comments pertains to Total Vattenfall)
Q3 Q3 Q1-Q3 Q1-Q3 Full year Last 12 Total Vattenfall, amounts in SEK million 2016 2015 2016 2015 2015 months
Profit for the period 188 1 600 - 21 852 - 22 225 - 19 766 - 19 393
Other comprehensive income
Items that will be reclassified to profit or loss when specific conditions are met Cash flow hedges - changes in fair value - 9 075 6 108 - 15 925 9 725 11 354 - 14 296
Cash flow hedges - dissolved against income statement 4 654 - 1 536 1 420 - 4 387 - 5 323 484 Cash flow hedges - transferred to cost of hedged item - 38 - 8 - 45 16 - 3 - 64 Hedging of net investments in foreign operations - 1 241 - 879 - 1 036 275 1 709 398 Translation differences and exchange rate effects net, divested companies 477 — 477 — — 477
Translation differences 2 418 2 028 2 848 1 024 - 1 938 - 114 Income tax relating to items that will be reclassified 1 448 - 971 3 933 - 1 260 - 1 722 3 471 Total items that will be reclassified to profit or loss when specific conditions are met - 1 357 4 742 - 8 328 5 393 4 077 - 9 644 Items that will not be reclassified to profit or loss Remeasurement pertaining to defined benefit obligations - 141 362 - 3 746 2 961 2 867 - 3 840
Income tax relating to items that will not be reclassified 42 - 108 1 086 - 810 - 762 1 134
Total items that will not be reclassified to profit or loss - 99 254 - 2 660 2 151 2 105 - 2 706 Total other comprehensive income, net after tax - 1 456 4 996 - 10 988 7 544 6 182 - 12 350 Total comprehensive income for the period - 1 268 6 596 - 32 840 - 14 681 - 13 584 - 31 743 Attributable to owner of the Parent Company - 1 680 6 209 - 33 480 - 11 405 - 10 398 - 32 473
Attributable to non-controlling interests 412 387 640 - 3 276 - 3 186 730
Vattenfall Interim Report January-September 2016 21
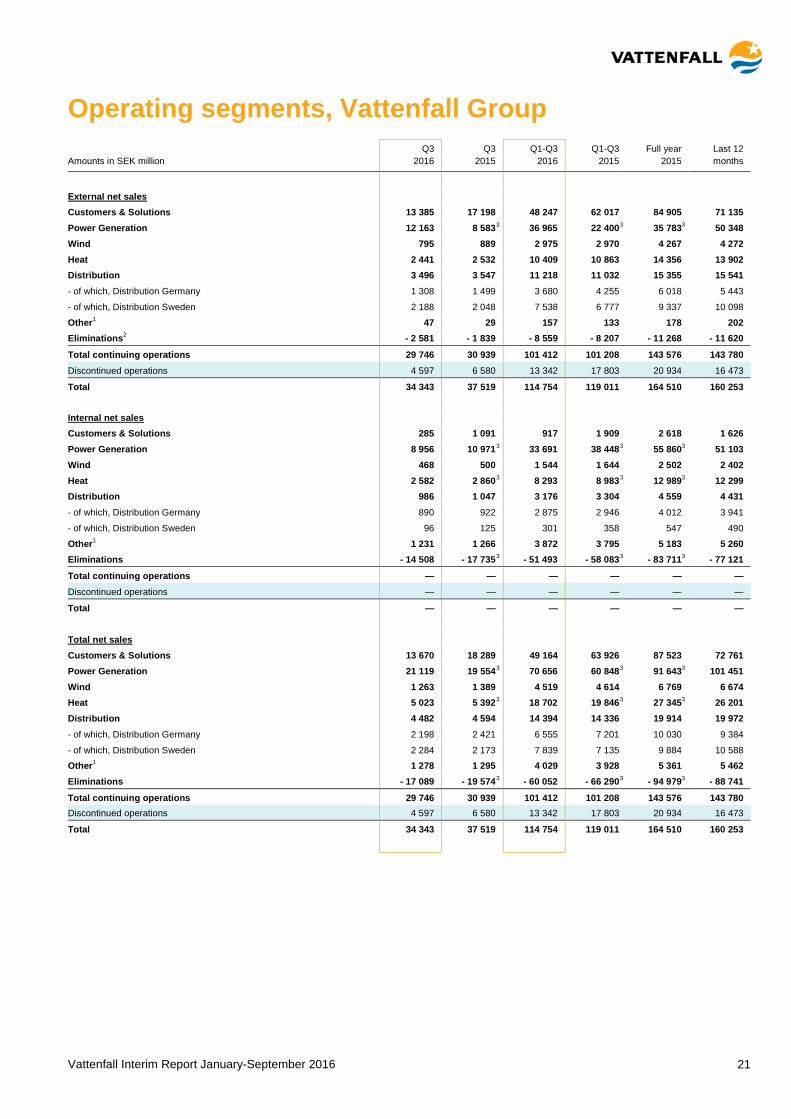
Operating segments, Vattenfall Group Q3 Q3 Q1-Q3 Q1-Q3 Full year Last 12 Amounts in SEK million 2016 2015 2016 2015 2015 months
External net sales
Customers & Solutions 13 385 17 198 48 247 62 017 84 905 71 135 Power Generation 12 163 8 583 3 36 965 22 400 3 35 783 3 50 348
Wind 795 889 2 975 2 970 4 267 4 272
Heat 2 441 2 532 10 409 10 863 14 356 13 902
Distribution 3 496 3 547 11 218 11 032 15 355 15 541
- of which, Distribution Germany 1 308 1 499 3 680 4 255 6 018 5 443
- of which, Distribution Sweden 2 188 2 048 7 538 6 777 9 337 10 098 Other1 47 29 157 133 178 202
Eliminations2 - 2 581 - 1 839 - 8 559 - 8 207 - 11 268 - 11 620
Total continuing operations 29 746 30 939 101 412 101 208 143 576 143 780 Discontinued operations 4 597 6 580 13 342 17 803 20 934 16 473
Total 34 343 37 519 114 754 119 011 164 510 160 253 Internal net sales
Customers & Solutions 285 1 091 917 1 909 2 618 1 626 Power Generation 8 956 10 971 3 33 691 38 448 3 55 860 3 51 103 Wind 468 500 1 544 1 644 2 502 2 402 Heat 2 582 2 860 3 8 293 8 983 3 12 989 3 12 299 Distribution 986 1 047 3 176 3 304 4 559 4 431 - of which, Distribution Germany 890 922 2 875 2 946 4 012 3 941 - of which, Distribution Sweden 96 125 301 358 547 490 Other1 1 231 1 266 3 872 3 795 5 183 5 260 Eliminations - 14 508 - 17 735 3 - 51 493 - 58 083 3 - 83 711 3 - 77 121
Total continuing operations — — — — — — Discontinued operations — — — — — —
Total — — — — — — Total net sales
Customers & Solutions 13 670 18 289 49 164 63 926 87 523 72 761 Power Generation 21 119 19 554 3 70 656 60 848 3 91 643 3 101 451 Wind 1 263 1 389 4 519 4 614 6 769 6 674 Heat 5 023 5 392 3 18 702 19 846 3 27 345 3 26 201 Distribution 4 482 4 594 14 394 14 336 19 914 19 972 - of which, Distribution Germany 2 198 2 421 6 555 7 201 10 030 9 384
- of which, Distribution Sweden 2 284 2 173 7 839 7 135 9 884 10 588 Other1 1 278 1 295 4 029 3 928 5 361 5 462 Eliminations - 17 089 - 19 574 3 - 60 052 - 66 290 3 - 94 979 3 - 88 741
Total continuing operations 29 746 30 939 101 412 101 208 143 576 143 780 Discontinued operations 4 597 6 580 13 342 17 803 20 934 16 473
Total 34 343 37 519 114 754 119 011 164 510 160 253
Vattenfall Interim Report January-September 2016 22
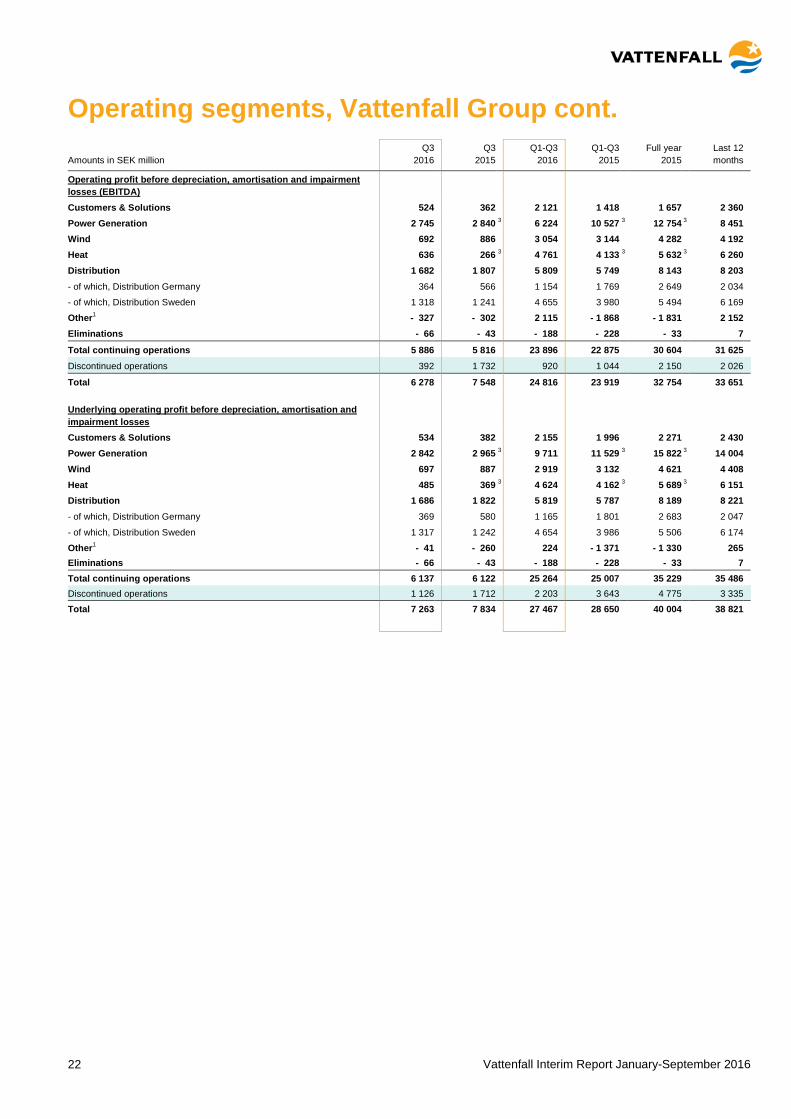
Operating segments, Vattenfall Group cont. Q3 Q3 Q1-Q3 Q1-Q3 Full year Last 12 Amounts in SEK million 2016 2015 2016 2015 2015 months
Operating profit before depreciation, amortisation and impairment losses (EBITDA)
Customers & Solutions 524 362 2 121
1 418 1 657 2 360
Power Generation 2 745 2 840 3 6 224
10 527 3 12 754 3 8 451
Wind 692 886 3 054
3 144 4 282 4 192
Heat 636 266 3 4 761
4 133 3 5 632 3 6 260
Distribution 1 682 1 807 5 809
5 749 8 143 8 203
- of which, Distribution Germany 364 566 1 154
1 769 2 649 2 034
- of which, Distribution Sweden 1 318 1 241 4 655
3 980 5 494 6 169
Other1 - 327 - 302 2 115
- 1 868 - 1 831 2 152
Eliminations - 66 - 43 - 188
- 228 - 33 7
Total continuing operations 5 886 5 816 23 896
22 875 30 604 31 625
Discontinued operations 392 1 732 920
1 044 2 150 2 026
Total 6 278 7 548 24 816
23 919 32 754 33 651
Underlying operating profit before depreciation, amortisation and impairment losses
Customers & Solutions 534 382 2 155
1 996 2 271 2 430
Power Generation 2 842 2 965 3 9 711
11 529 3 15 822 3 14 004
Wind 697 887 2 919
3 132 4 621 4 408
Heat 485 369 3 4 624
4 162 3 5 689 3 6 151
Distribution 1 686 1 822 5 819
5 787 8 189 8 221
- of which, Distribution Germany 369 580 1 165
1 801 2 683 2 047
- of which, Distribution Sweden 1 317 1 242 4 654
3 986 5 506 6 174
Other1 - 41 - 260 224
- 1 371 - 1 330 265
Eliminations - 66 - 43 - 188
- 228 - 33 7
Total continuing operations 6 137 6 122 25 264
25 007 35 229 35 486
Discontinued operations 1 126 1 712 2 203
3 643 4 775 3 335
Total 7 263 7 834 27 467
28 650 40 004 38 821
Vattenfall Interim Report January-September 2016 23
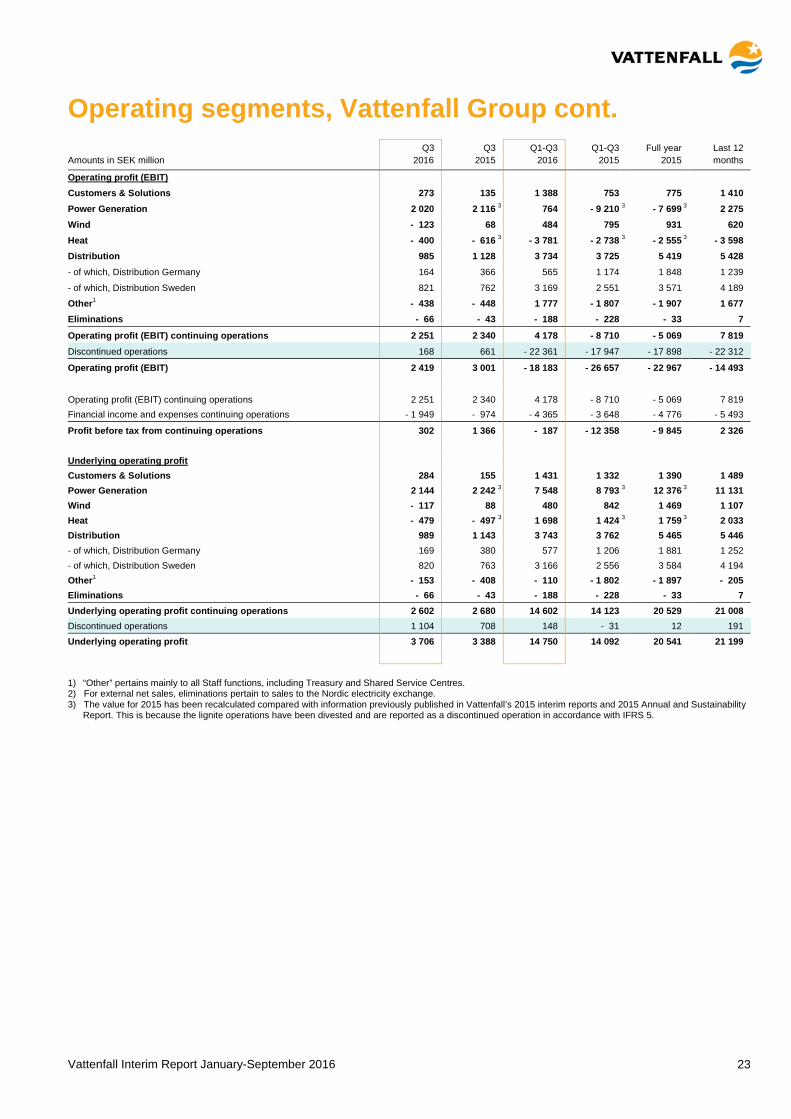
Operating segments, Vattenfall Group cont. Q3 Q3 Q1-Q3 Q1-Q3 Full year Last 12 Amounts in SEK million 2016 2015 2016 2015 2015 months
Operating profit (EBIT)
Customers & Solutions 273 135 1 388
753 775 1 410
Power Generation 2 020 2 116 3 764
- 9 210 3 - 7 699 3 2 275
Wind - 123 68 484
795 931 620
Heat - 400 - 616 3 - 3 781
- 2 738 3 - 2 555 3 - 3 598
Distribution 985 1 128 3 734
3 725 5 419 5 428
- of which, Distribution Germany 164 366 565
1 174 1 848 1 239
- of which, Distribution Sweden 821 762 3 169
2 551 3 571 4 189
Other1 - 438 - 448 1 777
- 1 807 - 1 907 1 677
Eliminations - 66 - 43 - 188
- 228 - 33 7
Operating profit (EBIT) continuing operations 2 251 2 340 4 178
- 8 710 - 5 069 7 819
Discontinued operations 168 661 - 22 361
- 17 947 - 17 898 - 22 312
Operating profit (EBIT) 2 419 3 001 - 18 183
- 26 657 - 22 967 - 14 493
Operating profit (EBIT) continuing operations 2 251 2 340 4 178
- 8 710 - 5 069 7 819
Financial income and expenses continuing operations - 1 949 - 974 - 4 365
- 3 648 - 4 776 - 5 493
Profit before tax from continuing operations 302 1 366 - 187
- 12 358 - 9 845 2 326
Underlying operating profit Customers & Solutions 284
155 1 431 1 332 1 390 1 489
Power Generation 2 144 2 242 3 7 548
8 793 3 12 376 3 11 131
Wind - 117 88 480
842 1 469 1 107
Heat - 479 - 497 3 1 698
1 424 3 1 759 3 2 033
Distribution 989 1 143 3 743
3 762 5 465 5 446
- of which, Distribution Germany 169 380 577
1 206 1 881 1 252
- of which, Distribution Sweden 820 763 3 166
2 556 3 584 4 194
Other1 - 153 - 408 - 110
- 1 802 - 1 897 - 205
Eliminations - 66 - 43 - 188
- 228 - 33 7
Underlying operating profit continuing operations 2 602 2 680 14 602
14 123 20 529 21 008
Discontinued operations 1 104 708 148
- 31 12 191
Underlying operating profit 3 706 3 388 14 750
14 092 20 541 21 199
1) “Other” pertains mainly to all Staff functions, including Treasury and Shared Service Centres. 2) For external net sales, eliminations pertain to sales to the Nordic electricity exchange. 3) The value for 2015 has been recalculated compared with information previously published in Vattenfall’s 2015 interim reports and 2015 Annual and Sustainability
Report. This is because the lignite operations have been divested and are reported as a discontinued operation in accordance with IFRS 5.
Vattenfall Interim Report January-September 2016 24
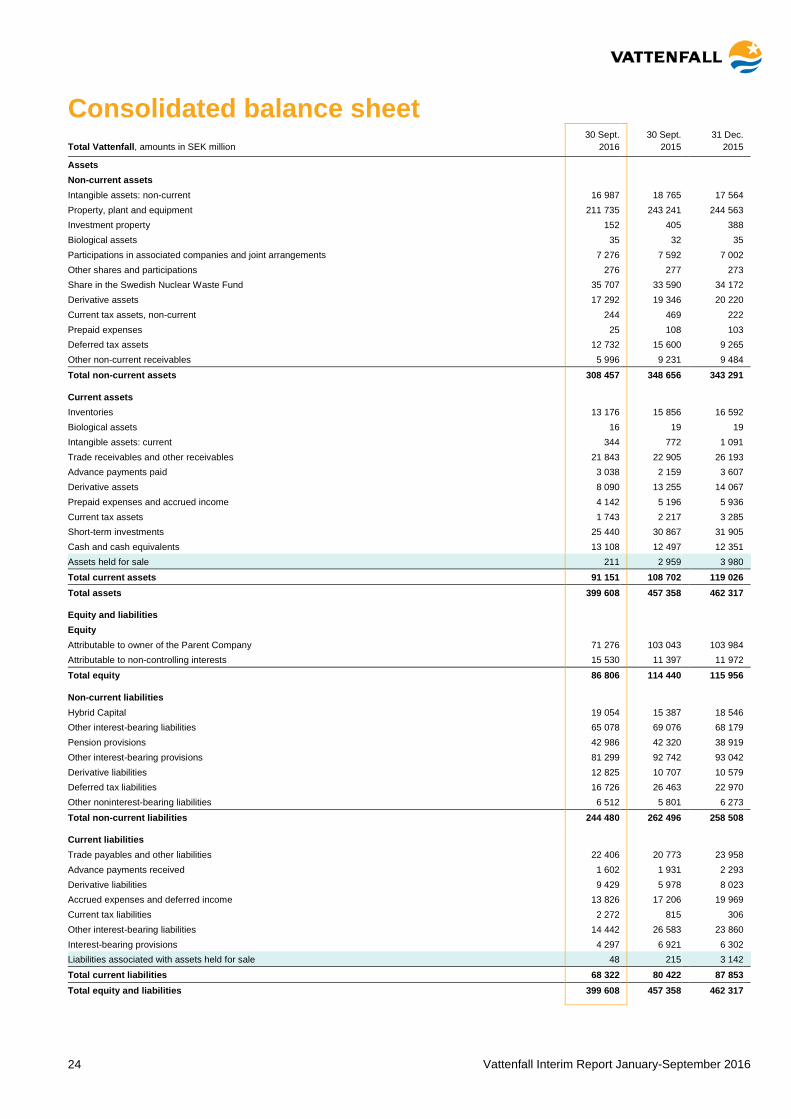
Consolidated balance sheet 30 Sept. 30 Sept. 31 Dec. Total Vattenfall, amounts in SEK million 2016 2015 2015
Assets Non-current assets Intangible assets: non-current 16 987 18 765 17 564 Property, plant and equipment 211 735 243 241 244 563 Investment property 152 405 388 Biological assets 35 32 35 Participations in associated companies and joint arrangements 7 276 7 592 7 002 Other shares and participations 276 277 273 Share in the Swedish Nuclear Waste Fund 35 707 33 590 34 172 Derivative assets 17 292 19 346 20 220 Current tax assets, non-current 244 469 222 Prepaid expenses 25 108 103 Deferred tax assets 12 732 15 600 9 265 Other non-current receivables 5 996 9 231 9 484
Total non-current assets 308 457 348 656 343 291
Current assets Inventories 13 176 15 856 16 592 Biological assets 16 19 19 Intangible assets: current 344 772 1 091 Trade receivables and other receivables 21 843 22 905 26 193 Advance payments paid 3 038 2 159 3 607 Derivative assets 8 090 13 255 14 067 Prepaid expenses and accrued income 4 142 5 196 5 936 Current tax assets 1 743 2 217 3 285 Short-term investments 25 440 30 867 31 905 Cash and cash equivalents 13 108 12 497 12 351 Assets held for sale 211 2 959 3 980
Total current assets 91 151 108 702 119 026 Total assets 399 608 457 358 462 317
Equity and liabilities Equity Attributable to owner of the Parent Company 71 276 103 043 103 984 Attributable to non-controlling interests 15 530 11 397 11 972
Total equity 86 806 114 440 115 956
Non-current liabilities Hybrid Capital 19 054 15 387 18 546 Other interest-bearing liabilities 65 078 69 076 68 179 Pension provisions 42 986 42 320 38 919 Other interest-bearing provisions 81 299 92 742 93 042 Derivative liabilities 12 825 10 707 10 579 Deferred tax liabilities 16 726 26 463 22 970 Other noninterest-bearing liabilities 6 512 5 801 6 273
Total non-current liabilities 244 480 262 496 258 508
Current liabilities Trade payables and other liabilities 22 406 20 773 23 958 Advance payments received 1 602 1 931 2 293 Derivative liabilities 9 429 5 978 8 023 Accrued expenses and deferred income 13 826 17 206 19 969 Current tax liabilities 2 272 815 306 Other interest-bearing liabilities 14 442 26 583 23 860 Interest-bearing provisions 4 297 6 921 6 302 Liabilities associated with assets held for sale 48 215 3 142
Total current liabilities 68 322 80 422 87 853 Total equity and liabilities 399 608 457 358 462 317

Vattenfall Interim Report January-September 2016 25
Consolidated balance sheet, cont. Supplementary information 30 Sept. 30 Sept. 31 Dec. Amounts in SEK million1 2016 2015 2015
Calculation of capital employed Intangible assets: current and non-current 17 331 19 537 18 655 Property, plant and equipment 211 735 243 241 244 563 Participations in associated companies and joint arrangements 7 276 7 592 7 002 Deferred and current tax assets 14 475 17 817 12 550 Non-current noninterest-bearing receivables 4 875 8 041 8 309 Inventories 13 176 15 856 16 592 Trade receivables and other receivables 21 843 22 905 26 193 Prepaid expenses and accrued income 4 142 5 196 5 936 Unavailable liquidity 7 264 6 810 6 813 Other 798 1 071 719
Total assets excl. financial assets 302 915 348 066 347 332 Deferred and current tax liabilities - 18 998 - 27 278 - 23 276 Other noninterest-bearing liabilities - 6 512 - 5 801 - 6 273 Trade payable and other liabilities - 22 406 - 20 773 - 23 958 Accrued expenses and deferred income - 13 826 - 17 206 - 19 969 Other — — - 77 Total noninterest-bearing liabilities - 61 742 - 71 058 - 73 553 Other interest-bearing provisions not related to adjusted net debt2 - 8 672 - 9 892 - 9 188
Capital employed3 232 501 267 116 264 591 Capital employed, average 249 809 274 459 279 435
Calculation of net debt Hybrid Capital - 19 054 - 15 387 - 18 546 Bond issues, commercial paper and liabilities to credit institutions - 57 092 - 71 505 - 68 898 Liabilities to associated companies - 2 861 - 2 742 - 2 751 Liabilities to owners of non-controlling interests - 10 321 - 13 155 - 13 041 Other liabilities - 9 244 - 8 257 - 7 349
Total interest-bearing liabilities - 98 572 - 111 046 - 110 585 Cash and cash equivalents 13 108 12 497 12 351 Short-term investments 25 440 30 867 31 905 Loans to owners of non-controlling interests in foreign Group companies 2 053 2 277 2 128 Net debt3 - 57 971 - 65 405 - 64 201
Calculation of adjusted gross debt and net debt Total interest-bearing liabilities - 98 572 - 111 046 - 110 585 50% of Hybrid Capital4 9 527 7 694 9 273 Present value of pension obligations - 42 986 - 42 320 - 38 919 Provisions for mining, gas and wind operations and other environment-related provisions - 4 219 - 18 026 - 19 099 Provisions for nuclear power (net)5 - 33 377 - 33 958 - 32 944 Margin calls received 5 052 5 989 5 307 Liabilities to owners of non-controlling interests due to consortium agreements 9 183 12 052 11 939
Adjusted gross debt - 155 392 - 179 615 - 175 028 Reported cash and cash equivalents and short-term investments 38 548 43 364 44 256 Unavailable liquidity - 7 264 - 6 810 - 6 813
Adjusted cash and cash equivalents and short-term investments 31 284 36 554 37 443 Adjusted net debt3 - 124 108 - 143 061 - 137 585
1) The amounts as per 30 September 2016 pertain to continuing operations, and the amounts as per 30 September 2015 and 31 December 2015 pertain to Total Vattenfall.
2) Includes personnel-related provisions for non-pension purposes, provisions for tax and legal disputes and certain other provisions. 3) See Definitions and calculations of key ratios for definitions of Alternative Performance Measures. 4) 50% of Hybrid Capital is treated as equity by the rating agencies, which thereby reduces adjusted net debt. 5) The calculation is based on Vattenfall’s share of ownership in the respective nuclear power plants, less Vattenfall’s share in the Swedish Nuclear Waste Fund and
liabilities to associated companies. Vattenfall has the following ownership interests in the respective plants: Forsmark 66%, Ringhals 70.4%, Brokdorf 20%, Brunsbüttel 66.7%, Krümmel 50% and Stade 33.3%. (According to a special agreement, Vattenfall is responsible for 100% of the provisions for Ringhals.)
Vattenfall Interim Report January-September 2016 26
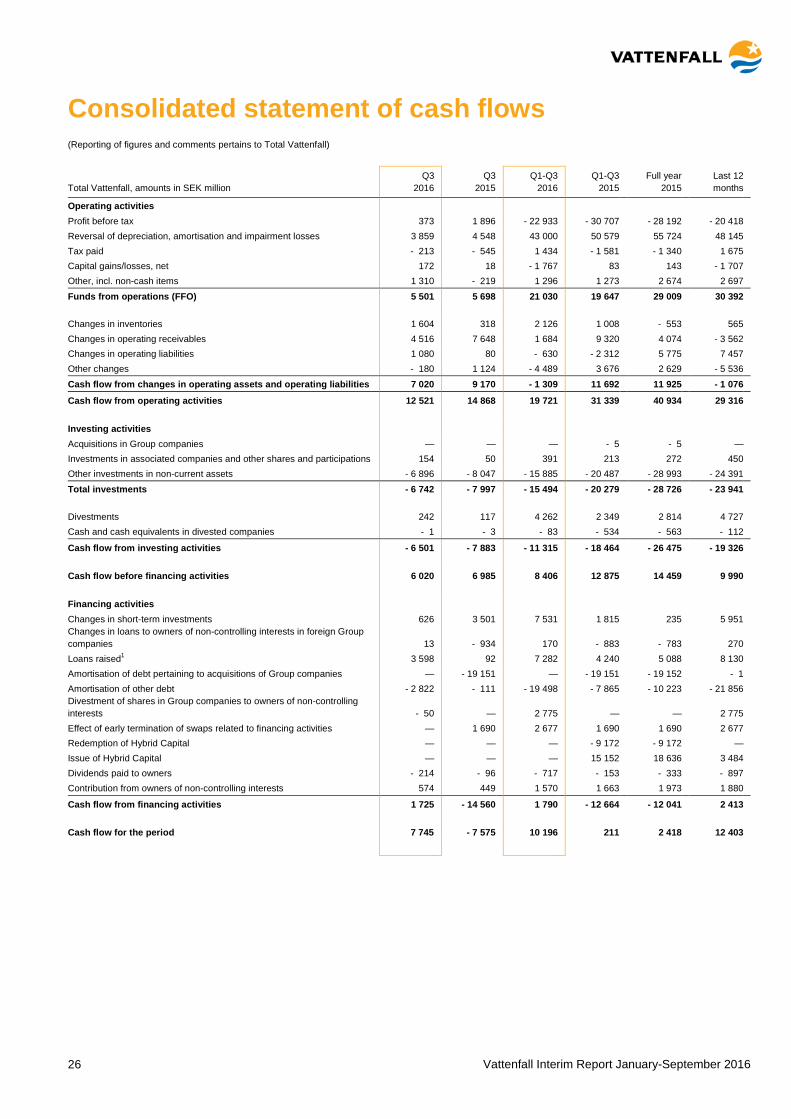
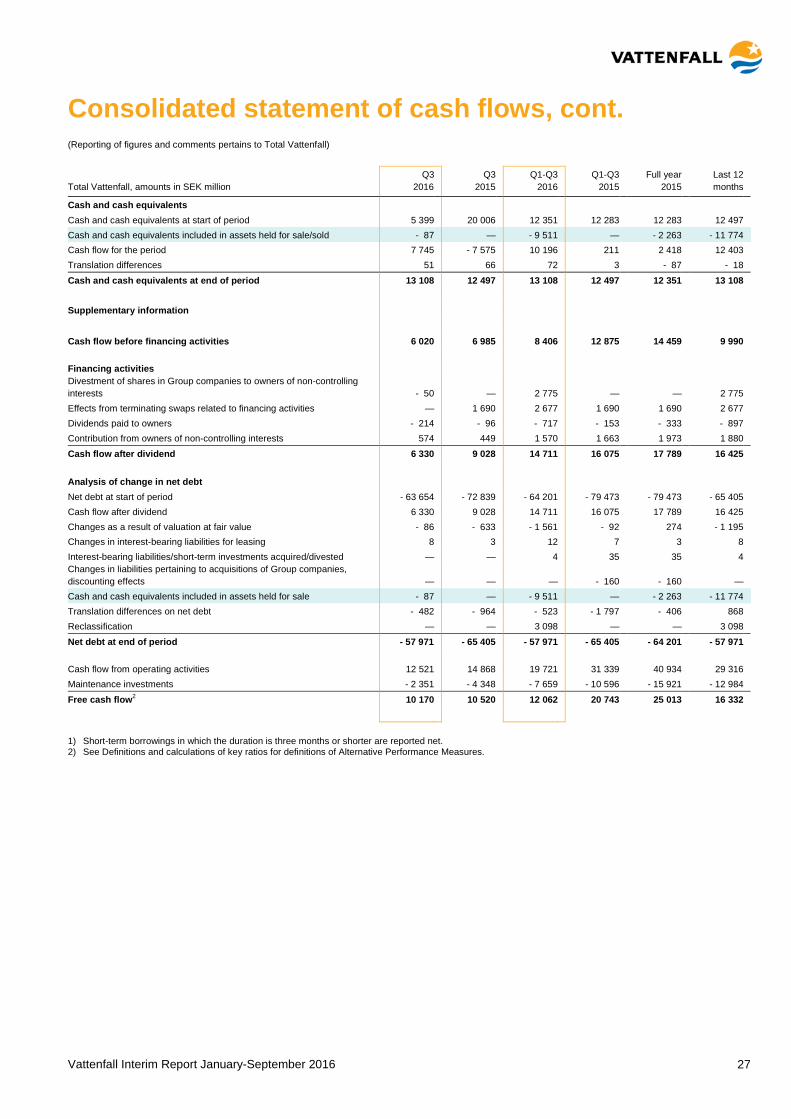
Consolidated statement of cash flows (Reporting of figures and comments pertains to Total Vattenfall)
Q3 Q3 Q1-Q3 Q1-Q3 Full year Last 12 Total Vattenfall, amounts in SEK million 2016 2015 2016 2015 2015 months
Operating activities Profit before tax 373 1 896 - 22 933 - 30 707 - 28 192 - 20 418 Reversal of depreciation, amortisation and impairment losses 3 859 4 548 43 000 50 579 55 724 48 145 Tax paid - 213 - 545 1 434 - 1 581 - 1 340 1 675 Capital gains/losses, net 172 18 - 1 767 83 143 - 1 707 Other, incl. non-cash items 1 310 - 219 1 296 1 273 2 674 2 697
Funds from operations (FFO) 5 501 5 698 21 030 19 647 29 009 30 392 Changes in inventories 1 604 318 2 126 1 008 - 553 565 Changes in operating receivables 4 516 7 648 1 684 9 320 4 074 - 3 562 Changes in operating liabilities 1 080 80 - 630 - 2 312 5 775 7 457 Other changes - 180 1 124 - 4 489 3 676 2 629 - 5 536
Cash flow from changes in operating assets and operating liabilities 7 020 9 170 - 1 309 11 692 11 925 - 1 076
Cash flow from operating activities 12 521 14 868 19 721 31 339 40 934 29 316
Investing activities Acquisitions in Group companies — — — - 5 - 5 — Investments in associated companies and other shares and participations 154 50 391 213 272 450 Other investments in non-current assets - 6 896 - 8 047 - 15 885 - 20 487 - 28 993 - 24 391
Total investments - 6 742 - 7 997 - 15 494 - 20 279 - 28 726 - 23 941 Divestments 242 117 4 262 2 349 2 814 4 727 Cash and cash equivalents in divested companies - 1 - 3 - 83 - 534 - 563 - 112
Cash flow from investing activities - 6 501 - 7 883 - 11 315 - 18 464 - 26 475 - 19 326
Cash flow before financing activities 6 020 6 985 8 406 12 875 14 459 9 990
Financing activities Changes in short-term investments 626 3 501 7 531 1 815 235 5 951 Changes in loans to owners of non-controlling interests in foreign Group companies 13 - 934 170 - 883 - 783 270 Loans raised1 3 598 92 7 282 4 240 5 088 8 130 Amortisation of debt pertaining to acquisitions of Group companies — - 19 151 — - 19 151 - 19 152 - 1 Amortisation of other debt - 2 822 - 111 - 19 498 - 7 865 - 10 223 - 21 856 Divestment of shares in Group companies to owners of non-controlling interests - 50 — 2 775 — — 2 775 Effect of early termination of swaps related to financing activities — 1 690 2 677 1 690 1 690 2 677 Redemption of Hybrid Capital — — — - 9 172 - 9 172 — Issue of Hybrid Capital — — — 15 152 18 636 3 484 Dividends paid to owners - 214 - 96 - 717 - 153 - 333 - 897 Contribution from owners of non-controlling interests 574 449 1 570 1 663 1 973 1 880
Cash flow from financing activities 1 725 - 14 560 1 790 - 12 664 - 12 041 2 413 Cash flow for the period 7 745 - 7 575 10 196 211 2 418 12 403
Vattenfall Interim Report January-September 2016 27
Consolidated statement of cash flows, cont. (Reporting of figures and comments pertains to Total Vattenfall)
Q3 Q3 Q1-Q3 Q1-Q3 Full year Last 12 Total Vattenfall, amounts in SEK million 2016 2015 2016 2015 2015 months
Cash and cash equivalents Cash and cash equivalents at start of period 5 399 20 006 12 351 12 283 12 283 12 497 Cash and cash equivalents included in assets held for sale/sold - 87 — - 9 511 — - 2 263 - 11 774 Cash flow for the period 7 745 - 7 575 10 196 211 2 418 12 403 Translation differences 51 66 72 3 - 87 - 18
Cash and cash equivalents at end of period 13 108 12 497 13 108 12 497 12 351 13 108 Supplementary information
Cash flow before financing activities 6 020 6 985 8 406 12 875 14 459 9 990 Financing activities Divestment of shares in Group companies to owners of non-controlling interests - 50 — 2 775 — — 2 775 Effects from terminating swaps related to financing activities — 1 690 2 677 1 690 1 690 2 677 Dividends paid to owners - 214 - 96 - 717 - 153 - 333 - 897 Contribution from owners of non-controlling interests 574 449 1 570 1 663 1 973 1 880
Cash flow after dividend 6 330 9 028 14 711 16 075 17 789 16 425
Analysis of change in net debt Net debt at start of period - 63 654 - 72 839 - 64 201 - 79 473 - 79 473 - 65 405 Cash flow after dividend 6 330 9 028 14 711 16 075 17 789 16 425 Changes as a result of valuation at fair value - 86 - 633 - 1 561 - 92 274 - 1 195 Changes in interest-bearing liabilities for leasing 8 3 12 7 3 8 Interest-bearing liabilities/short-term investments acquired/divested — — 4 35 35 4 Changes in liabilities pertaining to acquisitions of Group companies, discounting effects — — — - 160 - 160 — Cash and cash equivalents included in assets held for sale - 87 — - 9 511 — - 2 263 - 11 774 Translation differences on net debt - 482 - 964 - 523 - 1 797 - 406 868 Reclassification — — 3 098 — — 3 098
Net debt at end of period - 57 971 - 65 405 - 57 971 - 65 405 - 64 201 - 57 971 Cash flow from operating activities 12 521 14 868 19 721 31 339 40 934 29 316 Maintenance investments - 2 351 - 4 348 - 7 659 - 10 596 - 15 921 - 12 984
Free cash flow2 10 170 10 520 12 062 20 743 25 013 16 332
1) Short-term borrowings in which the duration is three months or shorter are reported net. 2) See Definitions and calculations of key ratios for definitions of Alternative Performance Measures.
Vattenfall Interim Report January-September 2016 28
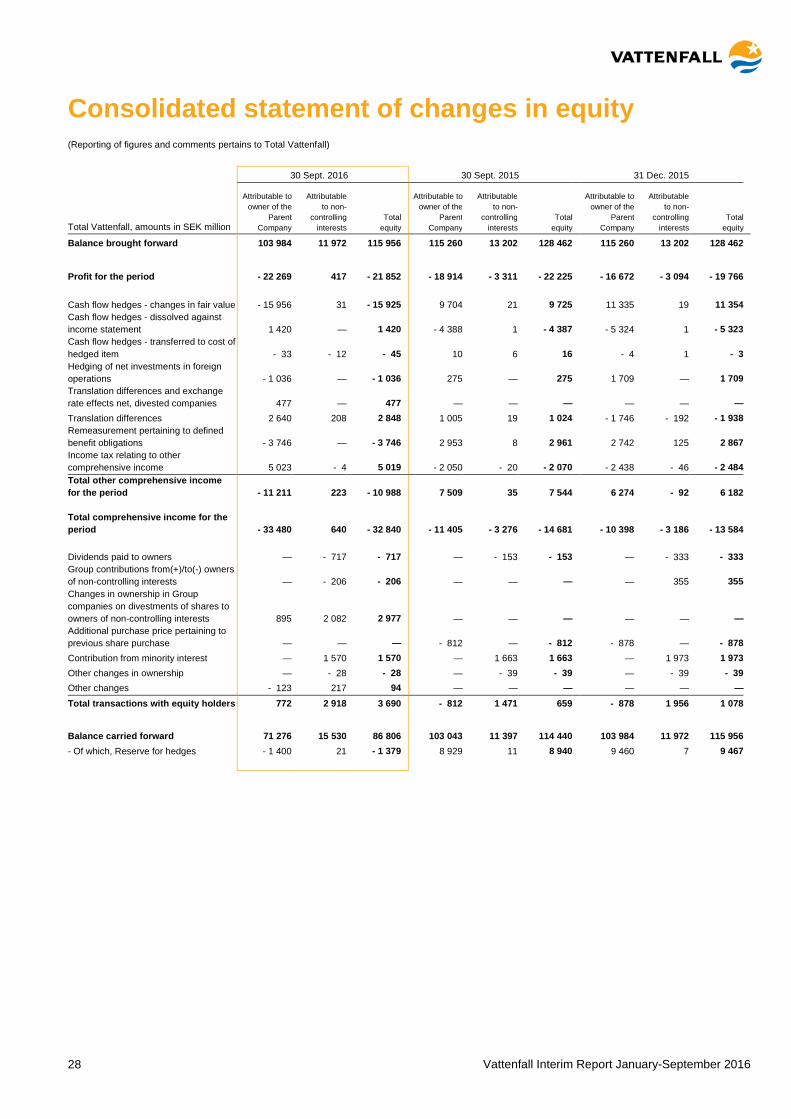
Consolidated statement of changes in equity (Reporting of figures and comments pertains to Total Vattenfall)
30 Sept. 2016 30 Sept. 2015 31 Dec. 2015
Total Vattenfall, amounts in SEK million
Attributable to owner of the
Parent Company
Attributable to non-
controlling interests
Total equity
Attributable to owner of the
Parent Company
Attributable to non-
controlling interests
Total equity
Attributable to owner of the
Parent Company
Attributable to non-
controlling interests
Total equity
Balance brought forward 103 984 11 972 115 956 115 260 13 202 128 462 115 260 13 202 128 462
Profit for the period - 22 269 417 - 21 852 - 18 914 - 3 311 - 22 225 - 16 672 - 3 094 - 19 766
Cash flow hedges - changes in fair value - 15 956 31 - 15 925 9 704 21 9 725 11 335 19 11 354 Cash flow hedges - dissolved against income statement 1 420 — 1 420 - 4 388 1 - 4 387 - 5 324 1 - 5 323 Cash flow hedges - transferred to cost of hedged item - 33 - 12 - 45 10 6 16 - 4 1 - 3 Hedging of net investments in foreign operations - 1 036 — - 1 036 275 — 275 1 709 — 1 709 Translation differences and exchange rate effects net, divested companies 477 — 477 — — — — — — Translation differences 2 640 208 2 848 1 005 19 1 024 - 1 746 - 192 - 1 938 Remeasurement pertaining to defined benefit obligations - 3 746 — - 3 746 2 953 8 2 961 2 742 125 2 867 Income tax relating to other comprehensive income 5 023 - 4 5 019 - 2 050 - 20 - 2 070 - 2 438 - 46 - 2 484 Total other comprehensive income for the period - 11 211 223 - 10 988 7 509 35 7 544 6 274 - 92 6 182 Total comprehensive income for the period - 33 480 640 - 32 840 - 11 405 - 3 276 - 14 681 - 10 398 - 3 186 - 13 584 Dividends paid to owners — - 717 - 717 — - 153 - 153 — - 333 - 333 Group contributions from(+)/to(-) owners of non-controlling interests — - 206 - 206 — — — — 355 355 Changes in ownership in Group companies on divestments of shares to owners of non-controlling interests 895 2 082 2 977 — — — — — — Additional purchase price pertaining to previous share purchase — — — - 812 — - 812 - 878 — - 878 Contribution from minority interest — 1 570 1 570 — 1 663 1 663 — 1 973 1 973 Other changes in ownership — - 28 - 28 — - 39 - 39 — - 39 - 39 Other changes - 123 217 94 — — — — — — Total transactions with equity holders 772 2 918 3 690 - 812 1 471 659 - 878 1 956 1 078
Balance carried forward 71 276 15 530 86 806 103 043 11 397 114 440 103 984 11 972 115 956 - Of which, Reserve for hedges - 1 400 21 - 1 379 8 929 11 8 940 9 460 7 9 467
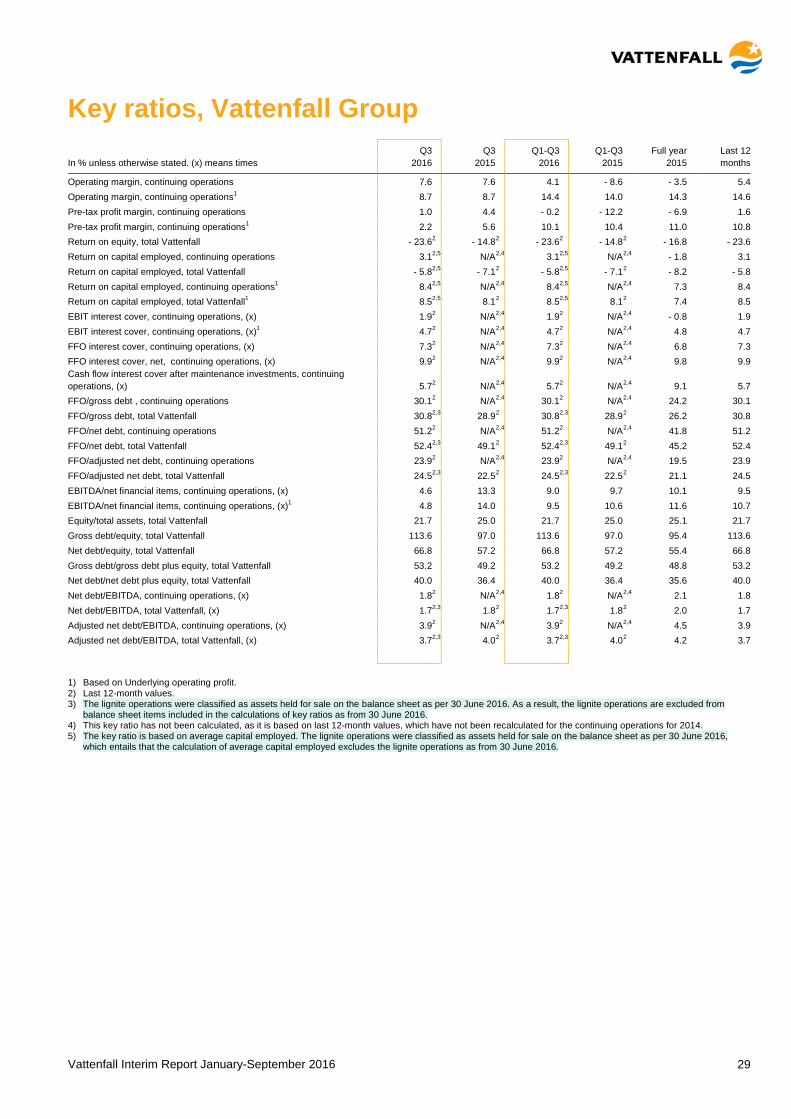
Vattenfall Interim Report January-September 2016 29
Key ratios, Vattenfall Group Q3 Q3 Q1-Q3 Q1-Q3 Full year Last 12 In % unless otherwise stated. (x) means times 2016 2015 2016 2015 2015 months
Operating margin, continuing operations 7.6 7.6 4.1 - 8.6 - 3.5 5.4 Operating margin, continuing operations1 8.7 8.7 14.4 14.0 14.3 14.6 Pre-tax profit margin, continuing operations 1.0 4.4 - 0.2 - 12.2 - 6.9 1.6 Pre-tax profit margin, continuing operations1 2.2 5.6 10.1 10.4 11.0 10.8 Return on equity, total Vattenfall - 23.6 2 - 14.8 2 - 23.6 2 - 14.8 2 - 16.8 - 23.6 Return on capital employed, continuing operations 3.1 2,5 N/A 2,4 3.1 2,5 N/A 2,4 - 1.8 3.1 Return on capital employed, total Vattenfall - 5.8 2,5 - 7.1 2 - 5.8 2,5 - 7.1 2 - 8.2 - 5.8 Return on capital employed, continuing operations1 8.4 2,5 N/A 2,4 8.4 2,5 N/A 2,4 7.3 8.4 Return on capital employed, total Vattenfall1 8.5 2,5 8.1 2 8.5 2,5 8.1 2 7.4 8.5 EBIT interest cover, continuing operations, (x) 1.9 2 N/A 2,4 1.9 2 N/A 2,4 - 0.8 1.9 EBIT interest cover, continuing operations, (x)1 4.7 2 N/A 2,4 4.7 2 N/A 2,4 4.8 4.7 FFO interest cover, continuing operations, (x) 7.3 2 N/A 2,4 7.3 2 N/A 2,4 6.8 7.3 FFO interest cover, net, continuing operations, (x) 9.9 2 N/A 2,4 9.9 2 N/A 2,4 9.8 9.9 Cash flow interest cover after maintenance investments, continuing operations, (x) 5.7 2 N/A 2,4 5.7 2 N/A 2,4 9.1 5.7 FFO/gross debt , continuing operations 30.1 2 N/A 2,4 30.1 2 N/A 2,4 24.2 30.1 FFO/gross debt, total Vattenfall 30.8 2,3 28.9 2 30.8 2,3 28.9 2 26.2 30.8 FFO/net debt, continuing operations 51.2 2 N/A 2,4 51.2 2 N/A 2,4 41.8 51.2 FFO/net debt, total Vattenfall 52.4 2,3 49.1 2 52.4 2,3 49.1 2 45.2 52.4 FFO/adjusted net debt, continuing operations 23.9 2 N/A 2,4 23.9 2 N/A 2,4 19.5 23.9 FFO/adjusted net debt, total Vattenfall 24.5 2,3 22.5 2 24.5 2,3 22.5 2 21.1 24.5 EBITDA/net financial items, continuing operations, (x) 4.6 13.3 9.0 9.7 10.1 9.5 EBITDA/net financial items, continuing operations, (x)1 4.8 14.0 9.5 10.6 11.6 10.7 Equity/total assets, total Vattenfall 21.7 25.0 21.7 25.0 25.1 21.7 Gross debt/equity, total Vattenfall 113.6 97.0 113.6 97.0 95.4 113.6 Net debt/equity, total Vattenfall 66.8 57.2 66.8 57.2 55.4 66.8 Gross debt/gross debt plus equity, total Vattenfall 53.2 49.2 53.2 49.2 48.8 53.2 Net debt/net debt plus equity, total Vattenfall 40.0 36.4 40.0 36.4 35.6 40.0 Net debt/EBITDA, continuing operations, (x) 1.8 2 N/A 2,4 1.8 2 N/A 2,4 2.1 1.8 Net debt/EBITDA, total Vattenfall, (x) 1.7 2,3 1.8 2 1.7 2,3 1.8 2 2.0 1.7 Adjusted net debt/EBITDA, continuing operations, (x) 3.9 2 N/A 2,4 3.9 2 N/A 2,4 4.5 3.9 Adjusted net debt/EBITDA, total Vattenfall, (x) 3.7 2,3 4.0 2 3.7 2,3 4.0 2 4.2 3.7
1) Based on Underlying operating profit. 2) Last 12-month values. 3) The lignite operations were classified as assets held for sale on the balance sheet as per 30 June 2016. As a result, the lignite operations are excluded from
balance sheet items included in the calculations of key ratios as from 30 June 2016. 4) This key ratio has not been calculated, as it is based on last 12-month values, which have not been recalculated for the continuing operations for 2014. 5) The key ratio is based on average capital employed. The lignite operations were classified as assets held for sale on the balance sheet as per 30 June 2016,
which entails that the calculation of average capital employed excludes the lignite operations as from 30 June 2016.
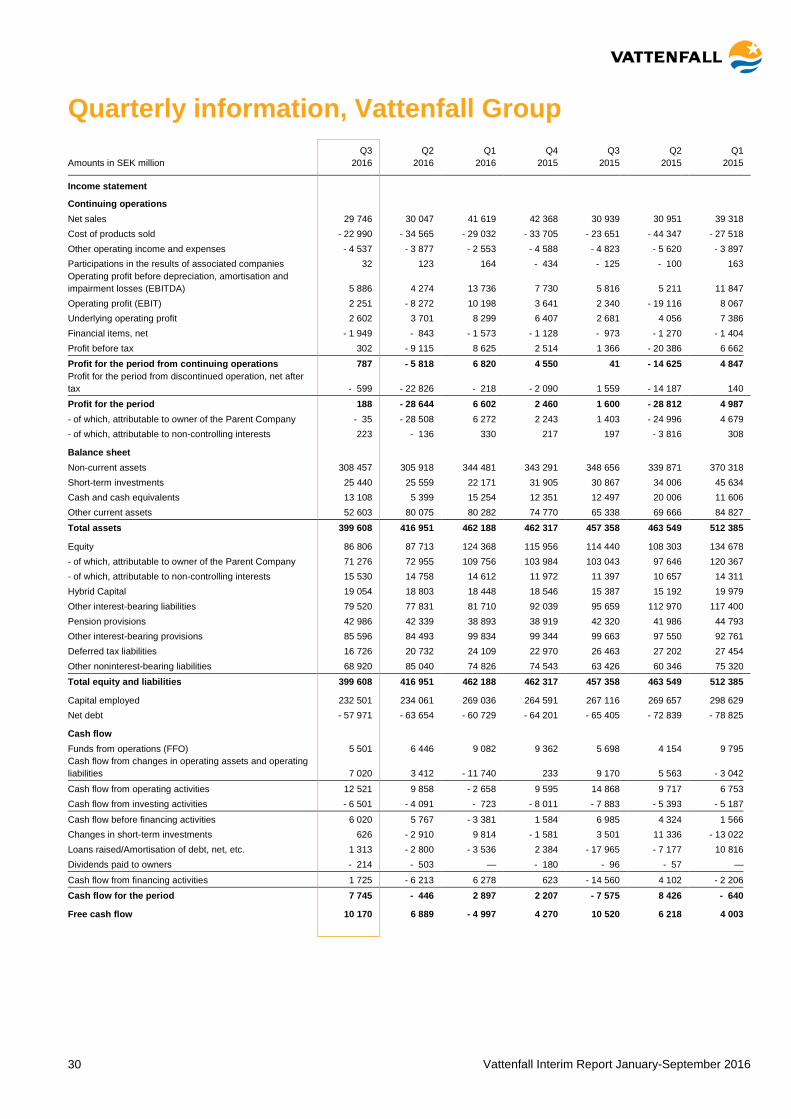
Vattenfall Interim Report January-September 2016 30
Quarterly information, Vattenfall Group Q3
Q2 Q1 Q4 Q3 Q2 Q1 Amounts in SEK million 2016 2016 2016 2015 2015 2015 2015
Income statement
Continuing operations Net sales 29 746 30 047 41 619 42 368 30 939 30 951 39 318 Cost of products sold - 22 990 - 34 565 - 29 032 - 33 705 - 23 651 - 44 347 - 27 518 Other operating income and expenses - 4 537 - 3 877 - 2 553 - 4 588 - 4 823 - 5 620 - 3 897 Participations in the results of associated companies 32 123 164 - 434 - 125 - 100 163 Operating profit before depreciation, amortisation and impairment losses (EBITDA) 5 886 4 274 13 736 7 730 5 816 5 211 11 847 Operating profit (EBIT) 2 251 - 8 272 10 198 3 641 2 340 - 19 116 8 067 Underlying operating profit 2 602 3 701 8 299 6 407 2 681 4 056 7 386 Financial items, net - 1 949 - 843 - 1 573 - 1 128 - 973 - 1 270 - 1 404 Profit before tax 302 - 9 115 8 625 2 514 1 366 - 20 386 6 662
Profit for the period from continuing operations 787 - 5 818 6 820 4 550 41 - 14 625 4 847 Profit for the period from discontinued operation, net after tax - 599 - 22 826 - 218 - 2 090 1 559 - 14 187 140
Profit for the period 188 - 28 644 6 602 2 460 1 600 - 28 812 4 987 - of which, attributable to owner of the Parent Company - 35 - 28 508 6 272 2 243 1 403 - 24 996 4 679 - of which, attributable to non-controlling interests 223 - 136 330 217 197 - 3 816 308
Balance sheet Non-current assets 308 457 305 918 344 481 343 291 348 656 339 871 370 318 Short-term investments 25 440 25 559 22 171 31 905 30 867 34 006 45 634 Cash and cash equivalents 13 108 5 399 15 254 12 351 12 497 20 006 11 606 Other current assets 52 603 80 075 80 282 74 770 65 338 69 666 84 827
Total assets 399 608 416 951 462 188 462 317 457 358 463 549 512 385
Equity 86 806 87 713 124 368 115 956 114 440 108 303 134 678 - of which, attributable to owner of the Parent Company 71 276 72 955 109 756 103 984 103 043 97 646 120 367 - of which, attributable to non-controlling interests 15 530 14 758 14 612 11 972 11 397 10 657 14 311 Hybrid Capital 19 054 18 803 18 448 18 546 15 387 15 192 19 979 Other interest-bearing liabilities 79 520 77 831 81 710 92 039 95 659 112 970 117 400 Pension provisions 42 986 42 339 38 893 38 919 42 320 41 986 44 793 Other interest-bearing provisions 85 596 84 493 99 834 99 344 99 663 97 550 92 761 Deferred tax liabilities 16 726 20 732 24 109 22 970 26 463 27 202 27 454 Other noninterest-bearing liabilities 68 920 85 040 74 826 74 543 63 426 60 346 75 320
Total equity and liabilities 399 608 416 951 462 188 462 317 457 358 463 549 512 385
Capital employed 232 501 234 061 269 036 264 591 267 116 269 657 298 629 Net debt - 57 971 - 63 654 - 60 729 - 64 201 - 65 405 - 72 839 - 78 825
Cash flow Funds from operations (FFO) 5 501 6 446 9 082 9 362 5 698 4 154 9 795 Cash flow from changes in operating assets and operating liabilities 7 020 3 412 - 11 740 233 9 170 5 563 - 3 042
Cash flow from operating activities 12 521 9 858 - 2 658 9 595 14 868 9 717 6 753 Cash flow from investing activities - 6 501 - 4 091 - 723 - 8 011 - 7 883 - 5 393 - 5 187
Cash flow before financing activities 6 020 5 767 - 3 381 1 584 6 985 4 324 1 566 Changes in short-term investments 626 - 2 910 9 814 - 1 581 3 501 11 336 - 13 022 Loans raised/Amortisation of debt, net, etc. 1 313 - 2 800 - 3 536 2 384 - 17 965 - 7 177 10 816 Dividends paid to owners - 214 - 503 — - 180 - 96 - 57 —
Cash flow from financing activities 1 725 - 6 213 6 278 623 - 14 560 4 102 - 2 206
Cash flow for the period 7 745 - 446 2 897 2 207 - 7 575 8 426 - 640
Free cash flow 10 170 6 889 - 4 997 4 270 10 520 6 218 4 003
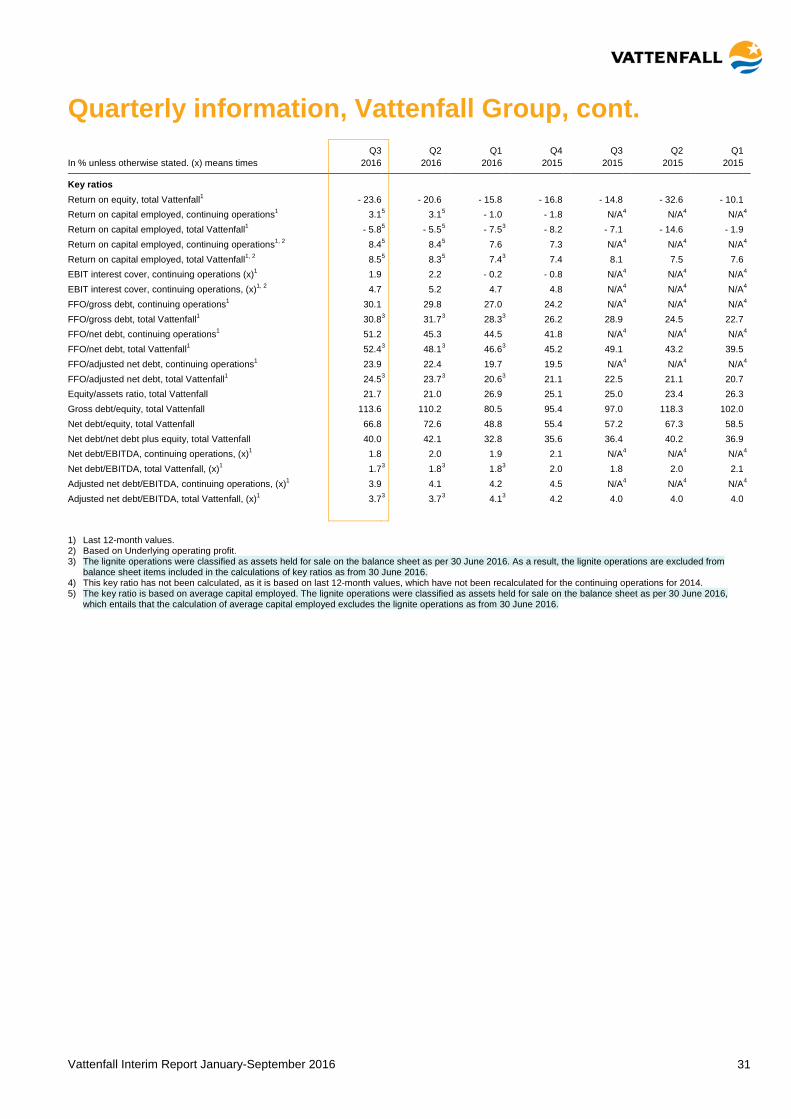
Vattenfall Interim Report January-September 2016 31
Quarterly information, Vattenfall Group, cont. Q3 Q2 Q1 Q4 Q3 Q2 Q1 In % unless otherwise stated. (x) means times 2016 2016 2016 2015 2015 2015 2015
Key ratios
Return on equity, total Vattenfall1 - 23.6 - 20.6 - 15.8 - 16.8 - 14.8 - 32.6 - 10.1 Return on capital employed, continuing operations1 3.1 5 3.1 5 - 1.0 - 1.8 N/A 4 N/A 4 N/A 4 Return on capital employed, total Vattenfall1 - 5.8 5 - 5.5 5 - 7.5 3 - 8.2 - 7.1 - 14.6 - 1.9 Return on capital employed, continuing operations1, 2 8.4 5 8.4 5 7.6 7.3 N/A 4 N/A 4 N/A 4 Return on capital employed, total Vattenfall1, 2 8.5 5 8.3 5 7.4 3 7.4 8.1 7.5 7.6 EBIT interest cover, continuing operations (x)1 1.9 2.2 - 0.2 - 0.8 N/A 4 N/A 4 N/A 4 EBIT interest cover, continuing operations, (x)1, 2 4.7 5.2 4.7 4.8 N/A 4 N/A 4 N/A 4 FFO/gross debt, continuing operations1 30.1 29.8 27.0 24.2 N/A 4 N/A 4 N/A 4 FFO/gross debt, total Vattenfall1 30.8 3 31.7 3 28.3 3 26.2 28.9 24.5 22.7 FFO/net debt, continuing operations1 51.2 45.3 44.5 41.8 N/A 4 N/A 4 N/A 4 FFO/net debt, total Vattenfall1 52.4 3 48.1 3 46.6 3 45.2 49.1 43.2 39.5 FFO/adjusted net debt, continuing operations1 23.9 22.4 19.7 19.5 N/A 4 N/A 4 N/A 4 FFO/adjusted net debt, total Vattenfall1 24.5 3 23.7 3 20.6 3 21.1 22.5 21.1 20.7 Equity/assets ratio, total Vattenfall 21.7 21.0 26.9 25.1 25.0 23.4 26.3 Gross debt/equity, total Vattenfall 113.6 110.2 80.5 95.4 97.0 118.3 102.0 Net debt/equity, total Vattenfall 66.8 72.6 48.8 55.4 57.2 67.3 58.5 Net debt/net debt plus equity, total Vattenfall 40.0 42.1 32.8 35.6 36.4 40.2 36.9 Net debt/EBITDA, continuing operations, (x)1 1.8 2.0 1.9 2.1 N/A 4 N/A 4 N/A 4 Net debt/EBITDA, total Vattenfall, (x)1 1.7 3 1.8 3 1.8 3 2.0 1.8 2.0 2.1 Adjusted net debt/EBITDA, continuing operations, (x)1 3.9 4.1 4.2 4.5 N/A 4 N/A 4 N/A 4 Adjusted net debt/EBITDA, total Vattenfall, (x)1 3.7 3 3.7 3 4.1 3 4.2 4.0 4.0 4.0
1) Last 12-month values. 2) Based on Underlying operating profit. 3) The lignite operations were classified as assets held for sale on the balance sheet as per 30 June 2016. As a result, the lignite operations are excluded from
balance sheet items included in the calculations of key ratios as from 30 June 2016. 4) This key ratio has not been calculated, as it is based on last 12-month values, which have not been recalculated for the continuing operations for 2014. 5) The key ratio is based on average capital employed. The lignite operations were classified as assets held for sale on the balance sheet as per 30 June 2016,
which entails that the calculation of average capital employed excludes the lignite operations as from 30 June 2016.
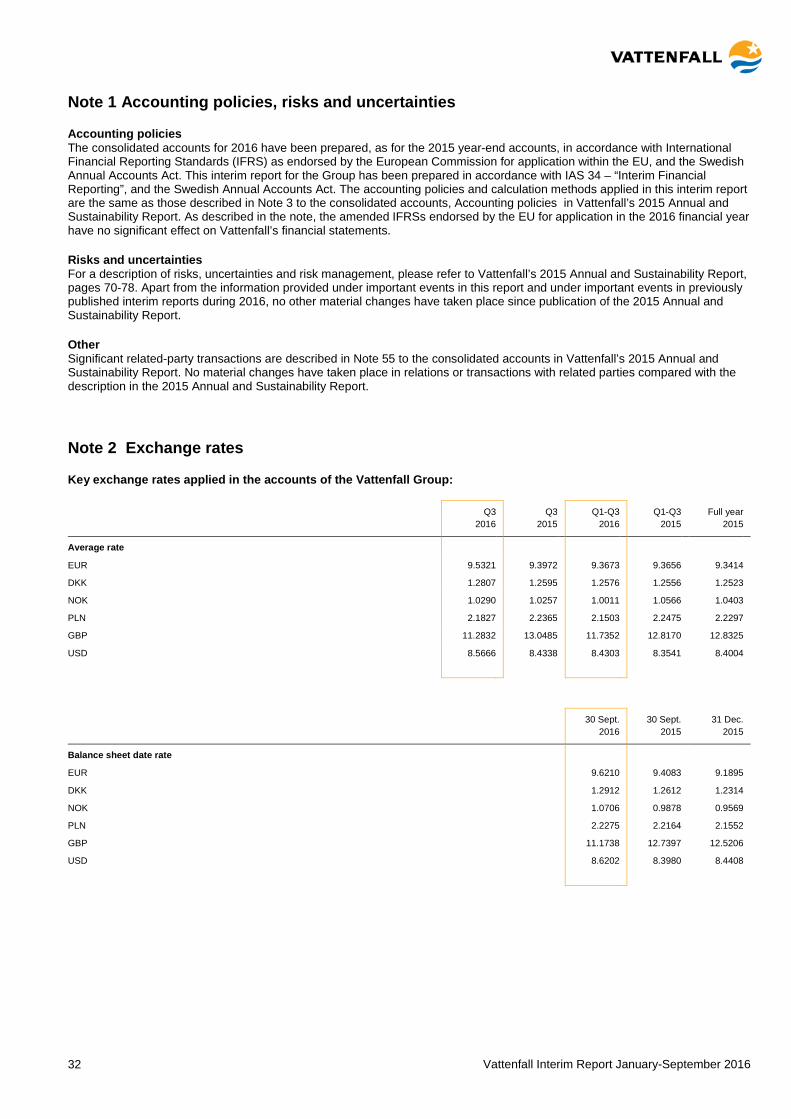
Vattenfall Interim Report January-September 2016 32
Note 1 Accounting policies, risks and uncertainties
Accounting policies The consolidated accounts for 2016 have been prepared, as for the 2015 year-end accounts, in accordance with International Financial Reporting Standards (IFRS) as endorsed by the European Commission for application within the EU, and the Swedish Annual Accounts Act. This interim report for the Group has been prepared in accordance with IAS 34 – “Interim Financial Reporting”, and the Swedish Annual Accounts Act. The accounting policies and calculation methods applied in this interim report are the same as those described in Note 3 to the consolidated accounts, Accounting policies in Vattenfall’s 2015 Annual and Sustainability Report. As described in the note, the amended IFRSs endorsed by the EU for application in the 2016 financial year have no significant effect on Vattenfall’s financial statements.
Risks and uncertainties For a description of risks, uncertainties and risk management, please refer to Vattenfall’s 2015 Annual and Sustainability Report, pages 70-78. Apart from the information provided under important events in this report and under important events in previously published interim reports during 2016, no other material changes have taken place since publication of the 2015 Annual and Sustainability Report.
Other Significant related-party transactions are described in Note 55 to the consolidated accounts in Vattenfall’s 2015 Annual and Sustainability Report. No material changes have taken place in relations or transactions with related parties compared with the description in the 2015 Annual and Sustainability Report.
Note 2 Exchange rates
Key exchange rates applied in the accounts of the Vattenfall Group: Q3 Q3 Q1-Q3 Q1-Q3 Full year 2016 2015 2016 2015 2015 Average rate EUR 9.5321 9.3972 9.3673 9.3656 9.3414 DKK 1.2807 1.2595 1.2576 1.2556 1.2523 NOK 1.0290 1.0257 1.0011 1.0566 1.0403 PLN 2.1827 2.2365 2.1503 2.2475 2.2297 GBP 11.2832 13.0485 11.7352 12.8170 12.8325 USD 8.5666 8.4338 8.4303 8.3541 8.4004
30 Sept. 30 Sept. 31 Dec. 2016 2015 2015 Balance sheet date rate EUR 9.6210 9.4083 9.1895 DKK 1.2912 1.2612 1.2314 NOK 1.0706 0.9878 0.9569 PLN 2.2275 2.2164 2.1552 GBP 11.1738 12.7397 12.5206 USD 8.6202 8.3980 8.4408
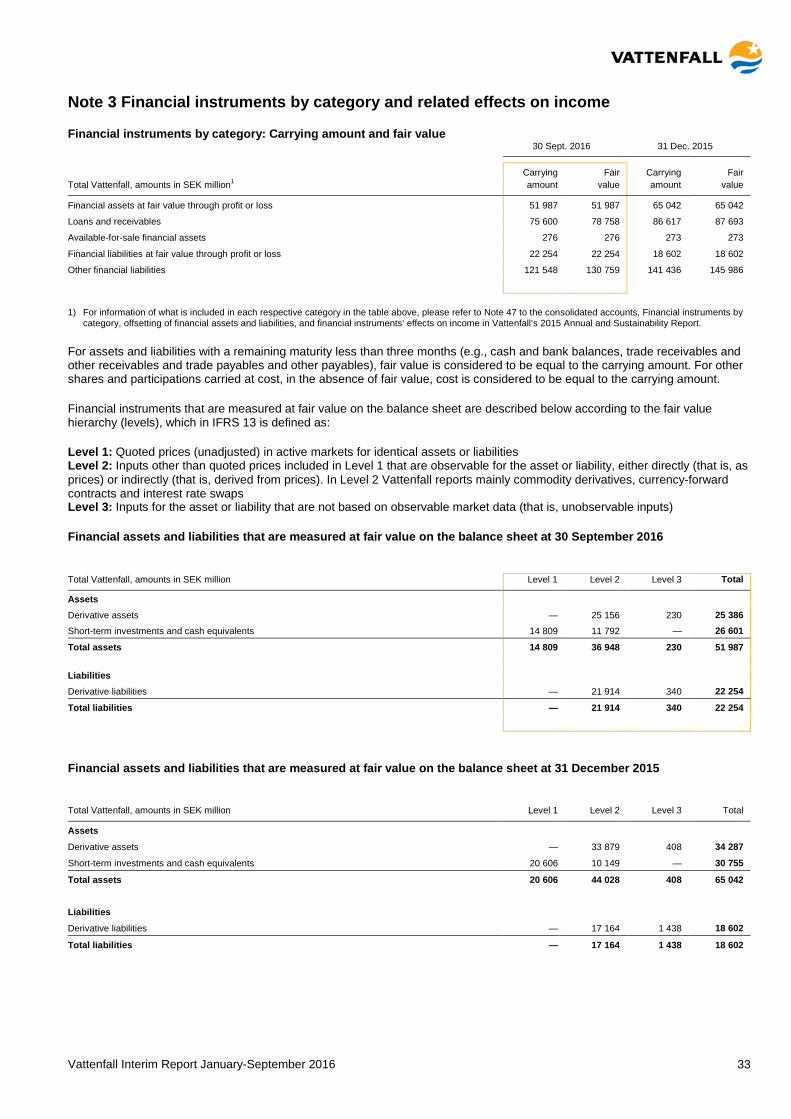
Vattenfall Interim Report January-September 2016 33
Note 3 Financial instruments by category and related effects on income
Financial instruments by category: Carrying amount and fair value 30 Sept. 2016 31 Dec. 2015
Carrying Fair Carrying Fair Total Vattenfall, amounts in SEK million1 amount value amount value Financial assets at fair value through profit or loss 51 987 51 987 65 042 65 042 Loans and receivables 75 600 78 758 86 617 87 693 Available-for-sale financial assets 276 276 273 273 Financial liabilities at fair value through profit or loss 22 254 22 254 18 602 18 602 Other financial liabilities 121 548 130 759 141 436 145 986
1) For information of what is included in each respective category in the table above, please refer to Note 47 to the consolidated accounts, Financial instruments by category, offsetting of financial assets and liabilities, and financial instruments’ effects on income in Vattenfall’s 2015 Annual and Sustainability Report.
For assets and liabilities with a remaining maturity less than three months (e.g., cash and bank balances, trade receivables and other receivables and trade payables and other payables), fair value is considered to be equal to the carrying amount. For other shares and participations carried at cost, in the absence of fair value, cost is considered to be equal to the carrying amount.
Financial instruments that are measured at fair value on the balance sheet are described below according to the fair value hierarchy (levels), which in IFRS 13 is defined as:
Level 1: Quoted prices (unadjusted) in active markets for identical assets or liabilities Level 2: Inputs other than quoted prices included in Level 1 that are observable for the asset or liability, either directly (that is, as prices) or indirectly (that is, derived from prices). In Level 2 Vattenfall reports mainly commodity derivatives, currency-forward contracts and interest rate swaps Level 3: Inputs for the asset or liability that are not based on observable market data (that is, unobservable inputs)
Financial assets and liabilities that are measured at fair value on the balance sheet at 30 September 2016
Total Vattenfall, amounts in SEK million Level 1 Level 2 Level 3 Total
Assets
Derivative assets — 25 156 230 25 386
Short-term investments and cash equivalents 14 809 11 792 — 26 601
Total assets 14 809 36 948 230 51 987
Liabilities
Derivative liabilities — 21 914 340 22 254
Total liabilities — 21 914 340 22 254
Financial assets and liabilities that are measured at fair value on the balance sheet at 31 December 2015
Total Vattenfall, amounts in SEK million Level 1 Level 2 Level 3 Total Assets Derivative assets — 33 879 408 34 287 Short-term investments and cash equivalents 20 606 10 149 — 30 755 Total assets 20 606 44 028 408 65 042 Liabilities Derivative liabilities — 17 164 1 438 18 602 Total liabilities — 17 164 1 438 18 602
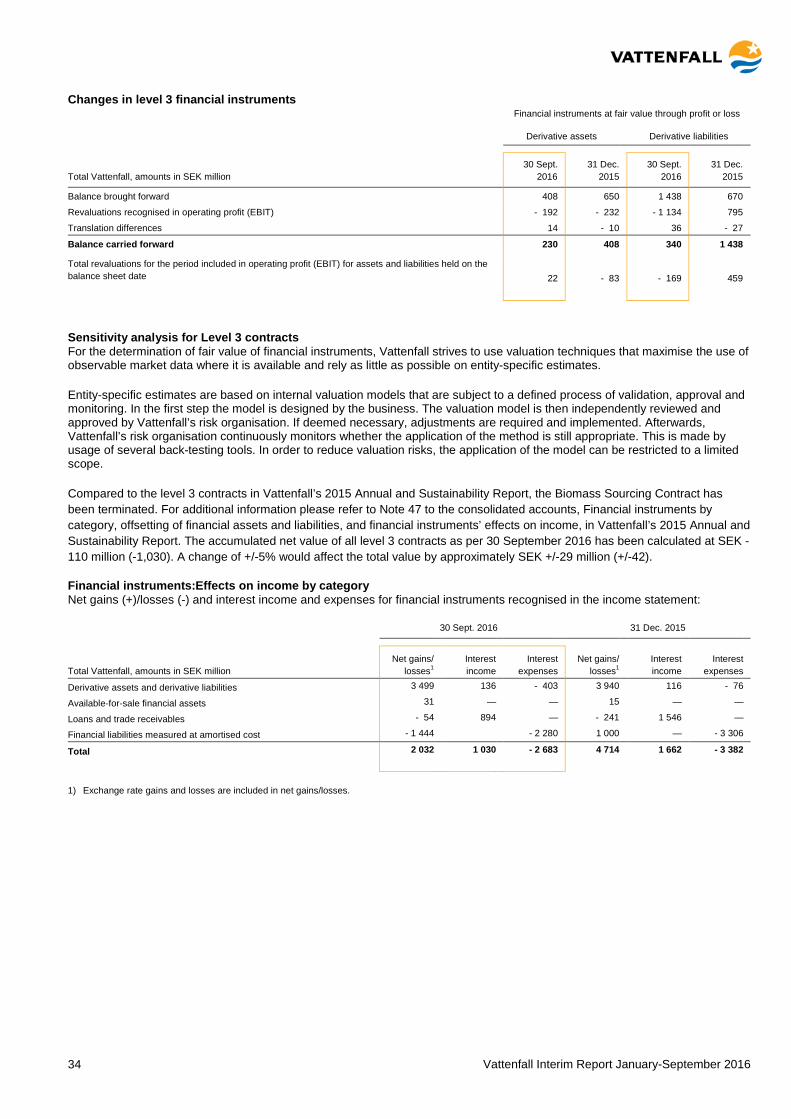
Vattenfall Interim Report January-September 2016 34
Changes in level 3 financial instruments Financial instruments at fair value through profit or loss
Derivative assets Derivative liabilities
30 Sept. 31 Dec. 30 Sept. 31 Dec.
Total Vattenfall, amounts in SEK million 2016 2015 2016 2015
Balance brought forward 408 650 1 438 670
Revaluations recognised in operating profit (EBIT) - 192 - 232 - 1 134 795
Translation differences 14 - 10 36 - 27
Balance carried forward 230 408 340 1 438
Total revaluations for the period included in operating profit (EBIT) for assets and liabilities held on the balance sheet date 22 - 83 - 169 459
Sensitivity analysis for Level 3 contracts For the determination of fair value of financial instruments, Vattenfall strives to use valuation techniques that maximise the use of observable market data where it is available and rely as little as possible on entity-specific estimates.
Entity-specific estimates are based on internal valuation models that are subject to a defined process of validation, approval and monitoring. In the first step the model is designed by the business. The valuation model is then independently reviewed and approved by Vattenfall’s risk organisation. If deemed necessary, adjustments are required and implemented. Afterwards, Vattenfall’s risk organisation continuously monitors whether the application of the method is still appropriate. This is made by usage of several back-testing tools. In order to reduce valuation risks, the application of the model can be restricted to a limited scope.
Compared to the level 3 contracts in Vattenfall’s 2015 Annual and Sustainability Report, the Biomass Sourcing Contract has been terminated. For additional information please refer to Note 47 to the consolidated accounts, Financial instruments by category, offsetting of financial assets and liabilities, and financial instruments’ effects on income, in Vattenfall’s 2015 Annual and Sustainability Report. The accumulated net value of all level 3 contracts as per 30 September 2016 has been calculated at SEK -110 million (-1,030). A change of +/-5% would affect the total value by approximately SEK +/-29 million (+/-42).
Financial instruments:Effects on income by category Net gains (+)/losses (-) and interest income and expenses for financial instruments recognised in the income statement:
30 Sept. 2016 31 Dec. 2015
Total Vattenfall, amounts in SEK million Net gains/
losses1 Interest income
Interest expenses
Net gains/ losses1
Interest income
Interest expenses
Derivative assets and derivative liabilities 3 499 136 - 403 3 940 116 - 76
Available-for-sale financial assets 31 — — 15 — —
Loans and trade receivables - 54 894 — - 241 1 546 —
Financial liabilities measured at amortised cost - 1 444 - 2 280 1 000 — - 3 306
Total 2 032 1 030 - 2 683 4 714 1 662 - 3 382
1) Exchange rate gains and losses are included in net gains/losses.

Vattenfall Interim Report January-September 2016 35
Note 4 Discontinued operations
In accordance with IFRS 5 – Non-Current Assets Held for Sale and Discontinued Operations, the lignite operations, which have been divested, are reported as a discontinued operation as from the second quarter of 2016. The lignite operations are thus reported on a separate line in the income statement, and comparison figures for 2015 have been recalculated in a corresponding manner. In the segment reporting, the parts of the Power Generation and Heat segments that pertain to the lignite operations have been reclassified as “Discontinued operations”, and the Power Generation and Heat operating segments have been recalculated for earlier periods so that they only include the continuing operations. In accordance with IFRS 5, the balance sheet has not been restated to reflect earlier periods. The Statement of cash flows has not been recalculated. Cash flow from the discontinued lignite operations is presented below in this note.
Earnings from discontinued operations Q3 Q3 Q1-Q3 Q1-Q3 Full year Last 12
Amounts in SEK million 2016 2015 2016 2015 2015 months Net Sales 4 596 6 580 13 341 17 803 20 934 16 472
Expenses - 4 028 - 5 918 - 13 835 - 35 750 - 38 831 - 16 916
Net financial items - 97 - 132 - 384 - 402 - 449 - 431
Realised gains related to fair value hedges — — 37 — — —
Translation differences related to hedging of net investments in foreign operations - 477 — - 477 — — - 477
Capital gain 276 — 276 — — 276
Impairment loss recognised on the remeasurement to fair value less costs to sell - 199 1 — - 21 704 — — - 21 704
Profit before tax from discontinued operations 71 530 - 22 746 - 18 349 - 18 346 - 22 743
Income tax expense - 670 1 029 - 896 5 861 3 768 - 2 989
Profit for the period from discontinued operations attributable to owners of the Parent Company - 599 1 559 - 23 642 - 12 488 - 14 578 - 25 732
1) Exchange rate effect in Q3 2016 on impairments losses recognised in Q2 2016.
Q3 Q3 Q1-Q3 Q1-Q3 Full year Last 12
Amounts in SEK million 2016 2015 2016 2015 2015 months Operating profit (EBIT) 168 661 - 22 361 - 17 947 - 17 898 - 22 312
Items affecting comparability 936 47 22 509 17 916 17 910 22 503
Underlying operating profit 1 104 708 148 - 31 12 191
Cash flow from discontinued operations Q3 Q3 Q1-Q3 Q1-Q3 Full year Last 12 Amounts in SEK million 2016 2015 2016 2015 2015 months
Funds from operations (FFO) 323 1 350 1 268 2 730 2 197 735 Cash flow from operating activities 3 621 - 2 503 2 189 - 437 - 2 158 468 Cash flow from investing activities 156 - 652 - 944 - 2 025 - 2 871 - 1 790 Cash flow from financing activities - 60 3 808 461 2 904 8 393 5 950
Total earnings effect of sale of lignite operations Q1-Q3 Amounts in SEK million 2016
Impairment loss recognised on remeasurement to fair value less costs to sell in Q2 2016 -21 505
Exchange rate effect in Q3 2016 on impairment losses recognised in Q2 2016 - 199
Capital gain Q3 2016 276
Dissolution of translation reserve and hedge of net investments in foreign operations - 477
Total earnings effect in 2016 - 21 905

Vattenfall Interim Report January-September 2016 36
The Parent Company Vattenfall AB Accounting policies The Parent Company Vattenfall AB’s accounts are prepared in accordance with the Swedish Annual Accounts Act and recommendation RFR 2 – Accounting for Legal Entities, issued by the Swedish Financial Reporting Board. The accounting policies used in this report are the same as those described in Vattenfall’s 2015 Annual and Sustainability Report (Note 2 to the Parent Company accounts, Accounting policies).
Quarter 1-3 of 2016 A condensed income statement and balance sheet for the Parent Company are presented below.
• Net sales amounted to SEK 21,870 million (22,326). • Profit before appropriations and tax was SEK -6,488 million (3,651). • Earnings were affected by the following:
o Received dividends of SEK 818 million. o A small capital gain from the sale of entire shareholding in Haparanda Värmeverk AB. o An impairment loss of SEK 12,700 million for the shareholding in Vattenfall GmbH.
• The balance sheet total was SEK 256,026 million (292,057). • Investments during the period amounted to SEK 7,306 million (312) of which SEK 7,000 million is related to shareholder
contribution to Vattenfall Vindkraft AB. • Cash and cash equivalents, and short-term investments amounted to SEK 30,996 million (38,794).
Risks and uncertainties See Note 1 to the consolidated accounts, Accounting policies, risks and uncertainties.
Other Significant related-party transactions are described in Note 39 to the Parent Company accounts, Related party disclosures, in Vattenfall’s 2015 Annual and Sustainability Report. No material changes have taken place in relations or transactions with related parties compared with the description in Vattenfall’s 2015 Annual and Sustainability Report.
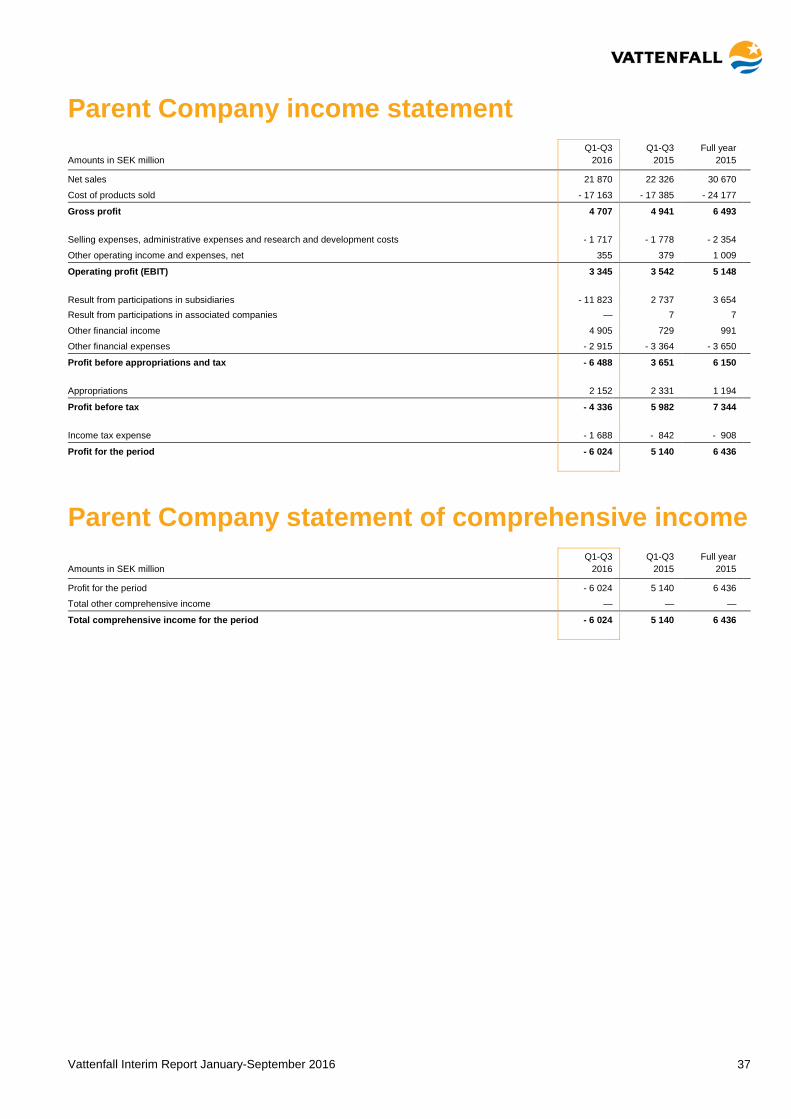
Vattenfall Interim Report January-September 2016 37
Parent Company income statement
Q1-Q3 Q1-Q3
Full year
Amounts in SEK million 2016 2015 2015
Net sales 21 870 22 326 30 670
Cost of products sold - 17 163 - 17 385 - 24 177
Gross profit 4 707 4 941 6 493
Selling expenses, administrative expenses and research and development costs - 1 717 - 1 778 - 2 354
Other operating income and expenses, net 355 379 1 009
Operating profit (EBIT) 3 345 3 542 5 148
Result from participations in subsidiaries - 11 823 2 737 3 654 Result from participations in associated companies — 7 7
Other financial income 4 905 729 991
Other financial expenses - 2 915 - 3 364 - 3 650
Profit before appropriations and tax - 6 488 3 651 6 150
Appropriations 2 152 2 331 1 194
Profit before tax - 4 336 5 982 7 344
Income tax expense - 1 688 - 842 - 908
Profit for the period - 6 024 5 140 6 436
Parent Company statement of comprehensive income
Q1-Q3 Q1-Q3
Full year
Amounts in SEK million 2016 2015 2015
Profit for the period - 6 024 5 140 6 436 Total other comprehensive income — — —
Total comprehensive income for the period - 6 024 5 140 6 436
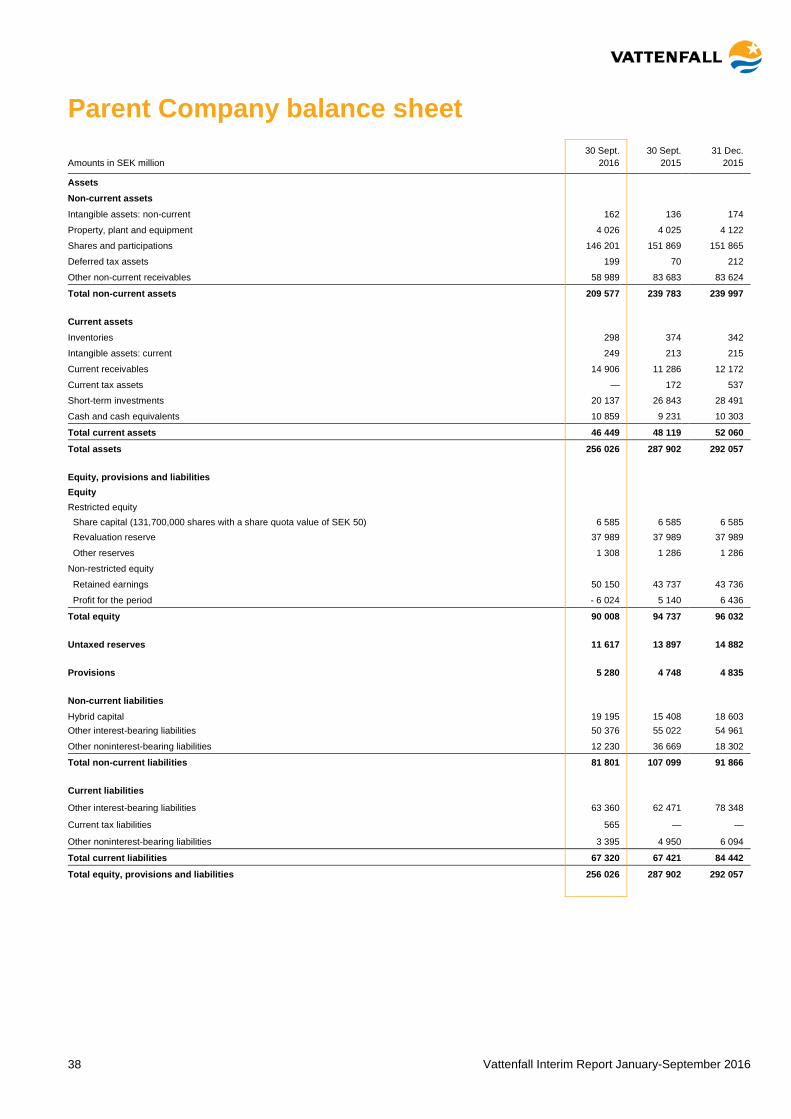
Vattenfall Interim Report January-September 2016 38
Parent Company balance sheet 30 Sept. 30 Sept. 31 Dec. Amounts in SEK million 2016 2015 2015
Assets
Non-current assets
Intangible assets: non-current 162 136 174
Property, plant and equipment 4 026 4 025 4 122
Shares and participations 146 201 151 869 151 865
Deferred tax assets 199 70 212
Other non-current receivables 58 989 83 683 83 624
Total non-current assets 209 577 239 783 239 997
Current assets
Inventories 298 374 342
Intangible assets: current 249 213 215
Current receivables 14 906 11 286 12 172
Current tax assets — 172 537
Short-term investments 20 137 26 843 28 491
Cash and cash equivalents 10 859 9 231 10 303
Total current assets 46 449 48 119 52 060
Total assets 256 026 287 902 292 057 Equity, provisions and liabilities Equity Restricted equity Share capital (131,700,000 shares with a share quota value of SEK 50) 6 585 6 585 6 585 Revaluation reserve 37 989 37 989 37 989
Other reserves 1 308 1 286 1 286
Non-restricted equity
Retained earnings 50 150 43 737 43 736
Profit for the period - 6 024 5 140 6 436
Total equity 90 008 94 737 96 032
Untaxed reserves 11 617 13 897 14 882
Provisions 5 280 4 748 4 835
Non-current liabilities Hybrid capital 19 195 15 408 18 603 Other interest-bearing liabilities 50 376 55 022 54 961
Other noninterest-bearing liabilities 12 230 36 669 18 302
Total non-current liabilities 81 801 107 099 91 866
Current liabilities
Other interest-bearing liabilities 63 360 62 471 78 348
Current tax liabilities 565 — —
Other noninterest-bearing liabilities 3 395 4 950 6 094
Total current liabilities 67 320 67 421 84 442
Total equity, provisions and liabilities 256 026 287 902 292 057
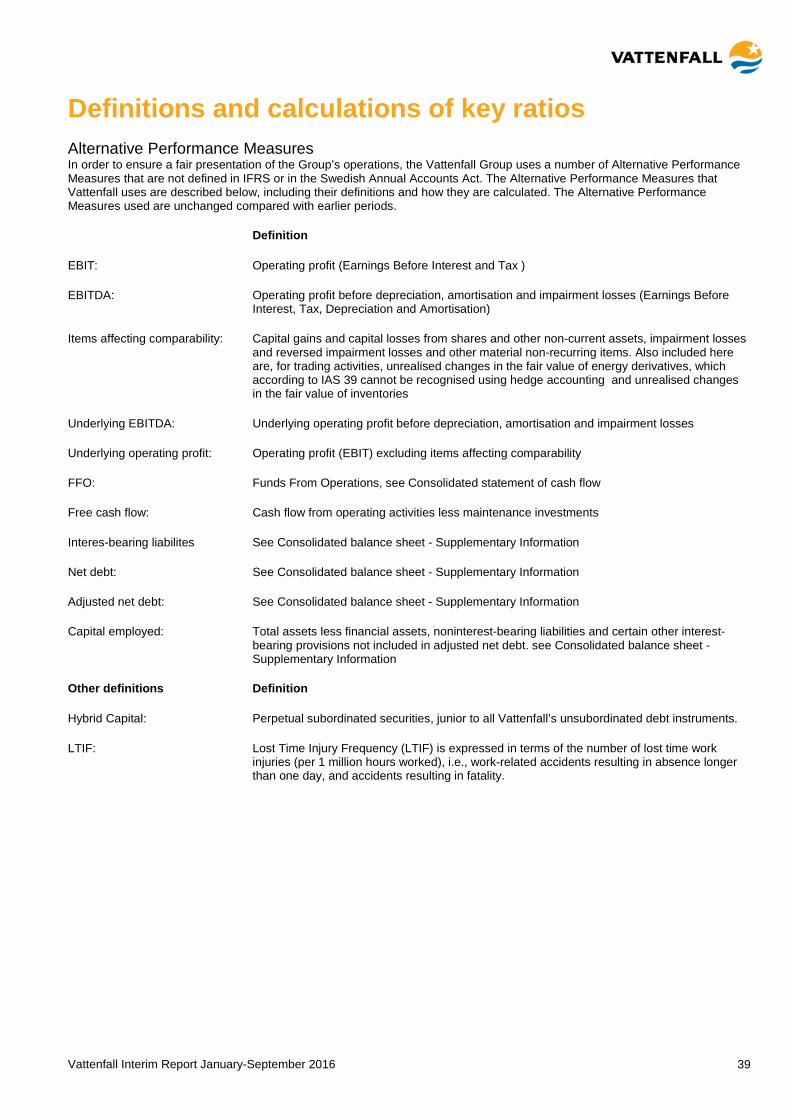
Vattenfall Interim Report January-September 2016 39
Definitions and calculations of key ratios Alternative Performance Measures In order to ensure a fair presentation of the Group’s operations, the Vattenfall Group uses a number of Alternative Performance Measures that are not defined in IFRS or in the Swedish Annual Accounts Act. The Alternative Performance Measures that Vattenfall uses are described below, including their definitions and how they are calculated. The Alternative Performance Measures used are unchanged compared with earlier periods.
Definition
EBIT: Operating profit (Earnings Before Interest and Tax )
EBITDA: Operating profit before depreciation, amortisation and impairment losses (Earnings Before Interest, Tax, Depreciation and Amortisation)
Items affecting comparability: Capital gains and capital losses from shares and other non-current assets, impairment losses and reversed impairment losses and other material non-recurring items. Also included here are, for trading activities, unrealised changes in the fair value of energy derivatives, which according to IAS 39 cannot be recognised using hedge accounting and unrealised changes in the fair value of inventories
Underlying EBITDA: Underlying operating profit before depreciation, amortisation and impairment losses
Underlying operating profit: Operating profit (EBIT) excluding items affecting comparability
FFO: Funds From Operations, see Consolidated statement of cash flow
Free cash flow: Cash flow from operating activities less maintenance investments
Interes-bearing liabilites See Consolidated balance sheet - Supplementary Information
Net debt: See Consolidated balance sheet - Supplementary Information
Adjusted net debt: See Consolidated balance sheet - Supplementary Information
Capital employed: Total assets less financial assets, noninterest-bearing liabilities and certain other interest-bearing provisions not included in adjusted net debt. see Consolidated balance sheet - Supplementary Information
Other definitions Definition
Hybrid Capital: Perpetual subordinated securities, junior to all Vattenfall’s unsubordinated debt instruments.
LTIF: Lost Time Injury Frequency (LTIF) is expressed in terms of the number of lost time work injuries (per 1 million hours worked), i.e., work-related accidents resulting in absence longer than one day, and accidents resulting in fatality.
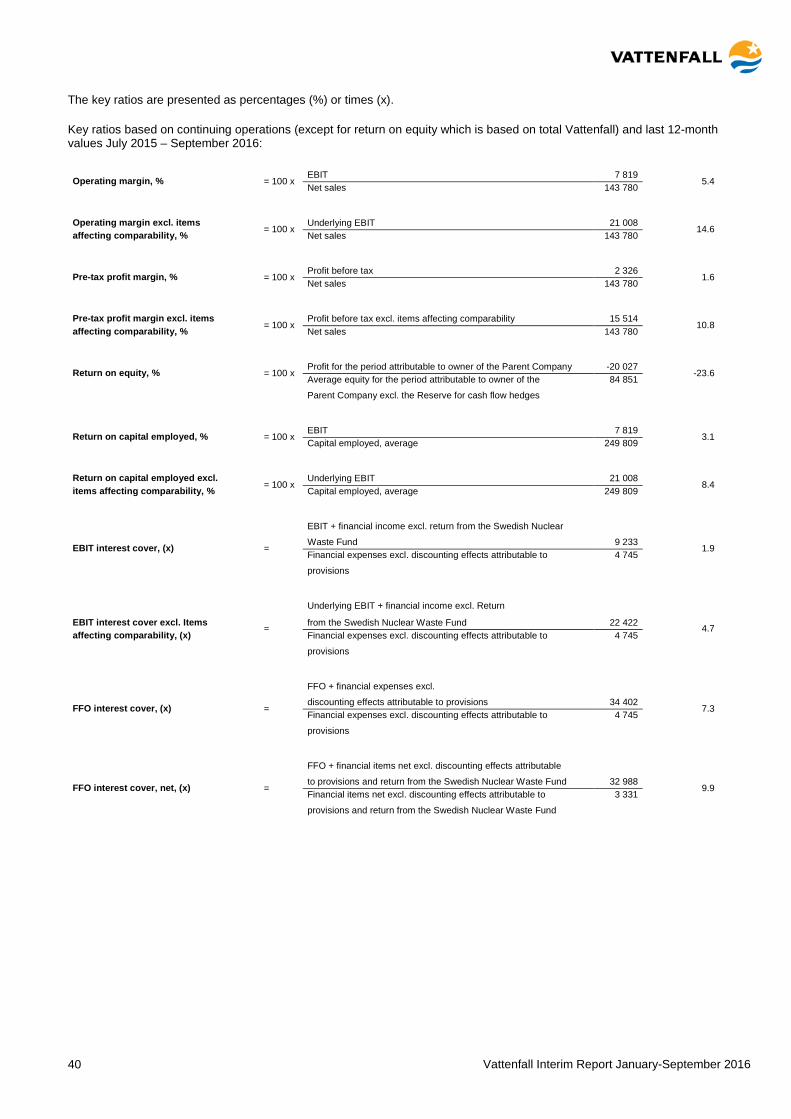
Vattenfall Interim Report January-September 2016 40
The key ratios are presented as percentages (%) or times (x).
Key ratios based on continuing operations (except for return on equity which is based on total Vattenfall) and last 12-month values July 2015 – September 2016:
Operating margin, % = 100 x EBIT 7 819
= 5.4 Net sales 143 780
Operating margin excl. items = 100 x
Underlying EBIT 21 008 = 14.6 affecting comparability, % Net sales 143 780
Pre-tax profit margin, % = 100 x
Profit before tax 2 326 = 1.6
Net sales 143 780
Pre-tax profit margin excl. items = 100 x
Profit before tax excl. items affecting comparability 15 514 = 10.8 affecting comparability, % Net sales 143 780
Return on equity, % = 100 x
Profit for the period attributable to owner of the Parent Company -20 027 = -23.6
Average equity for the period attributable to owner of the 84 851
Parent Company excl. the Reserve for cash flow hedges
Return on capital employed, % = 100 x
EBIT 7 819 = 3.1
Capital employed, average 249 809
Return on capital employed excl. = 100 x
Underlying EBIT 21 008 = 8.4 items affecting comparability, % Capital employed, average 249 809
EBIT + financial income excl. return from the Swedish Nuclear
EBIT interest cover, (x) = Waste Fund 9 233
= 1.9 Financial expenses excl. discounting effects attributable to 4 745
provisions
Underlying EBIT + financial income excl. Return
EBIT interest cover excl. Items = from the Swedish Nuclear Waste Fund 22 422 = 4.7 affecting comparability, (x) Financial expenses excl. discounting effects attributable to 4 745
provisions
FFO + financial expenses excl.
FFO interest cover, (x) = discounting effects attributable to provisions 34 402
= 7.3 Financial expenses excl. discounting effects attributable to 4 745
provisions
FFO + financial items net excl. discounting effects attributable
FFO interest cover, net, (x) =
to provisions and return from the Swedish Nuclear Waste Fund 32 988 = 9.9
Financial items net excl. discounting effects attributable to 3 331
provisions and return from the Swedish Nuclear Waste Fund
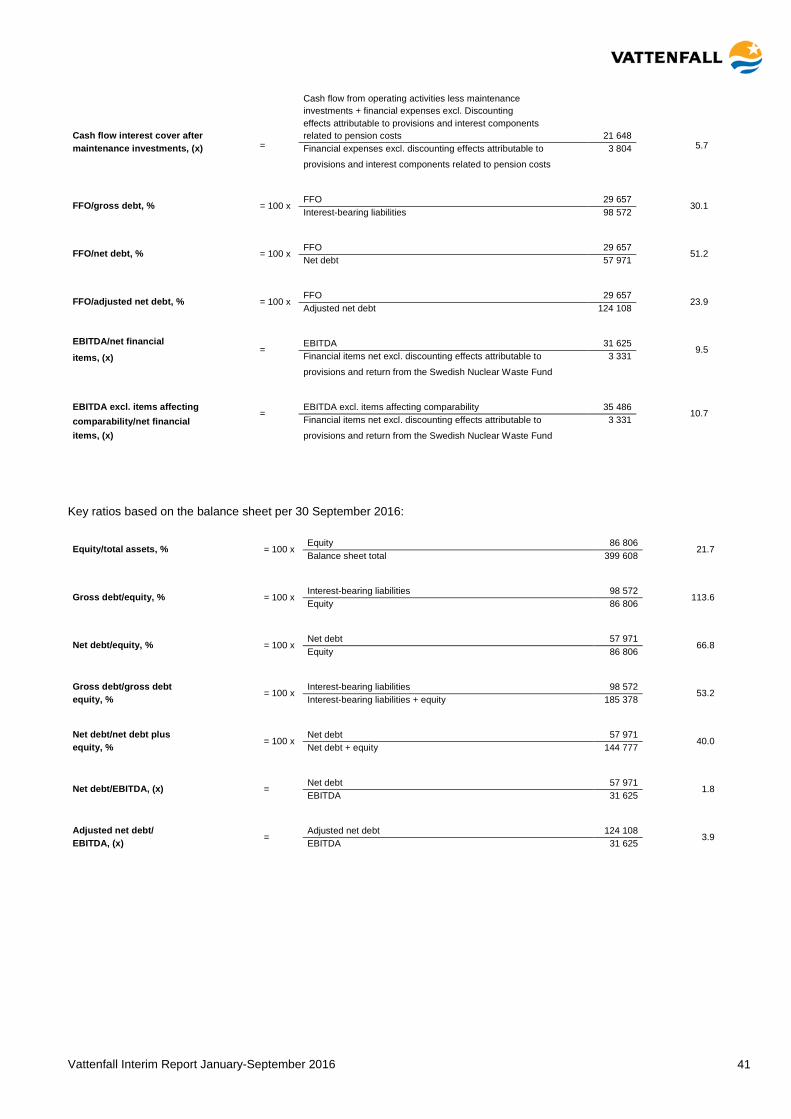
Vattenfall Interim Report January-September 2016 41
Cash flow from operating activities less maintenance investments + financial expenses excl. Discounting
Cash flow interest cover after
=
effects attributable to provisions and interest components related to pension costs 21 648
= 5.7 maintenance investments, (x) Financial expenses excl. discounting effects attributable to 3 804
provisions and interest components related to pension costs
FFO/gross debt, % = 100 x
FFO 29 657 = 30.1
Interest-bearing liabilities 98 572
FFO/net debt, % = 100 x
FFO 29 657 = 51.2
Net debt 57 971
FFO/adjusted net debt, % = 100 x
FFO 29 657 = 23.9
Adjusted net debt 124 108
EBITDA/net financial
= EBITDA 31 625
= 9.5 items, (x) Financial items net excl. discounting effects attributable to 3 331
provisions and return from the Swedish Nuclear Waste Fund
EBITDA excl. items affecting =
EBITDA excl. items affecting comparability 35 486 = 10.7
comparability/net financial Financial items net excl. discounting effects attributable to 3 331
items, (x)
provisions and return from the Swedish Nuclear Waste Fund
Key ratios based on the balance sheet per 30 September 2016:
Equity/total assets, % = 100 x Equity 86 806
= 21.7 Balance sheet total 399 608
Gross debt/equity, % = 100 x
Interest-bearing liabilities 98 572 = 113.6
Equity 86 806
Net debt/equity, % = 100 x
Net debt 57 971 = 66.8
Equity 86 806
Gross debt/gross debt = 100 x
Interest-bearing liabilities 98 572 = 53.2 equity, % Interest-bearing liabilities + equity 185 378
Net debt/net debt plus = 100 x
Net debt 57 971 = 40.0 equity, % Net debt + equity 144 777
Net debt/EBITDA, (x) =
Net debt 57 971 = 1.8
EBITDA 31 625
Adjusted net debt/ =
Adjusted net debt 124 108 = 3.9 EBITDA, (x) EBITDA 31 625
Vattenfall Interim Report January-September 2016 42
Interim report signature Solna, 27 October 2016
Magnus Hall President and CEO
This interim report has not been reviewed by the company’s auditors.
Financial calendar Year-end report 2016, 7 February 2017
Annual General Meeting, 27 April 2017
Interim report January-March, 28 April 2017
Interim report January-June, 21 July 2017
Interim report January-September, 27 October 2017 (tbd)
Contact information Vattenfall AB (publ) SE-169 92 Stockholm Corporate identity number 556036-2138 T +46-8-739 50 00 www.vattenfall.com www.vattenfall.se
Magnus Hall President and CEO T +46-8-739 50 09
Ingrid Bonde CFO T +46-8-739 60 06
Johan Sahlqvist Head of Investor Relations T +46-8-739 72 51 or +46-(0)72-226 40 51
Related Documents