Interim Report January–September 2015 July–September 2015 • Net sales of SEK 37,519 million (34,734) • Underlying operating profit 1 of SEK 3,388 million (2,750) • Operating profit of SEK 3,001 million (-19,436). Operating profit for the corresponding period in 2014 was negatively affected by SEK 25.2 billion in items affecting comparability, of which SEK 23.8 million consisted of impairment losses • Profit for the period after tax of SEK 1,600 million (-18,065) • Electricity generation of 41.2 TWh (36.8) January–September 2015 • Net sales of SEK 119,011 million (117,220) • Underlying operating profit 1 of SEK 14,092 million (15,911) • Operating profit of SEK -26,657 million (-9,239). Operating profit was negatively affected by SEK 40.7 billion in items affecting comparability, of which SEK 36.5 billion consisted of impairment losses • Profit for the period after tax of SEK -22,225 million (-12,183). Profit for the period was charged with SEK 29.8 billion in items affecting comparability, net after tax • Electricity generation of 127.2 TWh (126.6) 1) Underlying operating profit is defined as operating profit excluding items affecting comparability. For a specification of items affecting comparability, see page 8. Vattenfall discloses the information provided in this interim report pursuant to the Swedish Securities Market Act. Rounding differences may occur in this report.

Welcome message from author
This document is posted to help you gain knowledge. Please leave a comment to let me know what you think about it! Share it to your friends and learn new things together.
Transcript
Interim Report January–September 2015 July–September 2015
• Net sales of SEK 37,519 million (34,734)
• Underlying operating profit1 of SEK 3,388 million (2,750)
• Operating profit of SEK 3,001 million (-19,436). Operating profit for the corresponding period in 2014 was negatively affected by SEK 25.2 billion in items affecting comparability, of which SEK 23.8 million consisted of impairment losses
• Profit for the period after tax of SEK 1,600 million (-18,065)
• Electricity generation of 41.2 TWh (36.8)
January–September 2015
• Net sales of SEK 119,011 million (117,220)
• Underlying operating profit1 of SEK 14,092 million (15,911)
• Operating profit of SEK -26,657 million (-9,239). Operating profit was negatively affected by SEK 40.7 billion in items affecting comparability, of which SEK 36.5 billion consisted of impairment losses
• Profit for the period after tax of SEK -22,225 million (-12,183). Profit for the period was charged with SEK 29.8 billion in items affecting comparability, net after tax
• Electricity generation of 127.2 TWh (126.6)
1) Underlying operating profit is defined as operating profit excluding items affecting comparability. For a specification of items affecting comparability, see page 8.
Vattenfall discloses the information provided in this interim report pursuant to the Swedish Securities Market Act.
Rounding differences may occur in this report.
Vattenfall Interim Report January-September 2015 2
CEO’s comments “Compared with a year ago, during the third quarter Vattenfall increased its underlying operating profit, improved its cash flow and lowered its debt. The profit increase is mainly attributable to higher production volumes and lower operating costs. However, for the nine-month period January–September, the underlying operating profit decreased by SEK 1.8 billion to approximately SEK 14.1 billion. The market conditions remain challenging, with a considerable capacity surplus and low electricity prices, especially in the Nordic countries, which is squeezing our production margins.
Our cost-cutting efforts must continue. Among other measures we are now looking at opportunities to outsource parts of our administration and IT operations to external service providers. Our purchasing processes will continue to be sharpened and streamlined in an effort to achieve further savings.
During the quarter we continued the work on finding new owners for our German lignite assets by inviting interested bidders. This process is on track and we expect to reach an agreement during the first half of 2016.
Vattenfall will be a truly customer-centric company in parallel with our efforts to achieve a long-term sustainable production portfolio. We aspire to take a leading role in our work on meeting the customers’ demands on energy companies of the future. This is the foundation of our new, strategic direction, which is contributing to a sustainable energy system across the value chain in the northern Europe.”
Magnus Hall
President and CEO
Vattenfall Interim Report January-September 2015 3
Key data
Q3 Q3
Q1-Q3 Q1-Q3
Full year
Last 12
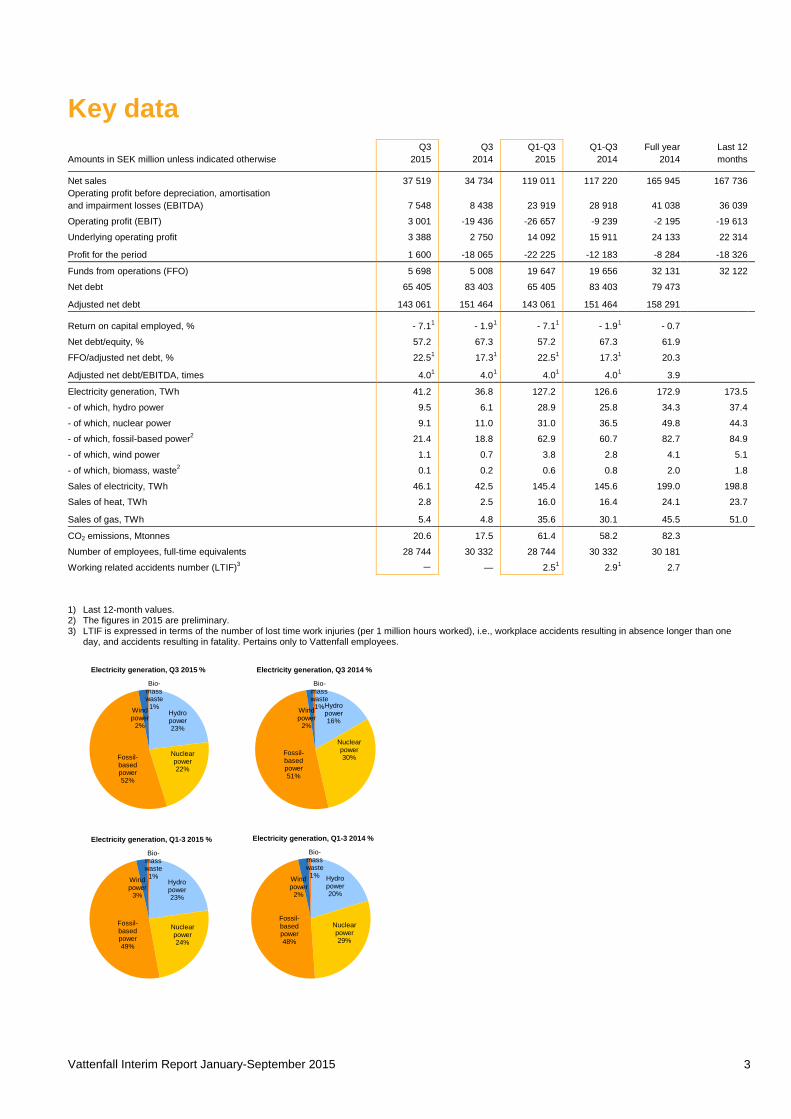
Amounts in SEK million unless indicated otherwise 2015 2014 2015 2014 2014 months Net sales 37 519 34 734
119 011 117 220
165 945 167 736
Operating profit before depreciation, amortisation and impairment losses (EBITDA) 7 548 8 438
23 919 28 918
41 038
36 039
Operating profit (EBIT) 3 001 -19 436
-26 657 -9 239
-2 195
-19 613
Underlying operating profit 3 388 2 750
14 092 15 911
24 133
22 314
Profit for the period 1 600 -18 065 -22 225 -12 183 -8 284 -18 326
Funds from operations (FFO) 5 698 5 008
19 647 19 656
32 131
32 122
Net debt 65 405 83 403
65 405 83 403
79 473 Adjusted net debt 143 061 151 464 143 061 151 464 158 291
Return on capital employed, % - 7.1 1 - 1.9 1 - 7.1 1 - 1.9 1 - 0.7 Net debt/equity, % 57.2 67.3
57.2 67.3
61.9
FFO/adjusted net debt, % 22.5 1 17.3 1 22.5 1 17.3 1 20.3 Adjusted net debt/EBITDA, times 4.0 1 4.0 1 4.0 1 4.0 1 3.9
Electricity generation, TWh 41.2 36.8
127.2 126.6
172.9
173.5
- of which, hydro power 9.5 6.1
28.9 25.8
34.3
37.4
- of which, nuclear power 9.1 11.0
31.0 36.5
49.8
44.3
- of which, fossil-based power2 21.4 18.8
62.9 60.7
82.7
84.9
- of which, wind power 1.1 0.7
3.8 2.8
4.1
5.1
- of which, biomass, waste2 0.1 0.2
0.6 0.8
2.0
1.8
Sales of electricity, TWh 46.1 42.5
145.4 145.6
199.0
198.8
Sales of heat, TWh 2.8 2.5
16.0 16.4
24.1
23.7
Sales of gas, TWh 5.4 4.8 35.6 30.1 45.5 51.0
CO2 emissions, Mtonnes 20.6 17.5
61.4 58.2
82.3 Number of employees, full-time equivalents 28 744 30 332
28 744 30 332
30 181
Working related accidents number (LTIF)3 — —
2.5 1 2.9 1 2.7
1) Last 12-month values. 2) The figures in 2015 are preliminary. 3) LTIF is expressed in terms of the number of lost time work injuries (per 1 million hours worked), i.e., workplace accidents resulting in absence longer than one
day, and accidents resulting in fatality. Pertains only to Vattenfall employees.
Hydro power23%
Nuclear power22%
Fossil-based power52%
Wind power
2%
Bio-masswaste
1%
Electricity generation, Q3 2015 %
Hydro power16%
Nuclear power30%
Fossil-based power51%
Wind power
2%
Bio-masswaste
1%
Electricity generation, Q3 2014 %
Hydro power23%
Nuclear power24%
Fossil-based power49%
Wind power
3%
Bio-masswaste
1%
Electricity generation, Q1-3 2015 %
Hydro power20%
Nuclear power29%
Fossil-based power48%
Wind power
2%
Bio-mass waste
1%
Electricity generation, Q1-3 2014 %
Vattenfall Interim Report January-September 2015 4
Targets and target achievement Vattenfall’s assignment is to generate a market rate of return by operating an energy business in such a way that the company is among the leaders in developing environmentally sustainable energy production.
Vattenfall’s owner and board of directors have set four financial targets for the Group, and the Board has set three sustainability targets.
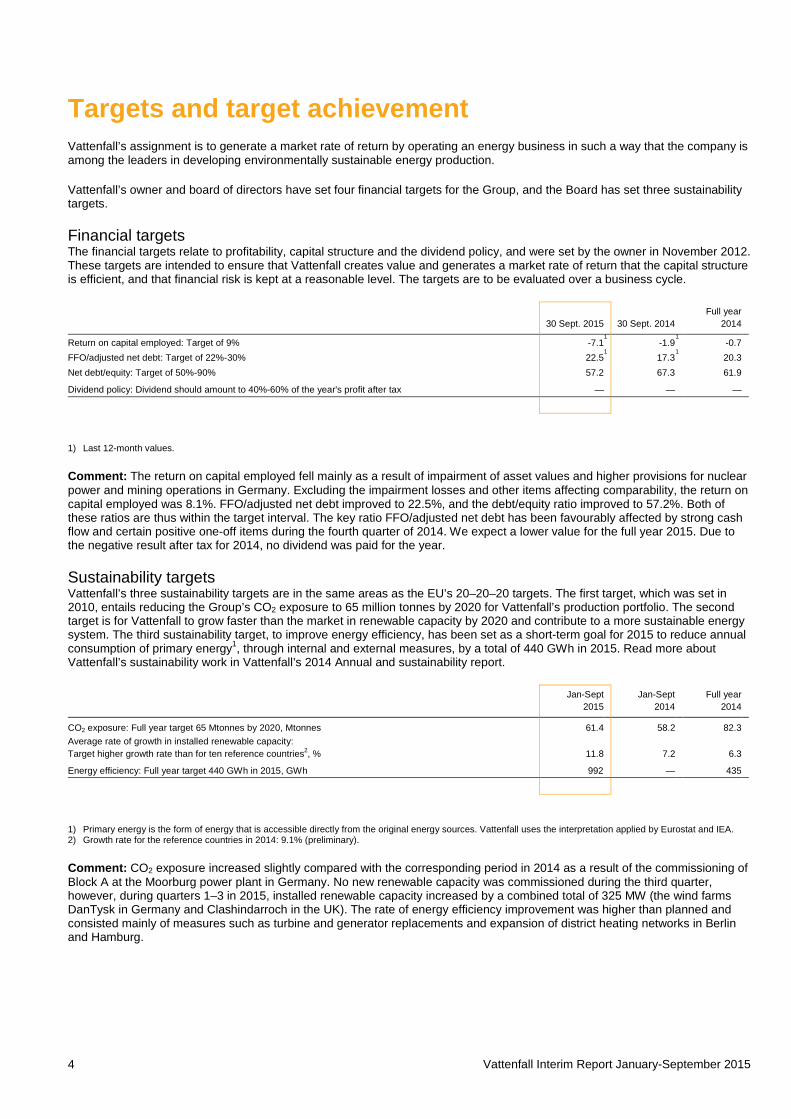
Financial targets The financial targets relate to profitability, capital structure and the dividend policy, and were set by the owner in November 2012. These targets are intended to ensure that Vattenfall creates value and generates a market rate of return that the capital structure is efficient, and that financial risk is kept at a reasonable level. The targets are to be evaluated over a business cycle.
Full year 30 Sept. 2015 30 Sept. 2014 2014
Return on capital employed: Target of 9% -7.1 1 -1.9
1 -0.7 FFO/adjusted net debt: Target of 22%-30% 22.5
1 17.3 1 20.3
Net debt/equity: Target of 50%-90% 57.2 67.3 61.9
Dividend policy: Dividend should amount to 40%-60% of the year's profit after tax — — —
1) Last 12-month values.
Comment: The return on capital employed fell mainly as a result of impairment of asset values and higher provisions for nuclear power and mining operations in Germany. Excluding the impairment losses and other items affecting comparability, the return on capital employed was 8.1%. FFO/adjusted net debt improved to 22.5%, and the debt/equity ratio improved to 57.2%. Both of these ratios are thus within the target interval. The key ratio FFO/adjusted net debt has been favourably affected by strong cash flow and certain positive one-off items during the fourth quarter of 2014. We expect a lower value for the full year 2015. Due to the negative result after tax for 2014, no dividend was paid for the year.
Sustainability targets Vattenfall’s three sustainability targets are in the same areas as the EU’s 20–20–20 targets. The first target, which was set in 2010, entails reducing the Group’s CO2 exposure to 65 million tonnes by 2020 for Vattenfall’s production portfolio. The second target is for Vattenfall to grow faster than the market in renewable capacity by 2020 and contribute to a more sustainable energy system. The third sustainability target, to improve energy efficiency, has been set as a short-term goal for 2015 to reduce annual consumption of primary energy1, through internal and external measures, by a total of 440 GWh in 2015. Read more about Vattenfall’s sustainability work in Vattenfall’s 2014 Annual and sustainability report.
Jan-Sept Jan-Sept Full year 2015 2014 2014
CO2 exposure: Full year target 65 Mtonnes by 2020, Mtonnes 61.4 58.2 82.3 Average rate of growth in installed renewable capacity: Target higher growth rate than for ten reference countries2, % 11.8
7.2
6.3
Energy efficiency: Full year target 440 GWh in 2015, GWh 992 — 435
1) Primary energy is the form of energy that is accessible directly from the original energy sources. Vattenfall uses the interpretation applied by Eurostat and IEA. 2) Growth rate for the reference countries in 2014: 9.1% (preliminary).
Comment: CO2 exposure increased slightly compared with the corresponding period in 2014 as a result of the commissioning of Block A at the Moorburg power plant in Germany. No new renewable capacity was commissioned during the third quarter, however, during quarters 1–3 in 2015, installed renewable capacity increased by a combined total of 325 MW (the wind farms DanTysk in Germany and Clashindarroch in the UK). The rate of energy efficiency improvement was higher than planned and consisted mainly of measures such as turbine and generator replacements and expansion of district heating networks in Berlin and Hamburg.
Vattenfall Interim Report January-September 2015 5
Important events Q3 2015 Final payment for shares in N.V. Nuon Energy On 1 July 2015 Vattenfall made the scheduled payment of EUR 2,071.3 million for the remaining 21% of the shares in N.V. Nuon Energy, corresponding to approximately SEK 19 billion. However, Vattenfall has consolidated N.V. Nuon Energy to 100% since 1 July 2009.
New wind farm in the UK Vattenfall made the decision to invest approximately SEK 1.2 billion in Ray Wind Farm, a new onshore wind farm in Northcumberland in northeast England. The wind farm will comprise 16 wind turbines with combined capacity of slightly more than 54 MW and will generate electricity equivalent to the annual electricity demand of some 30,000 English households. The wind farm is expected to begin operating in early 2017.
Changed investment plans for Ringhals 1 and 2 At the end of August the Ringhals AB board of directors made the decision to limit investments in the Ringhals 1 and 2 nuclear reactors, which will affect their remaining useful life. According to a consequence analysis performed by Ringhals’s CEO, Eva Halldén, the board decision entails that, given the current preconditions, Ringhals 1 and 2 cannot remain in operation longer than 2020. The decision on limited investment does not pertain to Ringhals 3 and 4. The existing plans for these two reactors, which provide for both to remain in operation for 60 years, remain unchanged. At an extraordinary general meeting of Ringhals AB on 15 October, the decision was made to decommission Ringhals 2 in 2019 and Ringhals 1 in 2020.
Largest onshore wind farm in Denmark completed Vattenfall’s largest repowering project in the Nordic countries was completed in September. A total of 22 new wind turbines with combined capacity of 70.4 MW have now been installed at the Klim wind farm in northwest Jutland. Klim is Denmark’s largest onshore wind farm and can generate electricity equivalent to the annual consumption of 64,000 Danish households.
Bidding process initiated for German lignite assets On 22 September Vattenfall published an invitation to potential bidders to state their interest in Vattenfall’s lignite assets in Germany. These include the power plants Boxberg, Jänschwalde, Schwarze Pumpe and Lippendorf block R as well as corresponding mining activities (Jänschwalde, Nochten, Reichwalde, Welzow–Süd and Cottbus Nord). Vattenfall’s hydro power assets in the adjacent area – mainly pumped storage power plants – may also be included in a sale, but only in conjunction with the sale of the lignite assets. It is expected to reach an agreement during the first half of 2016.
Changed ratings On 6 August the rating agency Moody’s affirmed Vattenfall’s long-term A3 rating, but changed its outlook from stable to negative. On 28 September the rating agency Standard & Poor’s changed its long-term rating of Vattenfall from A- to BBB+ and changed its outlook to negative.
Revaluation of shares in Vattenfall Eldistribution AB To better reflect the asset value, the parent company Vattenfall AB revalued its shareholding in Vattenfall Eldistribution AB to SEK 38 billion.
Events after the balance sheet date Expert opinion confirms that nuclear power provisions in Germany are correctly calculated On 10 October the German government published a stress test on nuclear power provisions in Germany prepared by the auditing firm Warth & Klein Grant Thornton AG on behalf of the German government. The auditing firm reported that they have found no reason to dispute the nuclear power operators’ principles for calculating their nuclear power provisions. Vattenfall has made provisions of approximately EUR 3 billion for the decommissioning of its partly owned nuclear power plants in Germany. The German government has appointed a special commission to issue recommendations, by no later than January 2016, on how to secure the long-term financing of nuclear plant decommissioning costs.
Vattenfall Eldistribution raises electricity network fee and increases investment in electricity networks On 13 October, Vattenfall announced an 11% increase in the electricity network fee in Sweden, effective 1 January 2016. The increase is being made to be able to accelerate the pace of investment and the quality of the electricity networks. In conjunction with this, Vattenfall Eldistribution will improve the compensation it pays to customers affected by electricity interruptions.
Agreement on standby capacity reserve for German lignite-fired power plants Within the framework of an agreement between the German government and Germany’s lignite producers, Vattenfall has agreed in 2018 and 2019 to transfer two production units at the Jänschwalde power plant (500 MW each) to a standby capacity reserve and then, after four years, to decommission them entirely. This will reduce Vattenfall’s annual CO2 emissions by 8 million tonnes. The total capacity reserve will amount to 2,700 MW, and the power plant owners will be compensated for the loss of production during the time the power plants are in standby mode. According to the German government, the compensation paid to all of the power plants in the reserve will amount to EUR 230 million per year for seven years.
Vattenfall Interim Report January-September 2015 6
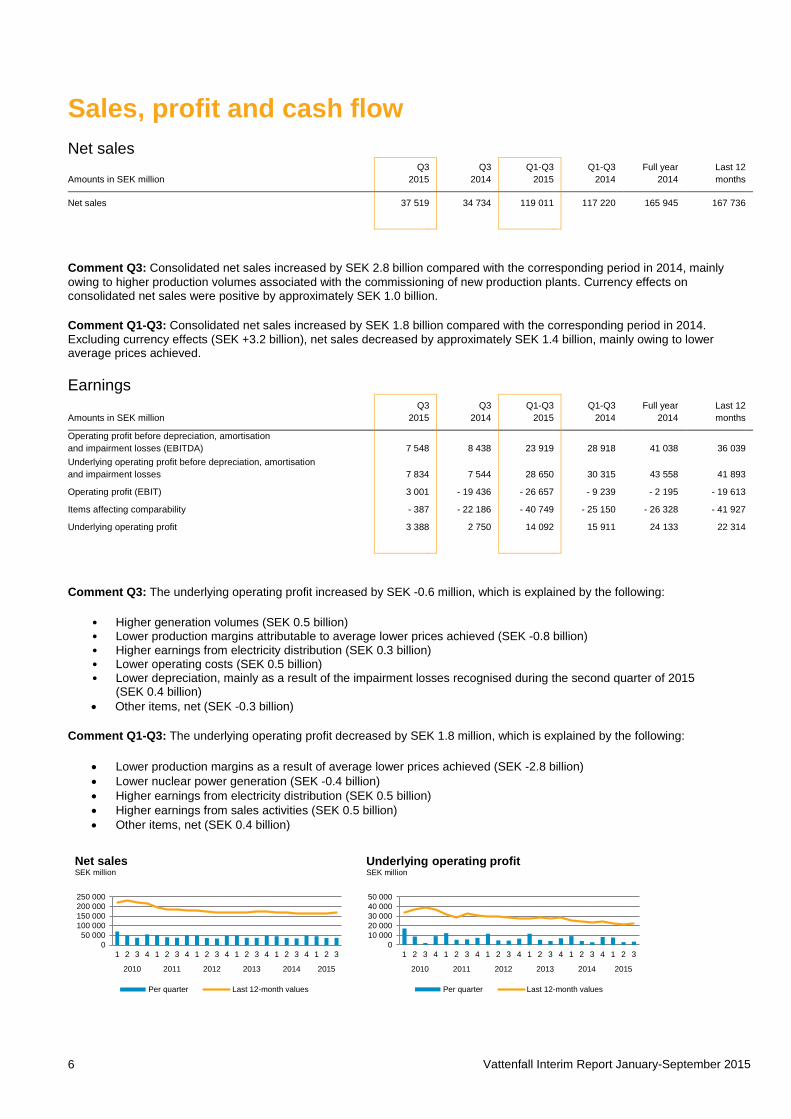
Sales, profit and cash flow Net sales Q3 Q3 Q1-Q3 Q1-Q3 Full year Last 12 Amounts in SEK million 2015 2014 2015 2014 2014 months Net sales 37 519 34 734 119 011 117 220 165 945 167 736
Comment Q3: Consolidated net sales increased by SEK 2.8 billion compared with the corresponding period in 2014, mainly owing to higher production volumes associated with the commissioning of new production plants. Currency effects on consolidated net sales were positive by approximately SEK 1.0 billion.
Comment Q1-Q3: Consolidated net sales increased by SEK 1.8 billion compared with the corresponding period in 2014. Excluding currency effects (SEK +3.2 billion), net sales decreased by approximately SEK 1.4 billion, mainly owing to lower average prices achieved.
Earnings Q3 Q3 Q1-Q3 Q1-Q3 Full year Last 12 Amounts in SEK million 2015 2014 2015 2014 2014 months Operating profit before depreciation, amortisation and impairment losses (EBITDA) 7 548 8 438 23 919 28 918 41 038 36 039 Underlying operating profit before depreciation, amortisation and impairment losses 7 834 7 544 28 650 30 315 43 558 41 893 Operating profit (EBIT) 3 001 - 19 436 - 26 657 - 9 239 - 2 195 - 19 613 Items affecting comparability - 387 - 22 186 - 40 749 - 25 150 - 26 328 - 41 927 Underlying operating profit 3 388 2 750 14 092 15 911 24 133 22 314
Comment Q3: The underlying operating profit increased by SEK -0.6 million, which is explained by the following:
• Higher generation volumes (SEK 0.5 billion) • Lower production margins attributable to average lower prices achieved (SEK -0.8 billion) • Higher earnings from electricity distribution (SEK 0.3 billion) • Lower operating costs (SEK 0.5 billion) • Lower depreciation, mainly as a result of the impairment losses recognised during the second quarter of 2015
(SEK 0.4 billion) • Other items, net (SEK -0.3 billion)
Comment Q1-Q3: The underlying operating profit decreased by SEK 1.8 million, which is explained by the following:
• Lower production margins as a result of average lower prices achieved (SEK -2.8 billion) • Lower nuclear power generation (SEK -0.4 billion) • Higher earnings from electricity distribution (SEK 0.5 billion) • Higher earnings from sales activities (SEK 0.5 billion) • Other items, net (SEK 0.4 billion)
050 000
100 000150 000200 000250 000
1 2 3 4 1 2 3 4 1 2 3 4 1 2 3 4 1 2 3 4 1 2 3
2010 2011 2012 2013 2014 2015
Net salesSEK million
Per quarter Last 12-month values
010 00020 00030 00040 00050 000
1 2 3 4 1 2 3 4 1 2 3 4 1 2 3 4 1 2 3 4 1 2 3
2010 2011 2012 2013 2014 2015
Underlying operating profitSEK million
Per quarter Last 12-month values
Vattenfall Interim Report January-September 2015 7
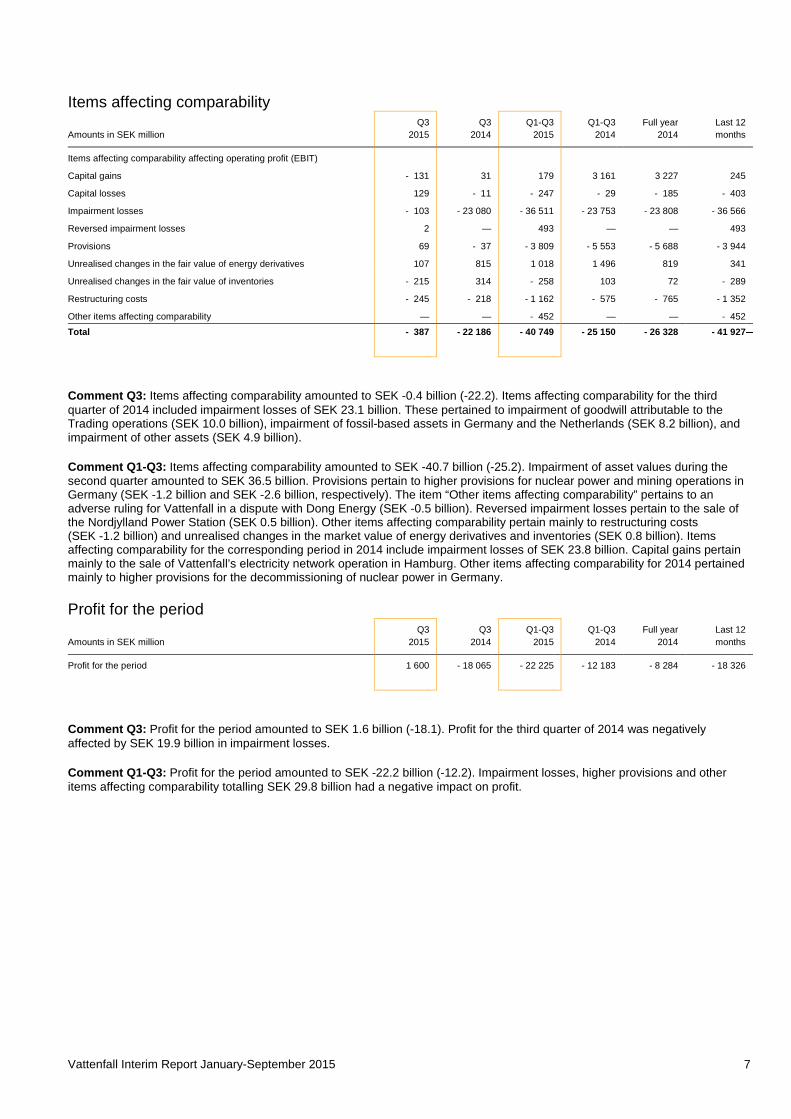
Items affecting comparability Q3 Q3 Q1-Q3 Q1-Q3 Full year Last 12 Amounts in SEK million 2015 2014 2015 2014 2014 months Items affecting comparability affecting operating profit (EBIT) Capital gains - 131 31 179 3 161 3 227 245 Capital losses 129 - 11 - 247 - 29 - 185 - 403 Impairment losses - 103 - 23 080 - 36 511 - 23 753 - 23 808 - 36 566 Reversed impairment losses 2 — 493 — — 493 Provisions 69 - 37 - 3 809 - 5 553 - 5 688 - 3 944 Unrealised changes in the fair value of energy derivatives 107 815 1 018 1 496 819 341 Unrealised changes in the fair value of inventories - 215 314 - 258 103 72 - 289 Restructuring costs - 245 - 218 - 1 162 - 575 - 765 - 1 352 Other items affecting comparability — — - 452 — — - 452 Total - 387 - 22 186 - 40 749 - 25 150 - 26 328 - 41 927 —
Comment Q3: Items affecting comparability amounted to SEK -0.4 billion (-22.2). Items affecting comparability for the third quarter of 2014 included impairment losses of SEK 23.1 billion. These pertained to impairment of goodwill attributable to the Trading operations (SEK 10.0 billion), impairment of fossil-based assets in Germany and the Netherlands (SEK 8.2 billion), and impairment of other assets (SEK 4.9 billion).
Comment Q1-Q3: Items affecting comparability amounted to SEK -40.7 billion (-25.2). Impairment of asset values during the second quarter amounted to SEK 36.5 billion. Provisions pertain to higher provisions for nuclear power and mining operations in Germany (SEK -1.2 billion and SEK -2.6 billion, respectively). The item “Other items affecting comparability” pertains to an adverse ruling for Vattenfall in a dispute with Dong Energy (SEK -0.5 billion). Reversed impairment losses pertain to the sale of the Nordjylland Power Station (SEK 0.5 billion). Other items affecting comparability pertain mainly to restructuring costs (SEK -1.2 billion) and unrealised changes in the market value of energy derivatives and inventories (SEK 0.8 billion). Items affecting comparability for the corresponding period in 2014 include impairment losses of SEK 23.8 billion. Capital gains pertain mainly to the sale of Vattenfall’s electricity network operation in Hamburg. Other items affecting comparability for 2014 pertained mainly to higher provisions for the decommissioning of nuclear power in Germany.
Profit for the period Q3 Q3 Q1-Q3 Q1-Q3 Full year Last 12 Amounts in SEK million 2015 2014 2015 2014 2014 months Profit for the period 1 600 - 18 065 - 22 225 - 12 183 - 8 284 - 18 326
Comment Q3: Profit for the period amounted to SEK 1.6 billion (-18.1). Profit for the third quarter of 2014 was negatively affected by SEK 19.9 billion in impairment losses.
Comment Q1-Q3: Profit for the period amounted to SEK -22.2 billion (-12.2). Impairment losses, higher provisions and other items affecting comparability totalling SEK 29.8 billion had a negative impact on profit.
Vattenfall Interim Report January-September 2015 8
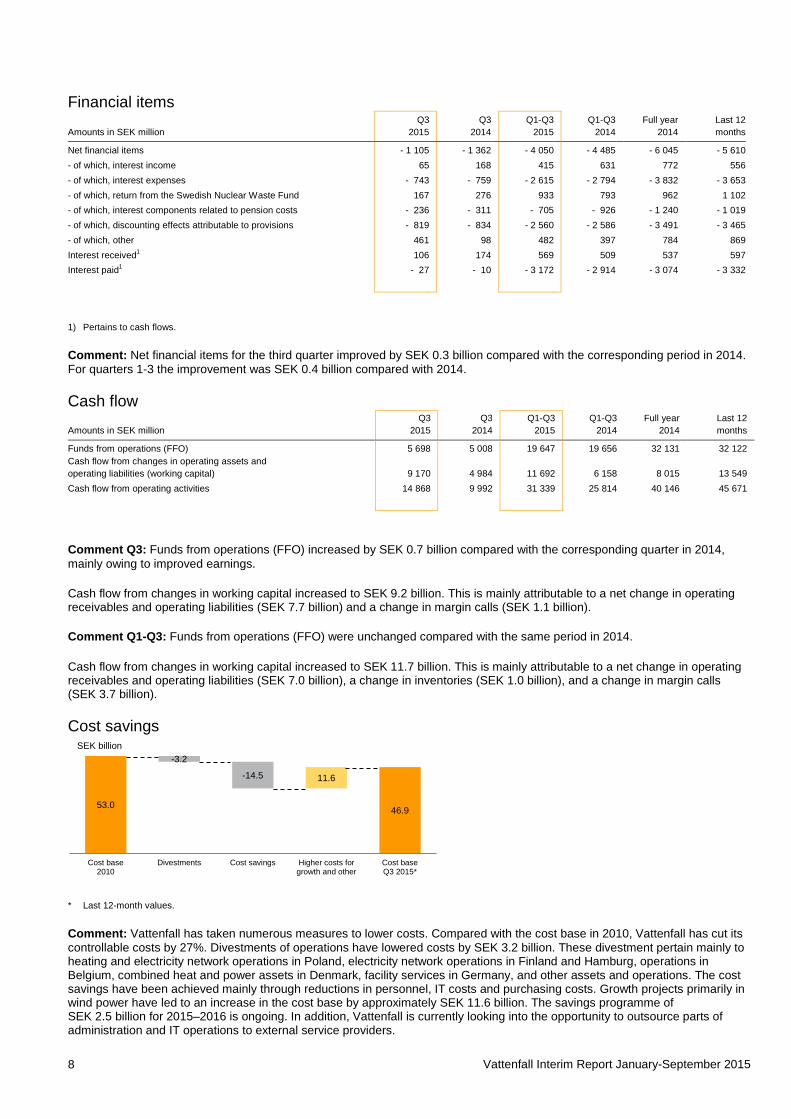
Financial items Q3 Q3 Q1-Q3 Q1-Q3 Full year Last 12 Amounts in SEK million 2015 2014 2015 2014 2014 months
Net financial items - 1 105 - 1 362 - 4 050 - 4 485 - 6 045 - 5 610 - of which, interest income 65 168 415 631 772 556 - of which, interest expenses - 743 - 759 - 2 615 - 2 794 - 3 832 - 3 653 - of which, return from the Swedish Nuclear Waste Fund 167 276 933 793 962 1 102 - of which, interest components related to pension costs - 236 - 311 - 705 - 926 - 1 240 - 1 019 - of which, discounting effects attributable to provisions - 819 - 834 - 2 560 - 2 586 - 3 491 - 3 465 - of which, other 461 98 482 397 784 869 Interest received1 106 174 569 509 537 597 Interest paid1 - 27 - 10 - 3 172 - 2 914 - 3 074 - 3 332
1) Pertains to cash flows.
Comment: Net financial items for the third quarter improved by SEK 0.3 billion compared with the corresponding period in 2014. For quarters 1-3 the improvement was SEK 0.4 billion compared with 2014.
Cash flow Q3 Q3 Q1-Q3 Q1-Q3 Full year Last 12 Amounts in SEK million 2015 2014 2015 2014 2014 months
Funds from operations (FFO) 5 698 5 008 19 647 19 656 32 131 32 122 Cash flow from changes in operating assets and operating liabilities (working capital) 9 170 4 984 11 692 6 158 8 015 13 549 Cash flow from operating activities 14 868 9 992 31 339 25 814 40 146 45 671
Comment Q3: Funds from operations (FFO) increased by SEK 0.7 billion compared with the corresponding quarter in 2014, mainly owing to improved earnings.
Cash flow from changes in working capital increased to SEK 9.2 billion. This is mainly attributable to a net change in operating receivables and operating liabilities (SEK 7.7 billion) and a change in margin calls (SEK 1.1 billion).
Comment Q1-Q3: Funds from operations (FFO) were unchanged compared with the same period in 2014.
Cash flow from changes in working capital increased to SEK 11.7 billion. This is mainly attributable to a net change in operating receivables and operating liabilities (SEK 7.0 billion), a change in inventories (SEK 1.0 billion), and a change in margin calls (SEK 3.7 billion).
Cost savings
* Last 12-month values.
Comment: Vattenfall has taken numerous measures to lower costs. Compared with the cost base in 2010, Vattenfall has cut its controllable costs by 27%. Divestments of operations have lowered costs by SEK 3.2 billion. These divestment pertain mainly to heating and electricity network operations in Poland, electricity network operations in Finland and Hamburg, operations in Belgium, combined heat and power assets in Denmark, facility services in Germany, and other assets and operations. The cost savings have been achieved mainly through reductions in personnel, IT costs and purchasing costs. Growth projects primarily in wind power have led to an increase in the cost base by approximately SEK 11.6 billion. The savings programme of SEK 2.5 billion for 2015–2016 is ongoing. In addition, Vattenfall is currently looking into the opportunity to outsource parts of administration and IT operations to external service providers.
53.0 46.9
-3.2
-14.5 11.6
Cost base2010
Divestments Cost savings Higher costs forgrowth and other
Cost baseQ3 2015*
SEK billion
Vattenfall Interim Report January-September 2015 9
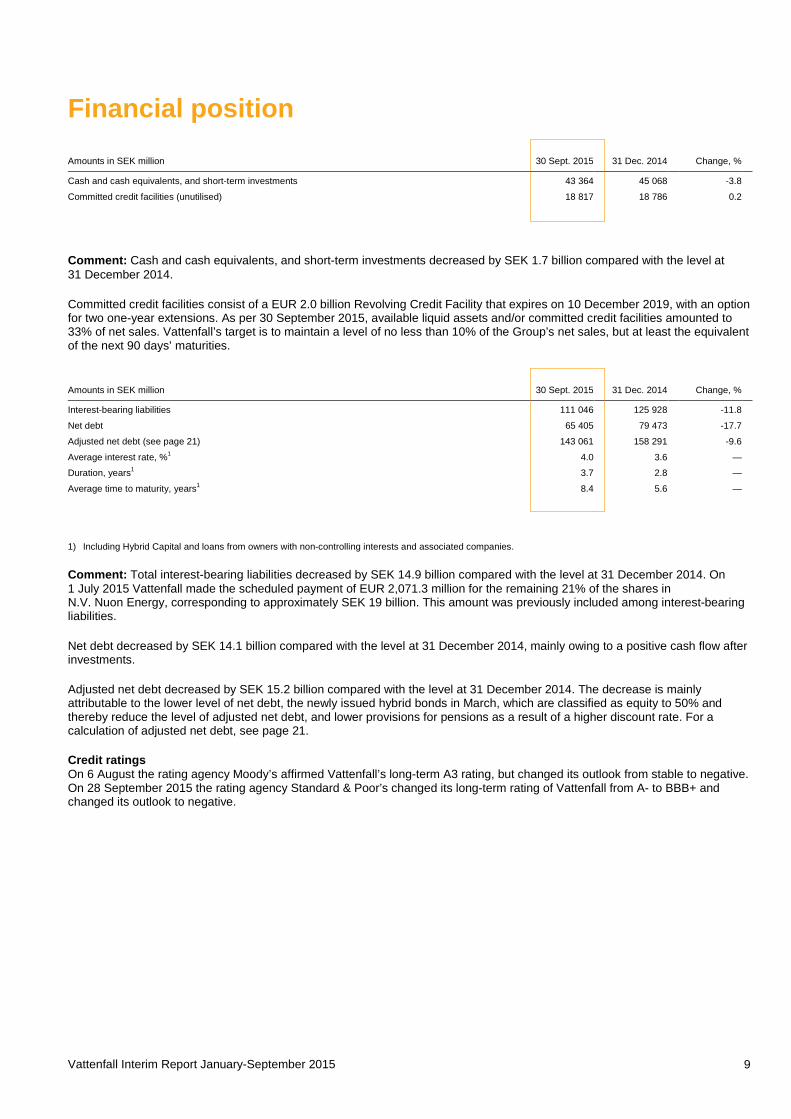
Financial position
Amounts in SEK million 30 Sept. 2015 31 Dec. 2014 Change, %
Cash and cash equivalents, and short-term investments 43 364 45 068
-3.8 Committed credit facilities (unutilised) 18 817 18 786
0.2
Comment: Cash and cash equivalents, and short-term investments decreased by SEK 1.7 billion compared with the level at 31 December 2014.
Committed credit facilities consist of a EUR 2.0 billion Revolving Credit Facility that expires on 10 December 2019, with an option for two one-year extensions. As per 30 September 2015, available liquid assets and/or committed credit facilities amounted to 33% of net sales. Vattenfall’s target is to maintain a level of no less than 10% of the Group’s net sales, but at least the equivalent of the next 90 days’ maturities.
Amounts in SEK million 30 Sept. 2015 31 Dec. 2014 Change, %
Interest-bearing liabilities 111 046 125 928
-11.8 Net debt 65 405 79 473
-17.7
Adjusted net debt (see page 21) 143 061 158 291
-9.6 Average interest rate, %1 4.0 3.6
—
Duration, years1 3.7 2.8
— Average time to maturity, years1 8.4 5.6
—
1) Including Hybrid Capital and loans from owners with non-controlling interests and associated companies.
Comment: Total interest-bearing liabilities decreased by SEK 14.9 billion compared with the level at 31 December 2014. On 1 July 2015 Vattenfall made the scheduled payment of EUR 2,071.3 million for the remaining 21% of the shares in N.V. Nuon Energy, corresponding to approximately SEK 19 billion. This amount was previously included among interest-bearing liabilities.
Net debt decreased by SEK 14.1 billion compared with the level at 31 December 2014, mainly owing to a positive cash flow after investments.
Adjusted net debt decreased by SEK 15.2 billion compared with the level at 31 December 2014. The decrease is mainly attributable to the lower level of net debt, the newly issued hybrid bonds in March, which are classified as equity to 50% and thereby reduce the level of adjusted net debt, and lower provisions for pensions as a result of a higher discount rate. For a calculation of adjusted net debt, see page 21.
Credit ratings On 6 August the rating agency Moody’s affirmed Vattenfall’s long-term A3 rating, but changed its outlook from stable to negative. On 28 September 2015 the rating agency Standard & Poor’s changed its long-term rating of Vattenfall from A- to BBB+ and changed its outlook to negative.
Vattenfall Interim Report January-September 2015 10
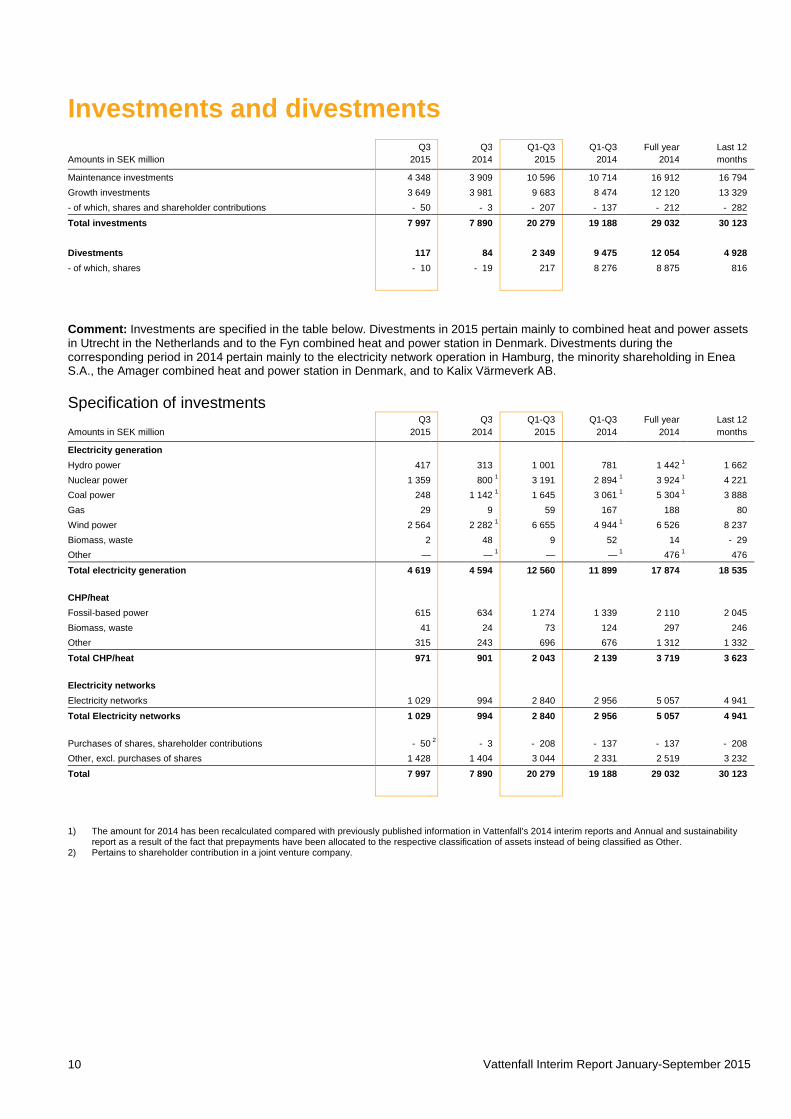
Investments and divestments Q3 Q3 Q1-Q3 Q1-Q3 Full year Last 12 Amounts in SEK million 2015 2014 2015 2014 2014 months
Maintenance investments 4 348 3 909 10 596 10 714 16 912 16 794 Growth investments 3 649 3 981 9 683 8 474 12 120 13 329 - of which, shares and shareholder contributions - 50 - 3 - 207 - 137 - 212 - 282
Total investments 7 997 7 890 20 279 19 188 29 032 30 123 Divestments 117 84 2 349 9 475 12 054 4 928 - of which, shares - 10 - 19 217 8 276 8 875 816
Comment: Investments are specified in the table below. Divestments in 2015 pertain mainly to combined heat and power assets in Utrecht in the Netherlands and to the Fyn combined heat and power station in Denmark. Divestments during the corresponding period in 2014 pertain mainly to the electricity network operation in Hamburg, the minority shareholding in Enea S.A., the Amager combined heat and power station in Denmark, and to Kalix Värmeverk AB.
Specification of investments Q3 Q3 Q1-Q3 Q1-Q3 Full year Last 12 Amounts in SEK million 2015 2014 2015 2014 2014 months
Electricity generation Hydro power 417 313 1 001 781 1 442 1 1 662 Nuclear power 1 359 800 1 3 191 2 894 1 3 924 1 4 221 Coal power 248 1 142 1 1 645 3 061 1 5 304 1 3 888 Gas 29 9 59 167 188 80 Wind power 2 564 2 282 1 6 655 4 944 1 6 526 8 237 Biomass, waste 2 48 9 52 14 - 29 Other — — 1 — — 1 476 1 476
Total electricity generation 4 619 4 594 12 560 11 899 17 874 18 535 CHP/heat Fossil-based power 615 634 1 274 1 339 2 110 2 045 Biomass, waste 41 24 73 124 297 246 Other 315 243 696 676 1 312 1 332
Total CHP/heat 971 901 2 043 2 139 3 719 3 623 Electricity networks Electricity networks 1 029 994 2 840 2 956 5 057 4 941
Total Electricity networks 1 029 994 2 840 2 956 5 057 4 941 Purchases of shares, shareholder contributions - 50 2 - 3 - 208 - 137 - 137 - 208 Other, excl. purchases of shares 1 428 1 404 3 044 2 331 2 519 3 232
Total 7 997 7 890 20 279 19 188 29 032 30 123
1) The amount for 2014 has been recalculated compared with previously published information in Vattenfall's 2014 interim reports and Annual and sustainability report as a result of the fact that prepayments have been allocated to the respective classification of assets instead of being classified as Other.
2) Pertains to shareholder contribution in a joint venture company.
Vattenfall Interim Report January-September 2015 11
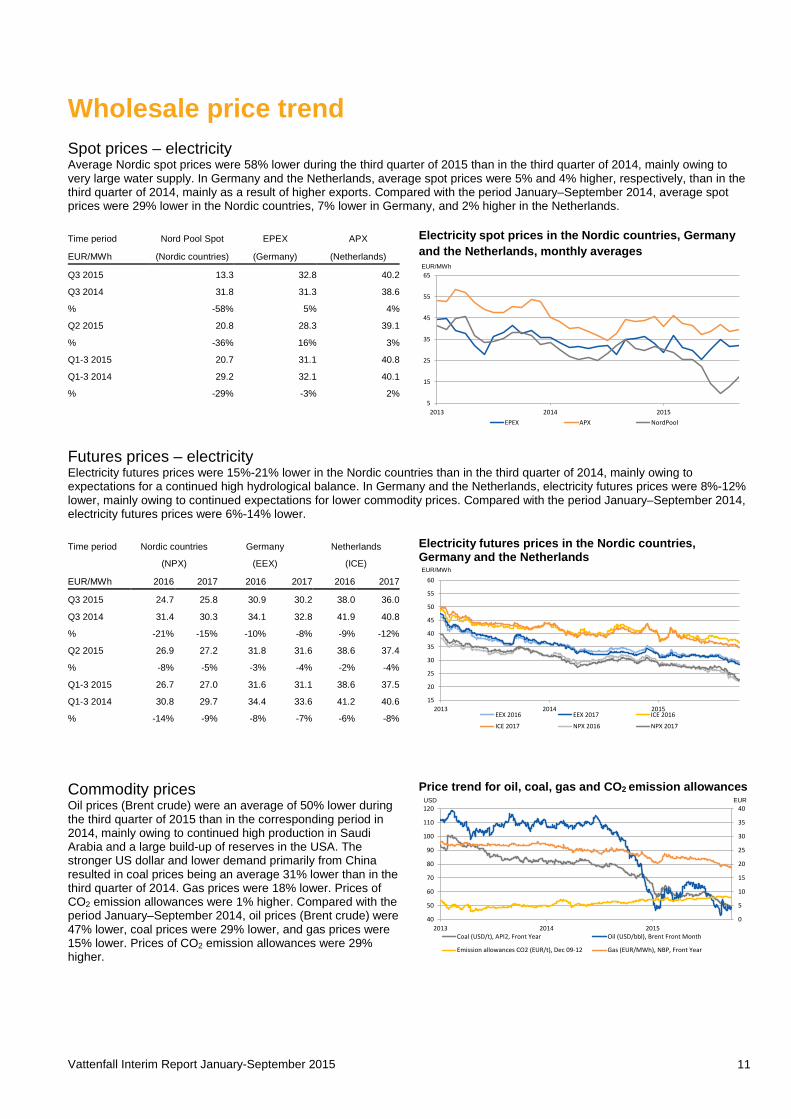
Wholesale price trend Spot prices – electricity Average Nordic spot prices were 58% lower during the third quarter of 2015 than in the third quarter of 2014, mainly owing to very large water supply. In Germany and the Netherlands, average spot prices were 5% and 4% higher, respectively, than in the third quarter of 2014, mainly as a result of higher exports. Compared with the period January–September 2014, average spot prices were 29% lower in the Nordic countries, 7% lower in Germany, and 2% higher in the Netherlands.
Time period Nord Pool Spot EPEX APX
EUR/MWh (Nordic countries) (Germany) (Netherlands)
Q3 2015 13.3 32.8 40.2
Q3 2014 31.8 31.3 38.6
% -58% 5% 4%
Q2 2015 20.8 28.3 39.1
% -36% 16% 3%
Q1-3 2015 20.7 31.1 40.8
Q1-3 2014 29.2 32.1 40.1
% -29% -3% 2%
Electricity spot prices in the Nordic countries, Germany and the Netherlands, monthly averages
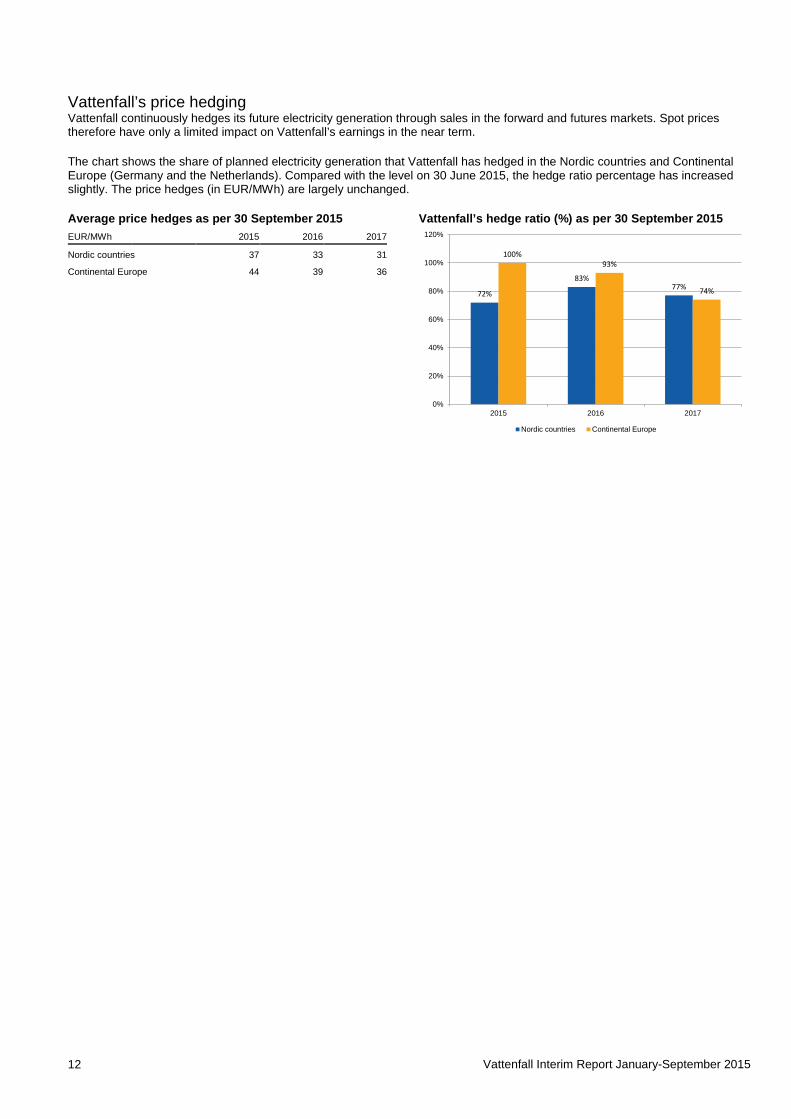
Futures prices – electricity Electricity futures prices were 15%-21% lower in the Nordic countries than in the third quarter of 2014, mainly owing to expectations for a continued high hydrological balance. In Germany and the Netherlands, electricity futures prices were 8%-12% lower, mainly owing to continued expectations for lower commodity prices. Compared with the period January–September 2014, electricity futures prices were 6%-14% lower.
Time period Nordic countries Germany Netherlands
(NPX) (EEX) (ICE)
EUR/MWh 2016 2017 2016 2017 2016 2017
Q3 2015 24.7 25.8 30.9 30.2 38.0 36.0
Q3 2014 31.4 30.3 34.1 32.8 41.9 40.8
% -21% -15% -10% -8% -9% -12%
Q2 2015 26.9 27.2 31.8 31.6 38.6 37.4
% -8% -5% -3% -4% -2% -4%
Q1-3 2015 26.7 27.0 31.6 31.1 38.6 37.5
Q1-3 2014 30.8 29.7 34.4 33.6 41.2 40.6
% -14% -9% -8% -7% -6% -8%
Electricity futures prices in the Nordic countries, Germany and the Netherlands
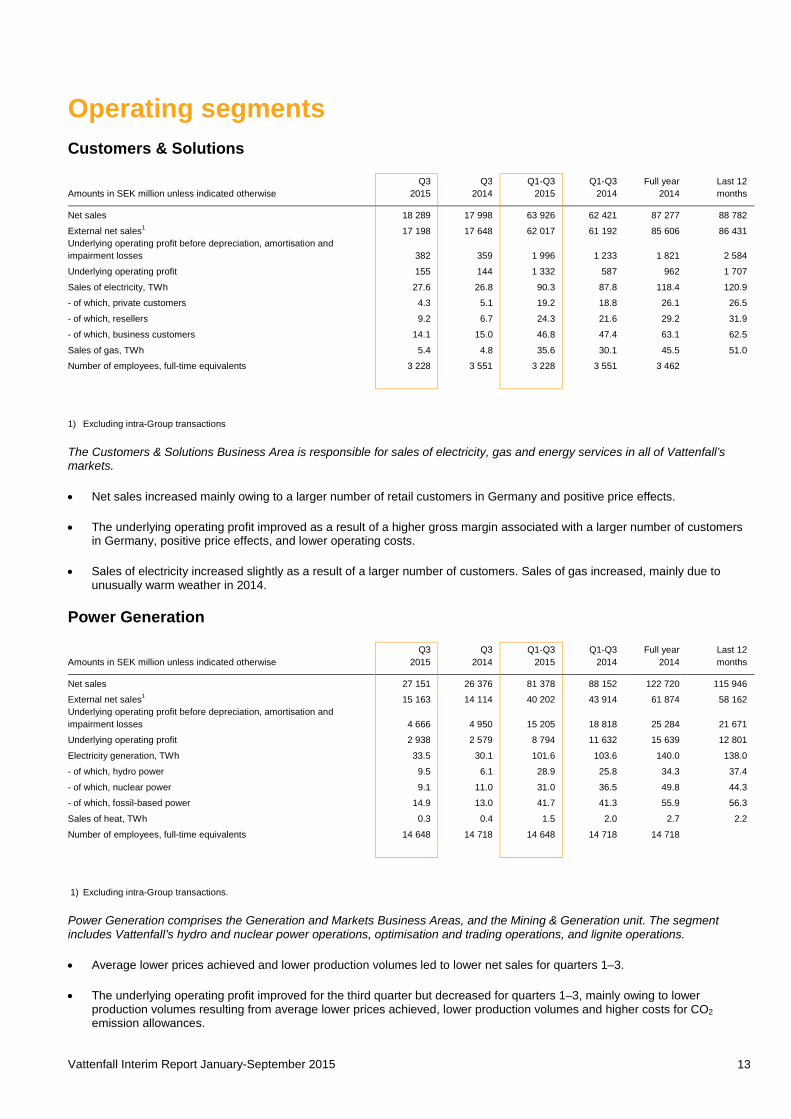
Commodity prices Oil prices (Brent crude) were an average of 50% lower during the third quarter of 2015 than in the corresponding period in 2014, mainly owing to continued high production in Saudi Arabia and a large build-up of reserves in the USA. The stronger US dollar and lower demand primarily from China resulted in coal prices being an average 31% lower than in the third quarter of 2014. Gas prices were 18% lower. Prices of CO2 emission allowances were 1% higher. Compared with the period January–September 2014, oil prices (Brent crude) were 47% lower, coal prices were 29% lower, and gas prices were 15% lower. Prices of CO2 emission allowances were 29% higher.
Price trend for oil, coal, gas and CO2 emission allowances
5
15
25
35
45
55
65
2013 2014 2015EPEX APX NordPool
EUR/MWh
15
20
25
30
35
40
45
50
55
60
2013 2014 2015EEX 2016 EEX 2017 ICE 2016
ICE 2017 NPX 2016 NPX 2017
EUR/MWh
0
5
10
15
20
25
30
35
40
40
50
60
70
80
90
100
110
120
2013 2014 2015Coal (USD/t), API2, Front Year Oil (USD/bbl), Brent Front Month
Emission allowances CO2 (EUR/t), Dec 09-12 Gas (EUR/MWh), NBP, Front Year
USD EUR
Vattenfall Interim Report January-September 2015 12
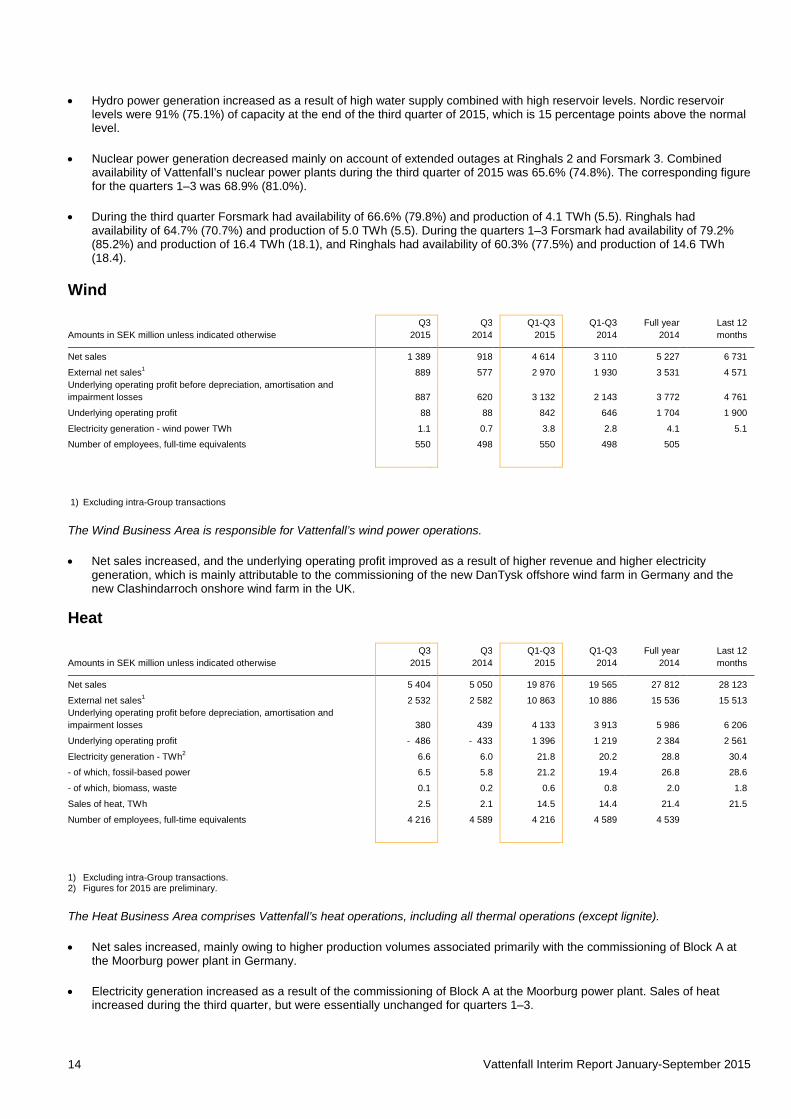
Vattenfall’s price hedging Vattenfall continuously hedges its future electricity generation through sales in the forward and futures markets. Spot prices therefore have only a limited impact on Vattenfall’s earnings in the near term.
The chart shows the share of planned electricity generation that Vattenfall has hedged in the Nordic countries and Continental Europe (Germany and the Netherlands). Compared with the level on 30 June 2015, the hedge ratio percentage has increased slightly. The price hedges (in EUR/MWh) are largely unchanged.
Average price hedges as per 30 September 2015 EUR/MWh 2015 2016 2017
Nordic countries 37 33 31
Continental Europe 44 39 36
Vattenfall’s hedge ratio (%) as per 30 September 2015
72%
83%77%
100%93%
74%
0%
20%
40%
60%
80%
100%
120%
2015 2016 2017
Nordic countries Continental Europe
Vattenfall Interim Report January-September 2015 13
Operating segments Customers & Solutions
Q3 Q3
Q1-Q3 Q1-Q3
Full year
Last 12
Amounts in SEK million unless indicated otherwise 2015 2014 2015 2014 2014 months Net sales 18 289 17 998
63 926 62 421
87 277
88 782
External net sales1 17 198 17 648
62 017 61 192
85 606
86 431 Underlying operating profit before depreciation, amortisation and
impairment losses 382 359
1 996 1 233
1 821
2 584
Underlying operating profit 155 144
1 332 587
962
1 707 Sales of electricity, TWh 27.6
26.8
90.3 87.8
118.4
120.9
- of which, private customers 4.3
5.1
19.2 18.8
26.1
26.5 - of which, resellers 9.2
6.7
24.3 21.6
29.2
31.9
- of which, business customers 14.1
15.0
46.8 47.4
63.1
62.5 Sales of gas, TWh 5.4
4.8
35.6 30.1
45.5
51.0
Number of employees, full-time equivalents 3 228 3 551
3 228 3 551
3 462
1) Excluding intra-Group transactions
The Customers & Solutions Business Area is responsible for sales of electricity, gas and energy services in all of Vattenfall’s markets.
• Net sales increased mainly owing to a larger number of retail customers in Germany and positive price effects.
• The underlying operating profit improved as a result of a higher gross margin associated with a larger number of customers in Germany, positive price effects, and lower operating costs.
• Sales of electricity increased slightly as a result of a larger number of customers. Sales of gas increased, mainly due to unusually warm weather in 2014.
Power Generation
Q3 Q3
Q1-Q3 Q1-Q3
Full year
Last 12
Amounts in SEK million unless indicated otherwise 2015 2014 2015 2014 2014 months Net sales 27 151 26 376
81 378 88 152
122 720
115 946
External net sales1 15 163 14 114
40 202 43 914
61 874
58 162 Underlying operating profit before depreciation, amortisation and
impairment losses 4 666 4 950
15 205 18 818
25 284
21 671
Underlying operating profit 2 938 2 579
8 794 11 632
15 639
12 801 Electricity generation, TWh 33.5
30.1
101.6 103.6
140.0
138.0
- of which, hydro power 9.5
6.1
28.9 25.8
34.3
37.4 - of which, nuclear power 9.1
11.0
31.0 36.5
49.8
44.3
- of which, fossil-based power 14.9
13.0
41.7 41.3
55.9
56.3 Sales of heat, TWh 0.3
0.4
1.5 2.0
2.7
2.2
Number of employees, full-time equivalents 14 648 14 718
14 648 14 718
14 718
1) Excluding intra-Group transactions.
Power Generation comprises the Generation and Markets Business Areas, and the Mining & Generation unit. The segment includes Vattenfall’s hydro and nuclear power operations, optimisation and trading operations, and lignite operations.
• Average lower prices achieved and lower production volumes led to lower net sales for quarters 1–3.
• The underlying operating profit improved for the third quarter but decreased for quarters 1–3, mainly owing to lower production volumes resulting from average lower prices achieved, lower production volumes and higher costs for CO2 emission allowances.
Vattenfall Interim Report January-September 2015 14
• Hydro power generation increased as a result of high water supply combined with high reservoir levels. Nordic reservoir levels were 91% (75.1%) of capacity at the end of the third quarter of 2015, which is 15 percentage points above the normal level.
• Nuclear power generation decreased mainly on account of extended outages at Ringhals 2 and Forsmark 3. Combined availability of Vattenfall’s nuclear power plants during the third quarter of 2015 was 65.6% (74.8%). The corresponding figure for the quarters 1–3 was 68.9% (81.0%).
• During the third quarter Forsmark had availability of 66.6% (79.8%) and production of 4.1 TWh (5.5). Ringhals had availability of 64.7% (70.7%) and production of 5.0 TWh (5.5). During the quarters 1–3 Forsmark had availability of 79.2% (85.2%) and production of 16.4 TWh (18.1), and Ringhals had availability of 60.3% (77.5%) and production of 14.6 TWh (18.4).
Wind
Q3 Q3
Q1-Q3 Q1-Q3
Full year
Last 12
Amounts in SEK million unless indicated otherwise 2015 2014 2015 2014 2014 months Net sales 1 389 918
4 614 3 110
5 227
6 731
External net sales1 889 577
2 970 1 930
3 531
4 571 Underlying operating profit before depreciation, amortisation and
impairment losses 887 620
3 132 2 143
3 772
4 761
Underlying operating profit 88 88
842 646
1 704
1 900 Electricity generation - wind power TWh 1.1
0.7
3.8 2.8
4.1
5.1
Number of employees, full-time equivalents 550 498
550 498
505
1) Excluding intra-Group transactions
The Wind Business Area is responsible for Vattenfall’s wind power operations.
• Net sales increased, and the underlying operating profit improved as a result of higher revenue and higher electricity generation, which is mainly attributable to the commissioning of the new DanTysk offshore wind farm in Germany and the new Clashindarroch onshore wind farm in the UK.
Heat
Q3 Q3
Q1-Q3 Q1-Q3
Full year
Last 12
Amounts in SEK million unless indicated otherwise 2015 2014 2015 2014 2014 months Net sales 5 404 5 050
19 876 19 565
27 812
28 123
External net sales1 2 532 2 582
10 863 10 886
15 536
15 513 Underlying operating profit before depreciation, amortisation and
impairment losses 380 439
4 133 3 913
5 986
6 206
Underlying operating profit - 486 - 433
1 396 1 219
2 384
2 561 Electricity generation - TWh2 6.6
6.0
21.8 20.2
28.8
30.4
- of which, fossil-based power 6.5
5.8
21.2 19.4
26.8
28.6 - of which, biomass, waste 0.1
0.2
0.6 0.8
2.0
1.8
Sales of heat, TWh 2.5
2.1
14.5 14.4
21.4
21.5 Number of employees, full-time equivalents 4 216 4 589
4 216 4 589
4 539
1) Excluding intra-Group transactions. 2) Figures for 2015 are preliminary.
The Heat Business Area comprises Vattenfall’s heat operations, including all thermal operations (except lignite).
• Net sales increased, mainly owing to higher production volumes associated primarily with the commissioning of Block A at the Moorburg power plant in Germany.
• Electricity generation increased as a result of the commissioning of Block A at the Moorburg power plant. Sales of heat increased during the third quarter, but were essentially unchanged for quarters 1–3.
Vattenfall Interim Report January-September 2015 15
Distribution
Q3 Q3
Q1-Q3 Q1-Q3
Full year
Last 12
Amounts in SEK million unless indicated otherwise 2015 2014 2015 2014 2014 months Net sales 4 594 4 269
14 336 13 448
18 782
19 670
External net sales1 3 547 3 216
11 032 10 075
14 173
15 130 Underlying operating profit before depreciation, amortisation and
impairment losses 1 822 1 534
5 787 5 164
7 412
8 035
Underlying operating profit 1 143 791
3 762 2 962
4 435
5 235 Number of employees, full-time equivalents 2 711 2 649
2 711 2 649
2 658
1) Excluding intra-Group transactions.
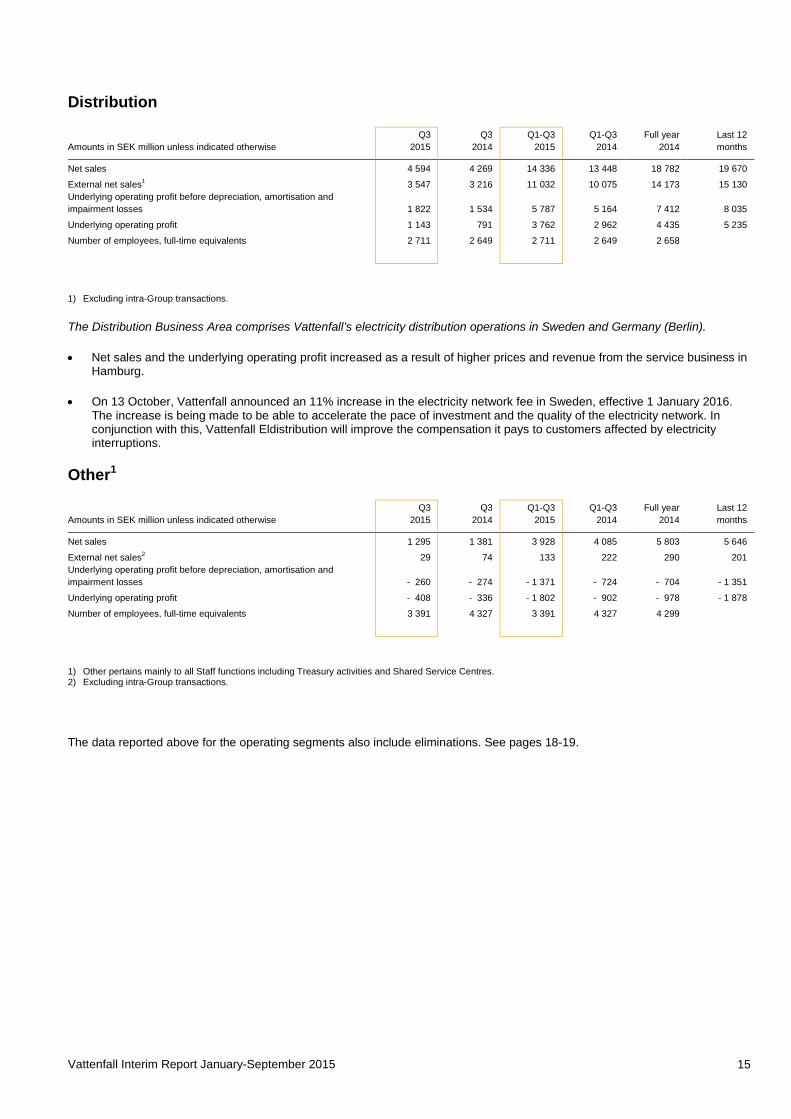
The Distribution Business Area comprises Vattenfall’s electricity distribution operations in Sweden and Germany (Berlin).
• Net sales and the underlying operating profit increased as a result of higher prices and revenue from the service business in Hamburg.
• On 13 October, Vattenfall announced an 11% increase in the electricity network fee in Sweden, effective 1 January 2016. The increase is being made to be able to accelerate the pace of investment and the quality of the electricity network. In conjunction with this, Vattenfall Eldistribution will improve the compensation it pays to customers affected by electricity interruptions.
Other1
Q3 Q3
Q1-Q3 Q1-Q3
Full year
Last 12
Amounts in SEK million unless indicated otherwise 2015 2014 2015 2014 2014 months Net sales 1 295 1 381
3 928 4 085
5 803
5 646
External net sales2 29 74
133 222
290
201 Underlying operating profit before depreciation, amortisation and
impairment losses - 260 - 274
- 1 371 - 724
- 704
- 1 351
Underlying operating profit - 408 - 336
- 1 802 - 902
- 978
- 1 878 Number of employees, full-time equivalents 3 391 4 327
3 391 4 327
4 299
1) Other pertains mainly to all Staff functions including Treasury activities and Shared Service Centres. 2) Excluding intra-Group transactions.
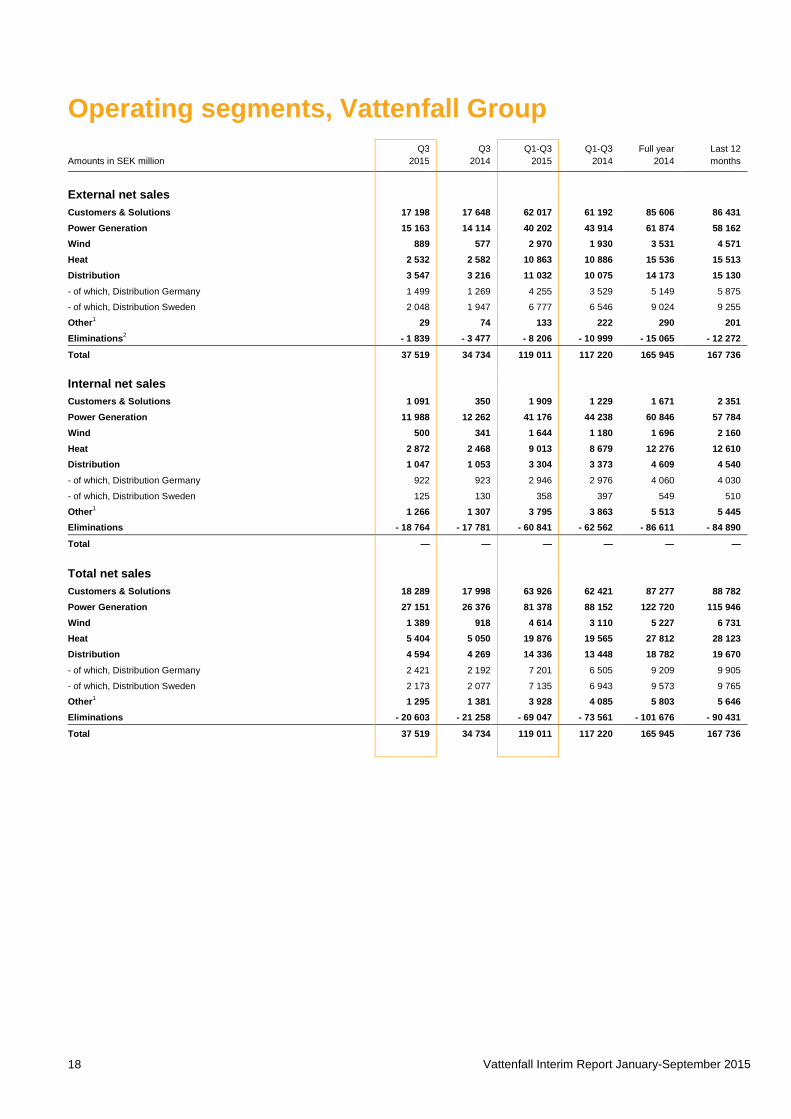
The data reported above for the operating segments also include eliminations. See pages 18-19.
Vattenfall Interim Report January-September 2015 16
Consolidated income statement
Q3 Q3
Q1-Q3 Q1-Q3
Full year
Last 12
Amounts in SEK million 2015 2014 2015 2014 2014 months
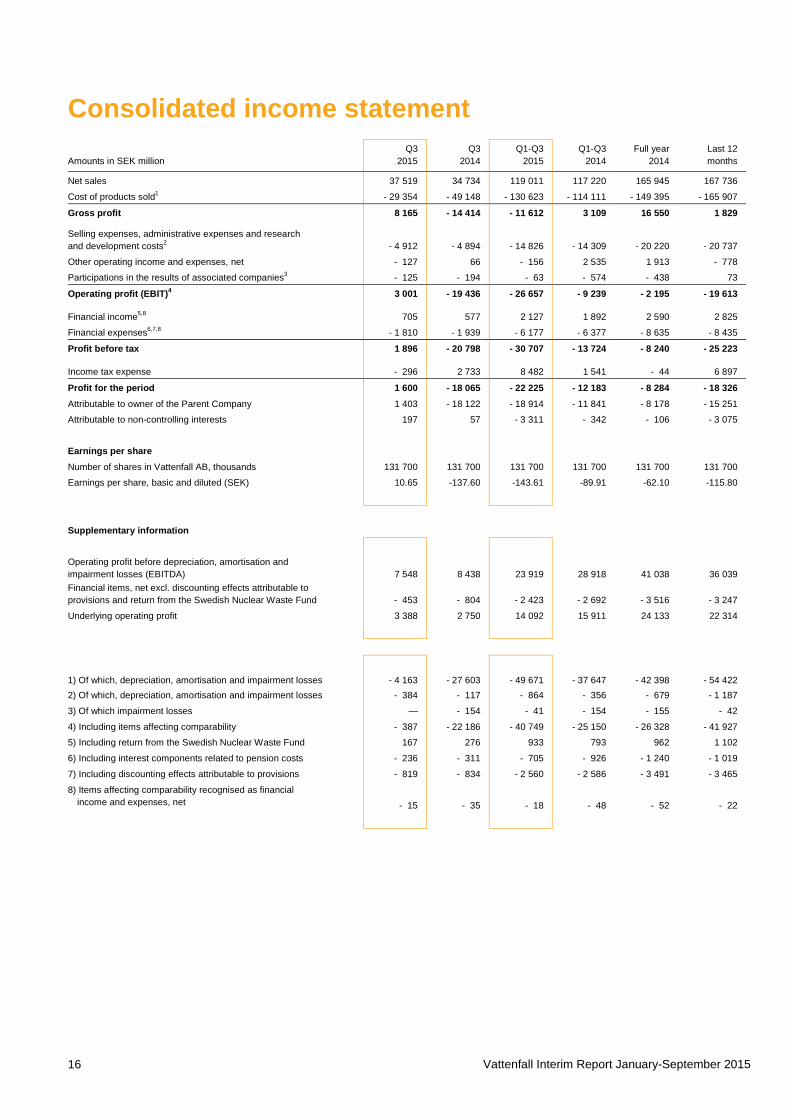
Net sales 37 519 34 734 119 011 117 220 165 945
167 736 Cost of products sold1 - 29 354 - 49 148
- 130 623 - 114 111
- 149 395 - 165 907
Gross profit 8 165 - 14 414 - 11 612 3 109 16 550
1 829
Selling expenses, administrative expenses and research and development costs2 - 4 912 - 4 894
- 14 826 - 14 309
- 20 220
- 20 737
Other operating income and expenses, net - 127 66
- 156 2 535
1 913
- 778 Participations in the results of associated companies3 - 125 - 194
- 63 - 574
- 438 73
Operating profit (EBIT)4 3 001 - 19 436 - 26 657 - 9 239 - 2 195
- 19 613
Financial income5,8 705 577
2 127 1 892
2 590
2 825 Financial expenses6,7,8 - 1 810 - 1 939
- 6 177 - 6 377
- 8 635 - 8 435
Profit before tax 1 896 - 20 798 - 30 707 - 13 724 - 8 240
- 25 223
Income tax expense - 296 2 733 8 482 1 541 - 44 6 897
Profit for the period 1 600 - 18 065
- 22 225 - 12 183
- 8 284
- 18 326 Attributable to owner of the Parent Company 1 403 - 18 122
- 18 914 - 11 841
- 8 178
- 15 251
Attributable to non-controlling interests 197 57
- 3 311 - 342
- 106
- 3 075
Earnings per share
Number of shares in Vattenfall AB, thousands 131 700 131 700
131 700 131 700
131 700
131 700
Earnings per share, basic and diluted (SEK) 10.65 -137.60
-143.61 -89.91
-62.10
-115.80
Supplementary information
Operating profit before depreciation, amortisation and impairment losses (EBITDA) 7 548 8 438
23 919 28 918
41 038
36 039
Financial items, net excl. discounting effects attributable to provisions and return from the Swedish Nuclear Waste Fund - 453 - 804
- 2 423 - 2 692
- 3 516
- 3 247
Underlying operating profit 3 388 2 750
14 092 15 911
24 133
22 314
1) Of which, depreciation, amortisation and impairment losses - 4 163 - 27 603
- 49 671 - 37 647
- 42 398
- 54 422
2) Of which, depreciation, amortisation and impairment losses - 384 - 117
- 864 - 356
- 679
- 1 187
3) Of which impairment losses — - 154
- 41 - 154
- 155
- 42 4) Including items affecting comparability - 387 - 22 186
- 40 749 - 25 150
- 26 328
- 41 927
5) Including return from the Swedish Nuclear Waste Fund 167 276
933 793
962
1 102 6) Including interest components related to pension costs - 236 - 311
- 705 - 926
- 1 240
- 1 019
7) Including discounting effects attributable to provisions - 819 - 834
- 2 560 - 2 586
- 3 491
- 3 465 8) Items affecting comparability recognised as financial
income and expenses, net - 15 - 35
- 18 - 48
- 52
- 22
Vattenfall Interim Report January-September 2015 17
Consolidated statement of comprehensive income
Q3 Q3
Q1-Q3 Q1-Q3
Full year
Last 12
Amounts in SEK million 2015 2014 2015 2014 2014 months
Profit for the period 1 600 - 18 065
- 22 225 - 12 183
- 8 284
- 18 326
Other comprehensive income
Items that will be reclassified to profit or loss when specific conditions are met
Cash flow hedges - changes in fair value of 6 108 210
9 725 4 714
5 243
10 254 Cash flow hedges - dissolved against income statement - 1 536 - 2 737
- 4 387 - 7 946
- 5 871
- 2 312
Cash flow hedges - transferred to cost of hedged item - 8 - 13
16 - 8
- 3
21 Hedging of net investments in foreign operations - 879 98
275 - 3 204
- 5 452
- 1 973
Translation differences and exchange rate effects net, divested companies — 50
— 50
101
51
Remeasurement of available-for-sale financial assets — —
— - 182
- 182
— Translation differences 2 028 - 201
1 024 6 530
10 453
4 947
Income tax relating to items that will be reclassified - 971 695 - 1 260 3 520
3 242
- 1 538 Total Items that will be reclassified to profit or loss when specific
conditions are met 4 742 - 1 898 5 393 3 474 7 531 9 450
Items that will not be reclassified to profit or loss
Remeasurement pertaining to defined benefit obligations 362 - 18
2 961 - 3 409
- 9 130
- 2 760
Income tax relating to items that will not be reclassified - 108 5 - 810 956 2 587 821
Total Items that will not be reclassified to profit or loss 254 - 13
2 151 - 2 453
- 6 543
- 1 939
Total other comprehensive income, net after tax 4 996 - 1 911
7 544 1 021
988
7 511
Total comprehensive income for the period 6 596 - 19 976
- 14 681 - 11 162
- 7 296
- 10 815 Attributable to owner of the Parent Company 6 209 - 20 056
- 11 405 - 11 053
- 7 412
- 7 764
Attributable to non-controlling interests 387 80
- 3 276 - 109
116
- 3 051
Vattenfall Interim Report January-September 2015 18
Operating segments, Vattenfall Group
Q3 Q3
Q1-Q3 Q1-Q3
Full year
Last 12
Amounts in SEK million 2015 2014 2015 2014 2014 months
External net sales
Customers & Solutions 17 198 17 648
62 017 61 192
85 606
86 431 Power Generation 15 163 14 114
40 202 43 914
61 874
58 162
Wind 889 577
2 970 1 930
3 531
4 571 Heat 2 532 2 582
10 863 10 886
15 536
15 513
Distribution 3 547 3 216
11 032 10 075
14 173
15 130 - of which, Distribution Germany 1 499 1 269
4 255 3 529
5 149
5 875
- of which, Distribution Sweden 2 048 1 947
6 777 6 546
9 024
9 255 Other1 29 74
133 222
290
201
Eliminations2 - 1 839 - 3 477
- 8 206 - 10 999
- 15 065
- 12 272 Total 37 519 34 734 119 011 117 220 165 945 167 736
Internal net sales
Customers & Solutions 1 091 350
1 909 1 229
1 671
2 351 Power Generation 11 988 12 262
41 176 44 238
60 846
57 784
Wind 500 341
1 644 1 180
1 696
2 160 Heat 2 872 2 468
9 013 8 679
12 276
12 610
Distribution 1 047 1 053
3 304 3 373
4 609
4 540 - of which, Distribution Germany 922 923
2 946 2 976
4 060
4 030
- of which, Distribution Sweden 125 130
358 397
549
510 Other1 1 266 1 307
3 795 3 863
5 513
5 445
Eliminations - 18 764 - 17 781
- 60 841 - 62 562
- 86 611
- 84 890 Total — — — — — —
Total net sales
Customers & Solutions 18 289 17 998
63 926 62 421
87 277
88 782 Power Generation 27 151 26 376
81 378 88 152
122 720
115 946
Wind 1 389 918
4 614 3 110
5 227
6 731 Heat 5 404 5 050
19 876 19 565
27 812
28 123
Distribution 4 594 4 269
14 336 13 448
18 782
19 670 - of which, Distribution Germany 2 421 2 192
7 201 6 505
9 209
9 905
- of which, Distribution Sweden 2 173 2 077
7 135 6 943
9 573
9 765 Other1 1 295 1 381
3 928 4 085
5 803
5 646
Eliminations - 20 603 - 21 258
- 69 047 - 73 561
- 101 676
- 90 431 Total 37 519 34 734 119 011 117 220 165 945 167 736
Vattenfall Interim Report January-September 2015 19
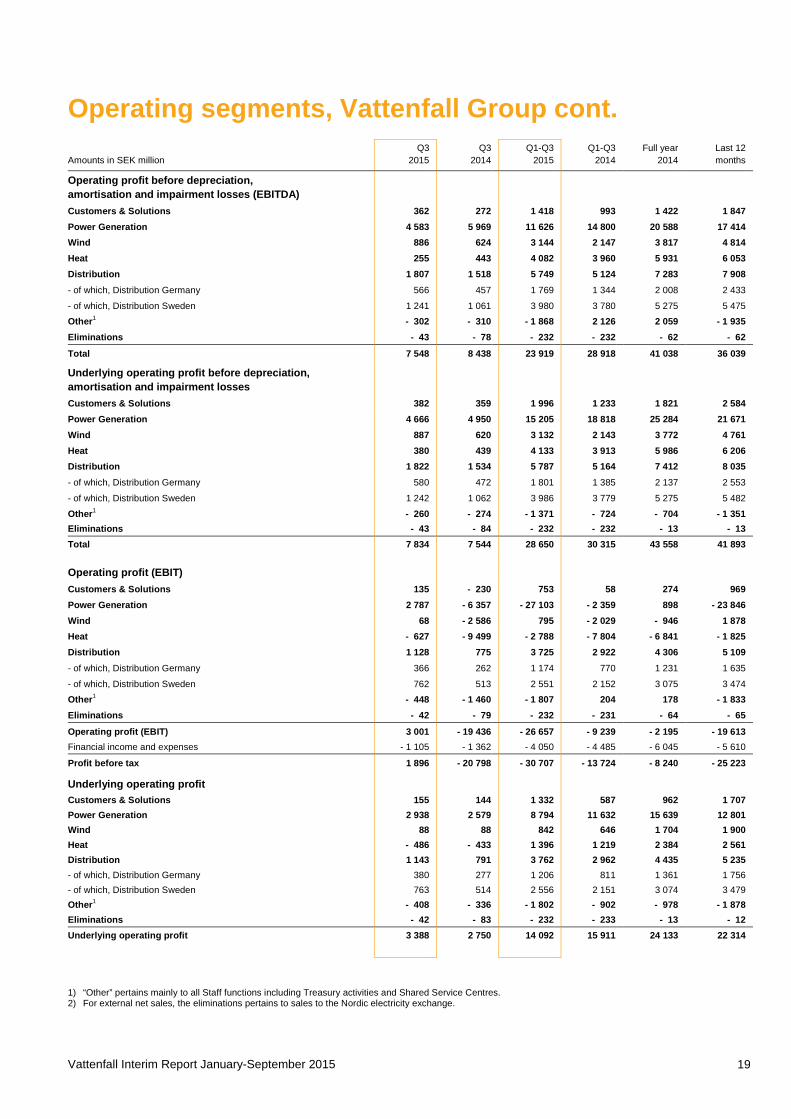
Operating segments, Vattenfall Group cont.
Q3 Q3
Q1-Q3 Q1-Q3
Full year
Last 12 Amounts in SEK million 2015 2014 2015 2014 2014 months
Operating profit before depreciation, amortisation and impairment losses (EBITDA)
Customers & Solutions 362 272 1 418
993 1 422 1 847
Power Generation 4 583 5 969 11 626
14 800 20 588 17 414
Wind 886 624 3 144
2 147 3 817 4 814
Heat 255 443 4 082
3 960 5 931 6 053
Distribution 1 807 1 518 5 749
5 124 7 283 7 908
- of which, Distribution Germany 566 457 1 769
1 344 2 008 2 433
- of which, Distribution Sweden 1 241 1 061 3 980
3 780 5 275 5 475
Other1 - 302 - 310 - 1 868
2 126 2 059 - 1 935
Eliminations - 43 - 78 - 232
- 232 - 62 - 62
Total 7 548 8 438
23 919 28 918
41 038 36 039
Underlying operating profit before depreciation, amortisation and impairment losses
Customers & Solutions 382 359 1 996
1 233 1 821 2 584
Power Generation 4 666 4 950 15 205
18 818 25 284 21 671
Wind 887 620 3 132
2 143 3 772 4 761
Heat 380 439 4 133
3 913 5 986 6 206
Distribution 1 822 1 534 5 787
5 164 7 412 8 035
- of which, Distribution Germany 580 472 1 801
1 385 2 137 2 553
- of which, Distribution Sweden 1 242 1 062 3 986
3 779 5 275 5 482
Other1 - 260 - 274 - 1 371
- 724 - 704 - 1 351
Eliminations - 43 - 84 - 232
- 232 - 13 - 13
Total 7 834 7 544
28 650 30 315
43 558 41 893
Operating profit (EBIT) Customers & Solutions 135
- 230 753 58 274 969
Power Generation 2 787 - 6 357 - 27 103
- 2 359 898 - 23 846
Wind 68 - 2 586 795
- 2 029 - 946 1 878
Heat - 627 - 9 499 - 2 788
- 7 804 - 6 841 - 1 825
Distribution 1 128 775 3 725
2 922 4 306 5 109
- of which, Distribution Germany 366 262 1 174
770 1 231 1 635
- of which, Distribution Sweden 762 513 2 551
2 152 3 075 3 474
Other1 - 448 - 1 460 - 1 807
204 178 - 1 833
Eliminations - 42 - 79 - 232
- 231 - 64 - 65
Operating profit (EBIT) 3 001 - 19 436
- 26 657 - 9 239
- 2 195 - 19 613
Financial income and expenses - 1 105 - 1 362 - 4 050
- 4 485 - 6 045 - 5 610
Profit before tax 1 896 - 20 798
- 30 707 - 13 724
- 8 240 - 25 223
Underlying operating profit Customers & Solutions 155
144 1 332 587 962 1 707
Power Generation 2 938 2 579 8 794
11 632 15 639 12 801
Wind 88 88 842
646 1 704 1 900
Heat - 486 - 433 1 396
1 219 2 384 2 561
Distribution 1 143 791 3 762
2 962 4 435 5 235
- of which, Distribution Germany 380 277 1 206
811 1 361 1 756
- of which, Distribution Sweden 763 514 2 556
2 151 3 074 3 479
Other1 - 408 - 336 - 1 802
- 902 - 978 - 1 878
Eliminations - 42 - 83 - 232
- 233 - 13 - 12
Underlying operating profit 3 388 2 750
14 092 15 911
24 133 22 314
1) “Other” pertains mainly to all Staff functions including Treasury activities and Shared Service Centres. 2) For external net sales, the eliminations pertains to sales to the Nordic electricity exchange.
Vattenfall Interim Report January-September 2015 20
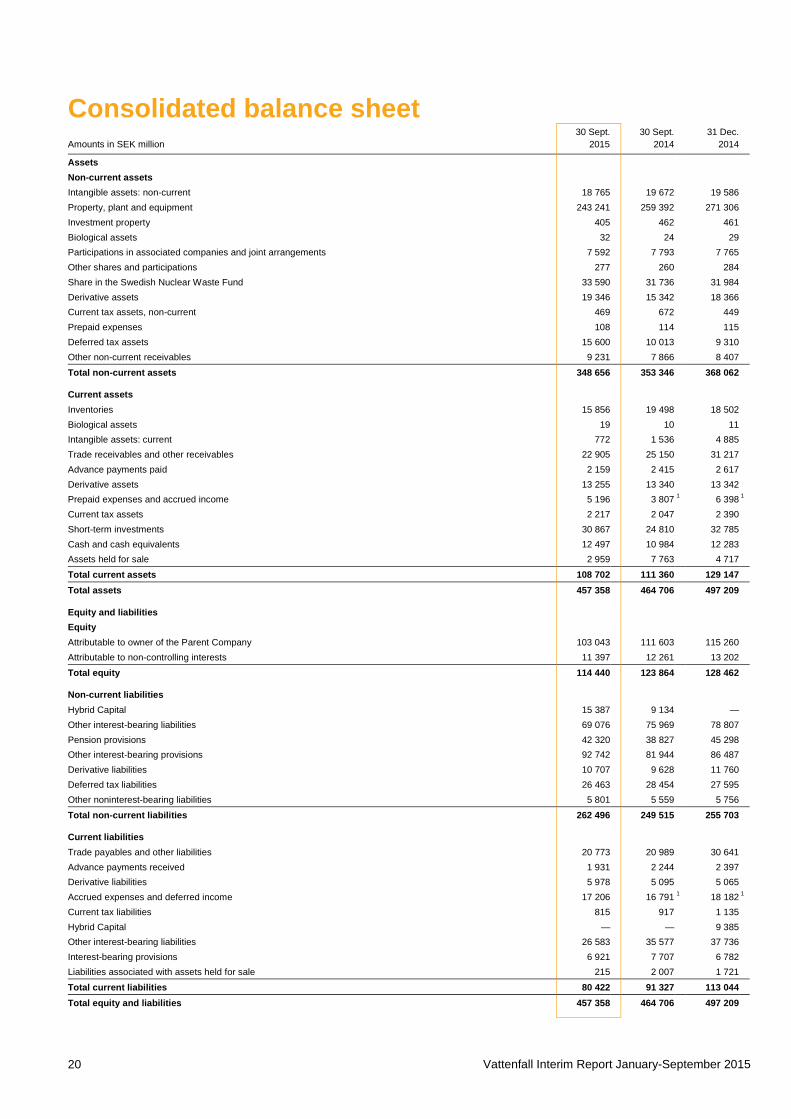
Consolidated balance sheet
30 Sept. 30 Sept.
31 Dec. Amounts in SEK million 2015 2014 2014
Assets Non-current assets Intangible assets: non-current 18 765 19 672
19 586
Property, plant and equipment 243 241 259 392
271 306 Investment property 405 462
461
Biological assets 32 24
29 Participations in associated companies and joint arrangements 7 592 7 793
7 765
Other shares and participations 277 260
284 Share in the Swedish Nuclear Waste Fund 33 590 31 736
31 984
Derivative assets 19 346 15 342
18 366 Current tax assets, non-current 469 672
449
Prepaid expenses 108 114
115 Deferred tax assets 15 600 10 013
9 310
Other non-current receivables 9 231 7 866 8 407
Total non-current assets 348 656 353 346
368 062
Current assets Inventories 15 856 19 498
18 502 Biological assets 19 10
11
Intangible assets: current 772 1 536
4 885 Trade receivables and other receivables 22 905 25 150
31 217
Advance payments paid 2 159 2 415
2 617 Derivative assets 13 255 13 340
13 342
Prepaid expenses and accrued income 5 196 3 807 1 6 398 1 Current tax assets 2 217 2 047
2 390
Short-term investments 30 867 24 810
32 785 Cash and cash equivalents 12 497 10 984
12 283
Assets held for sale 2 959 7 763 4 717
Total current assets 108 702 111 360 129 147 Total assets 457 358 464 706
497 209
Equity and liabilities Equity Attributable to owner of the Parent Company 103 043 111 603
115 260 Attributable to non-controlling interests 11 397 12 261 13 202
Total equity 114 440 123 864
128 462
Non-current liabilities Hybrid Capital 15 387 9 134
— Other interest-bearing liabilities 69 076 75 969
78 807
Pension provisions 42 320 38 827
45 298 Other interest-bearing provisions 92 742 81 944
86 487
Derivative liabilities 10 707 9 628
11 760 Deferred tax liabilities 26 463 28 454
27 595
Other noninterest-bearing liabilities 5 801 5 559 5 756
Total non-current liabilities 262 496 249 515
255 703
Current liabilities Trade payables and other liabilities 20 773 20 989
30 641 Advance payments received 1 931 2 244
2 397
Derivative liabilities 5 978 5 095
5 065 Accrued expenses and deferred income 17 206 16 791 1 18 182 1
Current tax liabilities 815 917
1 135 Hybrid Capital — —
9 385
Other interest-bearing liabilities 26 583 35 577
37 736 Interest-bearing provisions 6 921 7 707
6 782
Liabilities associated with assets held for sale 215 2 007 1 721
Total current liabilities 80 422 91 327 113 044 Total equity and liabilities 457 358 464 706
497 209
Vattenfall Interim Report January-September 2015 21
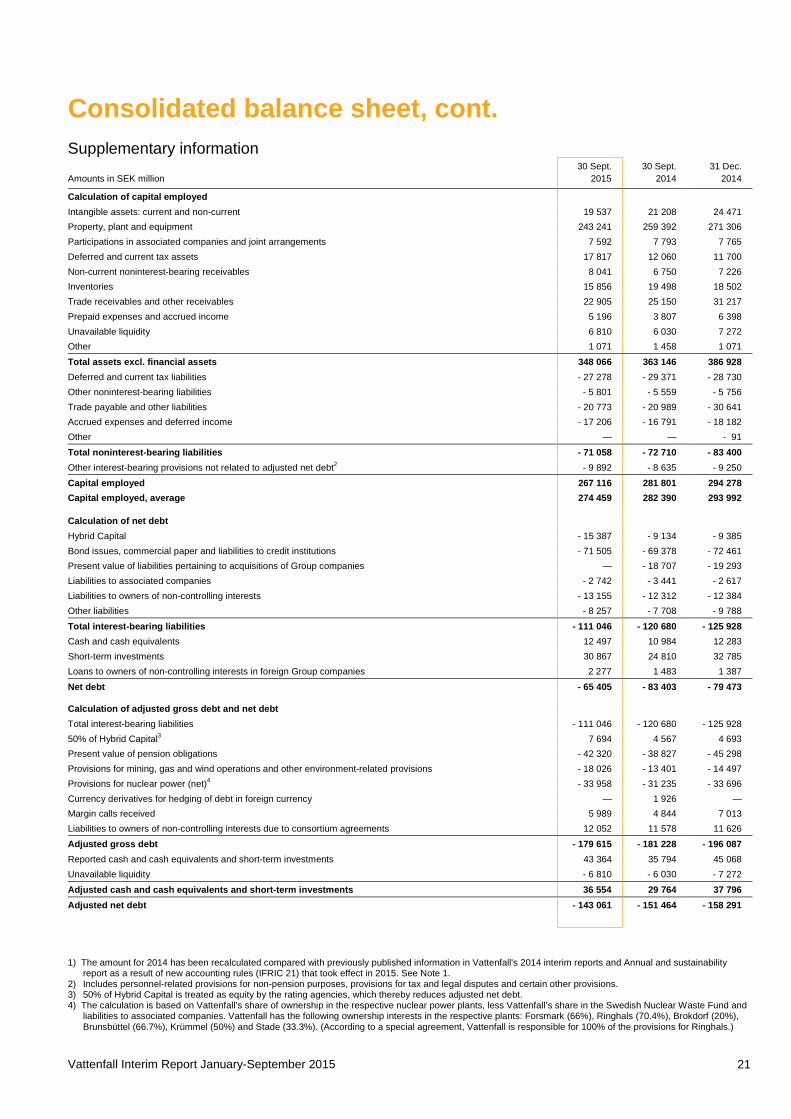
Consolidated balance sheet, cont. Supplementary information
30 Sept. 30 Sept.
31 Dec.
Amounts in SEK million 2015 2014 2014
Calculation of capital employed Intangible assets: current and non-current 19 537 21 208
24 471
Property, plant and equipment 243 241 259 392
271 306 Participations in associated companies and joint arrangements 7 592 7 793
7 765
Deferred and current tax assets 17 817 12 060
11 700 Non-current noninterest-bearing receivables 8 041 6 750
7 226
Inventories 15 856 19 498
18 502 Trade receivables and other receivables 22 905 25 150
31 217
Prepaid expenses and accrued income 5 196 3 807
6 398 Unavailable liquidity 6 810 6 030
7 272
Other 1 071 1 458 1 071
Total assets excl. financial assets 348 066 363 146
386 928 Deferred and current tax liabilities - 27 278 - 29 371
- 28 730
Other noninterest-bearing liabilities - 5 801 - 5 559
- 5 756 Trade payable and other liabilities - 20 773 - 20 989
- 30 641
Accrued expenses and deferred income - 17 206 - 16 791
- 18 182 Other — — - 91
Total noninterest-bearing liabilities - 71 058 - 72 710
- 83 400 Other interest-bearing provisions not related to adjusted net debt2 - 9 892 - 8 635 - 9 250
Capital employed 267 116 281 801
294 278 Capital employed, average 274 459 282 390
293 992
Calculation of net debt Hybrid Capital - 15 387 - 9 134
- 9 385
Bond issues, commercial paper and liabilities to credit institutions - 71 505 - 69 378
- 72 461 Present value of liabilities pertaining to acquisitions of Group companies — - 18 707
- 19 293
Liabilities to associated companies - 2 742 - 3 441
- 2 617 Liabilities to owners of non-controlling interests - 13 155 - 12 312
- 12 384
Other liabilities - 8 257 - 7 708 - 9 788
Total interest-bearing liabilities - 111 046 - 120 680
- 125 928 Cash and cash equivalents 12 497 10 984
12 283
Short-term investments 30 867 24 810
32 785 Loans to owners of non-controlling interests in foreign Group companies 2 277 1 483 1 387
Net debt - 65 405 - 83 403
- 79 473
Calculation of adjusted gross debt and net debt Total interest-bearing liabilities - 111 046 - 120 680
- 125 928
50% of Hybrid Capital3 7 694 4 567
4 693 Present value of pension obligations - 42 320 - 38 827
- 45 298
Provisions for mining, gas and wind operations and other environment-related provisions - 18 026 - 13 401
- 14 497 Provisions for nuclear power (net)4 - 33 958 - 31 235
- 33 696
Currency derivatives for hedging of debt in foreign currency — 1 926
— Margin calls received 5 989 4 844
7 013
Liabilities to owners of non-controlling interests due to consortium agreements 12 052 11 578 11 626
Adjusted gross debt - 179 615 - 181 228
- 196 087 Reported cash and cash equivalents and short-term investments 43 364 35 794
45 068
Unavailable liquidity - 6 810 - 6 030 - 7 272
Adjusted cash and cash equivalents and short-term investments 36 554 29 764 37 796 Adjusted net debt - 143 061 - 151 464
- 158 291
1) The amount for 2014 has been recalculated compared with previously published information in Vattenfall's 2014 interim reports and Annual and sustainability report as a result of new accounting rules (IFRIC 21) that took effect in 2015. See Note 1.
2) Includes personnel-related provisions for non-pension purposes, provisions for tax and legal disputes and certain other provisions. 3) 50% of Hybrid Capital is treated as equity by the rating agencies, which thereby reduces adjusted net debt. 4) The calculation is based on Vattenfall’s share of ownership in the respective nuclear power plants, less Vattenfall’s share in the Swedish Nuclear Waste Fund and
liabilities to associated companies. Vattenfall has the following ownership interests in the respective plants: Forsmark (66%), Ringhals (70.4%), Brokdorf (20%), Brunsbüttel (66.7%), Krümmel (50%) and Stade (33.3%). (According to a special agreement, Vattenfall is responsible for 100% of the provisions for Ringhals.)
Vattenfall Interim Report January-September 2015 22
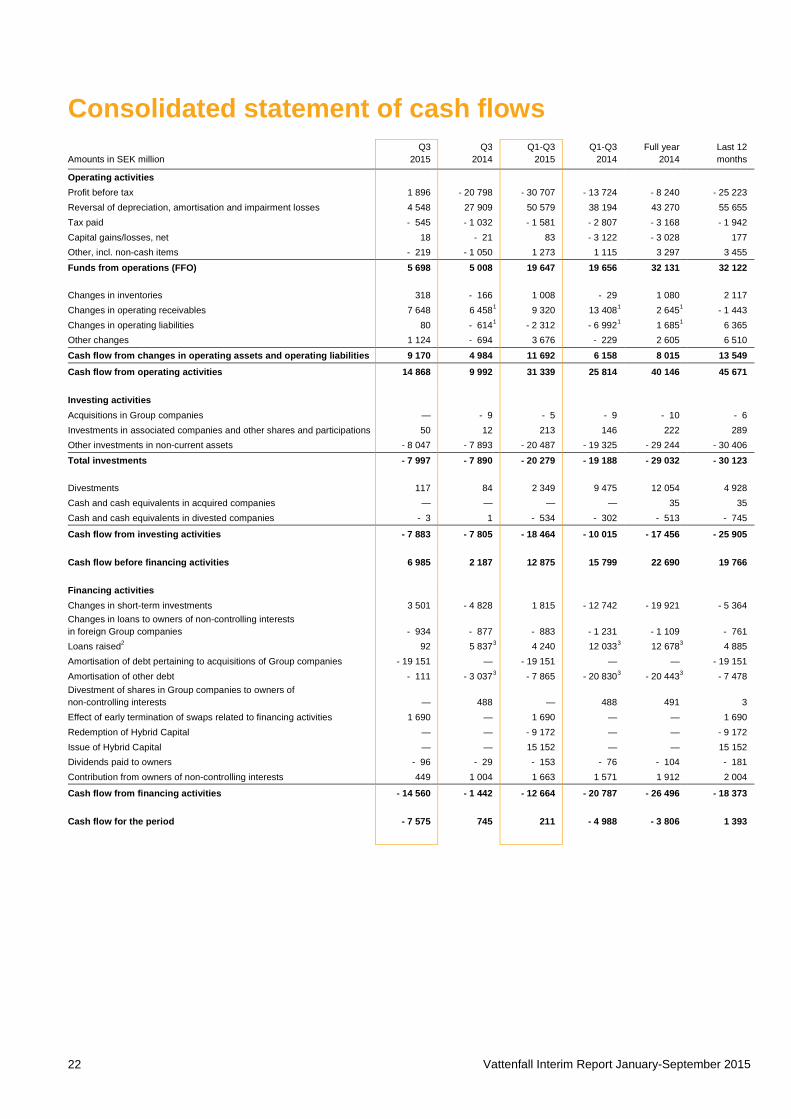
Consolidated statement of cash flows
Q3 Q3
Q1-Q3 Q1-Q3
Full year
Last 12 Amounts in SEK million 2015 2014 2015 2014 2014 months
Operating activities
Profit before tax 1 896 - 20 798
- 30 707 - 13 724
- 8 240
- 25 223
Reversal of depreciation, amortisation and impairment losses 4 548 27 909
50 579 38 194
43 270
55 655 Tax paid - 545 - 1 032
- 1 581 - 2 807
- 3 168
- 1 942
Capital gains/losses, net 18 - 21
83 - 3 122
- 3 028
177 Other, incl. non-cash items - 219 - 1 050 1 273 1 115 3 297 3 455
Funds from operations (FFO) 5 698 5 008
19 647 19 656
32 131
32 122
Changes in inventories 318 - 166
1 008 - 29
1 080
2 117 Changes in operating receivables 7 648 6 458 1 9 320 13 408 1 2 645 1 - 1 443 Changes in operating liabilities 80 - 614 1 - 2 312 - 6 992 1 1 685 1 6 365 Other changes 1 124 - 694 3 676 - 229 2 605 6 510
Cash flow from changes in operating assets and operating liabilities 9 170 4 984 11 692 6 158 8 015 13 549
Cash flow from operating activities 14 868 9 992
31 339 25 814
40 146
45 671
Investing activities
Acquisitions in Group companies — - 9
- 5 - 9
- 10
- 6
Investments in associated companies and other shares and participations 50 12
213 146
222
289 Other investments in non-current assets - 8 047 - 7 893 - 20 487 - 19 325 - 29 244 - 30 406
Total investments - 7 997 - 7 890
- 20 279 - 19 188
- 29 032
- 30 123
Divestments 117 84
2 349 9 475
12 054
4 928 Cash and cash equivalents in acquired companies — —
— —
35
35
Cash and cash equivalents in divested companies - 3 1
- 534 - 302
- 513
- 745
Cash flow from investing activities - 7 883 - 7 805 - 18 464 - 10 015 - 17 456 - 25 905
Cash flow before financing activities 6 985 2 187
12 875 15 799
22 690
19 766
Financing activities
Changes in short-term investments 3 501 - 4 828
1 815 - 12 742
- 19 921
- 5 364
Changes in loans to owners of non-controlling interests in foreign Group companies - 934 - 877
- 883 - 1 231
- 1 109
- 761
Loans raised2 92 5 837 3 4 240 12 033 3 12 678 3 4 885 Amortisation of debt pertaining to acquisitions of Group companies - 19 151 —
- 19 151 —
—
- 19 151
Amortisation of other debt - 111 - 3 037 3 - 7 865 - 20 830 3 - 20 443 3 - 7 478 Divestment of shares in Group companies to owners of
non-controlling interests — 488
— 488
491
3 Effect of early termination of swaps related to financing activities 1 690 —
1 690 —
—
1 690
Redemption of Hybrid Capital — —
- 9 172 —
—
- 9 172 Issue of Hybrid Capital — —
15 152 —
—
15 152
Dividends paid to owners - 96 - 29
- 153 - 76
- 104
- 181 Contribution from owners of non-controlling interests 449 1 004 1 663 1 571 1 912 2 004
Cash flow from financing activities - 14 560 - 1 442 - 12 664 - 20 787 - 26 496 - 18 373
Cash flow for the period - 7 575 745
211 - 4 988
- 3 806
1 393
Vattenfall Interim Report January-September 2015 23
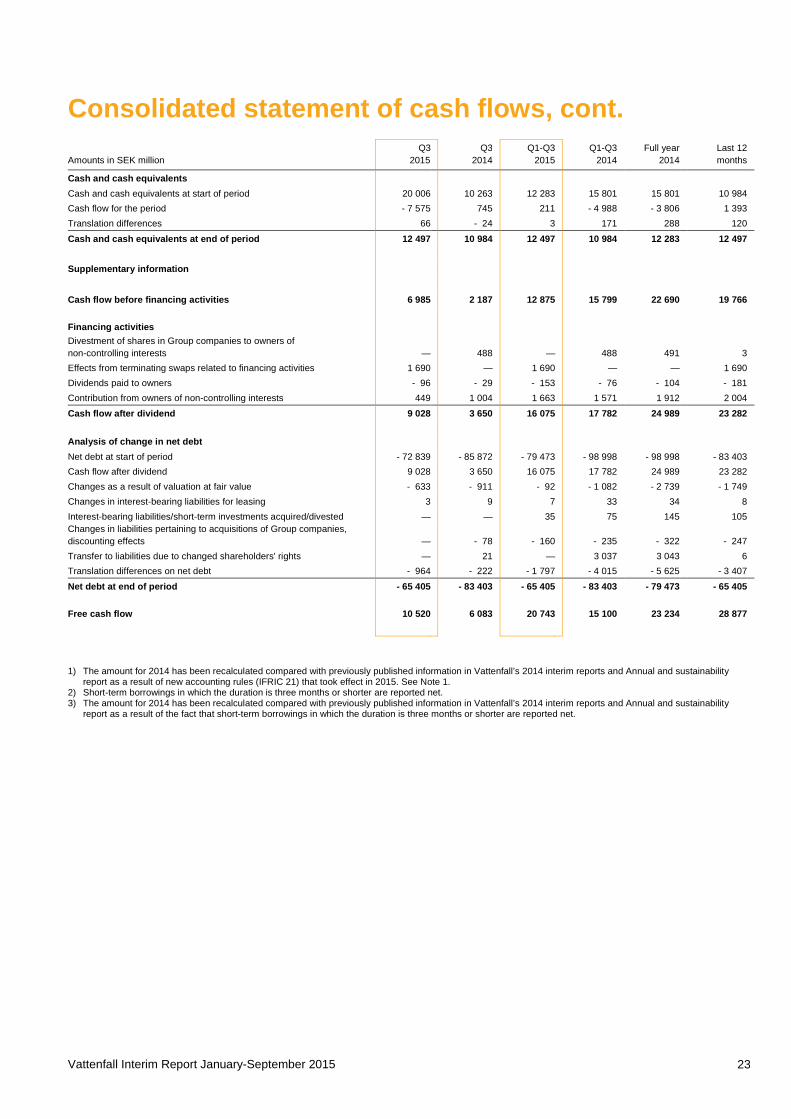
Consolidated statement of cash flows, cont.
Q3 Q3
Q1-Q3 Q1-Q3
Full year
Last 12 Amounts in SEK million 2015 2014 2015 2014 2014 months
Cash and cash equivalents Cash and cash equivalents at start of period 20 006 10 263
12 283 15 801
15 801
10 984
Cash flow for the period - 7 575 745
211 - 4 988
- 3 806
1 393 Translation differences 66 - 24 3 171 288 120
Cash and cash equivalents at end of period 12 497 10 984
12 497 10 984
12 283
12 497
Supplementary information
Cash flow before financing activities 6 985 2 187
12 875 15 799
22 690
19 766
Financing activities
Divestment of shares in Group companies to owners of
non-controlling interests — 488
— 488
491
3 Effects from terminating swaps related to financing activities 1 690 —
1 690 —
—
1 690
Dividends paid to owners - 96 - 29
- 153 - 76
- 104
- 181 Contribution from owners of non-controlling interests 449 1 004 1 663 1 571 1 912 2 004
Cash flow after dividend 9 028 3 650
16 075 17 782
24 989
23 282
Analysis of change in net debt
Net debt at start of period - 72 839 - 85 872
- 79 473 - 98 998
- 98 998
- 83 403
Cash flow after dividend 9 028 3 650
16 075 17 782
24 989
23 282 Changes as a result of valuation at fair value - 633 - 911
- 92 - 1 082
- 2 739
- 1 749
Changes in interest-bearing liabilities for leasing 3 9
7 33
34
8 Interest-bearing liabilities/short-term investments acquired/divested — —
35 75
145
105
Changes in liabilities pertaining to acquisitions of Group companies, discounting effects — - 78
- 160 - 235
- 322
- 247
Transfer to liabilities due to changed shareholders' rights — 21
— 3 037
3 043
6 Translation differences on net debt - 964 - 222 - 1 797 - 4 015 - 5 625 - 3 407
Net debt at end of period - 65 405 - 83 403 - 65 405 - 83 403 - 79 473 - 65 405
Free cash flow 10 520 6 083
20 743 15 100
23 234
28 877
1) The amount for 2014 has been recalculated compared with previously published information in Vattenfall’s 2014 interim reports and Annual and sustainability report as a result of new accounting rules (IFRIC 21) that took effect in 2015. See Note 1.
2) Short-term borrowings in which the duration is three months or shorter are reported net. 3) The amount for 2014 has been recalculated compared with previously published information in Vattenfall’s 2014 interim reports and Annual and sustainability
report as a result of the fact that short-term borrowings in which the duration is three months or shorter are reported net.
Vattenfall Interim Report January-September 2015 24
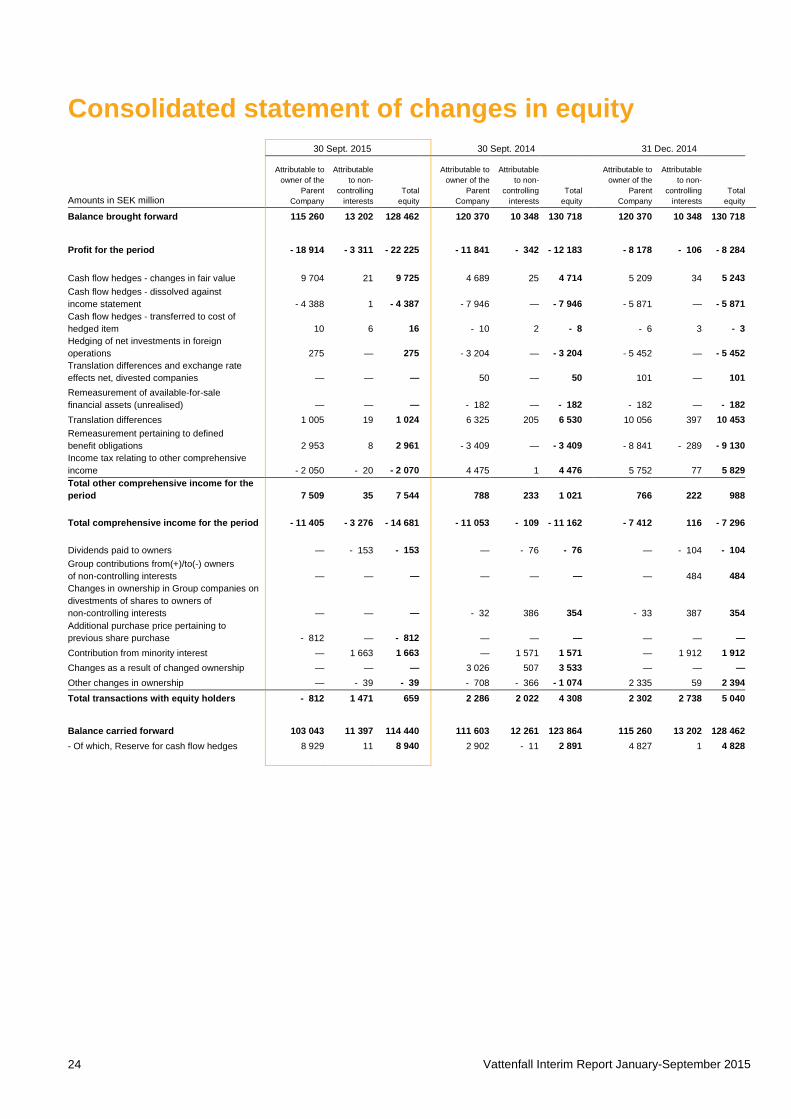
Consolidated statement of changes in equity 30 Sept. 2015 30 Sept. 2014 31 Dec. 2014
Amounts in SEK million
Attributable to owner of the
Parent Company
Attributable to non-
controlling interests
Total equity
Attributable to owner of the
Parent Company
Attributable to non-
controlling interests
Total equity
Attributable to owner of the
Parent Company
Attributable to non-
controlling interests
Total equity
Balance brought forward 115 260 13 202 128 462 120 370 10 348 130 718 120 370 10 348 130 718
Profit for the period - 18 914 - 3 311 - 22 225 - 11 841 - 342 - 12 183 - 8 178 - 106 - 8 284
Cash flow hedges - changes in fair value 9 704 21 9 725 4 689 25 4 714 5 209 34 5 243 Cash flow hedges - dissolved against income statement - 4 388 1 - 4 387 - 7 946 — - 7 946 - 5 871 — - 5 871 Cash flow hedges - transferred to cost of hedged item 10 6 16 - 10 2 - 8 - 6 3 - 3 Hedging of net investments in foreign operations 275 — 275 - 3 204 — - 3 204 - 5 452 — - 5 452 Translation differences and exchange rate effects net, divested companies — — — 50 — 50 101 — 101 Remeasurement of available-for-sale financial assets (unrealised) — — — - 182 — - 182 - 182 — - 182 Translation differences 1 005 19 1 024 6 325 205 6 530 10 056 397 10 453 Remeasurement pertaining to defined benefit obligations 2 953 8 2 961 - 3 409 — - 3 409 - 8 841 - 289 - 9 130 Income tax relating to other comprehensive income - 2 050 - 20 - 2 070 4 475 1 4 476 5 752 77 5 829 Total other comprehensive income for the period 7 509 35 7 544 788 233 1 021 766 222 988 Total comprehensive income for the period - 11 405 - 3 276 - 14 681 - 11 053 - 109 - 11 162 - 7 412 116 - 7 296 Dividends paid to owners — - 153 - 153 — - 76 - 76 — - 104 - 104 Group contributions from(+)/to(-) owners of non-controlling interests — — — — — — — 484 484 Changes in ownership in Group companies on divestments of shares to owners of non-controlling interests — — — - 32 386 354 - 33 387 354 Additional purchase price pertaining to previous share purchase - 812 — - 812 — — — — — — Contribution from minority interest — 1 663 1 663 — 1 571 1 571 — 1 912 1 912 Changes as a result of changed ownership — — — 3 026 507 3 533 — — — Other changes in ownership — - 39 - 39 - 708 - 366 - 1 074 2 335 59 2 394 Total transactions with equity holders - 812 1 471 659 2 286 2 022 4 308 2 302 2 738 5 040
Balance carried forward 103 043 11 397 114 440 111 603 12 261 123 864 115 260 13 202 128 462 - Of which, Reserve for cash flow hedges 8 929 11 8 940 2 902 - 11 2 891 4 827 1 4 828
Vattenfall Interim Report January-September 2015 25
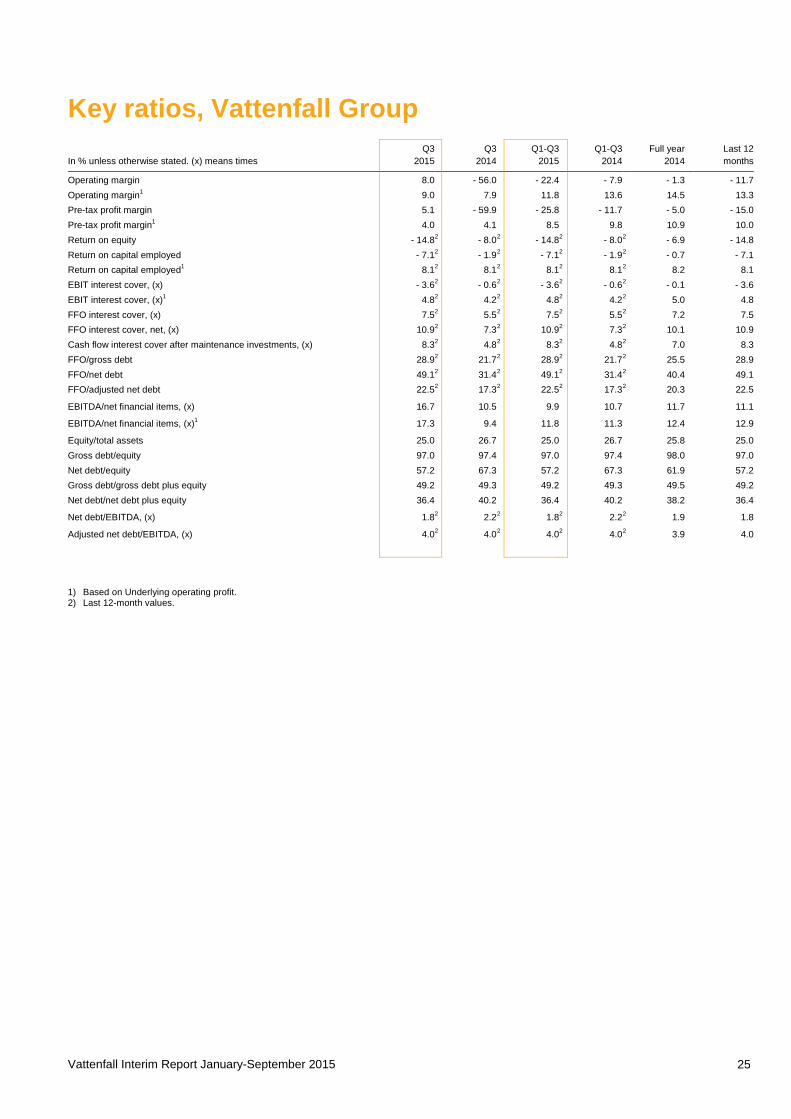
Key ratios, Vattenfall Group
Q3 Q3
Q1-Q3 Q1-Q3
Full year
Last 12
In % unless otherwise stated. (x) means times 2015 2014 2015 2014 2014 months
Operating margin 8.0 - 56.0
- 22.4 - 7.9
- 1.3
- 11.7 Operating margin1 9.0 7.9
11.8 13.6
14.5
13.3
Pre-tax profit margin 5.1 - 59.9
- 25.8 - 11.7
- 5.0
- 15.0 Pre-tax profit margin1 4.0 4.1
8.5 9.8
10.9
10.0
Return on equity - 14.8 2 - 8.0 2 - 14.8 2 - 8.0 2 - 6.9
- 14.8 Return on capital employed - 7.1 2 - 1.9 2 - 7.1 2 - 1.9 2 - 0.7
- 7.1
Return on capital employed1 8.1 2 8.1 2 8.1 2 8.1 2 8.2
8.1 EBIT interest cover, (x) - 3.6 2 - 0.6 2 - 3.6 2 - 0.6 2 - 0.1
- 3.6
EBIT interest cover, (x)1 4.8 2 4.2 2 4.8 2 4.2 2 5.0
4.8 FFO interest cover, (x) 7.5 2 5.5 2 7.5 2 5.5 2 7.2
7.5
FFO interest cover, net, (x) 10.9 2 7.3 2 10.9 2 7.3 2 10.1
10.9 Cash flow interest cover after maintenance investments, (x) 8.3 2 4.8 2 8.3 2 4.8 2 7.0
8.3
FFO/gross debt 28.9 2 21.7 2 28.9 2 21.7 2 25.5
28.9 FFO/net debt 49.1 2 31.4 2 49.1 2 31.4 2 40.4
49.1
FFO/adjusted net debt 22.5 2 17.3 2 22.5 2 17.3 2 20.3
22.5
EBITDA/net financial items, (x) 16.7 10.5
9.9 10.7
11.7
11.1
EBITDA/net financial items, (x)1 17.3 9.4
11.8 11.3
12.4
12.9
Equity/total assets 25.0 26.7
25.0 26.7
25.8
25.0 Gross debt/equity 97.0 97.4
97.0 97.4
98.0
97.0
Net debt/equity 57.2 67.3
57.2 67.3
61.9
57.2 Gross debt/gross debt plus equity 49.2 49.3
49.2 49.3
49.5
49.2
Net debt/net debt plus equity 36.4 40.2
36.4 40.2
38.2
36.4
Net debt/EBITDA, (x) 1.8 2 2.2 2 1.8 2 2.2 2 1.9
1.8
Adjusted net debt/EBITDA, (x) 4.0 2 4.0 2 4.0 2 4.0 2 3.9
4.0
1) Based on Underlying operating profit. 2) Last 12-month values.
Vattenfall Interim Report January-September 2015 26
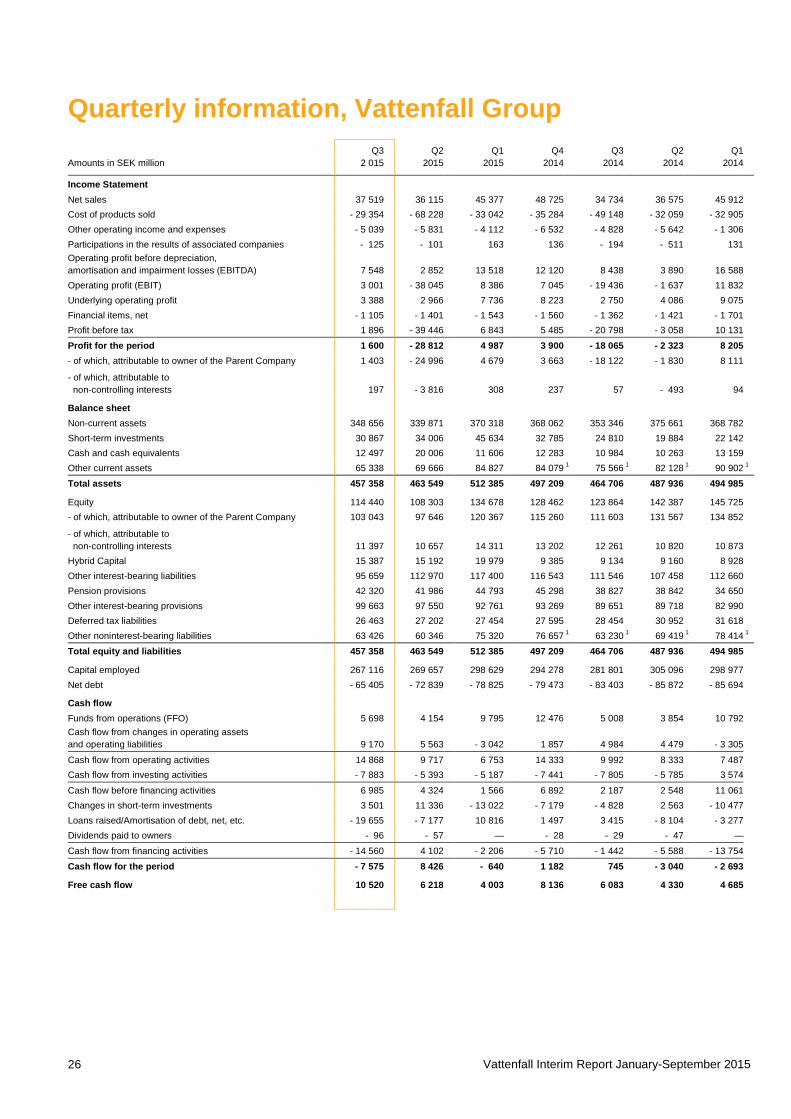
Quarterly information, Vattenfall Group
Q3
Q2
Q1
Q4
Q3
Q2
Q1
Amounts in SEK million 2 015 2015 2015 2014 2014 2014 2014
Income Statement Net sales 37 519 36 115
45 377
48 725
34 734
36 575
45 912
Cost of products sold - 29 354 - 68 228
- 33 042
- 35 284
- 49 148
- 32 059
- 32 905 Other operating income and expenses - 5 039 - 5 831
- 4 112
- 6 532
- 4 828
- 5 642
- 1 306
Participations in the results of associated companies - 125 - 101
163
136
- 194
- 511
131 Operating profit before depreciation,
amortisation and impairment losses (EBITDA) 7 548 2 852
13 518
12 120
8 438
3 890
16 588 Operating profit (EBIT) 3 001 - 38 045
8 386
7 045
- 19 436
- 1 637
11 832
Underlying operating profit 3 388 2 966
7 736
8 223
2 750
4 086
9 075 Financial items, net - 1 105 - 1 401
- 1 543
- 1 560
- 1 362
- 1 421
- 1 701
Profit before tax 1 896 - 39 446 6 843 5 485 - 20 798 - 3 058 10 131 Profit for the period 1 600 - 28 812
4 987
3 900
- 18 065
- 2 323
8 205
- of which, attributable to owner of the Parent Company 1 403 - 24 996
4 679
3 663
- 18 122
- 1 830
8 111 - of which, attributable to
non-controlling interests 197 - 3 816
308
237
57
- 493
94
Balance sheet Non-current assets 348 656 339 871
370 318
368 062
353 346
375 661
368 782
Short-term investments 30 867 34 006
45 634
32 785
24 810
19 884
22 142 Cash and cash equivalents 12 497 20 006
11 606
12 283
10 984
10 263
13 159
Other current assets 65 338 69 666 84 827 84 079 1 75 566 1 82 128 1 90 902 1
Total assets 457 358 463 549
512 385
497 209
464 706
487 936
494 985
Equity 114 440 108 303
134 678
128 462
123 864
142 387
145 725 - of which, attributable to owner of the Parent Company 103 043 97 646
120 367
115 260
111 603
131 567
134 852
- of which, attributable to non-controlling interests 11 397 10 657
14 311
13 202
12 261
10 820
10 873
Hybrid Capital 15 387 15 192
19 979
9 385
9 134
9 160
8 928 Other interest-bearing liabilities 95 659 112 970
117 400
116 543
111 546
107 458
112 660
Pension provisions 42 320 41 986
44 793
45 298
38 827
38 842
34 650 Other interest-bearing provisions 99 663 97 550
92 761
93 269
89 651
89 718
82 990
Deferred tax liabilities 26 463 27 202
27 454
27 595
28 454
30 952
31 618 Other noninterest-bearing liabilities 63 426 60 346 75 320 76 657 1 63 230 1 69 419 1 78 414 1
Total equity and liabilities 457 358 463 549
512 385
497 209
464 706
487 936
494 985
Capital employed 267 116 269 657
298 629
294 278
281 801
305 096
298 977 Net debt - 65 405 - 72 839
- 78 825
- 79 473
- 83 403
- 85 872
- 85 694
Cash flow Funds from operations (FFO) 5 698 4 154
9 795
12 476
5 008
3 854
10 792
Cash flow from changes in operating assets and operating liabilities 9 170 5 563
- 3 042
1 857
4 984
4 479
- 3 305
Cash flow from operating activities 14 868 9 717 6 753 14 333 9 992 8 333 7 487 Cash flow from investing activities - 7 883 - 5 393
- 5 187
- 7 441
- 7 805
- 5 785
3 574
Cash flow before financing activities 6 985 4 324 1 566 6 892 2 187 2 548 11 061 Changes in short-term investments 3 501 11 336
- 13 022
- 7 179
- 4 828
2 563
- 10 477
Loans raised/Amortisation of debt, net, etc. - 19 655 - 7 177
10 816
1 497
3 415
- 8 104
- 3 277 Dividends paid to owners - 96 - 57 — - 28 - 29 - 47 — Cash flow from financing activities - 14 560 4 102 - 2 206 - 5 710 - 1 442 - 5 588 - 13 754 Cash flow for the period - 7 575 8 426
- 640
1 182
745
- 3 040
- 2 693
Free cash flow 10 520 6 218
4 003
8 136
6 083
4 330
4 685

Vattenfall Interim Report January-September 2015 27
Quarterly information, Vattenfall Group, cont.
Q3 Q2
Q1
Q4
Q3
Q2
Q1
In % unless otherwise stated. (x) means times 2015 2015 2015 2014 2014 2014 2014
Key ratios
Return on equity3 - 14.8 - 32.6
- 10.1
- 6.9
- 8.0
8.4
- 10.1 Return on capital employed3 - 7.1 - 14.6
- 1.9
- 0.7
- 1.9
6.4
- 1.7
Return on capital employed2,3 8.1 7.5
7.6
8.2
8.1
8.2
8.4 EBIT interest cover, (x)3 - 3.6 - 8.0
- 0.9
- 0.1
- 0.6
3.3
- 0.6
EBIT interest cover, (x)2,3 4.8 4.6
5.1
5.0
4.2
4.2
3.9 FFO/gross debt3 28.9 24.5
22.7
25.5
21.7
24.0
24.7
FFO/net debt3 49.1 43.2
39.5
40.4
31.4
32.5
35.1 FFO/adjusted net debt3 22.5 21.1
20.7
20.3
17.3
17.9
20.4
Equity/assets ratio 25.0 23.4
26.3
25.8
26.7
29.2
29.4 Gross debt/equity 97.0 118.3
102.0
98.0
97.4
81.9
83.4
Net debt/equity 57.2 67.3
58.5
61.9
67.3
60.3
58.8 Net debt/net debt plus equity 36.4 40.2
36.9
38.2
40.2
37.6
37.0
Net debt/EBITDA, (x)3 1.8 2.0
2.1
1.9
2.2
2.2
1.9 Adjusted net debt/EBITDA, (x)3 4.0 4.0
4.0
3.9
4.0
4.0
3.3
1) The amount for 2014 has been recalculated compared with previously published information in Vattenfall's 2014 interim reports and Annual and sustainability report as a result of new accounting rules (IFRIC 21) that took effect in 2015. See Note 1.
2) Based on Underlying operating profit. 3) Last 12-month values.
Vattenfall Interim Report January-September 2015 28
Note 1 Accounting policies, risks and uncertainties
Accounting policies The consolidated accounts for 2015 have been prepared, as for the 2014 year-end accounts, in accordance with International Financial Reporting Standards (IFRS) as endorsed by the European Commission for application within the EU, and the Swedish Annual Accounts Act. This interim report for the Group has been prepared in accordance with IAS 34 – Interim Financial Reporting, and the Swedish Annual Accounts Act. The accounting policies and calculation methods applied in this interim report are the same as those described in Vattenfall’s 2014 Annual and sustainability report (Note 3 to the consolidated accounts), except for the amended IFRSs endorsed by the EU and described below, which are effective as of the 2015 financial year.
IFRIC 21 – Levies. The interpretation clarifies when a liability for levies should be recognised. Levies are fees and taxes charged to companies by government authorities in accordance with laws and regulations, except income taxes, penalties and fines. The interpretation clarifies that a liability should be recognised when a company has an obligation to pay due to a past event. A liability is recognised progressively if the obligating event occurs over a period of time. If an obligation to pay a levy is triggered when a minimum threshold is reached, the liability is not recognised until the minimum threshold is reached. The interpretation has had only a marginal effect on Vattenfall’s financial statements. For Vattenfall, application of IFRIC 21 has entailed that property tax in Sweden is entered as a liability in its entirety as per 1 January 2015 by just under SEK 3 billion, and that tax on the thermal effect in Sweden has been entered as a liability in an amount just under SEK 0.8 billion, resulting in an increase in the balance sheet total as per this date by SEK 3.7 billion. Previously, the liability for Swedish property tax was recognised gradually during the year. The balance sheets for 2014 have been recalculated as a result of application of IFRIC 21. The balance sheet has been adjusted by SEK 1.5 billion as per 30 September 2014 and by SEK 0.8 billion as per 31 December 2014.
Amendments to IAS 19 – Defined Benefit Plans: Employee Contributions, include clarifications on how contributions to a pension plan from employees or third parties should be recognised. The clarifications have not changed the way Vattenfall recognises these fees.
Annual improvements to IFRSs 2010–2012 Cycle and Annual improvements to IFRSs 2011–2013 Cycle aim to streamline and clarify the accounting standards concerning presentation, recognition and measurement, including changes in terminology and amendments of an editorial nature. The amendments have not had any significant effect on Vattenfall’s financial statements.
Risks and uncertainties For a description of risks, uncertainties and risk management, please refer to Vattenfall’s 2014 Annual and sustainability report, pages 66-72. Apart from the information provided under Important events in this report and under Important events in the half-year 2015 report, no other material changes have taken place since publication of the 2014 Annual and sustainability report.
Other Significant related-party transactions are described in Note 55 to the consolidated accounts in Vattenfall’s 2014 Annual and sustainability report. No material changes have taken place in relations or transactions with related parties compared with the description in the 2014 Annual and sustainability report.
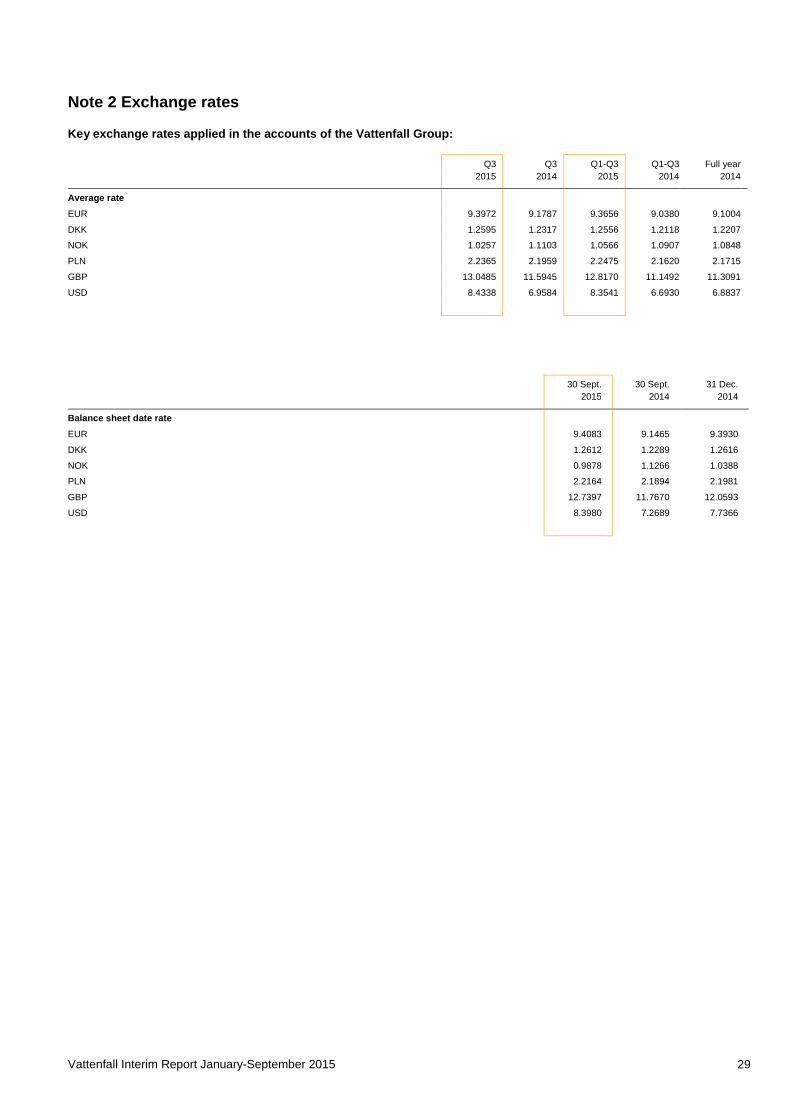
Vattenfall Interim Report January-September 2015 29
Note 2 Exchange rates
Key exchange rates applied in the accounts of the Vattenfall Group:
Q3 Q3
Q1-Q3 Q1-Q3
Full year
2015 2014 2015 2014 2014 Average rate
EUR 9.3972 9.1787
9.3656 9.0380
9.1004
DKK 1.2595 1.2317
1.2556 1.2118
1.2207
NOK 1.0257 1.1103
1.0566 1.0907
1.0848
PLN 2.2365 2.1959
2.2475 2.1620
2.1715
GBP 13.0485 11.5945
12.8170 11.1492
11.3091
USD 8.4338 6.9584
8.3541 6.6930
6.8837
30 Sept. 30 Sept.
31 Dec.
2015 2014 2014 Balance sheet date rate
EUR 9.4083 9.1465
9.3930
DKK 1.2612 1.2289
1.2616
NOK 0.9878 1.1266
1.0388
PLN 2.2164 2.1894
2.1981
GBP 12.7397 11.7670
12.0593
USD 8.3980 7.2689
7.7366
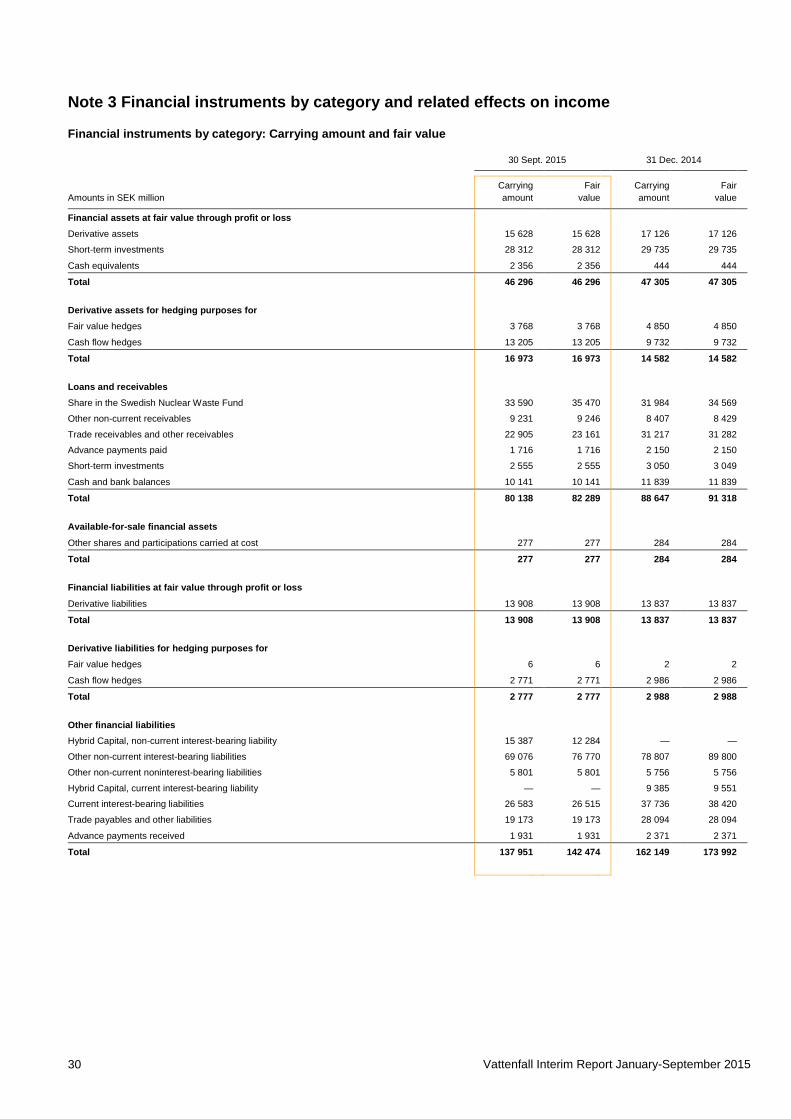
Vattenfall Interim Report January-September 2015 30
Note 3 Financial instruments by category and related effects on income
Financial instruments by category: Carrying amount and fair value 30 Sept. 2015 31 Dec. 2014
Carrying Fair Carrying
Fair Amounts in SEK million amount value amount value
Financial assets at fair value through profit or loss
Derivative assets 15 628
15 628 17 126
17 126
Short-term investments 28 312
28 312 29 735
29 735 Cash equivalents 2 356 2 356 444 444 Total 46 296 46 296 47 305 47 305
Derivative assets for hedging purposes for
Fair value hedges 3 768
3 768 4 850
4 850
Cash flow hedges 13 205 13 205 9 732 9 732 Total 16 973
16 973 14 582
14 582
Loans and receivables
Share in the Swedish Nuclear Waste Fund 33 590
35 470 31 984
34 569
Other non-current receivables 9 231
9 246 8 407
8 429 Trade receivables and other receivables 22 905
23 161 31 217
31 282
Advance payments paid 1 716
1 716 2 150
2 150 Short-term investments 2 555
2 555 3 050
3 049
Cash and bank balances 10 141 10 141 11 839 11 839 Total 80 138
82 289 88 647
91 318
Available-for-sale financial assets
Other shares and participations carried at cost 277 277 284 284 Total 277
277 284
284
Financial liabilities at fair value through profit or loss
Derivative liabilities 13 908 13 908 13 837 13 837 Total 13 908
13 908 13 837
13 837
Derivative liabilities for hedging purposes for
Fair value hedges 6
6 2
2
Cash flow hedges 2 771 2 771 2 986 2 986 Total 2 777
2 777 2 988
2 988
Other financial liabilities
Hybrid Capital, non-current interest-bearing liability 15 387
12 284 —
—
Other non-current interest-bearing liabilities 69 076
76 770 78 807
89 800 Other non-current noninterest-bearing liabilities 5 801
5 801 5 756
5 756
Hybrid Capital, current interest-bearing liability —
— 9 385
9 551 Current interest-bearing liabilities 26 583
26 515 37 736
38 420
Trade payables and other liabilities 19 173
19 173 28 094
28 094 Advance payments received 1 931 1 931 2 371 2 371 Total 137 951 142 474 162 149 173 992
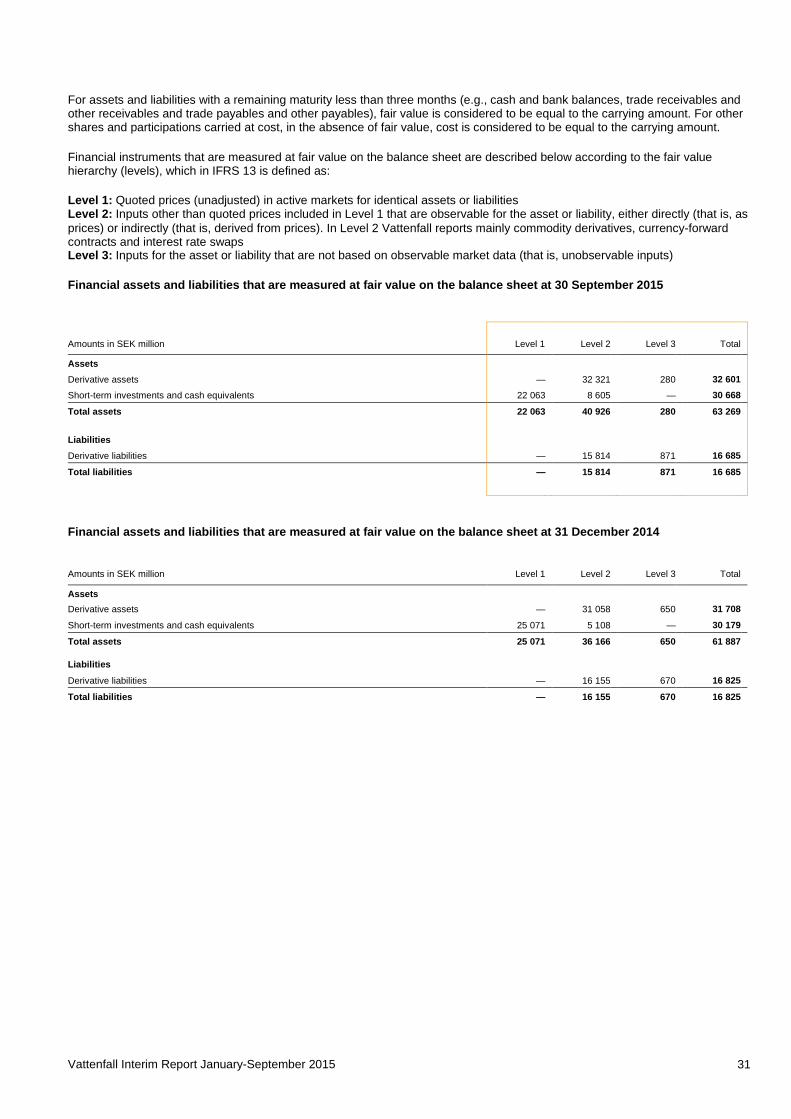
Vattenfall Interim Report January-September 2015 31
For assets and liabilities with a remaining maturity less than three months (e.g., cash and bank balances, trade receivables and other receivables and trade payables and other payables), fair value is considered to be equal to the carrying amount. For other shares and participations carried at cost, in the absence of fair value, cost is considered to be equal to the carrying amount.
Financial instruments that are measured at fair value on the balance sheet are described below according to the fair value hierarchy (levels), which in IFRS 13 is defined as:
Level 1: Quoted prices (unadjusted) in active markets for identical assets or liabilities Level 2: Inputs other than quoted prices included in Level 1 that are observable for the asset or liability, either directly (that is, as prices) or indirectly (that is, derived from prices). In Level 2 Vattenfall reports mainly commodity derivatives, currency-forward contracts and interest rate swaps Level 3: Inputs for the asset or liability that are not based on observable market data (that is, unobservable inputs)
Financial assets and liabilities that are measured at fair value on the balance sheet at 30 September 2015
Amounts in SEK million Level 1 Level 2 Level 3 Total
Assets
Derivative assets —
32 321
280
32 601
Short-term investments and cash equivalents 22 063 8 605 — 30 668
Total assets 22 063
40 926
280
63 269
Liabilities
Derivative liabilities — 15 814 871 16 685
Total liabilities — 15 814 871 16 685
Financial assets and liabilities that are measured at fair value on the balance sheet at 31 December 2014
Amounts in SEK million Level 1 Level 2 Level 3 Total Assets
Derivative assets —
31 058
650
31 708 Short-term investments and cash equivalents 25 071 5 108 — 30 179 Total assets 25 071
36 166
650
61 887
Liabilities
Derivative liabilities — 16 155 670 16 825 Total liabilities —
16 155
670
16 825
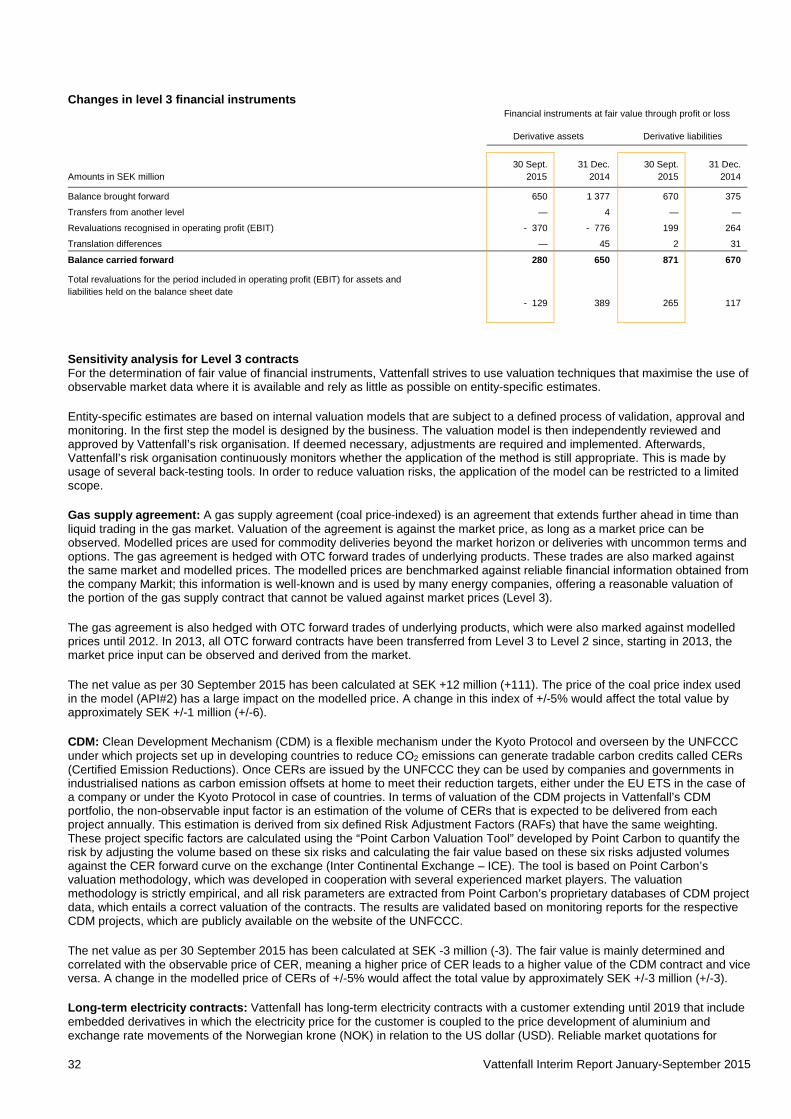
Vattenfall Interim Report January-September 2015 32
Changes in level 3 financial instruments Financial instruments at fair value through profit or loss
Derivative assets Derivative liabilities
30 Sept. 31 Dec. 30 Sept. 31 Dec.
Amounts in SEK million 2015 2014 2015 2014
Balance brought forward 650 1 377
670 375
Transfers from another level — 4
— —
Revaluations recognised in operating profit (EBIT) - 370 - 776
199 264
Translation differences — 45 2 31
Balance carried forward 280 650
871 670
Total revaluations for the period included in operating profit (EBIT) for assets and liabilities held on the balance sheet date
- 129 389
265 117
Sensitivity analysis for Level 3 contracts For the determination of fair value of financial instruments, Vattenfall strives to use valuation techniques that maximise the use of observable market data where it is available and rely as little as possible on entity-specific estimates.
Entity-specific estimates are based on internal valuation models that are subject to a defined process of validation, approval and monitoring. In the first step the model is designed by the business. The valuation model is then independently reviewed and approved by Vattenfall’s risk organisation. If deemed necessary, adjustments are required and implemented. Afterwards, Vattenfall’s risk organisation continuously monitors whether the application of the method is still appropriate. This is made by usage of several back-testing tools. In order to reduce valuation risks, the application of the model can be restricted to a limited scope.
Gas supply agreement: A gas supply agreement (coal price-indexed) is an agreement that extends further ahead in time than liquid trading in the gas market. Valuation of the agreement is against the market price, as long as a market price can be observed. Modelled prices are used for commodity deliveries beyond the market horizon or deliveries with uncommon terms and options. The gas agreement is hedged with OTC forward trades of underlying products. These trades are also marked against the same market and modelled prices. The modelled prices are benchmarked against reliable financial information obtained from the company Markit; this information is well-known and is used by many energy companies, offering a reasonable valuation of the portion of the gas supply contract that cannot be valued against market prices (Level 3).
The gas agreement is also hedged with OTC forward trades of underlying products, which were also marked against modelled prices until 2012. In 2013, all OTC forward contracts have been transferred from Level 3 to Level 2 since, starting in 2013, the market price input can be observed and derived from the market.
The net value as per 30 September 2015 has been calculated at SEK +12 million (+111). The price of the coal price index used in the model (API#2) has a large impact on the modelled price. A change in this index of +/-5% would affect the total value by approximately SEK +/-1 million (+/-6).
CDM: Clean Development Mechanism (CDM) is a flexible mechanism under the Kyoto Protocol and overseen by the UNFCCC under which projects set up in developing countries to reduce CO2 emissions can generate tradable carbon credits called CERs (Certified Emission Reductions). Once CERs are issued by the UNFCCC they can be used by companies and governments in industrialised nations as carbon emission offsets at home to meet their reduction targets, either under the EU ETS in the case of a company or under the Kyoto Protocol in case of countries. In terms of valuation of the CDM projects in Vattenfall’s CDM portfolio, the non-observable input factor is an estimation of the volume of CERs that is expected to be delivered from each project annually. This estimation is derived from six defined Risk Adjustment Factors (RAFs) that have the same weighting. These project specific factors are calculated using the “Point Carbon Valuation Tool” developed by Point Carbon to quantify the risk by adjusting the volume based on these six risks and calculating the fair value based on these six risks adjusted volumes against the CER forward curve on the exchange (Inter Continental Exchange – ICE). The tool is based on Point Carbon’s valuation methodology, which was developed in cooperation with several experienced market players. The valuation methodology is strictly empirical, and all risk parameters are extracted from Point Carbon’s proprietary databases of CDM project data, which entails a correct valuation of the contracts. The results are validated based on monitoring reports for the respective CDM projects, which are publicly available on the website of the UNFCCC.
The net value as per 30 September 2015 has been calculated at SEK -3 million (-3). The fair value is mainly determined and correlated with the observable price of CER, meaning a higher price of CER leads to a higher value of the CDM contract and vice versa. A change in the modelled price of CERs of +/-5% would affect the total value by approximately SEK +/-3 million (+/-3).
Long-term electricity contracts: Vattenfall has long-term electricity contracts with a customer extending until 2019 that include embedded derivatives in which the electricity price for the customer is coupled to the price development of aluminium and exchange rate movements of the Norwegian krone (NOK) in relation to the US dollar (USD). Reliable market quotations for
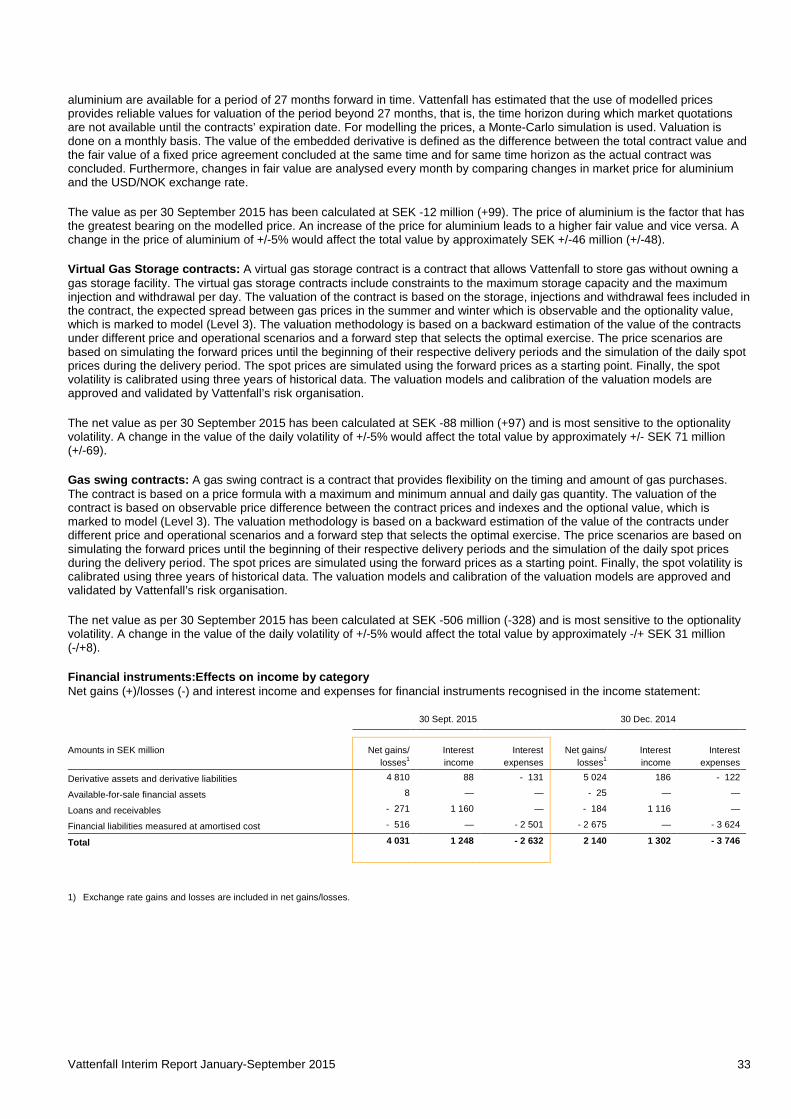
Vattenfall Interim Report January-September 2015 33
aluminium are available for a period of 27 months forward in time. Vattenfall has estimated that the use of modelled prices provides reliable values for valuation of the period beyond 27 months, that is, the time horizon during which market quotations are not available until the contracts’ expiration date. For modelling the prices, a Monte-Carlo simulation is used. Valuation is done on a monthly basis. The value of the embedded derivative is defined as the difference between the total contract value and the fair value of a fixed price agreement concluded at the same time and for same time horizon as the actual contract was concluded. Furthermore, changes in fair value are analysed every month by comparing changes in market price for aluminium and the USD/NOK exchange rate.
The value as per 30 September 2015 has been calculated at SEK -12 million (+99). The price of aluminium is the factor that has the greatest bearing on the modelled price. An increase of the price for aluminium leads to a higher fair value and vice versa. A change in the price of aluminium of +/-5% would affect the total value by approximately SEK +/-46 million (+/-48).
Virtual Gas Storage contracts: A virtual gas storage contract is a contract that allows Vattenfall to store gas without owning a gas storage facility. The virtual gas storage contracts include constraints to the maximum storage capacity and the maximum injection and withdrawal per day. The valuation of the contract is based on the storage, injections and withdrawal fees included in the contract, the expected spread between gas prices in the summer and winter which is observable and the optionality value, which is marked to model (Level 3). The valuation methodology is based on a backward estimation of the value of the contracts under different price and operational scenarios and a forward step that selects the optimal exercise. The price scenarios are based on simulating the forward prices until the beginning of their respective delivery periods and the simulation of the daily spot prices during the delivery period. The spot prices are simulated using the forward prices as a starting point. Finally, the spot volatility is calibrated using three years of historical data. The valuation models and calibration of the valuation models are approved and validated by Vattenfall’s risk organisation.
The net value as per 30 September 2015 has been calculated at SEK -88 million (+97) and is most sensitive to the optionality volatility. A change in the value of the daily volatility of +/-5% would affect the total value by approximately +/- SEK 71 million (+/-69).
Gas swing contracts: A gas swing contract is a contract that provides flexibility on the timing and amount of gas purchases. The contract is based on a price formula with a maximum and minimum annual and daily gas quantity. The valuation of the contract is based on observable price difference between the contract prices and indexes and the optional value, which is marked to model (Level 3). The valuation methodology is based on a backward estimation of the value of the contracts under different price and operational scenarios and a forward step that selects the optimal exercise. The price scenarios are based on simulating the forward prices until the beginning of their respective delivery periods and the simulation of the daily spot prices during the delivery period. The spot prices are simulated using the forward prices as a starting point. Finally, the spot volatility is calibrated using three years of historical data. The valuation models and calibration of the valuation models are approved and validated by Vattenfall’s risk organisation.
The net value as per 30 September 2015 has been calculated at SEK -506 million (-328) and is most sensitive to the optionality volatility. A change in the value of the daily volatility of +/-5% would affect the total value by approximately -/+ SEK 31 million (-/+8).
Financial instruments:Effects on income by category Net gains (+)/losses (-) and interest income and expenses for financial instruments recognised in the income statement:
30 Sept. 2015 30 Dec. 2014
Amounts in SEK million Net gains/ losses1
Interest income
Interest expenses
Net gains/ losses1
Interest income
Interest expenses
Derivative assets and derivative liabilities 4 810
88
- 131 5 024
186 - 122
Available-for-sale financial assets 8
—
— - 25
—
—
Loans and receivables - 271
1 160
— - 184
1 116
—
Financial liabilities measured at amortised cost - 516 — - 2 501 - 2 675 — - 3 624
Total 4 031
1 248
- 2 632 2 140
1 302 - 3 746
1) Exchange rate gains and losses are included in net gains/losses.
Vattenfall Interim Report January-September 2015 34
The Parent Company Vattenfall AB Accounting policies The Parent Company Vattenfall AB’s accounts are prepared in accordance with the Swedish Annual Accounts Act and recommendation RFR 2 – Accounting for Legal Entities, issued by the Swedish Financial Reporting Board. The accounting policies used in this report are the same as those described in Vattenfall’s 2014 Annual and sustainability report (Note 2 to the Parent Company accounts).
Quarter 1-3 of 2015 A condensed income statement and balance sheet for the Parent Company are presented below.
• Net sales amounted to SEK 22,326 million (23,065). • Profit before appropriations and tax was SEK 3,651 million (-13,554). • Earnings were affected by the following:
o Received dividends of SEK 3,897 million. o A small capital gain from the sale of entire shareholding in Övertorneå Värmeverk AB. o A capital gain of SEK 59 million from the liquidation of Vattenfall VätterEl AB. o Impairment loss of SEK 1,209 millon for the shareholding in Vattenfall A/S, the effect of previously a received
dividend. • The balance sheet total was SEK 287,902 million (31 December: 267,526). • On 1 July 2015 Vattenfall made the scheduled payment of EUR 2,071.3 million for the remaining 21% of the shares in N.V.
Nuon Energy, corresponding to approximately SEK 19 billion. • During the third quarter, shares in Vattenfall Distribution AB were revalued to SEK 38 billion in order to better reflect the
value of the shares • During the period, Vattenfall issued hybrid bonds of SEK 6 billion and EUR 1 billion, respectively (slightly more than
SEK 15 billion combined). The aim was to refinance Vattenfall’s previous hybrid bond that was issued 2005 and to use the remaining for general corporate purposes.
• Investments during the period amounted to SEK 312 million (249). • Cash and cash equivalents, and short-term investments amounted to SEK 36,074 million (31 December 2014: 35,059).
Risks and uncertainties For a description of risks, uncertainties and risk management, please refer to Vattenfall’s 2014 Annual and sustainability report, pages 66-72. Apart from the information provided under Important events on pages 5-6 in this report, no other material changes have taken place since publication of the 2014 Annual and sustainability report.
Other Significant related-party transactions are described in Note 39 to the Parent Company accounts in Vattenfall’s 2014 Annual and sustainability report. No material changes have taken place in relations or transactions with related parties compared with the description in the 2014 Annual and sustainability report.
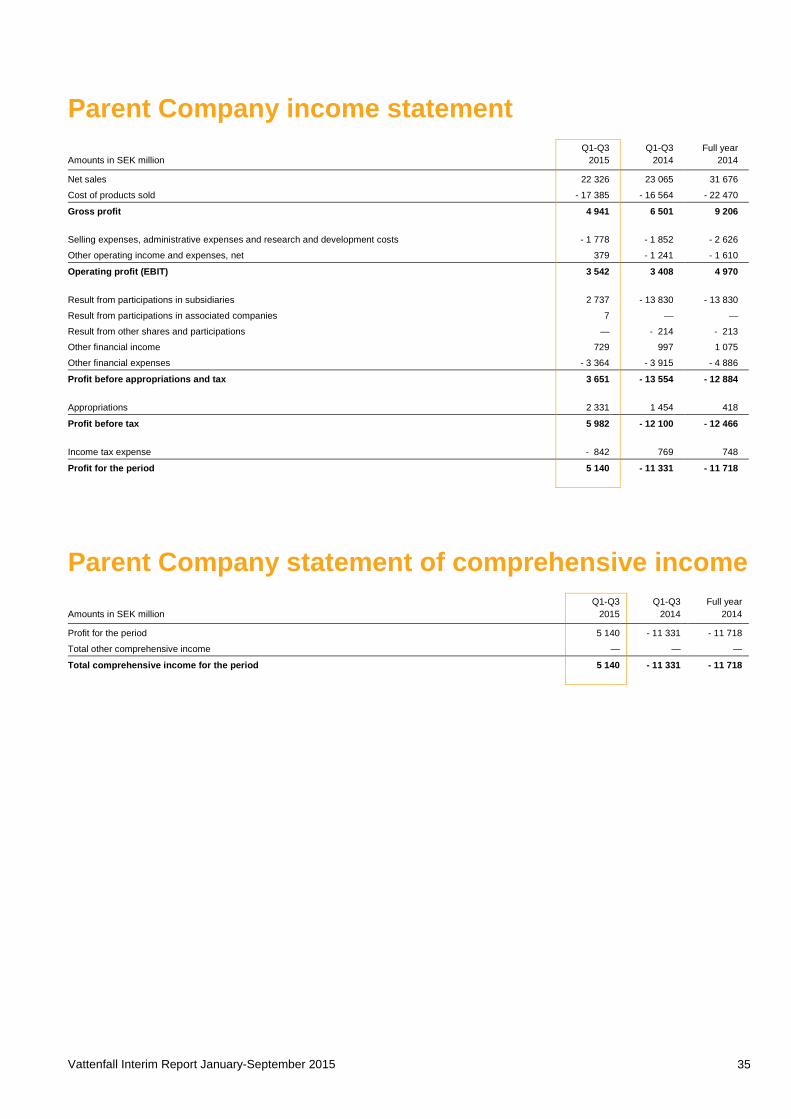
Vattenfall Interim Report January-September 2015 35
Parent Company income statement
Q1-Q3 Q1-Q3
Full year
Amounts in SEK million 2015 2014 2014
Net sales 22 326 23 065
31 676 Cost of products sold - 17 385 - 16 564 - 22 470
Gross profit 4 941 6 501
9 206
Selling expenses, administrative expenses and research and development costs - 1 778 - 1 852
- 2 626 Other operating income and expenses, net 379 - 1 241 - 1 610
Operating profit (EBIT) 3 542 3 408
4 970
Result from participations in subsidiaries 2 737 - 13 830
- 13 830 Result from participations in associated companies 7 —
—
Result from other shares and participations — - 214
- 213 Other financial income 729 997
1 075
Other financial expenses - 3 364 - 3 915 - 4 886
Profit before appropriations and tax 3 651 - 13 554
- 12 884
Appropriations 2 331 1 454 418
Profit before tax 5 982 - 12 100
- 12 466
Income tax expense - 842 769 748
Profit for the period 5 140 - 11 331
- 11 718
Parent Company statement of comprehensive income
Q1-Q3
Q1-Q3
Full year
Amounts in SEK million 2015 2014 2014
Profit for the period 5 140 - 11 331
- 11 718 Total other comprehensive income — — —
Total comprehensive income for the period 5 140 - 11 331
- 11 718
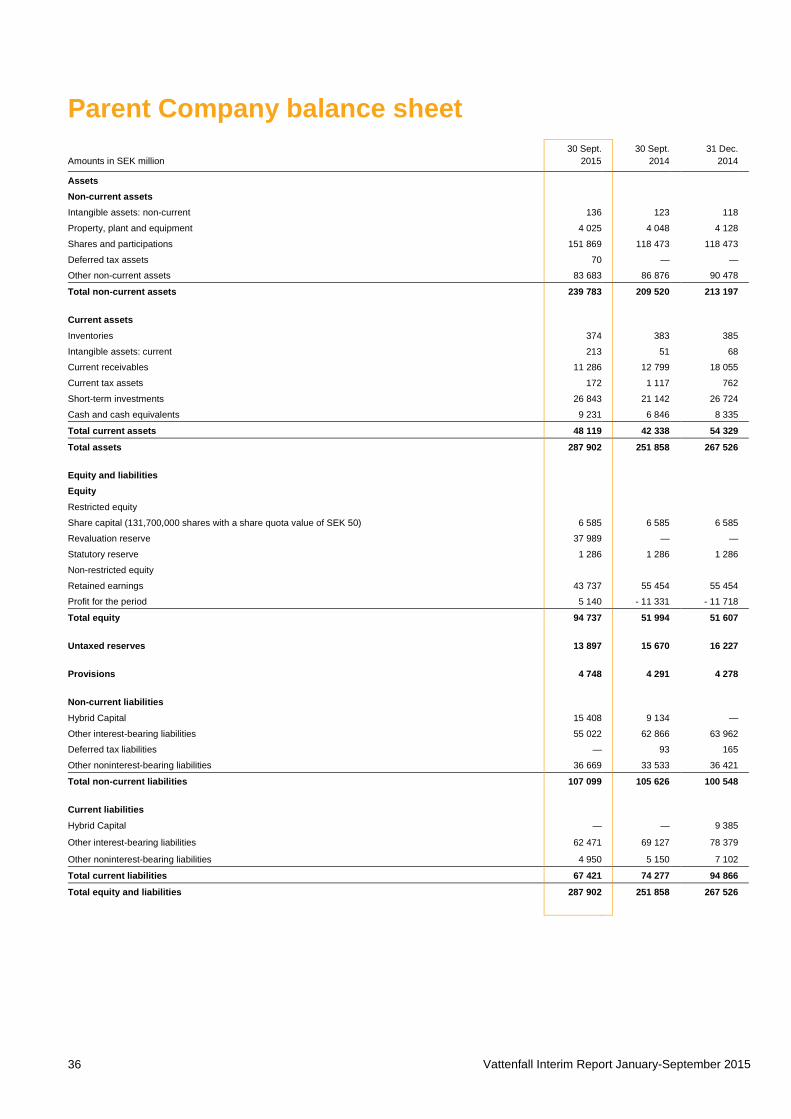
Vattenfall Interim Report January-September 2015 36
Parent Company balance sheet
30 Sept. 30 Sept.
31 Dec.
Amounts in SEK million 2015 2014 2014
Assets Non-current assets Intangible assets: non-current 136 123
118
Property, plant and equipment 4 025 4 048
4 128 Shares and participations 151 869 118 473
118 473
Deferred tax assets 70 —
— Other non-current assets 83 683 86 876 90 478
Total non-current assets 239 783 209 520
213 197
Current assets Inventories 374 383
385
Intangible assets: current 213 51
68 Current receivables 11 286 12 799
18 055
Current tax assets 172 1 117
762 Short-term investments 26 843 21 142
26 724
Cash and cash equivalents 9 231 6 846 8 335
Total current assets 48 119 42 338 54 329
Total assets 287 902 251 858
267 526
Equity and liabilities Equity Restricted equity Share capital (131,700,000 shares with a share quota value of SEK 50) 6 585 6 585
6 585
Revaluation reserve 37 989 —
— Statutory reserve 1 286 1 286
1 286
Non-restricted equity Retained earnings 43 737 55 454
55 454
Profit for the period 5 140 - 11 331 - 11 718
Total equity 94 737 51 994
51 607
Untaxed reserves 13 897 15 670
16 227
Provisions 4 748 4 291
4 278
Non-current liabilities Hybrid Capital 15 408 9 134
—
Other interest-bearing liabilities 55 022 62 866
63 962 Deferred tax liabilities — 93
165
Other noninterest-bearing liabilities 36 669 33 533 36 421
Total non-current liabilities 107 099 105 626
100 548
Current liabilities Hybrid Capital — —
9 385
Other interest-bearing liabilities 62 471 69 127
78 379 Other noninterest-bearing liabilities 4 950 5 150 7 102
Total current liabilities 67 421 74 277 94 866
Total equity and liabilities 287 902 251 858
267 526
Vattenfall Interim Report January-September 2015 37
Definitions and calculations of key ratios Figures for the Group in 2015. Amounts in SEK million unless indicated otherwise.
EBIT: Earnings Before Interest and Tax (Operating profit)
EBITDA: Earnings Before Interest, Tax, Depreciation and Amortisation. (Operating profit before depreciation, amortisation and impairment losses)
Items affecting comparability: Capital gains and capital losses from shares and other non-current assets, impairment losses and reversed impairment losses and other non-recurring items. Also included here are, for trading activities, unrealised changes in the fair value of energy derivatives, which according to IAS 39 cannot be recognised using hedge accounting and unrealised changes in the fair value of inventories
Underlying operating profit: Operating profit (EBIT) excluding items affecting comparability
FFO: Funds From Operations
Free cash flow: Cash flow from operating activities less maintenance investments
Hybrid Capital: Perpetual subordinated securities, junior to all Vattenfall’s unsubordinated debt instruments.
Capital employed: Balance sheet total less financial assets, noninterest-bearing liabilities and certain other interest-bearing provisions not included in adjusted net debt
Net debt: Interest-bearing liabilities less loans to owners of non-controlling interests in Group companies, cash and cash equivalents and short-term investments
Adjusted net debt: For calculation, see Consolidated balance sheet - Supplementary Information
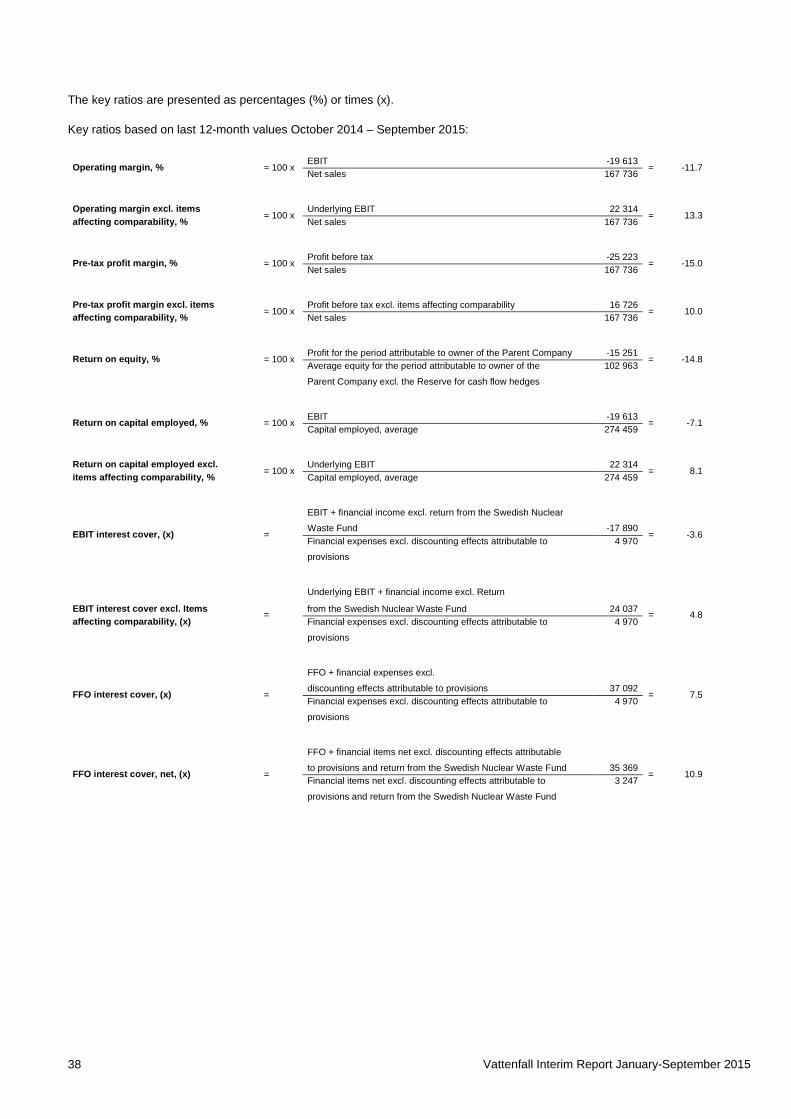
Vattenfall Interim Report January-September 2015 38
The key ratios are presented as percentages (%) or times (x).
Key ratios based on last 12-month values October 2014 – September 2015:
Operating margin, % = 100 x EBIT -19 613
= -11.7 Net sales 167 736
Operating margin excl. items = 100 x
Underlying EBIT 22 314 = 13.3 affecting comparability, % Net sales 167 736
Pre-tax profit margin, % = 100 x
Profit before tax -25 223 = -15.0
Net sales 167 736
Pre-tax profit margin excl. items = 100 x
Profit before tax excl. items affecting comparability 16 726 = 10.0 affecting comparability, % Net sales 167 736
Return on equity, % = 100 x
Profit for the period attributable to owner of the Parent Company -15 251 = -14.8
Average equity for the period attributable to owner of the 102 963
Parent Company excl. the Reserve for cash flow hedges
Return on capital employed, % = 100 x
EBIT -19 613 = -7.1
Capital employed, average 274 459
Return on capital employed excl. = 100 x
Underlying EBIT 22 314 = 8.1 items affecting comparability, % Capital employed, average 274 459
EBIT + financial income excl. return from the Swedish Nuclear
EBIT interest cover, (x) = Waste Fund -17 890
= -3.6 Financial expenses excl. discounting effects attributable to 4 970
provisions
Underlying EBIT + financial income excl. Return
EBIT interest cover excl. Items = from the Swedish Nuclear Waste Fund 24 037 = 4.8 affecting comparability, (x) Financial expenses excl. discounting effects attributable to 4 970
provisions
FFO + financial expenses excl.
FFO interest cover, (x) = discounting effects attributable to provisions 37 092
= 7.5 Financial expenses excl. discounting effects attributable to 4 970
provisions
FFO + financial items net excl. discounting effects attributable
FFO interest cover, net, (x) =
to provisions and return from the Swedish Nuclear Waste Fund 35 369 = 10.9
Financial items net excl. discounting effects attributable to 3 247
provisions and return from the Swedish Nuclear Waste Fund
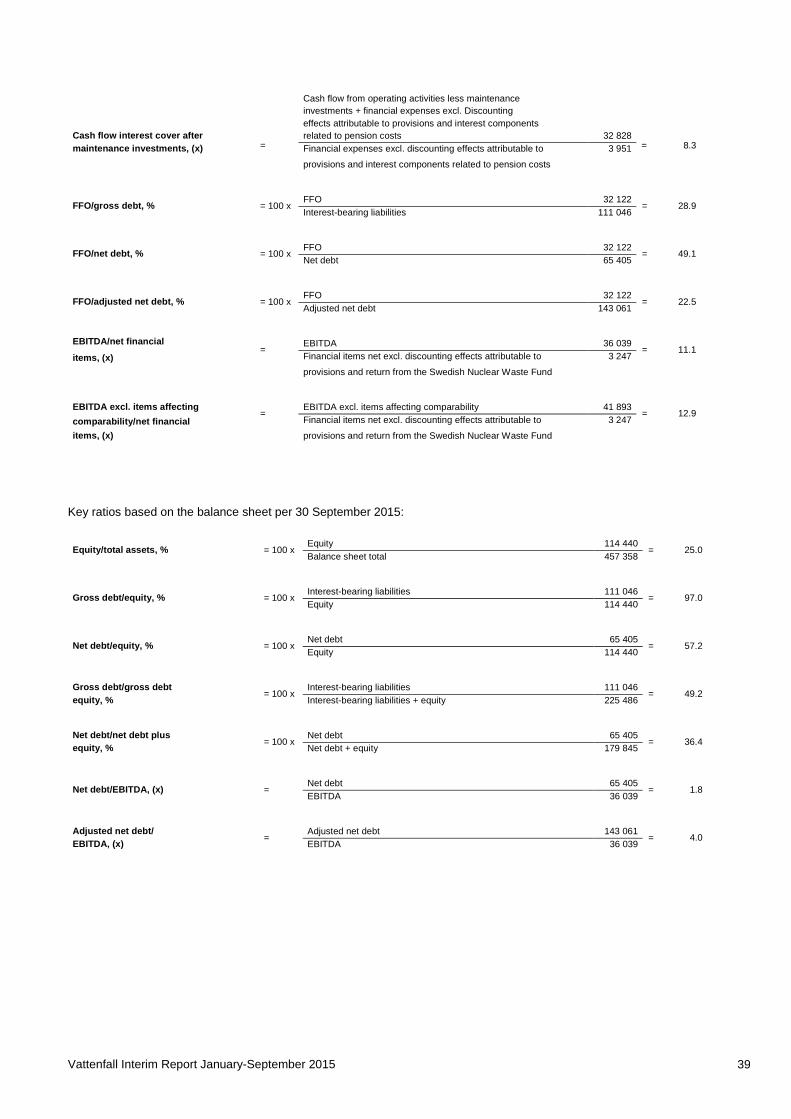
Vattenfall Interim Report January-September 2015 39
Cash flow from operating activities less maintenance investments + financial expenses excl. Discounting
Cash flow interest cover after
=
effects attributable to provisions and interest components related to pension costs 32 828
= 8.3 maintenance investments, (x) Financial expenses excl. discounting effects attributable to 3 951
provisions and interest components related to pension costs
FFO/gross debt, % = 100 x
FFO 32 122 = 28.9
Interest-bearing liabilities 111 046
FFO/net debt, % = 100 x
FFO 32 122 = 49.1
Net debt 65 405
FFO/adjusted net debt, % = 100 x
FFO 32 122 = 22.5
Adjusted net debt 143 061
EBITDA/net financial
= EBITDA 36 039
= 11.1 items, (x) Financial items net excl. discounting effects attributable to 3 247
provisions and return from the Swedish Nuclear Waste Fund
EBITDA excl. items affecting =
EBITDA excl. items affecting comparability 41 893 = 12.9
comparability/net financial Financial items net excl. discounting effects attributable to 3 247
items, (x)
provisions and return from the Swedish Nuclear Waste Fund
Key ratios based on the balance sheet per 30 September 2015:
Equity/total assets, % = 100 x Equity 114 440
= 25.0 Balance sheet total 457 358
Gross debt/equity, % = 100 x
Interest-bearing liabilities 111 046 = 97.0
Equity 114 440
Net debt/equity, % = 100 x
Net debt 65 405 = 57.2
Equity 114 440
Gross debt/gross debt = 100 x
Interest-bearing liabilities 111 046 = 49.2 equity, % Interest-bearing liabilities + equity 225 486
Net debt/net debt plus = 100 x
Net debt 65 405 = 36.4 equity, % Net debt + equity 179 845
Net debt/EBITDA, (x) =
Net debt 65 405 = 1.8
EBITDA 36 039
Adjusted net debt/ =
Adjusted net debt 143 061 = 4.0 EBITDA, (x) EBITDA 36 039
Vattenfall Interim Report January-September 2015 40
Interim report signature Solna, 27 October 2015
Magnus Hall President and CEO
This interim report has not been reviewed by the company’s auditors.
Financial calendar Year-end report 2015, 3 February 2016
Annual General Meeting, 27 April 2016
Interim report January–March, 28 April 2016
Interim report January–June, 21 July 2016
Interim report January–September, 27 October 2016
Contact information Vattenfall AB (publ) SE-169 92 Stockholm Corporate identity number 556036-2138 T +46-8-739 50 00 www.vattenfall.com www.vattenfall.se
Magnus Hall President and CEO T +46-8-739 50 09
Ingrid Bonde CFO T +46-8-739 60 06
Klaus Aurich Head of Investor Relations T +46-8-739 65 14 or +46-70-539 65 14
Related Documents