March 2018 NORTH AMERICAN INDUSTRIALS M&A Activity and Valuation Trends Q1 | 2018 Robert Ullman Managing Director [email protected] 415.613.4114 William Downing Managing Director [email protected] 602.734.0682 Michael Pucci Associate Director [email protected] 602.734.0667 Michael Hilcove Senior Associate [email protected] 602.734.0626 Michael Reister Senior Analyst [email protected] 602.734.0663

Welcome message from author
This document is posted to help you gain knowledge. Please leave a comment to let me know what you think about it! Share it to your friends and learn new things together.
Transcript

March 2018
NORTH AMERICAN
INDUSTRIALSM&A Activity and Valuation Trends
Q1 | 2018
Robert UllmanManaging Director
William DowningManaging Director
Michael PucciAssociate Director
Michael HilcoveSenior Associate
Michael ReisterSenior Analyst
March 2018
I. Economic Indicators 3
II. Dinan Index Constituents 5
III. Capital Market Activity 6
IV. Public Sector Valuations 9
V. Mergers and Acquisitions Overview 13
VI. First Quarter Transactions Overview 14
VII. Dinan Capital Advisors 22
Section Page
Table of Contents
March 2018
-10%
0%
10%
20%
30%
40%
Per
cen
t C
han
ge, I
nd
ex P
rice
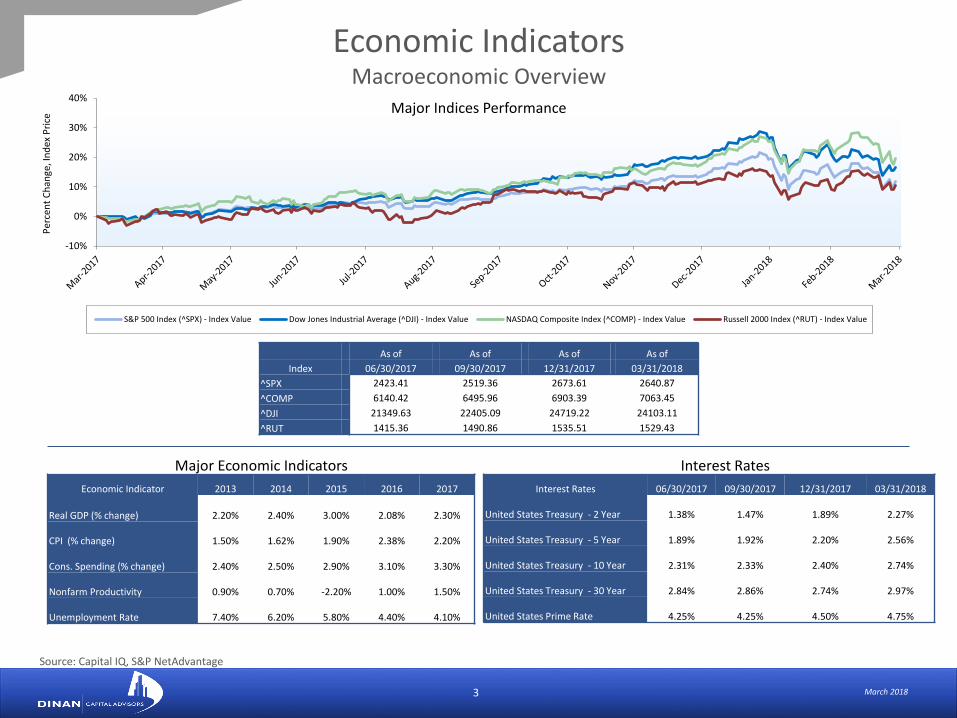
Major Indices Performance
S&P 500 Index (^SPX) - Index Value Dow Jones Industrial Average (^DJI) - Index Value NASDAQ Composite Index (^COMP) - Index Value Russell 2000 Index (^RUT) - Index Value
Economic IndicatorsMacroeconomic Overview
3
Major Economic Indicators Interest Rates
As of As of As of As of
Index 06/30/2017 09/30/2017 12/31/2017 03/31/2018
^SPX 2423.41 2519.36 2673.61 2640.87
^COMP 6140.42 6495.96 6903.39 7063.45
^DJI 21349.63 22405.09 24719.22 24103.11
^RUT 1415.36 1490.86 1535.51 1529.43
Interest Rates 06/30/2017 09/30/2017 12/31/2017 03/31/2018
United States Treasury - 2 Year 1.38% 1.47% 1.89% 2.27%
United States Treasury - 5 Year 1.89% 1.92% 2.20% 2.56%
United States Treasury - 10 Year 2.31% 2.33% 2.40% 2.74%
United States Treasury - 30 Year 2.84% 2.86% 2.74% 2.97%
United States Prime Rate 4.25% 4.25% 4.50% 4.75%
Economic Indicator 2013 2014 2015 2016 2017
Real GDP (% change) 2.20% 2.40% 3.00% 2.08% 2.30%
CPI (% change) 1.50% 1.62% 1.90% 2.38% 2.20%
Cons. Spending (% change) 2.40% 2.50% 2.90% 3.10% 3.30%
Nonfarm Productivity 0.90% 0.70% -2.20% 1.00% 1.50%
Unemployment Rate 7.40% 6.20% 5.80% 4.40% 4.10%
Source: Capital IQ, S&P NetAdvantage

March 2018
450
700
950
1200
1450
2011 2012 2013 2014 2015 2016 2017H
ou
sin
g St
arts
(Th
ou
)
Year
Housing Starts
90
95
100
105
110
2011 2012 2013 2014 2015 2016 2017
Year
Industrial Production Manufacturing (NAICS) Index
90
95
100
105
110
2011 2012 2013 2014 2015 2016 2017
Year
Industrial Production Index
74
75
76
77
78
79
80
2011 2012 2013 2014 2015 2016Year
Industry Capacity Utilization Index
Economic IndicatorsIndustrials Performance Metrics
4
The Industrial Production Manufacturing measures North American manufacturing output according to the NAICS.
The Federal Reserve Board derives the Industrial Capacity Utilization Indexthrough dividing an estimated monthly industrial production index by a relatedcapacity index providing a more complete picture of industrial developments.
The Industrial Production index is an economic indicator published by theFederal Reserve that measures the level of real production output ofmanufacturing, mining, and utilities.
The US Census Bureau along with the US Department of Housing and UrbanDevelopment release a monthly report on housing starts. A housing start isdefined as the beginning of a new foundation of a home itself.
Source: Federal Reserve Economic Data
72
74
76
78
80
2011 2012 2013 2014 2015 2016 2017
Year
Industry Capacity Utilization Index

March 20185
Industrial Conglomerates
Freight/Logistics
Distribution/MRO
Chemicals
Building Products
Aerospace and Defense
Test/Measurement
Paper/Plastics/Packaging
Machinery
Dinan Index ConstituentsIndustrials

March 2018
-10%
-5%
0%
5%
10%
15%
20%
25%
30%
Per
cen
t C
han
ge, I
nd
ex P
rice
Dinan Industrials Index (Price) - Index Value S&P 500 Index (^SPX) - Index Value
6
Capital Market ActivityIndustrials
Source: Capital IQ
Capitalization Number of % of Agg. Equity % of Agg. Equity
Profile Companies Companies Mkt. Value Mkt. Value
> $10B 20 35.09% $993,530.93 87.24%
$5B - $10B 15 26.32% $106,614.32 9.36%
$1B - $5B 15 26.32% $34,774.08 3.05%
< $1B 7 12.28% $3,937.86 0.35%
Total 57 100.00% $1,138,857.19 100.00%
March 2018
-20%
0%
20%
40%
Pe
rcen
t C
han
ge, I
nd
ex P
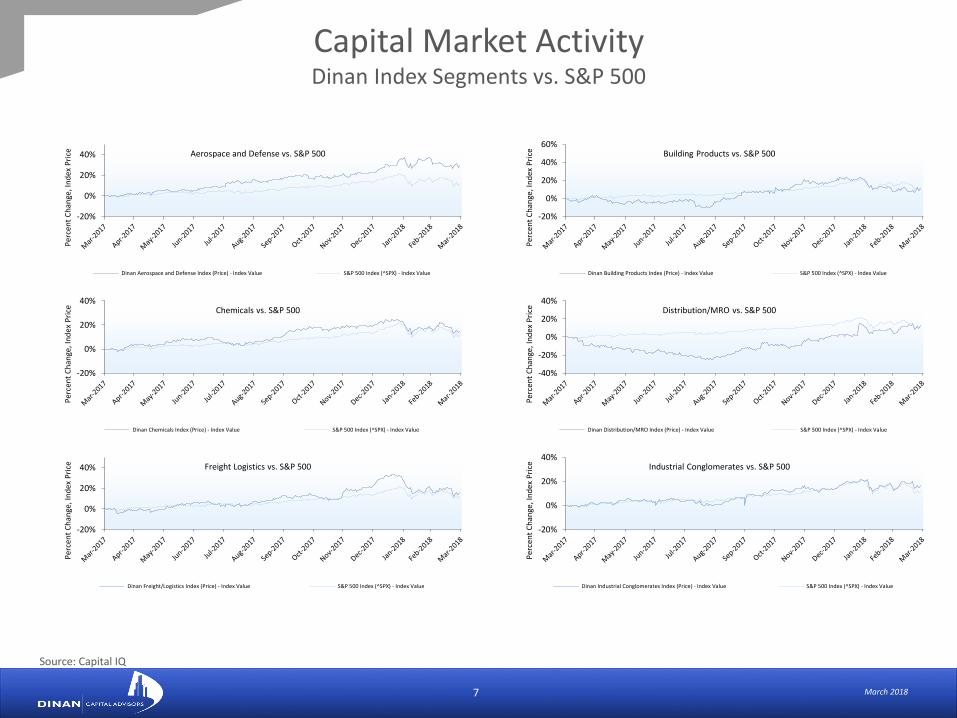
rice Freight Logistics vs. S&P 500
Dinan Freight/Logistics Index (Price) - Index Value S&P 500 Index (^SPX) - Index Value
-20%
0%
20%
40%
Pe
rcen
t C
han
ge, I
nd
ex P
rice Industrial Conglomerates vs. S&P 500
Dinan Industrial Conglomerates Index (Price) - Index Value S&P 500 Index (^SPX) - Index Value
-40%
-20%
0%
20%
40%
Pe
rcen
t C
han
ge, I
nd
ex P
rice Distribution/MRO vs. S&P 500
Dinan Distribution/MRO Index (Price) - Index Value S&P 500 Index (^SPX) - Index Value
-20%
0%
20%
40%
Pe
rcen
t C
han
ge, I
nd
ex P
rice Chemicals vs. S&P 500
Dinan Chemicals Index (Price) - Index Value S&P 500 Index (^SPX) - Index Value
-20%
0%
20%
40%
Pe
rcen
t C
han
ge, I
nd
ex P
rice Aerospace and Defense vs. S&P 500
Dinan Aerospace and Defense Index (Price) - Index Value S&P 500 Index (^SPX) - Index Value
-20%
0%
20%
40%
60%
Pe
rcen
t C
han
ge, I
nd
ex P
rice Building Products vs. S&P 500
Dinan Building Products Index (Price) - Index Value S&P 500 Index (^SPX) - Index Value
Capital Market ActivityDinan Index Segments vs. S&P 500
7
Source: Capital IQ
March 2018
-20%
0%
20%
40%
Pe
rcen
t C
han
ge, I
nd
ex P
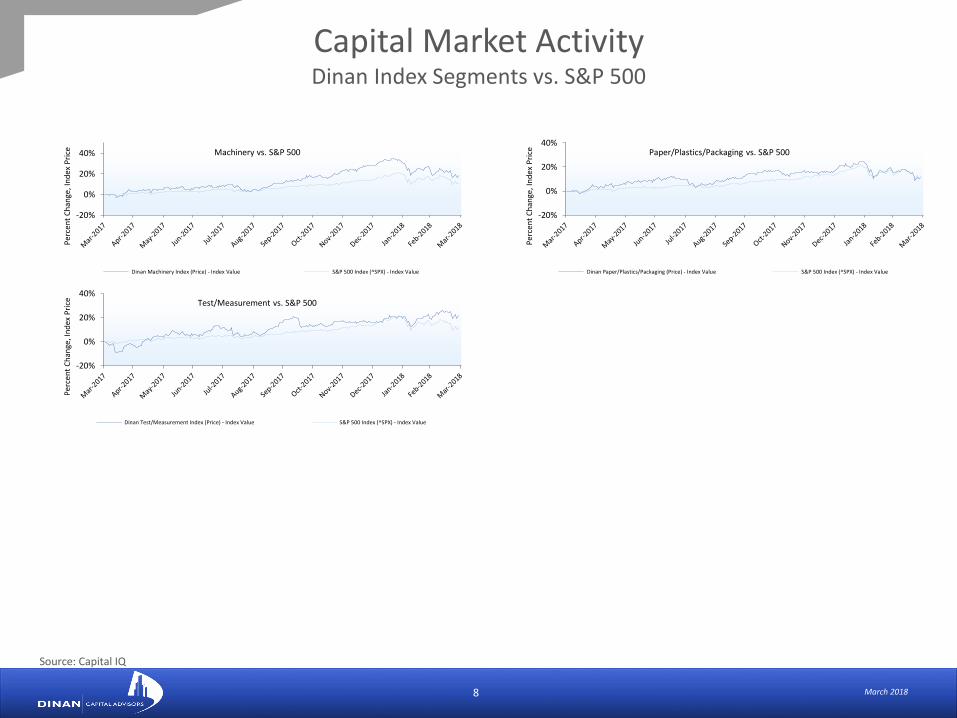
rice Test/Measurement vs. S&P 500
Dinan Test/Measurement Index (Price) - Index Value S&P 500 Index (^SPX) - Index Value
-20%
0%
20%
40%
Pe
rcen
t C
han
ge, I
nd
ex P
rice Paper/Plastics/Packaging vs. S&P 500
Dinan Paper/Plastics/Packaging (Price) - Index Value S&P 500 Index (^SPX) - Index Value
-20%
0%
20%
40%
Pe
rcen
t C
han
ge, I
nd
ex P
rice Machinery vs. S&P 500
Dinan Machinery Index (Price) - Index Value S&P 500 Index (^SPX) - Index Value
Capital Market ActivityDinan Index Segments vs. S&P 500
8
Source: Capital IQ
March 2018
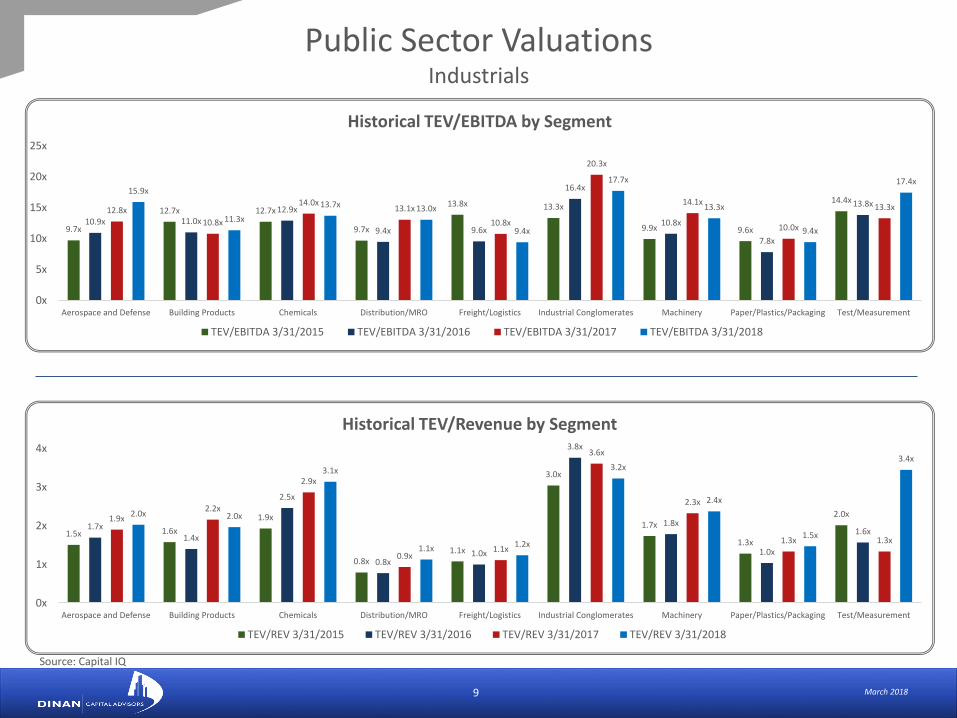
1.5x 1.6x
1.9x
0.8x1.1x
3.0x
1.7x
1.3x
2.0x
1.7x1.4x
2.5x
0.8x1.0x
3.8x
1.8x
1.0x
1.6x
1.9x2.2x
2.9x
0.9x1.1x
3.6x
2.3x
1.3x 1.3x
2.0x 2.0x
3.1x
1.1x 1.2x
3.2x
2.4x
1.5x
3.4x
0x
1x
2x
3x
4x
Aerospace and Defense Building Products Chemicals Distribution/MRO Freight/Logistics Industrial Conglomerates Machinery Paper/Plastics/Packaging Test/Measurement
Historical TEV/Revenue by Segment
TEV/REV 3/31/2015 TEV/REV 3/31/2016 TEV/REV 3/31/2017 TEV/REV 3/31/2018
9.7x
12.7x 12.7x
9.7x
13.8x 13.3x
9.9x 9.6x
14.4x
10.9x 11.0x
12.9x
9.4x 9.6x
16.4x
10.8x
7.8x
13.8x12.8x
10.8x
14.0x13.1x
10.8x
20.3x
14.1x
10.0x
13.3x
15.9x
11.3x
13.7x 13.0x
9.4x
17.7x
13.3x
9.4x
17.4x
0x
5x
10x
15x
20x
25x
Aerospace and Defense Building Products Chemicals Distribution/MRO Freight/Logistics Industrial Conglomerates Machinery Paper/Plastics/Packaging Test/Measurement
Historical TEV/EBITDA by Segment
TEV/EBITDA 3/31/2015 TEV/EBITDA 3/31/2016 TEV/EBITDA 3/31/2017 TEV/EBITDA 3/31/2018
Public Sector Valuations Industrials
9
Source: Capital IQ

March 201810
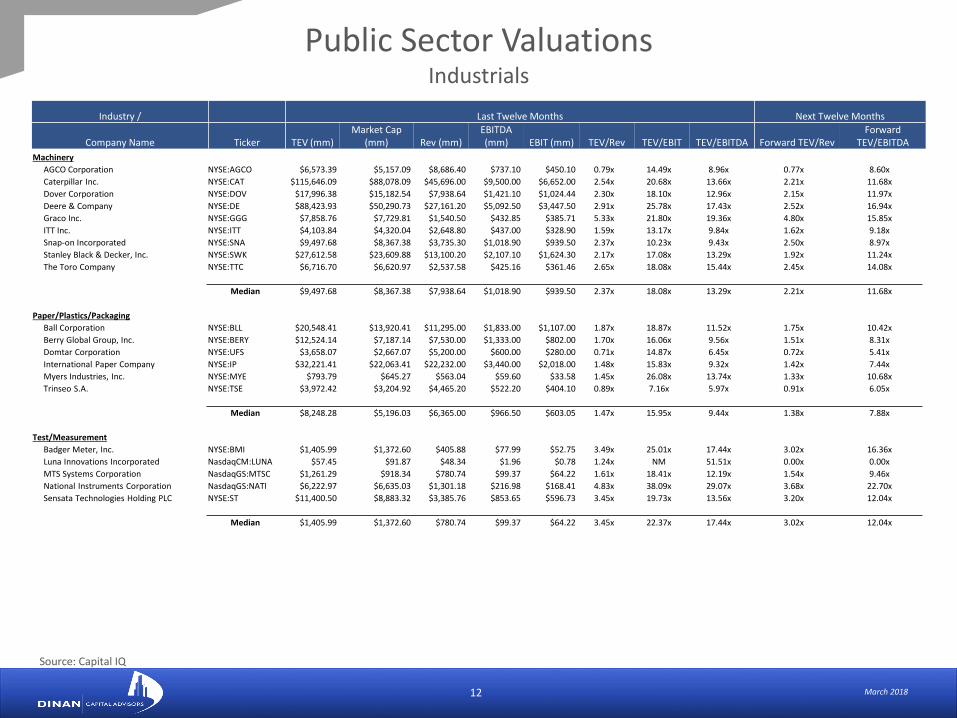
Public Sector Valuations Industrials
Industry / Last Twelve Months Next Twelve Months
Company Name Ticker TEV (mm)Market Cap
(mm) Rev (mm)EBITDA (mm) EBIT (mm) TEV/Rev TEV/EBIT TEV/EBITDA Forward TEV/Rev
Forward TEV/EBITDA
Aerospace and Defense
Bombardier Inc. TSX:BBD.B $19,048.51 $8,850.33 $16,641.00 $655.00 $436.00 0.94x 25.11x 18.08x 0.87x 11.95x
Lockheed Martin Corporation NYSE: LMT $108,064.57 $96,588.57 $51,471.00 $6,836.00 $5,770.00 2.12x 18.88x 15.90x 1.98x 12.30x
Raytheon Company NYSE:RTN $64,427.36 $62,265.36 $25,348.00 $3,797.00 $3,318.00 2.54x 19.42x 16.97x 2.31x 12.57x
Spirit AeroSystems Holdings, Inc. NYSE:SPR $10,322.82 $9,594.62 $7,025.00 $734.40 $533.30 1.48x 17.52x 13.12x 1.45x 8.86x
United Technologies Corporation NYSE:UTX $121,108.84 $100,666.84 $61,264.00 $10,377.00 $8,168.00 2.02x 15.32x 12.06x 1.90x 11.38x
Median $64,427.36 $62,265.36 $25,348.00 $3,797.00 $3,318.00 2.02x 18.88x 15.90x 1.90x 11.95x
Building Products
Armstrong World Industries, Inc. NYSE:AWI $3,680.22 $2,989.82 $901.10 $258.50 $190.10 4.12x 14.43x 11.43x 4.01x 10.70x
Continental Building Products, Inc. NYSE:CBPX $1,261.74 $1,068.95 $485.35 $134.42 $88.66 2.58x 14.11x 9.29x 2.42x 8.73x
Eagle Materials Inc. NYSE:EXP $5,559.40 $5,015.32 $1,386.52 $414.75 $297.55 4.03x 15.90x 12.05x 3.83x 10.96x
Griffon Corporation NYSE:GFF $1,968.11 $804.89 $1,704.78 $130.70 $80.68 1.22x 24.93x 15.40x 0.88x 9.44x
Masonite International Corporation NYSE:DOOR $2,180.19 $1,717.93 $2,032.93 $237.71 $160.13 1.07x 13.45x 9.09x 1.09x 8.16x
Quanex Building Products Corporation NYSE:NX $832.81 $610.43 $863.13 $93.36 $41.80 0.96x 19.93x 8.92x 0.93x 8.00x
Trex Company, Inc. NYSE:TREX $3,170.02 $3,200.53 $591.55 $166.60 $148.73 5.61x 22.19x 19.84x 5.15x 17.62x
USG Corporation NYSE:USG $6,286.12 $5,664.12 $3,223.00 $473.00 $338.00 1.96x 14.76x 11.27x 1.90x 10.10x
Median $2,675.10 $2,353.87 $1,143.81 $202.15 $154.43 2.27x 15.33x 11.35x 2.16x 9.77x
Chemicals
Agilent Technologies, Inc. NYSE:A $20,835.68 $21,573.68 $4,616.00 $1,124.00 $916.00 4.51x 22.75x 18.54x 3.98x 16.10x
Balchem Corporation NasdaqGS:BCPC $2,797.53 $2,618.98 $618.47 $148.48 $104.78 4.70x 28.27x 19.58x 4.94x 20.31x
Celanese Corporation NYSE:CE $17,074.84 $13,610.84 $6,520.00 $1,406.00 $1,092.00 2.78x 14.81x 11.70x 2.65x 10.11x
Huntsman Corporation NYSE:HUN $9,669.39 $7,090.39 $8,721.00 $1,330.00 $1,021.00 1.16x 10.66x 8.00x 1.14x 7.03x
Monsanto Company NYSE:MON $56,518.05 $51,437.05 $14,593.00 $4,154.00 $3,397.00 3.86x 16.74x 13.71x 3.81x 13.04x
RPM International Inc. NYSE:RPM $8,263.76 $6,371.86 $5,256.33 $686.15 $560.02 1.60x 15.01x 12.27x 1.57x 11.06x
The Sherwin-Williams Company NYSE:SHW $47,023.09 $36,706.64 $16,187.41 $2,807.47 $2,209.84 3.14x 23.99x 19.18x 2.55x 14.99x
Median $13,372.12 $10,350.62 $7,620.50 $1,368.00 $1,056.50 2.96x 15.87x 12.99x 2.60x 12.05x
Source: Capital IQ

March 201811
Industry / Last Twelve Months Next Twelve Months
Company Name Ticker TEV (mm)Market Cap
(mm) Rev (mm)EBITDA (mm) EBIT (mm) TEV/Rev TEV/EBIT TEV/EBITDA Forward TEV/Rev
Forward TEV/EBITDA
Public Sector Valuations Industrials
Distribution/MRO
Applied Industrial Technologies, Inc. NYSE:AIT $3,047.02 $2,819.38 $2,857.02 $252.72 $208.74 1.12x 15.85x 13.15x 1.04x 10.95x
DXP Enterprises, Inc. NasdaqGS:DXPE $896.66 $676.10 $1,054.19 $63.89 $36.40 0.89x 26.77x 14.63x 0.78x 11.35x
HD Supply Holdings, Inc. NasdaqGS:HDS $8,582.01 $7,039.01 $5,121.00 $687.00 $614.00 1.68x 13.98x 12.49x 1.54x 10.76x
Kaman Corporation NYSE:KAMN $2,096.76 $1,726.43 $1,833.30 $171.88 $132.71 1.16x 17.26x 13.05x 1.22x 12.97x
MRC Global Inc. NYSE:MRC $2,349.54 $1,516.54 $3,794.00 $151.00 $83.00 0.64x 35.60x 17.67x 0.65x 9.71x
WESCO International, Inc. NYSE:WCC $4,184.52 $2,919.87 $7,900.35 $381.53 $327.50 0.54x 13.04x 11.16x 0.48x 9.23x
W.W. Grainger, Inc. NYSE:GWW $17,976.31 $15,823.24 $10,650.13 $1,486.17 $1,220.42 1.72x 15.95x 12.92x 1.72x 12.71x
Median $3,047.02 $2,819.38 $3,794.00 $252.72 $208.74 1.12x 15.95x 13.05x 1.04x 10.95x
Freight/Logistics
Air Transport Services Group, Inc. NasdaqGS:ATSG $1,910.85 $1,373.43 $1,033.32 $267.65 $105.23 1.79x 21.19x 7.74x 2.02x 5.62x
C.H. Robinson Worldwide, Inc. NasdaqGS:CHRW $14,226.97 $13,095.86 $15,379.58 $868.40 $787.50 0.96x 18.35x 16.66x 0.79x 13.44x
FedEx Corporation NYSE:FDX $78,952.04 $64,161.04 $63,864.00 $8,388.00 $5,341.00 1.24x 14.78x 9.41x 1.20x 8.31x
Radiant Logistics, Inc. AMEX:RLGT $234.27 $190.95 $810.44 $23.90 $9.81 0.30x 20.34x 9.38x 0.26x 7.24x
United Parcel Service, Inc. NYSE:UPS $110,433.12 $90,156.12 $67,475.00 $9,756.00 $7,432.00 1.68x 14.67x 11.26x 1.63x 11.14x
Median $14,226.97 $13,095.86 $15,379.58 $868.40 $787.50 1.24x 18.35x 9.41x 1.20x 8.31x
Industrial Conglomerates
Carlisle Companies Incorporated NYSE:CSL $7,614.53 $6,407.93 $4,300.60 $719.00 $542.20 1.86x 14.00x 10.73x 1.60x 9.39x
Danaher Corporation NYSE:DHR $78,285.92 $68,384.52 $18,819.40 $4,559.80 $3,306.30 4.27x 24.62x 17.72x 4.00x 16.63x
General Electric Company NYSE:GE $254,561.75 $117,053.75 $115,450.00 $5,526.00 -$2,014.00 2.10x NM 49.58x 2.22x 15.51x
Raven Industries, Inc. NasdaqGS:RAVN $1,217.05 $1,257.58 $377.32 $74.69 $59.89 3.23x 20.36x 16.32x 3.36x 16.69x
Roper Technologies, Inc. NYSE:ROP $33,346.59 $28,862.36 $4,723.67 $1,599.61 $1,252.14 7.24x 27.55x 21.44x 6.45x 18.87x
Median $33,346.59 $28,862.36 $4,723.67 $1,599.61 $542.20 3.23x 22.49x 17.72x 3.36x 16.63x
Source: Capital IQ
March 201812
Industry / Last Twelve Months Next Twelve Months
Company Name Ticker TEV (mm)Market Cap
(mm) Rev (mm)EBITDA (mm) EBIT (mm) TEV/Rev TEV/EBIT TEV/EBITDA Forward TEV/Rev
Forward TEV/EBITDA
Public Sector Valuations Industrials
Machinery
AGCO Corporation NYSE:AGCO $6,573.39 $5,157.09 $8,686.40 $737.10 $450.10 0.79x 14.49x 8.96x 0.77x 8.60x
Caterpillar Inc. NYSE:CAT $115,646.09 $88,078.09 $45,696.00 $9,500.00 $6,652.00 2.54x 20.68x 13.66x 2.21x 11.68x
Dover Corporation NYSE:DOV $17,996.38 $15,182.54 $7,938.64 $1,421.10 $1,024.44 2.30x 18.10x 12.96x 2.15x 11.97x
Deere & Company NYSE:DE $88,423.93 $50,290.73 $27,161.20 $5,092.50 $3,447.50 2.91x 25.78x 17.43x 2.52x 16.94x
Graco Inc. NYSE:GGG $7,858.76 $7,729.81 $1,540.50 $432.85 $385.71 5.33x 21.80x 19.36x 4.80x 15.85x
ITT Inc. NYSE:ITT $4,103.84 $4,320.04 $2,648.80 $437.00 $328.90 1.59x 13.17x 9.84x 1.62x 9.18x
Snap-on Incorporated NYSE:SNA $9,497.68 $8,367.38 $3,735.30 $1,018.90 $939.50 2.37x 10.23x 9.43x 2.50x 8.97x
Stanley Black & Decker, Inc. NYSE:SWK $27,612.58 $23,609.88 $13,100.20 $2,107.10 $1,624.30 2.17x 17.08x 13.29x 1.92x 11.24x
The Toro Company NYSE:TTC $6,716.70 $6,620.97 $2,537.58 $425.16 $361.46 2.65x 18.08x 15.44x 2.45x 14.08x
Median $9,497.68 $8,367.38 $7,938.64 $1,018.90 $939.50 2.37x 18.08x 13.29x 2.21x 11.68x
Paper/Plastics/Packaging
Ball Corporation NYSE:BLL $20,548.41 $13,920.41 $11,295.00 $1,833.00 $1,107.00 1.87x 18.87x 11.52x 1.75x 10.42x
Berry Global Group, Inc. NYSE:BERY $12,524.14 $7,187.14 $7,530.00 $1,333.00 $802.00 1.70x 16.06x 9.56x 1.51x 8.31x
Domtar Corporation NYSE:UFS $3,658.07 $2,667.07 $5,200.00 $600.00 $280.00 0.71x 14.87x 6.45x 0.72x 5.41x
International Paper Company NYSE:IP $32,221.41 $22,063.41 $22,232.00 $3,440.00 $2,018.00 1.48x 15.83x 9.32x 1.42x 7.44x
Myers Industries, Inc. NYSE:MYE $793.79 $645.27 $563.04 $59.60 $33.58 1.45x 26.08x 13.74x 1.33x 10.68x
Trinseo S.A. NYSE:TSE $3,972.42 $3,204.92 $4,465.20 $522.20 $404.10 0.89x 7.16x 5.97x 0.91x 6.05x
Median $8,248.28 $5,196.03 $6,365.00 $966.50 $603.05 1.47x 15.95x 9.44x 1.38x 7.88x
Test/Measurement
Badger Meter, Inc. NYSE:BMI $1,405.99 $1,372.60 $405.88 $77.99 $52.75 3.49x 25.01x 17.44x 3.02x 16.36x
Luna Innovations Incorporated NasdaqCM:LUNA $57.45 $91.87 $48.34 $1.96 $0.78 1.24x NM 51.51x 0.00x 0.00x
MTS Systems Corporation NasdaqGS:MTSC $1,261.29 $918.34 $780.74 $99.37 $64.22 1.61x 18.41x 12.19x 1.54x 9.46x
National Instruments Corporation NasdaqGS:NATI $6,222.97 $6,635.03 $1,301.18 $216.98 $168.41 4.83x 38.09x 29.07x 3.68x 22.70x
Sensata Technologies Holding PLC NYSE:ST $11,400.50 $8,883.32 $3,385.76 $853.65 $596.73 3.45x 19.73x 13.56x 3.20x 12.04x
Median $1,405.99 $1,372.60 $780.74 $99.37 $64.22 3.45x 22.37x 17.44x 3.02x 12.04x
Source: Capital IQ

March 2018
1.9x 1.4x 1.6x 1.4x 1.2x 1.6x 1.4x
11.5x10.5x 10.0x
10.9x
7.5x
10.5x11.9x
0x
2x
4x
6x
8x
10x
12x
14x
2012 2013 2014 2015 2016 2017 2018
Transaction Multiples
TEV/REV TEV/EBITDA
12651097 1193
1079 1027 971
277
0
200
400
600
800
1000
1200
1400
2012 2013 2014 2015 2016 2017 2018YTD
Tran
sact
ion
Co
un
t
Yearly Transaction Overview
241 221 218245
219 200246
155201 204 194 190
226
4046 40
2825 50
44
8851 38 43 50
51
0
50
100
150
200
250
300
350
Q12015
Q22015
Q32015
Q42015
Q12016
Q22016
Q32016
Q42016
Q12017
Q22017
Q32017
Q42017
Q12018
Tran
sact
ion
Co
un
t
Quarterly M&A Transactions
Strategic Financial
13
Mergers & Acquisitions OverviewIndustrials
Source: Capital IQ
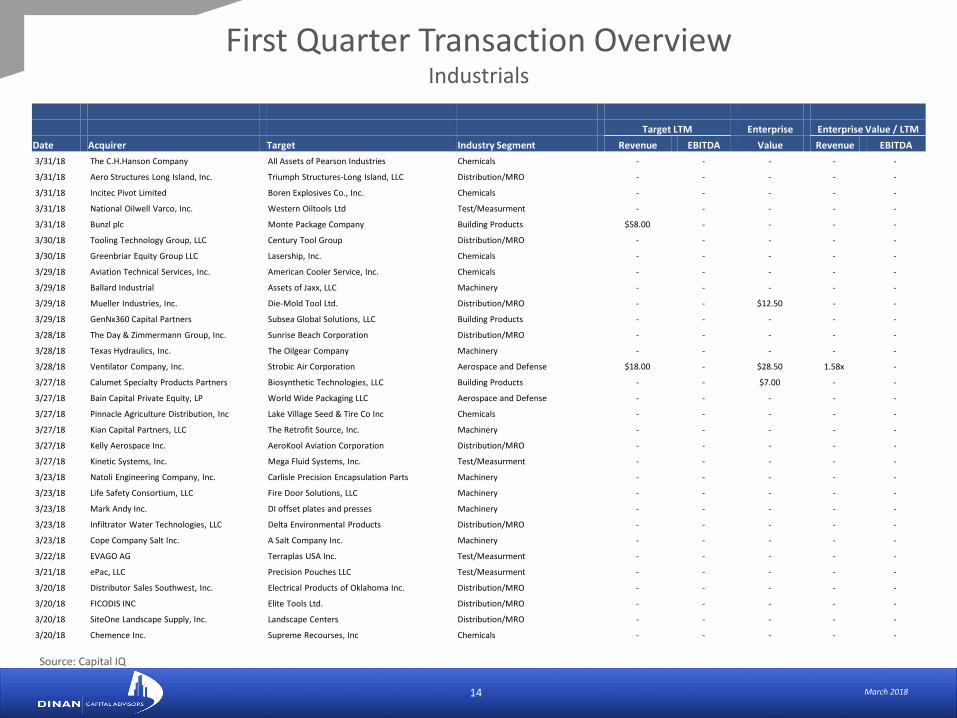
March 201814
Target LTM Enterprise Enterprise Value / LTM
Date Acquirer Target Industry Segment Revenue EBITDA Value Revenue EBITDA
First Quarter Transaction OverviewIndustrials
3/31/18 The C.H.Hanson Company All Assets of Pearson Industries Chemicals - - - - -
3/31/18 Aero Structures Long Island, Inc. Triumph Structures-Long Island, LLC Distribution/MRO - - - - -
3/31/18 Incitec Pivot Limited Boren Explosives Co., Inc. Chemicals - - - - -
3/31/18 National Oilwell Varco, Inc. Western Oiltools Ltd Test/Measurment - - - - -
3/31/18 Bunzl plc Monte Package Company Building Products $58.00 - - - -
3/30/18 Tooling Technology Group, LLC Century Tool Group Distribution/MRO - - - - -
3/30/18 Greenbriar Equity Group LLC Lasership, Inc. Chemicals - - - - -
3/29/18 Aviation Technical Services, Inc. American Cooler Service, Inc. Chemicals - - - - -
3/29/18 Ballard Industrial Assets of Jaxx, LLC Machinery - - - - -
3/29/18 Mueller Industries, Inc. Die-Mold Tool Ltd. Distribution/MRO - - $12.50 - -
3/29/18 GenNx360 Capital Partners Subsea Global Solutions, LLC Building Products - - - - -
3/28/18 The Day & Zimmermann Group, Inc. Sunrise Beach Corporation Distribution/MRO - - - - -
3/28/18 Texas Hydraulics, Inc. The Oilgear Company Machinery - - - - -
3/28/18 Ventilator Company, Inc. Strobic Air Corporation Aerospace and Defense $18.00 - $28.50 1.58x -
3/27/18 Calumet Specialty Products Partners Biosynthetic Technologies, LLC Building Products - - $7.00 - -
3/27/18 Bain Capital Private Equity, LP World Wide Packaging LLC Aerospace and Defense - - - - -
3/27/18 Pinnacle Agriculture Distribution, Inc Lake Village Seed & Tire Co Inc Chemicals - - - - -
3/27/18 Kian Capital Partners, LLC The Retrofit Source, Inc. Machinery - - - - -
3/27/18 Kelly Aerospace Inc. AeroKool Aviation Corporation Distribution/MRO - - - - -
3/27/18 Kinetic Systems, Inc. Mega Fluid Systems, Inc. Test/Measurment - - - - -
3/23/18 Natoli Engineering Company, Inc. Carlisle Precision Encapsulation Parts Machinery - - - - -
3/23/18 Life Safety Consortium, LLC Fire Door Solutions, LLC Machinery - - - - -
3/23/18 Mark Andy Inc. DI offset plates and presses Machinery - - - - -
3/23/18 Infiltrator Water Technologies, LLC Delta Environmental Products Distribution/MRO - - - - -
3/23/18 Cope Company Salt Inc. A Salt Company Inc. Machinery - - - - -
3/22/18 EVAGO AG Terraplas USA Inc. Test/Measurment - - - - -
3/21/18 ePac, LLC Precision Pouches LLC Test/Measurment - - - - -
3/20/18 Distributor Sales Southwest, Inc. Electrical Products of Oklahoma Inc. Distribution/MRO - - - - -
3/20/18 FICODIS INC Elite Tools Ltd. Distribution/MRO - - - - -
3/20/18 SiteOne Landscape Supply, Inc. Landscape Centers Distribution/MRO - - - - -
3/20/18 Chemence Inc. Supreme Recourses, Inc Chemicals - - - - -
Source: Capital IQ

March 201815
Target LTM Enterprise Enterprise Value / LTM
Date Acquirer Target Industry Segment Revenue EBITDA Value Revenue EBITDA
First Quarter Transaction OverviewIndustrials
3/20/18 Autajon C.S. Thoro Packaging Inc. Paper/Plastics/Packaging $37.00 - - - -
3/20/18 The Toro Company L.T. Rich Products, Inc. Chemicals - - - - -
3/20/18 L&W Supply Corporation Assets of Wright Brothers Supply Chemicals - - - - -
3/19/18 PriceSmart, Inc. Aeropost International Services, Inc. Distribution/MRO - - - - -
3/19/18 Harvey Industries, Inc. Thermo-Tech Windows and Doors LLC Chemicals - - - - -
3/19/18 Harbour Group Nationwide Industries Inc. Chemicals - - - - -
3/19/18 GAL Manufacturing Company, LLC Assets of Bore-Max Corporation Distribution/MRO - - - - -
3/19/18 Duncan Aviation, Inc. Capital Avionics Inc. Chemicals - - - - -
3/19/18 Liberty Metal Recycling UK Ltd Export Metals, LLC Distribution/MRO - - - - -
3/19/18 TransDigm Group Incorporated Kirkhill-TA Co. Freight/Logistics $90.00 - $50.00 0.56x -
3/19/18 Private Investor Carolina Precision Fibers Inc Distribution/MRO - - - - -
3/16/18 Fortress Global Enterprises Inc. S2G Biochemicals Inc. Machinery - - $1.91 - -
3/16/18 MFG Chemical, Inc. Gulf Bayport Chemicals L.P. Machinery - - - - -
3/15/18 North Coast Lift Truck, Inc. Ackerman Industrial Equipment, Inc. Machinery - - - - -
3/15/18 Babcock Power Inc. Geo-Synthetics, LLC Distribution/MRO - - - - -
3/15/18 Duport Capital Ltd. MPT Mustard Products Machinery - - - - -
3/15/18 St. George Trucking & Warehouse Inc. Freight Force, Inc. Chemicals - - - - -
3/14/18 Doskocil Manufacturing Company, Inc. Gamma2 Inc. Aerospace and Defense - - - - -
3/14/18 Smarte Carte, Inc. Aviation Mobility, LLC Distribution/MRO - - - - -
3/13/18 Gray Matter Systems LLC Technical Marketing Manufacturing, Inc. Building Products - - - - -
3/13/18 Arm & Hammer Animal Nutrition Passport Food Safety Solutions, Inc. Paper/Plastics/Packaging - - - - -
3/13/18 Evoqua Water Technologies Corp. Pacific Ozone Technology, Inc. Building Products - - - - -
3/13/18 Tenth Avenue Commerce, LLC Horsemen's Pride, Inc. Chemicals - - - - -
3/13/18 LBC Express Holdings, Inc. LBC Mabuhay Saipan, Inc. Machinery - - $0.21 - -
3/12/18 Duravant LLC QC Industries, LLC Chemicals - - - - -
3/9/18 Sun Chemical Corporation PPG Industries, Inc. Chemicals - - - - -
3/9/18 M-D Building Products, Inc. RCR International Inc. Distribution/MRO - - - - -
3/8/18 ECMD, Inc. Klumb Lumber Company, Inc. Machinery - - - - -
3/8/18 Industrial Supply Solutions, Inc. Tri-Flex Hose And Fitting Co., Inc. Machinery - - - - -
3/8/18 Tyman plc Ashland Products Inc. Machinery $67.20 $11.20 $101.00 1.50x 9.02x
3/8/18 Transcontinental Inc. Multifilm Packaging Corporation Chemicals - - - - -
Source: Capital IQ
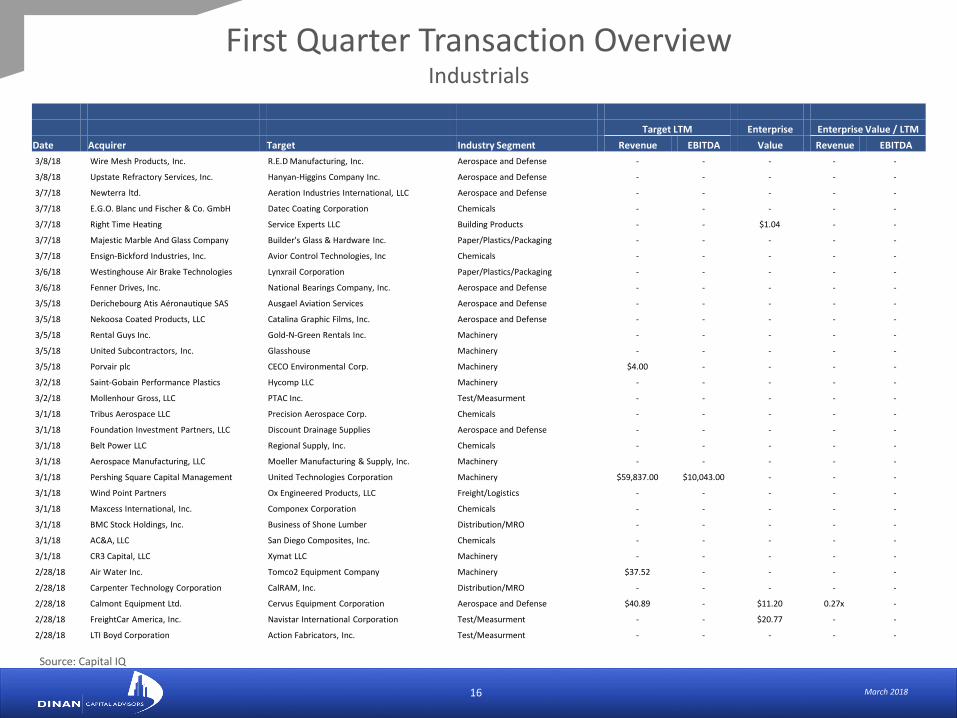
March 201816
Target LTM Enterprise Enterprise Value / LTM
Date Acquirer Target Industry Segment Revenue EBITDA Value Revenue EBITDA
First Quarter Transaction OverviewIndustrials
3/8/18 Wire Mesh Products, Inc. R.E.D Manufacturing, Inc. Aerospace and Defense - - - - -
3/8/18 Upstate Refractory Services, Inc. Hanyan-Higgins Company Inc. Aerospace and Defense - - - - -
3/7/18 Newterra ltd. Aeration Industries International, LLC Aerospace and Defense - - - - -
3/7/18 E.G.O. Blanc und Fischer & Co. GmbH Datec Coating Corporation Chemicals - - - - -
3/7/18 Right Time Heating Service Experts LLC Building Products - - $1.04 - -
3/7/18 Majestic Marble And Glass Company Builder's Glass & Hardware Inc. Paper/Plastics/Packaging - - - - -
3/7/18 Ensign-Bickford Industries, Inc. Avior Control Technologies, Inc Chemicals - - - - -
3/6/18 Westinghouse Air Brake Technologies Lynxrail Corporation Paper/Plastics/Packaging - - - - -
3/6/18 Fenner Drives, Inc. National Bearings Company, Inc. Aerospace and Defense - - - - -
3/5/18 Derichebourg Atis Aéronautique SAS Ausgael Aviation Services Aerospace and Defense - - - - -
3/5/18 Nekoosa Coated Products, LLC Catalina Graphic Films, Inc. Aerospace and Defense - - - - -
3/5/18 Rental Guys Inc. Gold-N-Green Rentals Inc. Machinery - - - - -
3/5/18 United Subcontractors, Inc. Glasshouse Machinery - - - - -
3/5/18 Porvair plc CECO Environmental Corp. Machinery $4.00 - - - -
3/2/18 Saint-Gobain Performance Plastics Hycomp LLC Machinery - - - - -
3/2/18 Mollenhour Gross, LLC PTAC Inc. Test/Measurment - - - - -
3/1/18 Tribus Aerospace LLC Precision Aerospace Corp. Chemicals - - - - -
3/1/18 Foundation Investment Partners, LLC Discount Drainage Supplies Aerospace and Defense - - - - -
3/1/18 Belt Power LLC Regional Supply, Inc. Chemicals - - - - -
3/1/18 Aerospace Manufacturing, LLC Moeller Manufacturing & Supply, Inc. Machinery - - - - -
3/1/18 Pershing Square Capital Management United Technologies Corporation Machinery $59,837.00 $10,043.00 - - -
3/1/18 Wind Point Partners Ox Engineered Products, LLC Freight/Logistics - - - - -
3/1/18 Maxcess International, Inc. Componex Corporation Chemicals - - - - -
3/1/18 BMC Stock Holdings, Inc. Business of Shone Lumber Distribution/MRO - - - - -
3/1/18 AC&A, LLC San Diego Composites, Inc. Chemicals - - - - -
3/1/18 CR3 Capital, LLC Xymat LLC Machinery - - - - -
2/28/18 Air Water Inc. Tomco2 Equipment Company Machinery $37.52 - - - -
2/28/18 Carpenter Technology Corporation CalRAM, Inc. Distribution/MRO - - - - -
2/28/18 Calmont Equipment Ltd. Cervus Equipment Corporation Aerospace and Defense $40.89 - $11.20 0.27x -
2/28/18 FreightCar America, Inc. Navistar International Corporation Test/Measurment - - $20.77 - -
2/28/18 LTI Boyd Corporation Action Fabricators, Inc. Test/Measurment - - - - -
Source: Capital IQ

March 201817
Target LTM Enterprise Enterprise Value / LTM
Date Acquirer Target Industry Segment Revenue EBITDA Value Revenue EBITDA
First Quarter Transaction OverviewIndustrials
2/28/18 Private Investor Leading Edge Avionics, Inc. Chemicals - - - - -
2/28/18 Broco Rankin Chamberlain Security Chemicals - - - - -
2/28/18 Midwest Industrial Rubber, Inc. Conveyor Belting Supply Co. Paper/Plastics/Packaging - - - - -
2/28/18 VanZandt Controls, LLC Stockton Valve Products Freight/Logistics - - - - -
2/28/18 Modern Aviation Inc. Air Wilmington, Inc. Chemicals - - - - -
2/27/18 Pearson Packaging Systems, Inc. Flexicell, Inc. Machinery - - - - -
2/27/18 Patriot Defense Group, LLC Innovative Logistics, LLC Test/Measurment - - - - -
2/26/18 WPX Energy, Inc. WhiteWater Midstream LLC Distribution/MRO - - - - -
2/26/18 Delmar International Inc. AIRTRADES Freight Forwarders Inc. Chemicals - - - - -
2/26/18 Private Investor Bridger Rail Shipping, LLC Distribution/MRO - - $47.00 - -
2/26/18 API Group plc DUNMORE Corporation Test/Measurment - - - - -
2/23/18 Pack Logix, Inc. Spectrum Corporation Machinery - - - - -
2/23/18 Woodgreen Advisors Prototype Composites LLC Distribution/MRO - - - - -
2/23/18 Air Technologies Compressed Air Systems, LLC Machinery - - - - -
2/23/18 Metal Powder Products Company NetShape Technologies, Inc. Paper/Plastics/Packaging - - - - -
2/23/18 Huntington Foam LLC Trimtec Systems, LTD Freight/Logistics - - - - -
2/22/18 Novacap Investments, Inc. Mailhot Industries, Inc. Test/Measurment - - - - -
2/22/18 SMG Indium Resources Ltd. RigHands Product Line Distribution/MRO - - - - -
2/22/18 HEB Grocery Company, LP NeighborFavor, Inc. Paper/Plastics/Packaging - - - - -
2/21/18 Architectural Surfaces Group Bedrock International, LLC Building Products - - - - -
2/21/18 GrowGeneration Corp. Groco Enterprises LLC Paper/Plastics/Packaging - - - - -
2/20/18 Aggreko Plc A Contact Electric Supply, Inc. Aerospace and Defense - - - - -
2/20/18 Allegion plc Aurora Systems Inc. Machinery $18.00 - - - -
2/19/18 Spectrum Plastics Group Apex Resource Technologies, Inc. Machinery - - - - -
2/16/18 M&Q Holdings LLC Flavorseal LLC Distribution/MRO - - - - -
2/16/18 Blue Wolf Capital Partners LLC Petrosmith LLC Machinery - - - - -
2/15/18 SiteOne Landscape Supply, Inc. Atlantic Irrigation Specialties Inc. Distribution/MRO - - - - -
2/15/18 Bridgepoint Advisers Limited Safety Technology Holdings, Inc. Machinery - - - - -
2/15/18 Golden West Packaging Group LLC Fleetwood-Fibre Packaging Test/Measurment - - - - -
2/15/18 2618249 Ontario Corp. TJR Coatings Inc. Distribution/MRO - - - - -
2/15/18 Oatey Company, Inc. G.F. Thompson Co. Ltd. Machinery - - - - -
Source: Capital IQ

March 201818
Target LTM Enterprise Enterprise Value / LTM
Date Acquirer Target Industry Segment Revenue EBITDA Value Revenue EBITDA
First Quarter Transaction OverviewIndustrials
2/15/18 Anton Paar GmbH Quantachrome Corporation Aerospace and Defense - - - - -
2/15/18 Foley, Inc. Giles & Ransome, Inc. Freight/Logistics - - - - -
2/14/18 Frank P. Langley Co. Inc. Herline Technologies, Inc. Chemicals - - - - -
2/14/18 CONE Midstream DevCo I LP Shirley-Pennsboro System Aerospace and Defense - - $278.95 - -
2/13/18 SMT Scharf Corporation RDH Mining Equipment Ltd. Building Products $11.56 - $6.38 0.55x -
2/12/18 Rexam Delta Inc. Grand Packaging, Inc. Paper/Plastics/Packaging - - - - -
2/12/18 Asendia Management SAS Globegistics Inc. Distribution/MRO - - - - -
2/12/18 H.I.G. Capital, LLC Wastequip, LLC Building Products - - - - -
2/12/18 TSI Incorporated 3M Company Machinery - - - - -
2/9/18 Alderman Holdings, LLC Dal Industries, Inc. Machinery - - - - -
2/9/18 Private Investor Paper Systems, Incorporated Chemicals - - - - -
2/9/18 Sepro Mineral Systems Corp. Carminex Systems Inc. Chemicals - - - - -
2/9/18 Leggett & Platt, Incorporated Precision Hydraulic Cylinders Inc. Machinery $81.00 - $85.00 1.05x -
2/8/18 Wellspring Capital Management LLC SupplyOne, Inc. Test/Measurment - - - - -
2/8/18 Thrivent Financial for Lutherans, Inc. Airtech, Inc. Machinery - - - - -
2/8/18 Private Investor EOM Offshore LLC Aerospace and Defense - - $2.65 - -
2/8/18 Foundation Building Materials, Inc. RM Supply Inc. Paper/Plastics/Packaging - - - - -
2/8/18 Foundation Building Materials, Inc. ArmCom Distributing Company Machinery - - - - -
2/7/18 Pacific Architects Incorporated Macfadden & Associates, Inc. Distribution/MRO - - - - -
2/7/18 BaleForce Recycling Equipment Inc. Ready Machinery & Equipment Inc Distribution/MRO - - - - -
2/7/18 Air Filtration Holdings, LLC RoboVent, Inc. Aerospace and Defense - - - - -
2/6/18 AMETEK, Inc. FMH Aerospace Corp. Distribution/MRO $50.00 - $235.00 4.70x -
2/6/18 The Jordan Company, L.P. Carlisle FoodService Products, Inc Machinery $320.00 - $750.00 2.34x -
2/6/18 Foley Products Company Forterra, Inc. Building Products - - - - -
2/6/18 Clock Spring Company, Inc. CTI Services LLC Aerospace and Defense - - - - -
2/5/18 Centurion Group Ltd. Oil Patch Group, Inc. Machinery - - - - -
2/5/18 The NEFCO Corporation Contractors & Industrial Supply, Inc. Distribution/MRO - - - - -
2/5/18 A & M Industries Inc Industrial Tool Specialist, Inc. Machinery - - - - -
2/5/18 TerraCycle US Inc. Air Cycle Corporation Distribution/MRO - - - - -
2/2/18 Xylem Inc. EmNet, LLC Distribution/MRO - - - - -
2/2/18 SupplyOne, Inc. Omni Packaging Company LLC Distribution/MRO - - - - -
Source: Capital IQ

March 201819
Target LTM Enterprise Enterprise Value / LTM
Date Acquirer Target Industry Segment Revenue EBITDA Value Revenue EBITDA
First Quarter Transaction OverviewIndustrials
2/2/18 Triad Technologies, LLC Cincinnati Hose & Fittings, Inc. Distribution/MRO - - - - -
2/2/18 AEA Investors LP Spectrum Plastics Group Machinery - - - - -
2/1/18 Weekes Forest Products, Inc. Snavely Forest Products, Inc. Distribution/MRO - - - - -
2/1/18 Albis Plastics Corporation Albis Barnet Polymers LLC Distribution/MRO - - - - -
2/1/18 The Delaney Co. Bravura Brass Machinery - - - - -
2/1/18 Xitron, Inc. Rti-Rips.com Chemicals - - - - -
2/1/18 Kaneka Aerospace, LLC Henkel Corporation Machinery - - - - -
2/1/18 Sierra Corporation Burke Industrial Coatings Building Products - - - - -
2/1/18 Leonard Green & Partners, L.P. ProMach Inc. Aerospace and Defense - - - - -
2/1/18 Burke E. Porter Machinery Company Titan, Inc. Paper/Plastics/Packaging - - - - -
2/1/18 Imperial Lubes & Supply, LLC PLC Corporation Aerospace and Defense - - - - -
2/1/18 Consolidated Electrical Distributors Electrical Engineering Company Distribution/MRO - - - - -
2/1/18 TerraVest Capital Inc. MaXfield Group Inc. Aerospace and Defense - - $13.34 - -
2/1/18 Opus Inspection, Inc. Gordon-Darby, Inc. Aerospace and Defense $35.00 - $55.00 1.57x -
2/1/18 Duravant LLC Key Technology, Inc. Paper/Plastics/Packaging $143.82 $9.89 $172.07 1.20x 17.40x
1/31/18 Hudson Bearings LLC Tool Tech Inc. Distribution/MRO - - - - -
1/31/18 Penn Engineering & Manufacturing Phillips Corporation Machinery - - - - -
1/31/18 Alpha Precision Group, Inc. Mercury Manufacturing Company Building Products - - - - -
1/31/18 Imperial Bag & Paper Co., LLC PCA Industrial & Paper Supplies, Inc. Distribution/MRO - - - - -
1/31/18 Financiere GMSL Inc. Earth Alive Clean Technologies Inc. Distribution/MRO $0.36 - $9.00 24.97x -
1/31/18 Cortec Group Inc Window Nation, Inc. Aerospace and Defense - - - - -
1/31/18 M-D Building Products, Inc. Morse Industries, Inc. Freight/Logistics - - - - -
1/31/18 Entegris, Inc. Particle Sizing Systems, LLC Distribution/MRO - - $37.00 - -
1/31/18 AIV Inc. Zenith Supply Company, Inc. Chemicals - - - - -
1/31/18 Private Investor DECO, Inc. Distribution/MRO - - - - -
1/30/18 Armada Group USA, Inc. Zero Nox Inc. Chemicals - - - - -
1/30/18 Loomis AB (publ) Sequel International Logistics Inc. Chemicals $2.60 - $2.00 0.77x -
1/29/18 Parksite Inc. Atlantic Plywood Corporation Distribution/MRO - - - - -
1/29/18 Sigma AgriScience, LLC Am-Ag, LLC Freight/Logistics - - - - -
1/29/18 Slocomb Windows and Doors, Inc. Lockheed Window Corp. Chemicals - - - - -
1/29/18 Ohio Awning & Manufacturing Co., Inc. The Canvas Exchange Inc. Test/Measurment - - - - -
Source: Capital IQ
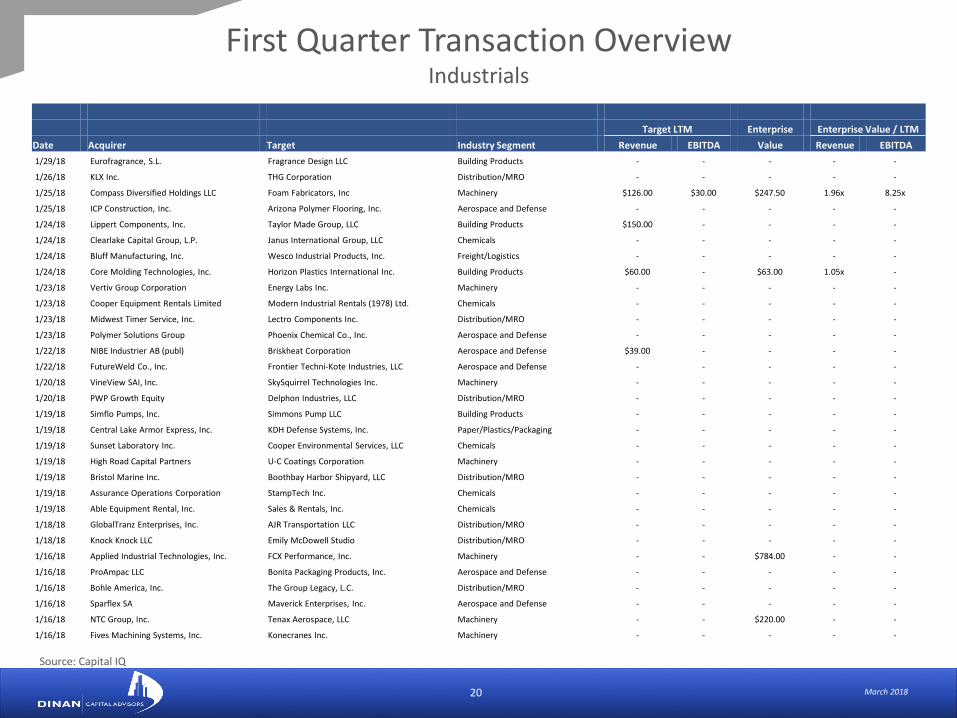
March 201820
Target LTM Enterprise Enterprise Value / LTM
Date Acquirer Target Industry Segment Revenue EBITDA Value Revenue EBITDA
First Quarter Transaction OverviewIndustrials
1/29/18 Eurofragrance, S.L. Fragrance Design LLC Building Products - - - - -
1/26/18 KLX Inc. THG Corporation Distribution/MRO - - - - -
1/25/18 Compass Diversified Holdings LLC Foam Fabricators, Inc Machinery $126.00 $30.00 $247.50 1.96x 8.25x
1/25/18 ICP Construction, Inc. Arizona Polymer Flooring, Inc. Aerospace and Defense - - - - -
1/24/18 Lippert Components, Inc. Taylor Made Group, LLC Building Products $150.00 - - - -
1/24/18 Clearlake Capital Group, L.P. Janus International Group, LLC Chemicals - - - - -
1/24/18 Bluff Manufacturing, Inc. Wesco Industrial Products, Inc. Freight/Logistics - - - - -
1/24/18 Core Molding Technologies, Inc. Horizon Plastics International Inc. Building Products $60.00 - $63.00 1.05x -
1/23/18 Vertiv Group Corporation Energy Labs Inc. Machinery - - - - -
1/23/18 Cooper Equipment Rentals Limited Modern Industrial Rentals (1978) Ltd. Chemicals - - - - -
1/23/18 Midwest Timer Service, Inc. Lectro Components Inc. Distribution/MRO - - - - -
1/23/18 Polymer Solutions Group Phoenix Chemical Co., Inc. Aerospace and Defense - - - - -
1/22/18 NIBE Industrier AB (publ) Briskheat Corporation Aerospace and Defense $39.00 - - - -
1/22/18 FutureWeld Co., Inc. Frontier Techni-Kote Industries, LLC Aerospace and Defense - - - - -
1/20/18 VineView SAI, Inc. SkySquirrel Technologies Inc. Machinery - - - - -
1/20/18 PWP Growth Equity Delphon Industries, LLC Distribution/MRO - - - - -
1/19/18 Simflo Pumps, Inc. Simmons Pump LLC Building Products - - - - -
1/19/18 Central Lake Armor Express, Inc. KDH Defense Systems, Inc. Paper/Plastics/Packaging - - - - -
1/19/18 Sunset Laboratory Inc. Cooper Environmental Services, LLC Chemicals - - - - -
1/19/18 High Road Capital Partners U-C Coatings Corporation Machinery - - - - -
1/19/18 Bristol Marine Inc. Boothbay Harbor Shipyard, LLC Distribution/MRO - - - - -
1/19/18 Assurance Operations Corporation StampTech Inc. Chemicals - - - - -
1/19/18 Able Equipment Rental, Inc. Sales & Rentals, Inc. Chemicals - - - - -
1/18/18 GlobalTranz Enterprises, Inc. AJR Transportation LLC Distribution/MRO - - - - -
1/18/18 Knock Knock LLC Emily McDowell Studio Distribution/MRO - - - - -
1/16/18 Applied Industrial Technologies, Inc. FCX Performance, Inc. Machinery - - $784.00 - -
1/16/18 ProAmpac LLC Bonita Packaging Products, Inc. Aerospace and Defense - - - - -
1/16/18 Bohle America, Inc. The Group Legacy, L.C. Distribution/MRO - - - - -
1/16/18 Sparflex SA Maverick Enterprises, Inc. Aerospace and Defense - - - - -
1/16/18 NTC Group, Inc. Tenax Aerospace, LLC Machinery - - $220.00 - -
1/16/18 Fives Machining Systems, Inc. Konecranes Inc. Machinery - - - - -
Source: Capital IQ
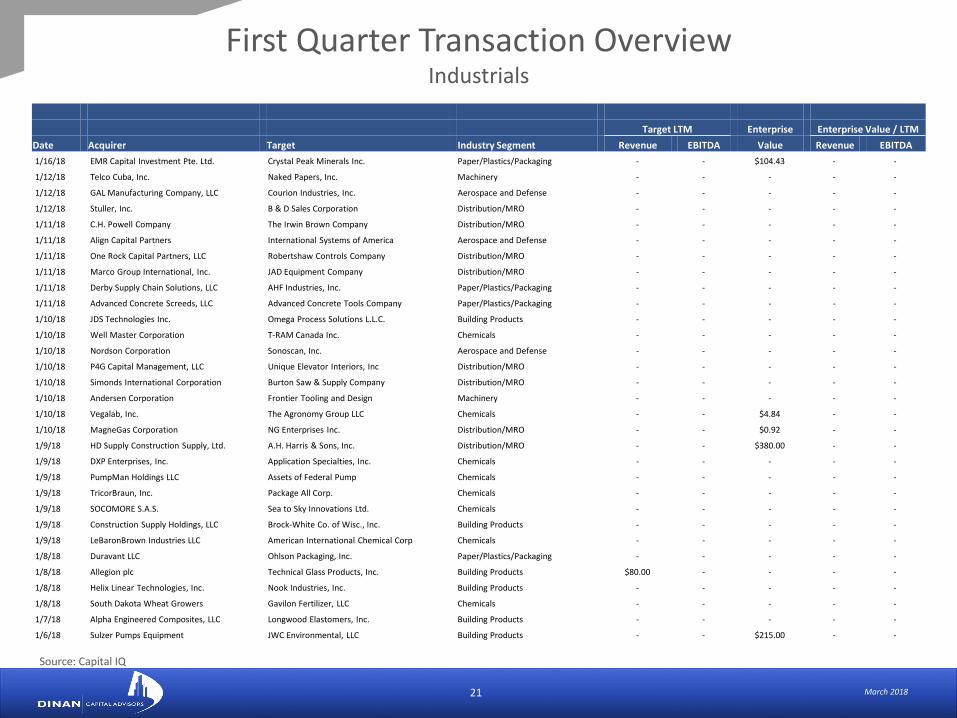
March 201821
Target LTM Enterprise Enterprise Value / LTM
Date Acquirer Target Industry Segment Revenue EBITDA Value Revenue EBITDA
First Quarter Transaction OverviewIndustrials
1/16/18 EMR Capital Investment Pte. Ltd. Crystal Peak Minerals Inc. Paper/Plastics/Packaging - - $104.43 - -
1/12/18 Telco Cuba, Inc. Naked Papers, Inc. Machinery - - - - -
1/12/18 GAL Manufacturing Company, LLC Courion Industries, Inc. Aerospace and Defense - - - - -
1/12/18 Stuller, Inc. B & D Sales Corporation Distribution/MRO - - - - -
1/11/18 C.H. Powell Company The Irwin Brown Company Distribution/MRO - - - - -
1/11/18 Align Capital Partners International Systems of America Aerospace and Defense - - - - -
1/11/18 One Rock Capital Partners, LLC Robertshaw Controls Company Distribution/MRO - - - - -
1/11/18 Marco Group International, Inc. JAD Equipment Company Distribution/MRO - - - - -
1/11/18 Derby Supply Chain Solutions, LLC AHF Industries, Inc. Paper/Plastics/Packaging - - - - -
1/11/18 Advanced Concrete Screeds, LLC Advanced Concrete Tools Company Paper/Plastics/Packaging - - - - -
1/10/18 JDS Technologies Inc. Omega Process Solutions L.L.C. Building Products - - - - -
1/10/18 Well Master Corporation T-RAM Canada Inc. Chemicals - - - - -
1/10/18 Nordson Corporation Sonoscan, Inc. Aerospace and Defense - - - - -
1/10/18 P4G Capital Management, LLC Unique Elevator Interiors, Inc Distribution/MRO - - - - -
1/10/18 Simonds International Corporation Burton Saw & Supply Company Distribution/MRO - - - - -
1/10/18 Andersen Corporation Frontier Tooling and Design Machinery - - - - -
1/10/18 Vegalab, Inc. The Agronomy Group LLC Chemicals - - $4.84 - -
1/10/18 MagneGas Corporation NG Enterprises Inc. Distribution/MRO - - $0.92 - -
1/9/18 HD Supply Construction Supply, Ltd. A.H. Harris & Sons, Inc. Distribution/MRO - - $380.00 - -
1/9/18 DXP Enterprises, Inc. Application Specialties, Inc. Chemicals - - - - -
1/9/18 PumpMan Holdings LLC Assets of Federal Pump Chemicals - - - - -
1/9/18 TricorBraun, Inc. Package All Corp. Chemicals - - - - -
1/9/18 SOCOMORE S.A.S. Sea to Sky Innovations Ltd. Chemicals - - - - -
1/9/18 Construction Supply Holdings, LLC Brock-White Co. of Wisc., Inc. Building Products - - - - -
1/9/18 LeBaronBrown Industries LLC American International Chemical Corp Chemicals - - - - -
1/8/18 Duravant LLC Ohlson Packaging, Inc. Paper/Plastics/Packaging - - - - -
1/8/18 Allegion plc Technical Glass Products, Inc. Building Products $80.00 - - - -
1/8/18 Helix Linear Technologies, Inc. Nook Industries, Inc. Building Products - - - - -
1/8/18 South Dakota Wheat Growers Gavilon Fertilizer, LLC Chemicals - - - - -
1/7/18 Alpha Engineered Composites, LLC Longwood Elastomers, Inc. Building Products - - - - -
1/6/18 Sulzer Pumps Equipment JWC Environmental, LLC Building Products - - $215.00 - -
Source: Capital IQ

March 201822
Target LTM Enterprise Enterprise Value / LTM
Date Acquirer Target Industry Segment Revenue EBITDA Value Revenue EBITDA
First Quarter Transaction OverviewIndustrials
1/5/18 Emerson Electric Co. Cooper-Atkins Corporation Machinery - - - - -
1/5/18 Celanese Corporation Omni Plastics, LLC Chemicals - - - - -
1/5/18 Platinum Equity, LLC Husky IMS International Ltd. Paper/Plastics/Packaging $1,300.00 - - - -
1/5/18 SiteOne Landscape Supply, Inc. Pete Rose, Inc. Machinery - - - - -
1/5/18 NIBE Industrier AB (publ) Gaumer Company, Inc. Machinery $25.20 - - - -
1/4/18 Norgren Inc Bimba Manufacturing Company, Inc. Building Products $109.00 $13.30 $198.00 1.82x 14.89x
1/4/18 Linamar Corporation MacDon Industries Ltd. Building Products $467.13 - $934.27 2.00x -
1/4/18 WestRock Company All Assets of Plymouth Packaging Inc. Paper/Plastics/Packaging - - - - -
1/4/18 Xylem Inc. Pure Technologies Ltd. Distribution/MRO $98.11 $14.92 $395.16 4.03x 26.48x
1/4/18 EnviroStar, Inc. All Assets of Zuf Acquisitions I LLC Distribution/MRO $27.00 - $13.24 0.49x -
1/3/18 SK Capital Partners Perimeter Solutions Chemicals $294.00 - $1,000.00 3.40x -
1/3/18 Roeslein & Associates, Inc. Pride Conveyance Systems Inc. Building Products - - - - -
1/3/18 Crane Co. Crane & Co., Inc. Chemicals - - $800.00 - -
1/3/18 Hexatronic Group AB (publ) Blue Diamond Industries, LLC Building Products $29.00 $4.00 $23.00 0.79x 5.75x
1/3/18 TDS Metrocom, LLC Merrimac Communications Ltd Distribution/MRO - - - - -
1/3/18 H&E Equipment Services, Inc. Contractors Equipment Center, LLC Building Products $34.00 - - - -
1/3/18 Integrity Directional Services, Inc. Drill Right Technology, Inc. Building Products - - - - -
1/3/18 Berry Global Group, Inc. Clopay Plastic Products Company, Inc. Paper/Plastics/Packaging $461.00 $53.00 $475.00 1.03x 8.96x
1/2/18 LANXESS Aktiengesellschaft Solvay S.A. Chemicals $68.62 - $68.00 0.99x -
1/2/18 Itafos Nu-West Industries, Inc. Chemicals - - $100.00 - -
1/2/18 Trammo Nitrogen Products, Inc. Agrium Inc. Chemicals - - - - -
1/2/18 Groupe Deschênes Inc. Corix Water Products Inc. Distribution/MRO - - - - -
1/2/18 Graphic Packaging International, Inc. International Paper Company Freight/Logistics $1,600.00 - $1,801.10 1.13x -
1/2/18 ENPAR Technologies Inc. Pumptronics Incorporated Test/Measurement - - $1.82 - -
1/1/18 IIOT-OXYS, Inc. HereLab, Inc. Test/Measurement - - $1.90 - -
1/1/18 Kuraray Holdings U.S.A., Inc. Calgon Carbon Corporation Test/Measurement $557.15 $80.63 $1,329.24 2.38x 16.45x
1/1/18 Cyient Defense Services Inc. B&F Design Inc. Aerospace and Defense - - $5.50 - -
1/1/18 Strata-G Solutions, Inc. WestWind Group, Inc. Aerospace and Defense - - - - -
1/1/18 Ingevity Arkansas, LLC Georgia-Pacific Chemicals LLC Chemicals - - $310.00 - -
Source: Capital IQ

March 201823
Source: Capital IQ
Target LTM Enterprise Enterprise Value / LTM
Date Acquirer Target Industry Segment Revenue EBITDA Value Revenue EBITDA
First Quarter Transaction OverviewIndustrials
High $59,837.00 $10,043.00 $1,801.10 24.97x 26.48x
Low $0.36 $4.00 $0.21 0.27x 5.75x
Mean $1,843.81 $932.32 $237.57 2.59x 13.40x
Median $63.60 $13.30 $59.00 1.35x 11.90x
March 201824
The information and views contained in this report were prepared by Dinan Capital Advisors, LLC. (“Dinan”). It is not a research report, assuch term is defined by applicable law and regulations, and is provided for informational purposes only. It is not to be construed as anoffer to buy or sell or a solicitation of an offer to buy or sell any financial instruments or to participate in any particular trading strategyand is provided for informational purposes only. The information contained herein is believed by Dinan to be reliable, but Dinan makes norepresentation as to the accuracy or completeness of such information. Opinions, estimates and projections in this report constituteDinan’s judgment and are subject to change without notice. Also, past performance is not necessarily indicative of future results. Anyunauthorized reproduction of this information is strictly prohibited.
This report may contain references to registered trademarks, service marks and copyright owned by third-party information providers.None of the third-party information providers is endorsing the offering of, and shall not in any way be deemed an issuer or underwriterof, the securities, financial instruments or other investments discussed in this report, and shall not have any liability or responsibility forany statements made in the report or for any financial statements, financial projections or other financial information contained orattached as an exhibit to the report. For more information about the materials provided by such third parties, please contact us throughthe contact information provided on the following page.
Dinan Capital AdvisorsDisclaimer

March 201825
Dinan Capital Advisors
Dinan Capital Advisors delivers a highly tailored strategic approach for middle-market companies that seek to capitalize on mergerand acquisition transactions. Our services are comparable in scope to those employed by Wall Street investment banks for theworld's most profitable multinational corporations, while using methodologies, processes and cost-effective structures that makesense for middle-market companies.
Based on a highly structured process that leverages our experience, research capabilities, and proprietary technology platforms, weinitiate every engagement by first assessing the market climate, and then developing an understanding of the current situation andstrategic objectives of each company. From there, we partner with our clients to develop a plan that maximizes shareholder valueand delivers the optimal transaction outcome.
Dinan is the registered FINRA member broker-dealer division of the Dinan Group of Companies, responsible for executing thesecurities related transactions of the firm. The Dinan Group is a leading diversified financial services company with over 25 years ofadvisory and merchant banking experience dedicated to middle-market transactions.
For any query regarding this report, please contact:
Robert UllmanManaging Director
William DowningManaging Director
Michael ReisterSenior Analyst
Michael HilcoveSenior Associate
Michael PucciAssociate Director
Related Documents