Putting together an outstanding field/lab write-up Lessons learned and examples

Putting together an outstanding field/lab write-up Lessons learned and examples.
Dec 22, 2015
Welcome message from author
This document is posted to help you gain knowledge. Please leave a comment to let me know what you think about it! Share it to your friends and learn new things together.
Transcript

Putting together an outstanding field/lab write-up
Lessons learned and examples

Abstract
• Do not include any citations in the abstract note: there are some publications that allow them, but not too many in science
• Be general first, then lead into your study– Talk about the parameters first – Then get into the study

Example - Abstract
Water masses are large amounts of water that have the same origin and differentiate based on density, a factor of temperature and salinity. T-S diagrams can be used to explain a water mass phenomenon known as caballing, which is the mixing of two equal density water masses to yield a water mass with a higher density. The MATES Oceanography class conducted a laboratory experiment in the school lab on 17 December 2014 to simulate and relate caballing to open ocean applications. Five groups measured the density of tank water using a hydrometer, and then replicated the same density from fresh water and a slurry mix. After caballing water masses, the end water mass densities were significantly different than the starting mass densities. Caballing in open ocean occurs in unstable water masses.

Introduction• Please be a bit more detailed when talking
about parameters
• Include citations and use years as part of APA format (very important & something you need to learn)
• Never use more than two sources consecutively (you can use them more times but not more than twice consecutively!)

Methods
• The three sub-sections have been working– Study site – Procedure– Statistical Analysis
• Citations can be used if you use a methodology from a source

Results
• Please include some of your actual data (with ranges)
“The results indicated significance in each trial with P-values ranging from 0.0230 to 3.53x10⁻²⁰ . The average velocities of fine particles in saltwater and freshwater are 4.80cm/s and 5.04cm/s respectively. The average velocities of coarse particles in freshwater and saltwater are 17.36 cm/s and 20.74 cm/s respectively. “

Graphs
• Please expand your captions and DO NOT USE “This graph shows…” Get to the point. Also, include UNITS for measurements mentioned and the DATES and LOCATION that the data were collected
Examples…

Example of a Poor Label
Figure 1: A graph of the average salinity from each method of testing

Example of a Well Written Label
Figure 1: Mean salinity values (PPT) among each method of determining salinity (n=4) conducted at MATES on December 8, 2014. The YSI 85 multi-meter was used a baseline (control).

Introduction of the “n”
• For your final write-up, I want to introduce you to “n” –It tells how many items are being
analyzed –It is important as it provides us with a
basis for the strength of your numbers–It can be represented by an F value
when running an ANOVA

Here is when “n” could be used…
10 11 12 13 14 15 16 17 18 19 20 21 22 23 24 25 26 27 28 29 30 31 32 33 34 350
1
2
3
4
5
6
Interclutch Interval (days)
Freq
uenc
y
Figure 4. Frequency of nesting females (n = 25) and interclutch intervals (days) for five years of the study at North Sedge Island. Interclutch nesting frequencies ranged from 12 days to 33 days. Our data were collected for returning females with known nests.
The use of “n” versus “N”
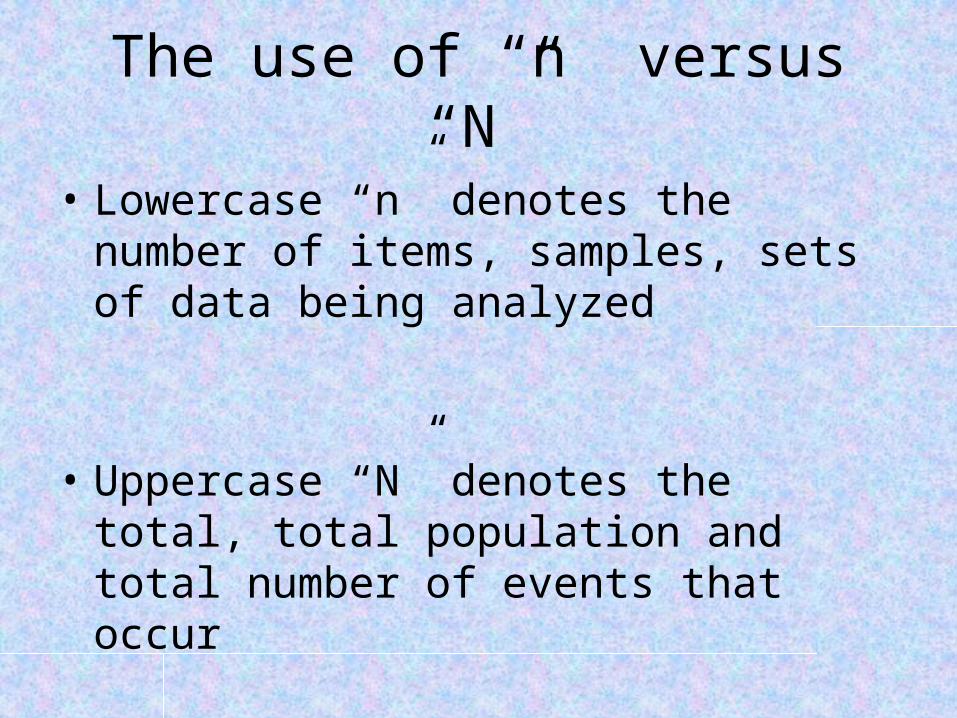
• Lowercase “n” denotes the number of items, samples, sets of data being analyzed
• Uppercase “N” denotes the total, total population and total number of events that occur
What happened to error bar?
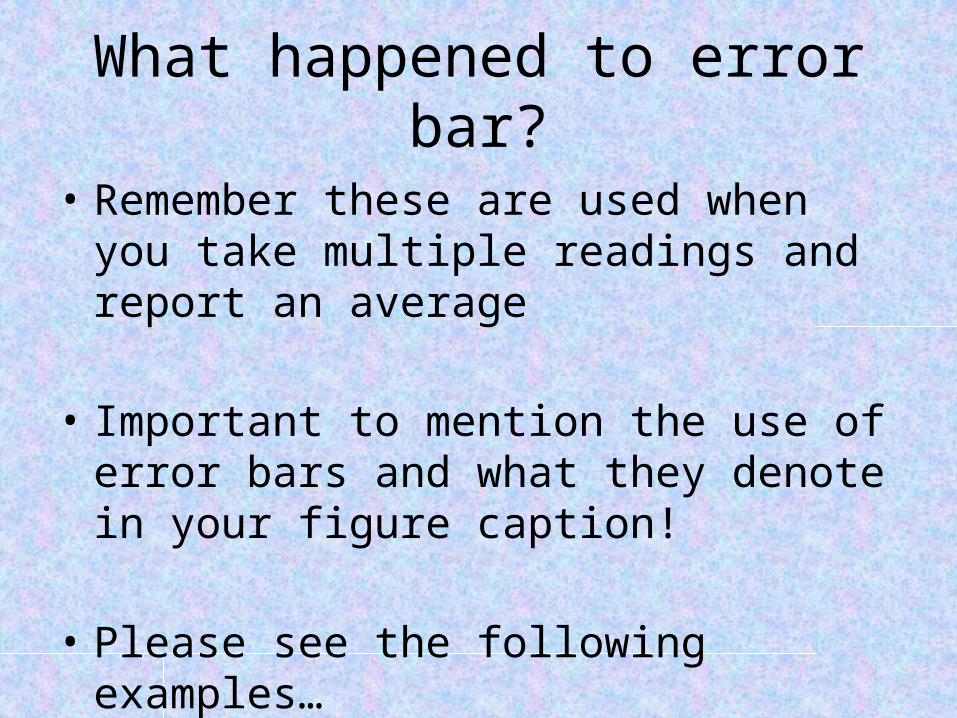
• Remember these are used when you take multiple readings and report an average
• Important to mention the use of error bars and what they denote in your figure caption!
• Please see the following examples…
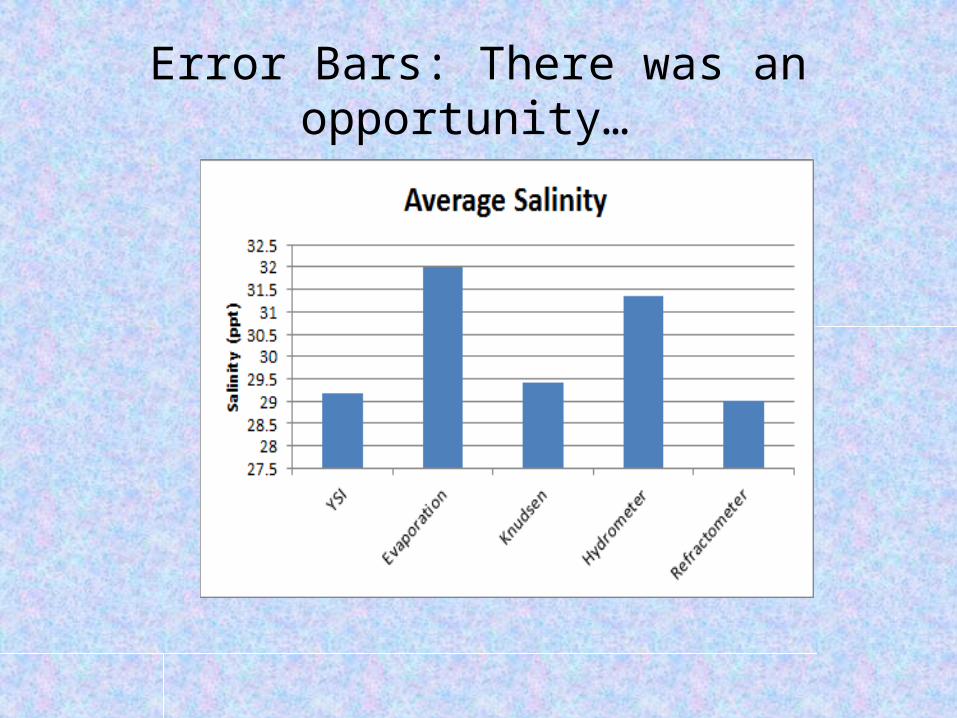
Error Bars: There was an opportunity…

Error Bars: Used Here
0 ppt 20 ppt 30 ppt0
200
400
600
800
1000
1200
Volumes of CO2 Collected at Varying Salinities
Salinity (PPT)
Volu
me
Gas C
olle
cted
(mL)
Figure 2: Volumes of carbon dioxide (mL) measured at different salinities (PPT) with standard errors (+ 5% ). Measurements were taken at MATES on November 25 and December 4, 2014. Freshwater reached saturation before most of the trials with salt water which was not the expected result.

Table 2. Using the gypsum blocks, the moisture retention capabilities were measured in kilopascals (kPa) for fine, medium, coarse, and very coarse sand. However, it was concluded that the data for the very coarse sand was skewed and inaccurate so it was omitted from the study.
Figure 26. The changes in the moisture retention capabilities of the sand types were observed from January 6, 2015 to January 14, 2015. The R2 values determined how well the data for each sand type fit their corresponding trend lines. The closer to one the R2 is, the better the data fits the trendline; therefore, the fine sand fit the trendline the best.
Lex O.
I don't think you need the DATE axis title
Lex O.
Moisture ability should probably be like moisture retention ability.

Statistics
• Include P values where appropriate, but anything less than 0.0001, please report as < 0.0001.
• Use only four places to the right of the decimal (for R squared and P values)
• Correlation vs. Significant Difference?
Proper Use of Stats In Graphs
2005 (n=5) 2006 (n=5) 2007 (n=8) 2008 (n=6) 2009 (n=9) Total (n=33)0
10
20
30
40
50
60
70
80
Year
Hat
chin
g Pe
rcen
tage
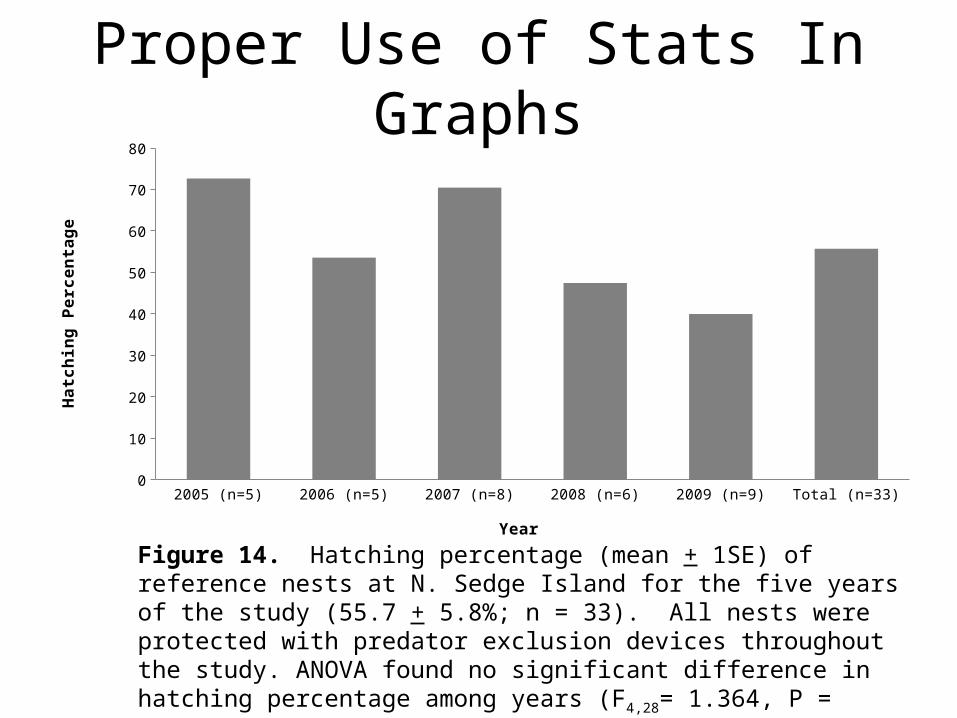
Figure 14. Hatching percentage (mean + 1SE) of reference nests at N. Sedge Island for the five years of the study (55.7 + 5.8%; n = 33). All nests were protected with predator exclusion devices throughout the study. ANOVA found no significant difference in hatching percentage among years (F4,28= 1.364, P = 0.2710).
Discussion
• Please explain why or why not your results happened the way they did.
• Please do not give all of the outcomes of your statistics (This was significant, this was not…), and then, no explanation
• Use citations!

Conclusion• This is the take home message aspect of your
report!
“Based on the statistical analyses, the hypothesis that an increase in salinity and temperature leads to an increase in dissolved gas solubility cannot be supported. However, because of many potential errors and a small sample size, the results are definitely not conclusive. It is suggested that future studies use a long-term data collection period that produces a range of each variable to for the best possible chances of a significant correlation.”

Acknowledgements
• Please thank those that helped – Classmates – Reviewers– Drivers, support team– Any equipment use (where did it come from)– Parents (for projects or review with their
assistance)

Bibliography
• Please cite all papers, manuals, personal communication that was used for your introduction, discussion and methods!
Sverdrup, K. A., & Armbrust, E. V. (2009). The Sea Floor and Its Sediments. An introduction to the world's oceans (10th ed., pp. 103-104). Dubuque, IA: McGraw-Hill.
Related Documents
![arXiv:1606.00704v3 [stat.ML] 21 Feb 2017 · We introduce the adversarially learned inference ... Autoregressive models produce outstanding samples but do so at the cost of slow ...](https://static.cupdf.com/doc/110x72/5b38b42f7f8b9a4a728d6c7f/arxiv160600704v3-statml-21-feb-2017-we-introduce-the-adversarially-learned.jpg)