Instructions for use Title Pulsed neutron spectroscopic imaging for crystallographic texture and microstructure Author(s) Sato, Hirotaka; Kamiyama, Takashi; Iwase, Kenji; Ishigaki, Toru; Kiyanagi, Yoshiaki Citation Nuclear Instruments and Methods in Physics Research Section A: Accelerators, Spectrometers, Detectors and Associated Equipment, 651(1): 216-220 Issue Date 2011-09-21 Doc URL http://hdl.handle.net/2115/47382 Right Type article (author version) Additional Information Hokkaido University Collection of Scholarly and Academic Papers : HUSCAP

Welcome message from author
This document is posted to help you gain knowledge. Please leave a comment to let me know what you think about it! Share it to your friends and learn new things together.
Transcript

Instructions for use
Title Pulsed neutron spectroscopic imaging for crystallographictexture and microstructure
Author(s) Sato, Hirotaka; Kamiyama, Takashi; Iwase, Kenji; Ishigaki,Toru; Kiyanagi, Yoshiaki
CitationNuclear Instruments and Methods in Physics Research SectionA: Accelerators, Spectrometers, Detectors and AssociatedEquipment, 651(1): 216-220
Issue Date 2011-09-21
Doc URL http://hdl.handle.net/2115/47382
Right
Type article (author version)
AdditionalInformation
Hokkaido University Collection of Scholarly and Academic Papers : HUSCAP

Paper submission: 9th World Conference on Neutron Radiography Kwa-Maritane, South Africa
3 – 8 October 2010
1
Pulsed Neutron Spectroscopic Imaging for
Crystallographic Texture and Microstructure
Hirotaka Satoa,*, Takashi Kamiyamaa, Kenji Iwaseb, Toru Ishigakib and
Yoshiaki Kiyanagia
a Graduate School of Engineering, Hokkaido University, Sapporo 060-8628,
Japan; b Frontier Research Center for Applied Atomic Sciences, Ibaraki University,
Ibaraki 319-1106, Japan.
*Corresponding author: Mr. Hirotaka Sato
Kita-13 Nishi-8, Kita-ku, Sapporo 060-8628, Japan.
Tel: +81-11-706 6652; Fax: +81-11-706 6652.
Abstract: A time-of-flight (TOF) spectroscopic neutron imaging at a pulsed
neutron source is expected to be a new material analysis tool because this
method can non-destructively investigate the spatial dependence of the
crystallographic and metallographic information in a bulk material. For
quantitative evaluation of such information, a spectral analysis code for the
transmission data is necessary. Therefore, we have developed a Rietveld-like
analysis code, RITS. Furthermore, we have applied the RITS code to
evaluation of the position dependence of the crystal orientation anisotropy, the
preferred orientation and the crystallite size of a welded α-iron plate, and we
have successfully obtained the information on the texture and the
microstructure. However, the reliability of the values given by the RITS code
has not been evaluated yet in detail. For this reason, we compared the
parameters provided by the RITS code with the parameters obtained by the
neutron TOF powder diffractometry and its Rietveld analysis. Both the RITS
code and the Rietveld analysis software indicated values close to each other,
but there were systematic differences on the preferred orientation and the
crystallite size.

Paper submission: 9th World Conference on Neutron Radiography Kwa-Maritane, South Africa
3 – 8 October 2010
2
Keywords: Bragg-edge transmission imaging; Rietveld analysis; Texture;
Crystallite size; Neutron diffraction.
1. Introduction
Information on texture (crystal orientation anisotropy and preferred
orientation) and microstructure (crystallite size) as well as strain and stress is
very important for characterization of the metallurgical properties of structural
or functional materials. In particular, the bulk information, which cannot be
non-destructively investigated by EBSD (electron backscatter diffraction), X-
ray diffraction and X-ray phase-contrast microtomography, reflects an
essential property of the entire material. For exploration of such information, a
time-of-flight (TOF) spectroscopic neutron imaging at a pulsed neutron source
[1] is the most suitable technique because this method can give the position-
dependent Bragg-edge transmission spectra over the wide area with a use of
a neutron imaging detector, which include the texture and microstructure
information of a bulk material at each pixel position. Therefore, a data analysis
code for the Bragg-edge transmission spectrum is indispensable for the
quantitative evaluation of the crystallographic and metallographic information.
For this reason, we have developed a Rietveld-like analysis code, RITS
(Rietveld Imaging of Transmission Spectra) [2,3], and we have successfully
carried out the quantitative imaging of the crystal orientation anisotropy, the
preferred orientation and the crystallite size in a welded steel plate [3].
However, the feasibility of this code has not been sufficiently confirmed yet.
Therefore, we have compared the results obtained by the RITS code with
those given by the Rietveld analysis software for neutron TOF diffractometry,
and discuss the features of both transmission method and diffraction method.
2. RITS - A Rietveld-type analysis code for the Bragg-edge
transmission imaging
The Rietveld analysis method [4] is a crystal structure analysis method
for powder diffraction data of X-rays and neutrons. In this method, we
calculate a whole scattering pattern based on the crystal structure factor, and
Paper submission: 9th World Conference on Neutron Radiography Kwa-Maritane, South Africa
3 – 8 October 2010
3
then refine the structural parameters by fitting the simulation calculation result
to the experimental data by adjusting the parameters. The non-linear least-
squares method, such as the Levenberg-Marquardt algorithm [5] used in the
RITS code, has to be used for the adjustment of the non-linear parameters.
Now, it is very important for the Bragg-edge transmission imaging to establish
a theoretical model being able to correctly analyze the experimental data.
Hereafter, we present the new theoretical expression of the Bragg-edge
transmission spectrum to deduce the crystallographic and metallographic
information.
The neutron transmission as a function of wavelength λ is related to the
total cross section (the attenuation coefficient). The total cross section
consists of elastic coherent scattering, elastic incoherent scattering, inelastic
scattering and absorption parts. The elastic coherent scattering cross section
)(elacoh represents the Bragg-edge transmission profile. For developing the
RITS code, we have proposed an effective formula that is composed of the
kinematical diffraction theory [6] with three new factors: the Dreele-Jorgensen-
Windsor type resolution function Rhkl(λ,dhkl) [7] describing the edge asymmetric
broadening for strain analysis, the modified March-Dollase function
Phkl(λ,dhkl,R0,HKL) [8] describing the crystal orientation anisotropy for texture
analysis, and Sabine’s extinction function Ehkl(λ,Fhkl,KD) [9] describing the re-
diffraction phenomenon of diffracted neutrons inside one crystallite for
microstructure analysis. This formula is expressed as follows:
hkl
hklhklhklhklhklhklhklhklhkl KDFdEHKLRdPdRdFV
),,2,(),,2,()2(2
)( 0
2
0
2elacoh ,
(1)
where V0 is the unit cell volume of the crystal lattice, dhkl is the distance of the
crystal lattice plane {hkl} (so-called the crystal lattice spacing or the d-
spacing), and Fhkl is the crystal structure factor including the Debye-Waller
factor. The first new factor, the Dreele-Jorgensen-Windsor type resolution
function Rhkl(λ,dhkl) [7], represents the edge asymmetric broadening due to the
neutron pulse shape, the edge shift due to the macrostrain and the edge
symmetric broadening due to the microstrain. The operation mode based on

Paper submission: 9th World Conference on Neutron Radiography Kwa-Maritane, South Africa
3 – 8 October 2010
4
the three-stage single edge profile analysis algorithm [10] has been optionally
implemented in the RITS code for the high resolution strain imaging.
The second new factor, the March-Dollase function Phkl(λ,dhkl,R0,HKL)
[8], represents the crystal orientation distribution averaged over the Debye-
Scherrer ring. Here, the March-Dollase coefficient R0 means the degree of
crystal orientation anisotropy. R0 = 1 means that the orientation distribution is
random (isotropic). As R0 is away from unity, the anisotropy becomes large.
The preferred orientation <HKL> orients parallel to the incident beam direction
when R0 is less than one, and orients perpendicular to the incident beam
direction when R0 is greater than one. By using this function, we can calculate
the shape change of the Bragg-edge transmission spectrum depending on the
texture effect, and can deduce the orientation anisotropy factor R0 and the
preferred orientation <HKL>. The third new factor, Sabine’s extinction function
Ehkl(λ,Fhkl,KD) [9], represents the re-diffraction phenomenon of diffracted
neutrons toward the transmitted beam direction occurring inside one crystallite
(the primary extinction effect), and is formulated as a function of the crystallite
size KD. By using this function, we can calculate the intensity increase of the
Bragg-edge transmission spectrum depending on the extinction effect, and
can deduce the crystallite size KD parallel to the transmitted beam direction.
3. Bragg-edge transmission imaging experiment with the RITS code
3.1 Specimens
Measured specimens were rolled and TIG (tungsten inert gas) welded
low-carbon steel (α-iron) plates composed of body-centered-cubic (BCC)
polycrystalline ferrites. Fig. 1 (a) shows a photograph of the specimens.
Neutrons were transmitted through the normal direction (ND) in the top
specimen, and were transmitted through the rolling direction (RD) in the
bottom one. The weld zone exists along the center line. The neutron
transmission thickness is 6 mm. Fig. 1 (b) shows stable end crystal
orientations of a BCC metal after the rolling process. In general, the <111>
orientation appears in the ND, and the <110> one appears in the RD [11]. In
addition, we note that the grains in the weld zone are almost a half of the size
of the grains in the base zone [3]. Thus, we have aimed at the quantitative
Paper submission: 9th World Conference on Neutron Radiography Kwa-Maritane, South Africa
3 – 8 October 2010
5
evaluation of the degree of crystal orientation anisotropy, the preferred
orientation and the crystallite size in both the base zone and the weld zone,
through the Bragg-edge transmission imaging with the RITS code.
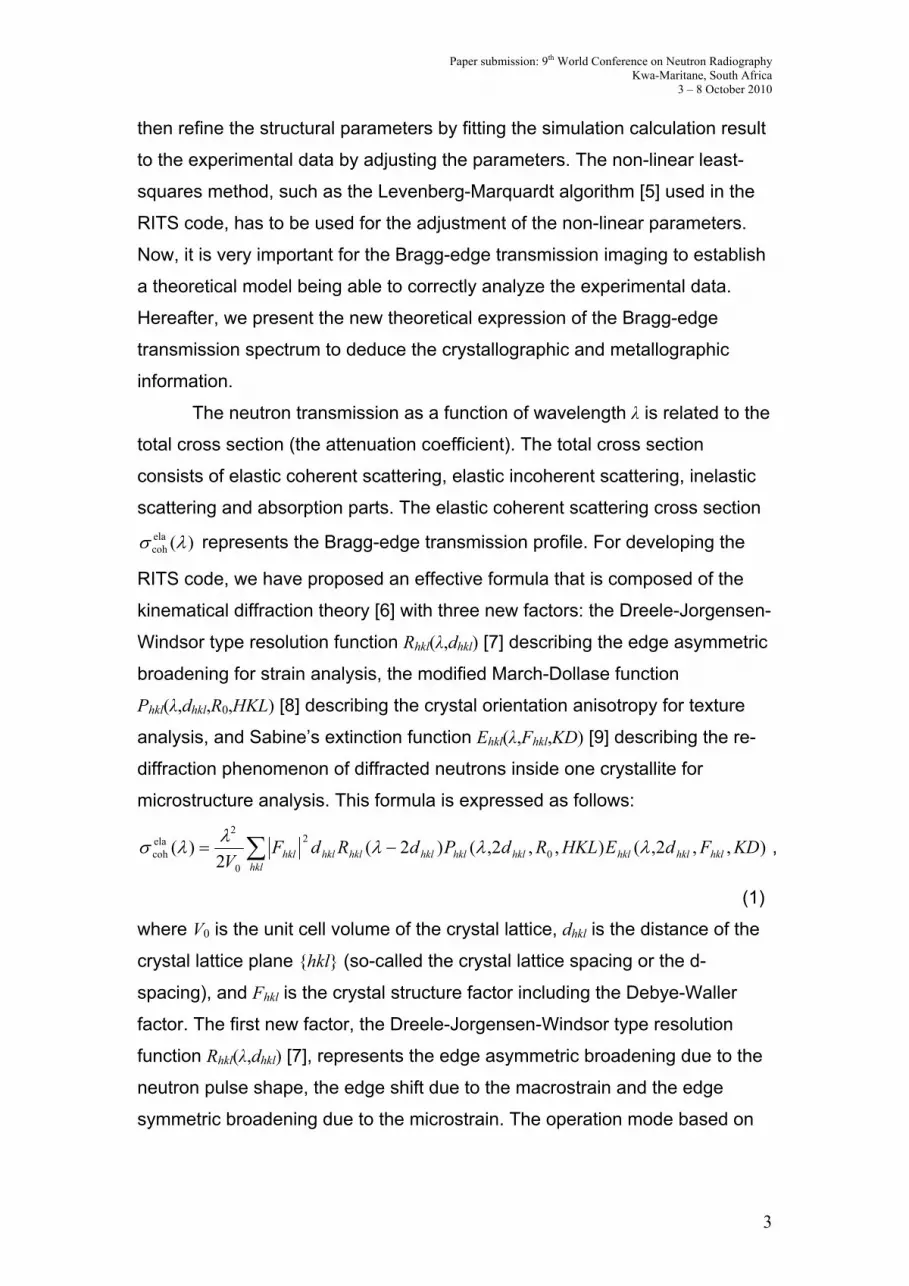
Fig. 1. (a) Photograph of the specimens. (b) Typical stable end crystal
orientations in the rolling process of a BCC polycrystalline material.
3.2 Experimental
A pulsed neutron TOF radiography experiment was carried out at the
cold neutron beam-line at the electron linear accelerator facility at Hokkaido
University in Japan. The neutron flight path length from the source to the
detector was 6.03 m. The neutron flux at the detector position was about 103
n/cm2/s. The neutron wavelength resolution and the d-spacing resolution was
2.7 % at the wavelength of 0.4 nm. The collimation ratio (L/D) was 60.3.
The two-dimensional neutron imaging detector used was a gaseous
detector with GEM (gas electron multiplier) [12]. The position resolution was
800 μm. The detection area was 10 cm × 10 cm. The detection efficiency was
15 % at the neutron wavelength of 0.4 nm. The TOF resolution was 10 ns.
The measurement time was 5.0 hours for the transmitted beam measurement,
and was 3.3 hours for the incident beam measurement since we used a weak
source and a detector with low detection efficiency.
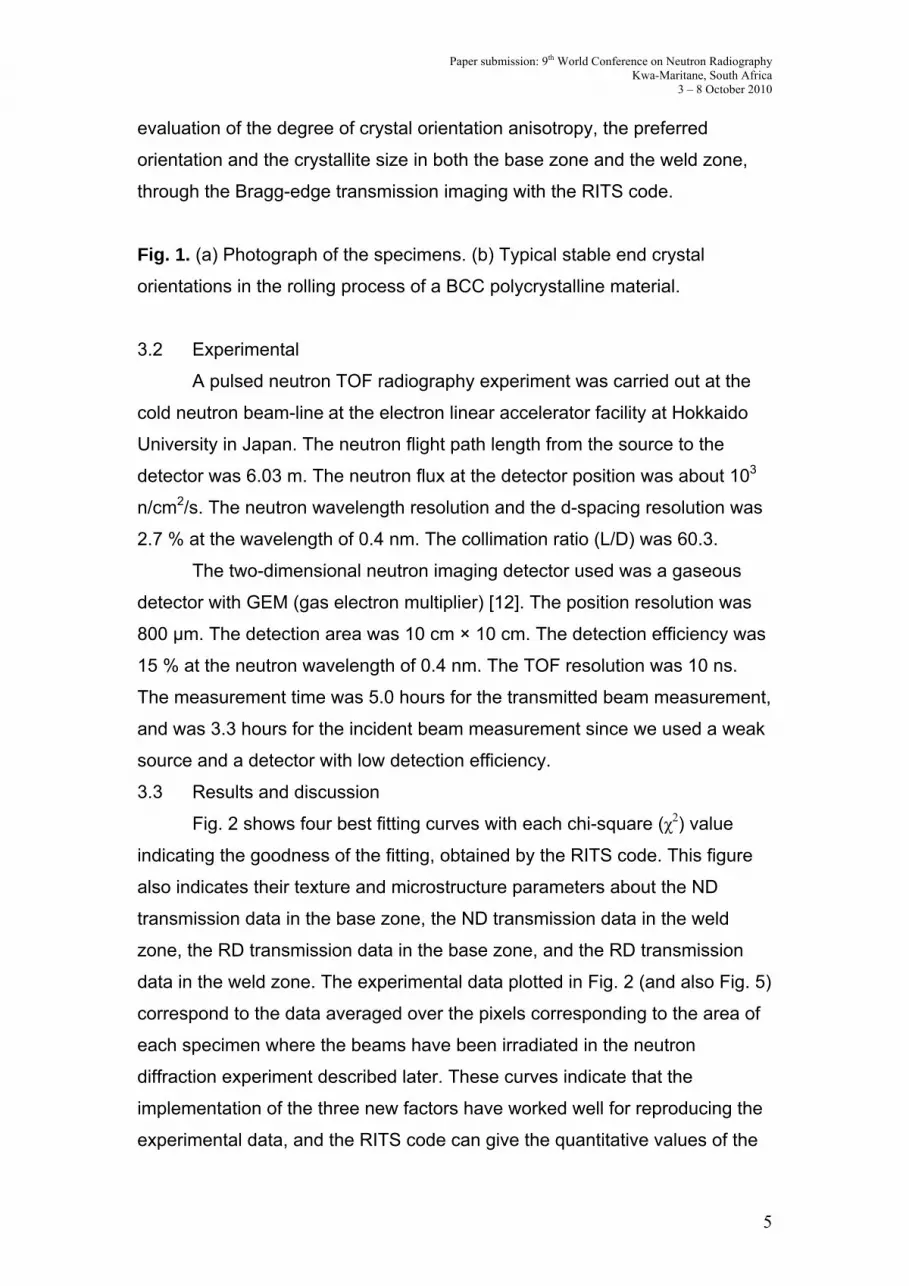
3.3 Results and discussion
Fig. 2 shows four best fitting curves with each chi-square (χ2) value
indicating the goodness of the fitting, obtained by the RITS code. This figure
also indicates their texture and microstructure parameters about the ND
transmission data in the base zone, the ND transmission data in the weld
zone, the RD transmission data in the base zone, and the RD transmission
data in the weld zone. The experimental data plotted in Fig. 2 (and also Fig. 5)
correspond to the data averaged over the pixels corresponding to the area of
each specimen where the beams have been irradiated in the neutron
diffraction experiment described later. These curves indicate that the
implementation of the three new factors have worked well for reproducing the
experimental data, and the RITS code can give the quantitative values of the

Paper submission: 9th World Conference on Neutron Radiography Kwa-Maritane, South Africa
3 – 8 October 2010
6
parameters of the preferred orientation, the crystal orientation anisotropy and
the crystallite size.
Fig. 3 shows quantitative images of the degree of crystal orientation
anisotropy R0, the preferred orientation <HKL> parallel to the neutron
transmission direction and the crystallite size KD along the neutron
transmission direction. Fig. 3 (a) indicates that the orientation anisotropies in
the weld zone become random (isotropy) due to the rapid cooling and
recrystallization during the solidification. Fig. 3 (b) indicates that the major
preferred orientation along the ND is <111>, and the major preferred
orientation along the RD is <110>. These are well consistent with the typical
stable end orientation property of a rolled BCC metal. Fig. 3 (c) indicates that
the crystallites in the weld zone become a half of the size of the crystallites in
the base zone due to the rapid cooling and recrystallization during the
solidification. This result is supported by the results of the grains observation
using an optical microscope [3]. Thus, we have successfully evaluated the
information on the texture and the microstructure by using the RITS code.
Fig. 2. Wavelength-dependent neutron transmission spectra of (a) the ND
specimen and (b) the RD specimen, with the best fitting curves with each χ2
value and the texture and microstructure parameters obtained by the RITS
code.
Fig. 3. Quantitative images with respect to (a) the degree of crystal orientation
anisotropy, (b) the preferred orientation parallel to the beam transmission
direction and (c) the crystallites size along the beam transmission direction.
4. Comparison with the results of a neutron TOF diffraction
experiment
4.1 Experimental
A pulsed neutron TOF diffraction experiment was carried out at the
Ibaraki materials design diffractometer (iMATERIA) [13] at Materials and Life
Science Experimental Facility (MLF) at Japan Proton Accelerator Research
Complex (J-PARC) in Japan. The proton beam power was 120 kW during the

Paper submission: 9th World Conference on Neutron Radiography Kwa-Maritane, South Africa
3 – 8 October 2010
7
experiment. The d-spacing resolution is 0.16 % at the backward detectors
bank. The time per once measurement was less than 1.0 hour. A diffraction
pattern was integrated by the time-focusing method [14] in a scattering angle
2θ > 150° of the backward detectors bank. We measured four kinds of
diffraction pattern of the same zones as those measured by the transmission
method as shown in Fig. 2.
4.2 Rietveld analysis results by using the Z-Rietveld code
We analyzed the experimental diffraction patterns by using the Z-
Rietveld code [15] that is the Rietveld analysis software for pulsed neutron
powder diffractometers installed at J-PARC. Fig. 4 shows a neutron TOF
diffraction pattern with the best fitting curve in the ND of the base zone, and
also the obtained texture and microstructure parameters. The isotropic
displacement parameter of 0.292369×10⁻² nm2 was used and fixed during the
Rietveld analyses. This value was equal to the value used in the analyses
using the RITS code. It has been indicated by analyzing the four diffraction
patterns that both the crystal orientation anisotropy and the crystallite size in
the weld zone become smaller than those in the base zone (see also R0,diff
and KDdiff in Table 1). On the other hand, we have obtained the results as
follows. The preferred orientation of the two ND specimens indicates that
<530> is perpendicular to the beam direction since R0 is greater than one, and
the preferred orientation of the two RD specimens indicates that <530> is
parallel to the beam direction since R0 is less than one. Namely, the Z-Rietveld
code has given an answer that the <530> orientation is parallel to the RD.
This is quite different from the previous works in metallurgy and also the
results of the Bragg-edge transmission imaging with the RITS code.
Fig. 4. Neutron TOF diffraction pattern of the ND of the base zone, the best
Rietveld fitting curve provided by the Z-Rietveld code, and the obtained
texture and microstructure parameters.
4.3 Discussion
The difference of the preferred orientation data may be caused by the
time-focusing method. This is because this method averages and gradates

Paper submission: 9th World Conference on Neutron Radiography Kwa-Maritane, South Africa
3 – 8 October 2010
8
the preferred orientation effect during the focusing over the wide scattering
angle (from 150° to 180° in this experiment). Therefore, we may obtain
incorrectly the preferred orientation information in the neutron TOF diffraction
experiment. For examining and preventing this phenomenon, we have to use
an angle-dispersive neutron diffractometer at a steady neutron source.
For comparing the other parameters, the crystal orientation anisotropy
R0 and the crystallite size KD, we have re-analyzed the experimental
transmission data shown in Fig. 2, under the condition that the preferred
orientation <530> is assumed in the RITS code. Fig. 5 shows fitting results of
the re-analyses with the χ2 values. Table 1 shows the parameters obtained by
the re-analyses (R0,trans and KDtrans), and the results of the diffraction pattern
analyses using the Z-Rietveld code (R0,diff and KDdiff). The fitting curves shown
in Fig. 5 are very close to the best fitting curves shown in Fig. 2 that the
orientation <111> or <110> are identified as the preferred orientation.
However, it is clearly indicated that the χ2 values of Fig. 5 are worse than the
χ2 values of Fig. 2. This similarity may cause the difference of the results of
the preferred orientation analyses between the transmission method and the
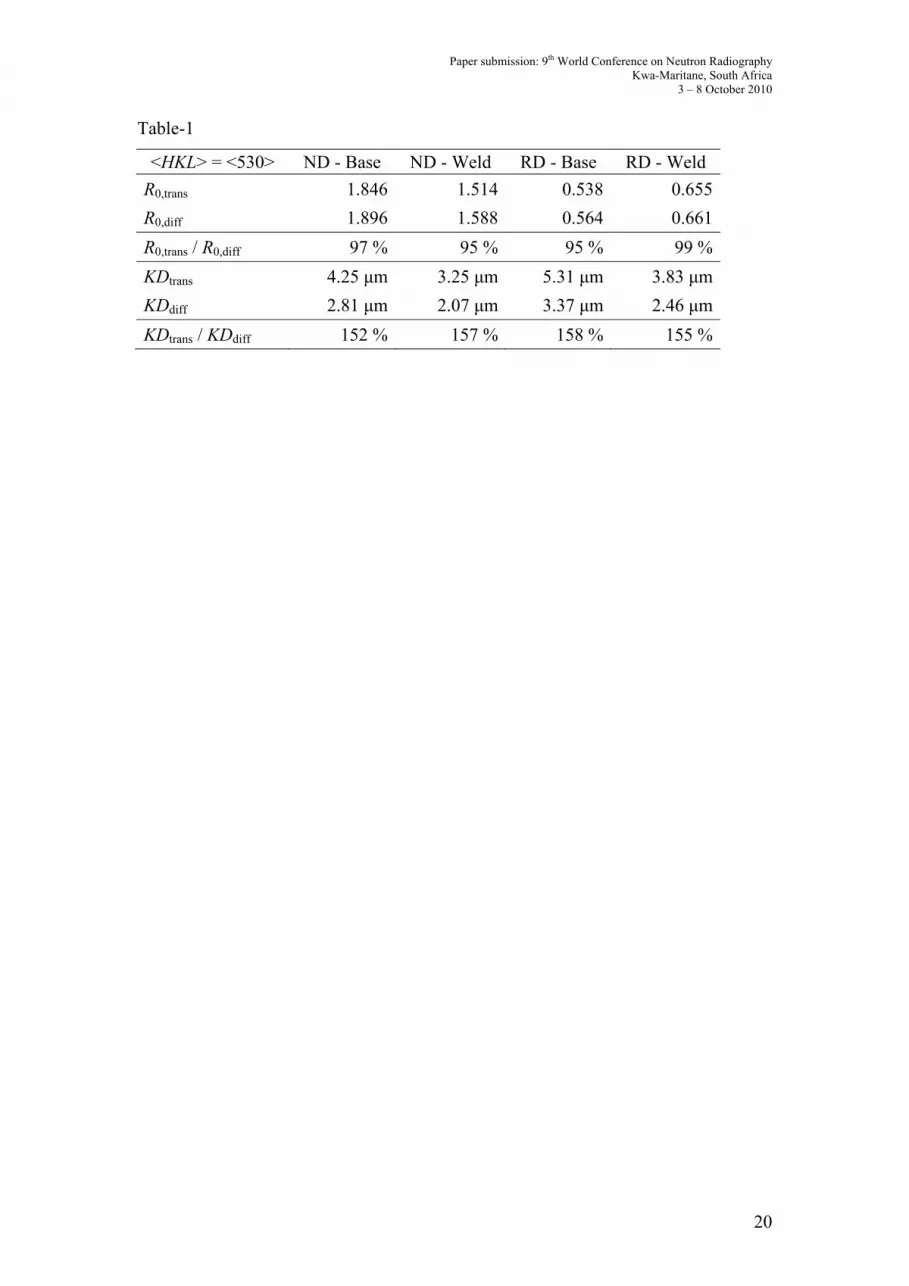
diffraction method. Table 1 indicates that the crystal orientation anisotropies
R0 of both the transmission method and the diffraction method are close each
other within 95 % ~ 99 %. On the other hand, the crystallite sizes of the
transmission method KDtrans have been 1.52 ~ 1.58 times larger than the
crystallite sizes of the diffraction method KDdiff. This indicates that the
extinction function in the RITS code works stronger than the extinction
function in the Z-Rietveld code. We should check the algorithms of both codes
in detail for exploring the reason of this systematic difference.
Fig. 5. Fitting curves re-analyzed by the RITS code, assuming <530> as the
preferred orientation. The χ2 values in this figure are larger than those of the
best fitting curves shown in Fig. 2.
Table 1. Comparison of the obtained parameters (crystal orientation
anisotropy and crystallite size) between the transmission method and the
Paper submission: 9th World Conference on Neutron Radiography Kwa-Maritane, South Africa
3 – 8 October 2010
9
diffraction method. In the analyses using the RITS code, the preferred
orientation has been fixed at <530> (the re-analysis results).
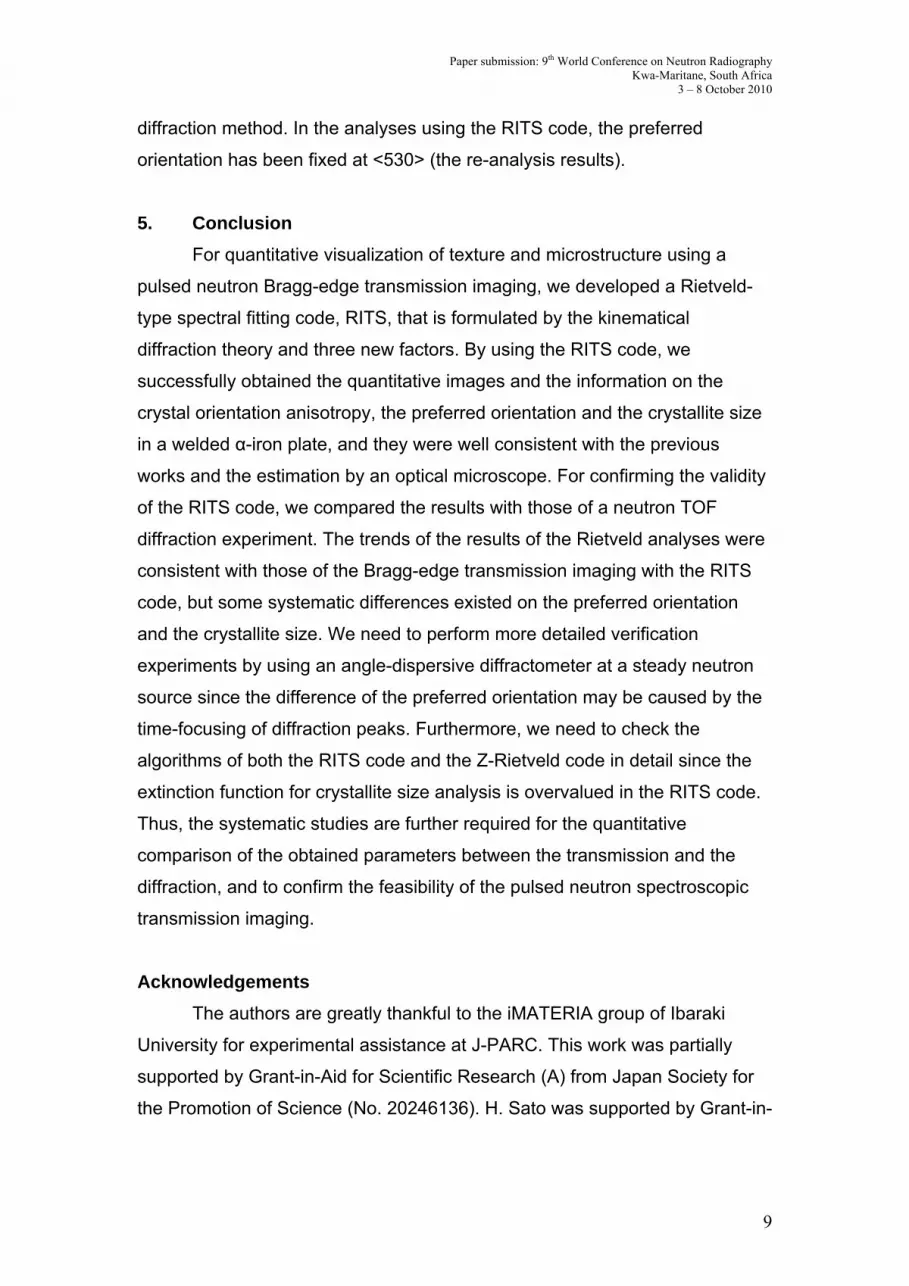
5. Conclusion
For quantitative visualization of texture and microstructure using a
pulsed neutron Bragg-edge transmission imaging, we developed a Rietveld-
type spectral fitting code, RITS, that is formulated by the kinematical
diffraction theory and three new factors. By using the RITS code, we
successfully obtained the quantitative images and the information on the
crystal orientation anisotropy, the preferred orientation and the crystallite size
in a welded α-iron plate, and they were well consistent with the previous
works and the estimation by an optical microscope. For confirming the validity
of the RITS code, we compared the results with those of a neutron TOF
diffraction experiment. The trends of the results of the Rietveld analyses were
consistent with those of the Bragg-edge transmission imaging with the RITS
code, but some systematic differences existed on the preferred orientation
and the crystallite size. We need to perform more detailed verification
experiments by using an angle-dispersive diffractometer at a steady neutron
source since the difference of the preferred orientation may be caused by the
time-focusing of diffraction peaks. Furthermore, we need to check the
algorithms of both the RITS code and the Z-Rietveld code in detail since the
extinction function for crystallite size analysis is overvalued in the RITS code.
Thus, the systematic studies are further required for the quantitative
comparison of the obtained parameters between the transmission and the
diffraction, and to confirm the feasibility of the pulsed neutron spectroscopic
transmission imaging.
Acknowledgements
The authors are greatly thankful to the iMATERIA group of Ibaraki
University for experimental assistance at J-PARC. This work was partially
supported by Grant-in-Aid for Scientific Research (A) from Japan Society for
the Promotion of Science (No. 20246136). H. Sato was supported by Grant-in-

Paper submission: 9th World Conference on Neutron Radiography Kwa-Maritane, South Africa
3 – 8 October 2010
10
Aid for JSPS Fellows from Japan Society for the Promotion of Science (No.
20002121).
Paper submission: 9th World Conference on Neutron Radiography Kwa-Maritane, South Africa
3 – 8 October 2010
11
References
[1] Y. Kiyanagi, N. Sakamoto, H. Iwasa, T. Kamiyama, F. Hiraga, S. Sato, H.
Sagehashi, T. Ino, M. Furusaka, J. Suzuki, A. Gorin, I. Manuilov, A.
Ryazantsev, K. Kuroda, K. Sakai, F. Tokanai, H. Miyasaka, T. Adachi, T. Oku,
K. Ikeda, S. Suzuki, K. Morimoto and H.M. Shimizu, Some experimental
studies on time-of-flight radiography using a pulsed neutron source, IEEE
Trans. Nucl. Sci. 52 (2005) 371-374.
[2] H. Sato, O. Takada, K. Iwase, T. Kamiyama and Y. Kiyanagi, Imaging of a
spatial distribution of preferred orientation of crystallites by pulsed neutron
Bragg edge transmission, J. Phys. Conf. Ser. 251 (2010) 012070.
[3] H. Sato, T. Kamiyama and Y. Kiyanagi, A Rietveld-Type Analysis Code for
Pulsed Neutron Bragg-Edge Transmission Imaging and Quantitative
Evaluation of Texture and Microstructure of a Welded α-Iron Plate, Mater.
Trans. (submitted).
[4] H.M. Rietveld, A profile refinement method for nuclear and magnetic
structures, J. Appl. Crystallogr. 2 (1969) 65-71.
[5] D.W. Marquardt, An algorithm for least-squares estimation of nonlinear
parameters, J. Soc. Indust. Appl. Math. 11 (1963) 431-441.
[6] E. Fermi, W.J. Sturm and R.G. Sachs, The transmission of slow neutrons
through microcrystalline materials, Phys. Rev. 71 (1947) 589-594.
[7] S. Vogel, A Rietveld-Approach for the Analysis of Neutron Time-Of-Flight
Transmission Data, Ph.D. Thesis, Christian Albrechts Universität, Kiel (2000).
[8] A.C. Larson and R.B. Von Dreele, General Structure Analysis System
(GSAS), Los Alamos National Laboratory Report LAUR 86-748, Los Alamos
National Laboratory, Los Alamos (2004).
[9] T.M. Sabine, R.B. Von Dreele and J.-E. Jørgensen, Extinction in time-of-
flight neutron powder diffractometry, Acta Crystallogr. Sec. A 44 (1988) 374-
379.
[10] J.R. Santisteban, L. Edwards, A. Steuwer and P.J. Withers, Time-of-flight
neutron transmission diffraction, J. Appl. Crystallogr. 34 (2001) 289-297.
[11] H. Inagaki, Stable end orientations in the rolling textures of the
polycrystalline iron, Z. Metallk. 78 (1987) 431-439.

Paper submission: 9th World Conference on Neutron Radiography Kwa-Maritane, South Africa
3 – 8 October 2010
12
[12] S. Uno, M. Sekimoto, T. Murakami, M. Tanaka, S. Nakagawa, E. Nakano,
F. Sugiyama, K. Nagaya, A. Sugiyama and T. Uchida, Development of
neutron gaseous detector with GEM, IEEE Nucl. Sci. Symp. Conf. Rec. 6
(2007) 4623-4626.
[13] T. Ishigaki, A. Hoshikawa, M. Yonemura, T. Morishima, T. Kamiyama, R.
Oishi, K. Aizawa, T. Sakuma, Y. Tomota, M. Arai, M. Hayashi, K. Ebata, Y.
Takano, K. Komatsuzaki, H. Asano, Y. Takano and T. Kasao, IBARAKI
materials design diffractometer (iMATERIA) - Versatile neutron diffractometer
at J-PARC, Nucl. Instrum. Methods Phys. Res. Sec. A 600 (2009) 189-191.
[14] J.D. Jorgensen, J. Faber Jnr, J.M. Carpenter, R.K. Crawford, J.R.
Haumann, R.L. Hitterman, R. Kleb, G.E. Ostrowski, F.J. Rotella and T.G.
Worlton, J. Appl. Crystallogr. 22 (1989) 321-333.
[15] R. Oishi, M. Yonemura, Y. Nishimaki, S. Torii, A. Hoshikawa, T. Ishigaki,
T. Morishima, K. Mori and T. Kamiyama, Rietveld analysis software for J-
PARC, Nucl. Instrum. Methods Phys. Res. Sec. A 600 (2009) 94-96.

Paper submission: 9th World Conference on Neutron Radiography Kwa-Maritane, South Africa
3 – 8 October 2010
13
CAPTION LIST
Fig. 1. (a) Photograph of the specimens. (b) Typical stable end crystal
orientations in the rolling process of a BCC polycrystalline material.
Fig. 2. Wavelength-dependent neutron transmission spectra of (a) the ND
specimen and (b) the RD specimen, with the best fitting curves with each χ2
value and the texture and microstructure parameters obtained by the RITS
code.
Fig. 3. Quantitative images with respect to (a) the degree of crystal orientation
anisotropy, (b) the preferred orientation parallel to the beam transmission
direction and (c) the crystallites size along the beam transmission direction.
Fig. 4. Neutron TOF diffraction pattern of the ND of the base zone, the best
Rietveld fitting curve provided by the Z-Rietveld code, and the obtained
texture and microstructure parameters.
Fig. 5. Fitting curves re-analyzed by the RITS code, assuming <530> as the
preferred orientation. The χ2 values in this figure are larger than those of the
best fitting curves shown in Fig. 2.

Paper submission: 9th World Conference on Neutron Radiography Kwa-Maritane, South Africa
3 – 8 October 2010
14
CAPTION LIST
Table 1. Comparison of the obtained parameters (crystal orientation
anisotropy and crystallite size) between the transmission method and the
diffraction method. In the analyses using the RITS code, the preferred
orientation has been fixed at <530> (the re-analysis results).

Paper submission: 9th World Conference on Neutron Radiography Kwa-Maritane, South Africa
3 – 8 October 2010
15
Figure-1
10 cm
5.6
cm
Weld zone Neutron transmission direction // ND
(a) Photograph of the specimens (b) Stable end crystal orientations in the rolling process of a BCC metal
Neutron transmission direction // RD
ND RD
<111> (-fiber)
<110> (-fiber)

Paper submission: 9th World Conference on Neutron Radiography Kwa-Maritane, South Africa
3 – 8 October 2010
16
Figure-2
40%
50%
60%
70%
0.30 0.35 0.40 0.45 0.50 0.55
Neutron wavelength / nm
Neu
ton
tran
smis
sion
RD - BaseFit. - BaseRD - WeldFit. - Weld
40%
50%
60%
70%
0.30 0.35 0.40 0.45 0.50 0.55
Neutron wavelength / nm
Neu
ton
tran
smis
sion
ND - BaseFit. - BaseND - WeldFit. - Weld
Bragg angle 110 / degree
816048
Bragg angle 110 / degree
816048
<HKL> = <111> <HKL> = <110>
{110
}
{110
}
(a) Specimen of the normal direction (b) Specimen of the rolling direction
Base: R0 = 0.53 & KD = 4.58 m (2 = 188.0)Weld: R0 = 0.63 & KD = 3.40 m (2 = 123.4)
Base: R0 = 0.62 & KD = 5.44 m (2 = 77.0)Weld: R0 = 0.73 & KD = 3.87 m (2 = 52.2)

Paper submission: 9th World Conference on Neutron Radiography Kwa-Maritane, South Africa
3 – 8 October 2010
17
Figure-3
Crystallite size along the beam direction KD / m
2.4
6.0
4.24.8
3.02.4
6.0
4.24.8
3.00.0
5.6
2.8
0.0 10.05.0Position x / cm
Pos
itio
n y
/ cm
Preferred crystal orientation parallel to the beam direction <HKL>
<111><110><100><221><211><210>
<111><110><100><221><211><210>
0.0
5.6
2.8
0.0 10.05.0Position x / cm
Pos
itio
n y
/ cm
Degree of crystal orientation anisotropy (March-Dollase coefficient R0)
0.0
5.6
2.8
0.0 10.05.0Position x / cm
Pos
itio
n y
/ cm
0.50
0.84
0.67
0.50
0.84
0.67
(a) Crystallographic anisotropy (b) Preferred orientation
(c) Crystallite size
Isotropy
Anisotropy

Paper submission: 9th World Conference on Neutron Radiography Kwa-Maritane, South Africa
3 – 8 October 2010
18
Figure-4
-20
0
20
40
60
80
100
120
0.00 0.05 0.10 0.15 0.20 0.25 0.30
Crystal lattice spacing / nm
Scat
teri
ng in
tens
ity /
arb.
uni
t ExperimentRietveld fittingDifference - 10
ND - Base<HKL> = <530> R0 = 1.90 KD = 2.81 m
Chi-square = 60.04 Rwp = 7.13 % Re = 0.92 %

Paper submission: 9th World Conference on Neutron Radiography Kwa-Maritane, South Africa
3 – 8 October 2010
19
Figure-5
40%
50%
60%
70%
0.30 0.35 0.40 0.45 0.50 0.55
Neutron wavelength / nm
Neu
ton
tran
smis
sion
RD - BaseFit. - BaseRD - WeldFit. - Weld
40%
50%
60%
70%
0.30 0.35 0.40 0.45 0.50 0.55
Neutron wavelength / nm
Neu
ton
tran
smis
sion
ND - BaseFit. - BaseND - WeldFit. - Weld
(a) Specimen of the normal direction (b) Specimen of the rolling direction
<HKL> = <530> was assumed.
<HKL> = <530> was assumed.
{110
}
{110
}
Bragg angle 110 / degree
816048
Bragg angle 110 / degree
816048
Base: R0 = 1.85 & KD = 4.25 m (2 = 190.3)Weld: R0 = 1.51 & KD = 3.25 m (2 = 128.0)
Base: R0 = 0.54 & KD = 5.31 m (2 = 88.6)Weld: R0 = 0.66 & KD = 3.83 m (2 = 52.9)
Paper submission: 9th World Conference on Neutron Radiography Kwa-Maritane, South Africa
3 – 8 October 2010
20
Table-1
<HKL> = <530> ND - Base ND - Weld RD - Base RD - Weld
R0,trans 1.846 1.514 0.538 0.655
R0,diff 1.896 1.588 0.564 0.661
R0,trans / R0,diff 97 % 95 % 95 % 99 %
KDtrans 4.25 μm 3.25 μm 5.31 μm 3.83 μm
KDdiff 2.81 μm 2.07 μm 3.37 μm 2.46 μm
KDtrans / KDdiff 152 % 157 % 158 % 155 %
Related Documents