3 Pulsed Cathodoluminescence of Natural and Synthetic Diamonds Excited by Nanosecond and Subnanosecond Electron Beams E.I. Lipatov 1 , V.M. Lisitsyn 2 , V.I. Oleshko 2 , E.F. Polisadova 2 , V.F. Tarasenko 1 and E.H. Baksht 1 1 High Current Electronics Institute, Tomsk, 2 Tomsk Polytechnic University, Tomsk, Russian Federation 1. Introduction Research on the luminescence of crystals due to ionizing radiation is an important field in spectral analysis of solids that allows determination of the chemical composition of material, its structure (the presence of defects), state (internal stress), etc. [Marfunin; Gritsenko et al.; Kravchenko et al.; Solomonov&Mikhailov]. The luminescence spectra and kinetics of various crystals are most commonly studied using pulsed accelerators with vacuum diodes [Gritsenko et al; Korepanov et al., 2000; Korepanov et al., 2005; Kravchenko et al.; Lipatov et al., 2007 (1); Lisitsyna et al., 2002; Lisitsyna et al., 2008; Lisitsyna et al., 2011; Solomonov&Mikhailov]. These accelerators produce electron beams of varying energy, current density, and pulse duration: the beam current pulse duration is varied by varying the voltage pulse parameters; the electron energy in a vacuum diode is determined by the voltage across the interelectrode gap. However with short beam current pulses ( 100 ps), the design of accelerators with vacuum diodes is added much complexity [Zheltov]. In this case, electron accelerators with gas diodes are more preferable to use [Tarasenko et al., 2008; Tarasenko et al., 2009; Tarasenko et al., 2010]; they are simpler in design and make it possible to produce an electron beam of current density 100 А/cm 2 and to control the pulse duration in the range from 100 to 500 ps [Baksht]. In this work, experiments were performed on two electron accelerators with vacuum and gas diodes. Compact electron accelerators based on vacuum and gas-filled diodes ensure high-intensity pulsed cathodoluminescence (PCL) typical of high-current electron beams [Solomonov&Mikhailov]. In our previous works, we demonstrated intense PCL of spodumene [Lipatov et al., 2007 (1)], ruby [Lipatov et al., 2005 (1)], calcite [Baksht et at], fluorite [Baksht et al], and diamond [Baksht et al.; Lipatov et al., 2005 (2)] excited by a subnanosecond avalanche electron beam and measured the integrated PCL spectra [Baksht et al.; Lipatov et al., 2005 (1); Lipatov et al., 2005 (2)] and the luminescence decay kinetics [Baksht et al.; Lipatov et al., 2007 (1)]. The objective of the present paper was to study the luminescence of two specimens of diamond (natural and synthetic) excited by nanosecond and subnanosecond electron beams www.intechopen.com

Welcome message from author
This document is posted to help you gain knowledge. Please leave a comment to let me know what you think about it! Share it to your friends and learn new things together.
Transcript

3
Pulsed Cathodoluminescence of Natural and Synthetic Diamonds Excited by Nanosecond
and Subnanosecond Electron Beams
E.I. Lipatov1, V.M. Lisitsyn2, V.I. Oleshko2, E.F. Polisadova2, V.F. Tarasenko1 and E.H. Baksht1
1High Current Electronics Institute, Tomsk, 2Tomsk Polytechnic University, Tomsk,
Russian Federation
1. Introduction
Research on the luminescence of crystals due to ionizing radiation is an important field in
spectral analysis of solids that allows determination of the chemical composition of material,
its structure (the presence of defects), state (internal stress), etc. [Marfunin; Gritsenko et al.;
Kravchenko et al.; Solomonov&Mikhailov]. The luminescence spectra and kinetics of various
crystals are most commonly studied using pulsed accelerators with vacuum diodes
[Gritsenko et al; Korepanov et al., 2000; Korepanov et al., 2005; Kravchenko et al.; Lipatov et
al., 2007 (1); Lisitsyna et al., 2002; Lisitsyna et al., 2008; Lisitsyna et al., 2011;
Solomonov&Mikhailov]. These accelerators produce electron beams of varying energy,
current density, and pulse duration: the beam current pulse duration is varied by varying
the voltage pulse parameters; the electron energy in a vacuum diode is determined by the
voltage across the interelectrode gap. However with short beam current pulses (100 ps),
the design of accelerators with vacuum diodes is added much complexity [Zheltov]. In this
case, electron accelerators with gas diodes are more preferable to use [Tarasenko et al., 2008;
Tarasenko et al., 2009; Tarasenko et al., 2010]; they are simpler in design and make it possible
to produce an electron beam of current density 100 А/cm2 and to control the pulse
duration in the range from 100 to 500 ps [Baksht]. In this work, experiments were performed
on two electron accelerators with vacuum and gas diodes. Compact electron accelerators
based on vacuum and gas-filled diodes ensure high-intensity pulsed cathodoluminescence
(PCL) typical of high-current electron beams [Solomonov&Mikhailov].
In our previous works, we demonstrated intense PCL of spodumene [Lipatov et al., 2007
(1)], ruby [Lipatov et al., 2005 (1)], calcite [Baksht et at], fluorite [Baksht et al], and diamond
[Baksht et al.; Lipatov et al., 2005 (2)] excited by a subnanosecond avalanche electron beam
and measured the integrated PCL spectra [Baksht et al.; Lipatov et al., 2005 (1); Lipatov et al.,
2005 (2)] and the luminescence decay kinetics [Baksht et al.; Lipatov et al., 2007 (1)].
The objective of the present paper was to study the luminescence of two specimens of diamond (natural and synthetic) excited by nanosecond and subnanosecond electron beams
www.intechopen.com

Cathodoluminescence
52
with a current density of 10–200 A/cm2 in the spectral range from 200 to 850 nm. The use of compact nanosecond and subnanosecond high-current electron accelerators as excitation sources allowed pulsed luminescence spectrometry with high temporal resolution, high light signal intensity, and hence high sensitivity and accuracy of measuring the decay characteristics over a wide time interval (10–10 ÷ 10–1 s).
The characteristics under study were the PCL spectra and decay kinetics of the diamond
specimens, including the time evolution of the spectra. The both specimens revealed a PCL
band due to intrinsic structural defects (Band-A). In the PCL spectra of the synthetic
diamond, because of the lower impurity content, a radiative recombination band of free
excitons was found, whereas in the PCL spectra of the natural diamond this band escaped
detection because of the high N impurity content. In the spectrum of the natural diamond,
the N3 system due to nitrogen-containing centers was observed.
2. Experimental setups, methods, and specimens
The integrated PCL spectra of the specimens were measured as shown in Fig. 1a. The
electron beam produced by accelerator 1 (the characteristics of the accelerators are presented
in Table 1) excited pulsed cathodoluminescence in specimen 2. The luminescence was
transferred through optical fiber 3 to spectrometer 5 (EPP-2000C Stellar-Net Inc.) and
converted to an electrical signal which was transmitted to computer 9 and represented as a
spectrum. In PCL spectrum processing, the optical absorption spectra of the specimen 2 and
fiber 3 and the spectral sensitivity of the spectrometer 5 were taken into account.
Accelerator Em, keV t0.5, ns je, А/cm2 Е, mJ/cm2
SLEP-150 100 0.1–0.65 10–100 1.5–8.0
RADAN-EXPERT – IMA3-150E 150 1.5 100 20
RADAN-220 – IMA3-150E 220 2 200 60
NORA 240 4 200 120
Vacuum diode with GIN-600 360 10 30 100
Table 1. Characteristics of the accelerators and electron beams that excited PCL in the specimens.
The optical absorption spectra were also measured as shown in Fig. 1a, except that a KrCl-
lamp [Lipatov et al., 2010] was used instead of the accelerator 1. The optical radiation was
delivered to the spectrometer 5 through the optical waveguide 3. Once the reference
spectrum was measured, the entrance aperture of the waveguide 3 was covered with the
specimen 2. The plane-parallel specimen 2 was arranged on a special cooled holder with
forevacuum pumping such that the output facet was parallel to the entrance aperture of the
waveguide 3. Because the radiation intensity of the KrCl-excilamp at 200–260 nm was much
higher than that at 260–800 nm, the foregoing procedure was followed for each range
separately. Two parts of the optical absorption spectrum was joined through multiplying
the short-wave part by an appropriate factor.
www.intechopen.com
Pulsed Cathodoluminescence of Natural and Synthetic Diamonds Excited by Nanosecond and Subnanosecond Electron Beams
53
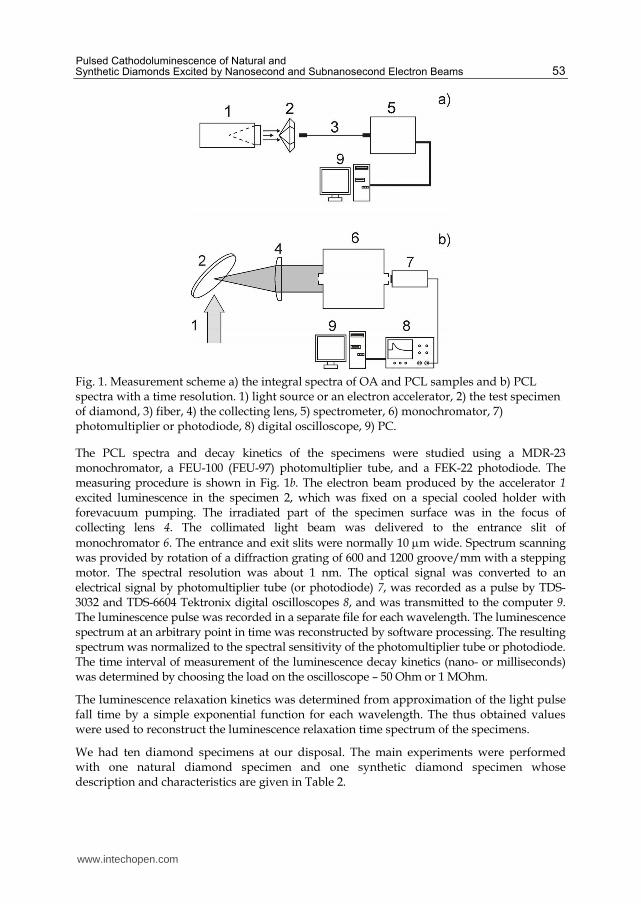
Fig. 1. Measurement scheme a) the integral spectra of OA and PCL samples and b) PCL spectra with a time resolution. 1) light source or an electron accelerator, 2) the test specimen of diamond, 3) fiber, 4) the collecting lens, 5) spectrometer, 6) monochromator, 7) photomultiplier or photodiode, 8) digital oscilloscope, 9) PC.
The PCL spectra and decay kinetics of the specimens were studied using a MDR-23 monochromator, a FEU-100 (FEU-97) photomultiplier tube, and a FEK-22 photodiode. The measuring procedure is shown in Fig. 1b. The electron beam produced by the accelerator 1 excited luminescence in the specimen 2, which was fixed on a special cooled holder with forevacuum pumping. The irradiated part of the specimen surface was in the focus of collecting lens 4. The collimated light beam was delivered to the entrance slit of
monochromator 6. The entrance and exit slits were normally 10 m wide. Spectrum scanning was provided by rotation of a diffraction grating of 600 and 1200 groove/mm with a stepping motor. The spectral resolution was about 1 nm. The optical signal was converted to an electrical signal by photomultiplier tube (or photodiode) 7, was recorded as a pulse by TDS-3032 and TDS-6604 Tektronix digital oscilloscopes 8, and was transmitted to the computer 9. The luminescence pulse was recorded in a separate file for each wavelength. The luminescence spectrum at an arbitrary point in time was reconstructed by software processing. The resulting spectrum was normalized to the spectral sensitivity of the photomultiplier tube or photodiode. The time interval of measurement of the luminescence decay kinetics (nano- or milliseconds) was determined by choosing the load on the oscilloscope – 50 Ohm or 1 MOhm.
The luminescence relaxation kinetics was determined from approximation of the light pulse fall time by a simple exponential function for each wavelength. The thus obtained values were used to reconstruct the luminescence relaxation time spectrum of the specimens.
We had ten diamond specimens at our disposal. The main experiments were performed with one natural diamond specimen and one synthetic diamond specimen whose description and characteristics are given in Table 2.
www.intechopen.com

Cathodoluminescence
54
No Description Dimensions, mm Type* Synthesis method
1 Disk 5 0.25 2а natural
2 Square plate 10 10 0.1 2а CVD**
* standard physical classification [Zaitsev]; ** chemical vapor deposition.
Table 2. Number, description, dimensions, type, and method of synthesis of the diamond specimens.
Fig. 2. The left axis: the transmission spectra of natural (continuous curve) and synthetic (broken curve) samples of diamond, measured at room temperature, and the transmission spectrum, calculated according to expression (1), for an ideal (non-absorbing) plane-parallel specimen of the diamond. The right axis: absorption spectra, calculated according to expression (1) and (2), of natural (continuous curve) and synthetic (broken curve) samples of the diamond.
Figure 2 shows the optical absorption spectra of the specimens measured by the foregoing
procedure. The absorption spectra of the specimens was calculated by the dichotomy
technique with resort to the available data [Zaitsev] on dispersion of the refractive index of
diamond and to the expressions:
2
2 2
1
1
d
d
r eT
r e
, (1)
2
2
1
1
nr
n
, (2)
where n() is the refraction index, r() is the reflection coefficient, () is the absorption coefficient [cm–1], and d is the optical thickness of a specimen. The calculated transmission spectrum of a perfect plane-parallel diamond shown in Fig. 2. Noteworthy is the absence of narrow-band peculiarities in the absorption spectra of the diamond specimens, the presence
www.intechopen.com

Pulsed Cathodoluminescence of Natural and Synthetic Diamonds Excited by Nanosecond and Subnanosecond Electron Beams
55
of a clearly defined fundamental absorption edge at 225 nm, and high imperfection of the synthetic diamond. According to the standard physical classification of diamonds [Zaitsev], the specimens are referred to type 2a.
3. Results and discussion
Figure 3 shows integrated PCL spectra of the natural (continuous spectrum) and synthetic (dotted spectrum) diamonds cooled with liquid nitrogen.
The integrated PCL spectrum of the natural diamond is dominated by the N3 vibronic system with a zero-phonon line (ZPL) at 415.2 nm and its phonon replicas at 420–450 nm due to the presence of N3V defects [Zaitsev]. The N3 system is thus superimposed on a structureless luminescence band-A in the spectral range 300–700 nm. According to [Takeuchi], the luminescence band-A owes to intrinsic defects of the diamond lattice – sp2-hybridized carbon bonds.
Fig. 3. Integrated PCL spectra of natural (continuous line) and synthetic (broken curve) of diamond samples, measured at liquid nitrogen temperatures. Inset: the band of the radiative recombination of free excitons (FETO at 235 nm), the zero-phonon line of N3V-defects (ZPL 415.2 nm), the emission bands of the second positive system of molecular nitrogen in the air.
On the contrary, the integrated PCL spectrum of the synthetic diamond revealed a very weak band-A and was dominated by a radiative recombination band of free excitons FETO at 235 nm. Because diamond is an indirect semiconductor, radiative recombination of free excitons occurs during the generation of phonons or a cascade of phonons [Fujii]. In the radiative recombination band of free excitons in the diamond, local maxima are observed according to the following expression:
h g b pE E E E , (3)
www.intechopen.com
Cathodoluminescence
56
where Eh is the maximum energy in the band, Eg is the width of the band gap of diamond (5.49 eV), Eb is the binding energy of a free exciton (80 meV), and Ep is the energy of the corresponding phonon. The radiative recombination spectrum of free excitons in pure diamond normally reveals local maxima corresponding to the following phonons of the diamond lattice [Fujii]: transverse acoustic phonon (TA, 87 meV) at 232.8 nm, transverse optical phonon (TO, 141 meV) at 235.2 nm, longitudinal optical phonon (LO, 163 meV) at 236.2 nm, and their cascades TO+LO at 242.7 nm and TO+LO+LO at 250.7 nm. The dominant component is thus the transverse acoustic phonon FETO at 235.2 nm against the background of which the longitudinal optical phonon at 236.2 nm is not distinguished.
In the PCL spectrum of the synthetic diamond in Fig. 3, the classical pattern of radiative recombination of free excitons is observed.
In the PCL spectrums of the both specimens in Fig. 3, luminescence of the second positive system of molecular nitrogen is detected in the form of a series of bands at 305–395 nm. The luminescence of the second positive system of molecular nitrogen was observed earlier in studies of the luminescence properties of natural spodumene (LiAlSi2O6 with Mn2+ impurity) in [Lipatov et al., 2007 (1)].
The considerable difference in the spectra of the natural and synthetic diamonds owes to the difference in their impurity contents. The ratio between radiative recombination bands of free excitons and luminescence band-A in a diamond allows one to judge the specimen perfection [Kawarada], i.e., as the defect or impurity concentration increases, the exciton luminescence intensity decreases and the band-A intensity increases due to amplification of radiationless recombination of free excitons and amount of sp2- hybridized carbon bonds. According to [Kawarada], the ratio between the exciton and band-A intensities (FETO/A) is close to unity at a defect concentration of ~ 1017 cm–3.
The natural diamond contains nitrogen in sufficient concentration (~ 1018 cm–3) to demonstrate the vibronic luminescence band of N3V defects. It was assumed that the excitation from N3V defects is transferred to the band-A centers thus increasing the band-A contribution to the integrated luminescence spectrum [Lipatov et al., 2007 (2)].
In the natural diamond, exciton luminescence bands were observed, but at FETO/A < 0.01 [Dean], i.e., the exciton luminescence under our conditions is impossible to distinguish against the background of the noise component.
3.1 Integrated PCL spectra of natural diamond
Pulsed cathodoluminescence of the natural diamond was excited by electron beams of duration 0.1–10 ns. Figure 4 shows integrated PCL spectra of the natural diamond excited by electron beams of duration 0.1, 2, and 4 ns.
The general PCL characteristics depend almost not at all on the duration of electron beam pulses. The band-A was found to dominate at 300–650 nm and was superimposed by the vibronic N3 system with a ZPL at 415.2 nm and phonon replicas at 420–480 nm. The maximum of the integrated spectra was between 430 and 440 nm.
It is found that the longer the beam duration and the higher the beam current density, the
larger the contribution of the N3 system to the integrated PCL spectrum. Presumably,
increasing the beam current density increased the duration of luminescence of the N3 system.
www.intechopen.com

Pulsed Cathodoluminescence of Natural and Synthetic Diamonds Excited by Nanosecond and Subnanosecond Electron Beams
57
Fig. 4. Integrated luminescence spectra of natural diamond sample at various durations of
the electron beam (0.1 ns, 2 ns, 4 ns) at room temperature (continuous lines) and at cooling
with liquid nitrogen (broken lines). Zero-phonon line of N3V-defects (ZPL 415.2 nm) is
marked. Inset: the spectral range of luminescence bands of the second positive system of
molecular nitrogen in the air, and integral luminescence spectra of natural diamond sample
under excitation by the electron beam with a duration 0.1 ns on a larger scale.
Cooling of the natural specimen with liquid nitrogen increased the ZPL intensity at
415.2 nm by a factor of ~ 2.5, ~ 8.8, and ~ 6.8 with a beam of duration 0.1, 2, and 4 ns,
respectively. The intensity of phonon replicas of the ZPL of the N3 system increased on
cooling with liquid nitrogen by a factor of ~ 2.1, 6.2, and 6.3, respectively. The band-A
intensity was nearly the same and increased ~ 1.8 times at all three beam durations.
Thus, the temperature quenching of luminescence was weaker for recombination radiation
(the band-A) than for intracenter transitions (the N3 system) [Solomonov].
On cooling of the natural specimen, the intensity of lines of the second positive system of
molecular nitrogen also increased. The causes for this phenomenon were discussed for mineral
spodumene earlier in [Lipatov et al., 2007 (1)] and are beyond the scope of the present study.
3.2 Time-resolved PCL spectra of natural diamond
The PCL spectra of the natural diamond were measured at room temperature by the procedure illustrated in Fig. 1b. Figure 5 shows PCL spectra of the natural diamond excited by an electron beam of duration 0.1 and 10 ns; the spectra were reconstructed at the maxima of light pulses and within 2 ms after the beginning of the pulse.
www.intechopen.com

Cathodoluminescence
58
Fig. 5. PCL spectra of natural diamond sample recovered from the amplitudes of the light signal at the maximums, and 2 ms after the onset of a light signal when excited by an electron beam of duration 0.1 ns (continuous lines) and 10 ns (broken line). For ease of comparison, the spectra measured at 2 ms after the start of the pulse, are enlarged in 1000 times. Inset: the spectral range of zero-phonon line 415.2 nm in an enlarged scale. The measurements were performed at room temperature.
With time, the PCL spectrum of the natural diamond underwent considerable transformations. At the maxima of the light pulse (within 10–15 ns after the beginning of the pulse), the PCL spectrum contained an intense band of the N3 system with a ZPL at 415.2 nm and phonon replicas at 420–480 nm.
Within 2 ms after the beginning of the excitation pulse, the PCL band intensity of the natural diamond decreased three orders of magnitude (for convenient comparison, the spectra are magnified by the corresponding factor). In this case, the N3 system escaped detection, whereas the band-A was detected in its undistorted form with a maximum at 450–470 nm.
For two excitation pulse (electron beam) durations of 0.1 and 10 ns at comparable current densities, the reconstructed spectra were almost the same. With a duration of 10 ns, the phonon replicas of the ZPL at 415.2 nm in the spectra of maximum light signals were much more pronounced. With a duration of 10 ns, the ZPL intensity at 415.2 nm was thus 1.6 times higher than that found with a duration of 0.1 ns. These differences were likely to be due to transient processes.
Within 2 ms after the beginning of the excitation pulse, the band-A was the same for both excitation pulse durations.
www.intechopen.com

Pulsed Cathodoluminescence of Natural and Synthetic Diamonds Excited by Nanosecond and Subnanosecond Electron Beams
59
3.3 Integrated PCL spectra of synthetic diamond
With an excitation pulse duration of 2 and 1.5 ns, the integrated PCL spectra of the synthetic diamond contained a weak band-A, an intense recombination band of free excitons, and lines of the second positive system of atmospheric nitrogen (see Fig. 6).
Fig. 6. Integrated luminescence spectra of synthetic diamond at room temperature (RT, continuous lines) and measured at temperature of liquid nitrogen (80 K, broken lines) under excitation by electron beam with a duration 2 ns and 1.5 ns. Spectra of PCL for the duration of the electron beam of 1.5 ns is shown in an enlarged scale. The second positive band system of molecular nitrogen of air is marked. Inset: the spectral range of the band radiative recombination of free excitons (FETO at 235 nm).
Cooling of the specimen with liquid nitrogen increased the exciton luminescence intensity ~ 2.5 times with a modest increase in band-A intensity.
For observation of the band-A of the synthetic diamond, a setup incorporated an image converter tube with a spectral range of 350–750 nm and excitation pulse duration of 1.5 ns was used [see Lipatov et al., 2007 (1) and references herein]. Note that the thus obtained band-A had a spectral maximum at 430–450 nm, i.e., was shifted by 20 nm toward the short-wave region with respect to the band-A of the natural diamond (see Fig. 5). The short-wave wing of the band-A of the synthetic diamond terminated steeply at 400 nm, whereas that of the natural diamond decreased gradually down to 350 nm.
The long-wave wing of the band-A was observed to 650 nm for both specimens; however, the intensity for the synthetic diamond decreased rapidly from 450 to 480 nm, whereupon it decreased gradually to 650 nm.
www.intechopen.com

Cathodoluminescence
60
It is conceivable that the described distinctions of the band-A for the synthetic diamond owe to the peculiar spectral sensitivity of the multichannel setup with an image converter tube.
The recombination band of free excitons at room temperature (RT) and on cooling with liquid nitrogen (80 K) was similar. All phonon components inherent in the luminescence of free excitons in diamond were observed (FETA at 232.8 nm, FETO at 235.2 nm, FELO at 236.2 nm, FETO+LO at 242.7 nm, and FETO+LO+LO at 250.7 nm) [Fujii]. Cooling with liquid nitrogen increased the intensity (2.5 times for the FETO component) with a decrease in the contribution of the FETA component.
At 80 K, the intensity of lines of the second positive nitrogen system also increased, as was the case for the natural diamond (see Fig. 4). However at an excitation pulse duration of 0.1 ns, the measured spectrum was free of lines of the second positive nitrogen system (see Fig. 7).
Fig. 7. Integrated luminescence spectra of synthetic diamond sample, measured at room temperature, under excitation by electron beam with durations 0.1 ns and 2 ns. The second positive band system of molecular nitrogen of the air is marked. Inset: the spectral range of the band radiative recombination of free excitons (FETO at 235 nm).
The recombination luminescence bands of free excitons with excitation pulse durations of 0.1 and 2 ns were distinct (Fig. 7). So in both cases, the FETO component of exciton luminescence of the diamond at 235.2 nm dominates; however, with an excitation pulse duration of 0.1 ns, the FETA component at 232.8 nm is not distinguished and mixing of multiphonon components with a common maximum at 242–246 nm in the long-wave region of the band is found. The difference of the radiative recombination band of free excitons in the diamond from the classical form at an excitation pulse duration of 0.1 ns presumably owes to transient processes.
www.intechopen.com

Pulsed Cathodoluminescence of Natural and Synthetic Diamonds Excited by Nanosecond and Subnanosecond Electron Beams
61
At both excitation pulse durations, the band-A was weak and structureless.
The intensity of the FETO component of exciton luminescence of the synthetic specimen increased nonlinearly with increasing the beam current density, as evidenced in Fig. 8. Approximation of the dependence by a power function gave an exponent of 1.4 (from 1.2 to 1.6 within confidence intervals). The nonlinear dependence of the output PCL on the electron beam current density made the radiative recombination band of free excitons undetectable against the background of the noise component in the low-impurity diamond at low excitation intensities. Apparently, this effect impeded the observation of exciton luminescence in the synthetic diamond excited by spontaneous UV sources (excilamps), whereas the excitation of photoluminescence by a pulsed KrCl-laser allowed observation of an intense FETO component of exciton luminescence [Lipatov et al., 2010].
Fig. 8. The intensity of the band 235 nm (radiative recombination of free excitons FETO) in the integral PCL spectra from electron beam current density for a sample of synthetic diamond.
3.4 Time-resolved PCL spectra of synthetic diamond
Figure 9 shows PCL spectra (at 232–238 nm) of the synthetic diamond excited by an electron
beam of duration of 2 ns; the spectra were reconstructed at the maxima of light pulses
(within 0.6–0.9 ns after the beginning of the excitation pulse); the measurements were taken
at room temperature and at 80 K.
The spectra reveal only the FETO component at 235.2 nm and the other phonon components present in the integrated luminescence spectra of this diamond (see Figs. 6 and 7) escape detection at an excitation pulse duration of 2 ns. The absence of phonon components of exciton luminescence, except for the FETO component, in the time-resolved PCL spectrum of
[mJ/cm2]
www.intechopen.com

Cathodoluminescence
62
the synthetic diamond confirms the effect of transient processes on the luminescence of phonon components the assumption of which was made in analyzing the integrated PCL spectrum of the diamond excited by an electron beam of duration 0.1 ns (Fig. 7). So the integrated PCL spectrum was free of the FETA component at 232.8 nm and mixing of multiphonon components with a common maximum at 242–246 nm was observed in the spectrum.
Fig. 9. Luminescence spectra and the decay time PCL of synthetic diamond sample in the
spectral range of the band radiative recombination of free excitons (FETO at 235 nm). The
intensity of luminescence is the maximum amplitude of the light pulse, which corresponds
to the time 1 ns after the beginning of the excitation pulse. Duration of the electron beam
was 2 ns. The decay time was calculated from the approximation of relaxation curve by an
exponential function. The measurements were performed at room temperature (RT, full
symbols) and at cooling with liquid nitrogen (80 K, empty symbols).
Cooling of the diamond to 80 K increased the intensity of the FETO components two times
with a decrease in the contribution of the short-wave wing of the exciton band, as is the case
in the integrated spectrum in Fig. 6.
The PCL spectra of synthetic diamond sample excited by the electron beam of duration of 10
ns are shown in Figure 10. The spectra were reconstructed from the amplitudes of the light
pulse, measured at 0.5, 1 and 2 ms after the start of the excitation pulse. As we can see, the
band-A with maximum about 450 nm in this time range is dominant in the spectrum of
synthetic diamond; in addition, is registered a weak peak at 415 nm.
www.intechopen.com

Pulsed Cathodoluminescence of Natural and Synthetic Diamonds Excited by Nanosecond and Subnanosecond Electron Beams
63
Fig. 10. PCL spectra of synthetic diamond sample under excitation by electron beam with a duration 10 ns, shown at 0.5, 1, 2 ms after the beginning of the excitation pulse.
3.5 PCL decay kinetics in natural and synthetic diamonds
The PCL decay kinetics in the diamonds was studied at an electron beam duration of 0.1–10 ns by the procedure shown in Fig. 1b. The electron accelerator was operated in two modes: a single-pulse mode at a FWHM of 0.1–10 ns and a two-pulse mode at a FWHM of 0.65 ns with a 3-ns interval. Figure 11 shows oscillograms of the electron beam current at a beam duration of 0.2 and 0.65 ns (two-spike mode). The same figure presents oscillograms of PCL at 300–650 nm (the region of the band-A and N3 system) with no spectral resolution (for which we removed the monochromator 6 from the circuit shown in Fig. 1b and replaced the photomultiplier tube 7 by the photodiode for the natural (atop) and synthetic (at the middle) diamonds.
For the natural diamond, the luminescence duration at 300–650 nm was an order of magnitude longer than that for the synthetic diamond. In the two-pulse excitation mode, the luminescence duration was also much longer than that in the single-pulse mode (Fig.11).
For the synthetic diamond, the light pulse decay time is nearly the same in the single- and two-pulse excitation modes, i.e., in PCL excitation by an electron beam of duration 0.25–0.65 ns, the light pulse duration was constant and was ~ 2 ns (Fig.11, middle).
Figure 9 shows PCL decay spectra of free excitons in the synthetic diamond excited by a pulse of duration 2 ns at room temperature and at 80 K; the spectra were obtained through approximation of the light pulse decay time in the single-pulse excitation mode by a first-order exponential function. At room temperature, the decay time was nearly constant at 233–237.5 nm and was 10–13 ns.
Cooling to 80 K caused an increase of the PCL decay time of the excitons to 13-14 ns in spectral range 234-236 nm. Outside this range the PCL decay time decreased to 8-11 ns.
www.intechopen.com

Cathodoluminescence
64
Fig. 11. Oscillograms of the luminescence of natural (atop) and synthetic (middle) diamond samples under electron beam excitation at single-pulse operation (duration of pulse 0.25 ns, broken curves) and two-pulse operation (duration of pulse 0.65 ns, continuous curves). Oscillograms of the beam current duration 0.25 ns (broken curve) and 0.65 ns (continuous curves) are shown down.
The PCL decay in the natural diamond was studied in the single-pulse mode at three excitation pulse durations: 0.1, 2, and 10 ns. The PCL decay spectra of the natural diamond are shown in Fig. 12.
In the nanosecond range, the decay time was 15–60 ns. With all excitation pulse durations, an increase in PCL decay time to 40–45 ns was observed in the vicinity of the ZPL at 415.2 nm. In the region of phonon replicas of the ZPL at 415.2 nm (420-480 nm), the PCL decay time increased to 35–45 ns with an excitation pulse duration of 0.1 and 10 ns and to 45–60 ns with an excitation pulse duration of 2 ns.
Thus, in the nanosecond range the N3 system dominates, and this is evidenced by the PCL spectrum (Fig. 5) and the spectra of decay time (Fig. 12).
The electron beam current densities at a beam duration of 0.1 and 10 ns were comparable, as can be seen from Table 1. However with an excitation pulse duration of 2 ns, the current density increased several-fold and the PCL decay time in the nanosecond range also increased compared to the decay times with excitation pulse durations of 0.1 and 10 ns.
www.intechopen.com

Pulsed Cathodoluminescence of Natural and Synthetic Diamonds Excited by Nanosecond and Subnanosecond Electron Beams
65
Fig. 12. The spectra of decay time of PCL of natural diamond sample under excitation by electron beams of duration 0.1, 2 and 10 ns at room temperature in nano- and millisecond ranges.
Fig. 13. The spectra of decay time of PCL of natural diamond sample under excitation by electron beams of duration 2 ns at room temperature (continuous curves) and at cooling with liquid nitrogen (80 K, broken curves) in nano- and millisecond ranges.
www.intechopen.com

Cathodoluminescence
66
Note that increasing the excitation intensity (the beam current) increases the luminescence duration of the N3 system, and this is confirmed by the increase in PCL duration in the two-pulse mode (Fig. 11) compared to that in the single-pulse mode.
In the millisecond range (Fig. 13), the PCL decay time in the natural diamond was 8.5–9 ms in the spectral luminescence region of the band-A and decreased steeply beyond this region. The PCL decay time thus did not depend on the excitation pulse duration. Actually in the millisecond range, only the luminescence of the band-A was observed in the natural diamond and that of the N3 system was entirely absent (see Figs. 5 and 12 see).
Cooling of the natural diamond to 80 K increased the decay time 1.8-2 times both for the N3 systems (nanosecond range) and for the band-A (millisecond range).
Figure 14 shows the decay curves of PCL at a wavelength of 235 nm for samples of natural and synthetic diamond under excitation by electron-beam duration of 10 ns. Rise time of light pulse is the same for both samples. Decay times are slightly different: about 25 ns for the synthetic sample and 45 ns for the natural sample.
-0,2
0
0,2
0,4
0,6
0,8
1
1,2
-100 0 100 200 300 400
I [arb.un]
Time [ns]
natural diamond
synthetic diamond
Fig. 14. Decay curve of PCL of natural and synthetic diamond sample at 235 nm under excitation by electron beams of duration 10 ns at room temperature.
Studies of the decay kinetics of 415 nm (Fig. 15) under excitation of samples by electron pulse with a duration of 10 ns showed that in this spectral range the decay time of PCL for synthetic sample is also smaller than for natural sample (16 and 50 ns, respectively) under identical conditions of excitation. That difference of the decay time may be due to the presence the channel of nonradiative energy transfer from the excited radiative levels in crystals of synthetic diamond.
Luminescence decay times of band-A in natural and synthetic diamond samples are also different (Fig. 16) under excitation by electron pulse of duration 10 ns. PCL decay in the
natural sample has been slower, is about 50 ns, whereas in the synthetic one is about 10 ns.
Decay kinetics of PCL for emission 235 nm, 415 nm, 450 nm when changing the excitation density from 6 to 300 mJ/cm2, were investigated. It is established that the decay kinetic of luminescence at 235 and 415 nm has changes weak with increasing density of excitation for both natural and synthetic diamond samples. The decay time is independent of excitation density.
www.intechopen.com

Pulsed Cathodoluminescence of Natural and Synthetic Diamonds Excited by Nanosecond and Subnanosecond Electron Beams
67
Fig. 15. Decay curve of PCL of natural and synthetic diamond sample at 415 nm under excitation by electron beams of duration 10 ns at room temperature.
Fig. 16. Decay curve of PCL of natural and synthetic diamond sample at 450 nm under excitation by electron beams of duration 10 ns at room temperature.
Investigation of the decay of luminescence at band 450 nm showed that the decay time of PCL in nanosecond range for synthetic diamond does not depend on the excitation density (Fig. 17). It was found that the decay time of PCL for natural sample increases from 12 to 50 ns with increasing excitation density. Dependence is shown in Figure 17. This feature is characteristic for the recombination luminescence.
www.intechopen.com

Cathodoluminescence
68
Fig. 17. The dependence of the decay time of PCL in the band 450 nm from excitation density for a sample of natural and synthetic diamond. The sample was excited by the electron beam of duration 10 ns.
4. Conclusion
In the work, we studied the integrated and time-resolved spectral-kinetic characteristics of pulsed cathodoluminescence (PCL) of natural and synthetic diamonds. The PCL was excited by electron beams of duration from 0.1 to 10 ns and current density from 10 to 200 А/cm2. According to the physical classification of diamonds, the diamonds under study were of type 2а, i.e., their optical transmission spectra revealed a clearly defined fundamental absorption edge at 225 nm, transparency from the UV to IR range, and absence of resolvable features.
The PCL of the natural diamond displayed two luminescence bands differing in nature, spectral composition, and time response. In the nanosecond range, the vibronic N3 system due to N3V defects dominated. The N3 system displayed a ZPL at 415.2 nm and phonon replicas at 420–480 nm. The characteristics decay time for the N3 system was 15–65 ns. In the vicinity of the ZPL at 415.2 nm, an increase in decay time to 45 ns was observed. In the region of phonon replicas of the ZPL, an increase in decay time to 40–65 ns was also found. Increasing the electron beam current density increased the intensity of the ZPL at 415.2 nm and its phonon replicas. The N3 system was reliably detected in the integrated and time-resolved PCL spectra, though it was not resolved in the absorption spectra of this diamond.
In the millisecond range, the N3 system escaped detection and the PCL spectra of the natural diamond revealed a broad structureless luminescence band-A at 350–650 nm with a decay time of 8.5–9 ms being dependent neither on the excitation pulse duration, nor on the electron beam current density.
www.intechopen.com

Pulsed Cathodoluminescence of Natural and Synthetic Diamonds Excited by Nanosecond and Subnanosecond Electron Beams
69
Cooling of the diamond increased the intensity and the decay time two-fold at all excitation pulse durations and beam current densities. The N3 system thus revealed a double increase in decay time. The intensity of the ZPL at 415.2 nm and its phonon replicas also increased on cooling. The higher the current densities, the more considerable the increase in intensity was.
The synthetic diamond also revealed the luminescence band-A in the PCL spectra. However, its intensity was too weak to study its time characteristics. The band-A was structureless in its spectral composition and was in the same spectral range as the band-A in the natural diamond.
The spectra of the synthetic diamond were dominated by a radiative recombination band of free excitons with several single-phonon and multiphonon components in which the dominating component was the FETO component at 235.2 nm. At excitation pulse durations of 0.1–2 ns, this component was the main one, and the FETA, FELO, FETO+LO, and FETO+LO+LO components (at 232.8, 236.2, 242.7, and 250.7 nm, respectively) were affected by transient processes.
The intensity of the exciton FETO component depended on the beam current density according to the power law with an exponent of ~ 1.4.
Cooling of the synthetic diamond increased the PCL intensity and decay time by a factor of 1.3–1.6 with a modest increase in band-A intensity. Cooling of the diamond also froze out the phonon FETA component of exciton luminescence.
It is shown that the decay time of PCL at band-A depends on the excitation density and has changes from 12 ns (at 6 mJ/cm2) to 50 ns (at 300 mJ/cm2) for a sample of natural diamond.
5. References
Baksht E. K.; Burachenko A.G. and Tarasenko V.F. (2010) Tech. Phys. Lett., Vol.36, pp. 1020-1023, ISSN 0320-0116.
Dean P.J., Jones I.H. Recombination radiation from diamond (1964) Physical review, Vol.133, №6A, pp.A1698-A1705.
Fujii A., Takiyama K., Maki R., Fujita T. (2001) Lifetime and quantum efficiency of luminescence due to indirect excitons in a diamond. Journal of luminescence, 94-95, pp.355-357. ISSN 0953-4075
Gritsenko B.P.; Lisitsyn V.M., Stepanchuk V.N. (1981) Phys. of the Solid State, Vol.23, pp. 393-396. ISSN 0367-3294
Kawarada H.; Tsutsumi T.; Hirayama H.; et al. (1994) Appl. Phys. Lett., Vol.64, pp. 451-453. ISSN 0003-6951.
Korepanov V. I.; Lisitsyn V. M. and. Oleshko V. I. (2000). Russian Physics Journal, Vol.43, pp. 185-192. ISSN 0021-3411.
Korepanov V.I.; Vil'chinskaya S.S.; Lisitsyn V.M.; Kuznetsov M.F. (2005) Optics and Spectr., Vol.98, pp. 401-404. ISSN 0030-4034.
Kravchenko V.D.; Lisitsyn V.M.; Yakovlev V.Yu. (1985) Phys. of the Solid State., Vol.27, pp. 2181-2183. ISSN 0367-3294
Marfunin A.S.(1975) Spectroscopy, Luminescence and Radiation Centers in Minerals; Nedra: Moscow, 327 p. (in Russian).
www.intechopen.com

Cathodoluminescence
70
Lipatov E.I.; Tarasenko V.F.; Orlovskii V.M.; Alekseev S.B. and Rybka D.V. (2005) Tech. Phys. Lett. Vol.31, pp. 231–232. ISSN 0320-0116.
Lipatov E.I., Tarasenko V.F., Orlovskii V.M., Alekseev S.B. (2005) Luminescence of crystals excited by a KrCl laser and a subnanosecond electron beam. Quantum electronics, Vol.35, №8, pp. 745-748. ISSN 0368-7147
Lipatov E.I., Orlovskii V.M., Tarasenko V.F., Solomonov V.I. (2007) Comparison of luminescence spectra of natural spodumene under KrCl laser and e-beam excitation. Journal of luminescence, Vol.126, №2, pp.817–821. ISSN 0953-4075.
Lipatov E.I.; Lisitsyn V.M.; Oleshko V.I.; and Tarasenko V. F. (2007) Russian Phys. J., Vol.50, pp. 52-57. ISSN 0021-3411.
Lipatov E.I., Avdeev S.M., Tarasenko V.F. (2010) Photoluminescence and optical transmission of diamond and its imitators. Journal of luminescence, 130, pp.2106-2112. ISSN 0953-4075
Lisitsyna L.A.; Korepanov V.I.; Lisitsyn V.M. (2002). Phys. of the Solid State. Vol. 44, pp. 2235-2239. ISSN 0367-3294
Lisitsyna L.A.; Oleshko V.I.; Putintseva S.N.; Lisitsyn V.M. (2008) Optics and Spectr. Vol. 105, pp. 531-537. ISSN 0030-4034
Lisitsyna L.A.; Korepanov V.I.; Lisitsyn V.M. Eliseev А.Е. at al. (2011) Optics and Spectr. Vol.110, pp. 568-573. ISSN 0030-4034
Solomonov V. I. and Mikhailov S. G. (2003) Pulsed Cathodoluminescence and Its Application to Analysis of Condensed Substances; Publisher: UrO RAN, Yekaterinburg, p. 1-181.
Takeuchi D.; Watanabe H.; Yamanaka S.; et al. (2001) Physical review B. Vol. 63, 245328. ISSN 0163-1829
Tarasenko V.F.; Baksht E.K.; Burachenko A.G.; Kostyrya I.D.; Lomaev M.I. and. Rybka D.V. (2008) Plasma Devises and Operation. Vol.16, pp.267-298. ISSN 1051-9998
Tarasenko V.F.; Baksht E.K.; Burachenko A.G.; Kostyrya I.D.; Lomaev M.I. and Rybka D.V. (2009) IEEE Trans. of Plasma Science. Vol.37, pp.832-838. ISSN 0093-3813.
Tarasenko V. F.; Baksht E. K.; Burachenko A.G.; Kostyrya I. D., Lomaev M. I. and Rybka D. V. (2010) IEEE Transactions on Plasma Science. Vol.38, 741-750. ISSN 0093-3813.
Zaitsev A.M. (2001) Optical properties of diamond; Springer:Berlin; 502 p. ISBN 354066582X Zheltov K.A. (1991) Pikosekundnye sil’notochnye elektronnye uskoriteli (Picosecond High-
Current Electron Accelerators). Energoatomizdat. Moscow, Russia, 1991. 114 p. ISBN: 5-283-03978-1
www.intechopen.com

CathodoluminescenceEdited by Dr. Naoki Yamamoto
ISBN 978-953-51-0362-2Hard cover, 324 pagesPublisher InTechPublished online 28, March, 2012Published in print edition March, 2012
InTech EuropeUniversity Campus STeP Ri Slavka Krautzeka 83/A 51000 Rijeka, Croatia Phone: +385 (51) 770 447 Fax: +385 (51) 686 166www.intechopen.com
InTech ChinaUnit 405, Office Block, Hotel Equatorial Shanghai No.65, Yan An Road (West), Shanghai, 200040, China
Phone: +86-21-62489820 Fax: +86-21-62489821
Cathodoluminescence (CL) is a non-destructive technique to characterize optical and electronic properties ofnanostructures in many kinds of materials. Major subject is to investigate basic parameters in semiconductors,impurities in oxides and phase determination of minerals. CL gives information on carrier concentration,diffusion length and life time of minority carriers in semiconductors, and impurity concentration and phasecomposition in composite materials. This book involves 13 chapters to present the basics in the CL techniqueand applications to particles, thin films and nanostructures in semiconductors, oxides and minerals. Thechapters covered in this book include recent development of CL technique and applications to wide range ofmaterials used in modern material science.
How to referenceIn order to correctly reference this scholarly work, feel free to copy and paste the following:
E.I. Lipatov, V.M. Lisitsyn, V.I. Oleshko, E.F. Polisadova, V.F. Tarasenko and E.H. Baksht (2012). PulsedCathodoluminescence of Natural and Synthetic Diamonds Excited by Nanosecond and SubnanosecondElectron Beams, Cathodoluminescence, Dr. Naoki Yamamoto (Ed.), ISBN: 978-953-51-0362-2, InTech,Available from: http://www.intechopen.com/books/cathodoluminescence/pulsed-cathodoluminescence-of-nachural-and-synthetic-diamond-under-the-action-of-nanosecond-and-subn

© 2012 The Author(s). Licensee IntechOpen. This is an open access articledistributed under the terms of the Creative Commons Attribution 3.0License, which permits unrestricted use, distribution, and reproduction inany medium, provided the original work is properly cited.
Related Documents