CENSUS OF INDIA 198' SERIES 22 UTTAR PRADESH Paper 1 of 1981 PROVISIONAL POPULATION TOTALS RAVINDRA GUPTA of the Indian Administrative Service Director of Census Operations, Uttar Pradesh

Welcome message from author
This document is posted to help you gain knowledge. Please leave a comment to let me know what you think about it! Share it to your friends and learn new things together.
Transcript

CENSUS OF INDIA 198'
SERIES 22
UTTAR PRADESH
Paper 1 of 1981
PROVISIONAL POPULATION TOTALS
RAVINDRA GUPTA of the Indian Administrative Service
Director of Census Operations, Uttar Pradesh

CONTENTS
1. PREFACE
2. FIGURES AT A GLANCE
3. STATEMENT SHOWING A COMPARATIVE PICTURE OF STATESJUNION TERRITORIES
4. STATEMENT SHOWING A COMPARATIVE PICTURE OF THE POPULATION OF THE DISTRICTS OF UTTAR PRADESH
5. MAPS AND CHARTS
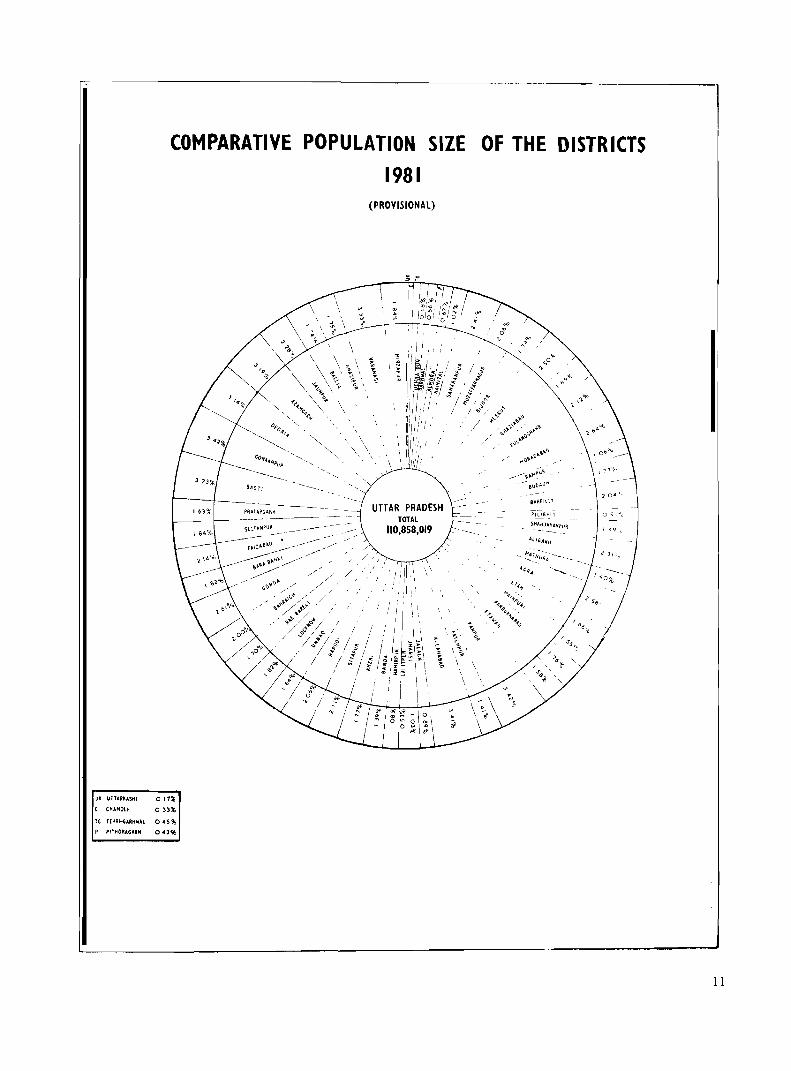
(i) Chart showing the comparative popUlation size of districts, 1981
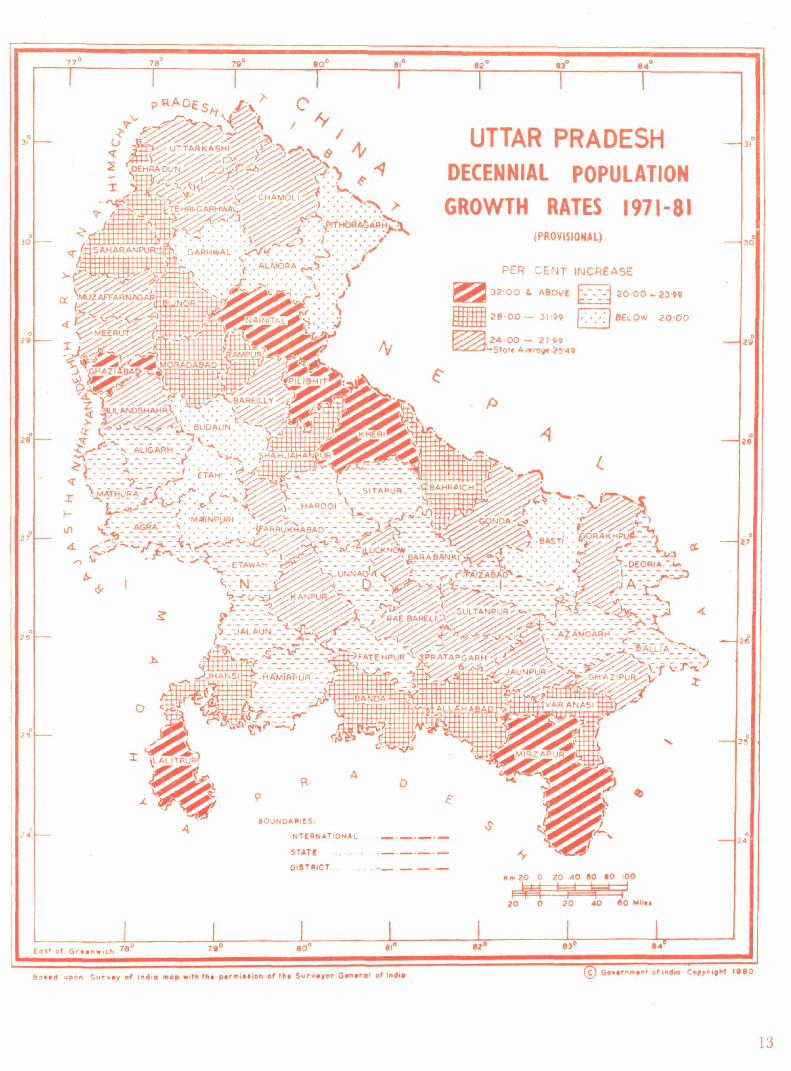
(ii) Decennial population growth rates, 1971-81
(iii) Density of population, 1981
(iv) Sex ratio, 1981
(v) Literacy. 1981
6. BACKGROUND NOTE
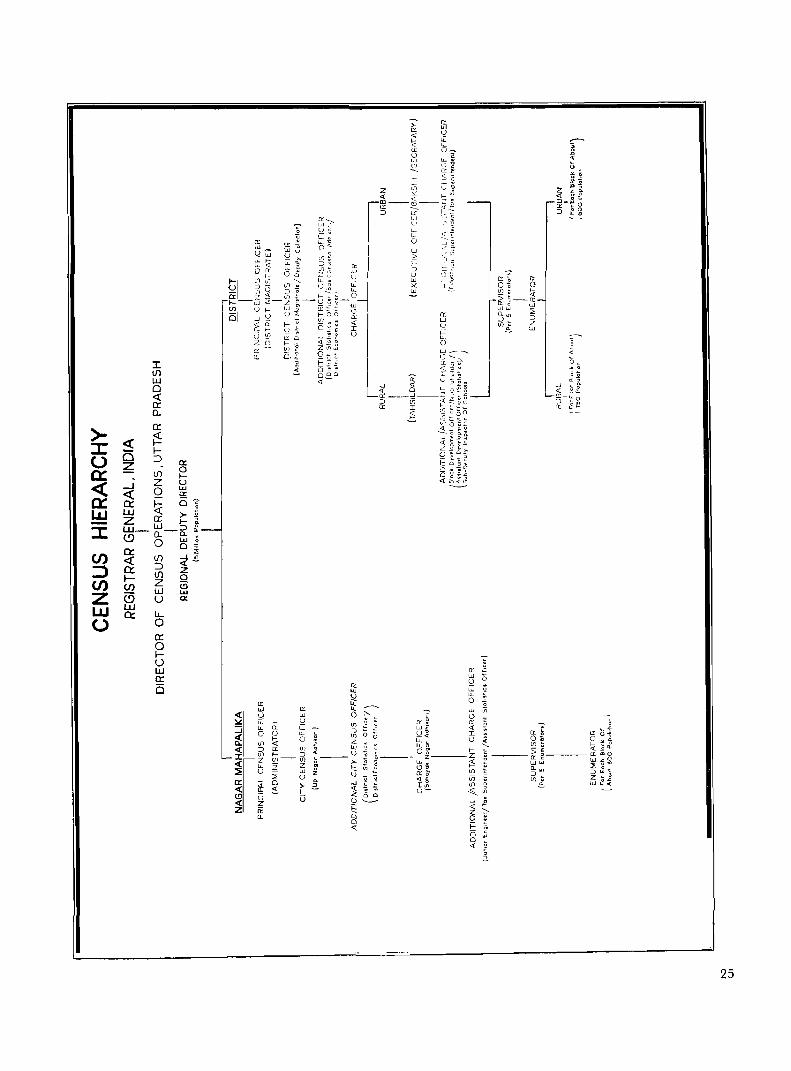
(i) Census Hierarchy
(ii) Appendix I-List of officers of the Directorate and Regional offices
(iii) Appendix 2-0fficials who worked in the "Provisional Population Totals Project" 1981 Census
7. ANALYSIS OF RESULTS
8. PROVISIONAL POPULATION TABLES
(i) Table I-Distribution of Population, Sex Ratio, Growth Rate and Density of Population by districts
(ii) Table 2-Decadal Variation in Population since 1901
(iii) Table 3-Literacy (including Population in age group 0-4)
(iv) Table 4-Cities with a Population of 100,000 and above
Page No.
1-2
3
5
6-7
II
13
15
17
19
22-24
25 27
28
30-32
34---35
36-37
38-40
41


PREFACE
It is my proud privilege to bring out Paper 1 of 1981 containing provisional population totals for Uttar Pradesh. The figures at all India level have already been released by the Registrar General-cum-Census Commissioner, India.
The first phase of 1981 Census i.e. houselisting had to be completed under trying circumstances. The houselisting had to be shifted twice owing to elections for the Lok Sabha and the State Assembly and could be completed in most of the areas by October, 1980 only. Severe drought followed by floods and law and order problems further strained the tight schedule. The enumeration operation was, however, carried out according to the fixed time schedule (FebFuary 9 to March 5, 1981).
In snow bound areas which become inaccessible at the time of enumeration, houselisting was completed inJune,1980and enumeration in September, 1980 with the sunrise of October 1, 1980 as the reference point of time. These non-synchronous areas were confined to the Uttarakhand districts ofUttarkashi, Chamoli and Pithoragarh.
During the last decade (1971-1981), three new districts, Ghaziabad, Lalitpur and Kanpur Rural were also created. Kanpur Rural district was created and abolished and then recreated in the midst of census operations and hence it does not find place here. The old Kanpur district, of course, has its mention.
The District Magistrates were the Principal Census Officers for the districts. The Administrators of Nagarmahapalikas were notified as Principal Census Officers for these N agarmahapalikas for the first time in this census.
The blessings of His Excellency the Governor and that of the Chief Minister of the State from time to time and at the start of enumeration operation are acknowledged with gratitude. I am indebted to the State Govern~ent for the valuable assistance at all stages. But for the continuous guidance, cooperation and personal interest taken by Shri D. K. Bhattacharya and Shri R. B. Saxena, ex-Chief Secretaries and Shri Tribhuwan Prasad, the present Chief Secretary of the State, the Census could not, perhaps, have been completed according to the schedule. My grateful thanks to them. I am also obliged to Shri S. K. Modwel and Shri S. M. H. Rizvi, ex-Secretaries to the General Administration Department of the U. P. Secretariat and Shri M. C. Joshi, the present Secretary G. A. D. and also Shri B. N. Sinha, Deputy Secretary, G. A. D.
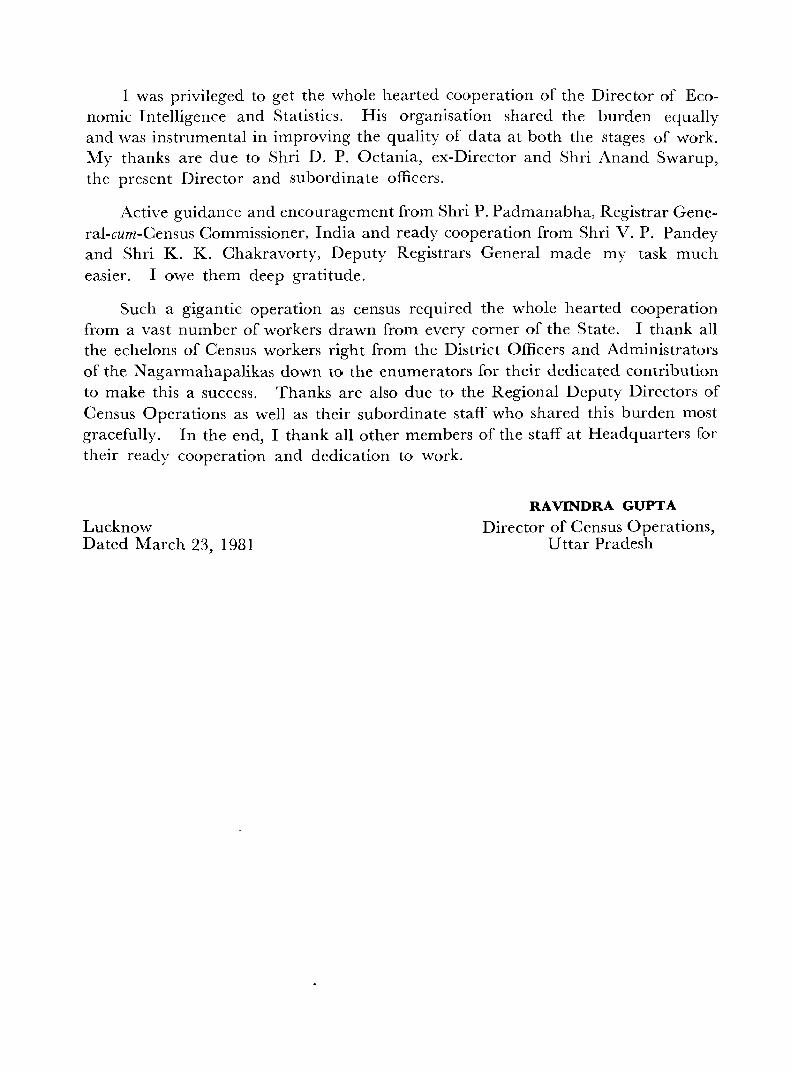
I was privileged to get the whole hearted cooperation of the Director of Economic Intelligence and Statistics. His organisation shared the burden equally and was instrumental in improving the quality of data at both the stages of work. My thanks are due to Shri D. P. Octania, ex-Director and Shri Anand Swarup, the present Director and subordinate officers.
Active guidance and encouragement from Shri P. Padmanabha, Registrar General-cum-Census Commissioner, India and ready cooperation from Shri V. P. Pandey and Shri K. K. Chakravorty, Deputy Registrars General made my task much eaSIer. lowe them deep gratitude.
Such a gigantic operation as census required the whole hearted cooperation from a vast number of workers drawn from every corner of the State. I thank all the echelons of Census workers right from the District Officers and Administrators of the N agarmahapalikas down to the enumerators for their dedicated contribution to make this a success. Thanks are also due to the Regional Deputy Directors of Census Operations as well as their subordinate staff who shared this burden most gracefully. In the end, I thank all other members of the staff at Headquarters for their ready cooperation and dedication to work.
Lucknow Dated March 23, 1981
RA VINDRA GUPTA
Director of Census Operations, Uttar Pradesh
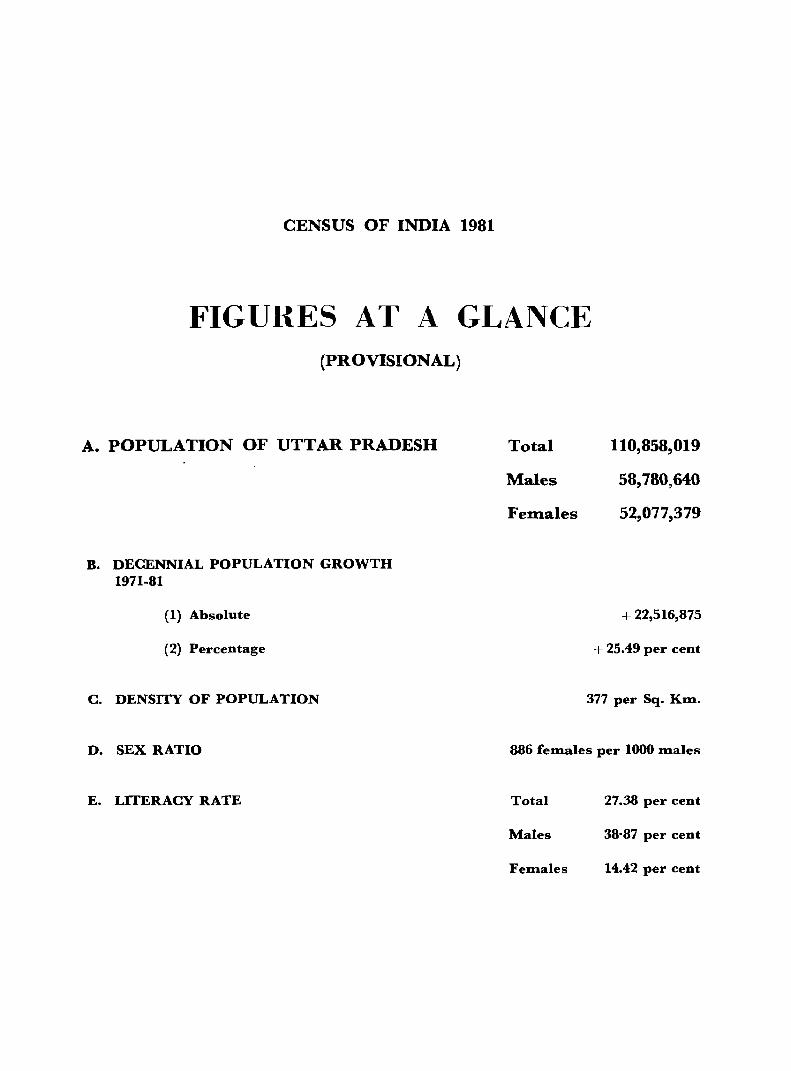
CENSUS OF INDIA 1981
FIGURES AT A GLANCE (PROVISIONAL)
A. POPULATION OF UTTAR PRADESH
B. DECENNIAL POPULATION GROWTH 1971-81
(1) Absolute
(2) Percentage
C. DENSITY OF POPULATION
D. SEX RATIO
E. LITERACY RATE
Total
Males
Females
110,858,019
58,780,640
52,077,379
+ 22,516,875
+ 25.49 per cent
377 per Sq. Km.
886 females per 1000 males
Total 27.38 per cent
Males 38·87 per cent
Females 14.42 per Cent


STATEMENT SHOWING A COMPARATIVE PICTURE OF STATES/UNION TERRITORIES 1981 Census
(Provisional Figures)
States/Union Territories Population Rank in Sex Percent-popula- Ratio age of
Persons Males Females tion literates
2 3 4 5 6 7
INDIA 683,810,051 353,347,249 330,462,802 935 34.80
States
1. Andhra Pradesh 53,403,619 27,035,531 26,368,088 5 975 29.94
2. Assam* 19,902,826 10,472,712 9,430,114 13 900 N.A.
3 Bihar 69,823,154 35,865,467 33,957,687 2 947 26.01
4 Gujarat 33,960,905 17,484,540 16,476,365 10 942 43.75
5 Haryana 12,850,902 6,846,153 6,004,749 15 877 35.84
6. Himachal Pradesh 4,237,569 2,131,312 2,106,257 18 988 41.94
7. Jammu & Kashmir* 5,981,600 3,062,200 2,919,400 17 953 N.A.
8. Karnataka 37,043,451 18,869,494 18,173,957 8 963 38.41
9. Kerala 25,403217 12487,961 12,915,256 12 1,034 69.17
10. Madhya Pradesh 52,131,717 26,856.752 25,274,965 6 941 27.82
11. Maharashtra 62,693,898 32,341,115 30,352,783 3 939 47.37
12. Manipur 1,433,691 727,108 706,583 20 972 41.99
13. Meghalaya 1,327,874 678,883 648,991 21 956 33.22
14. Nagaland 773,281 414,231 359,050 23 867 41.99
15. Orissa 26,272,054 13,253,523 13,018,531 11 982 34.12 16. Punjab 16,669,755 8,840,234 7,829,521 14 886 40.74
17. Rajasthan 34,102,912 17,749,282 16,353,630 9 921 24.05
18. Sikkim 315,682 171,959 143,723 28 836 33.83
19. Tamil Nadu 48,297,456 24,420,228 23,877,228 7 978 45.78 20. Tripura 2,060,189 1,057,714 1,002,475 19 948 41.58 21. Uttar Pradesh 110,858,019 58,780,640 52,077,379 886 27.38 22. West Bengal 54,485,560 28,505,151 25,980,409 4 911 40.88
Union Territories
1. A & N Islands 188,254 106,889 81,365 29 761 51.27 2. Arunachal Pradesh 628,050 335,941 292,l09 24 870 20.09
3. Chandigarh 450,061 254,208 195,853 27 770 64.68
4. D. & N. Haveli 103,677 52,514 51,163 30 974 26.60 5. Delhi 6,196,414 3,422,550 2,773,864 16 810 61.06
6. Goa, Daman & Diu 1 082,1l7 546,260 535,857 22 981 55.86 7. Lakshadweep 40,237 20,367 19,870 31 976 54.72
8. Mizoram 487,774 251,988 235,786 26 936 59.50 9. Pondicherry 604,136 304,342 299,794 25 985 54.23
* Projected figures N.A.-Not available.
5

STATEMENT SHOWING A COMPARATIVE PICTURE OF THE POPULATION 1981 Census
(Provisional Figures)
State/District Total Population Decennial Growth Density of Rates (Percentage) Population 1981
(per Km.2) Population in 1971 Population in 1981 1961-71 1971-81
(and rank) (and rank)
2 3 4 5 6
UTTAR PRADESH 88,341,144 110,858,019 +19.78 +25.49 377 1. U ttarkashi 147,805 (56) 189,102 (56) +20.33 +27.94 24 2. Chamoli 292,571 (55) 364,231 (55) +15.58 +24.49 40 3. Tehri-Garhwal 397,385 (54) 493,819 (53) +14.28 +24.27 112 4. Dehra Dun 577,306 (50) 758,241 (49) +34.57 +31.34 246
5. Garhwal 553,028 (51) 623,617 (51) +14.66 + 12.76 115
6. Pithoragarh 415,163 (53) 479,452 (54) +20.64 +15.49 54 7. Almora 648,622 l49) 747,557 (50) + 17.32 + 15.25 139 8. Nainital 790,080 (47) 1,131,876 (46) +37.57 +43.26 167 9. Saharanpur 2,054,834 (13) 2,673,136 (12) +27.20 +30.09 478
10. ~uzaffarnagar 1,802,289 ( 19) 2,288,387 (18) +24.73 +26.97 548 11. Bijnor 1,490,185 (32) 1,925,637 (30) +25.12 +29.22 397 12. ~eerut 2,207,957 (11 ) 2,767,101 (11) +21.35 +25.32 708 13. Ghaziabad 1,340,902 (38) 1,870,473 (33) +29.34 +39.49 722 14. Bulandshahr 1,891,437 ( 16) 2,349,603 (16) + 18.66 +24.22 540 15. ~oradabad 2,428,971 ( 8) 3,151,294 ( 8) +23.07 +29.74 528 16. Rampur 901,209 (44) 1,177,022 (44) +28.46 +30.60 497 17. Budaun 1,645,967 (22) 1,963,832 (27) +16.60 +19.31 380 18. Bareilly 1,779,867 (20) 2,264,634 (20) +20.38 +27.24 550 19. Pilibhit 752,114 (48) 1,010,839 (47) +22.05 +34.40 289 20. Shahjahanpur 1,286,104 (40) 1,648,065 (39) +13.79 +28.14 360 21. Aligarh 2,111,829 (12) 2,564,748 (13) + 19.63 +21.45 511 22. ~athura 1,290,307 (39) 1,555,239 (41) +20.45 +20.53 408 23. Agra 2,308,638 ( 9) 2,861,381 (10) +23.98 +23.94 596 24. Etah 1,570,925 (27) 1,837,565 (34) +20.87 + 16.97 413 25. ~ainpuri 1,445,534 (36) 1,723,441 (38) +22.41 + 19.23 397 26. Farrukhabad 1,556,930 (28) 1,947,708 (29) +20.22 ·:-25.10 456 27. Etawah 1,447,702 (35) 1,747,443 (37) +22.46 +20.70 404 28. Kanpur 2,996,232 ( 2) 3,787,134 ( 2) +25.81 +26.40 613 29. Fatehpur 1,278,254 (41) 1,565,677 (40) +19.94 +22.49 377 30. Allahabad 2,937,278 ( 4) 3,781,306 ( 3) +20.46 +28.74 521 31. Jalaun 813,490 (46) 987,432 (48) +22.67 +21.38 216
6

STATEMENT SHOWING A COMPARATIVE PICTURE OF THE POPULATION 1981 Census
(Provisional Figures)
State /District Total Population Decennial Growth Demityof Rates (Percentage) Population 1981
(per Km.2)
Population in 1971 Popula tion in 1981 1961-71 1971-81 (and rank) (and rank)
2 3 4 5 6
32. Jhansi 870,138 (45) 1,137,714 (45) +21.79 +30.75 226
33. Lalitpur 436,920 (52) 584,989 (52) +17.14 +33.89 116
34. Hamirpur 988,215 (43) 1,193,223 (43) +24.39 +20.75 167
35. Banda 1,182,215 (42) 1,537,903 (42) +23.96 +30.09 202
36. Kheri 1,486,590 (33) 1,964,007 (26) +18.13 +32.11 256
37. Sitapur 1,884,400 (17) 2,336,450 (17) +17.18 +23.99 407
38. Hardoi 1,849,519 (18) 2,279,919 (19) + 17.57 +23.27 381
39. Unnao 1,484,393 (34) 1,821,594 (35) +21.00 +22.72 400
40. Lucknow 1,617,846 (25) 2,017,117 (24) +20.84 +24.68 798
41. Rae Bareli 1,510,812 (31) 1,886,975 (32) + 14.27 +24.90 409
42. Bahraich 1,726,972 (21) 2,220,998 (21) + 15.14 +28.61 323
43. Gonda 2,302,029 (10) 2,895,856 ( 9) +11.04 +25.80 394
44. Bara Banki 1,635,593 (24) 2,013,600 (25) + 15.63 +23.11 458
45. Faizabad 1,927,281 (15) 2,369,487 (15) + 17.90 +22.94 525
46. Sultanpur 1,642,928 (23) 2,037,974 (23) + 16.27 +24.05 459
47. Pratapgarh 1,422,707 (37) 1,806,833 (36) + 13.62 +27.00 486
48. Basti 2,984,090 ( 3) 3,576,783 ( 5) +13.65 +19.86 495
49. Gorakhpur 3,038,177 ( 1) 3,795,735 ( 1) +18.44 +24.93 605
50. Deoria 2,812,350 ( 7) 3,477,350 ( 7) + 18.41 +23.65 639
51. Azamgarh 2,857,484 ( 5) 3,541,261 ( 6) +18.66 +23.93 G17
52. Jaunpur 2,005,434 (14) 2,527,492 (14) +16.10 +26.03 626
53. BaHia 1,588,935 (26) 1,925,633 (31) +18.22 +21.19 604
54. GhazijJur 1,531,654 (30) 1,941,665 (28) +15.90 +26.77 575
55. Varanasi 2,852,459 ( 6) 3,689,908 ( 4) +20.62 +29.36 725
56. Mirzapur 1,541,088 (29) 2,040,561 (22) +23.59 +32.41 180
7

MAPS &
CI-IARTS

COMPARATIVE POPULATION SIZE
1981 (PROVISIONAL)
UK UTTARUSHI 0 11%
C CHAMOL! 0 33%
TG TEHRI·GARHW.lL 0 45%
P PI THORA(j,.lRH 0 43%
OF THE DISTRICTS
."Rll~ l Y
-- PlUBHIT
S~~~JAHM;PUI!
ALIGARH
11---------. ~!:U"A ---- __ ,fC.f,f ----.._
11


CENSUS 1981
BACKGROUND NOTE

22
BACKGROUND NOTE
The Indian Census will have seen in 1981 no less than 125 years of amazingly active life. The lO-yearly series of census counts started around 1865-1872 and in the last 110 years the Census Commissioner of India has with unfailing zeal moved from house to house throughout this great land increasing the population from mere 206 million in 1882 to a hefty 684 million in 1981. The total population of Uttar Pradesh has risen by over 2-1/2 times to reach 110,858,019 in 1981 since 1872.
The Census Commissioner on top and Directors in each State and Union Territory form the top hierarchy in the country. It then descends [rom the District Collectors to District Census Officers in each district and from Administrators to City Census Officers in each N agarmahapalika, with charge officers of the rank of Sahayak Nagar Adhikaris and Tahsildars and Executive Officers of Municipal Boards, Notified Areas etc. They form the backbone of this huge operation. An army of 250 thousand field workers (Supervisors and Enumerators) fanned out ali over the State to compile massive census data in one of the biggest administrative operations in the world. Chart showing the census hierarchy is given after this note.
The preparations for the census continued through the inter-censal period. They gained momentum with the appointment of Directors of Census Operations
about 2 years ago.
The first step to a census is deciding the contents of questionnaires to be canvassed. These were developed after detailed discussions with the different data users-Ministries of Government of India, Planning Commission, Central Statistical
Organization, Director General of Employment and Training, Department of Social vVelfare, Chambers of Commerce and Industry, Individual scholars etc. The different questionnaires were pretested in the field before they were finalized. The basic questionnaires finally adopted for the 1981 Census were (1) the Houselist; (2) the Enterprise List; (3) the Household Schedule including the population record and (4)
the Individual Slip.
The initial field preparations involved finalization of maps of each town and its constituent wards in urban areas and each tahsil in rural areas. Each of these administrative units was then sub-divided into enumerator blocks-the working area for an enumerator. The blocks were carved-out of nearly equal size in population with clear cut boundaries. In case of rural areas attempt was made to keep the ideal size at about 750 population and in case of urban areas at about 600 population
per block.

Th<:> 1981 Census was conducted in two phases i.e. houselisting and enumeration. Notional map of each block was first prepared delineating its boundaries and important landmarks. Then, the layout sketch of each block was prepared indicating structures alongside streets and lanes in it. House numbering was also done in Geru in villages and small towns and in big cities and municipal boards and cantonment boards, with black crayons.
Durmg the Houselisting phase the Houselist and the Enterprise List wer<filled. The Enterprise List in itself forms the economic census of India 1980. In order to provide for the economic census at houselisting itself the contents of the Houselist for census were kept at the minimum. Of course, the year 1981 being the International year for physically handicapped, information of totally crippled, blind and dumb per
sons was also collected besides the total number of persons in each household. From the Houselist, Abridged Houselists were extracted to serve as a frame for the enumeration. At this stage, when population of each block became available, the big blocks were sub-divided into smaller blocks of ideal size mentioned above in order not only to distribute the work to enumerators equitably but also to make a frame of clusters of uniform size alongwith the layout sketches and Abridged Houselist for future sample surveys.
The second phase i.e. enumeration, ran from 9th February, 1981 through 28th February, 1981 followed by a whole night work of enumerating the house less (on 28th February-1st March) and followed by a revisional round (from March I to 5) to update the information with reference to the sunrise of March 1,1981, the reference point of time. During enumeration, the Household Schedules and Individual Slips were filled for each household and each person living in it.
The Household Schedule--Part I collected information on name of head, his religion, whether belongs to SC/ST, language mainly spoken in the household, does the household live in owned house or does it own a house or housesite at the place of enumeration, predominant construction material of house, amenities available to the household vi;:. drinking water, electricity and toilet, number ofliving rooms, number of couples, does the household cultivate land and local name of tenancy. Then, Part II was filled to serve as a population record for each household .
. \n Individual Slip has as many as 16 questions on various demographic and economic aspects of an individual, like name, relation to head, sex, age, marital status, mother-tongue, two other languages known, does he belong to SCjST, literacy, level of education and does he/she attend school/college. Besides, information regarding the economic activity of the person in great detail was collected.
In addition to these, 6 additional questions on migration and fertility were also asked in a 20 per cent sample of blocks. In these sample blocks detailed information was collected from each degree holder and technical personnel. They themselves filled the schedules and returned to the enumerator or posted it at the pre-printed
23
24
address. Collection of some information on a sample basis was done for the first time in this census.
Both the houselisting and enumeration operations werc preceded by 3 rounds of intensive training-theoretical and practical. These training programmes were intensively monitored and supervised. The census being a time bound operation, it was a yeoman's job to locate such a large number of people, to train them intensively, to issue them all forms etc., to supervise their work in the field and to collect records on a fixed date from them. Thereafter, the totals were built up from blocks to supervisor circles to charge level and finally to district level.
>:r (.) 0: « 0: UJ
::::t: (/) ::> (/)
z UJ u
~ l(/)
ffi a:
:r: If) w o <t 0:: 0.
0:
~ I:::>
If) :::> If) z w U LL. o 0:
r:? u W 0:: (5
25

ApPENDIX-1
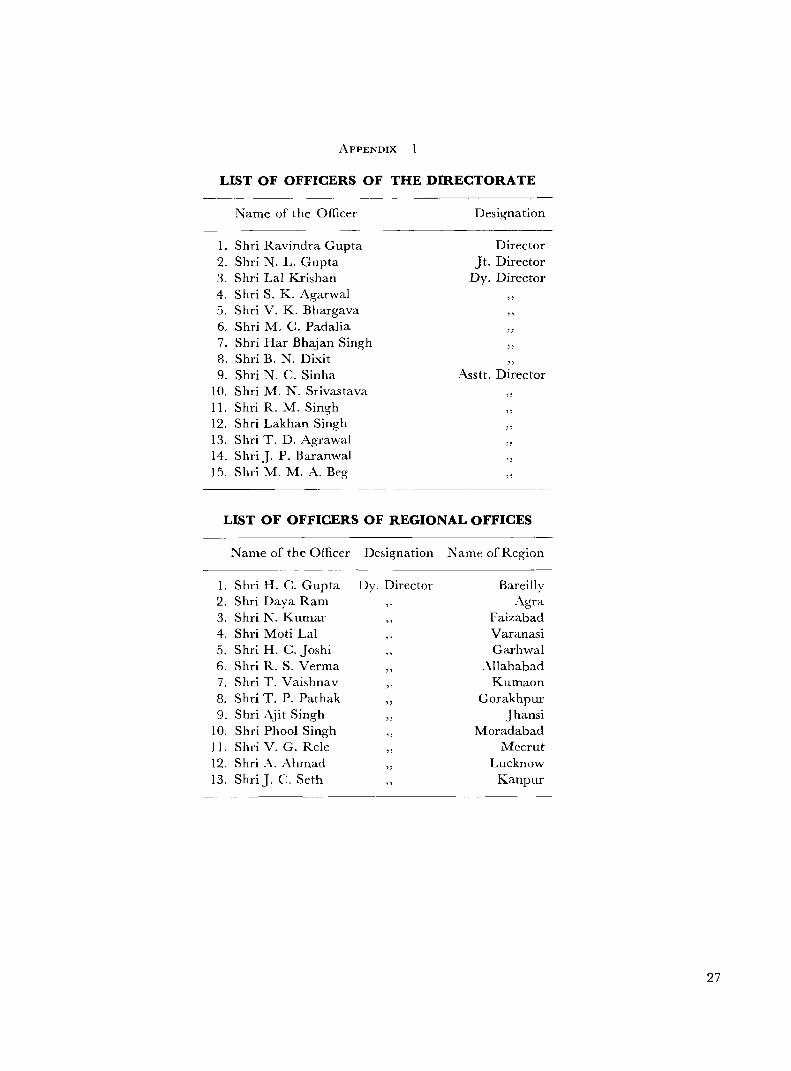
LIST OF OFFICERS OF THE DIRECTORATE
Name of the Officer Designation
1. Shri Ravindra Gupta Director 2. Shri N. L. Gupta Jt. Director 3. Shri Lal Krishan Dy. Director 4. Shri S. K. Agarwal
" 5. Shri V. K. Bhargava ,. 6. Shri M. C. Pad alia
" 7. Shri Har Bhajan Singh " 8. Shri B. N. Dixit " 9. Shri N. C. Sinha Asstt. Director
10. Shri M. N. Srivastava "
II. Shri R. M. Singh 12. Shri Lakhan Singh
" 13. Shri T. D. Agrawal
" 14. Shri J. P. Baranwal IS. Shri M. M. A. Beg
"
LIST OF OFFICERS OF REGIONAL OFFICES
Name of the Officer Designation Name of Region
1. Shri H. C. Gupta Dy. Director Bareilly 2. Shri Daya Ram Agra 3. Shri N. Kumar Faizabad 4. Shri Moti Lal Varanasi 5. Shri H. C. Joshi Garhwal 6. Shri R. S. Verma
" .\llahabad
7. Shri T. Vaishnav "
Kumaon 8. Shri T. P. Pathak
" Gorakhpur
9. Shri Ajit Singh Jhansi 10. Shri Phool Singh Moradabad II. Shri V. C. Rele
" Meerut
12. Shri A. Ahmad "
Lucknow 13. Shri J. C. Seth Kanpur
27

28
ApPENDIx-2
OFFICIALS WHO WORKED IN THE "PROVISIONAL POPULATION TOTALS-PROJECT"-1981 CENSUS
Supervision Shri Lal Krishan, DepUf)' Director
Shri M. C. Padalia, Deputy Director Shri J. P. Baranwal, Assistant Director
1. COMPILATION
Shri P. C. Tewari, Investigator
1. Shri Rafiq Uddin Statistical Asstt. 2. Shri S. C. Sharma Statistical Asstt. 3. Shri Ram Dass Stenographer 4. Shri M. K. Sharma Computor 5. Shri R. A. Misra Computor 6. Shri S. P. Singh Computor 7. Shri Prabhu Nath Computor 8. Shri Narendra Kumar Computor 9. Shri R. A. Gupta Computor
II. MAPPING
Shri]. c:. Srivastava, Sr. Geographer
1. Shri T. N. Srivastava 2. Shri S. P. Saxena 3. Shri N. C. Bose 4. Shri H. C. Tewari 5. Shri S. P. Ram 6. Shri Dunia Prasad 7. Shri Nagendra Pandey 8. Shri Naveen Chandra
III. PRINTING
Sf. Draughtsman Sr. Draughtsman
Draughtsman Draughtsman Draughtsman Draughtsman
Statistical Asstt. Hand Press Machine
Operator
Shri R. K. Saxena, Printing Inspector
1. Shri V. K. Srivastava 2. Shri R. P. Srivastava 3. Shri Ajai Kumar 4. Shri B. Bose
Statistical Asstt. Computor Computor
Assistant Compiler
ANALYSIS OF
RESULTS

30
ANALYSIS OF RESULTS
The 1981 Census population (provisional) of Uttar Pradesh as recorded at the sunrise of 1st March, 1981 was 110,858,019, consisting of 58,780,640 males and 52,077,379 females. This is one sixth of the country's population of 683,810,051 (provisional). Uttar Pradesh, thus, continues to hold the first rank in population amongst all the States and Union Territories. In area, it stands fourth.
During the decade (1971-81), the population of Uttar Pradesh increased by 22,516,875 persons, the decadal growth rate being 25.49 per cent.
The projections of population made by the Expert Committee on Population Projections, which have been our guide during the inter censal period, show that their estimate has been exceeded by the actual count by about 5 per cent in this State. Against a count of 110.9 million, the estimate was only 105.7 million. The All India count also reveals the same, though to a much lesser degree. As against an estimate of 672.0 million, the actual count registered 683.8 million, showing an excess of 1.8 per cent. The validity of the count is supported by the difference in the birth and death rates assumed for the estimates and those actually registered through the Sample Registration System operating in the State. The latest figures (1979) thrown up by the Sample Registration System are : Birth Rate -39.6 and Death Ratc-16.2 as against the assumed rates of 32.9 and 13.2 respectively. It is hoped that the age distribution of the population which will be available after the detailed tabulation of the census data, will throw further light on this subject.
Size and Distribution of Population Gorakhpur with a population of 3,795,735 ranks first amongst the 56 districts of
this State. The other districts close on the heels with population exceeding 3 million are: Kanpur (3,787,134), Allahabad (3,781,306), Varanasi (3,689,908), Basti (3,576,783), Azamgarh (3,541,261), Deoria (3,477,350) and :Moradabad (3,151,294). Uttarkashi has again recorded the lowest population (189,102). The hree districts, each having population less than haIfa million are Chamoli (364,231),
Pithoragarh (479~452) and Tehri-Garhwal (493,819)-all lying in the Himalayan Hills.
It will be observed that Gorakhpur and Kanpur districts continue to hold first and second places consistently both in 1971 and 1981. Allahabad has moved up to 3rd place in 1981, displacing Basti which has gone down to the 5th place. The fourth place has now been bagged by Varanasi which ranked 6th in 1971.

Growth Rate of Population During the decade 1971-81, the population of Uttar Pradesh has gone up by
25.49 per cent as against 19.78 per cent in 1961-71. Excepting districts Dehra Dun. Garhwal, Pithoragarh, Almora. Agra, Etah, Mainpuri, Etawah, Jalaun and Hamirpur where the increase in 1971-81 was less than in 1961-71, the rest of the districts have shown higher growth rates during 1971-81 as against 1961-71. The highest growth rate was recorded in Nainital district (43.26 per cent) followed by Ghaziabad (39.49 per cent). Other districts showing a growth rate 25 per cent above the State average are Pilibhit (34.40), Lalitpur (33.89), .Mirzapur (32.41) and Kheri (32.11). The districts are more or less evenly divided on either side of the mean.
Sex Ratio The sex ratio i.e. the number of females per 1000 males, has increased from 879
in 1971 to 886 in 1981. The districts where the sex-ratio has gone down in 1981 as compared to 1971 are Uttarkashi, Chamoli, Tehri-Garhwal, Budaun, Mathura, Agra, Etah, Fatehpur, Allahabad, Jalaun, Jhansi, Hamirpur, Banda, Rae Bareli, Sultanpur, Pratapgarh, Jaunpur, Varanasi and Mirzapur. In the rest, sex ratio follows the state trend of increase. The districts where the females are outnumbering males are Garhwal (1142), Almora (1108), Tehri-Garhwal (1104), Pithoragarh (1055), Chamoli (1043), Azamgarh (1022), Pratapgarh and Jaunpur (1010 each). In all these districts except Azamgarh, the sex ratio was in favour of females in 1971 also. The least sex ratio is in Budaun (808) followed upwards by Shahjahanpur and Mathura
(813 each) and Dehra Dun (818).
Density of Population The density of population of Uttar Pradesh works out to 377 which means that 77
more persons are occupying a sq. kilometre area as compared to 1971. The highest density was recorded in Lucknow (798). Other districts with density above 700 are Varanasi (725), Ghaziabad (722) and Meerut (708). Uttarkashi (24) continues to be the most sparsely populated district of the State, followed upwards by
Chamoli (40) and Pithoragarh (54).
Literacy The crude literacy rate has gone up to 27.38 per cent in 1981 as against 21.70
per cent in 1971 with male literacy up from 31.50 in 1971 to 38.87 in 1981 and the female literacy up at 14.42 per cent in 1981 from 10.55 per cent in 1971. In all the districts of the State the literacy rate has increased both for males and females. In Dehra Dun district nlOre than half 0:' the population (51.84 per cent) is literate, followed by Kanpur (44.29), Garhwal (41.69) and Lucknow (40.13). Dehra Dun and Kanpur held the same rank in 1971 and Garhwal has out-stripped Lucknow. The lowest literacy is in district Budaun (16.03), followed upward by Rampur (16.33), Bahraich (16.40) and Gonda (16.95). In 1971, Bahraich was at the bottom with Budaun, Rampur, Gonda and Bara Banki a little ahead of it. Male literacy is also highest in Dehra Dun district (60.53 per cent) followed by Garhwal (58.20), Chamoli (57.55), Almora (57.42), Pithoragarh (56.33), Kanpur (53.48), Jhansi (50.40) and
31

32
Jalaun (50.10). Dehra Dun has maintained the highest level in male literacy during the decade. Rampur (22.57), remains at the bottom. In female literacy, Dehra Dun once again tops the list with 41.22, followed by Kanpur (33.23), Lucknow (29.60), Garhwal (27.23) and Nainital (25.98). Dehra Dun, Kanpur and Lucknow have held their positions during the decade whereas Garhwal has inched above Nainital. As in 1971, Bahraich (6.34 per cent) remains at the bottom in 1981 also.
CITIES
Any town with population exceeding 100 thousand is called a city in census parlance. An urban agglomeration consists of a city or town with one or more adjoining towns or outgrowths beyond its statutory limits which together form a continuous spread.
The number of cities/urban agglomerations having a population of one hundred thousand and above has gone up to 30 from 22 in 1971 with the addition of Hardwar UA, Amroha MB, Etawah MB, Sambhal MB, Jaunpur MB, Bulandshahr MB, Hapur MB and Bahraich l\fB to this stratum. Kanpur VA having population of 1,685,308 continues to rank first among the cities, followed by Lucknow VA (1,006,843) which has just crossed the million mark, Varanasi VA (798,057), Agra VA (752,587) and Allahabad VA (632,359).
The sex ratio in none of the cities is favourable to females. The highest sex ratio is in Rampur MB (898) and lowest in Ghaziabad VA (793). Leaving aside Ghaziabad UA, in the remaining, the range of sex ratio spreads from 804 to 893.
Dehra Dun VA holds the top rank in literacy with about 2/3rd of its population (66.01 per cent) as literate. Other cities where more than half of the population is literate are Gorakhpur, Allahabad, Lucknow, Hardwar, Kanpur, Jhansi, Faizabad, Ghaziabad, Muzaffarnagar, Mathura and l\leerut. Lowest literacy is in Sambhal MB (24.84 per cent). Dehra Dun VA holds the top position (71.63 per cent) in male literacy also while Sambhal (30.38 per cent) remains at the bottom. Dehra Dun is the only city where more than half of the female popUlation (59.41 per cent) is literate. The other cities nearing the 50% mark are Gorakhpur (49.37): Lucknow (48.89) and Allahabad (48.21). Sambhal (18.50) is at the bottom in this respect also, followed up by Amroha (20.1 l'L
PROVISIONAL POPUl_JA TION TABLES

TABLE 1
DISTRIBUTION OF POPULATION, SEX RATIO, GROWTH RATE AND DENSITY OF POPULATION BY DISTRICTS
1981 Census (Provisional Figures)
State/District Population 1981 Sex Ratio Density of Decennial Growth (Females per Population Rate of 1000 Males) per Km2 Population
----Persons Males Females 1971 1981 1971 1981 1961-71 1971-81
2 3 4 5 6 7 8 9 10
UTTAR PRADESH 110,858,019 58,780,640 52,077,379 879 886 300 377 + 19.78 +25.49 1. U ttarkashi 189,102 99,862 89,240 899 894 18 24 +20.33 +27.94 2. Chamoli 364,231 178,292 185,939 1061 1043 32 40 + 15.58 +24.49 3. Tehri-Garhwal 493,819 234,728 259,091 1189 l104 90 112 + 14.28 +24.27 4. Dehra Dun 758,241 417,036 341,205 770 818 187 246 +34.57 +31.34 5. Garhwal 623,617 291,115 332,502 1118 1142 102 115 + 14.66 +12.76 6. Pithoragarh 479,452 233,293 246,159 1026 1055 47 54 +20.64 + 15.49 7. Almora 747,557 354,639 392,918 1088 Ll08 120 139 + 17.32 +15.25 8. Nainital 1,131,876 614,280 517,596 798 843 116 167 + 37.57 +43.26 9. Saharanpur 2,673,136 1,459,453 1,213,683 821 832 372 478 +27.20 +30.09
10. Muzaffarnagar 2,288,387 1,241,064 1,047,323 831 844 425 548 +24.73 +26.97 11. Bijnor 1,925,637 1,033,432 892,205 853 863 307 397 +25.12 +29.22 12. Meerut 2,767,101 1,504,090 1,263,011 832 840 566 708 +21.35 +25.32 13. Ghaziabad 1,870,473 1,020,151 850,322 832 834 515 722 +29.34 +39.49 14. Bulandshahr 2,349,603 1,259,118 1,090,485 855 866 435 540 + 18.66 +24.22 15. Moradabad 3,151,294 1,709,946 1,441,348 837 843 409 528 +23.07 +29.74 16. Rampur 1,177,022 638,404 538,618 836 8-H 380 497 +28.46 +30.60 17 Budaun 1,963,832 1,086,007 877,825 812 808 319 380 + 16.60 + 19.31 18. Bareilh- 2,264,634 1,236,810 1,027,824 817 831 431 550 +20.38 +27.24 19. Pilibhit 1,010,839 547,209 463,630 827 347 215 289 +22.05 +34.40 20. Shahjahanpur 1,648,065 909,108 738,957 797 813 281 360 +13.79 +28.14 21. Aligarh 2,564,748 1,394,094 1,170,654 834 840 420 511 + 19.63 +21.45 22. Mathura 1,555,239 857,631 697,608 822 813 340 -lO8 +20.45 +20.53 23. Agra 2,861,381 1,567,167 1,294,214 829 826 479 596 +23.98 +23.94 24. Etah 1,837,565 1,005,349 832,216 833 828 353 413 -/- 20.87 + 16.97 25. Mainpuri 1,723,441 939,245 784,196 833 835 340 397 +22.41 + 19.23 26. Farrukhabad 1,947,708 1,066,254 331,454 817 827 358 456 +20.22 +25.10 27. Etawah 1,747,443 953,977 793,466 826 832 335 404 +22.46 +20.70 28. Kanpur 3,787,134 2,068,420 1,718,714 812 831 490 613 +25.81 +26.40 29. Fatehpur 1,565,677 825,805 739,872 901 896 307 377 + 19.94 +22.49
34
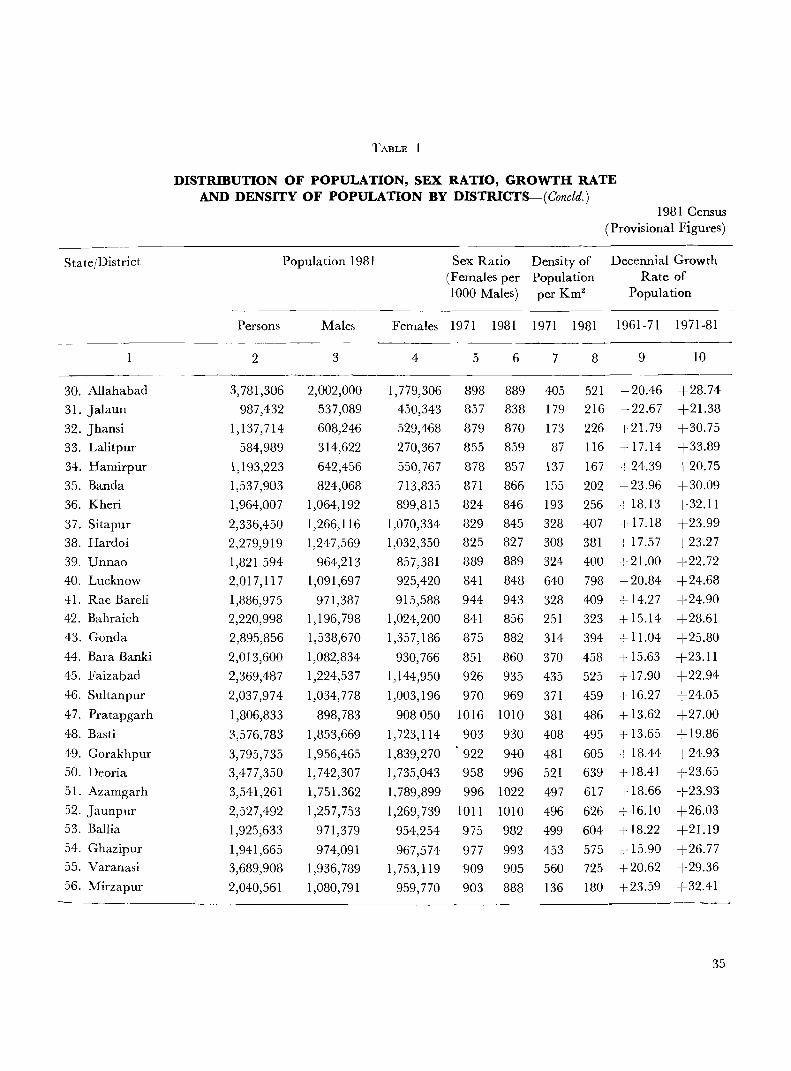
TABLE 1
DISTRffiUTION OF POPULATION, SEX RATIO, GROWTH RATE AND DENSITY OF POPULATION BY DISTRICTS-( Concld.)
1981 Census (Provisional Figures)
State/District Population 1981 Sex Ratio Density of Decennial Growth (Females per Population Rate of 1000 Males) per Km2 Population
----Persons Males Females 1971 1981 1971 1981 1961-71 1971-81
2 3 4 5 6 7 8 9 10
30. Allahabad 3,781,306 2,002,000 1,779,306 898 889 405 521 +20.46 +28.74
31. Jalaun 987,432 537,089 450,343 857 838 179 216 +22.67 +21.38
32. Jhansi 1,137,714 608,246 529,468 879 870 173 226 +21.79 +30.75
33. Lalitpur 584,989 314,622 270,367 855 859 87 116 + 17.14 +33.89
34. Hamirpur 1,193,223 642,456 550,767 878 857 137 167 +24.39 +20.75
35. Banda 1,537,903 824,068 713,835 871 866 155 202 +23.96 +30.09
36. Kheri 1,964,007 1,064,192 899,815 824 846 193 256 + 18.13 +32.11
37. Sitapur 2,336,450 1,266,116 1,070,334 829 845 328 407 +17.18 +23.99
38. Hardoi 2,279,919 1,247,569 1,032,350 825 827 308 381 + 17.57 +23.27
39. Unnao 1,821 594 964,213 857,381 889 889 324 400 +21.00 +22.72
40. Lucknow 2,017,117 1,091,697 925,420 841 848 640 798 +20.84 +24.68
41. Rae Bareli 1,886,975 971,387 915,588 944 943 328 409 + 14.27 +24.90
42. Bahraich 2,220,998 1,196,798 1,024,200 841 856 251 323 + 15.14 +28.61 43. Gonda 2,895,856 1,538,670 1,357,186 875 882 314 394 + 11.04 +25.80
44. Bara Banki 2,013,600 1,082,834 930,766 851 860 370 458 + 15.63 +23.11
45. Faizabad 2,369,487 1,224,537 1,144,950 926 935 435 525 + 17.90 +22.94
46. Sultanpur 2,037,974 1,034,778 1,003,196 970 969 371 459 + 16.27 +24.05
47. Pratapgarh 1,806,833 898,783 908050 1016 1010 381 486 + 13.62 +27.00
48. Basti 3,576,783 1,853,669 1,723,114 903 930 408 495 + 13.65 +19.86
49. Gorakhpur 3,795,735 1,956,465 1,839,270 922 940 481 605 + 18.44 +24.93
50. Deoria 3,477,350 1,742,307 1,735,043 958 996 521 639 +18.41 +23.65
51. Azamgarh 3,541,261 1,751,362 1,789,899 996 1022 497 617 + 18.66 +23.93
52. Jaunpur 2,527,492 1,257,753 1,269,739 1011 1010 496 626 + 16.10 +26.03 53. BaHia 1,925,633 971,379 954,254 975 982 499 604 + 18.22 +21.19 54. Ghazipur 1,941,665 974,091 967,574 977 993 453 575 + 15.90 +26.77 55. Varanasi 3,689,908 1,936,789 1,753,119 909 905 560 725 +20.62 +29.36
56. Mirzapur 2,040,561 1,080,791 959,770 903 888 136 180 +23.59 +32.41
35

TABLE 2
DECADAL VARIATION IN POPULATION SINCE 1961 1981 Census
(Provisional Figures)
State/District Percentage Decadal Variation in Population
1901-11 1911-21 1921-31 1931-41 1941-51 1951-61 1961-71 1971-81
2 3 4 5 6 7 8 9
UTTAR PRADESH - 0.97 - 3.08 + 6.66 +13.57 +11.82 +16.66 +19.78 +25.49 . 1. U ttarkashi + 1l.88 + 5.85 + 9.79 + 13.67 + 3.69 + 15.82 +20.33 +27.94
2. Charnoli + 11.69 + 1.16 +10.04 +12.78 + 6.23 + 16.67 + 15.58 +24.49
3. Tehri-Garhwal -I- 11.88 + 5.85 + 9.78 + 13.67 + 3.72 + 13.53 +14.28 +24.27 4. Dehra Dun +15.25 + 3.59 + 8.48 + 15.63 +36.08 + 18.61 +34.57 +31.34 5. Garhwal + 11.69 + 1.16 +10.04 +12.78 + 6.23 +14.12 + 14.66 + 12.76
6. Pithoragarh + 15.88 + 0.90 + 9.99 + 17.83 +12.46 +19.88 +20.64 +15.49 7. Almora + 15.88 + 0.90 + 9.99 + 17.83 +12.46 +13.80 + 17.32 +15.25 8. Nainital - 0.15 ·-14.42 + 0.15 + 5.26 +14.92 +73.10 +37.57 +43.26 9. Saharanpur - 5.62 - 4.97 + 11.37 +12.99 +14.67 +19.34- +27.20 +30.09
10. Muzaffarnagar - 7.82 - l.64 +12.68 + 18.12 + 15.61 +18.26 +24.73 +26.97 11. Bijnor + 3.33 - 8.15 + 12.85 + 8.95 + 8.13 +21.01 +25.12 +29.22 12. Meerut - l.35 - 0.31 + 6.89 + 18.39 +20.28 +18.15 +21.35 +25.32 13. Ghaziabad - 1.34 - 1.02 + 6.85 + 18.03 +19.38 +21.17 +29.34- +39.49 14. Bulandshahr - 1.26 - 5.04 + 6.63 + 15.86 + 13.87 +15.06 +18.66 +24.22 15. Moradabad + 5.95 - 5.11 + 7.12 +14.72 + 12.75 +19.74 +23.07 +29.74 16. Rampur - 0.27 -14.44 + 2.64 + 2.81 +13.87 +25.27 +28.46 +30.60 17. Budaun + 2.74 - 7.46 + 3.56 + 15.03 + 7.64 +12.83 +16.60 +19.31 18. Bareilly + 0.42 - 7.38 + 5.77 + 9.68 + 7.91 +16.51 +20.38 +27.24 19. Pilibhit + 3.67 - 11.49 + 3.99 + 9.33 + 2.79 +22.18 +22.05 +34.40 20. Shahjahanpur + 2.53 - 11.16 + 5.75 + 8.68 + 2.14 + 12.53 +13.79 +28.14 21. Aligarh - 2.93 - 8.92 + 10.36 + 17.15 + 12.45 +14.37 +19.63 +21.45 22. Mathura -13.97 - 5.70 + 7.86 +20.80 +12.45 +17.43 +20.45 +20.53 23. Agra - 3.66 - 9.56 +13.44 +23.02 +16.52 +24.03 +23.98 +23.94 24. Etah + 0.87 - 4.78 + 3.71 +14.44 +14.18 +15.59 +20.87 +16.97 25. Mainpuri - 3.83 - 6.22 + 0.21 +16.40 +13.90 +18.82 +22.41 + 19.23 26. Farrukhabad - 2.77 - 4.82 + 4.50 + 8.80 +14.34 +18.54 +20.22 +25.10 27. Etawah - 5.79 - 3.50 + 1.70 +18.40 + 9.90 +2l.79 +22.46 +20.70 28. Kanpur - 9.26 + 0.56 + 5.54 +28.38 +24'65 +22.76 +25.81 +26.40 29. Fatehpur - 1.38 - 3.63 + 5.58 +17.15 +12.65 +18.06 +19.94 +22.49 30. Allahabad - 1.56 - 4.27 + 6.20 +21.46 +13.01 +19.29 +20.46 +28.74 31. Jalaun + 1.68 N + 4.85 +14.02 + 7.39 +19.80 +22.67 +21.38
36
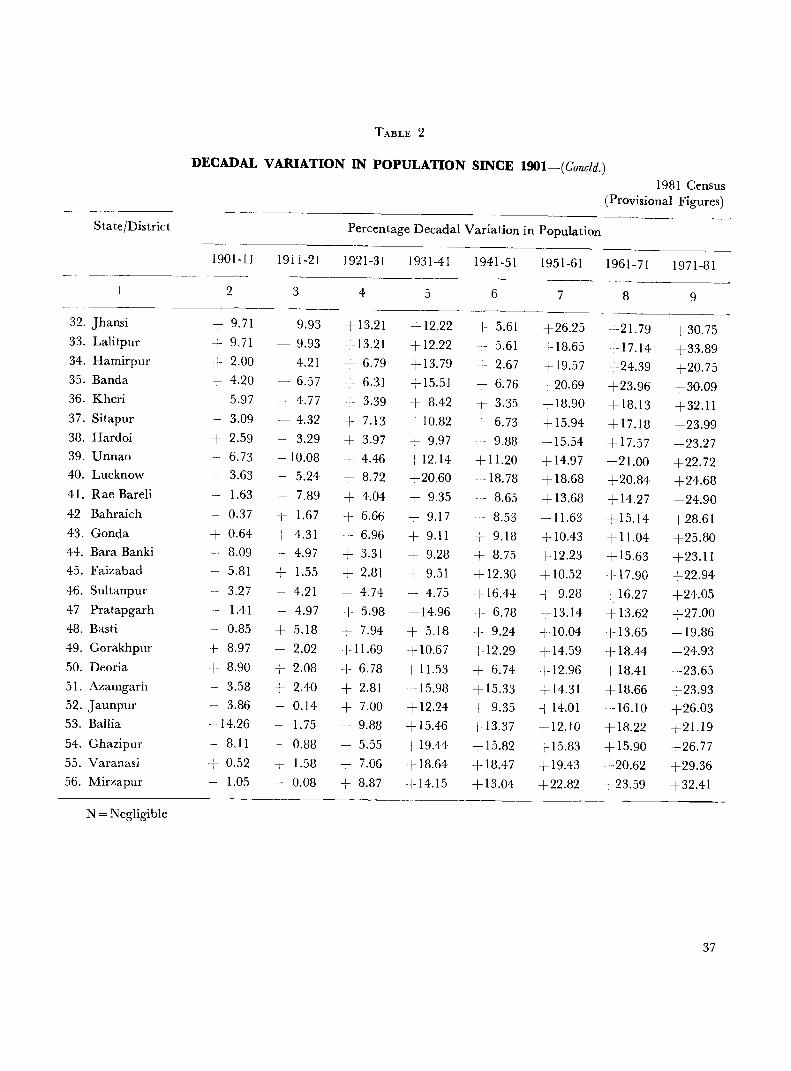
TABLE 2
DECADAL VARIATION IN POPULATION SINCE 1901-(Concld.)
1981 Census (Provisional Figures)
State/District Percentage Decadal Variation in Population
1901-11 1911-21 1921-31 1931-41 1941-51 1951-61 1961-71 1971-81
2 3 4 5 6 7 8 9
32. Jhansi + 9.71 - 9.93 + 13.21 + 12.22 + 5.61 +26.25 +21.79 +30.75 33. Lalitpur + 9.71 - 9.93 +13.21 + 12.22 + 5.61 +18.65 +17.14 +33.89 34. Hamirpur + 2.00 - 4.21 + 6.79 + 13.79 + 2.67 + 19.57 +24.39 +20.75 35. Banda + 4.20 - 6.57 + 6.31 +15.51 + 6.76 +20.69 +23.96 +30.09 36. Kheri + 5.97 - 4.77 + 3.39 + 8.42 + 3.35 +18.90 +18.13 +32.11 37. Sitapur - 3.09 - 4.32 + 7.13 + 10.82 + 6.73 +15.94 +17.18 +23.99 38. Hardoi + 2.59 - 3.29 + 3.97 + 9.97 + 9.88 +15.54 +17.57 +23.27 39. Unnao - 6.73 -10.08 + 4.46 + 12.14 +11.20 + 14.97 +21.00 +22.72 40. Lucknow - 3.63 - 5.24 + 8.72 +20.60 + 18.78 +18.68 +20.84 +24.68 41. Rae Bareli - 1.63 - 7.89 + 4.04 + 9.35 + 8.65 +13.68 + 14.27 +24.90 42 Bahraich - 0.37 -t- 1.67 + 6.66 + 9.17 + 8.53 + 11.63 +15.14 +28.61 43. Gonda + 0.64 + 4.31 + 6.96 + 9.11 + 9.18 + 10.43 + 11.04 +25.80 44. Bara Banki - 8.09 - 4.97 + 3.31 + 9.28 + 8.75 + 12.23 + 15.63 +23.11 45. Faizabad - 5.81 + 1.55 + 2.81 + 9.51 + 12.30 +10.52 +17.90 +22.94 46. Sultanpur - 3.27 - 4.21 + 4.74 + 4.75 +16.44 + 9.28 + 16.27 +24.05 47 Pratapgarh - 1.41 - 4.97 + 5.98 +14.96 + 6.78 +13.14 +13.62 +27.00 48. Basti - 0.85 + 5.18 + 7.94 + 5.18 + 9.24 +10.04 + 13.65 +19.86 49. Gorakhpur + 8.97 + 2.02 + 11.69 + 10.67 + 12.29 +14.59 + 18.44 +24.93 50. Deoria + 8.90 + 2.08 + 6.78 + 11.53 + 6.74 +12.96 + 18.41 +23.65 51. Azamgarh - 3.58 + 2.40 + 2.81 + 15.98 + 15.33 + 14.31 +18.66 +23.93 52. Jaunpur - 3.86 - 0.14 + 7.00 + 12.24 + 9.35 + 14.01 +16.10 +26.03 53. BaHia - 14.26 - 1.75 + 9.88 +15.46 + 13.37 + 12.10 + 18.22 +21.19 54. Ghazipur - 8.11 - 0.88 + 5.55 +19.44 + 15.82 + 15.83 +15.90 +26.77 55. Varanasi + 0.52 _L 1.58 + 7.06 + 18.64 +18.47 + 19.43 +20.62 +29.36 I
56. Mirzapur - 1.05 - 0.08 + 8.87 +14.15 +13.04 +22.82 +23.59 +32.41
N = Negligible
37

N
38
-.,j<O'lc-r.oON O'l -t: ~ c- co c<'l o::lt--~o)O<!)
~ -.,j< ~. 0 ~ 0 ~ N ~ ~ t-- 0 r.o 0 ~ ~ t-- ~ ~ t-- 0 .~ O~N~~<!) ~CO~~t--<!)~~c-c<'l c-~ ~ t-- t-- ci cO <!) r-..: cD co O'l cD cD O'l N cO N N O'l ci c<'l
"'~ ~<!) ~~ ~~ ~~~-.,j<-.,j<fNNNNC<")gf
=O'l<!)O~O'lo::l"'O~O'l t--O'l ....... "'e<"le<"lN ....... 0 e"JN<!)~CO<!)~ N"'~CO~r.oc:t--C<"lc:~O'l~N r..: o:i r-..: t-- _ ...... r--- co r-..: oi O'l cD ~ cD O'l ci cD <!) .- 0 -t: .-<
NNc<'lN~"'c<'lO'")~NNNC<"lc<'lNC''' NNNc<'l
o::l r.o ~ C<"l O'l 0 ~ '" N 0 .-< co r.o ~ r--- 0 O'l co '" ~8-~~~~~~~~ ~~8~~o~ ~~-~~~O'l ~~OO'lmoo~r.o~m~ c<'l-O'lc<'l~ ....... ~"'c<'lON~OC<"lCOC<"l"'OO'l N"'NNc<'lr.o~Nq~q~r---r.oqN~O'l~
.-<

>=i .£ ....., ~ ~ ...... sg:; 0.. ......
til ....., o ....., o .....,
'" v .....,
t ~
C'I
o ......
C'I CD O'J O'J ...... CD
- 11") ~~ CD~ ['~
CD CD 'i< O~ C1 C1 ..................
C<") [' [' ...... O'J 0:> C'I CD c<'l ~"'?""""I .......t
CD O'J [' O'J o~ O'J
0:> 0 O'J [' [' CD CD~ 00 O'J C<")
- "1 ...... ......
O'J -.,t< [' 11") CO CD ...... O'J [' O'J 11") O'J 11") O'J O'J 0:> O'J~ [' CD~ O~ 11")~
[' C'I ...... 0:> C'I O'J C'I CO~ O~ 0:> C'I 0:> C'i ...... C'I C'I ~ C'I ~
39

°
40
Ol C'lt- Ot- "" C'l0l0 l1"l ""0 t!:J C"'l~0l o-;r-C'lC'lOC'l""l1"l""': cOC'lo)Or-OOlC'l "":C"'lt.O
C'I 00 r- co t!:J C"'l C'! Ol l1"l OlcOlf'lO-rC'I C"'l C"'l "" C"'l C"'l
-
""C"'l-t!:JOC"'lC'lt!:J_lf'lr-C"'lC"'l t!:JOl~""C'lC"'lNCOc<") r-c;CO OlLC"iNUiO"":C"'l"":c.ocOr...:C'lM _C'lC'lNNNNNNNNC"'lN
""OlC'lNCOOC"'l OOOOlCOCO Ui or- 0- C'lOC'lO~C'lC"!0 If'lo::it!:Jr.DLC"icOr.Do::io::iOlOlC'''lcO
If'lC'''lt!:JCO,,,,C'''lCOt!:JNUiUiOlt!:Jr-":-c;",,C"'lOll1"lC"!r-o-;": _OlCO-lf'lOOlo)~C"'lOOlOl C'lC'IC'lC"'lC'lC"'lC'lC'lc<")C"'lC"'lC"'lN
If'l~~o(O:::::~ c<")G""~~ :;:lOlr...:~lf'lo)r...:o)C'I_Or--:Ol
NNNC'I
- N t!:J Ol N",,: _ r-
"" N Ui l1"l_ C"'l N

o
~I
~mm~ o~ro~~ro~~-NmOO~~mc<')~~ OO~~~~ OOOc<')~N~~~c<')c<')~mc<')~~oooo~O~~c<')c<') o~~mo~
~ro~mroN~~~m~~c<')m~0~c<')~O~NOOOro~~~ro ~~c<')c<')~~c<')c<')c<')~~~~~c<')c<')N~,·,~~~c<')~~~c<')c<')c<')c<')
roc<')~~m~ro~~o~Nmc<')~-o~~oooooooomoo~~~~oc<')'r~c<')~mo c<')c<')c<')~m~m ~~O-O~~c<')-~~m
N~~_~roo0c<')~~o~_~0rom0o~~N~~o~00N ~~~~~~~~~~~~~~~~c<')~~~~~~c<')~c<')~~~~
41
Related Documents