PROTOCOL TO DETECT AND MONITOR POLLINATOR COMMUNITIES GUIDANCE FOR PRACTITIONERS POLLINATION SERVICES FOR SUSTAINABLE AGRICULTURE EXTENSION OF KNOWLEDGE BASE ADAPTIVE MANAGEMENT CAPACITY BUILDING MAINSTREAMING

Welcome message from author
This document is posted to help you gain knowledge. Please leave a comment to let me know what you think about it! Share it to your friends and learn new things together.
Transcript
Protocol to Detect anD Monitor Pollinator coMMunities Guidance for Practitioners
Pollination services For sustainaBle aGriculture
extension oF KnowleDGe Base
adaPt ive ManaGeMent
caPacity buildinG
MainstreaMinG

P o l l i n a t i o n s e r v i c e s f o r s u s t a i n a b l e a G r i c u l t u r e
Gretchen leBuhn
sam Droege
ed connor
Barbara Gemmill-Herren
nadine azzu
food and aGriculture orGanization of the united nations , roMe, 2016
Protocol to Detect anD Monitor Pollinator coMMunities Guidance for Practitioners

the designations employed and the presentation of material in this information product do not imply the expression of any opinion
whatsoever on the part of the food and agriculture organization of the united nations (fao) concerning the legal or development
status of any country, territory, city or area or of its authorities, or concerning the delimitation of its frontiers or boundaries. the
mention of specific companies or products of manufacturers, whether or not these have been patented, does not imply that these
have been endorsed or recommended by fao in preference to others of a similar nature that are not mentioned.
the views expressed in this information product are those of the author(s) and do not necessarily reflect the views or policies of fao.
isbn 978-92-5-108978-1
© fao, 2016
fao encourages the use, reproduction and dissemination of material in this information product. except where otherwise indicated,
material may be copied, downloaded and printed for private study, research and teaching purposes, or for use in non-commercial
products or services, provided that appropriate acknowledgement of fao as the source and copyright holder is given and that fao’s
endorsement of users’ views, products or services is not implied in any way.
all requests for translation and adaptation rights, and for resale and other commercial use rights should be made via www.fao.org/
contact-us/licence-request or addressed to [email protected].
fao information products are available on the fao website (www.fao.org/publications) and can be purchased through publications-
cover photos
left to right: © s. roberts, © K. devkota, © n. o. Pereira
back cover photos
left to right: © r. Pintea, © n. Morison, © b. n. freitas
this publication provides guidance on using a common methodology for monitoring pollinator diversity and abundance, as part of the GeF supported Project “conservation and Management of Pollinators for sustainable agriculture, through an ecosystem approach” implemented in seven countries - Brazil, Ghana, india, Kenya, nepal, Pakistan and south africa. the project is coordinated by the Food and agriculture organization of the united nations (Fao) with implementation support from the united nations environment Programme (uneP).

iii
Protocol to detect and Monitor Pollinator coMMunities: Guidance for Practitioners
list of boxes, figures and tablesPrefaceacknowledgements
section 1 introDuction anD concePtual FraMeworK
section 2 Process to DeveloP a Protocol
section 3 Protocol aiM anD structure
section 4 General consiDerations For exPeriMental DesiGn anD stuDy site selection4.1 study area selection4.2 number of study plots4.3 Placement of study plots
section 5 Protocol For saMPlinG Plots5.1 using bowl traps5.2 length of sample5.3 weather5.4 Handling loss of bowl traps5.5 removing bees from bowl traps5.6 Field datasheets5.7 transporting bee specimens in alcohol
section 6 ProcessinG sPeciMens6.1 washing and drying bees6.2 Drying collected bees6.3 Pinning collected bees6.4 labeling collected bees
section 7 iDentiFyinG anD MaintaininG sPeciMens
section 8 Data entry anD DataBase Maintenance
section 9 Data analysis
section 10 General conclusions
reFerences
contents
ivv
vii
1
3
6
7888
1010121212121416
1717192022
24
26
28
29
53

iv
annexesannex a sampling data sheet
• Metadata fields and descriptions• visualization of sampling data sheet - mandatory fields
annex B Field and laboratory checklistsannex c Handling bee specimens
• Alternativemethodsfordryingbees• Cleaningbeesthathavebecomemoldy• Alternativebeestorageboxes• Foamboardsforlabelingandsorting
annex D Batch processing of common beesannex e sample r codeannex F Glossary of bee termsannex G Bee body part figures
list oF Boxes
Box 1 steps for monitoring survey
Box 2 summary of steps for setting out bowls at site
list oF FiGures
Figure 2.1 cumulative effect over ten years of different percentage annual decline on total remaining population size remaining
Figure 2.2 Minimum number of plots needed to obtain at least 90 percent power to detect an existing decline of 3 percent with three counts per year, given coefficient of variation and number of years, and assuming an alpha = 0.2, trend cv = 1, 2-tailed test, exponential growth and whole number rounding
Figure 5.1 re-purposed containers for holding soapy water solution used to fill sampling bowls in the field
Figure 5.2 Plant flat used to hold sets of bowls
Figure 6.1 tea strainer
Figure 6.2 Glass jar modified for drying bees with fiberglass screen in lid
Figure 6.3 Gluing pin to the side of a bee specimen
Figure 6.4 labels on bee specimen
Figure a1 sampling data sheet screen shot
Figure c1 assembled bee dryer made with a hair blow dryer and close-up of the plastic container that is inserted in the top of the bee dryer
Figure D1 counter for keeping track of numbers of bees of different taxa
Figure D2 sorting tray
30
3334
38414450
7
16
4
5
11
15
18
19
21
23
32
35
38
39

v
Protocol to detect and Monitor Pollinator coMMunities: Guidance for Practitioners
PreFace
in agro-ecosystems, pollinators are essential for orchard, oilseed crop, horticultural and
forage production, as well as the production of seed for many root and fibre crops. Pollinators
such as bees, birds and bats affect 35 percent of the world’s crop production, increasing
outputs of 87 of the leading food crops worldwide, plus many plant-derived medicines in the
world’s pharmacies.
at the same time as the role of pollinators is gaining increasing attention, evidence points
to potentially serious decline in populations of important pollinators on local scales. for
example, surveys of the himalayan cliff bee have shown significant declines in the number
of colonies or total loss across a 15-year period. in europe and north america, species of
bumblebees have been well documented to be severely declining. in brazil, 2 species of
native bees are officially listed as endangered.
considering the urgent need to address the issue of the worldwide decline in pollinator
diversity, the conference of the Parties to the convention biological diversity established
an international initiative for the conservation and sustainable use of Pollinators (also
known as the international Pollinators initiative-iPi) in 2000. first amongst the aims of the
international Pollinators initiative is to “monitor pollinator decline, its causes and its impact
on pollination services”.
yet, fifteen years after the creation of the international Pollinator initiative, changes
in the trends and distributions of most pollinator taxa and pollination failures remain
poorly described. the need for a global collaboration that pools case study evidence from
a multitude of ecosystems and contributes to a monitoring system that returns consistent,
scientifically sound information to policy-makers, remains a high priority on the pollinator
conservation agenda.
Within the context of its lead role in the implementation of the international Pollinator
initiative, fao established a Global action on Pollination services for sustainable agriculture.
fao also developed a global project, supported by the Global environment facility (Gef)
through the united nations environment Programme (uneP) entitled “conservation and
management of pollinators for sustainable agriculture, through an ecosystem approach”.

vi
seven countries (brazil, Ghana, india, Kenya, nepal, Pakistan and south africa) worked together
with fao to identify and carry out targeted activities that can address threats to pollinators in
agricultural landscapes. the outcomes of the Global Pollination Project are an expanded global
understanding, capacity and awareness of the conservation and sustainable use of pollinators.
as a contribution to the iPi, and as part of the Global Pollination Project to expand global
understanding, fao and its partners collaborated with the san francisco state university to
develop a protocol for monitoring bee pollinator populations in crop production landscapes. field
testing and adaptation of the monitoring methodology was made possible through the work of the
partners of the Global Pollination Project. Given the importance of pollinators for crop production,
it is hoped that this bee monitoring protocol can provide options for local implementation for a
variety of groups including researchers, extension agents, farmers, students and others.
Barbara Gemmill-Herren
focal Point of the international Pollinator initiative and Global Pollination Project coordinator
at the food and agriculture organization (fao) of the united nations, rome, italy
(2004-2015)

vii
Protocol to detect and Monitor Pollinator coMMunities: Guidance for Practitioners
acKnowleDGeMents
acknowledgement is given to all of the contributors to the handy bee Manual (see references,
and http://bees.tennessee.edu/publications/handybeeManual.pdf), a multi-collaborator online
manual of best practices for working with bees. Most of the techniques for collecting and
processing bees came directly from contributions to that manual. We would also like to thank
the Gef/uneP/fao Global Pollination Project partners in the seven countries, who tested and
used the methodology described in this protocol, for their collaboration.

intro title
viii
© s
. dr
oege
1
Protocol to detect and Monitor Pollinator coMMunities: Guidance for Practitioners
section 1introDuction anD concePtual FraMeworK
Pollination is a poorly considered aspect of world food security – yet terrestrial plants
(including crops) require pollination for seed and fruit production. approximately one third of
that pollination comes from pollen transfer mediated by insects (Klein et al., 2007). low or
absent populations of pollinators reduce production of food, timber, and fiber plants, creating
additional pressure on the supply of foods that is limiting in many parts of the world. aspects
of pollination have been widely studied as part of basic ecological and agricultural research,
but until recently it has simply been assumed that pollinators do not limit any aspect of
agricultural production. consequently, understanding of pollinator status and the interaction
between native and managed populations of pollinators with landscape management and
agricultural practices has been largely anecdotal, resulting in a current inability to make
substantive statements about the health, trends or status of pollinators in agricultural regions.
Pollinators make significant contributions to world agriculture (Klein et al., 2007). in
2005, the total economic value of pollination worldwide represented about 9.5 percent of the
value of the world agricultural production used for food. in addition, the crops that depend
on pollination services tend to be higher value crops. they average values of around €761 per
tonne whereas those crops that do not depend on animal pollination average €151 per tonne,
five times less than the animal pollinated crops (Gallai et al., 2009).
the value of pollinators results from their contribution to both yield and quality of fruit
and seed production. for example, strawberries that do not receive sufficient pollination
result in smaller, deformed fruits which in many markets would be discarded rather than sold
(Klatt et al., 2014). runner beans that do not receive full pollination result in sickle shaped
pods rather than full, straight pods and cannot be sold for export (vaissière, freitas and
Gemmill-herren, 2011). in addition, there is clearly both global and local economic impact
of insufficient pollination. for some species, it is not just the presence of pollinators but the
composition of the pollinator community that can affect yield. several crop species require

2
1 . i n t r o D u c t i o n a n D c o n c e P t u a l F r a M e w o r K
specific types of pollinators. for example, honey bees cannot pollinate tomatoes as these require
buzz pollination (buchmann, 1983). there is also evidence that the presence of native bees can
increase the efficiency of honey bees (Greenleaf and Kremen, 2006; Garibaldi et al., 2013).
Given the importance of pollinators, there is the need for a global monitoring program
to track trends in pollinator diversity and abundance, for pollinator services. the lack of a
monitoring program means that it is not known whether there is a crisis in pollination, nor can
the priority focus for conservation measures be identified.
a global monitoring programme needs a common methodology that can be applied
throughout the world, under a wide diversity of local circumstances and conditions. as with
all monitoring programmes, it is not feasible to count everything; a suitable indicator and
sampling methodology needs to be agreed that gives a reasonable estimate of trends applicable
to the target taxa, in this case pollinators. it is possible to develop a means of surveying the
most important group of pollinators: bees. thus, the purpose of this document is to present bee
monitoring protocols with options for local implementation as guidance for a variety of groups
including researchers, extension agents, farmers, students and others, and to provide some
resources for analyzing those data.
3
Protocol to detect and Monitor Pollinator coMMunities: Guidance for Practitioners1 . i n t r o D u c t i o n a n D c o n c e P t u a l F r a M e w o r K
section 2Process to DeveloP a Protocol
to develop a pollinator monitoring protocol, one needs to evaluate alternative methods
for sampling that minimize variance within samples while accurately measuring changes in
a pollinator community. the protocol must also determine where and how many sites are
needed to detect changes and evaluate the cost of the different methods. in addition, a good
monitoring protocol will have clearly defined questions and be repeatable.
to develop a monitoring protocol, two key questions must be answered: 1) how many
samples are needed to track changes?; and 2) is the monitoring program adequately precise?
three factors will influence the sample size: variability in the samples (counts), precision and
trend. the variability in counts is described using the coefficient of variation (cv). the cv is
calculated by dividing the standard deviation among samples by the mean among samples.
When cvs are high, trends are more difficult to extract from year to year because there is
considerable background noise in the data. this means that more samples will be needed to
detect a trend of a given magnitude and, therefore, costs of sampling will be higher. the
source of the background noise in the data is not relevant, but in all cases, the cv should be
lowered where possible and strategies for doing that can include options like standardizing
sampling on a time of year or a particular habitat.
Good sampling programs have a high probability of detecting change if one is occurring
and can detect significant changes in populations over time. for monitoring, it is often
more important to react when a trend is suspected than to be certain a trend exists. this
means that when evaluating the data, one should err on the side of detecting a trend that
is not there, rather than missing a true trend. statistical tests designate the probability of
incorrectly rejecting a true trend or hypothesis as the experiment-wise error rate which is
symbolized as alpha (α). in this case, the precision of a test can be set to have an α = 0.2
rather than the more common α = 0.05. this will increase the probability that changes that
are present will be detected.

4
2 . P r o c e s s t o D e v e l o P a P r o t o c o l
a program needs to be able to detect significant change. the amount of change detected is
called the effect size. at a minimum, a monitoring program should pick up a 50 percent change
over a set period of time. even small annual shifts in the number of individuals or species in a
habitat can add up to significant changes over a ten-year period (figure 2.1).
it is important to determine the amount of change and the period over which changes are
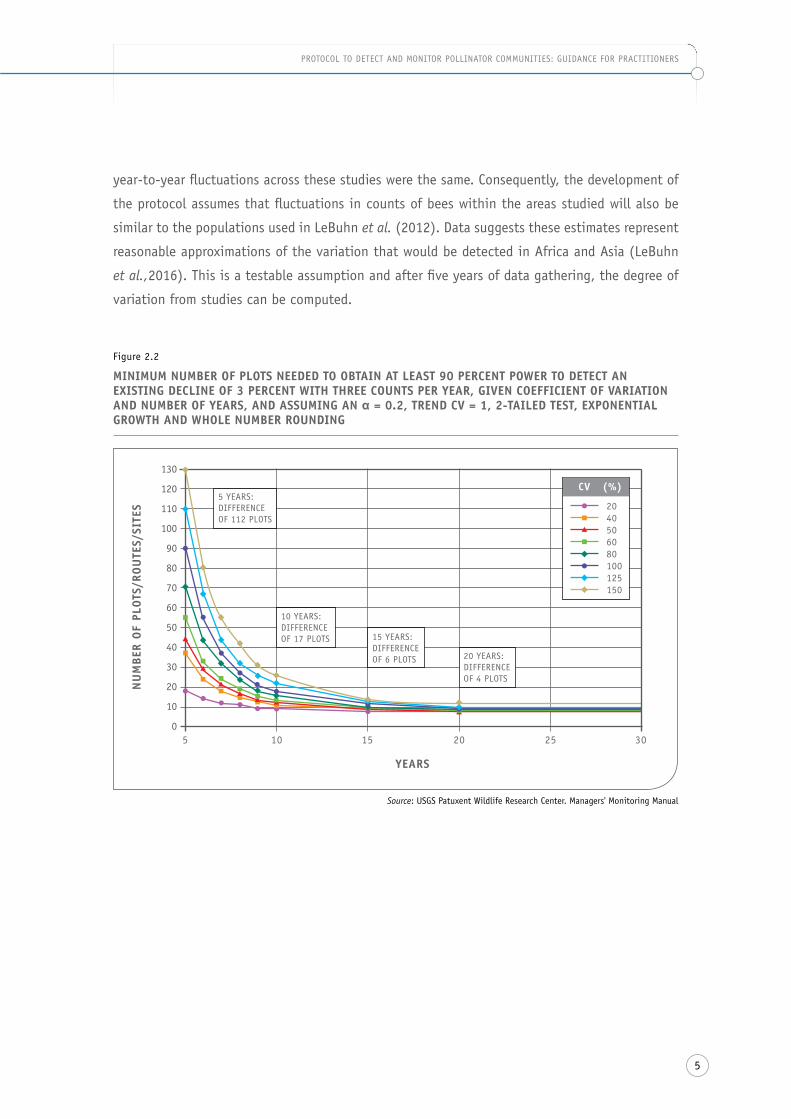
to be detected as both variables can significantly change the number of sites needed to sample
adequately. the longer a researcher samples, the fewer sites they will need (figure 2.2).
using data from a variety of sites, lebuhn et al. (2012) found that using the protocol
described below, studies will have 80 percent power to detect even a 7 percent decline in species
richness within two years with 100 sites and a 2 percent decline in species richness within five
years with 25 to 50 sites. lebuhn et al. (2012) used population data from the literature and
from existing studies of bees to estimate the degree of variability in counts of bees across years.
these data sets originated from three continents (north america, south america and europe)
and included a diversity of counting techniques, yet the results indicated that the degree of
figure 2.1
cuMulative eFFect over ten years oF DiFFerent PercentaGe annual Decline on total reMaininG PoPulation size
Source: G. lebuhn and e. connor
100
80
60
40
20
0
years
Perc
ent
reM
ain
inG
2 4 6 8 10
1% annual decline2% annual decline
5% annual decline7% annual decline
5
Protocol to detect and Monitor Pollinator coMMunities: Guidance for Practitioners2 . P r o c e s s t o D e v e l o P a P r o t o c o l
figure 2.2
MiniMuM nuMBer oF Plots neeDeD to oBtain at least 90 Percent Power to Detect an existinG Decline oF 3 Percent witH tHree counts Per year, Given coeFFicient oF variation anD nuMBer oF years, anD assuMinG an α = 0.2, trenD cv = 1, 2-taileD test, exPonential GrowtH anD wHole nuMBer rounDinG
Source: usGs Patuxent Wildlife research center. Managers' Monitoring Manual
130
120
110
100
90
80
70
60
50
40
30
20
10
0
years
nu
MB
er o
F Pl
ots
/ro
ute
s/si
tes
5 10 15 20 25 30
2040506080100125150
cv (%)5 years: difference of 112 Plots
10 years: difference of 17 Plots 15 years:
difference of 6 Plots 20 years:
difference of 4 Plots
year-to-year fluctuations across these studies were the same. consequently, the development of
the protocol assumes that fluctuations in counts of bees within the areas studied will also be
similar to the populations used in lebuhn et al. (2012). data suggests these estimates represent
reasonable approximations of the variation that would be detected in africa and asia (lebuhn
et al.,2016). this is a testable assumption and after five years of data gathering, the degree of
variation from studies can be computed.
6
section 3Protocol aiM anD structure
the protocol thus developed, in view of the points made above, aims to apply a standard
sampling design to assess the degree to which species richness or abundance are changing
in a given area over time, and which can be used at local, national, regional or even
continental scales.
the protocol can be implemented to simply detect changes in species richness and
abundance of pollinators. however, this protocol can also be used to test a variety of
hypotheses when used in a single or in a variety of areas. if all samples are placed in a
single type of area (no different treatments), then the protocol will detect changes in that
area’s pollinator community. When implemented across treatments such as in agricultural
versus wild areas, it can be used to look for differences in the trend of pollinators in those
different regions.
the benefits of following the monitoring protocol described below depend on the length
of time that sampling continues. in three to five years, this type of monitoring will be able
to detect changes in abundance and total species. Maps of distributions and changes in
distributions can be developed and the sampling will generate a considerable number of
specimens that can be used in natural history collections, genetic and taxonomic studies or
for teaching. these data can also provide the start for a public database of bee biodiversity
(e.g. Gbif, discover life, and see carvalheiro et al. 2016). over the longer term, 5-20 years,
this type of monitoring will be able to detect shifts in individual species abundances, regional
trends and the ability to detect large scale pollinator crashes in any year. standardizing
permits the methods to be used to monitor bees across localities, regions, even countries,
allowing comparisons among sites. the data can be used to detect patterns of distribution,
abundance, composition and fluctuation. the sampling will generate enough data for both
community and biogeographic analyses.

7
Protocol to detect and Monitor Pollinator coMMunities: Guidance for Practitioners
section 4General consiDerations For exPeriMental DesiGn anD stuDy site selection
to develop a national monitoring protocol, it may make sense to overlay sample sites on
an already established network such as agricultural experiment stations, national parks or
forests, a regional school system or farmer field schools. involving local managers or farmers
in the study will have the added benefit of increasing dissemination of the results, as well as
raising awareness of pollinator and pollination management-related issues. the protocol is
simple enough for high school students to implement.
box 1
stePs For MonitorinG survey
step 1: site selection
|| select area to be studied
|| determine number and placement of plots
step 2: site sampling (bee collection)
|| collection in the field
|| Preparing and identifying the bee specimens
step 3: Data collection and recording
|| enter specimen data into database
|| verify data accuracy and quality
step 4: Data analysis and synthesis
this protocol targets sampling bees in a region covering approximately 10-200 Km2,
although it can be applied over larger or smaller geographic regions. the specific goal is
to detect changes in native bee populations and to establish the ability for communities,
countries and regions to track changes in the common species of bee pollinators as well as
detecting shifts in the number of species present and the aggregated number of all individuals.
8
4 . G e n e r a l c o n s i D e r at i o n s F o r e x P e r i M e n ta l D e s i G n a n D s t u D y s i t e s e l e c t i o n
4.1 stuDy area selection
the researcher or participant will determine the specific study area. Within that study area it
must be decided if the entire area is going to be sampled or only parts.
some examples of partial surveys would be a survey of the bees:
|| in orchards
|| in natural areas
|| in urban areas
|| along roadsides
|| in fields in valley lowlands
|| in bean or canola fields and the natural areas adjacent to those fields.
all are legitimate targets for investigations; however, statements about trends in bees will
be limited to only those targeted areas. for example, if the research surveys orchards and find
declines in most of the bees there, the researcher cannot say that bees are declining throughout
the region or in the county, they can only say that they are declining in orchards in the area
being studied.
4.2 nuMBer oF stuDy Plots
to detect a 3-5 percent annual change in bee species richness or abundance over a five year
period, approximately 25 study plots are needed (lebuhn et al., 2012). the number of plots
needed will decrease if sampling will take place for longer than five years and will increase if
one: 1) wishes to detect smaller annual changes; 2) has a more variable fauna; or 3) wishes to
sample for a shorter period of time.
4.3 PlaceMent oF stuDy Plots
there are three options for placing study plots:
|| Place plots wherever a researcher likes.
|| Place plots randomly.
|| Place pots systematically.
the consequences of placing plots wherever a researcher likes rather than randomly or
systematically is that one can only talk about trends in bees on those chosen sites, but one
cannot extrapolate to locations outside of the those sites. so, if a researcher is sampling a set
9
Protocol to detect and Monitor Pollinator coMMunities: Guidance for Practitioners4 . G e n e r a l c o n s i D e r at i o n s F o r e x P e r i M e n ta l D e s i G n a n D s t u D y s i t e s e l e c t i o n
of orchards and simply chose the ones that were easiest to access and found that bees had
declined in those orchards they may say: “bees have declined at my sampling locations”. they
may not say: “bees have declined in orchards in this region”. under this choice, the researcher
has severely limited their ability to talk about declines in bees.
to be able to make a statement based on more robust results, a better option is to select a
set of random sites. for example, if one choses a set of random apple orchards in a region or a
set of orchards in specific habitat types, one can speak to declines in bees more broadly. thus,
the consequences of placing plots randomly or systematically are the same. as the sites were not
pre-selected based on a specific criteria, one may therefore say that the sites are representative
of the region as a whole and can make statements like: “from our surveys, we have shown that
bees are declining in this region’s orchards.” this results in a much stronger and definitive
statement from which management decisions can be based.
Many textbooks and web sites cover how to choose random or systematic locations for a study
area. refer to them and then show the protocol to a statistician for review. it is far, far better
to have errors detected prior to collecting data rather than after.

10
the protocol uses bowl or pan traps (lebuhn et al., 2012). these are inexpensive, easy to
use and easy to standardize. there are a variety of other methods for sampling bees. some
examples would be netting, trap nests, Malaise traps. these methods have similar success at
sampling but tend to be more difficult to use, expensive and difficult to standardize (lebuhn
et al., 2012). those other methods can all be used as ancillary data, if the researcher likes,
but be careful to only use them away from the standardized pan traps so they do not reduce
the specimens collected by the main survey.
bowl traps are small plastic bowls or cups, coloured white, fluorescent blue or fluorescent
yellow. the bowls are filled with water mixed with a small amount of detergent, which acts
as a surfactant. bees are attracted to the colours that mimic the colour of flowers, so they
land in the water and drown. bees do not see red but do see uv (fluorescent) and are highly
attracted to uv colours when combined with yellow and blue. normally, a bee landing on
water would float on the surface tension but, by adding detergent to the water, the soap
diminishes the surface tension enough that they sink.
there have been a number of studies in both europe and north american indicating that
bees readily fly to bowl or pan traps. however, in areas of tropical rainforest where many of
the bees are canopy feeders and vegetation elsewhere can be quite dense, it may be useful
to do preliminary testing to assess whether using bowls is an efficient way of collecting -
and perhaps assess other survey techniques such as netting or Malaise traps that might be
appropriate for these environments prior to the establishment of a survey system.
5.1 usinG Bowl traPs
at an individual study location, bowl traps are placed in a line or transect. twenty-four bowls
are used, eight of each colour, and the colours are alternated throughout the transect. bowls
section 5Protocol For saMPlinG at Plots

11
Protocol to detect and Monitor Pollinator coMMunities: Guidance for Practitioners
are placed on the ground (or elevated as mentioned below) 5 m apart and are located such that
each individual bowl is not hidden by vegetation, but left out in the open where a bee can spot
it. if bowls are placed too close together, they interfere with each other so, the 5 m distances
is critical. While a transect that follows a straight line is useful, it is not a requirement, and
transects can bend and wiggle around structures (such as clumps of bushes and trees, roads, and
dense vegetation). alternatively, bowls can be placed in the pattern of an “X”.
to set out a transect of bowls, the researcher needs a container filled with water (figure 5.1)
to which a large squirt of dishwashing liquid or laundry soap has been added. any type of dish
or laundry detergent can be used - except those with citrus scent added. citrus will decrease
the number of bees caught. laundry detergent is generally better than dish soap as it does not
create many suds on top of the water.
bee capture rates are the same no matter what size bowls are used; the standard is to use a
66 ml portion bowl (3.25 ounces) of the type often used in take-away containers at restaurants.
this size has the advantage that it increases efficiency as it allows a researcher to hold all 24
bowls in one hand. then, as the researcher travels down along the transect, s/he can get a bowl
ready using their thumb and forefinger while pouring the water with the other hand (thus without
having to put the bowls on the ground). this makes setting up the transect go quickly. also, the
smaller sizes have an advantage in that they do not require the researcher to carry as much water.
figure 5.1
re-PurPoseD container For HolDinG soaPy water solution useD to Fill saMPlinG Bowls in tHe FielD
© G
. le
buhn
12
5 . P r o t o c o l F o r s a M P l i n G at P l o t s
5.2 lenGtH oF saMPle
bowls can either be left out for any 24 hour period of good weather or placed out prior to
when bees are active in the morning and collected after they have become inactive in the
afternoon. if bowls are left out for less then 24 hours, note the length of time that they were
out sampling. these data can then be used to statistically correct for differences in sampling
across a field season.
5.3 weatHer if the weather is rainy, extremely windy or very cloudy, then catch will be minimal. consequently,
bowl surveys should not be run on those days. conditions are good for doing surveys if rain does
not threaten and if it is sunny or only partially cloudy. rain can be tolerated during the night or,
if for only a brief period during the day. however, if it rains heavily it will splash the collected
bees out of the bowl. one option might be to put a tiny overflow hole in the top of the pan trap
to let water out.
5.4 HanDlinG loss oF Bowl traPs
Within a sample day and site, the loss of individual traps is not a problem if only one or two
are lost. each time the researcher does a survey they will need to record the number of bowls
that remained full of water throughout the survey period. so, if the researcher started with 24
bowls and during the course of doing the survey one bowl was destroyed by a goat, one bowl
was stepped on, one bowl couldn’t be found, and one bowl was found to not have water in the
morning then the researcher would record the presence of 20 active bowls in the survey notes,
and not 24. at the end of the collection process, during the analysis of the data, the researcher
will divide the numbers of bees the researcher captured by the number of bowls available.
5.5 reMovinG Bees FroM Bowl traPs
retrieving bowls from a transect and shifting the bees to a container takes about the same amount
of time as setting out the bowls. at each bowl, remove all moths, butterflies, slugs, and very large
bodied non-hymenoptera (e.g. grasshoppers and crickets) to a different container if you are saving
them. these groups tend to contaminate the other specimens when placed in alcohol. following

13
Protocol to detect and Monitor Pollinator coMMunities: Guidance for Practitioners5 . P r o t o c o l F o r s a M P l i n G at P l o t s
their removal, the remaining specimens can be moved along with the water in the bowl into an
aquarium net, sieve, or tea strainer. it is very important to choose a strainer with extremely fine
mesh in order to catch the smallest of bees, some of which may only be 2-4 mm. aquarium nets
like those used for brine shrimp nets and tea strainers tend to have the finest meshes.
bowls from one transect or plot can be pooled rather than keeping individual trap data
separate, as handling time increases greatly when collecting from individual bowls. the catch
should be stored in 70 percent alcohol in containers or sample bags (for the purpose of this
protocol, the term “sample bags” will be used to indicate a either a container or sample bag)
that can be tightly sealed so no alcohol will escape. sample bags with plastic zippers will not
work for this. if using a net, it can help to use a spoon to gather the specimens from the net
and then transfer them to the sample bags. alternatively, the researcher can pick out the mass
of insects in the net or strainer with their fingers and move it into an individual sample bag.
however, the researcher may use a larger sized sample bag along with a small tea strainer; giving
the strainer a sharp rap after placing it in the bag will thereby dislodge all the insects at once.
Insects captured in white pan trap
© P
. ba
rret
o

14
each bag or cloth should have a tag inside listing the sample location and date written on
paper with pencil. do not trust any kind of writing to stay on the outside of a sample bag, as
they inevitably get wet with alcohol or water and the writing will become illegible.
5.6 FielD DatasHeets
sample site data sheets should be prepared prior to sampling and brought to the field. the
first time any site is sampled, the data fields the researcher needs to fill out to document the
characteristics of each of transect (the researcher only need to do this once) include: transect
name, latitude, longitude and a description of each site. if there are other characteristics of
the site of interest such as presence of grazing or a particular plant species, which should be
measured at the site to characterize it, they should be added to this data sheet.
each time the site is sampled, the researcher should write down the number of bowls missed
or destroyed on the data sheet. the data fields the researcher will need to fill out each time
include: site name, date, time bowls set out, time bowls retrieved, name of the person who set
out and retrieved the bowls, and number of bowls that retained water during the time they were
in the field. this data sheet can also include other variables of interest that may change with
each time the plot is sampled such as the amount of floral resources available.
tiP
often alcohol needs to be diluted to achieve the right percentage (70 percent). the label
on bottles of alcohol should have information on the alcohol percentage. note that most
inexpensive stores sell isopropyl that is only 50 percent alcohol. if the bottle is labeled with
the percent alcohol in terms of “proof”, you will need to have at least 140 proof. Proof is a
simple doubling of the percentage. therefore, 100 proof is 50 percent alcohol and 190 proof
is 95 percent alcohol. to dilute from 100 percent alcohol to 70 percent, choose a convenient
sized container, such as a quarter liter bottle, then fill it approximately 70 percent full with
alcohol and the rest with tap water. this measurement does not need to be exact, but as
close as possible.
an alternative to sample bags is to move the catch into small numbered squares of cloth that
are rolled up and rubber banded together. once back from the field, put each cloth into plastic
“zippered” bags and freeze until the specimens are ready to be pinned. this will decrease the
probability that samples will dry out because of leakage in the sample bag.
5 . P r o t o c o l F o r s a M P l i n G at P l o t s

15
Protocol to detect and Monitor Pollinator coMMunities: Guidance for Practitioners
tiP
it is a good practice to count and record the number of insects in a bag in the field on the
data sheet. if one returns to the laboratory with two unlabeled bags, it can help to identify
which bag came from which site.
a sampling data sheet can be found in annex a. a field trip (and laboratory) checklist is
provided in annex b.
eFFiciency tiPs
it is helpful to create the sets of bowls the day before setting them out. in particular, it is
very handy to have an empty, divided flat like those found holding plant starts at a local
nursery, as this holds the separate sets of bowls quite nicely (figure 5.2). red or pink
wire flags can be very useful for re-finding the transects. in areas with few landmarks, it
is particularly useful to use GPs. by using GPs to locate the transects as the researcher
positions the bowls, the researcher can then use the “goto” feature of the GPs unit to track
back the transect locations that same evening or the next day. this is particularly useful when
working in an area with few landmarks.
figure 5.2
Plant Flat useD to HolD sets oF Bowls
5 . P r o t o c o l F o r s a M P l i n G at P l o t s
© G
. le
buhn

16
5.7 transPortinG Bee sPeciMens in alcoHol
When traveling with, or shipping, bags of specimens, the researcher should partially drain the
alcohol out of the bags to diminish the possibility of leaking while in transit without affecting
their preservation. be sure to properly close the sample bags. Put all the sample bags into a
“zipper” storage bag and then, into another larger “zipper” storage bag to make sure nothing
leaks. some paper towels in the outer bag will provide added insurance.
box 2
suMMary oF stePs For settinG out Bowls at site
|| Put one heavy squirt of dish washing liquid in a 5 litre jug of water.
|| Place bowls level on the ground.
|| fill each bowl with soapy water about three quarters more full.
|| set bowls out in transects with 24 bowls spaced 5 meters apart (can be measured by pacing) alternating blue, yellow and white bowls.
|| avoid putting bowls in any heavy shade, as few to no bees will come to those bowls. there do not have to be flowers nearby to have bees come to bowls, as often there are bees scouting over flowerless areas.
|| collect bowls after 24 hours and place specimens in sample bags with alcohol. if you are not going to process the specimens within one to two days, store these samples in a freezer.
5 . P r o t o c o l F o r s a M P l i n G at P l o t s
17
Protocol to detect and Monitor Pollinator coMMunities: Guidance for Practitioners
once the specimens have been collected from the field, they need to be processed for
identification and this information must be entered into a database. the entire process has
several steps: washing and drying the bees, sorting, pinning and labeling and identifying.
each step is reviewed in the sections below.
6.1 wasHinG anD DryinG Bees
Pinning bees directly from water or alcohol usually results in matted hairs and altered
colours, along with a good coating of pollen, scales and other detritus picked up from the
sample. Washing and processing bees using the process listed below will result in high quality
specimens that can exceed the quality found when hand-collected.
there are two main approaches to washing bees, using either a strainer or a bee washer
to accomplish the task. both are explained below and videos are available at https://www.
youtube.com/watch?v=a2y-ind12cc.
strainer washing to begin, fill the specimen sample bags with water and then move contents into the strainer
(figure 6.1). transfer the specimens from the strainer into a plastic container with a lid (it
is helpful if the container you make a small hole in the lid to let out the foam). add warm
water and dish washing liquid, and very vigorously shake the specimens around with for 60
seconds. Place specimens back into the strainer and rinse under tap water until no more suds
are present. break the force of the water with a hand or spoon to protect the specimens. tap
off loose water and use a cloth towel to blot out as much excess water as possible on the
bottom of the strainer or net. next, squirt 95 percent alcohol onto the specimens, dip the
strainer into a bowl of alcohol, or drop them into a jar of alcohol and blot again. then, move
the specimens onto a set of three to six paper towels and fold the paper towels over the
specimens and roll them around with a finger, pencil or tweezers and refold a few times to
section 6ProcessinG sPeciMens
5 . P r o t o c o l F o r s a M P l i n G at P l o t s

18
6 . P r o c e s s i n G s P e c i M e n s
remove the bulk of the alcohol. at this point the researcher can fold corners of the paper towel
up and shake the specimens around inside to further dry them. When the specimen’s wings are
no longer stuck together or folded up on themselves and all bee hair is fluffy, the specimens do
not need to be shaken anymore. now the researcher can dry them and pin them.
it helps to hold the corners and the towel area between the corners, or the specimens will
jump out while the researcher is shaking them.
after the specimens have been dipped in alcohol the researcher can leave them lying on the
paper towel for up to 45 minutes before further fluffing them.
the best looking bees are those that are cleaned within 24 hours of capture.
tiP
tea strainers work well because of their fine mesh, aquarium nets designed for brine shrimp
also have sufficiently small mesh, but it is more difficult to remove specimens because of the
flexibility of the netting.
washing using a magnetic stirrer rather than cleaning bees by swirling them around in a jar by hand, a researcher can use a magnetic
stirrer, the same as used in all chemical laboratories. a small magnet is turned inside a jar or cup by
a magnetic plate. the water, soap, and bees are swirled around as gently as the researcher wishes.
this method does the best job of removing pollen, nectar and other detritus on specimens, simply
because the researcher can leave it washing for quite a while without a time penalty.
figure 6.1
tea strainer
© G
. le
buhn

19
Protocol to detect and Monitor Pollinator coMMunities: Guidance for Practitioners6 . P r o c e s s i n G s P e c i M e n s
6.2 DryinG collecteD Bees
it is important to dry specimens as it makes it easier for identification. on bees with long hair,
it is useful to use some form of drying system to speed the process. a video that demonstrates
how to dry bees can be seen at https://www.youtube.com/watch?v=935jlJep6go.
to dry bees, you will need a small clear glass half liter jar that has a canning jar lid of the
kind with a removable central metal disk, a piece of window screen that will be used to replace
the center of the canning jar lid, and a hair dryer (figure 6.2).
the basic idea is to move the bees around while blowing air on them so that the hair that
has been matted by getting wet returns to its original condition. to do this, follow the same
procedure as listed under the strainer section (above) but just quickly blot of the specimens on
the paper towels to get the bulk of the alcohol off. then, use a funnel to move the specimens
from the paper towel into the jar. Put the lid back on the jar with the screen in the middle; make
figure 6.2
Glass jar MoDiFieD For DryinG Bees witH FiBerGlass screen in liD
© G
. le
buhn

20
sure the screen is snug around the entire lid. it may help to add small rolled up bits of paper towel
in with the specimens. Place the jar on its side on the folded hand towel and place hair dryer
pointing into the jar as close as possible, without causing the hair dryer to turn off (usually about
3 cm). this can be hand held or set up in a wide variety of ways so that the researcher does not
need to hold the blower. While drying, shake the specimens back and forth vigorously, hitting the
sides on the towel periodically to dislodge them if they stick to the glass. specimens, when wet,
are very flexible and tough, so they can sustain a moderate amount of bumping around.
once the specimens are all loose, shift the jar slightly downward so that the specimens slide
towards the screen and whirl around in the dryer’s wind; continue shaking the specimens. small
short-haired specimens are done once their wings are flexed away from their body and their
hairs are not matted. bumblebees and long-haired specimens take longer. depending upon the
hair dryer and the bees, this may take anywhere from 1.5 to 3 minutes. alternative methods for
drying bees and working with large volumes of bees can be found in annex c.
tiP
fiberglass screening is an appropriate material to use as the insert in the jar, but metal screen
can also work. one advantage to a loose fiberglass screen is that it can be cut with scissors
to fit the jar.
6.3 PinninG collecteD Bees
specimens need to be pinned to be identified by experts. if the research group has expertise
with the bees in the area, doing batch processing where common, easily identified bees are not
pinned individually can circumvent this process. this type of processing is covered in annex d.
here, it is assumed that all bees will be pinned for identification.
to mount bees, it is recommended to glue, and not pierce, bees to the pin. start by taking
the dried specimens and placing them on a foam pad such that they are either upside down or
on their sides. for pinning use number 2 or number 3 pins. even large bees can be glued to pins
(the larger the bee, the more glue required) rather than pinned through their bodies.
Gluing, while not traditional for larger specimens, has several advantages over pinning:
|| it does not permanently damage the integument.
|| it permits more of the specimen’s scutum to be visible.
|| it permits the processing of dried specimens without rehydrating (and further damaging them).
|| it is much faster.
6 . P r o c e s s i n G s P e c i M e n s

21
Protocol to detect and Monitor Pollinator coMMunities: Guidance for Practitioners
the glues used should not be permanent and can either be white glue, tacky glue (a form of
white glue with greater immediate adhesive power) or school glue gel.
to glue an insect to a pin, take an insect specimen tray or even a piece of paper, drop a series
of pins into the bottom, and then run a line of glue along the top of one edge of the side of the
tray or paper. Pick up a pin with the fingers or reverse tweezers and dip one side of the pin into
the glue at the proper height. the proper height means there must be room above the bee for
someone to easily pick up the pin without snapping off the antennae and there must be room
below the pin to hold one or more labels. use more glue for a large specimen, less for a smaller
one (figure 6.3).
6 . P r o c e s s i n G s P e c i M e n s
figure 6.3
GluinG Pin to tHe siDe oF a Bee sPeciMen
© G
. le
buhn

22
take the pin and place the glued side onto either the side or the underside of the bee. Museums
generally require that bees only be glued on the right side. When gluing to the underside, the
optimal place to glue the specimen would be to the thorax or, even better, the joint between
the thorax and the abdomen (see figures in annex G). the angle of the legs often dictates where
the pin will most easily go.
after allowing the pins to lay on the specimens for a few minutes the specimens can be
moved and pinned into temporary storage boxes (usually these are foam lined cardboard boxes,
either made in the lab or purchased, see annex d for more information). to move the pin,
simply press the tip of the pin with the finger into the foam and the head to the pin will elevate
allowing the researcher to pick up the specimen. also note that for very small specimens the glue
is of sufficient immediate strength that the pin need only be touched to the specimen and then
moved to its resting place in the box.
6.4 laBelinG sPeciMens
there are a number of ways to generate labels for specimens. Most people use word processing
programs (font size 4 usually), others use spreadsheet or database, or proprietary programs. here
are the commonalities necessary for a good label:
|| it should have a unique specimen identification number that links the researcher to the
database record for that specimen.
|| the paper used should be thick (35-65# cardstock is good) and should be acid-free or archival
in quality (regular paper deteriorates over long periods of time).
|| the size should be such that the label does not extend greatly to either side of the specimen
and therefore take up too much shelf space (20 mm x 8 mm is a good size).
|| the label should have country, region, city (or location or park), collection date (with the
month written in roman numerals or text, but not abbreviated as the month’s number),
latitude and longitude, name of collector.
|| optional would be a scannable bar or matrix code that permits the specimen number to be
scanned in directly.
each specimen should then be labeled with collection information. labels should be placed
close to the specimen, but not so close that the information on them cannot be read when
the specimen is tipped at an angle and enough room should be left on the pin to add an
identification label and potentially other labels.
6 . P r o c e s s i n G s P e c i M e n s
23
Protocol to detect and Monitor Pollinator coMMunities: Guidance for Practitioners
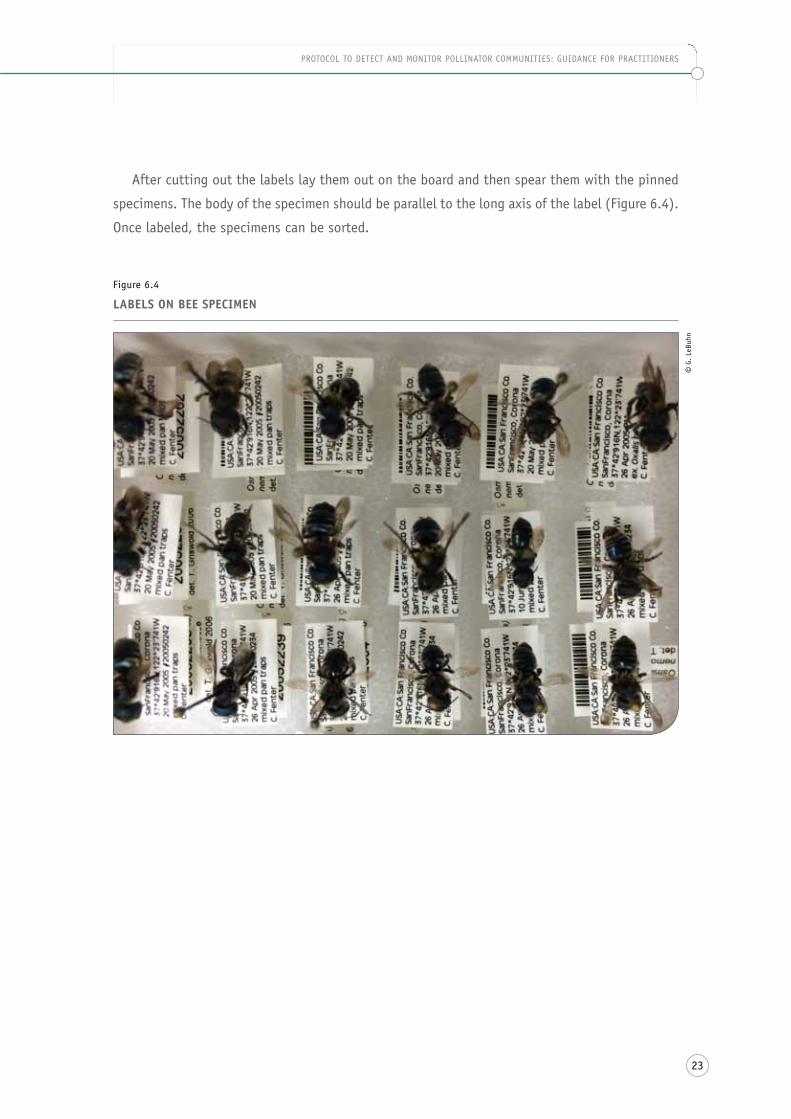
after cutting out the labels lay them out on the board and then spear them with the pinned
specimens. the body of the specimen should be parallel to the long axis of the label (figure 6.4).
once labeled, the specimens can be sorted.
6 . P r o c e s s i n G s P e c i M e n s
figure 6.4
laBels on Bee sPeciMen
© G
. le
buhn

24
section 7iDentiFyinG anD MaintaininG sPeciMens
identifying bees requires the engagement of a specialist or multiple specialists. for most
regions of the world, keys are not available for identifying many if not most genera. the
reason for this is three-fold:
1. differentiating the species within certain groups of bees is extremely difficult without a
good set of identification papers, access to a good collection of correctly identified bees
and plenty of experience. there are no regions of the world with a complete set of keys
for identification.
2. the taxonomy, names and status of bees are incomplete. Many bee species have yet to be
found and named.
3. there are very few taxonomists and insect collectors working on these issues. the renewed
collection of bees throughout the world and taxonomic studies of those specimens should
be encouraged.
this means that most groups will either want to send their bees off for identification
elsewhere, participate in a regional identification center, or have someone on staff that has
spent several years training with experts on bee identification of regional bees and has access
to a collection of correctly identified regional bees.
a good introduction to the identification and families of bees is available at: http://www.
yorku.ca/bugsrus/resources/keys/bfoW/images/introduction/introduction.html.
once labeled, specimens can be easily grouped and moved. Most people working on bees
first sort to the morpho-species (simply sorting into groups by what they look like without
knowing their names) level, or sort by genus. this accelerates the identification process,
particularly if most of the species are unfamiliar to the person doing identifications. here, the
large foam boards described in annex c work well to organize the specimens.
as the identification expert looks at specimens, they can pin individual species into trays
or simply pin them into boxes with identification labels (also called determination labels),

25
Protocol to detect and Monitor Pollinator coMMunities: Guidance for Practitioners
with all species identified as the same species or group grouped in rows or sections. a new row
or section is started for each new taxa which, makes it easy to see the groupings. it is easiest
to have a determination label precede the row or section of specimens so that the person doing
the data entry can clearly see the name of the species they will be entering.
another useful and time saving technique is to orient female specimens vertically in the box
or tray, and males horizontally. in that way, the person doing the identifications does not have
to write out another label for a different sex, the person doing the data entry need only read the
species name, and the person doing the checking afterward can quickly and visually determine
if the sex information has been entered correctly.
MaintaininG sPeciMens
specimens will degrade if exposed to uv light, pests, and excess humidity. using air conditioners
in humid environments can control humidity. Keeping specimens in closed cabinets and boxes
can control the light (note that uv light can penetrate though most glass and is also generated
by indoor fluorescent lighting). Pests can be controlled by periodically freezing the collection
(three days at -10 oc) and by keeping the specimens in tightly fitting museum drawers and
cabinets or by keeping them in smaller cardboard specimen boxes but enclosed in large re-
sealable plastic bags (such as storage bags). usually freezing specimens once a year is sufficient,
alternatively, specimens can be inspected every three months for signs of beetle infestation
(dropping and “dirt” under specimens are a clear sign) and freeze only the affected units.
© s
. dr
oege
26
section 8Data entry anD DataBase Maintenance
for large collections, the data from the specimens should be entered into a database system.
however, if more convenient, data can be entered initially into excel and then uploaded into
a database system. in both cases, the data should be accompanied by detailed metadata that
describes the project and each variable in detail. an excellent guide to data management can
be found at https://www.dataone.org/sites/all/documents/dataone_bP_Primer_020212.pdf.
there are many ways to put together a database system (annex a). for any database,
there is a core set of data fields that need to be present somewhere in the system. these are
outlined below, as well as some general guidance about managing such systems.
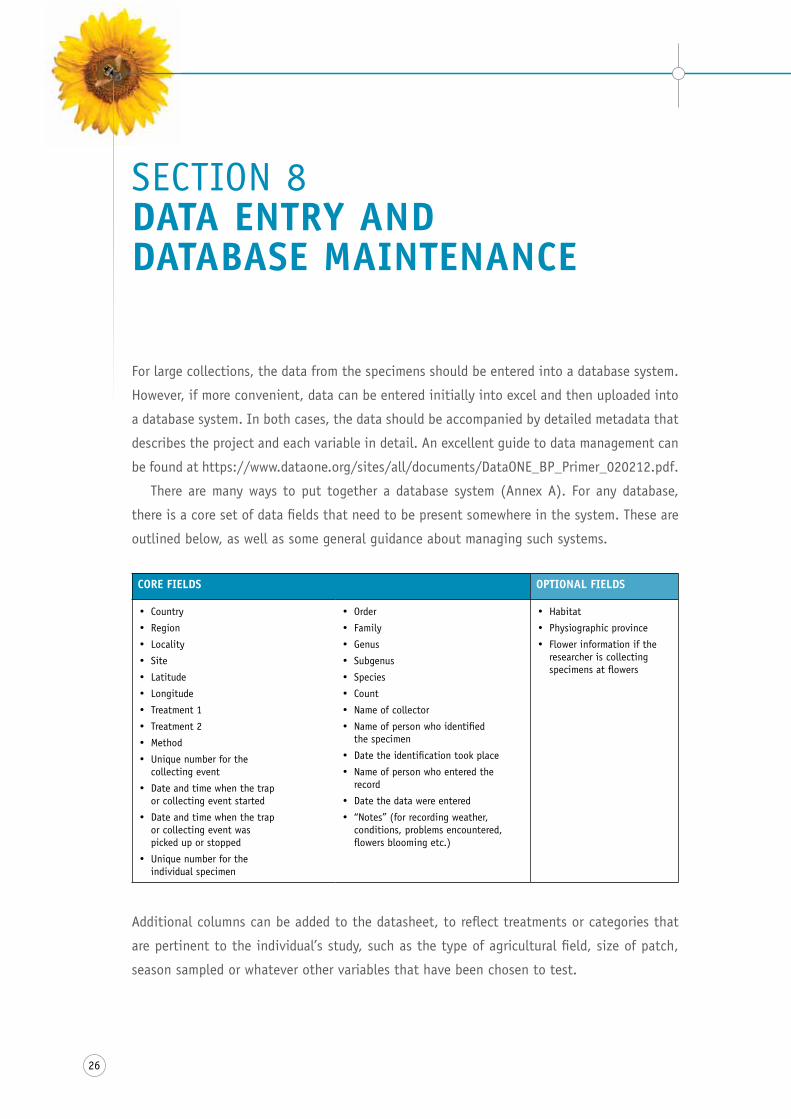
core FielDs oPtional FielDs
� country
� region
� locality
� site
� latitude
� longitude
� treatment 1
� treatment 2
� Method
� unique number for the collecting event
� date and time when the trap or collecting event started
� date and time when the trap or collecting event was picked up or stopped
� unique number for the individual specimen
� order
� family
� Genus
� subgenus
� species
� count
� name of collector
� name of person who identified the specimen
� date the identification took place
� name of person who entered the record
� date the data were entered
� “notes” (for recording weather, conditions, problems encountered, flowers blooming etc.)
� habitat
� Physiographic province
� flower information if the researcher is collecting specimens at flowers
additional columns can be added to the datasheet, to reflect treatments or categories that
are pertinent to the individual’s study, such as the type of agricultural field, size of patch,
season sampled or whatever other variables that have been chosen to test.

27
Protocol to detect and Monitor Pollinator coMMunities: Guidance for Practitioners
soMe DataBase suGGestions
after the data are entered, the researcher needs to examine the box of specimens and compare
it to the database records as a double check. often, errors occur when people enter their data.
it is also useful to set up a query in the database or spreadsheet program to do a count of the
different kinds of species in the database. by doing this, the computer will count as a different
“species” entries that have an extra space, subtle spelling mistakes, and capitalization problems.
data should be backed up and the backup copy should be stored at a different location.
valiDation anD DouBle cHecKinG
the establishment of a solid and statistically valid, survey program for bees is not a simple
matter. throughout the process there are numerous opportunities to make mistakes, use
incorrect assumptions, use inappropriate statistical techniques, make identification errors, and
make inappropriate changes to the project over the years that reduce, or even eliminate, the
usefulness of the data. so, to prevent this, it is recommended that a person familiar with bees
and statistical design of monitoring programs helps the researcher establish the initial program,
and review it after year 1, year 3 and year 5 to make sure that errors are caught and the project
is successful.

28
section 9Data analysis
there are numerous appropriate and even more numerous inappropriate ways to analyze these
data. if sites have been chosen at random, sign tests, simple regression, route regression,
estimating equations and graphs can be used to detect trends across time. a sample r code for
analyzing data using a sign test, a paired t-test or a linear regression, is provided in annex e.
When other factors such as landscape change or habitat types are of interest, anova,
multivariate techniques, ordination and other analyses are potentially useful ways of analyzing
the data. the decision of which technique to use will depend on the types of independent
variables the researcher wishes to include in the analysis as well as the structure of the data.
however, as when designing the initial surveys, it is recommended that each group consults
with a statistician prior to analyzing their data, as no simple one-size fits analysis will be
appropriate for everyone.
data from different studies that use this protocol can be combined into a meta-analysis
to examine trends at larger scales (see freitas et al., 2016).
29
Protocol to detect and Monitor Pollinator coMMunities: Guidance for Practitioners
section 10General conclusions
While managed honey bees are the dominant pollinator in many agricultural systems, other
bee species make significant contributions to a broad array of crops and are essential for
the health of non-cultivated plant species. Monitoring the health of the broad community is
essential for agricultural and other ecosystems.
the protocol is broadly applicable across habitats and regions (lebuhn et al., 2016). the
protocol was designed with the ideal of catalyzing a standardized monitoring methodology
across the globe to better document the patterns of our key pollinators (i.e. bees). it is
hoped that this protocol will be implemented broadly as the more sites collecting data in
this standardized way, the greater our power to understand whether pollinator populations
are declining.

30
a n n e X e s
anneX asaMPlinG Data sHeet
site naMe ______________________________________________________________________________
Date Bowls Put out ___/___ /2015 tiMe Bowls Put out ____:____ aM
Date Bowls PicKeD uP ___/___ /2015 tiMe Bowls PicKeD uP ____:____ aM
collectors ______________________________ nuMBer oF Bowls MissinG __________________
nuMBer oF insects collecteD ___________________
notes _________________________________________________________________________________
_______________________________________________________________________________________
_______________________________________________________________________________________
_______________________________________________________________________________________

31
Protocol to detect and Monitor Pollinator coMMunities: Guidance for Practitioners
Metadata fields and descriptions
DescriPtion oF stuDy describe your study here in a paragraph.
sPeciFic site DescriPtions add any details about each of your sites here. this can take up several lines if needed.
wHo to contact aBout stuDy name and email address.
version oF Data any time data gets changed we should change the version number of the data set and record what was changed.
MissinG values identify how missing values are coded. We suggest they be signified with a '.' leave blank if those data were not collected. if you collected on a date but found no pollinators, enter the country, site, appropriate treatments, method, time and collection date. Put none for the order, family, Genus and species and '0' for the count.
Data For eacH sPeciMen:
country the country where the samples were collected. Write the full name.
region the region where the sites were placed. Write the full name.
locality the locality where the samples were collected. only use if needed.
site the name of the site where you collected (on a separate metadata page, you should provide the latitude and longitude in digital degrees for each site and any details about it).
latitude
longitude
treatment 1 add as many treatment columns as needed. you also do not need to have treatment columns if you did not have treatments. this could be region, temperature, or crop type (e.g. Phaseolus…) or something else important to your study (e.g. bowl colour, sample location - in crop or on edge, etc.). on your metadata page, identify all the possible options for treatment levels.
treatment 2 you can add as many treatment columns as you need. if the previous one is crop type (e.g. Phaseolus…), this one might be organic versus non-organic. on your metadata, identify all the possible options for treatment levels.
Method identify how pollinators were collected. Please only use the terms "pan traps", "sweep nets" or "visual observation" so that there is a standard across all data sets. if you sampled in a different way, a new standard will need to be set.
unique number for the collecting event a unique number that relates all the bees collected at the same time and place. this can also reflect that the bees were collected on the same bowl or same species of plant.
date and time when the trap or collecting event started time of day and date collecting started (use 24 hour time). Please use the format dd.mm.year.hh:mm.
date and time when the trap or collecting event was picked up or stopped
time of day and date collecting completed (use 24 hour time). Please use the format dd.mm.year.hh:mm.
unique number for the individual specimen a unique number that will correspond to a label on the specimen.

32
a n n e X e s
visualization of sampling data sheet – mandatory fieldsa sampling data sheet can be found at: http://www.fao.org/pollination. this sampling sheet
was developed as a companion tool to this protocol, and consists of three work sheets: (a) meta
data; (b) sample data; and (c) a description of the data required for the sample data work sheet.
figure a1
saMPlinG Data sHeet
order order of the species (if data were lumped taxonomically give as much detail as available). if not known, type 'unknown'.
family family of the species. if not known, type 'unknown'.
Genus Genus name. if not known, type 'unknown'.
subgenus subgenus name, if not known, type 'unknown'. if this is not normally collected, please feel free to ignore.
species species name. if not known, type 'unknown'.
count number of individuals of that species. if nothing was collected on that date, put zero here. May not be needed if individual specimens are given unique numbers.
name of collector identity of the collector of the specimen.
name of person who identified the specimen identity of the expert who identified the specimens collected.
date the identification took place date in dd.mm.year.
name of person who entered the record identity of the person entering the data.
date the data were entered date in dd.mm.year.
"notes" (for recording weather, conditions, problems encountered, flowers blooming etc.)
oPtional FielDs:
habitat
Physiographic province
flower information if the researcher is collecting specimens at flowers

33
Protocol to detect and Monitor Pollinator coMMunities: Guidance for Practitioners
anneX bFielD triP anD laBoratory cHecKlists
FielD triP cHecKlist laB cHecKlist
� bowls
� Plastic spoon
� Mesh filter (e.g. tea strainer)
� detergent
� dishwashing liquid
� alcohol
� sample plastic bags (must seal tightly)
� 1-litre jug
� 20-litre water jug
� location log
� data sheets
� blank paper
� Permanent ink pen
� Pencils
� clipboard
� Maps
� GPs unit
� batteries
� charger
� hand lens
� two-way radios
� sun glasses
� hat
� toilet paper
� Matches
� cell phone
� collecting permits
� Plant id material
� technical pens
� boots
� sun screen
� deet insect repellent
� drinking water bottle
� backpack
� hip pack
� camera
� Watch
� first aid kit
� scissors
� tweezers
� determination (“det”) labels
� Paper triangles
� humidors
� enamel sorting pan
� hair dryer
� Pinning board
� bee washer jar
� empty bee boxes
� Pins
� Glue
© n
. o.
Per
eira
© n
. o.
Per
eira
© e
. ro
cha
© P
. ba
rret
o
34
a n n e X e s
anneX calternative MetHoDs For DryinG Bees
using compressed air it was found that using compressed air results in the quickest drying of wet bees. When using
compressed air, be aware that there can be moisture in the air lines. run the air wide open for
a few seconds to get rid of any loose moisture. also be aware that at high pressure, compressed
air can blow apart specimens, particularly their abdomens. direct the air stream to the side of
the jar and let it swirl the specimens around in a vortex (if the pressure is too high or they are
bouncing violently around, the researcher can rip some abdomens off). small specimens with
short hair take less than one minute to dry. bumblebees take about two minutes to have all the
hair on their thorax fluff up.
Making and using an autobeedryerif the researcher is involved in collecting and processing many specimens, s/he may want to
invest in the creation of an autobeedryer. a slideshow and video that demonstrate how to make
such a device can be seen at:
http://www.slideshare.net/sdroege/how-to-create-an-autobeedryer
http://www.youtube.com/watch?v=935jlJep6go
upright blow dryer bee dryeranother system that is fairly compact and easy to transport to the field is the upright blow dryer.
it can be built out of a piece of 1 x 4 lumber and a few small pieces of Pvc. the blower is set
upright and blows air through the tube placed on top of the dryer and dries the bees. the specific
design of the wooden frame depends upon the size and shape of the particular blow drier that
is used. a frame can be built around the dryer, making sure it can slide in and out of the frame.
use a blow dryer that has a “cool” temperature setting. “Warm” or “hot” will bake the bees and
make them brittle (although switching to “warm” air for a few minutes can accelerate the drying
process for Bombus and other large hairy bees).
35
Protocol to detect and Monitor Pollinator coMMunities: Guidance for Practitioners
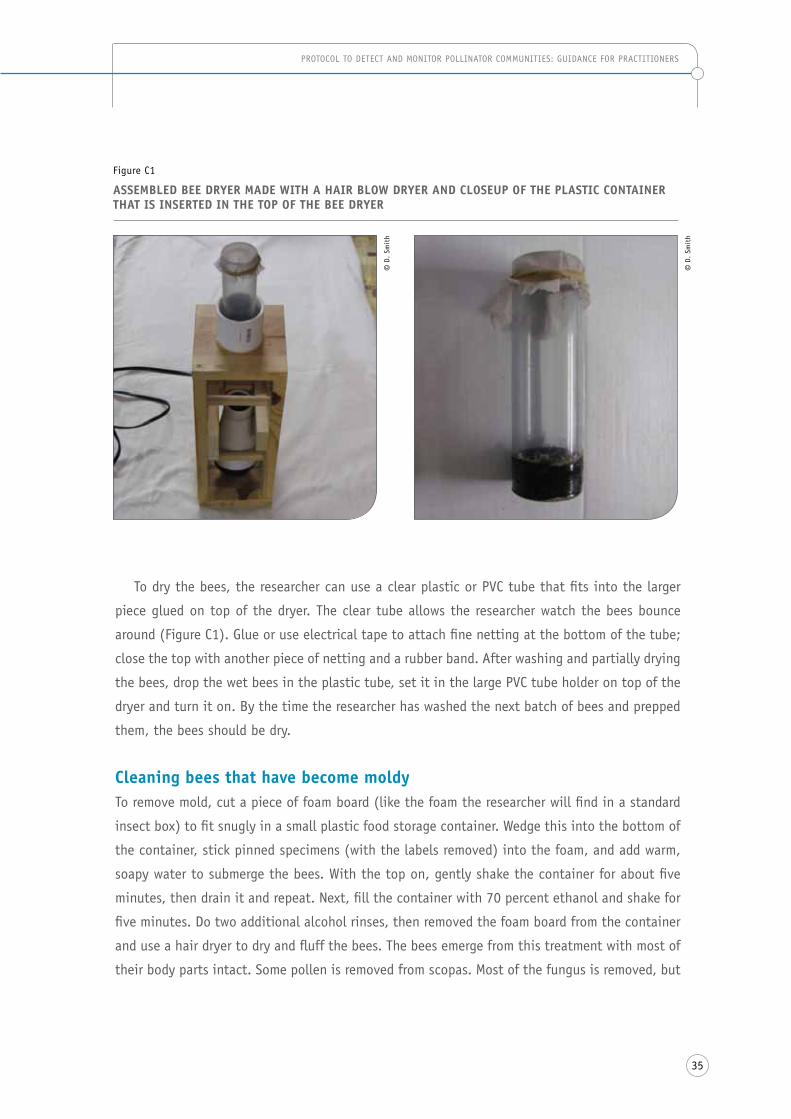
to dry the bees, the researcher can use a clear plastic or Pvc tube that fits into the larger
piece glued on top of the dryer. the clear tube allows the researcher watch the bees bounce
around (figure c1). Glue or use electrical tape to attach fine netting at the bottom of the tube;
close the top with another piece of netting and a rubber band. after washing and partially drying
the bees, drop the wet bees in the plastic tube, set it in the large Pvc tube holder on top of the
dryer and turn it on. by the time the researcher has washed the next batch of bees and prepped
them, the bees should be dry.
cleaning bees that have become moldyto remove mold, cut a piece of foam board (like the foam the researcher will find in a standard
insect box) to fit snugly in a small plastic food storage container. Wedge this into the bottom of
the container, stick pinned specimens (with the labels removed) into the foam, and add warm,
soapy water to submerge the bees. With the top on, gently shake the container for about five
minutes, then drain it and repeat. next, fill the container with 70 percent ethanol and shake for
five minutes. do two additional alcohol rinses, then removed the foam board from the container
and use a hair dryer to dry and fluff the bees. the bees emerge from this treatment with most of
their body parts intact. some pollen is removed from scopas. Most of the fungus is removed, but
figure c1
asseMBleD Bee Dryer MaDe witH a Hair Blow Dryer anD closeuP oF tHe Plastic container tHat is inserteD in tHe toP oF tHe Bee Dryer
© d
. sm
ith
© d
. sm
ith

36
a n n e X e s
some may still cling to hairy places and the tight spaces between body segments. the researcher
may be able to use a soft watercolour paintbrush to dislodge more of the fungus during one or
more of the rinses. be careful that the foam board does not break free and float, causing the
specimens to become pressed up against the top of the container.
re-hydrating bees that have been pinnedat times, there is a need to re-hydrate collected bees in order to remove them from the pin, or
to pull the tongue or genitalia (note that pulling open the jaws on specimens is difficult after
they have dried, even with extensive re-hydration). Place bees into a rehydration container, a
humidor or a covered Petri dish with a moist paper towel inside. it can take anywhere from a few
hours to several days for larger specimens to relax. to prevent mold, add a few drops of ethyl
acetate, a few mothballs, or a large dose of alcohol in the water. the longer the bee has been
pinned the longer it takes to relax and the more fragile it becomes.
alternative bee storage boxesif you have a large volume of bees being processed, you can use other types of cardboard boxes
with lids, such as boxes used for pizza, as an inexpensive alternative to traditional field boxes.
they can be inexpensive, save shelf space and hold more specimens than traditional boxes.
however, the researcher will need to purchase material separately and assemble the box, as they
are not as sturdy as other boxes and pest insects may have greater access. in many countries,
blank pizza boxes can be ordered online. restaurants may also be willing to donate cardboard
boxes. cross-linked polyethylene foam as a pinning base within the boxes seems to have superior
pin holding properties to that of ethafoam, but either could be used. ordering foam in bulk
quantity, directly from a manufacturer, can lower costs. the manufacturer could be asked to cut
the foam to 3/8” (about 1 cm) in thickness and ship as 2’x4’ (about 0.6 m x 1.2 m) sheets.
Foam boards for labeling and sortinglabels can be added to a pinned specimen using the traditional pinning block, but a much faster
method is to use closed cell or cross-linked polyethylene foam to set the label height (note that
styrofoam or polystyrene does not supply enough support for a paper label). to make a foam
pinning board, simply glue a piece of foam to a thin board (plywood works well, regular wood
often adsorbs too much moisture from the glue and will warp…at least for a time) or a piece of
thick plastic. White glues work quite well. be sure to place another board on top of just glued
foam and add weight to that board to increase the adhesion of the glue while drying. after the

37
Protocol to detect and Monitor Pollinator coMMunities: Guidance for Practitioners
glue has dried (approximately two days) the researcher can trim the edges with a saw to make
things neat and tidy. the united states Geological survey laboratory uses these boards for a
variety of activities and finds that boards of the following dimensions are most useful: 50 cm x
30 cm, 25 cm x 25 cm, 20 cm x 12 cm. the thickness of the foam should be approximately the
height of the labels, but better too thick than too thin.

38
a n n e X e s
anneX dBatcH ProcessinG oF coMMon Bees
bee identification is difficult in most circumstances, particularly at the beginning of a project
- and will require sending specimens to an identification center or a series of experts. however,
the researcher will find that at the sites there will be a few species of bees that are easy to
identify, and which are very abundant. consequently, there is no real need to actually pin these
specimens and a great deal of savings can occur if they are processed immediately without first
pinning them.
to most efficiently accomplish this, the researcher will first need to assign a site or batch
number to the group of bees they are working on. additionally, using a set of precise flat-tipped,
self-closing, reverse tweezers will speed the process as these self-closing tweezers greatly ease
the manipulation of dried specimens. and finally, it will also be of use to have a counter of some
kind available – this can be a one as illustrated in figure d1, or, alternatively, a web version.
if the bees are not pinned and the researcher wishes to work with a batch of specimens, the
researcher will want to put the specimens in a shallow box, tray, or Petri dish so the researcher
can hold the tray in one hand and manipulate the specimens with the tweezers in the other.
figure d1
counters For KeePinG tracK oF nuMBers oF Bees oF DiFFerent taxa
© G
. le
buhn
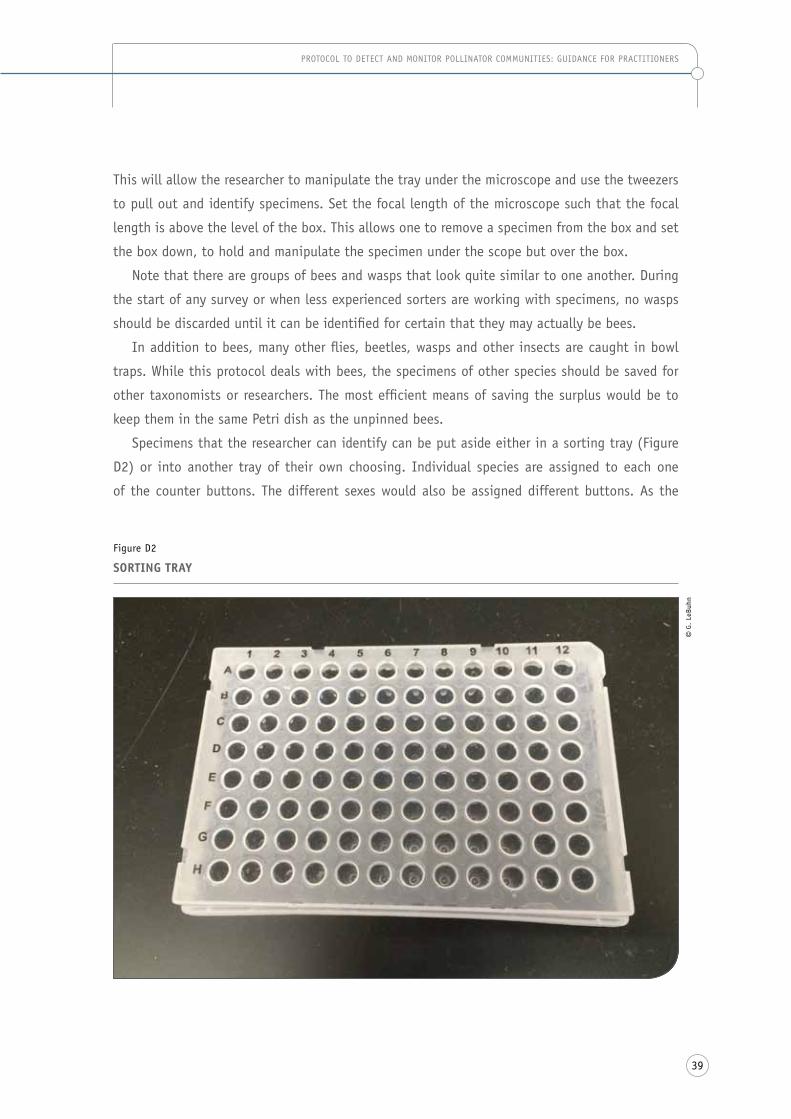
39
Protocol to detect and Monitor Pollinator coMMunities: Guidance for Practitioners
this will allow the researcher to manipulate the tray under the microscope and use the tweezers
to pull out and identify specimens. set the focal length of the microscope such that the focal
length is above the level of the box. this allows one to remove a specimen from the box and set
the box down, to hold and manipulate the specimen under the scope but over the box.
note that there are groups of bees and wasps that look quite similar to one another. during
the start of any survey or when less experienced sorters are working with specimens, no wasps
should be discarded until it can be identified for certain that they may actually be bees.
in addition to bees, many other flies, beetles, wasps and other insects are caught in bowl
traps. While this protocol deals with bees, the specimens of other species should be saved for
other taxonomists or researchers. the most efficient means of saving the surplus would be to
keep them in the same Petri dish as the unpinned bees.
specimens that the researcher can identify can be put aside either in a sorting tray (figure
d2) or into another tray of their own choosing. individual species are assigned to each one
of the counter buttons. the different sexes would also be assigned different buttons. as the
figure d2
sortinG tray
© G
. le
buhn

40
a n n e X e s
researcher continues to count specimens, they click the counter for each species/sex. for those
species the researcher is unsure of, or for some reason want to pin, the researcher would place
those directly onto a foam pad for pinning or put them into another box for pinning later.
Warning: if the researcher is processing specimens immediately after they have been washed and
dried then they will find that the large specimens are too heavy to stay glued to a pin and will
pull away. the researcher can pin them in the traditional manner or wait until they are dried in
a couple of weeks.
after the specimens have been sorted then transfer the counts for each species/sex from the
bee counter into a spreadsheet1 along with a count of the number of unidentified specimens that
will be pinned or pinned later.
the species that have been identified can be pooled together and placed into a Petri dish or
other container along with their identification tag. as long as these specimens are kept out of
the light, checked regularly for pests, and kept at low humidity then they will remain archived
for future researcher’s use. such archived species should be kept indefinitely. if the researcher
lives in a high humidity area then specimens should be kept in an air-conditioned room at all
times during the humid seasons and monitored closely for mold.
in general, the process outlined above greatly speeds up the processing of specimens, lowers
the costs necessary for pins, insect trays, insect drawers, insect cabinets, and large amounts of
humidity-controlled storage space.
1 to record data during the processing of bees, an excel spreadsheet (designed as a companion to this protocol) is available at http://www.fao.org/pollination. alternatively, a new data entry format can be constructed, as suits the researcher’s preference.

41
Protocol to detect and Monitor Pollinator coMMunities: Guidance for Practitioners
anneX esaMPle r coDe
this is presented through a hypothetical data set (beespecies.txt) that could be used to compare
species richness. this data set is too small to be an accurate measure of trend. for simplicity,
only three sites and three years were included.
e.1 Data set File ForMat
#beespecies.txt (this is the filename for this file)
e.2 saMPle coDe For statistical analyses# computing summary statistics
y = c(41,44,38,36,35,32)
ysum = sum(y)
ysq = sum(y^2)
n = length(y)
ymean = ysum/n
yvar = (ysq - ysum^2/n)/(n-1)
mean(y)
var(y)
location HaBitat sPecies aBunDance year
site1 agricultural 41 150 2001
site1 agricultural 44 138 2006
site1 agricultural 38 120 2011
site2 rural 36 95 2001
site2 rural 35 88 2006
site2 rural 32 90 2011
site3 suburban 38 105 2001
site3 suburban 37 100 2006
site3 suburban 31 80 2011
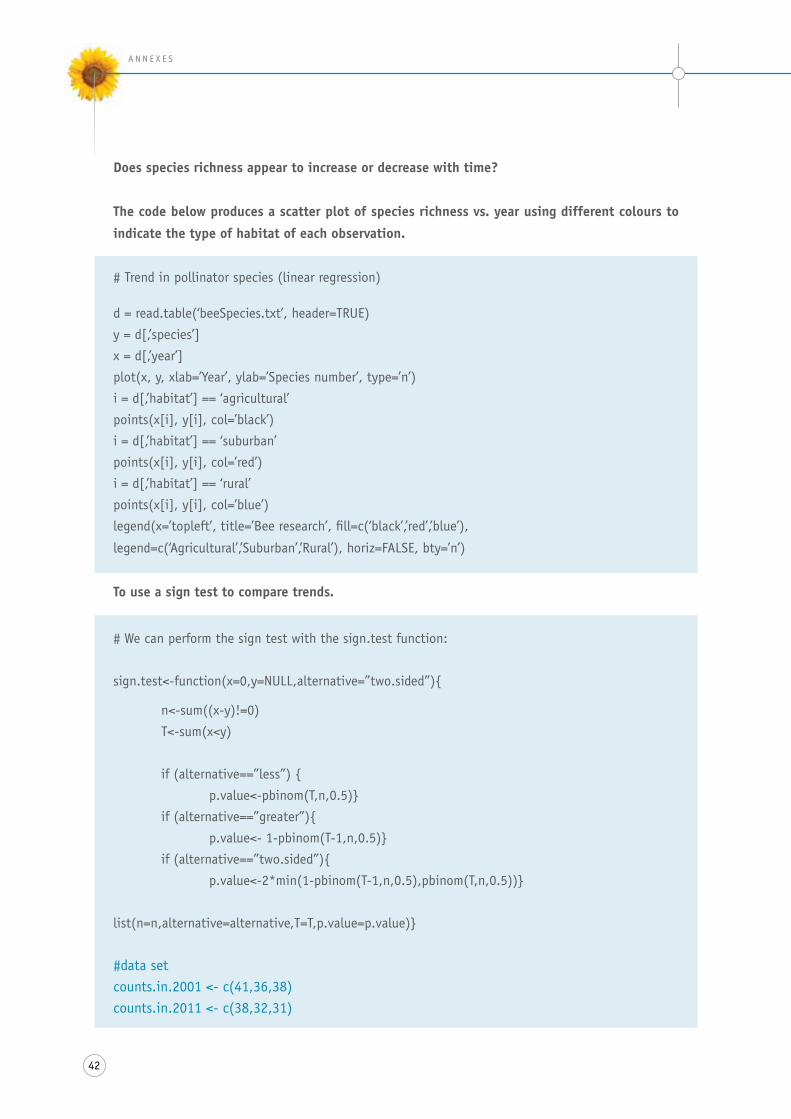
42
a n n e X e s
Does species richness appear to increase or decrease with time?
the code below produces a scatter plot of species richness vs. year using different colours to
indicate the type of habitat of each observation.
# trend in pollinator species (linear regression)
d = read.table(‘beespecies.txt’, header=true)
y = d[,’species’]
x = d[,’year’]
plot(x, y, xlab=’year’, ylab=’species number’, type=’n’)
i = d[,’habitat’] == ‘agricultural’
points(x[i], y[i], col=’black’)
i = d[,’habitat’] == ‘suburban’
points(x[i], y[i], col=’red’)
i = d[,’habitat’] == ‘rural’
points(x[i], y[i], col=’blue’)
legend(x=’topleft’, title=’bee research’, fill=c(‘black’,’red’,’blue’),
legend=c(‘agricultural’,’suburban’,’rural’), horiz=false, bty=’n’)
to use a sign test to compare trends.
# We can perform the sign test with the sign.test function:
sign.test<-function(x=0,y=null,alternative=”two.sided”){
n<-sum((x-y)!=0)
t<-sum(x<y)
if (alternative==”less”) {
p.value<-pbinom(t,n,0.5)}
if (alternative==”greater”){
p.value<- 1-pbinom(t-1,n,0.5)}
if (alternative==”two.sided”){
p.value<-2*min(1-pbinom(t-1,n,0.5),pbinom(t,n,0.5))}
list(n=n,alternative=alternative,t=t,p.value=p.value)}
#data setcounts.in.2001 <- c(41,36,38) counts.in.2011 <- c(38,32,31)
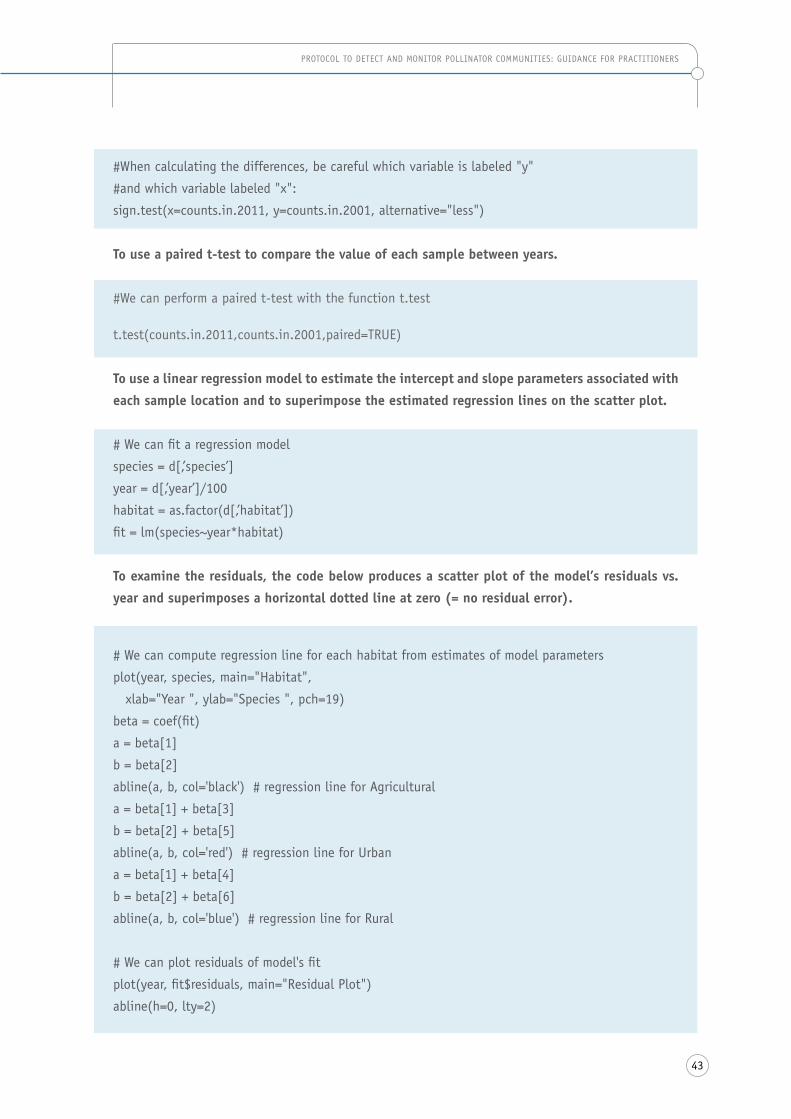
43
Protocol to detect and Monitor Pollinator coMMunities: Guidance for Practitioners
#When calculating the differences, be careful which variable is labeled "y"
#and which variable labeled "x":
sign.test(x=counts.in.2011, y=counts.in.2001, alternative="less")
to use a paired t-test to compare the value of each sample between years.
#We can perform a paired t-test with the function t.test
t.test(counts.in.2011,counts.in.2001,paired=true)
to use a linear regression model to estimate the intercept and slope parameters associated with
each sample location and to superimpose the estimated regression lines on the scatter plot.
# We can fit a regression model
species = d[,’species’]
year = d[,’year’]/100
habitat = as.factor(d[,’habitat’])
fit = lm(species~year*habitat)
to examine the residuals, the code below produces a scatter plot of the model’s residuals vs.
year and superimposes a horizontal dotted line at zero (= no residual error).
# We can compute regression line for each habitat from estimates of model parameters
plot(year, species, main="habitat",
xlab="year ", ylab="species ", pch=19)
beta = coef(fit)
a = beta[1]
b = beta[2]
abline(a, b, col='black') # regression line for agricultural
a = beta[1] + beta[3]
b = beta[2] + beta[5]
abline(a, b, col='red') # regression line for urban
a = beta[1] + beta[4]
b = beta[2] + beta[6]
abline(a, b, col='blue') # regression line for rural
# We can plot residuals of model's fit
plot(year, fit$residuals, main="residual Plot")
abline(h=0, lty=2)

44
a n n e X e s
anneX fGlossary oF Bee taxonoMic terMs
anGulate forming an angle rather than a curve
areolate an area dissected by reticulating raised lines forming clear and strongly defined cells
anterior toward the head or on the head side of a segment being described
aPex end of any structure
aPical near or at the apex or end of any structure
aPPresseD tight and flat against the body of the bee, usually used to describe hair
arcuate curved like a bow
areolate integumental (skin) sculpture pattern: divided into a number of small irregular spaces, very similar if not used interchangeably with reticulate
arolia the pad between the claws found at the ends of some bees legs
BanDs usually referring to bands of hair or bands of colour that traverse across an abdominal segment from side to side
BasaD (Basally) toward the base
Base (Basal area) on whatever part being described, this would be the section or the area at or near to the point of attachment, or nearest the main body of the bee, the opposite end of which would be the apical area
Basitarsus the segment of the tarsus that is the nearest to the bee’s body….usually the largest of all the tarsal segments
BasitiBial Plate a small plate or saclike projection at the base of the hind tibia (like a bee knee pad)
BiFiD cleft or divided into 2 parts; forked
carina a clearly defined ridge or keel, not necessarily high or acute, usually appears on bees as simply a raised line
carinate keeled; having keels or carinae
cauDaD towards the tail, or on the tail side of a segment being described
45
Protocol to detect and Monitor Pollinator coMMunities: Guidance for Practitioners
cHeeKs the lateral part of the head beyond the compound eyes, includes the gena and the subgena
clyPeus a section of the face below the antennae, demarcated by the epistomal sutures
conically cone shaped, with a flat base, tapering to what is usually a blunt or rounded top
convex the outer curved surface of a segment of a sphere, as opposed to concave
corBicula a hairless area or patch surrounded by longer hairs used to hold and transport pollen. bumblebees and honey bees have this on their tibia, while andrena have a patch on the sides of their propodeum
costa wing vein
coxae the basal segment of the leg
cuBital wing vein
Denticle a small tooth-like projection
Disc a generic term for the middle surface of a plate (usually in reference to an abdominal segment) as opposed to what might be going on along the sides
Distal away from the body or a description of a place on a segment that is furthest from the place of attachment with the body of the bee
DorsuM in general, the upper surface
ecHinate thickly set with short, stout spines or prickles
eMarGinate a notched or cut out place in an edge or margin, can be dramatic or simply a subtle inward departure from the general curve or line of the margin or structure being described
Fasciae a transverse band or broad line, in bees often created by a band of light coloured hairs on the abdomen
FerruGinous rusty, red–brown, orange-brown
FlaGelluM the third and remaining part of the antenna beyond the pedicel and scape, containing most of the antennal segments
Fore usually refers to the first pair of legs, the ones closest to the head
Foveae a depressed region of cuticle, in bees this depressed area is usually only very slightly hollow and usually on the face
Fulvous a brownish yellow-tawny colour to orange brown
Fuscous dark brown, approaching black; a plain mixture of brown and red
Gena the cheek or the region below the eye seen when viewing the head from the side and holding the head so that the flat of the face is at right angles to the line of sight

46
a n n e X e s
GlaBrous a surface without any hairs
Glossa part of the tongue
GraDulus a line that runs from side to side on abdominal segments of some bees that is formed by the step between two regions that differ in height, often that difference is only apparent upon very close inspection
Hyaline transparent, glassy
HyPoePiMeral area on the thorax
HyPostoMa the notched region underneath the head and behind the mandible that holds the folded tongue
iMBricate lined with microscopic inscribed lines that form a fish scale like pattern
iMPresseD area almost always refers to the rear part of the upper abdominal segments, these areas often being very slightly (often very difficult to detect) lower than the front part of the segment
iMPunctate not punctate or marked with punctures or pits
inFuscateD smoky gray-brown, with a blackish tinge
inner usually refers to legs and refers to the part that faces the body
inteGuM the outer layer of the bee; the skin or cuticle
intercuBital wing vein
interstitial when describing veins it refers to the end of one approximating the beginning of another, as in a grid intersection
laBruM abutting the clypeus in front of the month
Macula a spot or mark
Maculations spotted or made up of several marks
Malar sPace the shortest distance between the base of the mandible and the margin of the compound eye often completely absent in bees
ManDiBles bee teeth, so to speak, usually crossed and folded in front of the mouth
MarGinal cell a wing cell located on the edge (margin) of the wing
Mesally (MeDially) pertaining to, situated on, in or along the middle of the body or segment
MesePisturnuM, MesoPleura, or MesotHorax the second or middle segment of the thorax bearing the middle legs and the forewings, the pronotum is the first segment
MetaPleura thorax segment bearing the hind legs and hind wings

47
Protocol to detect and Monitor Pollinator coMMunities: Guidance for Practitioners
notaulices a pair of lines on some bees that appear on either side of the scutum near the base of the wings
ocelli the 3 simple eyes or lenses that sit at the top of the head of bees
ocHraceous pale yellow
PaPillae (PaPilate) very tiny short hard cone-like projections usually in bees only found on the wing or legs and often having small hairs arising from the top
outer usually refers to legs and specifically to the surfaces facing away from the body
Pectinate comb-like, having large comb-like teeth that are clearly separate from one another
Petiolate having a stalk
Piceous glossy brownish black in colour, pitch like
Pleura the lateral or side areas of the thorax, excluding the lateral surfaces of the propodeum
PluMose feather-like
Pollex a thumb; the stout fixed spur at the inside of the tip of the tibia
Posterior toward the tail end or on the tail end of a segment being described
PreaPical referring to a section of a bee that is just physically found just before the outermost (or apical) end of the section or segment
PronotuM a collar-like segment on the thorax and directly behind the head; extends down the sides of the thorax toward the first pair of legs
ProPoDeuM the last segment of a bees thorax (although not evident, it is in fact considered anatomically part of the abdomen)
ProtHoracic of or pertaining to the prothorax
ProtuBerant rising or produced above the surface or the general level, often used as a term to define a single or pair of small bumps
ProxiMal that part nearest the body
PuBescent downy; clothed with soft, short, fine, loosely set hair
PyGiDial Plate unusually flat area (a plate) surrounded by a ridge or line and sometimes sticking well off of the end of the bee. if present, found on the sixth upper abdominal segment in females, seventh in males
rePose in a retracted physical state
reFlexeD bent up or away
reticulate made up of a network of lines that creates a set of netlike cells, similar to areolate except perhaps more of a regular network of cells - undoubtedly both have been used to describe the same patterns at times

48
a n n e X e s
ruGose a wrinkled set of bumps that are rough and raised well above the surface
scaPe the first or basal segment of the antenna
scoPa a brush; a fringe of long dense and sometimes modified hairs designed to hold pollen
scutelluM shield shaped plate behind scutum
scutuM the large segment on top of the thorax located between the wings and behind the head
serrate notched on the edge, like a serrated knife
setose covered with setae or stiff short hairs
sinuate the margin with wavy and strong indentations
sPatulate shaped like a spatula
sPicule small needlelike spine
sPinose armed with thorny spines, more elongate than echinate
sterna the plates on the underside of the abdomen
stiGMa a thickened coloured spot or cell in the forewing just behind the costal cell
striae a set of parallel lines (usually raised) and can be thick or thin
suBaPical located just behind the apex of the segment or body part
suBcontiGuous not quite contiguous or touching
suBequal similar but not necessarily exactly equal in size, form or length
suBMarGinal cells one or more cells of the wing lying immediately behind the marginal cells
suBruGose a bit bumpy but not forming an extensive set of wrinkled bumps
sulcus groove; more of an elongate hole or puncture in the skin of the bee
suPra above, beyond or over
suPraclyPeal area the region of the head between the antennal sockets and clypeus, demarcated on the sides by the subantennal sutures
suture a groove marking the line of fusion of two distinct plates on the body or face of a bee
tarsus the leg segments at the end of the bee’s leg, attached to the tibia
teGulae the usually oval, small shield like structure carried at the extreme base of the wing where it attaches to the body
terGuM the segments on the top side of the abdomen

49
Protocol to detect and Monitor Pollinator coMMunities: Guidance for Practitioners
tessellate small very fine lines that make up a network of squares like a chessboard on the surface of the skin; can often be very faint markings that appear like fingerprints on the shiny surface of the skin
testaceous brownish-yellow
tiBia segment of the leg, between the femur and the tarsus
toMentuM a form of pubescence composed of short matted, woolly hair
toMentose covered with tomentum
transverse across the width of the body or segment rather than the length, in other words at right angles to the head to abdomen axis of the body
trocHanters segment of the insect leg between the coxa and the femur
truncate cut off squarely at tip
tuBercle a small knoblike or rounded protuberance
unDulate wavy
venter the undersurface of a section of a bee or bee part, usually the abdomen
ventral pertaining the undersurface of the abdomen
vertex the top of the head
violaceous violet coloured

50
a n n e X e s
anneX GBee BoDy Part FiGures
Drawn by rebekah nelson
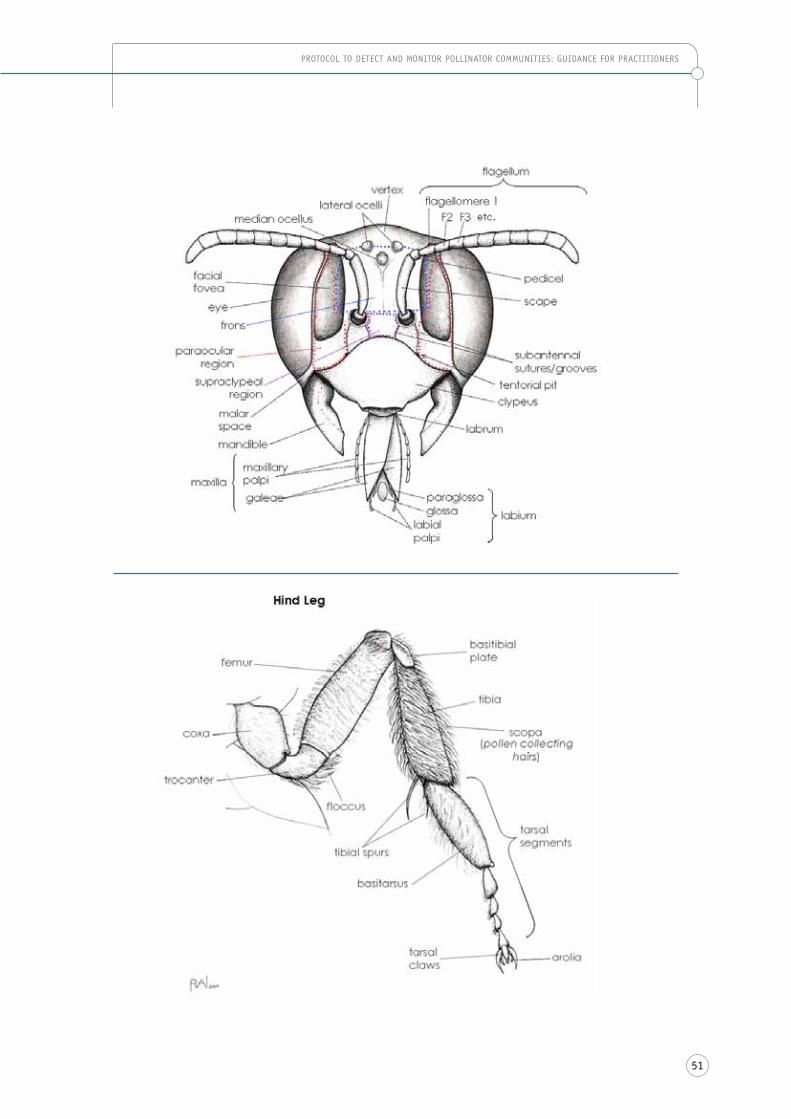
51
Protocol to detect and Monitor Pollinator coMMunities: Guidance for Practitioners
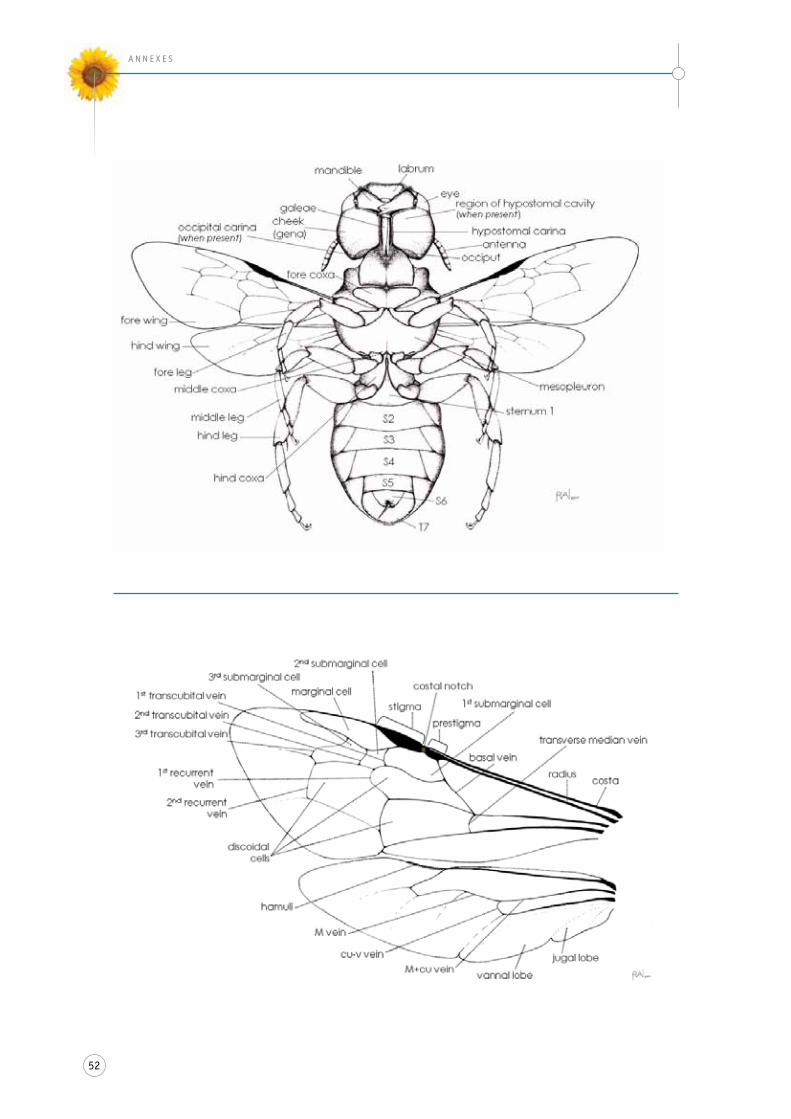
52
a n n e X e s

53
Protocol to detect and Monitor Pollinator coMMunities: Guidance for Practitioners
carvalheiro, l.G., saraiva, a.M. & Giannini, t.c. 2016. establishing knowledge management systems for ecological interactions: the case of crop pollinators. In Gemmill-herren, b. (ed.), Pollination services to agriculture: sustaining and enhancing a Key ecosystem service. routledge, london and new york.
Droege, s. 2010. How to wash bees [online video] (posted on 2 february 2010 in youtube channel) (available at https://www.youtube.com/watch?v=a2y-ind12cc).
Droege, s. 2010. How to Dry Bee Specimens [online video] (posted on 5 february 2010 in youtube channel) (available at https://www.youtube.com/watch?v=935jlJep6go).
Droege, s. 2015. The Very Handy Manual: How to Catch and Identify Bees and Manage a Collection. (available at http://bees.tennessee.edu/publications/handybeeManual.pdf) (accessed on 13 november 2015).
Freitas, B.F., vaissièrem B.e., saraiva, a., carvalheiro, l.G., Garibaldi, l.a. & ngo, H. 2016. identifying and assessing Pollination Deficits in crops. In Gemmill-herren, b. (ed.), Pollination services to agriculture: sustaining and enhancing a Key ecosystem service. routledge, london and new york.
Gallai, n., salles, j., settele, j. & vaissière, B. e. 2009. economic valuation of the vulnerability of world agriculture confronted with pollinator decline. Ecological Economics, 68(3): 810–821.
Garibaldi, l. a., steffan-Dewenter, i., winfree, r., aizen, M. a., Bommarco, r., cunningham, s. a., Kremen, c., carvalheiro, l.G., Harder, l.D., afik, o., Bartomeus, i., Benjamin, F., Boreux, v., cariveau, D., chacoff, n.P., Dudenhöffer, j.H., Freitas, B.M., Ghazoul, j., Greenleaf, s., Hipólito, j., Holzschuh, a., Howlett, B., isaacs, r., javorek, s.K., Kennedy, c.M., Krewenka, K.M., Krishnan, s., Mandelik, y., Mayfield, M.M., Motzke, i., Munyuli, t., nault, B.a., otieno, M., Petersen j., Pisanty, G., Potts, s.G., rader, r., ricketts, t.H., rundlöf, M., seymour, c.l., schüepp, c., szentgyörgyi, H., taki, H., tscharntke, t., vergara, c.H., viana, B.F., wanger, t.c., westphal, c., williams, n. & Klein a.M. 2013. Wild pollinators enhance fruit set of crops regardless of honey bee abundance. Science, 339: 1608-1611.
Greenleaf, s. s. & Kremen, c. 2006. Wild bees enhance honey bees’ Pollination of hybrid sunflower. Proceedings of the National Academy of Sciences of the United States of America, 103(37): 13890–95. doi:10.1073/pnas.0600929103. http://www.pnas.org/content/103/37/13890.full
Klatt, B. K., Holzschuh, a., westphal, c., clough, y., smit, i., Pawelzik, e. & tscharntke, t. 2014. bee Pollination improves crop Quality, shelf life and commercial value. Proceedings. Biological Sciences / The Royal Society, 281(1775): 20132440. doi:10.1098/rspb.2013.2440. http://rspb.royalsocietypublishing.org/content/281/1775/20132440
reFerences

54
r e F e r e n c e s
Klein, a.-M., vaissière, B. e., cane, j. H., steffan-Dewenter, i., cunningham, s.a., Kremen, c. & tscharntke, t. 2007. importance of Pollinators in changing landscapes for World crops.Proceedings. Biological Sciences / The Royal Society, 274(1608): 303–13. doi:10.1098/rspb.2006.3721. http://rspb.royalsocietypublishing.org/content/274/1608/303
leBuhn, G., Droege, s., connor, e.F., Gemmill-Herren, B., Potts, s.G., Minckley, r. l., Griswold, t., jean, r., Kula, e., roubik, D. w., cane, j., wright, K. w., Frankie, G. & Parker, F. 2012. detecting insect Pollinator declines on regional and Global scales. Conservation Biology: The Journal of the Society for Conservation Biology, december, 1–8. doi:10.1111/j.1523-1739.2012.01962.x. http://onlinelibrary.wiley.com/doi/10.1111/j.1523-1739.2012.01962.x/full
leBuhn, G., connor, e., Brand, M., colville, j.F., Devkota, K., thapa, r.B., Kasina, M., joshi, r.K., aidoo, K., Kwapong, P., annoh, c., Bosu, P. & rafique, M.K. 2016. Monitoring pollinators around the world. In Gemmill-herren, b. (ed.), Pollination services to agriculture: sustaining and enhancing a Key ecosystem service. routledge, london and new york.
Packer, l. & ratti, c. Key to the bee families of the World (available at http://www.yorku.ca/bugsrus/resources/keys/bfoW/images/introduction/introduction.html).
strasser, c., cook, r., Michener, w. & Budden, a. Primer on data Management: What you always wanted to know* (but were afraid to ask). dataone. (available at https://www.dataone.org/sites/all/documents/dataone_bP_Primer_020212.pdf).
vaissière, B. e., Freitas, B. M. & Gemmill-Herren, B. 2011. Protocol to Detect and Assess Pollination Deficits in Crops: A Handbook for Its Use. fao. rome, italy. http://www.fao.org/3/a-i1929e.pdf
verzani, j. 2005. using r for introductory statistics. chapman & hall, boca raton, florida.

Food and agriculture organization of the united nations viale delle terme di caracalla, 00153 rome, italy
www.fao.org/pollinationwww.fao.org/agriculture/crops/agp-homee-mail: [email protected]
GloBal action on Pollination services for sustainaBle aGriculture
as a contribution to the international Pollinator initiative, and through the Gef/uneP/fao Global Pollination Project, fao collaborated with the san francisco state university to develop a protocol for monitoring bee pollinator populations in crop production landscapes. Practical guidance is provided for using a common methodology to monitor pollinator diversity and abundance. the publication provides options for local implementation for a variety of groups including researchers, extension agents, farmers, students and others.
i536
7e/1
/01.
16
Related Documents