Title Proteomic profiling of HTLV-1 carriers and ATL patients reveals sTNFR2 as a novel diagnostic biomarker for acute ATL( Text_全文 ) Author(s) Guerrero, Carmina Louise Hugo Citation Blood Advances, 4(6): 1062-1071 Issue Date 2020-03-20 URL http://hdl.handle.net/20.500.12000/47433 Rights

Welcome message from author
This document is posted to help you gain knowledge. Please leave a comment to let me know what you think about it! Share it to your friends and learn new things together.
Transcript

TitleProteomic profiling of HTLV-1 carriers and ATL patientsreveals sTNFR2 as a novel diagnostic biomarker for acuteATL( Text_全文 )
Author(s) Guerrero, Carmina Louise Hugo
Citation Blood Advances, 4(6): 1062-1071
Issue Date 2020-03-20
URL http://hdl.handle.net/20.500.12000/47433
Rights

REGULAR ARTICLE
Proteomic profiling of HTLV-1 carriers and ATL patients reveals sTNFR2 asa novel diagnostic biomarker for acute ATL
Carmina Louise Hugo Guerrero,1 Yoshiko Yamashita,2 Megumi Miyara,3 Naoki Imaizumi,4 Megumi Kato,1 Shugo Sakihama,5
Masaki Hayashi,6 Takashi Miyagi,7 Kaori Karimata,7 Junnosuke Uchihara,8 Kazuiku Ohshiro,9 Junpei Todoroki,10 Sawako Nakachi,11
Satoko Morishima,11 Kennosuke Karube,5 Yuetsu Tanaka,12 Hiroaki Masuzaki,11 and Takuya Fukushima1
1Laboratory of Hematoimmunology, Graduate School of Health Sciences, University of the Ryukyus, Nishihara, Japan; 2AI Drug Development Division, NECCorporation, Tokyo,Japan; 3Department of Health and Nutrition, Faculty of Health and Nutrition, Okinawa University, Naha, Japan; 4Laboratory of Molecular Genetics, Graduate School of HealthSciences, and 5Department of Pathology and Cell Biology, Graduate School of Medicine, University of the Ryukyus, Nishihara, Japan; 6Department of Hematology, NakagamiHospital, Okinawa City, Japan; 7Department of Hematology, Heart Life Hospital, Nakagusuku, Japan; 8Department of Hematology, Naha City Hospital, Naha, Japan; 9Departmentof Hematology, Okinawa Prefectural Nambu Medical Center and Children’s Medical Center, Haebaru, Japan; 10Department of Hematology, Chubu Tokushukai Hospital,Nakagami, Japan; and 11Division of Endocrinology, Diabetes, and Metabolism, Hematology, Rheumatology (Second Department of Internal Medicine), Graduate School ofMedicine, and 12Department of Immunology, Graduate School of Medicine, University of the Ryukyus, Nishihara, Japan
Key Points
• A distinct sTNFR2range is observed inacute ATL patients(10-60 ng/mL) vs ACs(1-8 ng/mL) and those inremission (2-9 ng/mL).
•High cell surface ex-pression of TNFR2 onacute ATL cells sug-gests the clinical utilityof sTNFR2 as a diag-nostic biomarker foracute ATL.
AdultT-cell leukemia/lymphoma (ATL) is ahumanT-cell leukemiavirus type 1 (HTLV-1)–associated
T-cell malignancy with generally poor prognosis. Although only ;5% of HTLV-1 carriers
progress to ATL, early diagnosis is challenging because of the lack of ATL biomarkers. In
this study, we analyzed blood plasma profiles of asymptomatic HTLV-1 carriers (ACs);
untreated ATL patients, including acute, lymphoma, smoldering, and chronic types; and
ATL patients in remission. Through SOMAscan, expression levels of 1305 plasma proteins
were analyzed in 85 samples (AC, n 5 40; ATL, n 5 40; remission, n 5 5). Using gene set
enrichment analysis and gene ontology, overrepresented pathways in ATL vs AC included
angiogenesis, inflammation by cytokines and chemokines, interleukin-6 (IL-6)/JAK/STAT3,
and notch signaling. In selecting candidate biomarkers, we focused on soluble tumor
necrosis factor receptor 2 (sTNFR2) because of its active role in enriched pathways,
extreme significance (Welch’s t test P , .00001), high discrimination capacity (area under
the curve .0.90), and novelty in ATL research. Quantification of sTNFR2 in 102 plasma
samples (AC, n5 30; ATL, n5 68; remission, n5 4) using enzyme-linked immunosorbent assay
showed remarkable elevations in acute ATL, at least 10 times those of AC samples, and
return of sTNFR2 to AC state levels after achieving remission. Flow cytometry and
immunostaining validated the expression of TNFR2 in ATL cells. No correlation between sIL-2
and sTNFR2 levels in acute ATL was found, suggesting the possibility of sTNFR2 as
an independent biomarker. Our findings represent the first extensive blood-based proteomic
analysis of ATL, suggesting the potential clinical utility of sTNFR2 in diagnosing acute ATL.
Introduction
Adult T-cell leukemia/lymphoma (ATL) is a mature T-cell neoplasm associated with human T-cellleukemia virus type 1 (HTLV-1).1-4 The classification of ATL into acute, lymphoma, chronic, andsmoldering clinical subtypes was proposed based on prognostic factors, clinical features, and naturalhistory of the disease.5 The “Revised Adult T-Cell Leukemia-Lymphoma International ConsensusMeeting Report” also includes a recently proposed variant of the lymphoma type ATL called the
Submitted 2 January 2020; accepted 23 February 2020; published online 20 March2020. DOI 10.1182/bloodadvances.2019001429.
Presented in part as an oral presentation at the 61st annual meeting of the AmericanSociety of Hematology, Orlando, FL, 9 December 2019 (oral abstract 0660).
For all original data, please contact the corresponding author, Takuya Fukushima(e-mail: [email protected]).The full-text version of this article contains a data supplement.© 2020 by The American Society of Hematology
1062 24 MARCH 2020 x VOLUME 4, NUMBER 6
Dow
nloaded from https://ashpublications.org/bloodadvances/article-pdf/4/6/1062/1724758/advancesadv2019001429.pdf by U
NIVER
SITY OF R
YUKYU
S user on 12 August 2020

extranodal primary cutaneous variant,6 which has a fatal clinicalcourse and is considered aggressive ATL.7 Patients with aggressiveATL (ie, acute, lymphoma, and unfavorable chronic types) arefrequently treated with intensive multidrug chemotherapy with orwithout mogamulizumab, a defucosylated anti–CC chemokinereceptor 4 monoclonal antibody. Aggressive ATL typically hasa very poor prognosis, with a median survival time of 8 to 10 months.Median survival time with the VCAP-AMP-VECP regimen (ie,vincristine, cyclophosphamide, doxorubicin, and prednisone[VCAP]; doxorubicin, ranimustine, and prednisone [AMP]; andvindesine, etopside, carboplatin, and prednisone [VECP]), whichshowed the best results for chemotherapy in patients withuntreated aggressive ATL in the phase 3 Japan Clinical OncologyGroup (JCOG) 9801 trial (1998-2003), was only 13 months.8
Indolent ATL (ie, favorable chronic and smoldering types) generallyprogresses slowly, and it is therefore recommended that patientsundergo monitoring through watchful waiting or treatment withinterferon-a and zidovudine.9 However, most patients with indolentATL will eventually die after progression to aggressive ATL duringthe chronic course of illness; the prognosis is not good, and there isno plateau phase in the survival curve.10
HTLV-1 is a retrovirus currently endemic in southwest Japan, sub-Saharan Africa, South America, the Caribbean, parts of the MiddleEast, and Australo-Melanesia; the estimated prevalence of infectionis 10 to 20 million worldwide.11-15 HTLV-1 generally does not causeclinical features in a majority of infected individuals; in fact,;95% ofHTLV-1 carriers remain asymptomatic throughout their lives.15 Thelifetime risk of developing ATL in HTLV-1 carriers in Japan is;6% to7% for men and;2% to 3% for women, with 1000 new ATL casesdiagnosed each year.12
Because of the poor prognosis of ATL, it is vital to identify HTLV-1carriers at high risk of developing ATL to establish early interven-tional treatment methods. A nationwide prospective study of 1218asymptomatic HTLV-1 carriers (ACs) in Japan revealed that nonedeveloped ATL among those with a baseline proviral load lower than;4 copies per 100 peripheral blood mononuclear cells (PBMCs);higher proviral load, advanced age, family history of ATL, and firstopportunity for HTLV-1 testing during treatment for another diseasenot related to HTLV-1 were independent risk factors for theprogression of ATL in multivariate Cox analyses.16 In Japan, medianage at diagnosis of ATL was reported as 68 years (range, 34-100years),17 which is older than that in other ATL endemic areas suchas the Caribbean (median, 54 years; range, 28-87 years).18
Geographical differences in the age at ATL onset may be explainednot only by genetic factors, but also by several epigenetic andenvironmental factors that begin to have an effect during the 60-year latency period.12 Many of the epigenetic factors involved in theprogression of ATL remain unknown, prompting us to explore theless researched field of ATL epigenetics: proteomics.
Plasma proteins play key roles in various biological processes, such assignaling, transport, growth, repair, and defense mechanisms, whichare often dysregulated in disease states. Analyses of plasma proteinsprove valuable for developing disease biomarkers with potentialclinical utility, because plasma and other components of blood remainthe predominant specimens for routine analysis. Previously, a high-throughput mass spectrometric plasma protein analysis of patientswith HTLV-1–associated myelopathy was performed to describethe proteomic content of extracellular vesicles in comparison
with the AC state.19 However, comparative proteomic profilingfor ACs and ATL patients has not yet been performed. To furtherunderstand the biological processes in the progression of ATL, weexplored the disease, remission, and carrier states with a proteomicapproach. In this study, we aimed to identify potential proteinbiomarkers for: (1) the onset of ATL by comparing plasma profiles ofACs vs ATL patients; (2) the progression of ATL to its aggressiveforms by comparing plasma profiles of acute, lymphoma, smoldering,and chronic types; and (3) the achievement of remission or response tochemotherapy in ATL patients by comparing plasma profiles of pre-and postremission states. Here, we show the discovery of solubletumor necrosis factor receptor 2 (sTNFR2) as a novel and promisingdiagnostic biomarker for acute ATL.
Methods
Patients and specimens
Samples were obtained from the following: (1) ACs confirmedwith anti-HTLV–1 antibodies through the particle-agglutinationmethod; (2) ATL patients diagnosed based on the criteria proposedby the JCOG5 and confirmed with monoclonally integrated HTLV-1proviral genome using the Southern blot hybridization method, asdescribed previously20; and (3) previously diagnosed ATL patientsachieving complete remission for .4 weeks, where remissionwas judged based on a modified version21 of the World HealthOrganization response criteria.22 Samples were procured from 7institutions in Okinawa Prefecture, Japan (University of the RyukyusHospital, Heart Life Hospital, Nakagami Hospital, Naha CityHospital, Nanbu Medical Center, Chubu Tokushukai Hospital, andKariyushi Hospital) from November 2016 to November 2019.Plasma and PBMCs were separated from blood samples andstored at 280°C until use. Lymph node and subcutaneous skinlesions from ATL patients were also harvested.
Proteomic profiling
Expression levels of 1305 proteins from cryopreserved plasmasamples (1 mL each) were determined. The SOMAscan assayutilizes new-generation protein capture slow off-rate modifiedaptamer (SOMAmer) reagents, which are modified nucleotideswith amino acid– or protein-like side chains that have affinitiesfor proteins and, at the same time, are recognizable by DNAhybridization probes and measurable by fluorescence.23,24 The 1305proteins analyzed were listed using their protein coding gene IDs(eg, TNFa, TNFR1, and TNFR2 are reflected as TNF, TNFRSF1A,and TNFRSF1B, respectively).
Statistical considerations
Significance levels of proteins in ACs vs ATLs and ATLs vsremissions were calculated using Welch’s t test, and discrimi-nation capacities were determined by calculating the area underthe receiver operating characteristic curve (AUC). We illustratedelevations and decreases in AC, ATL, and remission states usingbox-and-whisker and dot plots. All statistical analyses wereperformed using Python 3.6.2 (Python Software Foundation,Beaverton, OR) with the following packages: Statsmodels 0.8.0for t tests and Matplotlib 2.0.2 for box-and-whisker plots.
Pathway enrichment
To generate heatmap visualizations and determine significantlyenriched pathways among various parameters, such as ATL/
24 MARCH 2020 x VOLUME 4, NUMBER 6 sTNFR2: A NOVEL BIOMARKER FOR ATL 1063
Dow
nloaded from https://ashpublications.org/bloodadvances/article-pdf/4/6/1062/1724758/advancesadv2019001429.pdf by U
NIVER
SITY OF R
YUKYU
S user on 12 August 2020

AC/remission states, age, and ATL subtypes, we used gene setenrichment analysis (GSEA version 3.0; Broad Institute; MolecularSignatures Database: hallmarks and curated gene sets) with a falsediscovery rate cutoff of ,25%, run at 1000 permutations. We alsodetermined overrepresented pathways in ATL states using geneontology (GO PANTHER Pathways) by inputting proteins catego-rized as extremely significant. Protein names in the heatmaps arealso reflected as protein coding gene IDs.
Plasma protein concentrations
To determine plasma protein concentration levels of selectedcandidate biomarkers, the following enzyme-linked immunosorbentassay (ELISA) kits were sourced: sTNFa, sTNFR1, and sTNFR2(R&D Systems, Minneapolis, MN) and sTNFRSF8 (RayBiotech,Peachtree Corners, GA).
Flow cytometric analysis
We proceeded with flow cytometry to determinne if elevations inplasma levels of sTNFR2 were correlated with ATL cell surfaceexpression of TNFR2. We performed flow cytometry with the BDFACSCalibur cell analyzer, and data were analyzed with CellQuestPro software (BD Biosciences, San Jose, CA). Briefly, cryopre-served PBMCs were retrieved by rapid thawing of cryotubes ina 37°C water bath, Fc-blocked with 2 ng/mL of human immuno-globulin G and resuspended in fluorescence-activated cell sortingbuffer (phosphate-buffered saline containing 2% fetal calf serumand 0.1% sodium azide), and then washed. Cell surface stainingwas performed on ice for 30 minutes using the following antibodycombinations: fluorescein isothiocyanate–conjugated rabbit anti-SynCAM TLSC1/CADM1 monoclonal antibody (MBL Co., Ltd,Nagoya, Japan), PE-cyanine7 mouse anti-human CD7 (BD Bio-sciences), Alexa Fluor 647 anti-human CD4 antibody (Biolegend,San Diego, CA), and phycoerythrin-conjugated anti-human TNFR2(Miltenyi Biotec, Bergisch Gladbach, Germany). Cells were thenwashed and resuspended in 1% paraformaldehyde in phosphate-buffered saline (Wako Pure Chemical Industries, Ltd, Osaka,Japan). The gating strategy for selecting CD41 T-cell lymphocytesubpopulations is shown in in Figure 3A. Because CADM1expression is a marker for aggressive ATL and stepwise down-regulation of CD7 is closely associated with clonal expansion ofHTLV-1–infected cells in ATL,25 we also plotted CD4 against CD7and TNFR2 against CADM1.
Immunostaining
Immunostaining with polyclonal antibodies against TNFR2 (EnzoLife Sciences, Farmingdale, NY) for tissue specimens includinglymph nodes and subcutaneous skin lesions obtained from ATLpatients was performed with heat-mediated antigen retrieval offormalin-fixed paraffin-embedded sections of the samples.
mRNA expression
Finally, to determine TNFR2 messenger RNA (mRNA) expression inACs and ATL patients, semiquantitative reverse transcriptionpolymerase chain reaction was performed. Total cellular RNA fromPBMCs was extracted using RNeasy Mini Kit (Qiagen, Hilden,Germany) according to the manufacturer’s instructions. Reversetranscription of 500 ng of RNA to complementary DNA was carriedout using SuperScript III First-Strand Synthesis System (Invitrogen,Carlsbad, CA), with oligo(dT)20 primer. Real-time polymerase chainreaction was completed on StepOnePlus (Applied Biosystems,
Foster City, CA) using TaqMan Fast Advanced Master Mix (ThermoFisher Scientific, Waltham, MA). mRNA expression of TNFR2 wascalculated using the 22DDCT method. TaqMan primer-probe setshuman TNFR2 (Hs00153550_m1) and housekeeping geneb-actin (Hs01060665_g1) were used in this assay (Thermo FisherScientific).
Ethical considerations
All samples and information of stored cryopreserved samples wereobtained under prior comprehensive consent for storage and use incorrelative studies after receiving approval from the institutionalreview board of each institution in accordance with the Declarationof Helsinki. The research plan was approved by the institutionalreview board of the University of the Ryukyus and NEC CorporationJapan.
Results
A total of 85 plasma samples (ACs, n 5 40; ATLs, n 5 40;remissions, n 5 5) were selected for protein analysis using theSOMAscan assay. Demographic and clinical information of ATLpatients is provided in supplemental Table 1. We categorizeddifferences in protein levels in ACs vs ATLs as extremely significant,very significant, significant, and nonsignificant (Table 1) and listedthe top 10 elevated or decreased proteins and their functions(Table 2). We also determined significance levels of 11 proteinsoverrepresented in ATLs vs remissions (Table 3) and listed theseproteins with their functions (Table 4). The complete list of all 1305plasma proteins measured is shown in supplemental Table 2,which includes P values and AUC values. We depicted thedifferences in plasma protein expression levels of some of thecandidate biomarkers in AC vs ATL states, as well as in ATL vsremission states, in box-and-whisker plots and dot plots, as shownin Figure 1.
Enriched pathways and heatmap visualization
Heatmap visualization and pathway enrichment analysis for thefollowing phenotype comparisons were generated via GSEA: (1)ATL vs AC, (2) ATL patients age ,70 vs $70 years, (3) acute vsAC, (4) acute vs nonacute (including lymphoma, smoldering, andchronic), (5) acute vs chronic, (6) acute vs lymphoma, (7) acute vssmoldering, (8) chronic vs AC, (9) chronic vs lymphoma, (10)chronic vs smoldering, (11) lymphoma vs AC, (12) lymphoma vssmoldering, (13) smoldering vs AC, (14) preremission ATL vsremission (same patients followed up), (15) preremission ATL vsATL (patients who did not achieve remission), (16) remission vs ATL(patients who did not achieve remission), and (17) AC vs remission
Table 1. Number of plasma proteins with significantly different levels
in HTLV-1 vs ATL
P Interpretation
No. of
proteins
Cumulative
frequency
,.00001 Extremely significant 176 176
.00001# and, .0001 58 234
.0001 # and , .001 99 333
.001 # and , .01 Very significant 149 482
.01 # and , .05 Significant 149 631
$.05 Not significant 674 1305
1064 GUERRERO et al 24 MARCH 2020 x VOLUME 4, NUMBER 6
Dow
nloaded from https://ashpublications.org/bloodadvances/article-pdf/4/6/1062/1724758/advancesadv2019001429.pdf by U
NIVER
SITY OF R
YUKYU
S user on 12 August 2020

(supplemental Figure 1A-Q for heatmap visualizations of eachphenotype comparison; supplemental Tables 3-19 for enrichedpathways). Overrepresented pathways in ATL vs AC, as generatedby gene ontology, included inflammation by cytokine and chemokinesignaling, IL signaling pathway, notch signaling, angiogenesispathway, p53 pathway by glucose deprivation, blood coagulation,and ras pathway, among others (supplemental Figure 2).
Plasma protein levels of sTNFa and TNF
superfamily receptors
Proteins with active roles in the enriched pathways, extremesignificance levels (P, .00001), and high discrimination capacities(AUC .0.90) were deemed candidate biomarkers in this study.Among the candidate biomarkers, we focused on sTNFR1,sTNFR2, and sTNFRSF8, which are receptors belonging toa superfamily of proteins: the TNF superfamily. We also includedTNFa in our analysis, because it is the ligand of TNFR1 and TNFR2.For sTNFR2, a total of 102 plasma samples (AC, n 5 30; ATL, n 568 [acute, n 5 33; lymphoma, n 5 9; chronic, n 5 12; smoldering,n 5 14], and remission, n 5 4) were confirmed using ELISA. Aremarkable increase in sTNFR2 could be seen in ATL patients vsACs (P , .001), especially in patients with acute ATL vs ACs(range, 10-60 ng/mL vs 1-8 ng/mL; P , .001; Figure 2A). Asignificant increase in sTNFR2 could also be seen in lymphoma ATL(P, .01); however, the values were quite varied, with some patientshaving low sTNFR2 levels (range, 1.5-32.7 ng/mL). Significantlyhigher sTNFR2 levels were found in acute ATL patients comparedwith those with other ATL subtypes. Interestingly, sTNFR2 levels ofACs and ATL patients who achieved remission were similar (range,2-9 ng/mL in patients in remission). For sTNFR1, sTNFa, andsTNFRSF8, we tested 38 plasma samples (AC, n5 9; ATL, n5 29[acute, n5 13; lymphoma, n5 6; chronic, n5 6; smoldering, n5 4])using ELISA. Significant increases in sTNFR1 were apparent inATL patients compared with ACs, especially in acute ATL patients(Figure 2B). Regarding sTNFa protein levels, no significant differ-ences were found between ATL patients vs ACs (Figure 2C). ForsTNFRSF8, significant increases in acute ATL patients vs ACs, aswell as in acute vs chronic ATL patients, can be seen (Figure 2D).Although elevated levels of sTNFR1 and sTNFRSF8 in acute ATLpatients were also apparent, the cutoff point is not as distinct as thatof sTNFR2. sTNFR2 concentration values for all samples can befound in supplemental Table 20.
Cell surface expression of TNFR2 on PBMCs of acute
ATL cells
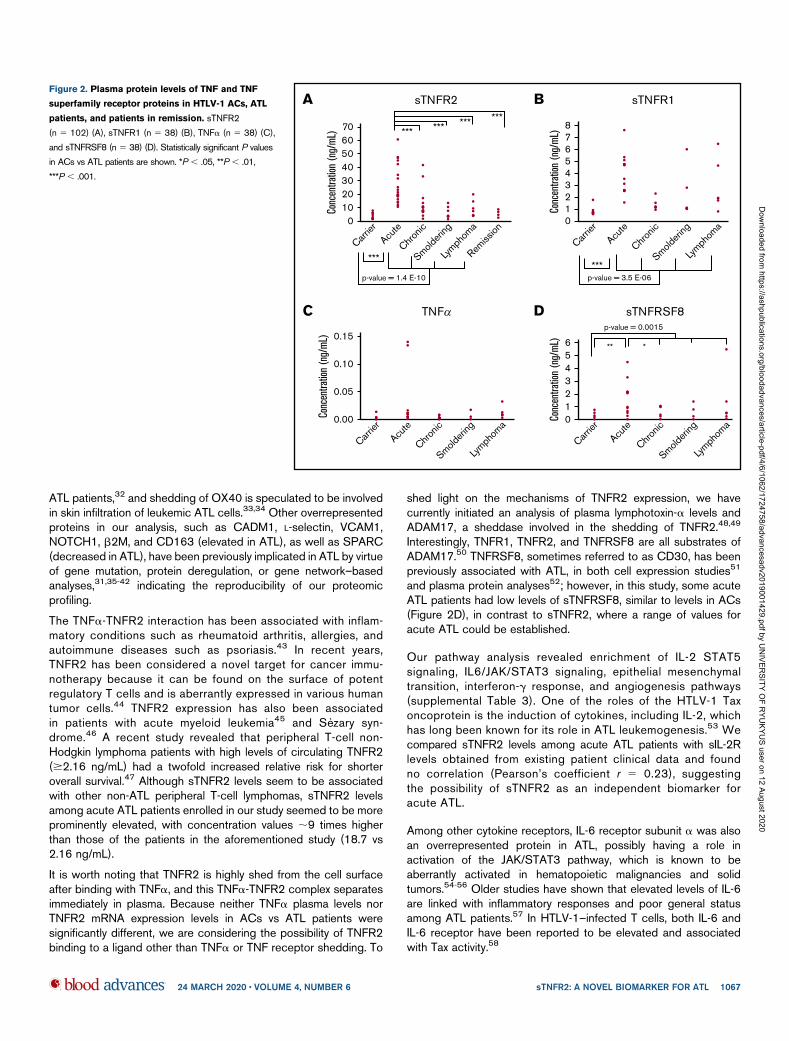
Of the proteins tested using ELISA, we focused on TNFR2 becauseof its remarkable and consistent increase in acute ATL patients.Flow cytometric analysis of PBMCs from 12 samples (AC, n 5 6;acute ATL, n 5 6) showed significantly higher TNFR21CADM11
populations in acute ATL patients (mean, 54.9%; range, 33.3%-80.3%) compared with ACs (mean, 26.5%; range, 24.7%-28.9%;Figure 3B-D). Plasma sTNFR2 levels and TNFR2 cell surfaceexpression levels were positively correlated, with a correlationcoefficient of 0.63 (Figure 3E).
mRNA expression of TNFR2 on HTLV-1 carriers and
ATL patients
TNFR2 mRNA expression analysis of RNA extracted from 12PBMCs (AC, n 5 3; acute ATL, n 5 9) showed no significantincrease in ACs vs ATL patients (supplemental Figure 3).
Discussion
In this study, we have demonstrated a novel approach in searchingfor ATL biomarkers through the use of a SOMAmer-based high-throughput proteomic assay, followed by an extensive proteomicpathway analysis and confirmed using standard laboratory techni-ques such as ELISA, flow cytometry, and immunostaining. Thisapproach led us to the discovery of candidate biomarkers belongingto the TNF receptor superfamily, namely sTNFR1, sTNFR2, andsTNFRSF8. Among them, sTNFR2 was deemed to be the mostprominent in comparing AC vs ATL. Plasma protein analysis ofsTNFR2 showed: (1) remarkable and distinct elevations in acuteATL (10-60 ng/mL), approximately at least 10 times higher thanlevels in ACs (1-9 ng/mL) and reference values of healthy controls26
(1-5 ng/mL), and (2) a return of sTNFR2 to levels similar to carrier
Table 2. Top 10 proteins with significantly different levels in HTLV-1 vs ATL
Protein name
Elevation (up) or
decrease (down) Protein function
Protein coding
gene ID UniProt P AUC
1 Coagulation factor Xa Up in ATL Blood coagulation F10 P00742 1.82E-16 0.99
2 Coagulation factor X Up in ATL Blood coagulation F10 P00742 4.13E-16 0.99
3 Cadherin-6 Down in ATL Cell adhesion CDH6 P55285 9.32E-14 0.93
4 Insulin-like growth factor binding protein 4 Up in ATL IGF regulation IGFBP4 P22692 2.90E-12 0.91
5 Lysozyme C Up in ATL Hydrolysis LYZ P61626 5.65E-12 0.89
6 BDNF/NT-3 growth factor receptor Down in ATL Neuronal development and regulation NTRK2 Q16620 1.70E-11 0.88
7 Granulins Up in ATL Cell growth regulation GRN P28799 2.73E-11 0.91
8 RAS GTPase-activating protein 1 Down in ATL Cell proliferation and differentiation RASA1 P20936 2.77E-11 0.95
9 Interleukin-18-binding protein Up in ATL Cell immunity induction IL18BP O95998 5.03E-11 0.93
10 TNFR2 Up in ATL Apoptosis modulation and signaling TNFRSF1B P20333 6.82E-11 0.92
Table 3. Number of significantly different proteins in remission state
HTLV-1 and ATL P < .00001
(176 proteins)
Remission and ATL
<.00001 <.0001 <.001 <.01 <.05 ‡.05
Remission and HTLV-1 $.05 11 5 15 24 20 32
We identified a total of 75 proteins with significantly different expression levels inpostremission vs ATL, which were also not significantly different in remission vs HTLV-1, todetermine which proteins returned to the HTLV-1 carrier state after achieving remission.
24 MARCH 2020 x VOLUME 4, NUMBER 6 sTNFR2: A NOVEL BIOMARKER FOR ATL 1065
Dow
nloaded from https://ashpublications.org/bloodadvances/article-pdf/4/6/1062/1724758/advancesadv2019001429.pdf by U
NIVER
SITY OF R
YUKYU
S user on 12 August 2020

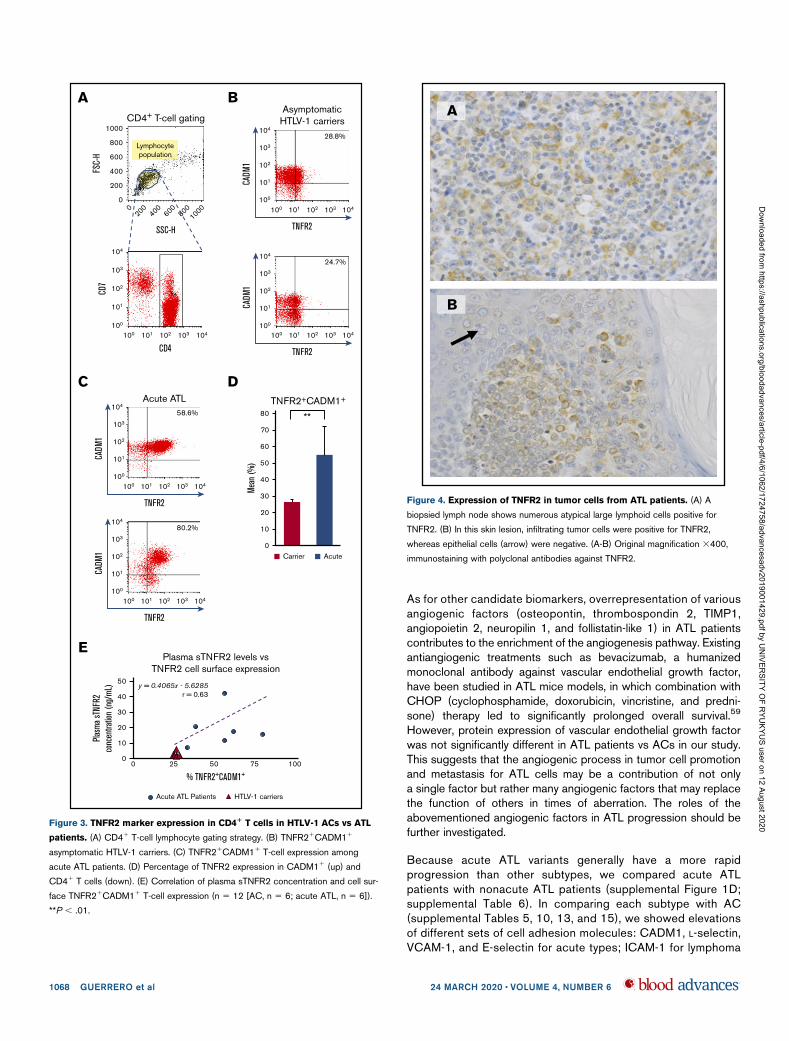
state levels after achieving remission (2-8 ng/mL). Flow cytometricanalysis showed higher cell surface expression of TNFR2 in ATLpatients vs ACs (Figure 3B-D), and sTNFR2 concentration levelscorrelated with cell surface TNFR2 expression (Figure 3E). TNFR2was immunohistochemically positive in atypical lymphoid cells(Figure 4A), as well as in skin infiltrates (Figure 4B), both fromtumor cells of patients diagnosed with lymphoma ATL. However,the circulating levels of sTNFR2 among lymphoma ATL patientsseemed to vary, and the range of concentration values was not asdistinct compared with the range in acute ATL patients. Theseresults indicate the potential of sTNFR2 as a clinically usefuldiagnostic biomarker for acute ATL.
TNFR1, TNFR2, and TNFRSF8, which are all receptors of the TNFsuperfamily, consist of proteins that are activated by various TNF-like
cytokine ligands, including TNFa itself and lymphotoxin-a.27 Incontrast to TNFR1, TNFR2 lacks the death domain and recruitsTNFR-associated factor 2, which promotes cell activation, pro-liferation, and survival,28,29 likely via NF-kB activation. Previously,a comprehensive molecular analysis of ATL by Kataoka et al30,31
described NF-kB activation and multiple gene mutations in the ATLstate to have a substantial impact on ATL progression. Of note,some of the overrepresented proteins found in the present studycorresponded with some of the mutated protein coding genes in theaforementioned molecular analysis, including FYN and VAV1. In ouranalysis, FYN and VAV1 both have decreased expression levelsin ATL patients vs ACs (supplemental Figure 1A). Another NF-kB–activating TNF superfamily receptor significantly overrepresentedin this study was TNFRSF4 (OX40; supplemental Table 2). Interestingly,high levels of soluble OX40 has recently been associated with acute
Table 4. Expression levels of 11 proteins that returned to HTLV-1 state after achieving remission in ATL patients with P > .00001
Protein name
Elevation (up) or
decrease (down) Protein function Protein coding gene UniProt P
1 Soluble L-selectin Down in remission Leukocyte-endothelial cell adhesion SELL P14151 9.98E-8
2 Cell adhesion molecule 1 Down in remission Cell adhesion CADM1 Q9BY67 1.26E-7
3 TNFRSF8 Down in remission Regulation of cell growth, activated lymphoblasttransformation
TNFRSF8 P28908 1.62E-7
4 LDL receptor related protein 8 Down in remission Cholesterol transport receptor LRP8 Q14114 6.03E-7
5 Lymphocyte activation gene Down in remission Lymphocyte activation LAG3 P18627 6.23E-7
6 Tissue inhibitor of metallopeptidase-1 Down in remission Promotion of erythroid progenitor stem cell proliferation TIMP1 P01033 9.17E-7
7 Angiopoietin-2 Down in remission Vascular remodeling, proliferation ANGPT2 O15123 8.05E-06
8 T-lymphocyte surface antigen Ly-9/CD229 Down in remission Innate immune response LY9 Q9HBG7 1.07E-6
9 Deoxycytidine-triphosphatase 1 Down in remission DNA replication DCTPP1 Q9H773 1.14E-6
10 T-cell cytokine receptor (WSX-1) TCCR Down in remission Induction of Th-1 type immune response IL27RA Q6UWB1 2.99E-6
11 Ephrin A4 Down in remission Metastasis EFNA4 P52798 4.51E-6
HTLV-1
20000
40000
60000
80000
100000
120000
TNFR2all
+
+
++p=0.0000***
order: 10/1305
ATL
remission
ATL
remiss
ion
ATNFR1
HTLV-1
1000
3000
2000
4000
5000
6000
7000
all
+++
+
+p=0.0000***
order: 48/1305
ATL
remission
ATL
remiss
ion
BTNFRSF8 (CD30)
HTLV-1
0
20000
40000
60000
80000
all
+
+p=0.0000***
order: 56/1305
ATL
remission
ATL
remiss
ion
C
Figure 1. Box-and-whisker plots for sTNFR1, sTNFR2, and sTNFRSF8 in HTLV-1 ACs vs ATL patients and ATL patients vs those in remission. Numbers on the
left side are in relative fluorescence units. sTNFR1 (A), sTNFR2 (B), and sTNFRSF8 (C).
1066 GUERRERO et al 24 MARCH 2020 x VOLUME 4, NUMBER 6
Dow
nloaded from https://ashpublications.org/bloodadvances/article-pdf/4/6/1062/1724758/advancesadv2019001429.pdf by U
NIVER
SITY OF R
YUKYU
S user on 12 August 2020
ATL patients,32 and shedding of OX40 is speculated to be involvedin skin infiltration of leukemic ATL cells.33,34 Other overrepresentedproteins in our analysis, such as CADM1, L-selectin, VCAM1,NOTCH1, b2M, and CD163 (elevated in ATL), as well as SPARC(decreased in ATL), have been previously implicated in ATL by virtueof gene mutation, protein deregulation, or gene network–basedanalyses,31,35-42 indicating the reproducibility of our proteomicprofiling.
The TNFa-TNFR2 interaction has been associated with inflam-matory conditions such as rheumatoid arthritis, allergies, andautoimmune diseases such as psoriasis.43 In recent years,TNFR2 has been considered a novel target for cancer immu-notherapy because it can be found on the surface of potentregulatory T cells and is aberrantly expressed in various humantumor cells.44 TNFR2 expression has also been associatedin patients with acute myeloid leukemia45 and Sezary syn-drome.46 A recent study revealed that peripheral T-cell non-Hodgkin lymphoma patients with high levels of circulating TNFR2($2.16 ng/mL) had a twofold increased relative risk for shorteroverall survival.47 Although sTNFR2 levels seem to be associatedwith other non-ATL peripheral T-cell lymphomas, sTNFR2 levelsamong acute ATL patients enrolled in our study seemed to be moreprominently elevated, with concentration values ;9 times higherthan those of the patients in the aforementioned study (18.7 vs2.16 ng/mL).
It is worth noting that TNFR2 is highly shed from the cell surfaceafter binding with TNFa, and this TNFa-TNFR2 complex separatesimmediately in plasma. Because neither TNFa plasma levels norTNFR2 mRNA expression levels in ACs vs ATL patients weresignificantly different, we are considering the possibility of TNFR2binding to a ligand other than TNFa or TNF receptor shedding. To
shed light on the mechanisms of TNFR2 expression, we havecurrently initiated an analysis of plasma lymphotoxin-a levels andADAM17, a sheddase involved in the shedding of TNFR2.48,49
Interestingly, TNFR1, TNFR2, and TNFRSF8 are all substrates ofADAM17.50 TNFRSF8, sometimes referred to as CD30, has beenpreviously associated with ATL, in both cell expression studies51
and plasma protein analyses52; however, in this study, some acuteATL patients had low levels of sTNFRSF8, similar to levels in ACs(Figure 2D), in contrast to sTNFR2, where a range of values foracute ATL could be established.
Our pathway analysis revealed enrichment of IL-2 STAT5signaling, IL6/JAK/STAT3 signaling, epithelial mesenchymaltransition, interferon-g response, and angiogenesis pathways(supplemental Table 3). One of the roles of the HTLV-1 Taxoncoprotein is the induction of cytokines, including IL-2, whichhas long been known for its role in ATL leukemogenesis.53 Wecompared sTNFR2 levels among acute ATL patients with sIL-2Rlevels obtained from existing patient clinical data and foundno correlation (Pearson’s coefficient r 5 0.23), suggestingthe possibility of sTNFR2 as an independent biomarker foracute ATL.
Among other cytokine receptors, IL-6 receptor subunit a was alsoan overrepresented protein in ATL, possibly having a role inactivation of the JAK/STAT3 pathway, which is known to beaberrantly activated in hematopoietic malignancies and solidtumors.54-56 Older studies have shown that elevated levels of IL-6are linked with inflammatory responses and poor general statusamong ATL patients.57 In HTLV-1–infected T cells, both IL-6 andIL-6 receptor have been reported to be elevated and associatedwith Tax activity.58
Carrier
0
21
345678
Conc
entra
tion
(ng/
mL)
***
Acute
p-value = 3.5 E-06
Chronic
Smolderi
ng
Lymph
oma
B sTNFR1
Carrier
010203040506070
Conc
entra
tion
(ng/
mL) ***
***
*** *** ***
Acute
p-value = 1.4 E-10
Chronic
Smolderi
ng
Lymph
oma
Remiss
ion
A sTNFR2
p-value = 0.0015
** *
Carrier
01
32
456
Conc
entra
tion
(ng/
mL)
Acute
Chronic
Smolderi
ng
Lymph
oma
D sTNFRSF8
Carrier
0.00
0.05
0.10
0.15Co
ncen
tratio
n (n
g/m
L)
Acute
Chronic
Smolderi
ng
Lymph
oma
C TNF
Figure 2. Plasma protein levels of TNF and TNF
superfamily receptor proteins in HTLV-1 ACs, ATL
patients, and patients in remission. sTNFR2
(n 5 102) (A), sTNFR1 (n 5 38) (B), TNFa (n 5 38) (C),
and sTNFRSF8 (n 5 38) (D). Statistically significant P values
in ACs vs ATL patients are shown. *P , .05, **P , .01,
***P , .001.
24 MARCH 2020 x VOLUME 4, NUMBER 6 sTNFR2: A NOVEL BIOMARKER FOR ATL 1067
Dow
nloaded from https://ashpublications.org/bloodadvances/article-pdf/4/6/1062/1724758/advancesadv2019001429.pdf by U
NIVER
SITY OF R
YUKYU
S user on 12 August 2020
As for other candidate biomarkers, overrepresentation of variousangiogenic factors (osteopontin, thrombospondin 2, TIMP1,angiopoietin 2, neuropilin 1, and follistatin-like 1) in ATL patientscontributes to the enrichment of the angiogenesis pathway. Existingantiangiogenic treatments such as bevacizumab, a humanizedmonoclonal antibody against vascular endothelial growth factor,have been studied in ATL mice models, in which combination withCHOP (cyclophosphamide, doxorubicin, vincristine, and predni-sone) therapy led to significantly prolonged overall survival.59
However, protein expression of vascular endothelial growth factorwas not significantly different in ATL patients vs ACs in our study.This suggests that the angiogenic process in tumor cell promotionand metastasis for ATL cells may be a contribution of not onlya single factor but rather many angiogenic factors that may replacethe function of others in times of aberration. The roles of theabovementioned angiogenic factors in ATL progression should befurther investigated.
Because acute ATL variants generally have a more rapidprogression than other subtypes, we compared acute ATLpatients with nonacute ATL patients (supplemental Figure 1D;supplemental Table 6). In comparing each subtype with AC(supplemental Tables 5, 10, 13, and 15), we showed elevationsof different sets of cell adhesion molecules: CADM1, L-selectin,VCAM-1, and E-selectin for acute types; ICAM-1 for lymphoma
CD4+ T-cell gating1000
FSC-
H
SSC-H
0
800
600
400
200
200400
600800
10000
Lymphocytepopulation
A BAsymptomatic
HTLV-1 carriers28.8%
TNFR2
CADM
1
104
100
103
102
101
101 102 103 104
100
CD4
CD7
104
100
103
102
101
101 102 103 104
100
24.7%
TNFR2
CADM
1104
100
103
102
101
101 102 103 104100
C DAcute ATL
58.6%
TNFR2
CADM
1
104
100
103
102
101
101 102 103 104
100
0Carrier Acute
10
20
30
40
50
Mean
(%)
60
70
80
TNFR2+CADM1+
**
80.2%
TNFR2
CADM
1
104
100
103
102
101
101 102 103 104
100
E
50
Plasma sTNFR2 levels vsTNFR2 cell surface expression
y = 0.4065x - 5.6285r = 0.6340
30
20
10
00 25 50 75 100
Plas
ma
sTNF
R2co
ncen
tratio
n (n
g/m
L)
% TNFR2+CADM1+
Acute ATL Patients HTLV-1 carriers
Figure 3. TNFR2 marker expression in CD41T cells in HTLV-1 ACs vs ATL
patients. (A) CD41 T-cell lymphocyte gating strategy. (B) TNFR21CADM11
asymptomatic HTLV-1 carriers. (C) TNFR21CADM11 T-cell expression among
acute ATL patients. (D) Percentage of TNFR2 expression in CADM11 (up) and
CD41 T cells (down). (E) Correlation of plasma sTNFR2 concentration and cell sur-
face TNFR21CADM11 T-cell expression (n 5 12 [AC, n 5 6; acute ATL, n 5 6]).
**P , .01.
A
B
Figure 4. Expression of TNFR2 in tumor cells from ATL patients. (A) A
biopsied lymph node shows numerous atypical large lymphoid cells positive for
TNFR2. (B) In this skin lesion, infiltrating tumor cells were positive for TNFR2,
whereas epithelial cells (arrow) were negative. (A-B) Original magnification 3400,
immunostaining with polyclonal antibodies against TNFR2.
1068 GUERRERO et al 24 MARCH 2020 x VOLUME 4, NUMBER 6
Dow
nloaded from https://ashpublications.org/bloodadvances/article-pdf/4/6/1062/1724758/advancesadv2019001429.pdf by U
NIVER
SITY OF R
YUKYU
S user on 12 August 2020

types; L-selectin and CADM1 for chronic types; and CADM1 andALCAM for smoldering types. Additional analyses of the proteomicprofiles of all ATL subtypes are needed to provide more accuratesubclassifications and elucidate the nature of ATL progressionspecific to each ATL subtype.
As for remission states, the decrease in sTNFR2 levels suggeststhat sTNFR2 may prove useful in monitoring chemotherapysensitivity or progress in achieving remission. However, analyzingsTNFR2 levels in various treatment strategies using a larger sampleis necessary to confirm whether sTNFR2 can be used asa chemotherapy-sensitivity marker.
The role of TNFR2 in ATL pathogenesis is yet to be explored andmay prove to be pivotal in ATL research. With the developments inproteomic research and technology, it will be vital to analyzeproteins for the improvement of diagnosis and treatment of disease,in the hope of improving patient survival outcomes.
Acknowledgments
The authors thank all the patients who participated in this study, aswell as the staff of Kariyushi Hospital, Ishigaki, Okinawa, for theircontributions.
This work is partially supported by funds from the AdvancedMedical Research Center, Faculty of Medicine, University of theRyukyus.
Authorship
Contribution: T.F. designed the study; C.L.H.G. and T.F. wrote themanuscript; C.L.H.G. and Y.Y. had access to the raw data and an-alyzed the data; C.L.H.G., Y.Y., M.K., N.I., and T.F. conceptualized thevisual abstract; C.L.H.G., M.M., N.I., and S.S. prepared samples andmanaged the data; C.L.H.G., M.K., and N.I. performed ELISA; M.K.and Y.T. performed flow cytometry; K. Karube performed immunos-taining; K. Karube and Y.T. contributed reagents, materials, andanalysis tools; N.I. performedmRNAanalysis;M.H., T.M., K. Karimata,J.U., K.O., J.T., S.N., S.M., H.M., and T.F. managed the patients andcollected samples; T.F. had full access to all the data in this study andhad final responsibility for the decision to submit for publication;and all authors reviewed the manuscript.
Conflict-of-interest disclosure: T.F. and Y.Y. have patent rightsrelated to findings from this study. NECCorporation has a patent forthe proteomic data (patent 2019-021539), and the University ofthe Ryukyus has a patent for data regarding sTNFR2 as an ATLbiomarker (patent 2019-200986). The remaining authors declareno competing financial interests.
ORCID profiles: C.L.H.G., 0000-0002-0283-0775; K. Karube,0000-0002-1205-858X; T.F., 0000-0001-9422-2875.
Correspondence: Takuya Fukushima, Laboratory of Hema-toimmunology, Graduate School of Health Sciences, University ofthe Ryukyus, 207 Uehara, Nishihara, Okinawa, 903-0215 Japan;e-mail: [email protected].
References
1. Uchiyama T, Yodoi J, Sagawa K, Takatsuki K, Uchino H. Adult T-cell leukemia: clinical and hematologic features of 16 cases. Blood.1977;50(3):481-492.
2. Poiesz BJ, Ruscetti FW, Gazdar AF, Bunn PA, Minna JD, Gallo RC. Detection and isolation of type C retrovirus particles from fresh and culturedlymphocytes of a patient with cutaneous T-cell lymphoma. Proc Natl Acad Sci USA. 1980;77(12):7415-7419.
3. Hinuma Y, Nagata K, Hanaoka M, et al. Adult T-cell leukemia: antigen in an ATL cell line and detection of antibodies to the antigen in human sera. ProcNatl Acad Sci U S A. 1981;78(10):6476-6480.
4. Yoshida M, Miyoshi I, Hinuma Y. Isolation and characterization of retrovirus from cell lines of human adult T-cell leukemia and its implication in the disease.Proc Natl Acad Sci U S A. 1982;79(6):2031-2035.
5. Shimoyama M. Diagnostic criteria and classification of clinical subtypes of adult T-cell leukaemia-lymphoma. A report from the Lymphoma Study Group(1984-87). Br J Haematol. 1991;79(3):428-437.
6. Tsukasaki K, Imaizumi Y, Tokura Y, et al. Meeting report on the possible proposal of an extranodal primary cutaneous variant in the lymphoma type of adultT-cell leukemia-lymphoma. J Dermatol. 2014;41(1):26-28.
7. Cook LB, Fuji S, Hermine O, et al. Revised adult T-cell leukemia-lymphoma international consensus meeting report. J Clin Oncol. 2019;37(8):677-687.
8. Tsukasaki K, Utsunomiya A, Fukuda H, et al; Japan Clinical Oncology Group Study JCOG9801. VCAP-AMP-VECP compared with biweekly CHOP foradult T-cell leukemia-lymphoma: Japan Clinical Oncology Group Study JCOG9801. J Clin Oncol. 2007;25(34):5458-5464.
9. Bazarbachi A, Plumelle Y, Carlos Ramos J, et al. Meta-analysis on the use of zidovudine and interferon-alfa in adult T-cell leukemia/lymphoma showingimproved survival in the leukemic subtypes. J Clin Oncol. 2010;28(27):4177-4183.
10. Takasaki Y, Iwanaga M, Imaizumi Y, et al. Long-term study of indolent adult T-cell leukemia-lymphoma. Blood. 2010;115(22):4337-4343.
11. Gessain A, Cassar O. Epidemiological aspects and world distribution of HTLV-1 infection. Front Microbiol. 2012;3:388.
12. Iwanaga M, Watanabe T, Yamaguchi K. Adult T-cell leukemia: a review of epidemiological evidence. Front Microbiol. 2012;3:322.
13. Yoshida M, Seiki M, Yamaguchi K, Takatsuki K. Monoclonal integration of human T-cell leukemia provirus in all primary tumors of adult T-cell leukemiasuggests causative role of human T-cell leukemia virus in the disease. Proc Natl Acad Sci U S A. 1984;81(8):2534-2537.
14. Proietti FA, Carneiro-Proietti ABF, Catalan-Soares BC, Murphy EL. Global epidemiology of HTLV-I infection and associated diseases.Oncogene. 2005;24(39):6058-6068.
15. Gonçalves DU, Proietti FA, Ribas JGR, et al. Epidemiology, treatment, and prevention of human T-cell leukemia virus type 1-associated diseases. ClinMicrobiol Rev. 2010;23(3):577-589.
24 MARCH 2020 x VOLUME 4, NUMBER 6 sTNFR2: A NOVEL BIOMARKER FOR ATL 1069
Dow
nloaded from https://ashpublications.org/bloodadvances/article-pdf/4/6/1062/1724758/advancesadv2019001429.pdf by U
NIVER
SITY OF R
YUKYU
S user on 12 August 2020

16. Iwanaga M, Watanabe T, Utsunomiya A, et al; Joint Study on Predisposing Factors of ATL Development investigators. Human T-cell leukemia virus type I(HTLV-1) proviral load and disease progression in asymptomatic HTLV-1 carriers: a nationwide prospective study in Japan. Blood. 2010;116(8):1211-1219.
17. Nosaka K, Iwanaga M, Imaizumi Y, et al. Epidemiological and clinical features of adult T-cell leukemia-lymphoma in Japan, 2010-2011: a nationwidesurvey. Cancer Sci. 2017;108(12):2478-2486.
18. Zell M, Assal A, Derman O, et al. Adult T-cell leukemia/lymphoma in the Caribbean cohort is a distinct clinical entity with dismal response to conventionalchemotherapy. Oncotarget. 2016;7(32):51981-51990.
19. Jeannin P, Chaze T, Giai Gianetto Q, et al. Proteomic analysis of plasma extracellular vesicles reveals mitochondrial stress upon HTLV-1 infection. SciRep. 2018;8(1):5170.
20. Kamihira S, Sugahara K, Tsuruda K, et al. Proviral status of HTLV-1 integrated into the host genomic DNA of adult T-cell leukemia cells. Clin LabHaematol. 2005;27(4):235-241.
21. Yamada Y, Tomonaga M, Fukuda H, et al. A new G-CSF-supported combination chemotherapy, LSG15, for adult T-cell leukaemia-lymphoma: JapanClinical Oncology Group study 9303. Br J Haematol. 2001;113(2):375-382.
22. World Health Organization. WHO Handbook for Reporting Results of Cancer Treatment. Geneva, Switzerland: World Health Organization; 1979.
23. Gold L, Ayers D, Bertino J, et al. Aptamer-based multiplexed proteomic technology for biomarker discovery. PLoS One. 2010;5(12):e15004.
24. SomaLogic. SOMAscan Proteomic Assay: Technical White Paper. Boulder, CO: SomaLogic; 2015.
25. Kobayashi S, Nakano K, Watanabe E, et al. CADM1 expression and stepwise downregulation of CD7 are closely associated with clonal expansion ofHTLV-I-infected cells in adult T-cell leukemia/lymphoma. Clin Cancer Res. 2014;20(11):2851-2861.
26. Kudo N, Yamamori H, Ishima T, et al. Plasma levels of soluble tumor necrosis factor receptor 2 (STNFR2) are associated with hippocampal volume andcognitive performance in patients with schizophrenia. Int J Neuropsychopharmacol. 2018;21(7):631-639.
27. MacEwan DJ. TNF ligands and receptors—a matter of life and death. Br J Pharmacol. 2002;135(4):855-875.
28. Tartaglia LA, Ayres TM, Wong GHW, Goeddel DV. A novel domain within the 55 kd TNF receptor signals cell death. Cell. 1993;74(5):845-853.
29. Faustman D, Davis M. TNF receptor 2 pathway: drug target for autoimmune diseases. Nat Rev Drug Discov. 2010;9(6):482-493.
30. Kataoka K, Nagata Y, Kitanaka A, et al. Integrated molecular analysis of adult T cell leukemia/lymphoma. Nat Genet. 2015;47(11):1304-1315.
31. Kataoka K, Iwanaga M, Yasunaga JI, et al. Prognostic relevance of integrated genetic profiling in adult T-cell leukemia/lymphoma. Blood. 2018;131(2):215-225.
32. Tanaka Y, Takahashi Y, Tanaka R, Miyagi T, Saito M, Fukushima T. Association of high levels of plasma OX40 with acute adult T-cell leukemia. IntJ Hematol. 2019;109(3):319-327.
33. Imura A, Hori T, Imada K, et al. The human OX40/gp34 system directly mediates adhesion of activated T cells to vascular endothelial cells. J Exp Med.1996;183(5):2185-2195.
34. Kasahara D, Takara A, Takahashi Y, et al. Natural OX40L expressed on human T cell leukemia virus type-I-immortalized T cell lines interferes with infectionof activated peripheral blood mononuclear cells by CCR5-utilizing human immunodeficiency virus. Virol J. 2013;10:338.
35. Sasaki H, Nishikata I, Shiraga T, et al. Overexpression of a cell adhesion molecule, TSLC1, as a possible molecular marker for acute-type adult T-cellleukemia. Blood. 2005;105(3):1204-1213.
36. Tatewaki M, Yamaguchi K, Matsuoka M, et al. Constitutive overexpression of the L-selectin gene in fresh leukemic cells of adult T-cell leukemia that can betransactivated by human T-cell lymphotropic virus type 1 Tax. Blood. 1995;86(8):3109-3117.
37. Ishikawa T, Imura A, Tanaka K, Shirane H, Okuma M, Uchiyama T. E-selectin and vascular cell adhesion molecule-1 mediate adult T-cell leukemia celladhesion to endothelial cells. Blood. 1993;82(5):1590-1598.
38. Weng AP, Ferrando AA, Lee W, et al. Activating mutations of NOTCH1 in human T cell acute lymphoblastic leukemia. Science. 2004;306(5694):269-271.
39. Yu P, Petrus MN, JuW, et al. Augmented efficacy with the combination of blockade of the Notch-1 pathway, bortezomib and romidepsin in a murine MT-1adult T-cell leukemia model. Leukemia. 2015;29(3):556-566.
40. Asano N, Miyoshi H, Kato T, et al Expression pattern of immunosurveillance-related antigen is a critical prognostic factor of adult T-cell leukemia/lymphoma [abstract]. Blood. 2016;128(22). Abstract 4135.
41. Niino D, Komohara Y, Kimura Y, et al M2 macrophage infiltration is closely associated with poor prognosis for adult T-cell leukemia/lymphoma (ATLL).Blood. 2011;118(21). Abstract 3672.
42. Ohyashiki JH, Hamamura R, Kobayashi C, Zhang Y, Ohyashiki K. A network biology approach evaluating the anticancer effects of bortezomib identifiesSPARC as a therapeutic target in adult T-cell leukemia cells. Adv Appl Bioinform Chem. 2008;1:85-98.
43. Croft M, Benedict CA, Ware CF. Clinical targeting of the TNF and TNFR superfamilies. Nat Rev Drug Discov.2013;12(2):147-168.
44. Vanamee E, Faustman DL. TNFR2: a novel target for cancer immunotherapy. Trends Mol Med. 2017;23(11):1037-1046.
45. Wang M, Zhang C, Tian T, et al. Increased regulatory T cells in peripheral blood of acute myeloid leukemia patients rely on tumor necrosis factor(TNF)-a-TNF receptor-2 pathway. Front Immunol. 2018;9:1274.
46. Torrey H, Khodadoust M, Tran L, et al. Targeted killing of TNFR2-expressing tumor cells and Tregs by TNFR2 antagonistic antibodies in advanced Sezarysyndrome. Leukemia. 2019;33(5):1206-1218.
1070 GUERRERO et al 24 MARCH 2020 x VOLUME 4, NUMBER 6
Dow
nloaded from https://ashpublications.org/bloodadvances/article-pdf/4/6/1062/1724758/advancesadv2019001429.pdf by U
NIVER
SITY OF R
YUKYU
S user on 12 August 2020

47. Heemann C, Kreuz M, Stoller I, et al. Circulating levels of TNF receptor II are prognostic for patients with peripheral T-cell non-Hodgkin lymphoma. ClinCancer Res. 2012;18(13):3637-3647.
48. Faustman DL, Davis M. TNF receptor 2 and disease: autoimmunity and regenerative medicine. Front Immunol. 2013;4:478.
49. Ward-Kavanagh LK, Lin WW, Sedy JR, Ware CF. The TNF receptor superfamily in co-stimulating and co-inhibitory responses. Immunity. 2016;44(5):1005-1019.
50. Zunke F, Rose-John S. The shedding protease ADAM17: physiology and pathophysiology. Biochim Biophys Acta Mol Cell Res. 2017;1864(11):2059-2070.
51. Takeshita M, Akamatsu M, Ohshima K, et al. CD30 (Ki-1) expression in adult T-cell leukaemia/lymphoma is associated with distinctive immunohistologicaland clinical characteristics. Histopathology. 1995;26(6):539-546.
52. Nishioka C, Takemoto S, Kataoka S, et al. Serum level of soluble CD30 correlates with the aggressiveness of adult T-cell leukemia/lymphoma. CancerSci. 2005;96(11):810-815.
53. Maeda M, Arima N, Daitoku Y, et al. Evidence for the interleukin-2 dependent expansion of leukemic cells in adult T cell leukemia. Blood. 1987;70(5):1407-1411.
54. Halfter H, Friedrich M, Postert C, Ringelstein EB, Stogbauer F. Activation of Jak-Stat and MAPK2 pathways by oncostatin M leads to growth inhibition ofhuman glioma cells. Mol Cell Biol Res Commun. 1999;1(2):109-116.
55. Richards CD. The enigmatic cytokine oncostatin m and roles in disease. ISRN Inflamm. 2013;2013:512103.
56. Hermanns HM. Oncostatin M and interleukin-31: cytokines, receptors, signal transduction and physiology. Cytokine Growth Factor Rev. 2015;26(5):545-558.
57. Yamamura M, Yamada Y, Momita S, Kamihira S, Tomonaga M. Circulating interleukin-6 levels are elevated in adult T-cell leukaemia/lymphoma patientsand correlate with adverse clinical features and survival. Br J Haematol. 1998;100(1):129-134.
58. Horiuchi S, Yamamoto N, Dewan MZ, et al. Human T-cell leukemia virus type-I Tax induces expression of interleukin-6 receptor (IL-6R): shedding ofsoluble IL-6R and activation of STAT3 signaling. Int J Cancer. 2006;119(4):823-830.
59. Mori F, Ishida T, Ito A, et al. Antitumor effects of bevacizumab in a microenvironment-dependent human adult T-cell leukemia/lymphomamouse model. EurJ Haematol. 2014;92(3):219-228.
24 MARCH 2020 x VOLUME 4, NUMBER 6 sTNFR2: A NOVEL BIOMARKER FOR ATL 1071
Dow
nloaded from https://ashpublications.org/bloodadvances/article-pdf/4/6/1062/1724758/advancesadv2019001429.pdf by U
NIVER
SITY OF R
YUKYU
S user on 12 August 2020
Related Documents