Propylene from Methanol

Welcome message from author
This document is posted to help you gain knowledge. Please leave a comment to let me know what you think about it! Share it to your friends and learn new things together.
Transcript

8/20/2019 Propylene production from methanol
http://slidepdf.com/reader/full/propylene-production-from-methanol 1/82
Propylene from
Methanol

8/20/2019 Propylene production from methanol
http://slidepdf.com/reader/full/propylene-production-from-methanol 2/82
Copyrights © 2013 by Intratec Solutions LLC. All rights reserved. Printed in the United States of America.
#TEC002B
Technology Economics
Propylene Production from Methanol
2013
Abstract
Propylene has established itself as the second major member of the global olefins business, only after ethylene. Globally, the
largest volume of propylene is generated as by-product in steam crackers and through the fluid catalytic cracking (FCC) process.
With ethane prices falling in the USA, due to the exploration of shale gas reserves, the low price ethylene produced from this raw
material has given chemical producers in North America a feedstock advantage. Such change has put naphtha-fed steam crackers
at a disadvantageous position, with many of them shutting down or revamping to use ethane as feedstock. Nevertheless, the
propylene output rates from ethane-fed crackers are negligible. The result is a tight propylene market.
For this reason, new and novel lower-cost chemical processes for on-purpose propylene production technologies are of high
interest to the petrochemical marketplace. Such processes include: Metathesis, Propane Dehydrogenation (PDH), Methanol-to-
Olefins/Methanol-to-Propylene (MTO/MTP), High Severity FCC, and Olefins Cracking. Among those, MTO/MTP and PDH stand outdue to the use of low-cost raw materials. The main raw material used in the MTP process is methanol that is produced from
synthesis gas which, in turn, can be obtained in large-scale from natural gas or coal. Natural gas extracted from shale gas has
become the fastest-growing source of gas in the USA, while China possesses large reserves of coal, making both countries
competitive when comparing to others with high-cost feedstock.
In this report, the production of propylene from methanol (MTP) is reviewed. Included in the analysis is an overview of the
technology and economics of a process similar to the Lurgi MTP® and JGC/Mitsubishi DTP® processes. Both the capital investment
and the operating costs are presented for a plant constructed in the US Gulf Coast and China.
The economic analysis presented in this report is based upon a plant fully integrated with a petrochemical complex and capable
of producing 557 kta of polymer-grade propylene. The estimated CAPEX for such a plant in US Gulf Coast is about USD 380 million.
China is the most attractive place to start-up a MTP plant, which justifies the fact that the only two existing MTP plants are locatedin China. However, with the advent of shale gas in the USA, natural gas prices are low, favoring the construction of a MTP plant
also in the country. This fact is proved by the calculated internal rate of return of above 25% per year in both regions.

8/20/2019 Propylene production from methanol
http://slidepdf.com/reader/full/propylene-production-from-methanol 3/82
ii
… It was actually an advisory
service ordered by one of our
clients, now disclosed to our
readership with his consent.
It results from the innovative
concept, designed by Intratec for
leading companies in the chemical and allied
sectors who have asked for more affordable
and reliable studies to plan their investments.
Intratec’s strategy works by charging clients
lower-than-market fees to conduct a
technology advisory service with the
understanding that such studies may be
released, after an agreed upon period of time,
as publications.
Available through well-known sales channels
such as Amazon, Google Books and HP
MagCloud, our publications can be purchasedby any interested reader.
In short, our clients receive
traditionally expensive studies
for a fraction of the cost, and
our readers get unprecedented
access to real professional
publications at steep discounts.
How Readers Benefit?
From academics to industry executives, our
readers benefit by gaining access to real
consulting cases, released for the first time to
the market as one-of-a-kind publications at
affordable prices.
Through our university discount policy,
students and faculty members will be able to
become familiar with challenges faced by
industry for a price similar to a usual textbook.
How Clients Benefit?
While traditional consulting firms charge their
clients hundreds of thousands of dollars,
Intratec offers, from the convenience of a web
browser, a much better advisory experience
for a price 80% lower than market.
What is Technology
Economics?
Advisory services targeting investments on
new chemical units, answering:
What is the process? What equipment is
necessary?
What are the raw materials and utilities
consumptions?
What are the operating and capital
expenses?
In which locations is this technology more
profitable?
Each new assignment comprises of a study
structured like this publication, valuable
spreadsheets and broad support.
This Publication Was Not a Publication…

8/20/2019 Propylene production from methanol
http://slidepdf.com/reader/full/propylene-production-from-methanol 4/82
iii
Reshaping the Advisory Industry
1) Our publications are accessed and attested to by a huge audience . . .
2) . . . including potential clients who like the publication structure . . .
3) . . . and order advisory services based on the same format.
4) If our clients agree, their advisory services are disclosed as publications.
Everyone Benefits from Cost Sharing & Online Experience
1) Readers purchase our publications at steep discounts online . . .
4) . . . because they were actually consulting cases . . .
3) . . . requested online by the initial client . . .
2) . . . who shared the costs with the readers.
For a better understanding of our innovative concept, please visit www.intratec.us.
Consulting as Publications at a Glance

8/20/2019 Propylene production from methanol
http://slidepdf.com/reader/full/propylene-production-from-methanol 5/82
1
Information, analyses and/or models herein presented
are prepared on the basis of publicly available
information and non-confidential information disclosed
by third parties. Third parties, including, but not limited
to technology licensors, trade associations or
marketplace participants, may have provided some of
the information on which the analyses or data are based.
Intratec Solutions LLC (known as “Intratec”) does not
believe that such information will contain any
confidential information but cannot provide any
assurance that any third party may, from time to time,
claim a confidential obligation to such information.
The aforesaid information, analyses and models are
developed independently by Intratec and, as such, are
the opinion of Intratec and do not represent the point of
view of any third parties nor imply in any way that they
have been approved or otherwise authorized by third
parties that are mentioned in this publication.
The application of the solutions presented in this
publication without license from the owners infringes on
the intellectual property rights of the owners, including
patent rights, trademark rights, and rights to trade
secrets and proprietary information.
Intratec conducts analyses and prepares publications
and models for readers in conformance with generally
accepted professional standards. Although the
statements in this publication are derived from or based
on several sources that Intratec believe to be reliable,
Intratec does not guarantee their accuracy, reliability, or
quality; any such information, or resulting analyses, may
be incomplete, inaccurate or condensed. All estimates
included in this publication are subject to change
without notice. This publication is for informational
purposes only and is not intended as any
recommendation of investment.
Reader agrees it will not, without prior written consent of
Intratec, represent, directly or indirectly, that its products
have been approved or endorsed by the other parties.
In no event shall Intratec, its employees, representatives,
resellers or distributors be liable to readers or any other
person or entity for any direct, indirect, special,
exemplary, punitive, or consequential damages,
including lost profits, based on breach of warranty,
contract, negligence, strict liability or otherwise, arising
from the use of this publication, whether or not they or it
had any knowledge, actual or constructive, that such
damages might be incurred.
Reader shall indemnify and hold harmless Intratec and its
resellers, representatives, distributors, and information
providers against any claim, damages, loss, liability or
expense arising out of reader’s use of the publication in
any way contrary to the present terms and conditions.
Intratec publications are the product of extensive work
and original research and are protected by international
copyright law.
Products supplied as printed reports or books should not
be copied but can be included in schools, universities or
corporate libraries and circulated to colleagues to the
extended permitted by copyright law.
Products supplied digitally are licensed, not sold. The
purchaser is responsible for ensuring that license terms
are adhered to at all times. PDF documents may be
supplied watermarked with the customer’s name, email
and/or company. Digital documents are supplied with
an enterprise license and can be shared by all employees
and on-site contractors of a single organization.
Members of the organization may make such copies as
are necessary to facilitate this distribution. An enterprise
license does not permit sharing with external
organizations.
Reader agrees that Intratec retains all rights, title and
interest, including copyright and other proprietary rights,
in this publication and all material, including but not
limited to text, images, and other multimedia data,
provided or made available as part of this publication.
Terms & Conditions
8/20/2019 Propylene production from methanol
http://slidepdf.com/reader/full/propylene-production-from-methanol 6/82
2
Contents
About this Study .............................................................................................................................................................. 8
Object of Study.............................................................................................................................................................................................................................8
Analysis Performed ............. ................ .............. ................. ................ .............. ................ .......... .............. .............. ................ .............. ............... ............... ........8
Construction Scenarios ..............................................................................................................................................................................................................8
Location Basis ...................................................................................................................................................................................................................................9
Design Conditions......................................................................................................................................................................................................................9
Study Background ........................................................................................................................................................ 10
About Propylene ............ ................ .............. .............. ............... ............... ............. ................. .............. .............. ................. ............. ............... .............. ...........10
Introduction.................................................................................................................................................................................................................................... 10
Applications.................................................................................................................................................................................................................................... 10
Manufacturing Alternatives ............. ................. ................ ............... ............. ............... .............. .............. ................ .............. .............. ................ .............11
Licensor(s) & Historical Aspects......................................................................................................................................................................................13
Technical Analysis............ ......... ......... .......... ......... .......... ......... ......... .......... ......... .......... ......... .......... ......... ......... .......... 14
Chemistry.......................................................................................................................................................................................................................................14
Raw Material ............. ............... ............... .............. ................ .............. .............. ................. ............. ................ ............... .............. .............. ............... ................ ...14
Technology Overview...........................................................................................................................................................................................................16Detailed Process Description & Conceptual Flow Diagram.......................................................................................................................17
Area 100: Reaction & Regeneration................................................................................................................................................................................17
Area 200: Quench & Compression..................................................................................................................................................................................18
Area 300: Product Fractionation.......................................................................................................................................................................................18
Key Consumptions..................................................................................................................................................................................................................... 19
Technical Assumptions ...........................................................................................................................................................................................................19
Labor Requirements.................................................................................................................................................................................................................. 19
ISBL Major Equipment List.................................................................................................................................................................................................23
OSBL Major Equipment List ............... ............... .............. ................. .............. .............. ............. ............... ................ .............. ............... .............. ..............26
Other Process Remarks .............. ................ ................ ................. .............. ................ ............. ................ .............. ................ .............. .............. .............. ......27
Technology Comparison........................................................................................................................................................................................................27
Integration with FCC & Naphtha Crackers...................................................................................................................................................................27
Economic Analysis ........................................................................................................................................................ 29
General Assumptions............................................................................................................................................................................................................29
8/20/2019 Propylene production from methanol
http://slidepdf.com/reader/full/propylene-production-from-methanol 7/82
3
Project Implementation Schedule...............................................................................................................................................................................30
Capital Expenditures..............................................................................................................................................................................................................30
Fixed Investment......................................................................................................................................................................................................................... 30
Working Capital............................................................................................................................................................................................................................ 33
Other Capital Expenses ...........................................................................................................................................................................................................34
Total Capital Expenses .............................................................................................................................................................................................................34
Operational Expenditures ............. ............... ................. ................ ................ ................. ......... .............. .............. .............. ............... ............... ............. ......34
Manufacturing Costs................................................................................................................................................................................................................. 34
Historical Analysis........................................................................................................................................................................................................................ 35
Economic Datasheet .............. ............... ................ ................ ............... ............... ................ ......... ............... ............... .............. ................ .............. ...............35
Regional Comparison & Economic Discussion.................................................................................................... 38
Regional Comparison............................................................................................................................................................................................................38
Capital Expenses.......................................................................................................................................................................................................................... 38
Operational Expenses...............................................................................................................................................................................................................38
Economic Datasheet.................................................................................................................................................................................................................38
Economic Discussion ............. .............. ............... ............... ............... ............... .............. .............. ............... ............... .............. ................ .............. ...............39
References....................................................................................................................................................................... 41
Acronyms, Legends & Observations....................................................................................................................... 42
Technology Economics Methodology........ ........ .......... ......... .......... ......... ......... ........... .......... ......... .......... .......... .. 43
Introduction.................................................................................................................................................................................................................................43
Workflow........................................................................................................................................................................................................................................43
Capital & Operating Cost Estimates............................................................................................................................................................................45
ISBL Investment............................................................................................................................................................................................................................ 45
OSBL Investment......................................................................................................................................................................................................................... 45
Working Capital............................................................................................................................................................................................................................ 46
Start-up Expenses ....................................................................................................................................................................................................................... 46
Other Capital Expenses ...........................................................................................................................................................................................................47
Manufacturing Costs.................................................................................................................................................................................................................47
Contingencies............................................................................................................................................................................................................................47
Accuracy of Economic Estimates..................................................................................................................................................................................48
Location Factor..........................................................................................................................................................................................................................48
Appendix A. Mass Balance & Streams Properties............................................................................................... 50
Appendix B. Utilities Consumption Breakdown ......... ......... ......... .......... ......... .......... .......... ......... .......... ........ .... 55
Appendix C. Carbon Footprint ................................................................................................................................. 56
8/20/2019 Propylene production from methanol
http://slidepdf.com/reader/full/propylene-production-from-methanol 8/82
4
Appendix D. Equipment Detailed List & Sizing................................................................................................... 57
Appendix E. Detailed Capital Expenses................................................................................................................. 66
Direct Costs Breakdown......................................................................................................................................................................................................66
Indirect Costs Breakdown ............ ................ ............... ............... ............... .............. ............... .............. .............. ............... .............. ................ ................ ...67
Appendix F. Economic Assumptions...................................................................................................................... 68
Capital Expenditures..............................................................................................................................................................................................................68
Construction Location Factors ...........................................................................................................................................................................................68
Working Capital............................................................................................................................................................................................................................ 68
Other Capital Expenses ...........................................................................................................................................................................................................68
Operational Expenses .............. .............. .............. ............... .............. .............. .............. ................. .............. ................. .............. ............... ................ ...........69
Fixed Costs ...................................................................................................................................................................................................................................... 69
Depreciation................................................................................................................................................................................................................................... 69
Appendix G. Released Publications ........................................................................................................................ 70
Appendix H. Technology Economics Form Submitted by Client ................................................................. 71

8/20/2019 Propylene production from methanol
http://slidepdf.com/reader/full/propylene-production-from-methanol 9/82
5
List of Tables
Table 1 – Construction Scenarios Assumptions (Based on Degree of Integration) ......................................................................................9
Table 2 – Location & Pricing Basis ....................................................................................................................................................................................................9
Table 3 – General Design Assumptions.......................................................................................................................................................................................9
Table 4 – Major Propylene Consumers......................................................................................................................................................................................10
Table 5 - Raw Materials & Utilities Consumption (per ton of product)................................................................................................................19
Table 6 – Design & Simulation Assumptions.........................................................................................................................................................................19
Table 7 – Labor Requirements for a Typical Plant..............................................................................................................................................................19
Table 8 – Main Streams Operating Conditions and Composition..........................................................................................................................23
Table 9 – Inside Battery Limits Major Equipment List......................................................................................................................................................23
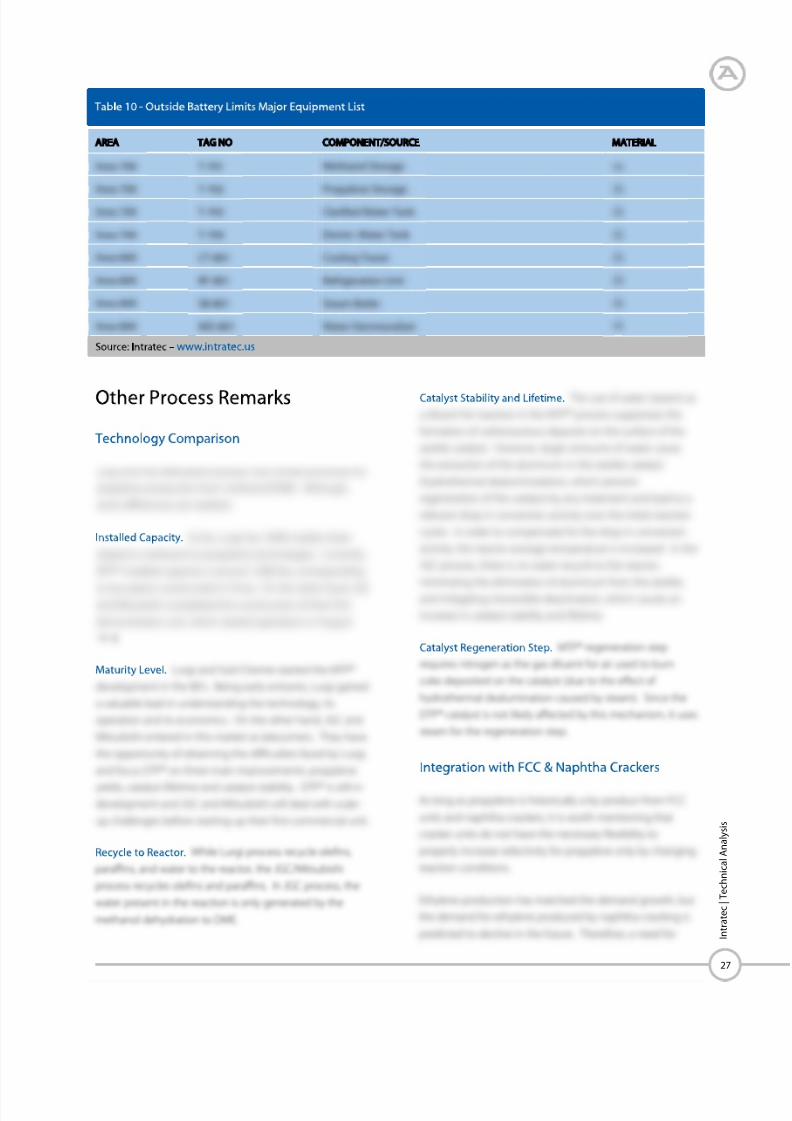
Table 10 - Outside Battery Limits Major Equipment List ...............................................................................................................................................27
Table 11 – Base Case General Assumptions...........................................................................................................................................................................29
Table 12 - Bare Equipment Cost per Area (USD Thousands)......................................................................................................................................30
Table 13 – Total Fixed Investment Breakdown (USD Thousands)..........................................................................................................................30
Table 14 – Working Capital (USD Million) ................................................................................................................................................................................33
Table 15 – Other Capital Expenses (USD Million) ...............................................................................................................................................................34
Table 16 – CAPEX (USD Million)......................................................................................................................................................................................................34
Table 17 – Manufacturing Fixed Cost (USD/ton) ................................................................................................................................................................34
Table 18 – Manufacturing Variable Cost (USD/ton)..........................................................................................................................................................35
Table 19 – OPEX (USD/ton)................................................................................................................................................................................................................35
Table 20 – Technology Economics Datasheet: Propylene Production from Methanol on the US Gulf Coast.......................37
Table 21 – Technology Economics Datasheet: Propylene Production from Methanol in China ....................................................40
Table 22 – Project Contingency......................................................................................................................................................................................................47
Table 23 – Criteria Description.........................................................................................................................................................................................................47
Table 24 – Accuracy of Economic Estimates .........................................................................................................................................................................48
Table 25 – Detailed Material Balance & Streams Properties........................................................................................................................................50
Table 26 – Utilities Consumption Breakdown ......................................................................................................................................................................55
Table 27 – Assumptions for CO2e Emissions Calculation.............................................................................................................................................56
Table 28 – CO2e Emissions (ton/ton prod.)............................................................................................................................................................................56
Table 29 – Compressors .......................................................................................................................................................................................................................57
Table 30 – Heat Exchangers ..............................................................................................................................................................................................................57
Table 31 – Pumps......................................................................................................................................................................................................................................61
Table 32 – Columns.................................................................................................................................................................................................................................62

8/20/2019 Propylene production from methanol
http://slidepdf.com/reader/full/propylene-production-from-methanol 10/82
6
Table 33 – Utilities Supply...................................................................................................................................................................................................................63
Table 34 – Vessels & Tanks..................................................................................................................................................................................................................63
Table 35 – Indirect Costs Breakdown for the Base Case (USD Thousands)......................................................................................................67
Table 36 – Detailed Construction Location Factor............................................................................................................................................................68
Table 37 – Working Capital Assumptions (Base Case) ....................................................................................................................................................68
Table 38 – Other Capital Expenses Assumptions (Base Case) ...................................................................................................................................68
Table 39 – Other Fixed Cost Assumptions ..............................................................................................................................................................................69
Table 40 – Depreciation Value & Assumptions ....................................................................................................................................................................69

8/20/2019 Propylene production from methanol
http://slidepdf.com/reader/full/propylene-production-from-methanol 11/82
7
List of Figures
Figure 1 – Construction Scenarios Assumptions (Based on Degree of Integrations)..................................................................................8
Figure 2 – Propylene from Multiple Sources .........................................................................................................................................................................12
Figure 3 – MTP Reaction Diagram.................................................................................................................................................................................................14
Figure 4 – US Natural Gas Production History and Forecast (Trillion Cubic Feet)........................................................................................15
Figure 5 – Process Block Flow Diagram.....................................................................................................................................................................................16
Figure 6 – Inside Battery Limits Conceptual Process Flow Diagram.....................................................................................................................20
Figure 7 – MTP Integrated with FCC/Naphtha Cracker Units ....................................................................................................................................28
Figure 8 – Project Implementation Schedule .......................................................................................................................................................................29
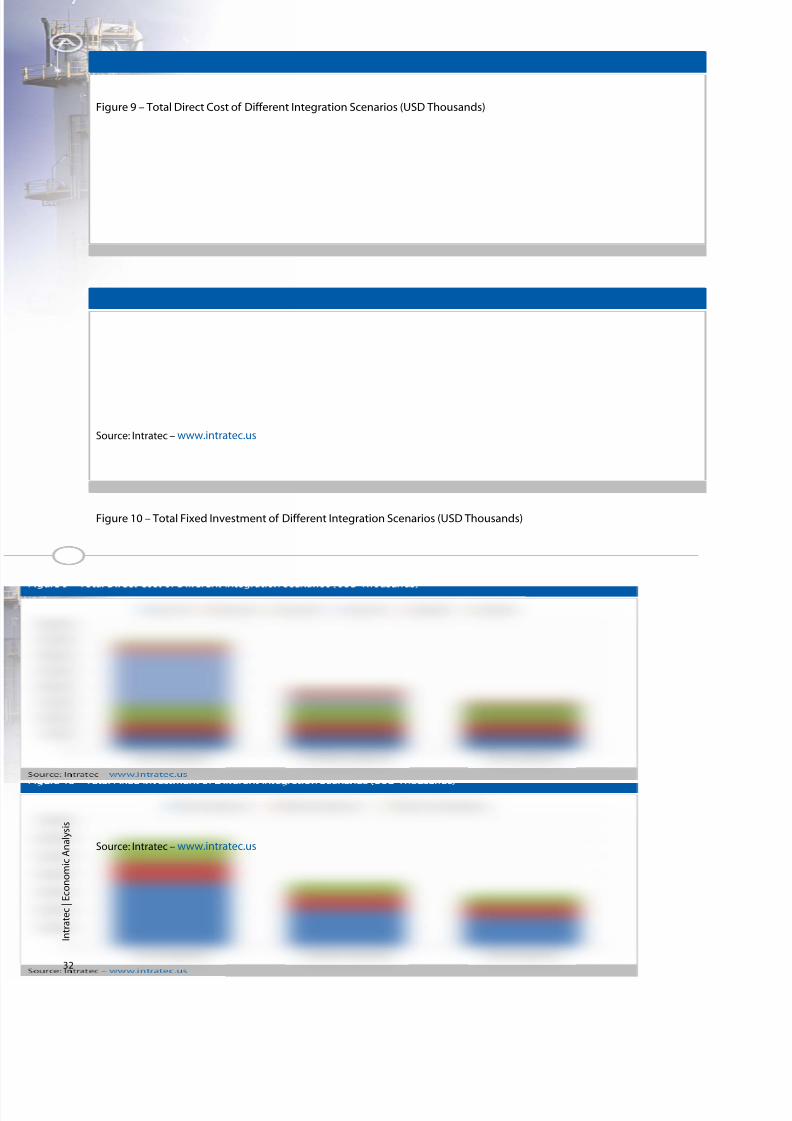
Figure 9 – Total Direct Cost of Different Integration Scenarios (USD Thousands)......................................................................................32
Figure 10 – Total Fixed Investment of Different Integration Scenarios (USD Thousands) ....................................................................32
Figure 11 – Total Fixed Investment Validation (USD Million).....................................................................................................................................33
Figure 12 – OPEX and Product Sales History (USD/ton) ................................................................................................................................................36
Figure 13 – EBITDA Margin & IP Indicators History Comparison..............................................................................................................................36
Figure 14 – CAPEX per Location (USD Million).....................................................................................................................................................................38
Figure 15 – Operating Costs Breakdown per Location (USD/ton) .........................................................................................................................39
Figure 16 – Methodology Flowchart...........................................................................................................................................................................................44
Figure 17 – Location Factor Composition...............................................................................................................................................................................49
Figure 18 – ISBL Direct Costs Breakdown by Equipment Type (Base Case) .....................................................................................................66
Figure 19 – OSBL Direct Costs by Equipment Type (Base Case) ..............................................................................................................................66

8/20/2019 Propylene production from methanol
http://slidepdf.com/reader/full/propylene-production-from-methanol 12/82
8
I n t r a t e c | A b o u t t h i s S t u d y
This study follows the same pattern as all Technology
Economics studies developed by Intratec and is based on
the same rigorous methodology and well-defined structure
(chapters, type of tables and charts, flow sheets, etc.).
This chapter summarizes the set of information that served
as input to develop the current technology evaluation. All
required data were provided through the filling of the
Technology Economics Form available at Intratec’s website.
You may check the original form in the “Appendix H.
Technology Economics Form Submitted by Client”.
Object of Study This assignment assesses the economic feasibility of an
industrial unit for propylene production from methanol,
implementing technology similar to the Lurgi MTP® and
JGC/Mitsubishi DTP® processes.
The current assessment is based on economic data
gathered on Q3 2011 and a chemical plant’s nominal
capacity of 557 kta (thousand metric tons per year).
Raw Materials
Storage
ISBL Unit
Products Storage
Raw Materials
Provider
ISBL Unit
Products Storage
Raw Materials
Provider
ISBL Unit
Products
Consumer
Petrochemical Complex
Petrochemical Complex
Analysis Performed
Construction Scenarios
The economic analysis is based on the construction of a
plant inside a petrochemical complex, in which methanol
feedstock is locally provided and propylene product is
consumed by a nearby polypropylene unit. Therefore, no
storage for product or raw material is required. Additionally,
the petrochemical complex supplies most utilities.
Since the Outside Battery Limits (OSBL) requirements–
storage and utilities supply facilities – significantly impact
the capital cost estimates for a new venture, they may play adecisive role in the decision as to whether or not to invest.
Thus, in this study three distinct OSBL configurations are
compared. Those scenarios are summarized in Figure 1 and
Table 1
About this Study
Figure 1 – Construction Scenarios Assumptions (Based on Degree of Integrations)
Non-Integrated
Petrochemical Complex
Raw Materials
Storage
ISBL Unit
Products Consumer
Petrochemical Complex
Partially Integrated Fully Integrated
Raw Materials
Provider
ISBL Unit
Products Consumer
Raw Materials
Storage
ISBL Unit
Products Storage
Grassroots unit Unit is part of a petrochemical complex Most infrastructure is already installed
Source: Intratec – www.intratec.us

8/20/2019 Propylene production from methanol
http://slidepdf.com/reader/full/propylene-production-from-methanol 13/82
9
I n t r a t e c | A b o u t t h i s S t u d y
Location Basis Regional specific conditions influence both construction
and operating costs. This study compares the economic
performance of two identical plants operating in different
locations: the US Gulf Coast and China.
The assumptions that distinguish the two regions analyzed
in this study are provided in Table 2.
Design Conditions
The process analysis is based on rigorous simulation models
developed on Aspentech Aspen Plus and Hysys, which
support the design of the chemical process, equipment andOSBL facilities.
The design assumptions employed are depicted in Table 3.
Cooling water temperature 24 °C
Cooling water range 11 °C
Steam (High Pressure) 28 bar abs
Steam (Medium Pressure) 11 bar abs
Steam (Low Pressure) 7 bar abs
Refrigerant (Propylene) -45 °C
Wet Bulb Air Temperature 25 °C
Table 1 – Construction Scenarios Assumptions (Based on Degree of Integration)
Storage Capacity (Base Case for Evaluation)
Feedstock & Chemicals 20 days of operation 20 days of operation Not included
End-products & By-products 20 days of operation Not included Not included
Utility Facilities Included All All Only refrigeration unit
Support & Auxiliary Facilities
(Area 900)
Control room, labs, gate house,
maintenance shops,
warehouses, offices, change
house, cafeteria, parking lot
Control room, labs,
maintenance shops,
warehouses
Control room and labs
Source: Intratec – www.intratec.us
Table 2 – Location & Pricing Basis
Source: Intratec – www.intratec.us
Table 3 – General Design Assumptions
Source: Intratec – www.intratec.us
8/20/2019 Propylene production from methanol
http://slidepdf.com/reader/full/propylene-production-from-methanol 14/82
10
I n t r a t e c | S t u d y B a c k g r o u n d
About Propylene
Introduction
Propylene is an unsaturated organic compound having the
chemical formula C3H6. It has one double bond, is the
second simplest member of the alkene class of
hydrocarbons, and is also second in natural abundance.
Propylene 2D structure
Propylene is produced primarily as a by-product of
petroleum refining and of ethylene production by steam
cracking of hydrocarbon feedstocks. Also, it can be
produced in an on-purpose reaction (for example, in
propane dehydrogenation, metathesis or syngas-to-olefins
plants). It is a major industrial chemical intermediate that
serves as one of the building blocks for an array of chemical
and plastic products, and was also the first petrochemical
employed on an industrial scale.
Commercial propylene is a colorless, low-boiling,
flammable, and highly volatile gas. Propylene is traded
commercially in three grades:
Polymer Grade (PG): min. 99.5% of purity.
Chemical Grade (CG): 90-96% of purity.
Refinery Grade (RG): 50-70% of purity.
Applications
The three commercial grades of propylene are used fordifferent applications. RG propylene is obtained from
refinery processes. The main uses of refinery propylene are
in liquefied petroleum gas (LPG) for thermal use or as an
octane-enhancing component in motor gasoline. It can
also be used in some chemical syntheses (e.g., cumene or
isopropanol). The most significant market for RG propylene
is the conversion to PG or CG propylene for use in the
production of polypropylene, acrylonitrile, oxo-alcohols and
propylene oxide.
While CG propylene is used extensively for most chemical
derivatives (e.g., oxo-alcohols, acrylonitrile, etc.), PG
propylene is used in polypropylene and propylene oxide
manufacture.
PG propylene contains minimal levels of impurities, such as
carbonyl sulfide, that can poison catalysts.
Thermal & Motor Gasoline Uses
Propylene has a calorific value of 45.813 kJ/kg, and RG
propylene can be used as fuel if more valuable uses are
unavailable locally (i.e., propane – propene splitting to
chemical-grade purity). RG propylene can also be blended
into LPG for commercial sale.
Also, propylene is used as a motor gasoline component for
octane enhancement via dimerization – formation of
polygasoline or alkylation.
Chemical Uses
The principal chemical uses of propylene are in the
manufacture of polypropylene, acrylonitrile, oxo-alcohols,
propylene oxide, butanal, cumene, and propene oligomers.
Other uses include acrylic acid derivatives and ethylene –
propene rubbers.
Global propylene demand is dominated by polypropylene
production, which accounts for about two-thirds of total
propylene demand.
Polypropylene Mechanical parts, containers, fibers, films
Acrylonitrile Acrylic fibers, ABS polymers
Propylene oxidePropylene glycol, antifreeze,
polyurethane
Oxo-alcohols Coatings, plasticizers
Cumene Polycarbonates, phenolic resins
Acrylic acidCoatings, adhesives, super absorbent
polymers
Study Background
Table 4 – Major Propylene Consumers
Source: Intratec – www.intratec.us
8/20/2019 Propylene production from methanol
http://slidepdf.com/reader/full/propylene-production-from-methanol 15/82
11
I n t r a t e c | S t u d y B a c k g r o u n d
Manufacturing Alternatives
Propylene is commercially generated as a co-product, either
in an olefins plant or a crude oil refinery’s fluid catalytic
cracking (FCC) unit, or produced in an on-purpose reaction
(for example, in propane dehydrogenation, metathesis or
syngas-to-olefins plants).
Globally, the largest volume of propylene is produced in
NGL (Natural Gas Liquids) or naphtha steam crackers, which
generates ethylene as well. In fact, the production of
propylene from such a plant is so important that the name
“olefins plant” is often applied to this kind of manufacturing
facility (as opposed to “ethylene plant”). In an olefins plant,
propylene is generated by the pyrolysis of the incoming
feed, followed by purification. Except where ethane is used
as the feedstock, propylene is typically produced at levels
ranging from 40 to 60 wt% of the ethylene produced. The
exact yield of propylene produced in a pyrolysis furnace is afunction of the feedstock and the operating severity of the
pyrolysis.
The pyrolysis furnace operation usually is dictated by
computer optimization, where an economic optimum for
the plant is based on feedstock price, yield structures,
energy considerations, and market conditions for the
multitude of products obtained from the furnace. Thus,
propylene produced by steam cracking varies according to
economic conditions.
In an olefins plant purification area, also called separationtrain, propylene is obtained by distillation of a mixed C3
stream, i.e., propane, propylene, and minor components, in
a C3-splitter tower. It is produced as the overhead
distillation product, and the bottoms are a propane-
enriched stream. The size of the C3-splitter depends on the
purity of the propylene product.
The propylene produced in refineries also originates from
other cracking processes. However, these processes can be
compared to only a limited extent with the steam cracker
for ethylene production because they use completely
different feedstocks and have different production
objectives.
Refinery cracking processes operate either purely thermally
or thermally – catalytically. By far the most important
process for propene production is the fluid- catalytic
cracking (FCC) process, in which the powdery catalyst flows
as a fluidized bed through the reaction and regeneration
areas. This process converts heavy gas oil preferentially into
gasoline and light gas oil.
The propylene yielded from olefins plants and FCC units is
typically considered a co-product in these processes, which
are primarily driven by ethylene and motor gasoline
production, respectively. Currently, the markets have
evolved to the point where modes of by-product
production can no longer satisfy the demand for propylene.
A trend toward less severe cracking conditions, and thus to
increase propylene production, has been observed in steam
cracker plants using liquid feedstock. As a result, new and
novel lower-cost chemical processes for on-purpose
propylene production technologies are of high interest to
the petrochemical marketplace. Such processes include:
Olefin Metathesis. Also known as disproportionation,
metathesis is a reversible reaction between ethylene
and butenes in which double bonds are broken and
then reformed to form propylene. Propylene yields of
about 90 wt% are achieved. This option may also be
used when there is no butene feedstock. In this case,
part of the ethylene feeds an ethylene-dimerization
unit that converts ethylene into butene.
Propane Dehydrogenation. A catalytic process that
converts propane into propylene and hydrogen (by-
product). The yield of propylene from propane is
about 85 wt%. The reaction by-products (mainly
hydrogen) are usually used as fuel for the propane
dehydrogenation reaction. As a result, propylene
tends to be the only product, unless local demand
exists for the hydrogen by-product.
Methanol-to-Olefins/Methanol-to-Propylene. A
group of technologies that first converts synthesis gas
(syngas) to methanol, and then converts the methanol
to ethylene and/or propylene. The process also
produces water as by-product. Synthesis gas is
produced from the reformation of natural gas or by the
steam-induced reformation of petroleum products
such as naphtha, or by gasification of coal. A large
amount of methanol is required to make a world-scale
ethylene and/or propylene plant.
High Severity FCC. Refers to a group of technologies
that use traditional FCC technology under severe
conditions (higher catalyst-to-oil ratios, higher steam
injection rates, higher temperatures, etc.) in order to
maximize the amount of propylene and other light
products. A high severity FCC unit is usually fed with

8/20/2019 Propylene production from methanol
http://slidepdf.com/reader/full/propylene-production-from-methanol 16/82
12
I n t r a t e c | S t u d y B a c k g r o u n d
gas oils (paraffins) and residues, and produces about
20-25 wt% propylene on feedstock together with
greater volumes of motor gasoline and distillate by-
products.
Olefins Cracking. Includes a broad range of
technologies that catalytically convert large olefins
molecules (C4-C8) into mostly propylene and small
amounts of ethylene. This technology will best be
employed as an auxiliary unit to an FCC unit or steam
cracker to enhance propylene yields.
These on-purpose methods are becoming increasingly
significant, as the shift to lighter steam cracker feedstocks
with relatively lower propylene yields and reduced motor
gasoline demand in certain areas has created an imbalance
of supply and demand for propylene.
Figure 2 – Propylene from Multiple Sources
Steam Cracker
Refinery FCC Unit
PDH
Metathesis
MTO/MTP
High Severity FCC
Olefins Cracking
Naphtha
NGL
RG Propylene CG/PG Propylene
Gas Oil
Propane
Ethylene/
Butenes
Methanol
C4 to C8
Olefins
Gas Oil
Source: Intratec – www.intratec.us

8/20/2019 Propylene production from methanol
http://slidepdf.com/reader/full/propylene-production-from-methanol 17/82
13
I n t r a t e c | S t u d y B a c k g r o u n d
Licensor(s) & Historical Aspects
The continuous rise in petroleum prices in addition to the
increase in world demand for propylene led to innovation
by the chemical industry in the development of production
routes other than those involving oil. Thus, the economic
and environmental benefits arising from the use of naturalgas encouraged an alternative route for olefins production
by using inexpensive methanol, which is deemed to be a
readily stored and managed intermediate product
generated from the natural gas.
Since the 1980s, hydrocarbons production from methanol
over a zeolite (especially of the ZSM-5 type) catalyst has
been known. It was found that methanol could be
converted into olefins ranging from C2 to C8, depending on
the reaction conditions. However, at that time, the
commercialization of routes such as MTG (methanol-to-
gasoline) by Mobil (now ExxonMobil) and the first tests of methanol into olefins conversion conducted by Lurgi, were
not possible on a commercial scale due to the high price of
methanol and the complexity of the required reactor
systems.
Propylene production from methanol started to become
technically feasible in 1999, when Lurgi made the choice of
a proper zeolite as the catalyst and started a pilot plant for
optimization tests. A demonstration unit was then built in
Norway in order to prove that the catalyst life under realistic
conditions was long enough to make the process
economically feasible. The main objective wasaccomplished and PG propylene production through
methanol-to-propylene (MTP) was also proved.
A similar technology that converts dimethyl-ether into
propylene, named as DTP® (Dominant Technology for
Propylene), has been jointly developed by the Japanese
corporations JGC and Mitsubishi Chemicals since 2007. This
technology can be considered a Lurgi MTP® competitor. A
demonstration plant was built in Mitsubishi Chemical’s
Mizushima Plant, Japan, and started the operations in
August 2010. However, till the present date, there is no
commercial unit in operation of the DTP® technology.
8/20/2019 Propylene production from methanol
http://slidepdf.com/reader/full/propylene-production-from-methanol 18/82
14
I n t r a t e c | T e c h n i c a l A n a l y s i s
Chemistry
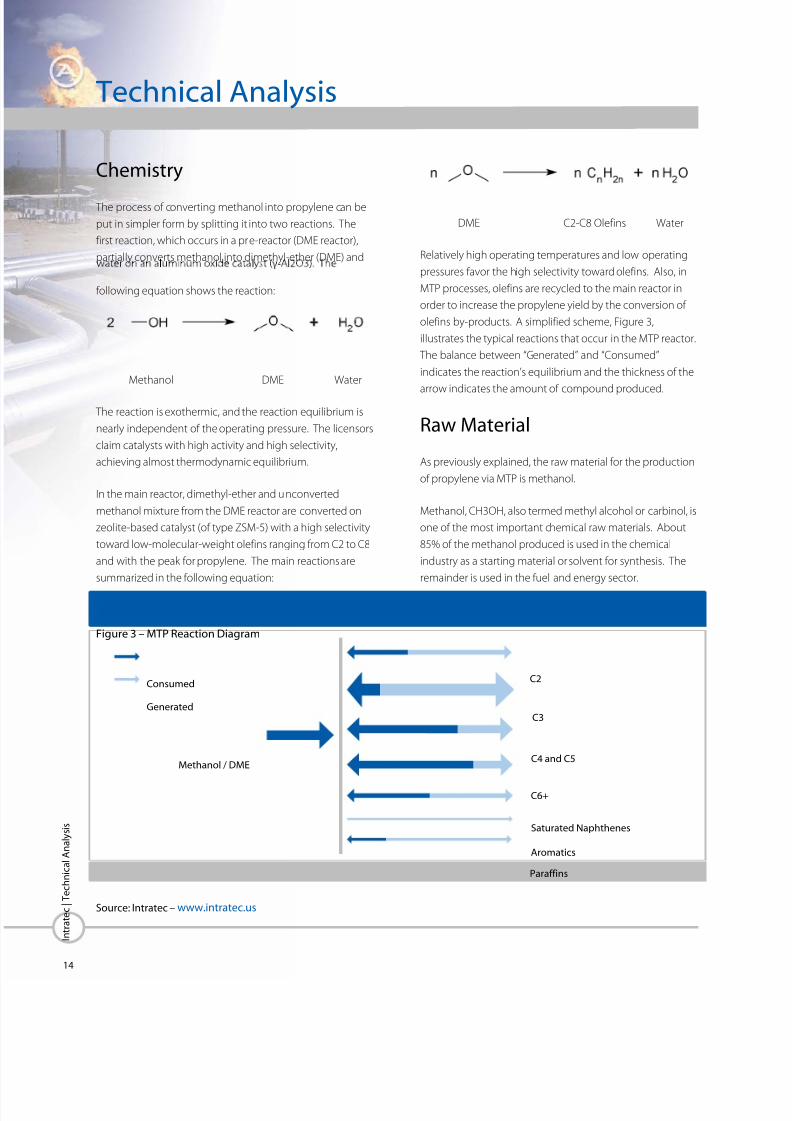
The process of converting methanol into propylene can be
put in simpler form by splitting it into two reactions. The
first reaction, which occurs in a pre-reactor (DME reactor),
partially converts methanol into dimethyl-ether (DME) and
following equation shows the reaction:
Methanol DME Water
The reaction is exothermic, and the reaction equilibrium is
nearly independent of the operating pressure. The licensors
claim catalysts with high activity and high selectivity,
achieving almost thermodynamic equilibrium.
In the main reactor, dimethyl-ether and unconverted
methanol mixture from the DME reactor are converted on
zeolite-based catalyst (of type ZSM-5) with a high selectivity
toward low-molecular-weight olefins ranging from C2 to C8
and with the peak for propylene. The main reactions are
summarized in the following equation:
DME C2-C8 Olefins Water
Relatively high operating temperatures and low operating
pressures favor the high selectivity toward olefins. Also, in
MTP processes, olefins are recycled to the main reactor in
order to increase the propylene yield by the conversion of
olefins by-products. A simplified scheme, Figure 3,
illustrates the typical reactions that occur in the MTP reactor.
The balance between “Generated” and “Consumed”
indicates the reaction’s equilibrium and the thickness of the
arrow indicates the amount of compound produced.
Raw Material
As previously explained, the raw material for the production
of propylene via MTP is methanol.
Methanol, CH3OH, also termed methyl alcohol or carbinol, is
one of the most important chemical raw materials. About
85% of the methanol produced is used in the chemical
industry as a starting material or solvent for synthesis. The
remainder is used in the fuel and energy sector.
Technical Analysis
Figure 3 – MTP Reaction Diagram
Methanol / DME
Paraffins
Aromatics
Saturated Naphthenes
C6+
C4 and C5
C3
C2Consumed
Generated
Source: Intratec – www.intratec.us

8/20/2019 Propylene production from methanol
http://slidepdf.com/reader/full/propylene-production-from-methanol 19/82
15
I n t r a t e c | T e c h n i c a l A n a l y s i s
Methanol is currently produced on an industrial scale
exclusively by catalytic conversion of synthesis gas.
Processes are classified according to the pressure used:
High-pressure process: 250 – 300 bar abs.
Medium-pressure process: 100 – 250 bar abs.
Low-pressure process: 50 – 100 bar abs.
The main advantages of the low-pressure process are lower
investment and production costs, improved operational
reliability and greater flexibility in the choice of plant size.
Industrial methanol production can be subdivided into
three main steps: production of synthesis gas; synthesis of
methanol; and processing of crude methanol.
All carbonaceous materials such as coal, coke, natural gas,
petroleum, and fractions obtained from petroleum (asphalt,gasoline, and gaseous compounds) can be used as starting
materials for synthesis gas production. Economy is of
primary importance with regard to choice of raw materials.
Long-term availability, energy consumption, and
environmental aspects must also be considered.
Natural gas is generally used in the large-scale production
of synthesis gas for methanol synthesis. In a few processes
(e.g., acetylene production), residual gases are formed
which have roughly the composition of the synthesis gas
required for methanol synthesis.
Natural gas extracted from shale gas has become the
fastest-growing source of gas in the United States and
could become a significant new global energy source. This
will enable the United States to consume a predominantly
domestic supply of gas for many years and produce more
natural gas than it consumes.
According to the forecast from the US Energy Information
Administration (EIA), in 2035, about half of the natural gas
production in the US will be from shale gas. Figure 4 shows
the US natural gas production history and forecast.
MTP technology has a favorable outlook for end-users who
have access to cost-advantaged feedstocks.
Figure 4 – US Natural Gas Production History and
Forecast (Trillion Cubic Feet)
Source: US Energy Information Administration (EIA) AOE2012
0
5
10
15
20
25
30
1990 1995 2000 2005 2010 2015 2020 2025 2030 2035
Non-associated onshore Associated with oil
Coalbed methane Alaska
Non-associated offshore Tight gasShale gas
ForecastHistory

8/20/2019 Propylene production from methanol
http://slidepdf.com/reader/full/propylene-production-from-methanol 20/82
16
I n t r a t e c | T e c h n i c a l A n a l y s i s
Technology Overview
The MTP technology is based on the efficient combination
of two main features:
Fixed-bed reactor system, selected as the most suitable
reaction system from a technological and economicpoint of view;
Highly selective and stable zeolite-based fixed-bed
catalyst commercially manufactured.
In the process, methanol fed to the MTP plant is first
converted to DME and water in a DME pre-reactor. Using a
highly active and selective catalyst, thermodynamic
equilibrium is achieved, resulting in the methanol-water-
DME mixture at appropriate operating conditions.
Hydrocarbon recycle and steam generated from waterrecycle are added to this mixture before it enters the first
MTP reactor of the multi-stage adiabatic reactor system.
The methanol/DME conversion rate exceeds 99%, with
propylene as the essential compound. Additional reaction
proceeds in the downstream reactor stages.
The product mixture leaving the reactor system consists of
product gas, organic liquid and water. This mixture is
cooled and compressed.
After product gas compression, traces of water and DME are
removed and the gas is further processed, yielding polymer-
grade propylene. Several hydrocarbon-containing streams
are recycled to boost the propylene yield. Propylene is the
single main product, as shown in the simplified flow
diagram. Gasoline, LPG, fuel gas and water are by-products.
To avoid accumulation of inert materials in the system, a
small purge is required for light- and heavy-ends. The
excess water resulting from the methanol conversion is also
purged. It can be used as raw water or for irrigation after
inexpensive standard treatment. It can even be processed
to potable water.
Occurrence of coke formed on the active catalyst surfaces is
a crucial issue and inherent in catalytic conversion to olefins
due to inevitable side reactions. The amount of coke
formed is decisive for choosing the most adequate reactor
operation mode and catalyst. For this reason, propylene
synthesis is conducted in a semi-continuous manner, with
one or two reactor systems effectively conducting the
reactions, while the other or a third one is in regeneration or
on stand-by mode.
Regeneration is conducted by burning the coke with a
nitrogen/air mixture, after a cycle of approximately 500-600
hours of operation. The regeneration is carried out at
temperatures similar to the reaction itself, hence the catalyst
particles do not experience any unusual temperature stress
during the in-situ catalyst regeneration procedure.
Figure 5 – Process Block Flow Diagram
Methanol
Water RecycleGasoline
PG PropyleneArea 100
Reaction
Area 200
Quench &
Compression
Area 300
Fractionation
Olefins Recycle
Water
LPG
Fuel Gas
Source: Intratec – www.intratec.us

8/20/2019 Propylene production from methanol
http://slidepdf.com/reader/full/propylene-production-from-methanol 21/82
17
I n t r a t e c | T e c h n i c a l A n a l y s i s

8/20/2019 Propylene production from methanol
http://slidepdf.com/reader/full/propylene-production-from-methanol 22/82
18
I n t r a t e c | T e c h n i c a l A n a l y s i s
8/20/2019 Propylene production from methanol
http://slidepdf.com/reader/full/propylene-production-from-methanol 23/82
19
I n t r a t e c | T e c h n i c a l A n a l y s i s
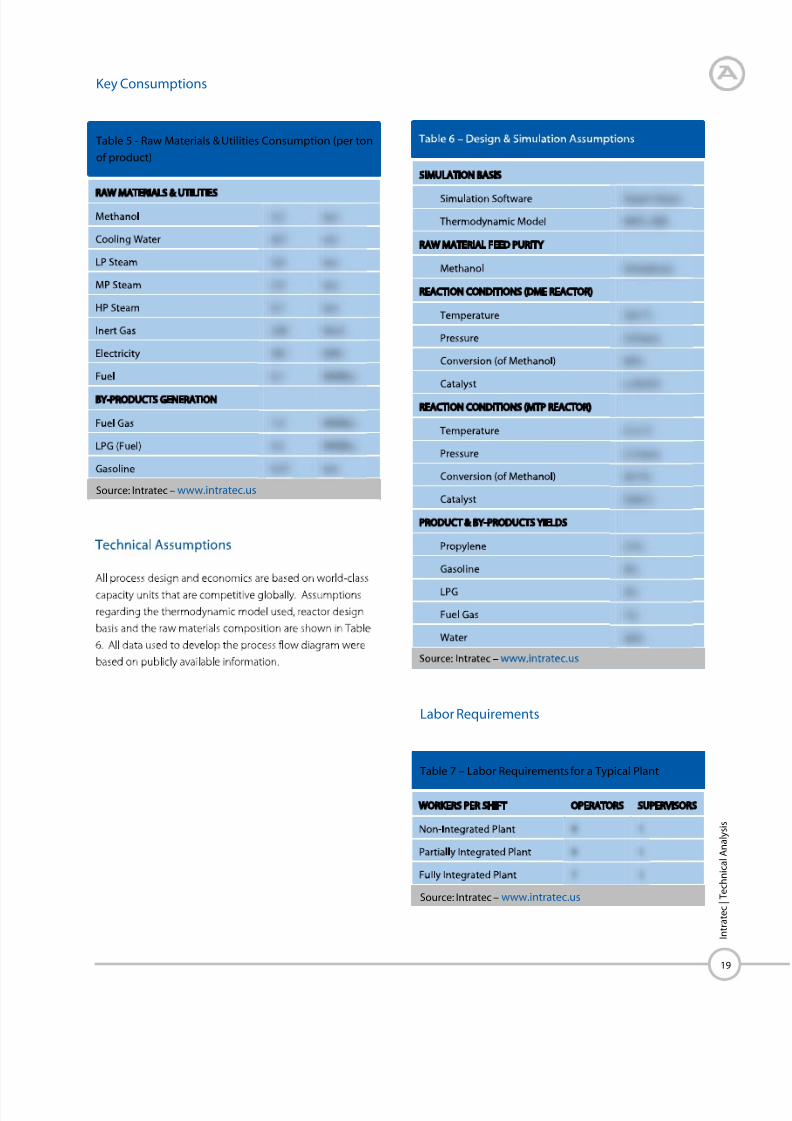
Key Consumptions
Labor Requirements
Table 5 - Raw Materials & Utilities Consumption (per ton
of product)
Source: Intratec – www.intratec.us
Table 7 – Labor Requirements for a Typical Plant
Source: Intratec – www.intratec.us

8/20/2019 Propylene production from methanol
http://slidepdf.com/reader/full/propylene-production-from-methanol 24/82
20
I n t r a t e c | T e c h n i c a l A n a l y s i s
Figure 6 – Inside Battery Limits Conceptual Process Flow Diagram
Source: Intratec – www.intratec.us

8/20/2019 Propylene production from methanol
http://slidepdf.com/reader/full/propylene-production-from-methanol 25/82
21
I n t r a t e c | T e c h n i c a l A n a l y s i s
Figure 6 – Inside Battery Limits Conceptual Process Flow Diagram (Cont.)
Source: Intratec – www.intratec.us

8/20/2019 Propylene production from methanol
http://slidepdf.com/reader/full/propylene-production-from-methanol 26/82
22
I n t r a t e c | T e c h n i c a l A n a l y s i s
Figure 6 – Inside Battery Limits Conceptual Process Flow Diagram (Cont.)
Source: Intratec – www.intratec.us
8/20/2019 Propylene production from methanol
http://slidepdf.com/reader/full/propylene-production-from-methanol 27/82
23
I n t r a t e c | T e c h n i c a l A n a l y s i s
Table 8 presents the main streams composition and
operating conditions. For a more complete material
balance, see the “Appendix A. Mass Balance & Streams
Properties.”
Information regarding utilities flow rates is provided in
“Appendix B. Utilities Consumption Breakdown.” For further
details on greenhouse gas emissions caused by this process,
see “Appendix C. Carbon Footprint.”
ISBL Major Equipment List Table 9 shows the equipment list by area. It also presents a
brief description and the main materials used.
Find main specifications for each piece of equipment in
“Appendix D. Equipment Detailed List & Sizing.”

8/20/2019 Propylene production from methanol
http://slidepdf.com/reader/full/propylene-production-from-methanol 28/82
24
I n t r a t e c | T e c h n i c a l A n a l y s i s
8/20/2019 Propylene production from methanol
http://slidepdf.com/reader/full/propylene-production-from-methanol 29/82
25
I n t r a t e c | T e c h n i c a l A n a l y s i s

8/20/2019 Propylene production from methanol
http://slidepdf.com/reader/full/propylene-production-from-methanol 30/82
26
I n t r a t e c | T e c h n i c a l A n a l y s i s
OSBL Major Equipment List
The OSBL is divided into three main areas: storage (Area700), energy and water facilities (Area 800), and support &
auxiliary facilities (Area 900).
Table 10 shows the list of tanks located in the storage area
and the energy facilities required in the construction of a
non-integrated unit.
8/20/2019 Propylene production from methanol
http://slidepdf.com/reader/full/propylene-production-from-methanol 31/82
27
I n t r a t e c | T e c h n i c a l A n a l y s i s

8/20/2019 Propylene production from methanol
http://slidepdf.com/reader/full/propylene-production-from-methanol 32/82
28
I n t r a t e c | T e c h n i c a l A n a l y s i s
Figure 7 – MTP Integrated with FCC/Naphtha Cracker Units
Hydrogenation
Reactor
MTP Reactor
C4 and C5
Hydrocarbons
from FCC or
Naphtha Cracker
Quenching,
Compression &
Fractionation
DME
Fuel Gas
PG Propylene
LPG
Gasoline
WaterRecycled Olefins
Source: Intratec – www.intratec.us

8/20/2019 Propylene production from methanol
http://slidepdf.com/reader/full/propylene-production-from-methanol 33/82
29
I n t r a t e c | E c o n o m i c A n a l y s i s
General Assumptions
The general assumptions for the base case of this analysis
are outlined below.
In Table 11, the IC Index stands for Intratec chemical plant
Construction Index, an indicator, published monthly by
Intratec, to scale capital costs from one time period to
another.
This index reconciles prices trends of fundamental
components of a chemical plant construction such as labor,
material and energy, providing meaningful historical and
forecast data for our readers and clients.
The assumed operating hours per year indicated does not
represent any technology limitation; rather, it is an
assumption based on usual industrial operating rates
Additionally, Table 11 discloses assumptions regarding the
project complexity, technology maturity and data reliability,
which are of major importance for attributing reasonable
contingencies for the investment and for evaluating the
overall accuracy of estimates. Definitions and figures for
both contingencies and accuracy of economic estimates
can be found in this publication in the chapter “Technology
Economics Methodology.”
Economic Analysis
Table 11 – Base Case General Assumptions
Source: Intratec – www.intratec.us
Figure 8 – Project Implementation Schedule
Source: Intratec – www.intratec.us

8/20/2019 Propylene production from methanol
http://slidepdf.com/reader/full/propylene-production-from-methanol 34/82
30
I n t r a t e c | E c o n o m i c A n a l y s i s
Project Implementation
Schedule
The main objective of knowing upfront the project
implementation schedule is to enhance the estimates for
both capital initial expenses and return on investment.
The implementation phase embraces the period from the
decision to invest to the start of commercial production.
This phase can be divided into five major stages: (1) Basic
Engineering, (2) Detailed Engineering, (3) Procurement, (4)
Construction, and (5) Plant Start-up.
The duration of each phase is detailed in Figure 8.
Capital Expenditures
Fixed Investment
Table 12 shows the bare equipment cost associated with
each area of the project.
Table 13 presents the breakdown of the total fixedinvestment (TFI) per item (direct & indirect costs and project
contingencies). For further information about the
components of the TFI please see the chapter “Technology
Economics Methodology”.
Fundamentally, the direct costs are the total direct material
and labor costs associated with the equipment (including
installation bulks). The total direct cost represents the total
bare equipment installed cost.
“Appendix E. Detailed Capital Expenses” provides a detailed
breakdown for the direct expenses, outlining the share of
each type of equipment in total.
After defining the total direct cost, the TFI is established by
adding field indirects, engineering costs, overhead, contract
fees and contingencies.
Indirect costs are defined by the American Association of
Cost Engineers (AACE) Standard Terminology as those
"costs which do not become a final part of the installation
but which are required for the orderly completion of the
installation."
The indirect project expenses are further detailed in
“Appendix E. Detailed Capital Expenses”
Table 12 - Bare Equipment Cost per Area (USD
Thousands)
Source: Intratec – www.intratec.us
Table 13 – Total Fixed Investment Breakdown (USD
Thousands)
Source: Intratec – www.intratec.us

8/20/2019 Propylene production from methanol
http://slidepdf.com/reader/full/propylene-production-from-methanol 35/82
31
I n t r a t e c | E c o n o m i c A n a l y s i s
Alternative OSBL Configurations
The total fixed investment for the construction of a new
chemical plant is greatly impacted by how well it will be
able to take advantage of the infrastructure already installed
in that location.
For example, if there are nearby facilities consuming a unit’s
final product or supplying a unit’s feedstock, the need for
storage facilities significantly decreases, along with the total
fixed investment required. This is also true for support
facilities that can serve more than one plant in the same
complex, such as a parking lot, gate house, etc.
This study analyzes the total fixed investment for three
distinct scenarios regarding OSBL facilities:
Non-Integrated Plant
Plant Partially Integrated
Plant Fully Integrated
The detailed definition, as well as the assumptions used for
each scenario is presented in the chapter “About this Study”
The influence of the OSBL facilities on the capital
investment is depicted in Figure 9 and in Figure 10.
8/20/2019 Propylene production from methanol
http://slidepdf.com/reader/full/propylene-production-from-methanol 36/82
32
I n t r a t e c | E c o n o m i c A n a l y s i s
Figure 9 – Total Direct Cost of Different Integration Scenarios (USD Thousands)
Source: Intratec – www.intratec.us
Figure 10 – Total Fixed Investment of Different Integration Scenarios (USD Thousands)
Source: Intratec – www.intratec.us
8/20/2019 Propylene production from methanol
http://slidepdf.com/reader/full/propylene-production-from-methanol 37/82
33
I n t r a t e c | E c o n o m i c A n a l y s i s
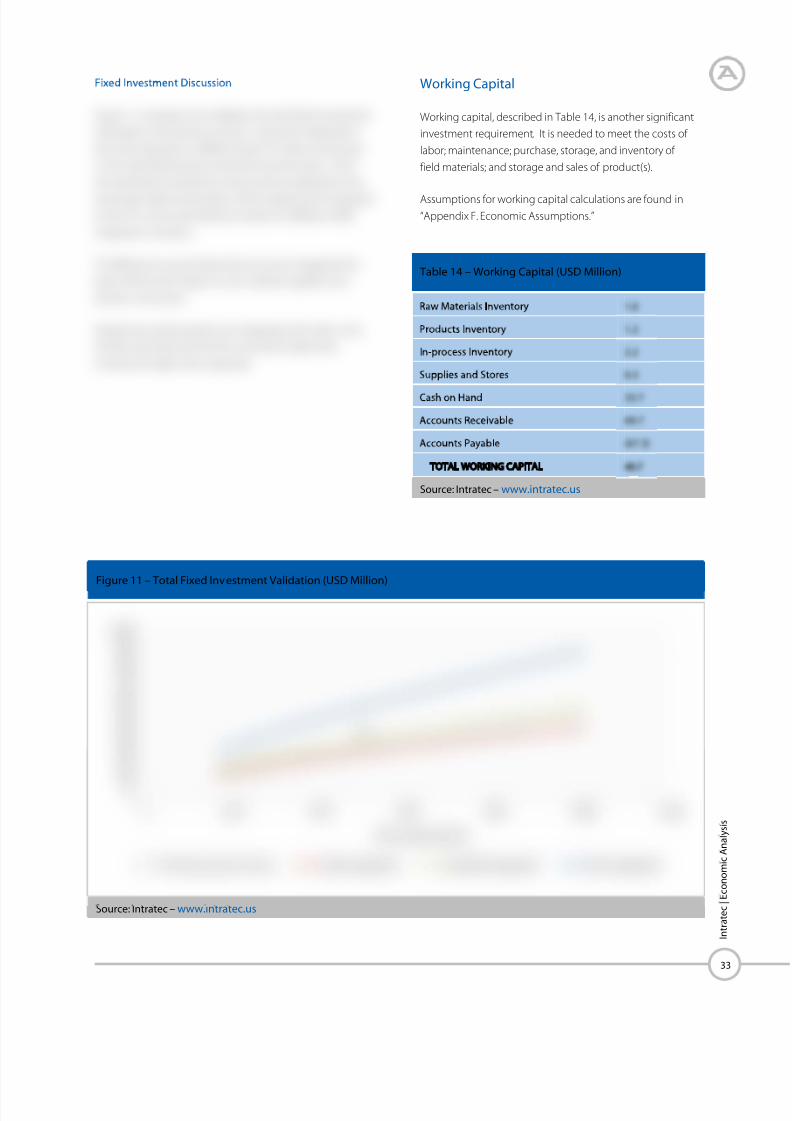
Working Capital
Working capital, described in Table 14, is another significant
investment requirement. It is needed to meet the costs of
labor; maintenance; purchase, storage, and inventory of
field materials; and storage and sales of product(s).
Assumptions for working capital calculations are found in
“Appendix F. Economic Assumptions.”
Figure 11 – Total Fixed Investment Validation (USD Million)
Source: Intratec – www.intratec.us
Table 14 – Working Capital (USD Million)
Source: Intratec – www.intratec.us
8/20/2019 Propylene production from methanol
http://slidepdf.com/reader/full/propylene-production-from-methanol 38/82
34
I n t r a t e c | E c o n o m i c A n a l y s i s
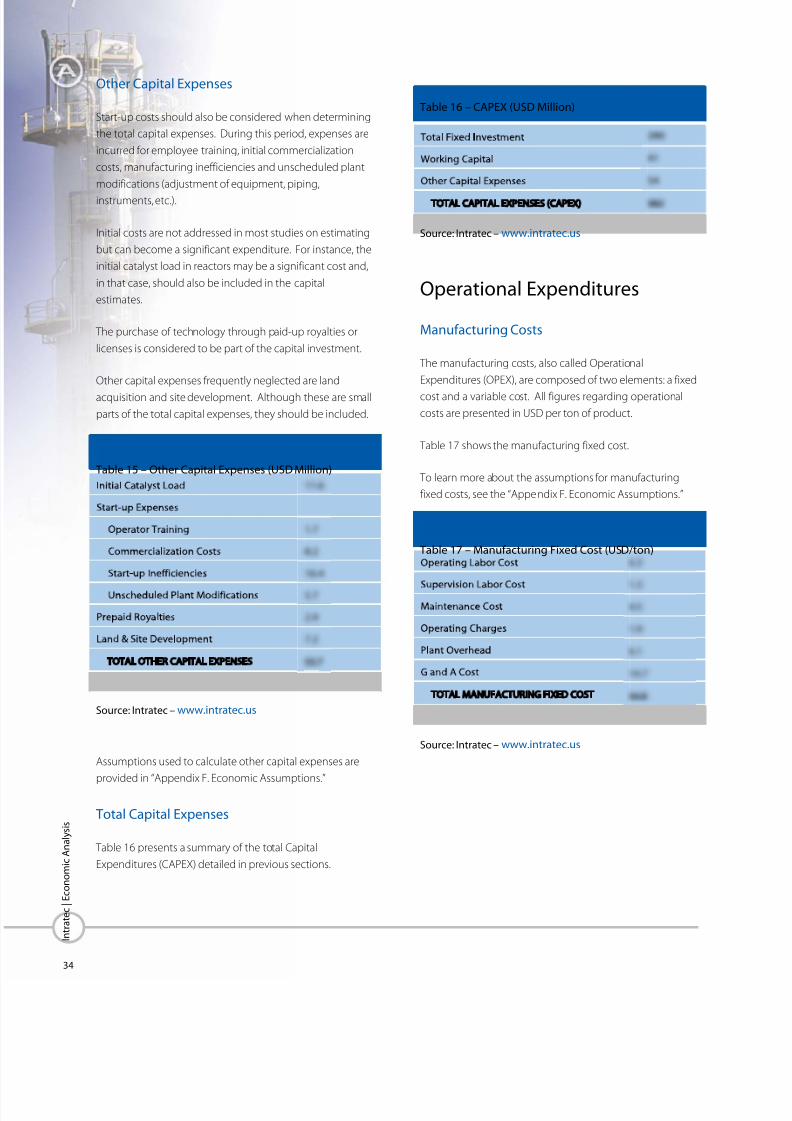
Other Capital Expenses
Start-up costs should also be considered when determining
the total capital expenses. During this period, expenses are
incurred for employee training, initial commercialization
costs, manufacturing inefficiencies and unscheduled plant
modifications (adjustment of equipment, piping,
instruments, etc.).
Initial costs are not addressed in most studies on estimating
but can become a significant expenditure. For instance, the
initial catalyst load in reactors may be a significant cost and,
in that case, should also be included in the capital
estimates.
The purchase of technology through paid-up royalties or
licenses is considered to be part of the capital investment.
Other capital expenses frequently neglected are land
acquisition and site development. Although these are small
parts of the total capital expenses, they should be included.
Assumptions used to calculate other capital expenses are
provided in “Appendix F. Economic Assumptions.”
Total Capital Expenses
Table 16 presents a summary of the total Capital
Expenditures (CAPEX) detailed in previous sections.
Operational Expenditures
Manufacturing Costs
The manufacturing costs, also called Operational
Expenditures (OPEX), are composed of two elements: a fixed
cost and a variable cost. All figures regarding operational
costs are presented in USD per ton of product.
Table 17 shows the manufacturing fixed cost.
To learn more about the assumptions for manufacturing
fixed costs, see the “Appendix F. Economic Assumptions.”
Table 15 – Other Capital Expenses (USD Million)
Source: Intratec – www.intratec.us
Table 16 – CAPEX (USD Million)
Source: Intratec – www.intratec.us
Table 17 – Manufacturing Fixed Cost (USD/ton)
Source: Intratec – www.intratec.us

8/20/2019 Propylene production from methanol
http://slidepdf.com/reader/full/propylene-production-from-methanol 39/82
35
I n t r a t e c | E c o n o m i c A n a l y s i s
Table 18 discloses the manufacturing variable costs.
Historical Analysis
Figure 12 depicts Sales and OPEX historic data. Figure 13
compares the project EBITDA trends with Intratec
Profitability Indicators (IP Indicators). The Basic Chemicals IPIndicator represents basic chemicals sector profitability,
based on the weighted average EBITDA margins of major
global basic chemicals producers. On the other hand, the
Chemical Sector IP Indicator reveals the overall chemical
sector profitability through a weighted average of the IP
Indicators calculated for three major chemical industry
niches: basic, specialties and diversified chemicals.
Economic Datasheet
The Technology Economic Datasheet, presented in Table
20, is an overall evaluation of the technology's production
costs in a US Gulf Coast based plant.
The expected revenues in products sales and initialeconomic indicators are presented for a short-term
assessment of its economic competitiveness.
Table 18 – Manufacturing Variable Cost (USD/ton)
Source: Intratec – www.intratec.us
Table 19 – OPEX (USD/ton)
Source: Intratec – www.intratec.us

8/20/2019 Propylene production from methanol
http://slidepdf.com/reader/full/propylene-production-from-methanol 40/82
36
I n t r a t e c | E c o n o m i c A n a l y s i s
Figure 12 – OPEX and Product Sales History (USD/ton)
Source: Intratec – www.intratec.us
Figure 13 – EBITDA Margin & IP Indicators History Comparison
Source: Intratec – www.intratec.us
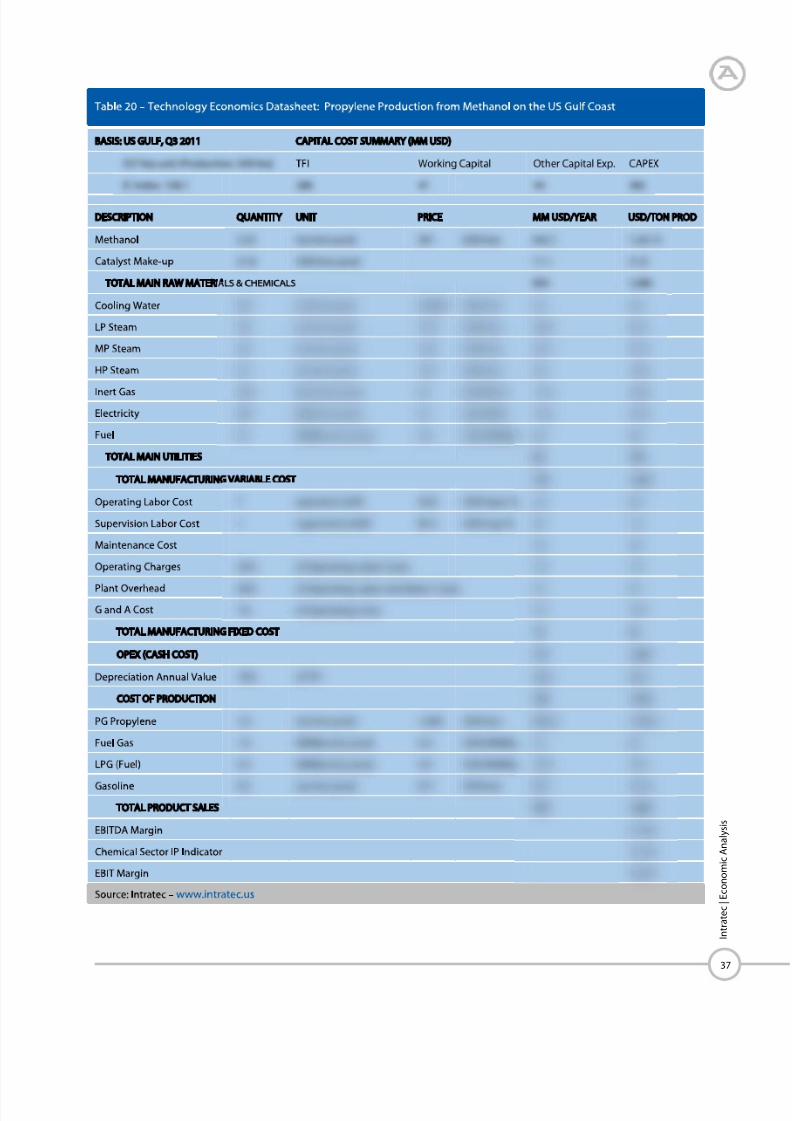
8/20/2019 Propylene production from methanol
http://slidepdf.com/reader/full/propylene-production-from-methanol 41/82
37
I n t r a t e c | E c o n o m i c A n a l y s i s
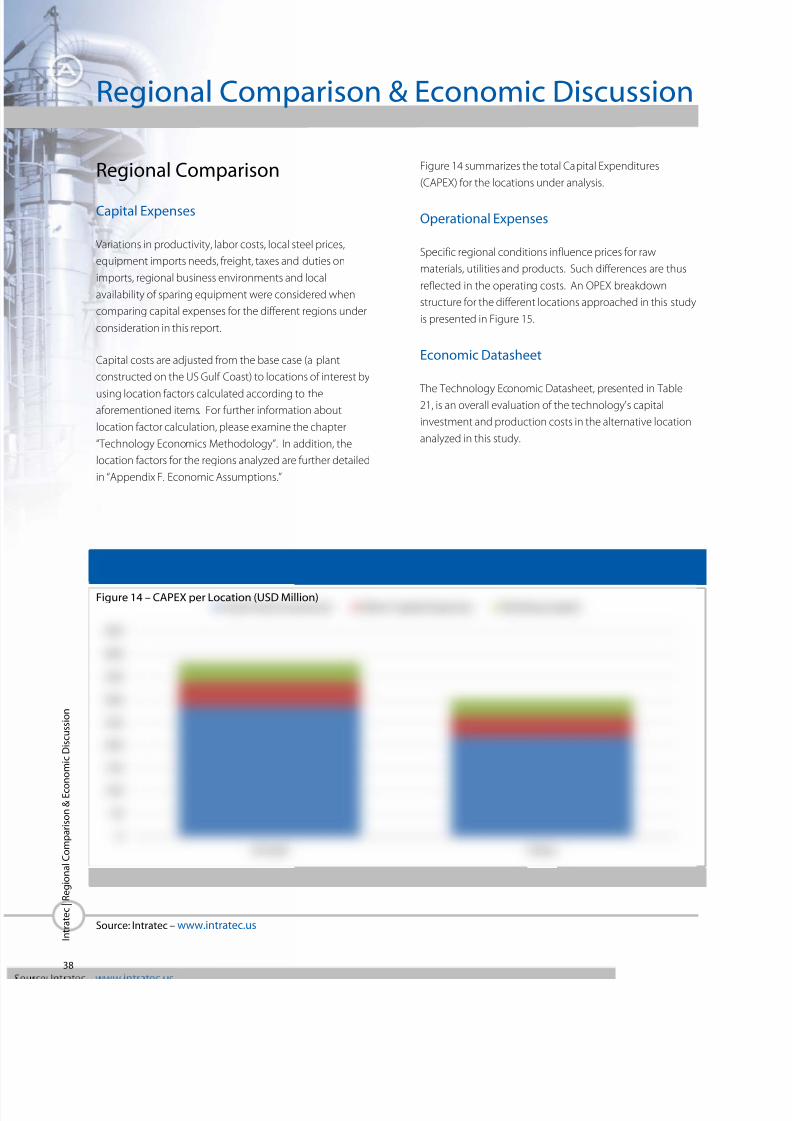
8/20/2019 Propylene production from methanol
http://slidepdf.com/reader/full/propylene-production-from-methanol 42/82
38
I n t r a t e c | R e g i o n a l C o m p a r i s o n & E c o
n o m i c D i s c u s s i o n
Regional Comparison
Capital Expenses
Variations in productivity, labor costs, local steel prices,
equipment imports needs, freight, taxes and duties on
imports, regional business environments and local
availability of sparing equipment were considered when
comparing capital expenses for the different regions under
consideration in this report.
Capital costs are adjusted from the base case (a plant
constructed on the US Gulf Coast) to locations of interest by
using location factors calculated according to theaforementioned items. For further information about
location factor calculation, please examine the chapter
“Technology Economics Methodology”. In addition, the
location factors for the regions analyzed are further detailed
in “Appendix F. Economic Assumptions.”
Figure 14 summarizes the total Capital Expenditures
(CAPEX) for the locations under analysis.
Operational Expenses
Specific regional conditions influence prices for raw
materials, utilities and products. Such differences are thus
reflected in the operating costs. An OPEX breakdown
structure for the different locations approached in this study
is presented in Figure 15.
Economic Datasheet
The Technology Economic Datasheet, presented in Table21, is an overall evaluation of the technology's capital
investment and production costs in the alternative location
analyzed in this study.
Regional Comparison & Economic Discussion
Figure 14 – CAPEX per Location (USD Million)
Source: Intratec – www.intratec.us
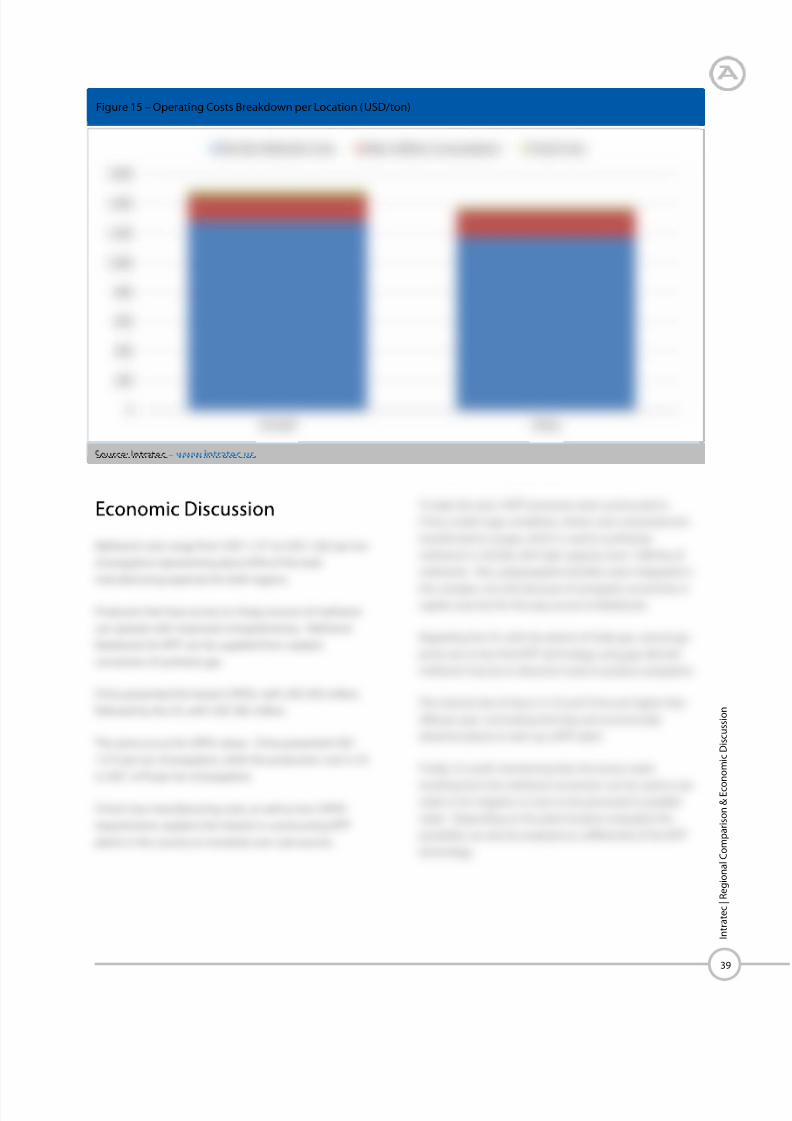
8/20/2019 Propylene production from methanol
http://slidepdf.com/reader/full/propylene-production-from-methanol 43/82
39
I n t r a t e c | R e g i o n a l C o m p a r i s o n & E c o
n o m i c D i s c u s s i o n
Figure 15 – Operating Costs Breakdown per Location (USD/ton)
Source: Intratec – www.intratec.us
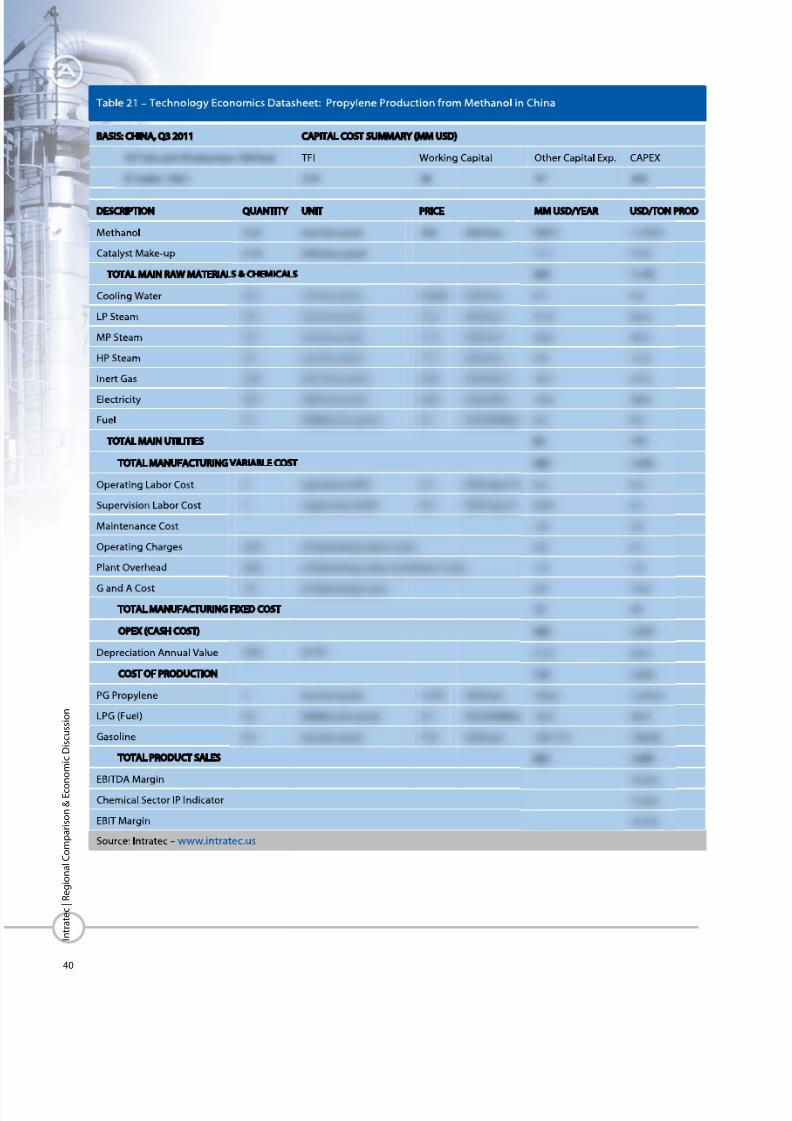
8/20/2019 Propylene production from methanol
http://slidepdf.com/reader/full/propylene-production-from-methanol 44/82
40
I n t r a t e c | R e g i o n a l C o m p a r i s o n & E c o
n o m i c D i s c u s s i o n

8/20/2019 Propylene production from methanol
http://slidepdf.com/reader/full/propylene-production-from-methanol 45/82
41
I n t r a t e c | R e f e r e n c e s
References

8/20/2019 Propylene production from methanol
http://slidepdf.com/reader/full/propylene-production-from-methanol 46/82
42
I n t r a t e c | A c r o n y m s , L e g e n d s & O b s e r v a t i o n s
AACE: American Association of Cost Engineers
AOE2012: US Energy Information Administration's AnnualEnergy Outlook 2012
C: Distillation, stripper, scrubber columns (e.g., C-101 would
denote a column tag)
C2, C3, ... Cn: Hydrocarbons with "n" number of carbon
atoms
C2=, C3=, ... Cn=: Alkenes with "n" number of carbon atoms
CAPEX: Capital Expenditures
CC: Distillation column condenser
CG: Chemical grade
CP: Distillation column reflux pump
CR: Distillation column reboiler
CT: Cooling tower (e.g., CT-801 would denote an
equipment tag)
CV: Distillation column accumulator drum
CW: Cooling water
DME: Dimethyl-ether
DTP: Dominant Technology for Propylene
E: Heat exchangers, heaters, coolers, condensers, reboilers
(e.g., E-101 would denote a heat exchanger tag)
EBIT: Earnings before Interest and Taxes
EBITDA: Earnings before Interests, Taxes, Depreciation and
Amortization
F: Furnaces, fired heaters (e.g., F-101 would denote a
furnace tag)
FCC: Fluid catalytic cracking
HP ST: High-pressure steam
IC Index: Intratec Chemical Plant Construction Index
IP Indicator: Intratec Chemical Sector Profitability Indicator
IRR: Internal Return Rate
ISBL: Inside battery limits
K: Compressors, blowers, fans (e.g., K-101 would denote a
compressor tag)
kta: thousands metric tons per year
LP ST: Low-pressure steam
LPG: Liquefied petroleum gas
MP ST: Medium-pressure steam
MTG: Methanol-to-Gasoline
MTO: Methanol-to-Olefins
MTP: Methanol-to-Propylene
NGL: Natural gas liquids
NPV: Net Present Value
OPEX: Operational Expenditures
OSBL: Outside battery limits
P: Pumps (e.g., P-101 would denote a pump tag)
PDH: Propane Dehydrogenation
PG: Polymer grade
R: Reactors, treaters (e.g., R-101 would denote a reactor tag)
RF: Refrigerant (Flowsheet) or Refrigeration Unit (e.g., RF-
801 would denote an equipment tag)
RG: Refinery grade
SB: Steam boiler (e.g., SB-801 would denote an equipment
tag)
ST: Steam
Syn-gas: Synthesis gas
T: Tanks (e.g., T-101 would denote a tank tag)
TFI: Total Fixed Investment
TPC: Total process cost
V: Horizontal or vertical drums, vessels (e.g., V-101 would
denote a vessel tag)
WD: Demineralized water (Flowsheet) or Demineralizer
(e.g., WD-801 would denote an equipment tag)
WP: Process water
X: Special equipment (e.g., X-101 would denote a special
equipment tag)
Obs.: 1 ton = 1 metric ton = 1,000 kg
Acronyms, Legends & Observations
8/20/2019 Propylene production from methanol
http://slidepdf.com/reader/full/propylene-production-from-methanol 47/82
43
I n t r a t e c | T e c h n o l o g y E c o n o m i c s M e t h o d o l o g y
Intratec Technology Economics methodology
ensures a holistic, coherent and consistenttechno-economic evaluation, ensuring a clear
understanding of a specific mature chemical
process technology.
Introduction
The same general approach is used in the development of
all Technology Economics assignments. To know more
about Intratec’s methodology, see Figure 16.
While based on the same methodology, all TechnologyEconomics studies present uniform analyses with identical
structures, containing the same chapters and similar tables
and charts. This provides confidence to everyone interested
in Intratec’s services since they will know upfront what they
will get.
Workflow
Once the scope of the study is fully defined and
understood, Intratec conducts a comprehensive
bibliographical research in order to understand technical
aspects involved with the process analyzed.
Subsequently, the Intratec team simultaneously develops
the process description and the conceptual process flow
diagram based on:
a. Patent and technical literature research
b. Non-confidential information provided by technology
licensors
c. Intratec's in-house database
d. Process design skills
Next, all the data collected are used to build a rigorous
steady state process simulation model in Aspen Hysys
and/or Aspen Plus, leading commercial process
flowsheeting software tools.
From this simulation, material balance calculations are
performed around the process, key process indicators are
identified and main equipment listed.
Equipment sizing specifications are defined based on
Intratec's equipment design capabilities and an extensive
use of AspenONE Engineering Software Suite that enables
the integration between the process simulation developed
and equipment design tools. Both equipment sizing and
process design are prepared in conformance with generally
accepted engineering standards.
Then, a cost analysis is performed targeting ISBL & OSBL
fixed capital costs, manufacturing costs, and overall working
capital associated with the examined process technology.
Equipment costs are primarily estimated using Aspen
Process Economic Analyzer (formerly Aspen Icarus)
customized models and Intratec's in-house database.
Cost correlations and, occasionally, vendor quotes of unique
and specialized equipment may also be employed. One of
the overall objectives is to establish Class 3 cost estimates 1
with a minimum design engineering effort.
Next, capital and operating costs are assembled in Microsoft
Excel spreadsheets, and an economic analysis of such
technology is performed.
Finally, two analyses are completed, examining:
a. The total fixed investment in different construction
scenarios, based on the level of integration of the plant
with nearby facilities
b. The capital and operating costs for a second different
plant location
1 These are estimates that form the basis for budget authorization,
appropriation, and/or funding. Accuracy ranges for this class of
estimates are + 10% to + 30% on the high side, and - 10 % to - 20 %
on the low side.
Technology Economics Methodology
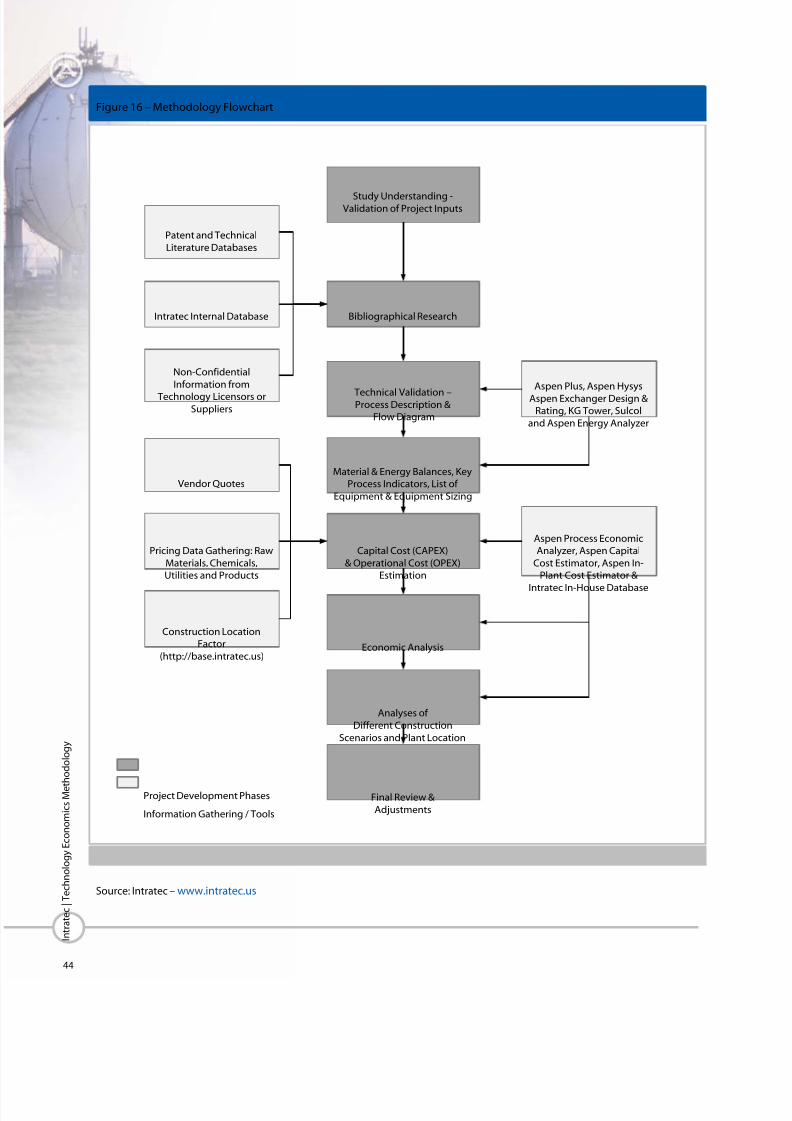
8/20/2019 Propylene production from methanol
http://slidepdf.com/reader/full/propylene-production-from-methanol 48/82
44
I n t r a t e c | T e c h n o l o g y E c o n o m i c s M e t
h o d o l o g y
Figure 16 – Methodology Flowchart
Intratec Internal Database
Non-Confidential
Information from
Technology Licensors orSuppliers
Aspen Plus, Aspen Hysys
Aspen Exchanger Design &
Rating, KG Tower, Sulcol
and Aspen Energy Analyzer
Bibliographical Research
Material & Energy Balances, Key
Process Indicators, List of
Equipment & Equipment Sizing
Capital Cost (CAPEX)
& Operational Cost (OPEX)
Estimation
Patent and Technical
Literature Databases
Pricing Data Gathering: Raw
Materials, Chemicals,
Utilities and Products
Aspen Process Economic
Analyzer, Aspen Capital
Cost Estimator, Aspen In-
Plant Cost Estimator &
Intratec In-House Database
Construction Location
Factor
(http://base.intratec.us)
Project Development Phases
Information Gathering / Tools
Vendor Quotes
Study Understanding -Validation of Project Inputs
Technical Validation –Process Description &
Flow Diagram
Final Review &
Adjustments
Economic Analysis
Analyses of
Different Construction
Scenarios and Plant Location
Source: Intratec – www.intratec.us
8/20/2019 Propylene production from methanol
http://slidepdf.com/reader/full/propylene-production-from-methanol 49/82
45
I n t r a t e c | T e c h n o l o g y E c o n o m i c s M e t h o d o l o g y
Capital & Operating Cost
Estimates
The cost estimate presented in the current study considers
a process technology based on a standardized design
practice, typical of a major chemical company. The specific
design standards employed can have a significant impact
on capital costs.
The basis for the capital cost estimate is that the plant is
considered to be built in a clear field with a typical large
single-line capacity. In comparing the cost estimate hereby
presented with an actual project cost or contractor's
estimate, the following must be considered:
Minor differences or details (many times, unnoticed)
between similar processes can affect cost noticeably.
The omission of process areas in the design considered
may invalidate comparisons with the estimated cost
presented.
Industrial plants may be overdesigned for particular
objectives and situations.
Rapid fluctuation of equipment or construction costs
may invalidate cost estimate.
Equipment vendors or engineering companies may
provide goods or services below profit margins during
economic downturns.
Specific locations may impose higher taxes and fees,
which can impact costs considerably.
In addition, no matter how much time and effort are
devoted to accurately estimating costs, errors may occur
due to the aforementioned factors, as well as cost and labor
changes, construction problems, weather-related issues,
strikes, or other unforeseen situations. This is partially
considered in the project contingency. Finally, it must
always be remembered that an estimated project cost is not
an exact number, but rather is a projection of the probable
cost.
ISBL Investment
The ISBL investment includes the fixed capital cost of the
main processing units of the plant necessary to the
manufacturing of products. The ISBL investment includes
the installed cost of the following items:
Process equipment (e.g., reactors and vessels, heat
exchangers, pumps, compressors, etc.)
Process equipment spares
Housing for process units
Pipes and supports within the main process units
Instruments, control systems, electrical wires and other
hardware
Foundations, structures and platforms
Insulation, paint and corrosion protection
In addition to the direct material and labor costs, the ISBL
addresses indirect costs, such as construction overheads,
including: payroll burdens, field supervision, equipment
rentals, tools, field office expenses, temporary facilities, etc.
OSBL Investment
The OSBL investment accounts for auxiliary items necessary
to the functioning of the production unit (ISBL), but which
perform a supporting and non-plant-specific role. OSBL
items considered may vary from process to process. The
OSBL investment could include the installed cost of the
following items:
Storage and packaging (storage, bagging and a
warehouse) for products, feedstocks and by-products
Steam units, cooling water and refrigeration systems
Process water treating systems and supply pumps
Boiler feed water and supply pumps
Electrical supply, transformers, and switchgear
Auxiliary buildings, including all services and
equipment of: maintenance, stores warehouse,
laboratory, garages, fire station, change house,
cafeteria, medical/safety, administration, etc.
General utilities including plant air, instrument air, inert
gas, stand-by electrical generator, fire water pumps,
etc.
Pollution control, organic waste disposal, aqueous
waste treating, incinerator and flare systems

8/20/2019 Propylene production from methanol
http://slidepdf.com/reader/full/propylene-production-from-methanol 50/82
46
I n t r a t e c | T e c h n o l o g y E c o n o m i c s M e t
h o d o l o g y
Working Capital
For the purposes of this study,2 working capital is defined as
the funds, in addition to the fixed investment, that a
company must contribute to a project. Those funds must
be adequate to get the plant in operation and to meet
subsequent obligations.
The initial amount of working capital is regarded as an
investment item. This study uses the following
items/assumptions for working capital estimation:
Accounts receivable. Products and by-products
shipped but not paid by the customer; it represents
the extended credit given to customers (estimated as a
certain period – in days – of manufacturing expenses
plus depreciation).
Accounts payable. A credit for accounts payable such
as feedstock, catalysts, chemicals, and packaging
materials received but not paid to suppliers (estimated
as a certain period – in days – of manufacturing
expenses).
Product inventory. Products and by-products (if
applicable) in storage tanks. The total amount depends
on sales flow for each plant, which is directly related to
plant conditions of integration to the manufacturing of
product‘s derivatives (estimated as a certain period – in
days – of manufacturing expenses plus depreciation,
defined by plant integration circumstances).
Raw material inventory. Raw materials in storage
tanks. The total amount depends on raw material
availability, which is directly related to plant conditions
of integration to raw material manufacturing
(estimated as a certain period – in days – of raw
material delivered costs, defined by plant integration
circumstances).
In-process inventory. Material contained in pipelines
and vessels, except for the material inside the storage
tanks (assumed to be 1 day of manufacturing
expenses).
Supplies and stores. Parts inventory and minor spare
equipment (estimated as a percentage of total
maintenance materials costs for both ISBL and OSBL).
2 The accounting definition of working capital (total current assets
minus total current liabilities) is applied when considering the
entire company.
Cash on hand. An adequate amount of cash on hand
to give plant management the necessary flexibility to
cover unexpected expenses (estimated as a certain
period – in days – of manufacturing expenses).
Start-up Expenses
When a process is brought on stream, there are certain one-
time expenses related to this activity. From a time
standpoint, a variable undefined period exists between the
nominal end of construction and the production of quality
product in the quantity required. This period is commonly
referred to as start-up.
During the start-up period expenses are incurred for
operator and maintenance employee training, temporary
construction, auxiliary services, testing and adjustment of
equipment, piping, and instruments, etc. Our method of
estimating start-up expenses consists of four components:
Labor component. Represents costs of plant crew
training for plant start-up, estimated as a certain
number of days of total plant labor costs (operators,
supervisors, maintenance personnel and laboratory
labor).
Commercialization cost. Depends on raw materials
and products negotiation, on how integrated the plant
is with feedstock suppliers and consumer facilities, and
on the maturity of the technology. It ranges from 0.5%
to 5% of annual manufacturing expenses.
Start-up inefficiency. Takes into account those
operating runs when production cannot be
maintained or there are false starts. The start-up
inefficiency varies according to the process maturity:
5% for new and unproven processes, 2% for new and
proven processes, and 1% for existing licensed
processes, based on annual manufacturing expenses.
Unscheduled plant modifications. A key fault that
can happen during the start-up of the plant is the risk
that the product(s) may not meet specificationsrequired by the market. As a result, equipment
modifications or additions may be required.
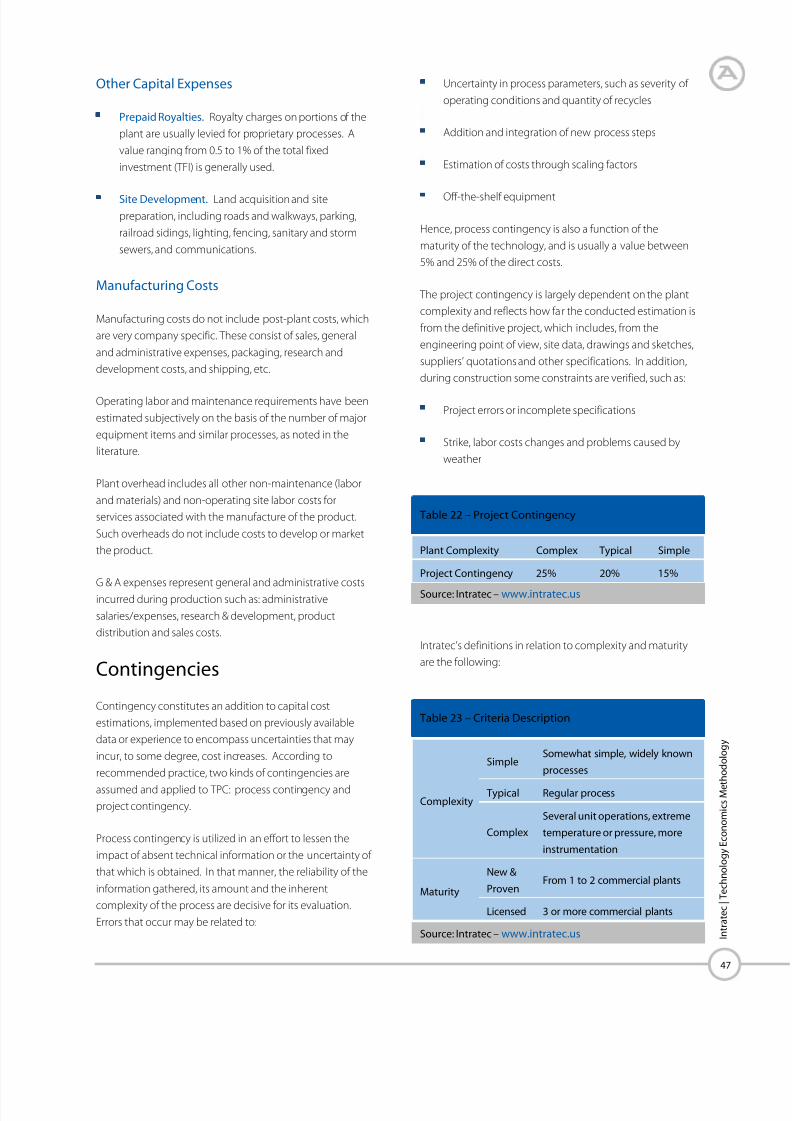
8/20/2019 Propylene production from methanol
http://slidepdf.com/reader/full/propylene-production-from-methanol 51/82
47
I n t r a t e c | T e c h n o l o g y E c o n o m i c s M e t h o d o l o g y
Other Capital Expenses
Prepaid Royalties. Royalty charges on portions of the
plant are usually levied for proprietary processes. A
value ranging from 0.5 to 1% of the total fixed
investment (TFI) is generally used.
Site Development. Land acquisition and site
preparation, including roads and walkways, parking,
railroad sidings, lighting, fencing, sanitary and storm
sewers, and communications.
Manufacturing Costs
Manufacturing costs do not include post-plant costs, which
are very company specific. These consist of sales, general
and administrative expenses, packaging, research and
development costs, and shipping, etc.
Operating labor and maintenance requirements have been
estimated subjectively on the basis of the number of major
equipment items and similar processes, as noted in the
literature.
Plant overhead includes all other non-maintenance (labor
and materials) and non-operating site labor costs for
services associated with the manufacture of the product.
Such overheads do not include costs to develop or market
the product.
G & A expenses represent general and administrative costs
incurred during production such as: administrative
salaries/expenses, research & development, product
distribution and sales costs.
Contingencies
Contingency constitutes an addition to capital cost
estimations, implemented based on previously available
data or experience to encompass uncertainties that may
incur, to some degree, cost increases. According to
recommended practice, two kinds of contingencies are
assumed and applied to TPC: process contingency and
project contingency.
Process contingency is utilized in an effort to lessen the
impact of absent technical information or the uncertainty of
that which is obtained. In that manner, the reliability of the
information gathered, its amount and the inherent
complexity of the process are decisive for its evaluation.
Errors that occur may be related to:
Uncertainty in process parameters, such as severity of
operating conditions and quantity of recycles
Addition and integration of new process steps
Estimation of costs through scaling factors
Off-the-shelf equipment
Hence, process contingency is also a function of the
maturity of the technology, and is usually a value between
5% and 25% of the direct costs.
The project contingency is largely dependent on the plant
complexity and reflects how far the conducted estimation is
from the definitive project, which includes, from the
engineering point of view, site data, drawings and sketches,
suppliers’ quotations and other specifications. In addition,
during construction some constraints are verified, such as:
Project errors or incomplete specifications
Strike, labor costs changes and problems caused by
weather
Intratec’s definitions in relation to complexity and maturity
are the following:
Complexity
SimpleSomewhat simple, widely known
processes
Typical Regular process
Complex
Several unit operations, extreme
temperature or pressure, more
instrumentation
Maturity
New &
ProvenFrom 1 to 2 commercial plants
Licensed 3 or more commercial plants
Table 22 – Project Contingency
Plant Complexity Complex Typical Simple
Project Contingency 25% 20% 15%
Source: Intratec – www.intratec.us
Table 23 – Criteria Description
Source: Intratec – www.intratec.us

8/20/2019 Propylene production from methanol
http://slidepdf.com/reader/full/propylene-production-from-methanol 52/82
48
I n t r a t e c | T e c h n o l o g y E c o n o m i c s M e t
h o d o l o g y
Accuracy of Economic Estimates
The accuracy of estimates gives the realized range of plant
cost. The reliability of the technical information available is
of major importance.
The non-uniform spread of accuracy ranges (+30 to – 20 %,
rather than ±25%, e.g.) is justified by the fact that the
unavailability of complete technical information usually
results in under estimating rather than over estimating
project costs.
Location Factor
A location factor is an instantaneous, total cost factor used
for converting a base project cost from one geographic
location to another.
A properly estimated location factor is a powerful tool, bothfor comparing available investment data and evaluating
which region may provide greater economic attractiveness
for a new industrial venture. Considering this, Intratec has
developed a well-structured methodology for calculating
Location Factors, and the results are presented for specific
regions’ capital costs comparison.
Intratec’s Location Factor takes into consideration the
differences in productivity, labor costs, local steel prices,
equipment imports needs, freight, taxes and duties on
imported and domestic materials, regional business
environments and local availability of sparing equipment.For such analyses, all data were taken from international
statistical organizations and from Intratec’s database.
Calculations are performed in a comparative manner, taking
a US Gulf Coast-based plant as the reference location. The
final Location Factor is determined by four major indexes:
Business Environment, Infrastructure, Labor, and Material.
The Business Environment Factor and the Infrastructure
Factor measure the ease of new plant installation in
different countries, taking into consideration the readiness
of bureaucratic procedures and the availability and quality
of ports or roads.
Labor and material, in turn, are the fundamental
components for the construction of a plant and, for this
reason, are intrinsically related to the plant costs. This
concept is the basis for the methodology, which aims to
represent the local discrepancies in labor and material.
Productivity of workers and their hourly compensation are
important for the project but, also, the qualification of
workers is significant to estimating the need for foreign
labor.
On the other hand, local steel prices are similarly important,
since they are largely representative of the costs of
structures, piping, equipment, etc. Considering the
contribution of labor in these components, workers’
qualifications are also indicative of the amount that needs
to be imported. For both domestic and imported materials,
a Spare Factor is considered, aiming to represent the need
for spare rotors, seals and parts of rotating equipment.
The sum of the corrected TFI distribution reflects the relative
cost of the plant, this sum is multiplied by the Infrastructure
and the Business Environment Factors, yielding the Location
Factor.
For the purpose of illustrating the conducted methodology,
a block flow diagram is presented in F igure 17 in which the
four major indexes are presented, along with some of their
components.
Table 24 – Accuracy of Economic Estimates
Reliability Low Moderate HighVery
High
Accuracy+ 30%
- 20%
+ 22%
- 18%
+ 18%
- 14%
+ 10%
- 10%
Source: Intratec – www.intratec.us

8/20/2019 Propylene production from methanol
http://slidepdf.com/reader/full/propylene-production-from-methanol 53/82
49
I n t r a t e c | T e c h n o l o g y E c o n o m i c s M e t h o d o l o g y
Figure 17 – Location Factor Composition
Infrastructure FactorLabor Index
Location Factor
Material IndexBusiness Environment
Factor
Local Labor Index
Relative Salary
Productivity
Expats Labor
Domestic Material Index
Relative Steel Prices
Labor Index
Taxes and Freight
Rates
Spares
Imported Material
Taxes and Freight
Rates
Spares
Ports, Roads, Airports
and Rails (Availability
and Quality)
Communication
Technologies
Warehouse
Infrastructure
Border Clearance
Local Incentives
Readiness of
Bureaucratic
Procedures
Legal Protection of
Investors
Taxes
Source: Intratec – www.intratec.us

8/20/2019 Propylene production from methanol
http://slidepdf.com/reader/full/propylene-production-from-methanol 54/82
50
I n t r a t e c | A p p e n d i x A . M a s s B a l a n c e &
S t r e a m s P r o p e r t i e s

8/20/2019 Propylene production from methanol
http://slidepdf.com/reader/full/propylene-production-from-methanol 55/82
51
I n t r a t e c | A p p e n d i x A . M a s s B a l a n c e & S t r e a m s P r o p e r t i e s
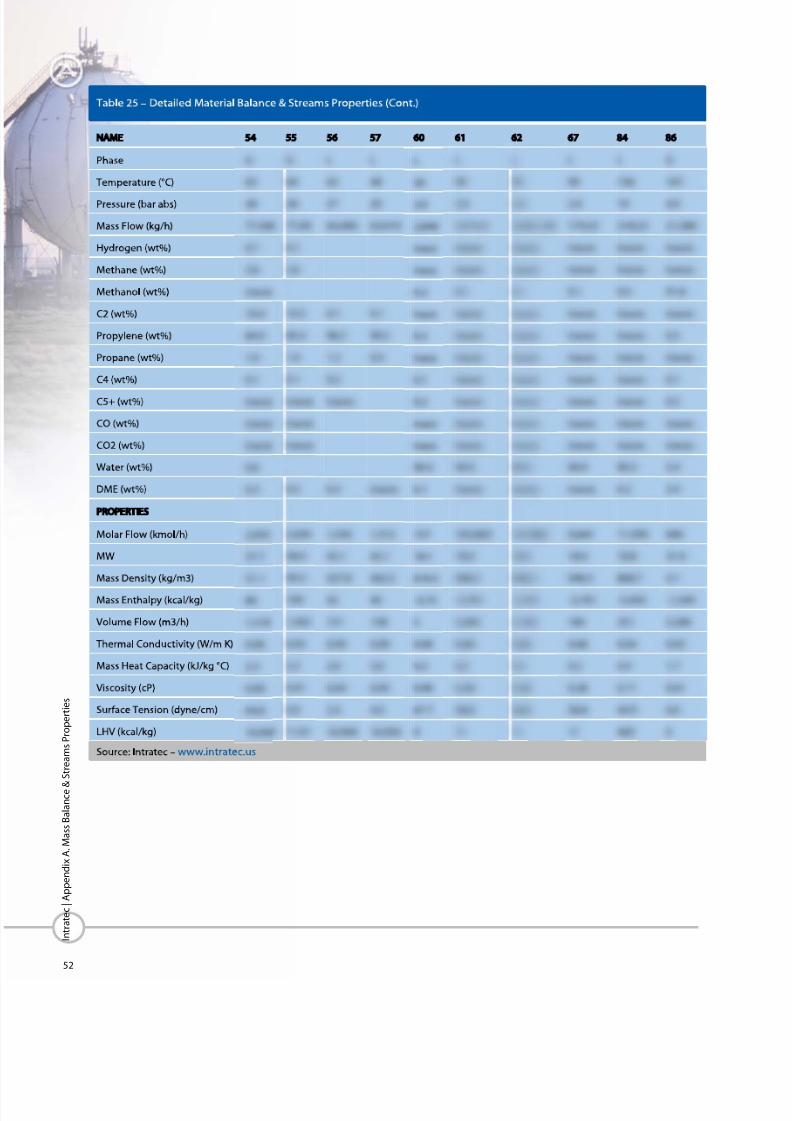
8/20/2019 Propylene production from methanol
http://slidepdf.com/reader/full/propylene-production-from-methanol 56/82
52
I n t r a t e c | A p p e n d i x A . M a s s B a l a n c e &
S t r e a m s P r o p e r t i e s
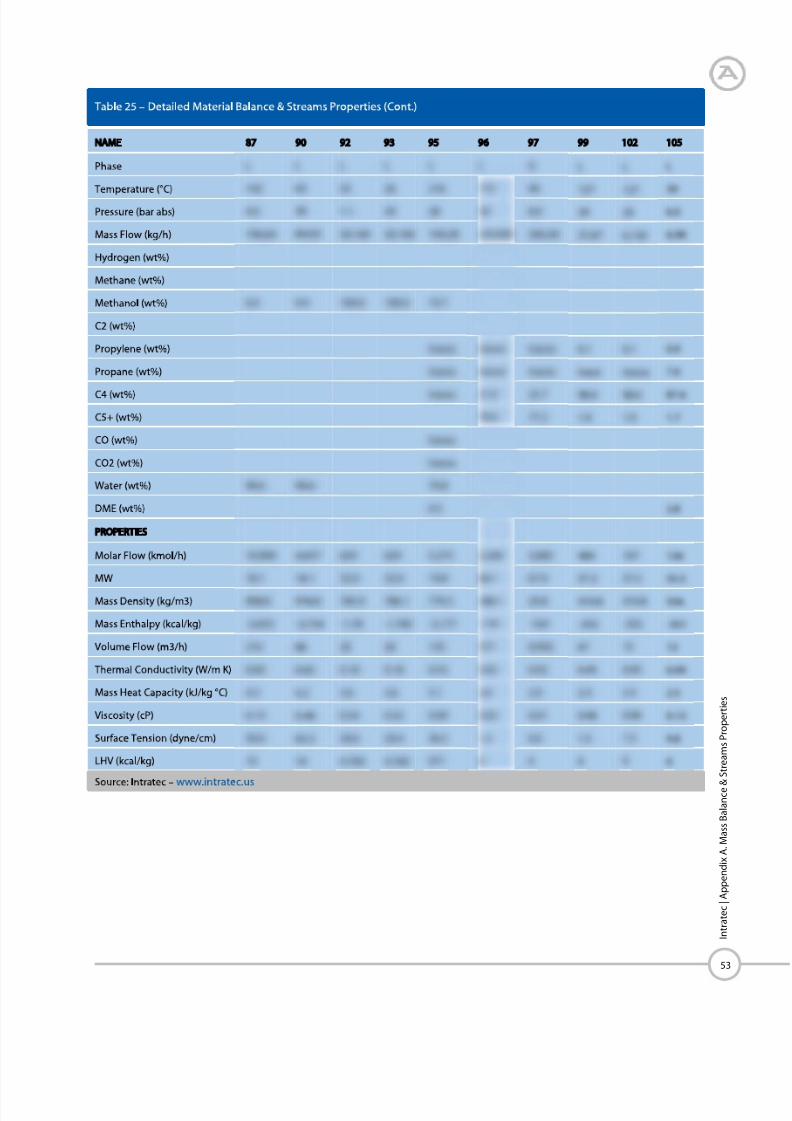
8/20/2019 Propylene production from methanol
http://slidepdf.com/reader/full/propylene-production-from-methanol 57/82
53
I n t r a t e c | A p p e n d i x A . M a s s B a l a n c e & S t r e a m s P r o p e r t i e s
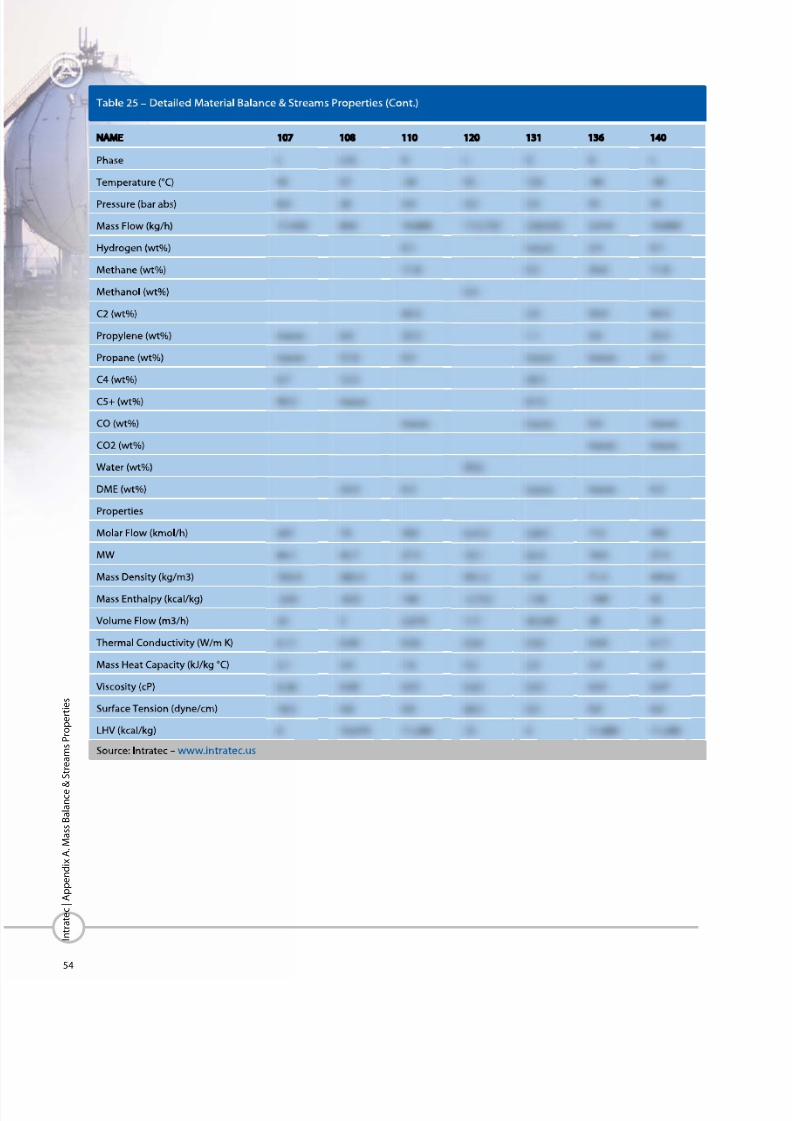
8/20/2019 Propylene production from methanol
http://slidepdf.com/reader/full/propylene-production-from-methanol 58/82
54
I n t r a t e c | A p p e n d i x A . M a s s B a l a n c e &
S t r e a m s P r o p e r t i e s
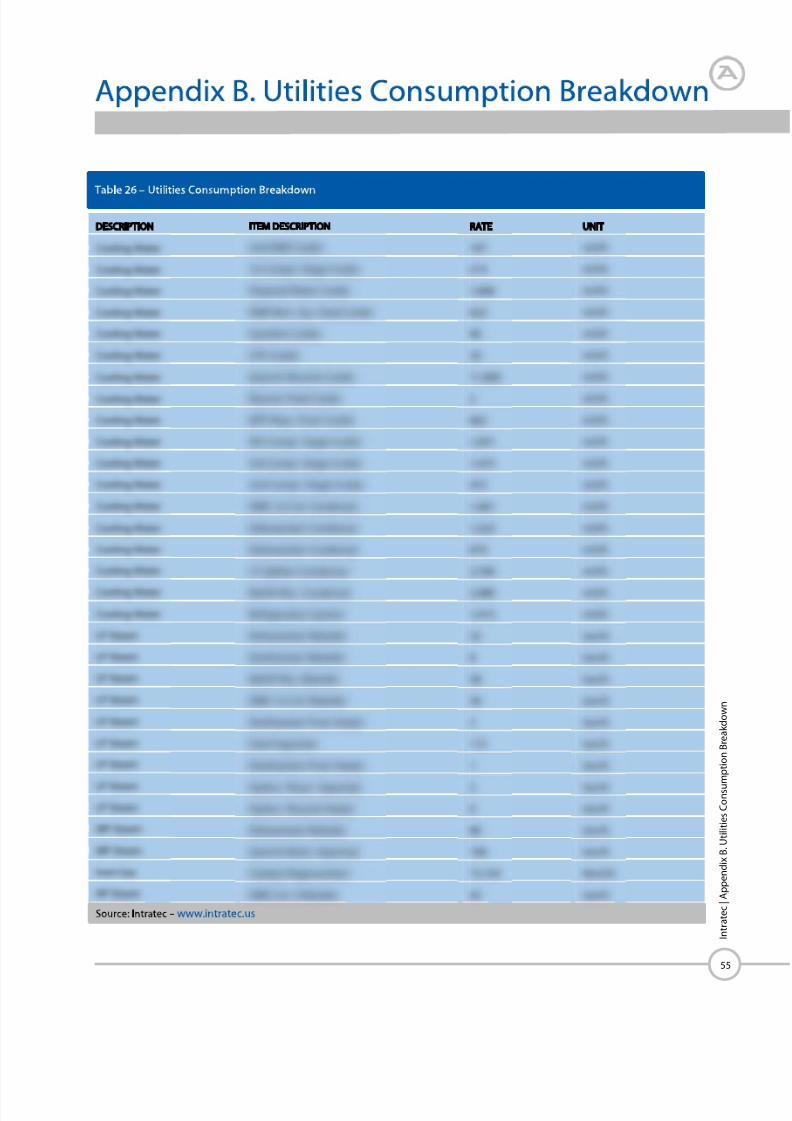
8/20/2019 Propylene production from methanol
http://slidepdf.com/reader/full/propylene-production-from-methanol 59/82
55
I n t r a t e c | A p p e n d i x B . U t i l i t i e s C o n s u m p t i o n B r e a k d o w n

8/20/2019 Propylene production from methanol
http://slidepdf.com/reader/full/propylene-production-from-methanol 60/82
56
I n t r a t e c | A p p e n d i x C . C a r b o n F o o t p r i n t
The process’ carbon footprint can be defined as the total
amount of greenhouse gas (GHG) emissions caused by the
process operation.
Although it is difficult to precisely account for the total
emissions generated by a process, it is possible to estimate
the major emissions, which can be divided into:
Direct emissions. Emissions caused by process waste
streams combusted in flares.
Indirect emissions. The ones caused by utilities
generation or consumption, such as the emissions due
to using fuel in furnaces for heating process streams.
Fuel used in steam boilers, electricity generation, and
any other emissions in activities to support process
operation are also considered indirect emissions.
In order to estimate the direct emissions, it is necessary to
know the composition of the streams, as well as the
oxidation factor.
Estimation of indirect emissions requires specific data,
which depends on the plant location, such as the local
electric power generation profile, and on the plant
resources, such as the type of fuel used.
The assumptions for the process carbon footprint
calculation are presented in Table 27 and the results are
provided in Table 28
Equivalent carbon dioxide (CO2e) is a measure that
describes the amount of CO2 that would have the same
global warming potential of a given greenhouse gas, when
measured over a specified timescale.
All values and assumptions used in calculations are basedon data provided by the Environment Protection Agency
(EPA) Climate Leaders Program.
Appendix C. Carbon Footprint
Table 27 – Assumptions for CO2e Emissions Calculation
Source: Intratec – www.intratec.us
Table 28 – CO2e Emissions (ton/ton prod.)
Source: Intratec – www.intratec.us
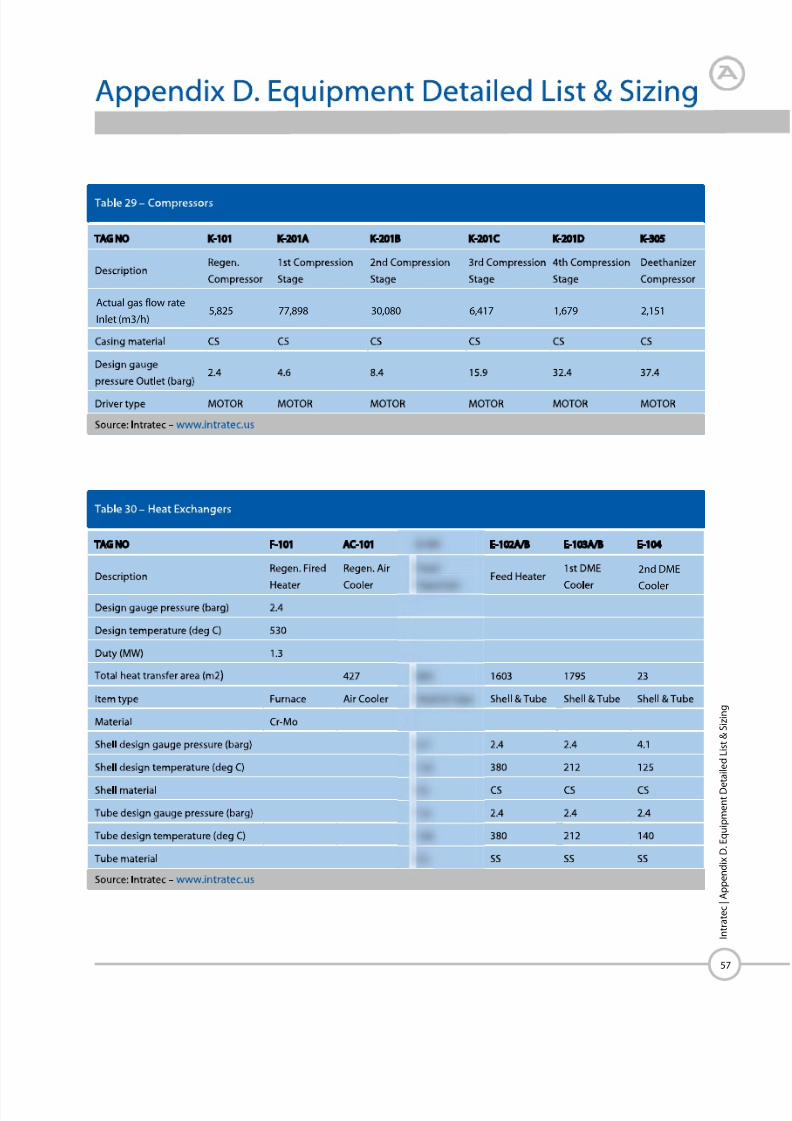
8/20/2019 Propylene production from methanol
http://slidepdf.com/reader/full/propylene-production-from-methanol 61/82
57
I n t r a t e c | A p p e n d i x D . E q u i p m e n t D e
t a i l e d L i s t & S i z i n g
Actual gas flow rate
Inlet (m3/h)5,825 77,898 30,080 6,417 1,679 2,151
2nd DME
Cooler
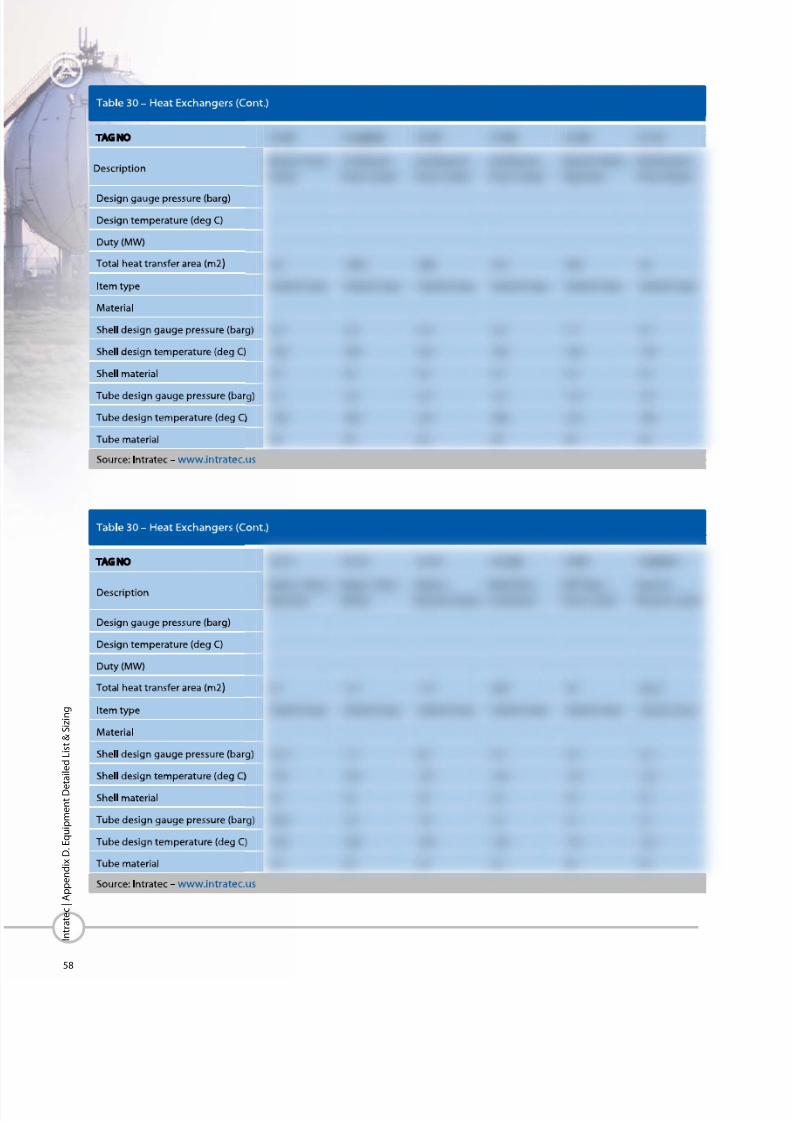
8/20/2019 Propylene production from methanol
http://slidepdf.com/reader/full/propylene-production-from-methanol 62/82
58
I n t r a t e c | A p p e n d i x D . E q u i p m e n t D e t a i l e d L i s t & S i z i n g
8/20/2019 Propylene production from methanol
http://slidepdf.com/reader/full/propylene-production-from-methanol 63/82
59
I n t r a t e c | A p p e n d i x D . E q u i p m e n t D e
t a i l e d L i s t & S i z i n g

8/20/2019 Propylene production from methanol
http://slidepdf.com/reader/full/propylene-production-from-methanol 64/82
60
I n t r a t e c | A p p e n d i x D . E q u i p m e n t D e t a i l e d L i s t & S i z i n g

8/20/2019 Propylene production from methanol
http://slidepdf.com/reader/full/propylene-production-from-methanol 65/82
61
I n t r a t e c | A p p e n d i x D . E q u i p m e n t D e
t a i l e d L i s t & S i z i n g
8/20/2019 Propylene production from methanol
http://slidepdf.com/reader/full/propylene-production-from-methanol 66/82
62
I n t r a t e c | A p p e n d i x D . E q u i p m e n t D e t a i l e d L i s t & S i z i n g
Design gauge pressure
(barg)

8/20/2019 Propylene production from methanol
http://slidepdf.com/reader/full/propylene-production-from-methanol 67/82
63
I n t r a t e c | A p p e n d i x D . E q u i p m e n t D e
t a i l e d L i s t & S i z i n g
8/20/2019 Propylene production from methanol
http://slidepdf.com/reader/full/propylene-production-from-methanol 68/82
64
I n t r a t e c | A p p e n d i x D . E q u i p m e n t D e t a i l e d L i s t & S i z i n g

8/20/2019 Propylene production from methanol
http://slidepdf.com/reader/full/propylene-production-from-methanol 69/82
65
I n t r a t e c | A p p e n d i x D . E q u i p m e n t D e
t a i l e d L i s t & S i z i n g
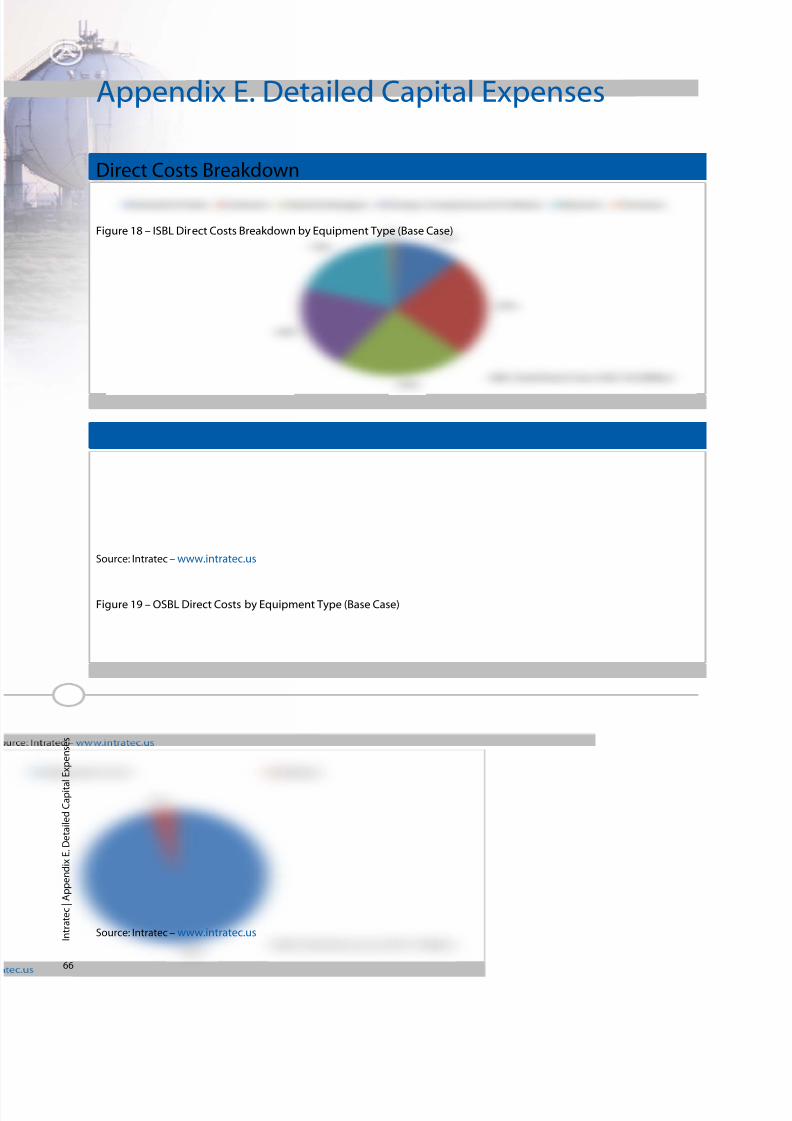
8/20/2019 Propylene production from methanol
http://slidepdf.com/reader/full/propylene-production-from-methanol 70/82
66
I n t r a t e c | A p p e n d i x E . D e t a i l e d C a p i t a
l E x p e n s e s
Direct Costs Breakdown
Appendix E. Detailed Capital Expenses
Figure 18 – ISBL Direct Costs Breakdown by Equipment Type (Base Case)
Source: Intratec – www.intratec.us
Figure 19 – OSBL Direct Costs by Equipment Type (Base Case)
Source: Intratec – www.intratec.us
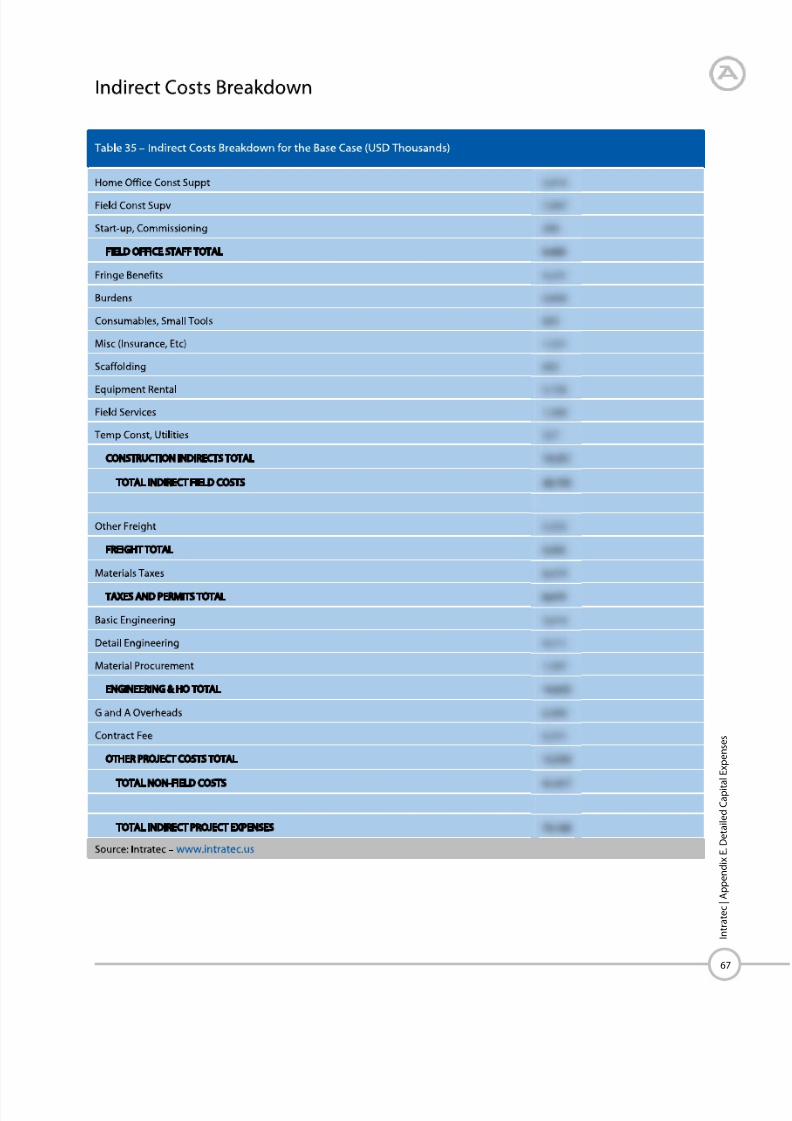
8/20/2019 Propylene production from methanol
http://slidepdf.com/reader/full/propylene-production-from-methanol 71/82
67
I n t r a t e c | A p p e n d i x E . D e t a i l e d C a p i t a l E x p e n s e s

8/20/2019 Propylene production from methanol
http://slidepdf.com/reader/full/propylene-production-from-methanol 72/82
68
I n t r a t e c | A p p e n d i x F . E c o n o m i c A s s u
m p t i o n s
Capital Expenditures
For a better description of working capital and other capital
expenses components, as well as the location factors
methodology, see the chapter “Technology Economics
Methodology.”
Construction Location Factors
Working Capital
Supplies and
Stores
Appendix F. Economic Assumptions
Table 36 – Detailed Construction Location Factor
Source: Intratec – www.intratec.us
Table 37 – Working Capital Assumptions (Base Case)
Source: Intratec – www.intratec.us
Table 38 – Other Capital Expenses Assumptions (Base
Case)
Source: Intratec – www.intratec.us

8/20/2019 Propylene production from methanol
http://slidepdf.com/reader/full/propylene-production-from-methanol 73/82
69
I n t r a t e c | A p p e n d i x F . E c o n o m i c A s s u
m p t i o n s
Operational Expenses
Fixed Costs
Fixed costs are estimated based on the specific
characteristics of the process. The fixed costs, like operating
charges and plant overhead, are typically calculated as apercentage of the industrial labor costs, and G & A expenses
are added as a percentage of the operating costs.
The goal of depreciation is to allow a credit against
manufacturing costs, and hence taxes, for the non-
recoverable capital expenses of an investment. The
depreciable portion of capital expense is the total fixed
investment.
Table 40 shows the project depreciation value and the
assumptions used in its calculation.
Table 39 – Other Fixed Cost Assumptions
Source: Intratec –www.intratec.us
Table 40 – Depreciation Value & Assumptions
Source: Intratec – www.intratec.us

8/20/2019 Propylene production from methanol
http://slidepdf.com/reader/full/propylene-production-from-methanol 74/82
70
I n t r a t e c | A p p e n d i x G . R e l e a s e d P u b l i c a t i o n s
The list below is intended to be an easy and quick way to
identify Intratec reports of interest. For a more complete
and up-to-date list, please visit the Publications section on
our website, www.intratec.us.
TECHNOLOGY ECONOMICS
Propylene Production via Metathesis: Propylene
production via metathesis from ethylene and butenes,
in a process similar to Lummus OCT.
Propylene Production via Propane
Dehydrogenation: Propane dehydrogenation (PDH)
process conducted in moving bed reactors, in a
process similar to UOP OLEFLEX™.
Propylene Production from Methanol: Propylene
production from methanol, in a process is similar to
Lurgi MTP®.
Polypropylene Production via Gas Phase Process: A
gas phase type process similar to the Dow UNIPOL™ PP
process to produce both polypropylene homopolymer
and random copolymer.
Polypropylene Production via Gas Phase Process,
Part 2: A gas phase type process similar to Lummus
NOVOLEN® for production of both homopolymer and
random copolymer.
Sodium Hypochlorite Chemical Production: Sodium
hypochlorite (bleach) production, in a widely used
industrial process, similar to that employed by Solvay
Chemicals, for example.
Propylene Production via Propane
Dehydrogenation, Part 2: Propane dehydrogenation
(PDH) in fixed bed reactors, in a process is similar to
Lummus CATOFIN®.
Propylene Production via Propane
Dehydrogenation, Part 3: Propane dehydrogenation
(PDH) by applying oxydehydrogenation, in a process
similar to the STAR PROCESS® licensed by Uhde.
CONCEPTUAL DESIGN
Membranes on Polyolefins Plants Vent Recovery:
The Report evaluates membrane units for the
separation of monomer and nitrogen in PP plants,
similar to the VaporSep® system commercialized by
MTR.
Use of Propylene Splitter to Improve Polypropylene
Business: The report assesses the opportunity of
purchasing the less valued RG propylene to produce
the PG propylene raw material used in a PP plant.
Appendix G. Released Publications
8/20/2019 Propylene production from methanol
http://slidepdf.com/reader/full/propylene-production-from-methanol 75/82
Appendix H.
Technology Economics Form
Submitted by Client
Appendix H. Technology Economics FormSubmitted by Client
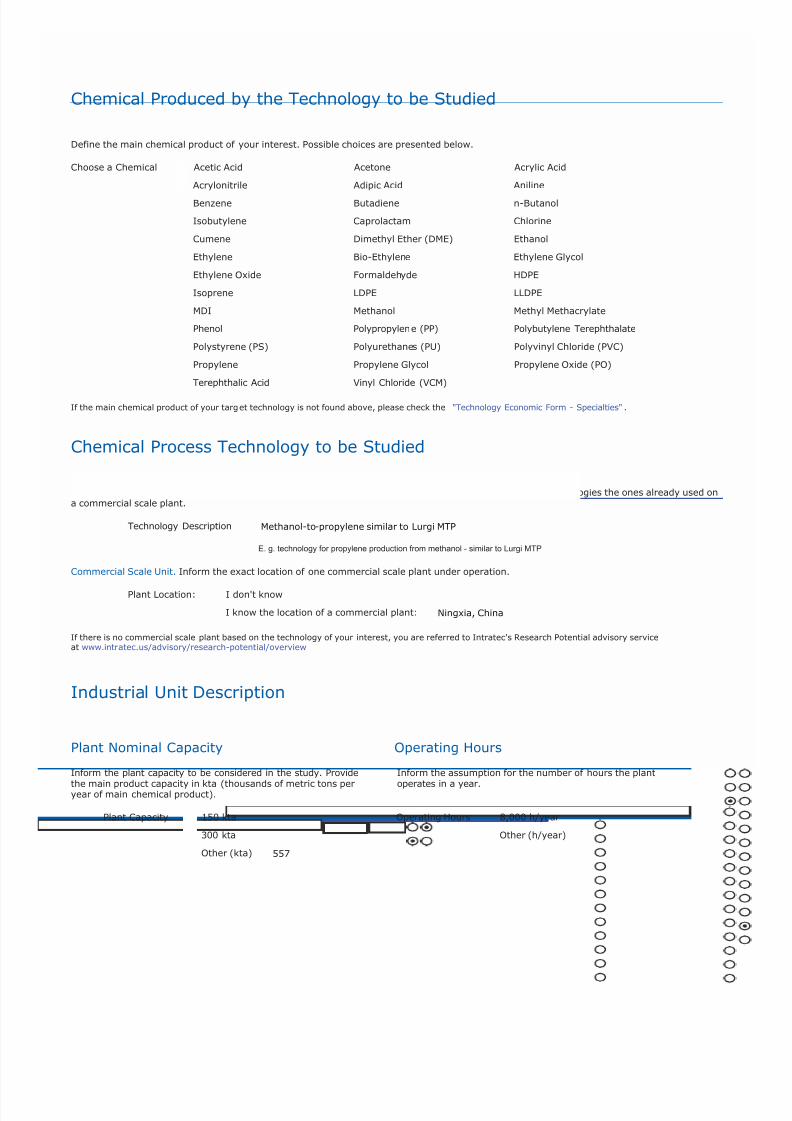
8/20/2019 Propylene production from methanol
http://slidepdf.com/reader/full/propylene-production-from-methanol 76/82
Chemical Produced by the Technology to be Studied
Define the main chemical product of your interest. Possible choices are presented below.
Choose a Chemical Acetic Acid Acetone Acrylic Acid
Acrylonitrile Adipic Acid Aniline
Benzene Butadiene n-Butanol
Isobutylene Caprolactam Chlorine
Cumene Dimethyl Ether (DME) Ethanol
Ethylene Bio-Ethylene Ethylene Glycol
Ethylene Oxide Formaldehyde HDPE
Isoprene LDPE LLDPE
MDI Methanol Methyl Methacrylate
Phenol Polypropylene (PP) Polybutylene Terephthalate
Polystyrene (PS) Polyurethanes (PU) Polyvinyl Chloride (PVC)
Propylene Propylene Glycol Propylene Oxide (PO)
Terephthalic Acid Vinyl Chloride (VCM)
If the main chemical product of your target technology is not found above, please check the "Technology Economic Form - Specialties".
Chemical Process Technology to be Studied
Identify the mature chemical process technology you would like us to assess. Intratec considers mature technologies the ones already used ona commercial scale plant.
Technology Description
E. g. technology for propylene production from methanol - similar to Lurgi MTP
Commercial Scale Unit. Inform the exact location of one commercial scale plant under operation.
Plant Location: I don't know
I know the location of a commercial plant:
If there is no commercial scale plant based on the technology of your interest, you are referred to Intratec's Research Potential advisory serviceat www.intratec.us/advisory/research-potential/overview
Industrial Unit Description
Plant Nominal Capacity Operating Hours
Inform the plant capacity to be considered in the study. Provide
the main product capacity in kta (thousands of metric tons peryear of main chemical product).
Inform the assumption for the number of hours the plant
operates in a year.
Plant Capacity 150 kta
300 kta
Other (kta)
Operating Hours 8,000 h/year
Other (h/year)
Methanol-to-propylene similar to Lurgi MTP
Ningxia, China
557
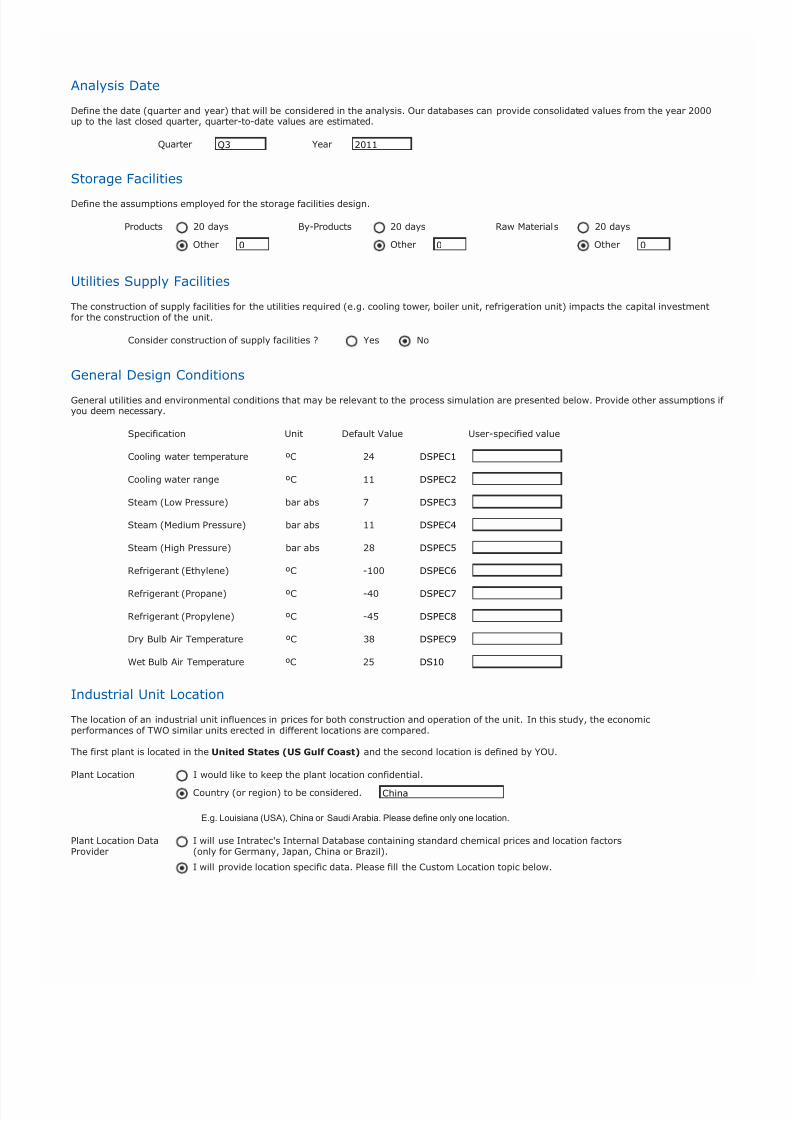
8/20/2019 Propylene production from methanol
http://slidepdf.com/reader/full/propylene-production-from-methanol 77/82
Analysis Date
Define the date (quarter and year) that will be considered in the analysis. Our databases can provide consolidated values from the year 2000up to the last closed quarter, quarter-to-date values are estimated.
Quarter Year
Storage Facilities
Define the assumptions employed for the storage facilities design.
Products 20 days
Other
By-Products 20 days
Other
Raw Materials 20 days
Other
Utilities Supply Facilities
The construction of supply facilities for the utilities required (e.g. cooling tower, boiler unit, refrigeration unit) impacts the capital investmentfor the construction of the unit.
Consider construction of supply facilities ? Yes No
General Design Conditions
General utilities and environmental conditions that may be relevant to the process simulation are presented below. Provide other assumptions if you deem necessary.
Specification Unit Default Value User-specified value
Cooling water temperature ºC 24 DSPEC1
Cooling water range ºC 11 DSPEC2
Steam (Low Pressure) bar abs 7 DSPEC3
Steam (Medium Pressure) bar abs 11 DSPEC4
Steam (High Pressure) bar abs 28 DSPEC5
Refrigerant (Ethylene) ºC -100 DSPEC6
Refrigerant (Propane) ºC -40 DSPEC7
Refrigerant (Propylene) ºC -45 DSPEC8
Dry Bulb Air Temperature ºC 38 DSPEC9
Wet Bulb Air Temperature ºC 25 DS10
Industrial Unit Location
The location of an industrial unit influences in prices for both construction and operation of the unit. In this study, the economicperformances of TWO similar units erected in different locations are compared.
The first plant is located in the United States (US Gulf Coast) and the second location is defined by YOU.
Plant Location I would like to keep the plant location confidential.
Country (or region) to be considered.
E.g. Louisiana (USA), China or Saudi Arabia. Please define only one location.
Plant Location DataProvider
I will use Intratec's Internal Database containing standard chemical prices and location factors(only for Germany, Japan, China or Brazil).
I will provide location specific data. Please fill the Custom Location topic below.
Q3 2011
0 0 0
China

8/20/2019 Propylene production from methanol
http://slidepdf.com/reader/full/propylene-production-from-methanol 78/82
Custom Location Description. Describe both capital investment and prices at your custom location.
A) Capital Investment. Provide the relative capital cost at your custom location in comparison to the United States (U.S. Gulf Coast)
Custom Location Relative Cost (%)
130% means that the capital costs in the custom location are 30% higher than the costs in the United States.
B) Raw Materials Prices. Describe the raw material prices to be considered in the custom location.
Item Description Price Unit Price
Raw1 RU1 RP1
Raw2 RU2 RP2
Raw3 RU3 RP3
E.g. Propane USD/metric ton 420
C) Product Prices. Describe the products prices to be considered in the custom location.
Item Description Price Unit Price
Prod1 PU1 PP1
Prod2 PU2 PP2
Prod3 PU3 PP3
E.g. Polypropylene USD/metric ton 1700
D) Utilities Prices. Describe the utilities prices to be considered in the custom location.
Item Description Price Unit Price
Electricity UP1
Steam (Low Pressure) UP2
Steam (High Pressure) UP3
Fuel UP4
Clarified Water UP5
Util6 UU6 YP6
Util7 UU7 UP7
Util8 UU8 UP8
E) Labor Prices. Describe the labor prices to be considered in the custom location.
Item Description Price Unit Price
Operating Labor USD/operator/hour LP1
Supervision Labor USD/supervisor/hour LP1
F) Others. Describe any other price you deem necessary to be considered in the custom location.
Item Description Price Unit Price
Other1 OU1 OP1
Other2 OU2 OP2
Other3 OU3 OP3
E.g. Catalyst USD/metric ton 5000
Methanol USD/ton
PG Propylene USD/ton
Gasoline USD/ton
USD/kWh
USD/ton
USD/ton
USD/MMBtu
8/20/2019 Propylene production from methanol
http://slidepdf.com/reader/full/propylene-production-from-methanol 79/82
Other Remarks
If you have any other comments, feel free to write them below:
Comments:
Complementary Files
Along with this form, you may also upload any other chemical document deemed relevant for the description of the project, such asarticles, brochures, book sections, patents, etc. Multiple files may be uploaded.
If you are filling this form offline please upload this form and any complementary files at www.intratec.us/advisory/technology-economics/order-commodities
Non-Disclosure Period & Pricing
You can keep your study confidential or get discounts, by allowing Intratec to disclose it to the market as a publication, after anagreed non-disclosure period, starting at the date you place your order.
Choose an Option 6 months 24 months 36 months Never Disclosed
Non-Disclosure Period Price
6 months $8,000 (9 x $899) Save 84% - Payment of our advisory service is conducted
24 months $28,000 (9 x $3,111) Save 44% automatically, in equal and pre-defined installments
36 months $40,000 (11 x $3,636) Save 20% - Every 15 days, an installment will be charged to your
Never Disclosed $50,000 (13 x $3,846) credit card or PayPal account.
Pay Less! Benefit From a 5% Discount
Inform us the email address of the Intratec Agent that introduced you to our advisory services you will benefit from a 5% discount on the totalprice of your service. To know more about Intratec New Business Development Agents, please visit www.intratec.us/be-our-agent.
Intratec Agent Email
Evaluate our Intratec Agent. Your opinion will be kept confidential.
Unsatisfied Neutral Satisfied
Knowledge about Intratecofferings and presentation skills
Kindness and Helpfulness
DOWNLOAD EXAMPLES OF FILLED FORMS HERE.
DOWNLOAD A PDF VERSION OF THIS FORM HERE.
NEED ASSISTANCE ? SEND AN EMAIL TO [email protected].
v.1-mar-13
I provided the main prices I would like to include in my analysis. Please, use Intratec's prices for China in the other fields I havenot filled.

8/20/2019 Propylene production from methanol
http://slidepdf.com/reader/full/propylene-production-from-methanol 80/82

8/20/2019 Propylene production from methanol
http://slidepdf.com/reader/full/propylene-production-from-methanol 81/82
8/20/2019 Propylene production from methanol
http://slidepdf.com/reader/full/propylene-production-from-methanol 82/82
Technology Economics
Standardized advisory services developed
under Intratec’s Consulting as
Publications pioneer approach.
Technology Economics studies answermain questions surrounding process
technologies:
- How is the technology? What are the
main pieces of equipment required?
- What are the raw materials and utilities
consumption rates?
- What are the capital and operating
expenses breakdown?
- What are the economic
indicators?
- In which regions is this
technology more
profitable?
Related Documents