PROPOSING A COMPREHENSIVE FRAMEWORK FOR ITSM EFFICIENCY 2013MASI05 Master’s (Two years) thesis in Informatics (30 credits) Mohammadreza Farmand

Welcome message from author
This document is posted to help you gain knowledge. Please leave a comment to let me know what you think about it! Share it to your friends and learn new things together.
Transcript

PROPOSING A
COMPREHENSIVE
FRAMEWORK FOR ITSM
EFFICIENCY
2013MASI05
Master’s (Two years) thesis in Informatics (30 credits)
Mohammadreza Farmand
Name 1
Name 2

1
Title: Proposing a comprehensive framework for ITSM efficiency Year: 2013
Author: Mohammadreza Farmand
Abstract
Nowadays, the main concern for IT-related service sector in organizations is to improve IT-
Service Management (ITSM) by reducing cost of service in conjunction with growing in their
efficiency and effectiveness. Particularly in IT firms, these concerns are much more imperative
where the ITSM framework is the main section of providing service and feedback to managers.
However, a challenge is that this significant service segment is ineffective by customers (I.e. IT
managers) since IT maintenance and IT operations are unnoticed by IT related research.
Academia together with industry demand a better knowledge and information of IT service
management to work closely in order to improve efficiency and effectiveness of the system
function.
In this research study, it is attempted to review the situation of ITSM framework (I.e., Metrics)
about evaluation method based on Key Performance Indicators (KPIs) and best practices for IT-
Service Management process in DB Schenker and to compare them with other corporations. At
first, the researcher has done an extensive literature review on the earlier works of Metrics for
IT Service Management. After extracting needed information, it is governed in an innovative way
to make it more effective and efficient, then run a case study for better understanding of the real
situation and to compare literature and real world. The researchers mainly choose Swedish
companies as successful companies in IT management to review ITSM framework (i.e. KPIs).
Keywords: Comprehensive framework for ITSM, ITISM metrics, ITIL framework, Quality of
Service

2
Acknowledgements
This master thesis has been written in efficiency of IT Service Management framework at the
Department of IT and Business, University of Borås.
First of all I would like to appreciate Dr. Anders Hjalmarsson who assisted me to conduct my
research properly.
I also would like to thank Nicklas Salomonson Ph.D., an Assistant Professor in Business
Administration at the School of Business and IT, University of Borås, and Hannes Göbel
Doctoral student at School of Business and IT and Director of Innovation Lab in University of
Borås, for the unfailing support, in whole process of writing thesis. The support encouraged me
to discover new methods for challenging with problem and difficulties.
Jun 2013
Mohammadreza Farmand

3
Table of Contents
1. INTRODUCTION .............................................................................................................................................. 7
1.1 BACKGROUND ......................................................................................................................................... 7
1.2 STATEMENT OF PROBLEM .................................................................................................................... 8
1.3 PURPOSE OF THE STUDY AND EXPECTED OUTCOME .................................................................... 8
1.4 RESEARCH QUESTIONS .......................................................................................................................... 9
1.5 TARGET GROUP ....................................................................................................................................... 9
1.6 EXPERIENCE AND BACKGROUND OF AUTHOR ............................................................................. 10
1.7 DELIMITATIONS ..................................................................................................................................... 10
1.8 STRUCTURE OF THE THESIS ............................................................................................................... 11
2 METHODOLOGY ........................................................................................................................................... 12
2.1 RESEARCH PERSPECTIVE .................................................................................................................... 12
2.2 RESEARCH STRATEGY ......................................................................................................................... 13
2.3 DATA COLLECTION METHOD ............................................................................................................. 14
2.3.1 Primary data ...................................................................................................................................... 14
2.3.2 Secondary data .................................................................................................................................. 15
2.4 DATA ANALYSIS PROCEDURES ......................................................................................................... 15
2.5 STRATEGIES FOR VALIDATING FINDINGS ...................................................................................... 16
2.6 RESULT PRESENTATION METHOD .................................................................................................... 17
3 THEORETICAL FRAMES OF REFERENCES ........................................................................................... 18
3.1 KEY CONCEPTS ...................................................................................................................................... 18
3.2 SUBJECT AREAS RELEVANT FOR THE RESEARCH ........................................................................ 19
3.3 PREVIOUS RESEARCH .......................................................................................................................... 20
3.4 RELEVANT LITERATURE SOURCES .................................................................................................. 22
3.5 KNOWLEDGE ON ITSM FRAMEWORKS ............................................................................................ 24
3.6 NEEDS OF ITSM IN ORGANIZATION .................................................................................................. 24
3.6.1 Organizational requests for improvement of ITSM measurement .................................................... 26
3.7 IT SERVICE MANAGEMENT BASED ON THE IT INFRASTRUCTURE LIBRARY ........................ 27
3.7.1 Successful IT Service Management through ITIL process adoption ................................................. 28

4
3.7.2 ITIL V2.0 / V3.0 framework ............................................................................................................. 30
3.7.3 Service support process ..................................................................................................................... 32
3.7.4 Service delivery ................................................................................................................................. 33
3.7.5 Process level of evaluation framework of metrics ............................................................................. 33
3.7.6 Control objectives for information and related technology ............................................................... 38
3.7.7 Benefits of ITIL- ITSM ..................................................................................................................... 39
3.7.8 Metrics for IT service management process ...................................................................................... 40
3.7.9 How to measure business- IT alignments .......................................................................................... 41
3.7.10 Performance Measurements .............................................................................................................. 41
3.7.11 Positive and negative consequence of measurements ........................................................................ 43
3.7.12 PMs Development phase ................................................................................................................... 44
3.8 DECISION MAKING PROCESS ............................................................................................................. 45
3.8.1 Service Quality .................................................................................................................................. 46
3.8.2 Quality management system .............................................................................................................. 47
3.8.3 The new Gaps model ......................................................................................................................... 50
3.8.4 SERVQUAL development ................................................................................................................ 51
3.8.5 SERVQUAL measurement aspects from different views ................................................................. 51
4 EMPRICIAL FOUNDATIONS ....................................................................................................................... 53
4.1 PURPOSE .................................................................................................................................................. 53
4.2 CASE STUDY BACKGROUND .............................................................................................................. 53
4.3 PROCEDURE ............................................................................................................................................ 54
4.4 THE INTERVIEW ..................................................................................................................................... 54
4.5 FINDINGS ................................................................................................................................................. 55
4.5.1 Measuring operation .......................................................................................................................... 56
4.6 STUDY ON COMPREHENSIBLE FRAMEWORK MODEL ................................................................. 59
4.7 EMPIRICAL STUDY RESULTS .............................................................................................................. 61
5 ANALYSIS AND RESULTS............................................................................................................................ 64
5.1 ANALYSIS ................................................................................................................................................ 64
5.2 SOLUTIONS TO ENHANCE ITSM FRAMEWORK EFFICIENCY ..................................................... 66
5.3 RESULT SUMMARY ............................................................................................................................... 68
6 DISCUSSION .................................................................................................................................................... 70
6.1 CONCLUSION .......................................................................................................................................... 70

5
6.2 IMPLICATIONS FOR THE SUBJECT AREA......................................................................................... 70
6.3 EVALUATION .......................................................................................................................................... 71
6.3.1 Method evaluation ............................................................................................................................. 71
6.3.2 Result evaluation ............................................................................................................................... 72
6.4 POSSIBILITIES TO GENERALIZE ......................................................................................................... 72
6.5 IDEAS FOR CONTINUED RESEARCH ................................................................................................. 73
7 REFERENCES .................................................................................................................................................. 75
8 APPENDIXES ................................................................................................................................................... 78
8.1 INCIDENT MANAGEMENT ................................................................................................................... 78
8.1.1 Example of HAVERBLAD IT Management AB .............................................................................. 81
8.2 SERVICE DESK ........................................................................................................................................ 81
8.2.1 Example of Service Desk .................................................................................................................. 85
8.3 CONFIGURATION MANAGEMENT ..................................................................................................... 86
8.3.1 Example of HAVERBLAD IT Management AB .............................................................................. 89
8.4 CHANGE MANAGEMENT ..................................................................................................................... 90
8.4.1 Example of HAVERBLAD IT Management AB .............................................................................. 93
8.5 RELEASE MANAGEMENT .................................................................................................................... 94
8.5.1 Example of HAVERBLAD IT Management AB .............................................................................. 99
8.5.2 Example of Pink Elephant ................................................................................................................. 99
8.5.3 Example of KPI Library .................................................................................................................. 100
8.6 OPERATIONS MANAGEMENT/ICT INFRASTRUCTURE MANAGEMENT .................................. 101
8.7 SERVICE LEVEL MANAGEMENT (SLM) .......................................................................................... 103
8.8 PROBLEM MANAGEMENT ................................................................................................................. 105
8.8.1 Example of HAVERBLAD IT Management AB ............................................................................ 109
8.9 FINANCIAL MANAGEMENT .............................................................................................................. 110
8.10 CAPACITY MANAGEMENT ................................................................................................................ 112
8.10.1 Example of HAVERBLAD IT Management AB ............................................................................ 115
8.11 IT SERVICE CONTINUITY MANAGEMENT ..................................................................................... 115
8.11.1 Example of HAVERBLAD IT Management AB ............................................................................ 118
8.12 AVAILABILITY MANAGEMENT ........................................................................................................ 119
8.13 SECURITY MANAGEMENT ................................................................................................................ 123

6
8.14 BUSINESS PERSPECTIVE METRICS .................................................................................................. 125
8.15 CONTINUOUS SERVICE IMPROVEMENT PROGRAMS (SIP) ........................................................ 129
8.16 RISK MANAGEMENT ........................................................................................................................... 131
8.17 DOCUMENTATION MANAGEMENT ................................................................................................. 134
8.18 COMPETENCE, AWARENESS AND TRAINING (CAT) ................................................................... 137
8.19 METRICS FOR PROGRAM AND PROJECT MANAGEMENT .......................................................... 140
8.20 EXAMPLE OF OTHER METRICS ........................................................................................................ 142

7
1. INTRODUCTION
The main purpose of this chapter is to describe the problem and to have an overall view on the
study. In this chapter, first the author describes the background of the topic and secondly, the
reasons that persuaded the author in the selection process.
1.1 Background
In today’s highly competitive business environment, information plays an important role.
Companies need to derive and share information as much as possible in an efficient way. This
resource nourishes other resources of the company and it is an infrastructure for many other
activities of the business. IT provides a standard operating environment to conduct these business
activities.
As IT environment grows, its management becomes much more difficult and complex due to the
volume and complexity of its hardware and software applications (Kumbakara 2008). In this
complex environment many issues should be considered to increase the efficiency and
effectiveness of the system. IT Service Management (ITSM) has been shaped to manage this
complex environment with incorporating different management methods. According to
(Mesquida, Mas et al. 2012): “ITSM is a process-oriented discipline which combines process
management and industry’s best practices into a standard approach for optimizing IT services”.
ITSM nowadays is considered as a key issue in the IT area (McNaughton, Ray et al. 2010). With
a comprehensive management framework, organizations would integrate and centralize different
IT operations.
Academics and practitioners have tried to make some standards for ITSM. Some examples of
these Standards are: ITIL (Information technology infrastructure library), ISO/IEC 20000,
COBIT (Control objectives for information and related technology) and DMTF (Distributed
management task force). The main task of all of these standards is to deliver the best quality IT
service to the customers and fulfill the business needs and requirements.
In each of these standards, many methods and measurements are introduced to assess the IT
operations and to help them increase the efficiency and effectiveness of the system. Measuring
the performance of IT operations is very important and service measurements play an important
role in ITSM. In this research study, first the author reviews these measurements and then he
tries to interconnect them to each other and orchestrate them for better incorporation onto the
practical environment.

8
1.2 Statement of problem
Although many academics and practitioners have tried to consider ITSM from different
perspectives, this subject needs to be further developed. Increasing the quality of services is the
main concern of many managers in the IT area; and much works have been done previously for
the development of special standards in this area. Publishers of these standards mentioned many
issues for the improvement of IT services. Measuring these services is one of the issues that are
addressed by many academics and practitioners. There are many measurements in these
standards from different views. In some situations, this bulk of measurements make the
incorporation of them harder to incorporation for the managers and experts. This study tries to
review all these measurements and orchestrate them with a different point of view.
1.3 Purpose of the study and expected outcome
In this research study, the author tries to have both theoretical and empirical points of view. At
first, a comprehensive view on ITSM and its different standards is provided. The author tries to
cover all the needed issues for the analysis part. The expectation from the discussions in this part
is to extract measurements for evaluating ITSM performance and use them for the next part. In
the second part of study, the main purpose of author is orchestrating extracted measurements for
increasing the sufficiency of the standards and to find a comprehensive framework for IT service
management efficiency.
Main objectives
- Giving an overview of ITSM and its frameworks.
- Comparison of different frameworks to extract the strengths and weaknesses of them.
- Surveying and assessing the development of ITSM frameworks in selected companies.
To find out the problems and challenges of the ITSM implementations.
- Propose a practical framework to increase the ITSM efficiency.
- Defining and clarifying different ITSM metrics to incorporate them to the framework.
- Propose a comprehensive framework to improve ITSM efficiency.
9
1.4 Research questions In this research study the author tried to design appropriate research questions to fulfill the
objectives of the research. Based on the purposes of this study, the author defined a main
questions and some sub-questions which are mentioned below:
Main question:
How to improve ITSM efficiency in order to make a better contribution to IT industries?
Sub-questions:
What are the operational needs related to ITSM framework and how to improve ITSM
efficiency?
What are the main strength and weakness points of the ITSM Performance in the practical
areas?
What are the Impacts of ITSM-ITIL (best practices) on IT/business operation?
1.5 Target group
The results from this research study can be useful for two groups of people.
1. The academics that their focus is on the IT service management and its various stages
from meaning to implementation phases
First, this research study can be beneficial for academia and researchers who want to increase
their knowledge about ITSM issues and its role in IT area. As mentioned above, one of the main
purposes of this study is to give an overview on ITSM concept. To achieve this, the author
reviewed many academic sources such as different journal papers and books to gather the
appropriate information. Therefore, we can say this research study is a good reference for people
who want to know more about the ITSM from its different definitions and advantages to various
considered issues from different academics.
2. IT managers and specialists who their main consideration is how to implement ITSM-
ITIL (Best-Practice) particularly in IT organizations
Second, in this research the author also considers the practical environment. This task is done
with gathering information from different companies which are pioneers in this area. In this part
different issues from the barriers of implementing ITSM from considering metrics to increase the
efficiency of the system are provided. So people who want to find out how ITSM and its
different issues are considered in practical environment can benefit from this part. So IT
managers who request to find the answer of questions such as: “What skills are needed in order
to make ITSM more effective and efficient in an IT organization?” and “How can ITSM be
managed in an innovative way to make it more useful and operative?” can benefit from this
study.

10
1.6 Experience and background of author The researcher obtained bachelor degree in Information technology, E-commerce from
Australian University of Wollongong in Dubai in 2008, immediately after graduation the author
start took an internship in The Network Center Company in Dubai-UAE. The author served as
the Net Work Administer as his main responsibility and worked with different products as well
as Check Point software which is decrease security complexity and lowers total cost of
ownership and also Extreme Network which provided the solutions for the company’s open
network and provided a platform for improved business agility and different management
products. While working in different project he found his interest in improving IT Service
Management framework in IT corporations. Presently, the researcher is taking Master’s degree in
Informatics with specialization in Co-Design of Business and IT, 120 ECTS at Högskolan i
Boras. By collecting skills and knowledge foundation, through master courses and experiences
from different assignments, the author has the skills and ability in performing research in the
field of informatics.
1.7 Delimitations As mentioned above, in this study the author covers both theoretical and empirical part of the
issue. As many books and articles have been published in the area of ITSM concept the author
has to select some specific parts to review based on his goals. These issues can be summarized
in: The definitions of Information Technology Infrastructure Library (ITIL) and IT Service
Management Framework (ITSM), the needs of comprehensive ITSM framework, advantages of
using ITSM and its different framework and benefits of using ITIL best practice. In practical
part, because of some constraints such as lack of time and companies to undertake survey at, the
author has to limit himself to some limited number of companies for running his empirical part.
So the author limits the empirical part to some interviews and information which he gathered
himself from practical environment.

11
1.8 Structure of the thesis
Introduction
In introduction part, the infrastructure of the
thesis is discussed. Some Issues like the
background of the research, purpose of the
study, research questions and target group are
provided.
Methodology The methods which author applied to his
research study are discussed in methodology
part. The methods for data collection, strategies
for validating the thesis and analysis method
are the parts which are presented by author in
this section.
Theoretical frame of references
In theoretical frame of references chapter, the
author presents concepts which he mentioned
in his goals and makes the theoretical structure
with reviewing previous academic works to
use in analysis part.
Empirical study
In empirical study chapter, the author tries to
gather some practical information about the
ITSM to use in analysis part with running
some interviews with companies.
Analysis
In this part, the author makes connection
between theoretical and empirical part.
Different information gathered from theoretical
and empirical part will be analyzed in this part
with using mentioned methodologies.
Discussion
In discussion section, the conclusion of the
study and its implication are provided by the
author. Moreover, in this part the researcher
evaluates the research and presents ideas for
developing the concept.
Table1 Structure of the thesis

12
2 METHODOLOGY
In the methodology chapter, the author discusses about the methods used in different parts of the
thesis. This chapter presents research strategy and research approaches. Moreover, at the end of
this part the author presents the proofs of validity and reliability of the research study.
2.1 Research perspective
As stated, mainly there are two different scientific paradigms in this regard. According to him,
the concept of paradigm refers to value, judgment, norms, standards, perspectives, myths,
theories, frames of reference and approved procedures which is derived from the people and is a
representative of their thoughts and action. The theory of knowledge has two main paradigms:
Positivistic paradigm
When the knowledge is objective, scientific and tangible in nature the positivism paradigm
comes in to account. As positivistic paradigm is tangible and objective, its basis should be
contained in the nature. So, the basis of this concept is mainly from experiment, quantitative
measurement and logical reasoning. This kind of paradigm is achieved through performing
rational, logical and reasonable approach. Other issues like emotions, beliefs and feelings are not
well suited in this kind of paradigm. In conclusion, this paradigm can be achieved via verifying
hypothesis and different theories.
Hermeneutic paradigm
If emotions, beliefs and feelings are applied in the research then it can be assumed that
hermeneutic paradigm is achieved. The researcher of this kind of paradigm demonstrates his own
perception of the issues. So this kind of paradigm is called “the concept which tries to review and
develop theories and the interpretation and understanding of texts” in the academic views. The
data in this paradigm comes from different theories and the researcher explains them based on
his own feelings.
The overall structure of this research work is built on the positivistic approach. As mentioned
earlier, the researcher builds his research upon reviewing the academic resources. So the basis of
the thesis comes from scientific and rational resources. The second type of data comes from
empirical study. The researcher tries to connect these parts by deploying his own explanation and
understating from the information. So in this part the research has somehow a hermeneutic
approach.

13
Research studies can be categorized into two main approaches to conduct in a scientific research;
quantitative and qualitative researches (Bryman & Bell, 2011).
In quantitative research, the researcher uses numerical data in his study and tries to make
connection between variables. Therefore, the quantitative research goal is to develop
mathematical models or different hypotheses. In the opposite, there is other type of research
which is Qualitative research. In this type of research, the author mainly uses the methods such
as observation, analyzing text and documents, interviews, recording and transcribing to develop
his research study. Explanatory questions such as ‘Why’ is the basis of this type of research. To
summarize, qualitative researcher is “subjective” and quantitative research is “objective”.
As mentioned in previous parts, in this research the author uses information from different
academic resources and practical environment. As it is clear the nature of his concept of this area
of concern is considered as managerial issue. So information used in this study is qualitative and
has the subjective nature.
2.2 Research strategy
The main purpose of this study is to help IT managers/organization realize possible influence or
significance which brought by IT Service Management Processes Metrics and to give IT
managers and IT users a useful reference when they try to establish or improve a ITSM
framework efficiency.
To fulfil these purposes, this research includes both theoretical and empirical study. In order to
achieve the goals of the research, it is important to have an intensive text investigation through
different academic resources in the theoretical part. It is also important to acquire appropriate
information through extensive communication with the people in the empirical part. The aim of
the author in this research study is to present a research based on theoretical studies with
considering empirical data gathered from practical environment.
Firstly, the author reviews different academic resources to build his theoretical foundation. After
reviewing the literature of the concept comprehensively, the researcher enters a practical
environment with performing a case study and an interview with a company such as DB
Schenker. Finally, after gathering enough information the researcher analyses the information
with setting up a connection between the information gathered from practical environment and
the literature. Generally our research strategy is divided into two types of research strategy;
Exploratory and explanatory.
Empirical research study
The empirical investigations are guided by the outcomes of experiments or observation
based on the facts and realities that are made by the researcher. Based on the explanatory
studies in the empirical study, for finding the comprehensive framework for ITSM the
researcher is going to compare different perspectives of the same condition in various
companies to attain a final model that are used to support and make the theoretical
findings durable (Chisnall, 1981; Noon 1983 ). Finally, the researcher could draw that

14
something important like collecting related evidences has been added to the body of
knowledge. Here in this thesis, case study is used as empirical research approach to
analyze specific research unit.
Case Study
According to Blatter (2008; 2008), case studies were fundamentally needed for the
primary research strategy at the inception of modern social science. Here, the proposed
research strategy is a case study. The need of the thesis is to analyze different qualitative
elements of ITSM framework and ITIL strategy guide. According to Oates (2006), the
most common methods for data generation are questionnaires, interviews and
observations. Thus, in order to gather information on the elements of IT service
management efficiency, Interviews are highlighted as the most operative and effective
method .This will be similar to most qualitative methods as informative, holistic and
recognize multiple realities that answers questions relying on “what”, “who”, “why” and
“how” it can be improved.
Theoretical studies
Exploratory study deals with the conditions where the problem is not very clear and is
used for better understanding the problem. At the first stage, there are unlimited numbers
of perceptions and academic studies for collecting the knowledge about IT service
management (Cooper and Schindler 2003; Blumberg, Cooper et al. 2008, 1998).Then, the
theoretical study will develop the conceptual model in order to present answers for the
research questions. Moreover, in the analysis and result chapter comparative analysis
method will focus on both studies’ result where inconsistency may be clarified. Based on
the comparative analysis method the new conceptual model will be offered.
2.3 Data collection method
As mentioned before in the structure of thesis part, the author in this research study first is going
to have a review on the academic resources related to the subject area. After gathering valuable
academic information from valid resources the author will continue the study with gathering
needed information from selected companies. Data used in this research can be categorized in
two main parts: Primary Data and Secondary Data.
2.3.1 Primary data
Primary data is the one that comes from practical experiences. Personal experiments such as
interviews and direct observation are the example of this type of data. In these methods, all the
information of the experiments is important for the researcher and gathering information as much
as it is possible is the key issue for success.
In this research study, the author selected the interview method to gather appropriate information
for verifying the theoretical part for achieving the defined purposes. In a point of view, there are
mainly two types of interview sampling: probability and non-probability. Probability is a kind of
sampling which the selection of interviews is random. Conversely, in non-probability method
15
interviews are determined and the selection method is not random based. Referring to the
research strategy in which the information of theoretical part should be compared by the
information of practical ones, verified information is important for the author. Therefore, the
author selected some determined interviews for gathering needed information.
In the interviews the author seeks to gather some information related to the metrics for managing
ITSM such as ITIL V3/V2 and COBIT. Using practical information to serve as an aid to
introduce and categorize these metrics can be the main purpose of this part. To achieve this goal,
the author had some cooperation with innovation lab of Borås University who were involved in
an ITSM project and also conducted some interviews with IT manager of DB Schenker
Company which is credited as the pioneer company of logistics. DB Schenker is an organization
which provides transports, logistics and information services globally. More information about
this company is provided by the author in empirical part.
Qualitative interviews are normally categorized in unstructured, semi-structured, and structured
(Bloom & Crabtree, 2006). The author tried to arrange the semi-structured interview with an
expert in this company which could give reliable information. Some open and close questions
have been selected to conduct the meeting. To better conduct the interview, the researcher sent
some general questions before the meeting. But to have more challenge during the interview
some specific open questions have been selected to be asked in the meeting.
2.3.2 Secondary data
Secondary data includes information from scientific articles, documents, websites and other
valuable records. This data builds the foundation of the research and considers as a valuable
resource to evaluate and validate the study. Commonly gathering secondary data from its
resources is done through qualitative methodologies.
2.4 Data Analysis procedures
To achieve his research goal, the author should have a comprehensive analysis while performing
appropriate methods. Strauss & Corbin (1990) mentions the significance of the processes in
research study and also stress to provide special attention to it. Data analysis processes are the
most significant phase in writing research articles in order to support inclusive decision making
processes and to provide reliable outcome (Strauss and Corbin 1990).
As we mentioned earlier in section 2.1, we had selected the qualitative perspective approach
where an inductive approach is practical to our thesis investigation. According to (Backman
1998) data analysis in the qualitative research is a difficult task. Once information managed for
analysis, the relevant data to research question will be shaped according to unrelated, relevant
and general value data to research question.
In the analysis and results chapter of both theoretical and empirical studies which investigates the
research sub-questions is answered and these results will go through a comparative analysis
according to characteristic of this study where the data will be assessed and results will be

16
presented. According to Mills (2008), comparison is the most important aspect in the analysis of
great number of social science research, which essentially follows from the frame of reference.
Generally, it happens between different objects, such as individuals, groups, cases, settings,
themes, statements, different points in time and interviews (Mills 2008).
At the first step, the researcher of this study grouped theoretical findings based on the required
information from reliable resources (e.g. academic resources). Then the researcher gathers the
information from real world by running some interviews with DB Schenker Sweden, the
empirical results are then used to analyse our theoretical studies with the facts and metrics
obtained from various organizations for comprehensive IT service management framework
issues. The next step is to analyse and to compare the results through comparative analysis based
on the classified data that are allocated at the final step in order to explore new result. Finally,
concluding the subject according to arguments from last two parts.
2.5 Strategies for validating findings
Reliability is: “The degree of consistency between two measures of the same” (Mehrens and
Lehmann 1987). It defines a research as “reliable” when it is consistent and the results are not
different from the results of the same studies. As mentioned before, the basis of this research is
built on academic resources. The researcher tries to select the most important and reliable one in
the area of ITSM concept. So it can be assumed that the theoretical part has the accepted level of
reliability from the researcher’s point of view. In empirical part, the researcher has selected some
of the best known companies to run his interviews and gather appropriate information. The
people who had been interviewed are experts in the related area and the researcher used his
knowledge which was acquired from theoretical part to make the empirical part as reliable as
possible.
If the researcher can measure what has been defined at the beginning of the research in the end
we can say the research has validity. There are two kinds of validity:
1. Internal validity
Internal validity is defined when we can appropriately connect the theoretical part with empirical
one we can say the research has internal validity. For instance, in this research the researcher
used interview method. And he gathered some information from different people. If the
interviews performed in its best way the information has validity and we can make connection
with reliable information from theoretical part.
2. External validity
External Validity is defined when the research can be generalized. To summarize, it refers to the
degree use of using the results in the future. In this research, since the results are the combination
of theory and empirical study it can be fruitful for academics and practitioners to use and develop
this concept.

17
2.6 Result presentation method
The researcher of this study chose written format for his work. As the purpose of this research is
making contribution to the selected area with giving appropriate information this format has been
selected. Figures and tables have been selected to make information more visible for the reader.
The Harvard system is used by the author for referring the sources. In Harvard system, the name
of author and the publish date are provided when an issue is used.
18
3 THEORETICAL FRAMES OF REFERENCES
3.1 Key concepts
IT Service Management (ITSM): IT management focuses on the management area of IT
processes such as IT services and products. According to, Silva Molina, E. j. a. p., Leonel and
Flors, Jonny and Vargas, Norman (2005), IT management should be included in the IT
Governance process. But, there is an obvious difference between IT management and IT
governance. The term IT management mainly concentrates on the effective supply of IT services
and products and the management of IT functions. But, IT governance focuses on broader areas
such as “performing and transforming IT to meet present and future demands of the business and
clients”. According to Rakesh, “Good IT governance is about creating a learning organization
and culture of effective IT decision making” (Silva Molina 2005; Rakesh 2009).
IT Infrastructure Library (ITIL): ITIL models Verson2/Version3 illustrate the most accepted
guidance for enterprise IT operations to meet the need of services and products in order to
provide cost-effective and efficient IT operation inside the Government Computer Center (GCC).
COBIT: The Control Objectives for Information and related Technology (COBIT) governance
has been generated by Information System Audit and Control Association (ISACA). COBIT is a
combining tool that gives permits the managers to link the activity among technical issues,
control requirements and business risks. The first Version of COBIT was produced in 1996 and
the latest version released in 2007 as V4.1 (Grembergen, 1997).
Metrics: “ metric is just another term for a “measure” or “meter” that shows the performance of
the system based on percentages or means. Metrics identify what is to be measured for IT such
as: technology processes and services. Metrics deliver the feedback mechanism that allows
management to navigate, control and guide IT toward strategic objectives under continuous
improvement process” (Brooks, 2006).
Performance Measurements (PMs): According to Lohman, Fortuin, &Wouters, “PM is an
activity that managers perform in order to reach predefined goals that are derived from the
company’s strategic objectives (Lohman, Fortuin et al. 2004).
Key Performance Indicators (KPIs): is a metric, value or quantity and it is a type of
performance measurement. The KPIs provide the opportunity to compare against an internal or
external object in order to indicate of performance, such as benchmarking of inside performance
with external criteria (Ahmad and Dhafr 2002; David 2010).
Quality Management System (QMS): Quality Management System (QMS) is the
organizational step-by-step improvement structure, procedures, analysis and necessary resources
to implement QM (Hank 2006).
SERVQUAL: a multiple-item scale for measuring consumer perceptions of service quality.

19
3.2 Subject areas relevant for the research
In this section, we discuss subject areas that contribute in obtaining the results of our research
questions. We narrowed down the key concepts in the subject areas as:
1. Knowledge on ITSM Frameworks and essential needs of ITSM in IT industries.
2. ITSM based on The IT Infrastructure Library (ITIL)
3. Decision-making Process.
The diagrammatical representation below clarifies how the subject areas are relevant for our
research question and how they help to answering it.
Figure1 Relation of three subject areas

20
3.3 Previous research
To the best of the author’s knowledge there is no obtainable work which performs the collection
and comparison of different IT Service Management processes and metrics from different IT
corporations on real life process data. Nevertheless, there are several works that are highly
related to this academic work and influences ITSM process and operation framework.
First of all, there are several works on the application of Implementing ITIL-ITSM using best
practices, standards and management techniques.
In “Key performance indicators: developing, implementing, and using winning KPIs”, David
(2010) presented different approaches to find critical success factors over 300 performance
measures and how to brainstorm the performance measure. Also in the second edition of the
book he illustrated that how to track and identify organization’s KPIs in order to increase the
success factors (David 2010).
Jurison (1996) argues that Information Technology (IT) can provide important benefits, but in
great number of cases these benefits are captured by other stakeholders and not captured by the
firms that made the investment; he also proposed a framework for distribution of IT
benefits(Jurison 1996).
In “ITIL: What It Is And What It Isn't”, Hank M (2006) examined in the measuring techniques of
successful companies when implementing the ITIL-best practice. He describes Service Support
and Service delivery and explains its stress on ITSM-ITIL best practice that it does not stand
alone and it could be successful when applying with other practices. The authors suggest that
there are three certain tasks such as, appropriate goal setting through a Process Maturity
Framework (PMF), rigorous auditing and reporting through a Quality Management System
(QMS) and Project Management and a Continuous Service Improvement Program (CSIP), to
support ITIL-usage. Furthermore, he also provided more information about business-aligned IT
process and continuous improvement of the operational and tactical elements specially those
processes that focused on service quality by clients and users (Hank 2006).
Apart from the other works on Improving the efficiency of IT service management field, there is
a real life example of a case study which is focusing on IT framework and Service Strategy
process of Steel Manufacturing Enterprise (SMC) which are related to the subject area of this
thesis. In a manufacturing enterprise, Zhong and Xin (2010) used integration of COBIT and ITIL
best practice to improve ITSM framework, they also introduced an approach to service strategy
evaluation framework in SMC by providing indicators for different evaluation process in order to
improve the result from ITIL implementation and to increase the improvements on changed IT
processes, they use different approaches to find the problem of Business-IT alignment in SMC.
The approach aims at minimizing the difficulty of business-IT alignment in importance within
the IT community. In the same article Bartolini et al (2006), has suggested an IT Management by
Business Objectives (MBO) method, which is a special method to ensure business strategic
objectives-IT alignment, by defining a new system for decision support in ITSM. It is closely
related to the ITIL component in operational level and tactical level of theoretical research
(Bartolini, Salle et al. ; Zhong and Xin).

21
In “E-government: ITIL-Based Service Management Case Study”, Meziani and Saleh (2010)
developed a service management self-assessment plans for the government agency to support
continuous quality improvement of IT processes based on ITIL governance- gap analysis
methods with the respect to ITIL standards (Meziani and Saleh).
In “Managed IT services: the role of IT standards” Narayanan (2008) argues the practical issues
based on standards and the management of IT services delivered by external or outsourced
service providers. Here, the purpose of the authors is to assist IT organizations to understand the
significance of having a mutual standard for managing IT services (Narayanan 2008).
Grembergen and Haes (2009) illustrated a set of best practices (COBIT Framework) for
management, control and assurance of information technology, and categorized them around a
logical framework based on 34 IT processes.
Marrone and Kolbe (2011) studied the benefits of both operational and strategic of IT Service
Management. The research outcome indicates that as the implementation of ITIL increased, the
number of realized benefits increased, like: the levels of maturity of the Business-IT alignment.
Jung-Oh, Sang-Geun et al (2008) suggested an effectively measuring method about maturity of
security management supporting.
However, there are some other studies about IT Service Management metrics ‘influence in IT
Corporation decision-making.
Shatzkin (2005) emphasizes on the needs of publishers to review their own metrics in order to be
sure they are not leading them into wrong business decisions (Shatzkin 2005).
Ahmad and Dhafr (2002) illustrated the creation of KPIs in industrial areas. They also presented
a new methodology, a critical evaluation and a few examples of implementing KPIs are included.
Lohman and Fortuin et al. (2004) analyzed the case study carried out at the european operations
department of Nike. Their results are related to continued enhancement of PMS, the act of
similar enterprises for PM and the standardized metrics role. It also proposes that improving
PMSs must to a large scope not be considered as a “ design ” effort; instead it must be
considered as a “co-ordination effort” (Lohman, Fortuin et al. 2004).
However, there are more studies about Measuring Service Quality and development of
SERVQUAL.
Parasuraman, A, Zeithaml, Valarie A and Berry, Leonard L. (1994) in their article highlighted
the arguments and evidences that are necessary for a balanced assessment and evaluation of
service quality measurement such as underlining unresolved issues. Also in the research “a
conceptual Model of Service Quality and Its Implications for Future Research” Parasuraman and
Zeithaml et al. (1985) illustrated the most importance of service quality model (Parasuraman,
Zeithaml et al. 1985; Parasuraman, Zeithaml et al. 1994).

22
In SERVQUAL: A Multiple-Item Scale for Measuring Consumer Perceptions of Service
Quality”, Parasuraman (1988) presented information on the improvement of SERVQUAL scale
from the studies of different researchers for measuring customer perceptions of service quality in
organizations, this study focused on perceived quality as a scale of SERVQUAL (Parasuraman
1988).
The author’s experience shows that users benefit from the efficiency improvements accrued by
appropriate service strategy in whole ITSM implementation. He continue to work with IT
Service management (Tactical-service delivery and Operational-service support), and Continues
Service Improvement to increase IT service management indicators in IT industries.
3.4 Relevant literature sources
In previous research discussion, a few studies related to ITSM and implementing ITIL-best
practices into organizational framework were presented that could provide direct help and
references. This topic follows the criteria in chapter two. The related literature was selected from
“Metrics for IT Service Management book, online databases were searched at University of
Borås Libraries, Innovation-lab and internet. A great number of e-journals were browsed by
topic and databases were searched by the key words.
Databases: used were, ACM Digital Library, Wiley Online Library, EBSCO, ScienceDirect,
SpringerLink and Blackwell Synergy.
Key words: IT Service Management, Service Management, IT Infrastructure Library, ITIL,
ITSM best practice, Comprehensive framework for ITSM, metrics for ITSM, ITIL process
framework. All the referenced articles in the literature review were issued in peer-reviewed
journal that serve as a research sources for both academic researchers and experts.
Brooks, P (2006) emphasizes on the implementation of IT Service Management in his book
―includes practical information on the provision of useful and meaningful metrics‖. He provides
specific examples and templates for the use of each metric (Brooks and Forum 2006).
Pollard, C. and A. Cater-Steel 2009 article: “Justifications, Strategies, and Critical Success
Factors in successful ITIL Implementations in U.S. and Australian companies: An Exploratory
Study” was published in Information Systems Management”. It is a peer-reviewed scientific
journal. The authors deem that not all ITIL implementations are successful and some have been
dissatisfied with the outcomes. Some conclusion from exploratory study, illustrated that,
successful implementations applying ITIL V2 framework into their ITSM process. In this
research also authors divided Critical Success Factors (CSFs) into different parts in order to
assist IT managers such as, interdepartmental communication and collaboration, use of
consultants, training and careful software selection, creating an ITIL-friendly culture, executive
management support, process, and customer-focused metrics. This study will give reference to a
successful IT service management framework.
Zhong, Y. and W. Xin 2010 article: “An ITIL based ITSM practice: A case study of steel
manufacturing enterprise” was published in - Service Systems and Service Management
(ICSSSM), 2010 7th International Conference on Service Systems and Service Management,

23
IEEE. In this paper authors illustrates the importance of the practical process to implement the
ITSM in one of steel manufacturing corporations. And divided the service strategy in this firm to
four main parts: Change Management, Resource Configuration, Accident Management and
Release Management (Zhong, Y. and W. Xin).
Meziani, R. and I. Saleh 2010 article: “e-government: ITIL-based service management case
study”. Proceedings of the 12th International Conference on information integration and web-
based applications & services, published in ACM. In this paper the authors introduced the ITIL
framework in order to accomplish Quality Service (QS) and overcome problems related with the
growth of IT systems. This research is valuable to be a reference
Bartolini, C., M. Salle, et al. 2006 article: “IT service management driven by business objectives
an application to incident management” published in IEEE/IFIP Network Operations and
Management Symposium.
McLaughlin, K. and F. Damiano article: “American ITIL”, published in ACM. McLaughlin, K.
and F. Damiano argue about how college using ITIL, containing, Problem Management, Incident
Management, developing internal Operating Level Agreements (OLA's), establishing Service
Level Agreements (SLA's) and creating metrics. It is closely related to the second part of
theoretical research that allows managers to decide and make meaningful metrics that the
customer/users can understand.
McNaughton, B., P. Ray, et al. 2010 article: "Designing an evaluation framework for IT service
management" Published in Information & Management. The authors are believed that, there is a
lack of research and study on benefits of implementing and using ITIL processes have been
predicted. Therefore, The authors goals is to present a design of a holistic evaluation framework
for improvement of ITSM framework with particular focus on ITIL.this study will give reference
ITSM-ITIL benefits in organizations framework.
Parasuraman, A., V. A. Zeithaml, et al. 1994 article: "Alternative scales for measuring service
quality: A comparative assessment based on psychometric and diagnostic criteria" Published in
Journal of Retailing. They also authored "Reassessment of Expectations as a Comparison
Standard in Measuring Service Quality: Implications for Further Research” which is published
in" The Journal of Marketing. These researches are valuable to be references.
Silva Molina, E. J. a. P., Leonel and Flores, Jonny and Vargas, Norman 2005 article: “How to
identify and Measure the Level of Alignment between IT and Business Governance”. It is peer-
reviewed scientific journal and was presented in PICMET conference. The main part of this
article contains a new perspective and preliminary concepts on how to measure the level of
alignment between IT and business governance. However, the authors believe that, the main
reasons why organizations fail to achieve the full potential of their Information technology
investment is related to the lack of alignment, between information technology and business
strategies. This research is valuable to be a reference.

24
3.5 Knowledge on ITSM frameworks
During the last two decades, the ITSM-related frameworks have provided better systematic
approach to the management of IT services in the fields of IT operation to continual
improvement, implementation and design (Marrone and Kolbe 2011). For example, different
studies have concentrated on the adoption of IT Service Management (ITSM) as a “specific
service oriented best practice” (Marrone and Kolbe 2011). According to Winniford et al. (2009),
about 45% of US corporations are operating an ITSM while 15% are preparation its usage
(Winniford, Conger et al. 2009).IT service management is somehow the quality customer service
that tries to ensure that customer needs and expectations are met at all times. (Tan, Cater-Steel et
al. 2009). IT organization need a structure approach for measuring IT service support process
such as using IT Infrastructure Library (ITIL, ISO20000), Control Objectives for Information
and Related Technology (COBIT), Six Sigma, Enhanced Telecom Operation Map (ETOM) and
Sarbanes Oxley (SOX), Microsoft’s Operations Framework (MOF), IBM Systems Management
Solutions Lifecycle (IT Process Model) and HP IT Service Management Reference Model are
emerging as some of the more popular Standards in IT Service Management, Governance,
Quality and operation issues (Brooks 2006; Hank 2006; Tan, Cater-Steel et al. 2009;
McNaughton, Ray et al. 2010). According to the “IT Governance Institute (2008) ITSM
framework with the highest adoption rate is IT Infrastructure Library (ITIL) with 24%, followed
by Control Objectives for Information and related Technology (COBIT) with an adoption rate of
14%” (Marrone and Kolbe 2011).
3.6 Needs of ITSM in organization
ITSM increases the level of the communication efficiency between business departments. And
provides a structure in order to plan, research and implement IT services. The needs of ITSM in
organizations can be changes in the ways they operate, communicate and do business and also
develop and innovate, gain market advantage and differentiate themselves to their end customers
(Brooks 2006). In addition, ITSM allows companies to internally govern and follow to the set
global standards (Mior 2008).
25
However, the types of the ITSM benefits and allocation among stakeholder group can be
different based on the purpose of the system and managerial goals. Therefore, In order to attain
the maximum level of efficiency we must first identify IT and business goals to understand better
the needs of organization, managers and stakeholders. (Silva Molina, Plazaola et al.). According
to Jurison (1996), “stakeholders are all those parties who affect or are affected by a corporation’s
actions, behaviour, and policies. Thus, IT investment made by stakeholder or IT management
based on different business demands can be issues mentioned below:
- “Take customers as centre and provide IT services that meet customer’s demands.
- Enhanced quality.
- Low cost IT service in company.
- Better response to the client needs.
- Evaluating service delivery precisely” (Jurison 1996).
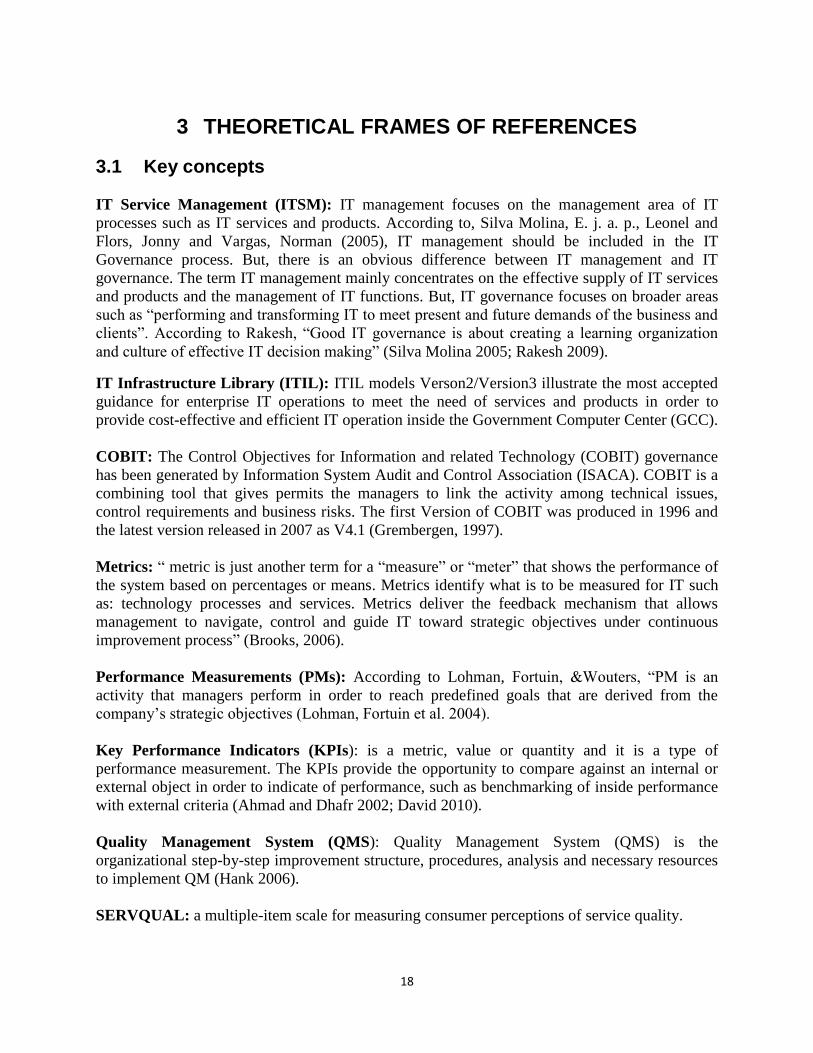
For better understanding of the ITSM concept in organization, reviewing the ITSM component
would be useful. ITSM components consist of Process, Technology, Manpower (people),
Organization, and Security, which is recently added to organization construction to develop the
system security (Park, Kim et al. 2008; McNaughton, Ray et al. 2010). Figure 1 illustrates the
component of ITSM.
Figure2 ITSM components
Processes
The most important element to construct ITSM system (e.g.IT business process facilitates
and keeps up IT service).
High secure manpower and organization
To provide better IT service level and arranges proper tasks in organization.
Technology and security
To provide best possible tools and automated solutions to develop process in higher level
of efficiency and safety
People Organisation
Technology Process
ITSM

26
As mentioned earlier, IT service is connected to the four fundamentals of Information
Technology Service Management (ITSM). So when IT is aligned with the business strategy and
the organization, it can do what it wants to do. Furthermore, IT and new technologies enable the
organization to do new things that were never possible before (Silva Molina, Plazaola et al.). The
strategic outcome is that the overall business benefits from effective IT-related service and IT
benefits that are integral to the company’s business plans will be delivered to the maximum
economical value. Two alignment directions can be identified;
One on the way that IT is aligned to business and the other, on the way that business can be
aligned to IT, both directions are equally important.(Jerry 2003; Marrone and Kolbe 2011).
However, new studies try to provide a solution for clarifying the confusion about IT values such
as cost, management methods and process of development for parities, managers and
researchers. For instance, the most cited ones concentrate on three different reasons among many
other explanations in the field of ITSM such as,
1. “Inappropriate measures,
2. Inappropriate unit of analysis,
3. Failure to account for time lag” (Jurison 1996; Marrone and Kolbe 2011)
3.6.1 Organizational requests for improvement of ITSM measurement
In ever-growing market, IT management is the key issue and one of the most significant aspects
of organizational control. E .j. Silvia Molina et al, (2005) expressed that, “the lack of association
between IT and Business strategies is one of the main reasons why projects fail to realize the full
potential of their investments”. Thus organizations rely upon IT service management to enable
them to achieve their company vision and goals by facilitating the new system and management
methods. For example, The key issue in having a new system design is to provide benefits as
well as set up new IT service management system which is followed by creating competitive
advantages for different tactical opportunities rather than developing operational
efficiency(Jurison 1996). Moreover, as Notowidigdo reports: “new strategic systems can be
considered either internal, having direct benefit to the company, or external, having direct benefit
to customers”(Notowidigdo 1984).Therefore, new IT Service Management requested by IT
manager and investor decision to accept cost and receiving some benefits.
There are several progresses, which have created a request for organizations to grow their IT
service management. First, “co-operation must to be improved along the IT management and
offer more flexibility, less cost, faster introduction on new products to clients and decreasing
delivery times. Several organizations are managed functionally”. For instance, around the
following levels of production, it might be difficult to manage the supply chain; such as sales,
marketing, purchasing, distribution, and manufacturing (Lohman, Fortuin et al. 2004).
Secondly, better IT management is not only important across functional borders, but also across
countries. For instance, sales and marketing turn to be as centralized, the organizations change
with the local products, services, products and customers to the organization that serves
particular products for the whole Europe. Therefore, it is essential to manage supply change and
IT service management to a European level of standard in order to move “product distribution,
marketing, demand management and distribution” to a European scale. Thirdly, linking
measurements operation across chain of separate departments as a result of providing better

27
service opportunity to end-consumer is another critical issue which must be considered(Lohman,
Fortuin et al. 2004). According to Lohman (2004), there are five different problems in
organization regarding the lack of IT management such as,
- “Lack of unit and cohesion structure between metrics.
- Insecurity and doubt about what to measure.
- Decentralized.
- Lack of communication among users and producers of PI (Performance indicator).
- Spread IT infrastructure” (Lohman, Fortuin et al. 2004).
The new style of IT management vs. Traditional styles IT management
According to Marquis, H. (2009) the new styles of IT Service are complex communication and
collaboration system, including business oriented service support in that IT services, are
managed by technology department and planned based on the business demands. The main
important change in organizational management system is to support how they collaborate to
achieve an objective. For instance; if the ITSM are well designed and followed the line with
business requirements, they can capture the control of the system. Like what Information
Technology Infrastructure Library (ITIL) really espouses (Brooks 2006; Marquis December
2009).
Another issue is the communication. The communication is a vital part of IT services
management and is a two-way process. So it is important to integrate requirements from the
various stakeholders and use their involvement throughout to improve service delivery and
process operation (Brooks 2006; McNaughton, Ray et al. 2010). On the other hand, the
traditional style of IT management function is silo-based which the structure is a little different
from process and performance (hardware/software, help desk, application management and
network system). For instance, almost every business uses silos to gather specialist into groups
such as in medicine, military and education. Usually, this silo makes group technologies and
their technologists into convenient units (C. Rudd 2004; McNaughton, Ray et al. 2010).
3.7 IT Service Management based on the IT Infrastructure Library
Within the last few years, majority of companies such as consulting organizations and vendors
have declined IT service management methodologies to skip into the ITIL concept and
implemented the ITIL framework to set of descriptive management documents to develop ITSM
frameworks. ITIL is a continuous technique of managing and operating of IT which is based on
providing high quality service by dealing with the needs of a complex system and customer’s
request for flexibility and changes in order to increasing customer’s satisfaction, determining
business-IT alignment and continuously improving tactical and operational level of business
performance in order to focus on service quality (McNaughton, Ray et al. 2010; Marquis
December 2009).

28
ITIL developed in 1980 by the UK’s Office of Government Commerce, with the name of Central
Computer and Telecommunications Agency. ITIL illustrates the most accepted guidance for
enterprise IT operations and provided cost-effective and efficient IT operation inside the
Government Computer Centres. For instance, recently each Request For Proposal (RFP) from
government and project activity needs an ITIL based response. in addition ITIL is used in a
combination with one or more other best practices to manage IT such as, “ISO 27000 (a standard
for IT security), COBIT (framework for IT Governance and Controls), Six Sigma (quality
methodology), TOGAF (framework for IT architecture)” (Zhen and Xin-yu 2007; Tan, Cater-
Steel et al. 2009; Marquis 2009).
3.7.1 Successful IT Service Management through ITIL process adoption
In order to have a successful IT structure in an organization, we should understand the difference
between process and performance. Process illustrates the work presented by people. However,
often, managers consider that a process shows an organizational structure. For example,
according to (Marquis December 2009) 45% of IT organization will be crashed as a result of
misunderstanding process and performance. However, this chaos might be caused by
organizational refusal to it. Moreover, according to Marquis (2009), a study by Evergreen
System showed that 72 % of companied that answered a questioner found the main difficulty to
ITIL adoption in their business is organizational resistance as a result of lack of knowledge in
understanding ITIL goals. As ITIL stated that; ITIL process approach means that process has to
be controlled and managed over more than one area surrounded by traditional hierarchical
construction (Marquis December 2009).
However, effective ITIL Implementers indicate that their success did not come from, consultants,
software changes, training, and work-structure. But in order to succeed we must involve
leadership skills and empower staff at different stages. According to McNaughton; “There are
50,000 ITIL certified professionals worldwide and 24.1% of IT managers in large organizations
are familiar with the ITIL standards” (McNaughton, Ray et al. 2010; Marquis December 2009).
On the other hand, one of the important reason for ITIL collapse in organization is because
organizations think ITIL is a “project you do” and when is over is done. For instance, successful
organizations mostly use other best practices, management techniques and standards when
implementing ITIL (Hank 2006).

29
There are three main practices needed to support ITIL usage as below.
First Practice: project management and a Continuous Service Improvement Program (CSIP):
The CSIP is doing ITIL and is a formal process of including:
“Managing the process of change needed to move an IT organization.
Stakeholders
Establishing goals”(Hank 2006)
Second Practice: appropriate target setting through a Process Maturity Framework (PMF): Some
famous PMF selections are:
“Capability Maturity Model/Integration (CMMI, CMM)
COBIT Governance” (Hank 2006)
Further, the PMF is to recognize “organizational and process maturity and capability” like,
“where” to implement and “when” to start implementing method based on ITIL.
Third Practice: Rigorous auditing and reporting through a Quality Management System (QMS)
ITIL(Hank 2006).
Table2. The four perceptions of using ITIL within the organization 1. Management Perspective
Highest level in organization which is to certify that other units (financial, business and
collective user) are correctly deliberated in the evaluation (McNaughton, Ray et al. 2010).
2. Technology Perspective
To provide a positive effect on different parts like: technological efficiency, IT personnel and
resource efficiency, and specific IT related costs and budgets (McNaughton, Ray et al. 2010).
3. IT Users Perspective
Who are interacting with IT help or service desk for their needs like; systems, technology,
equipment, products and services of the IT department on a daily basis to support processes
(McNaughton, Ray et al. 2010).
4. IT Employees Perspective
IT department’s personnel includes: first and second support, network and database
administrators, security personnel and application owner (McNaughton, Ray et al. 2010).
30
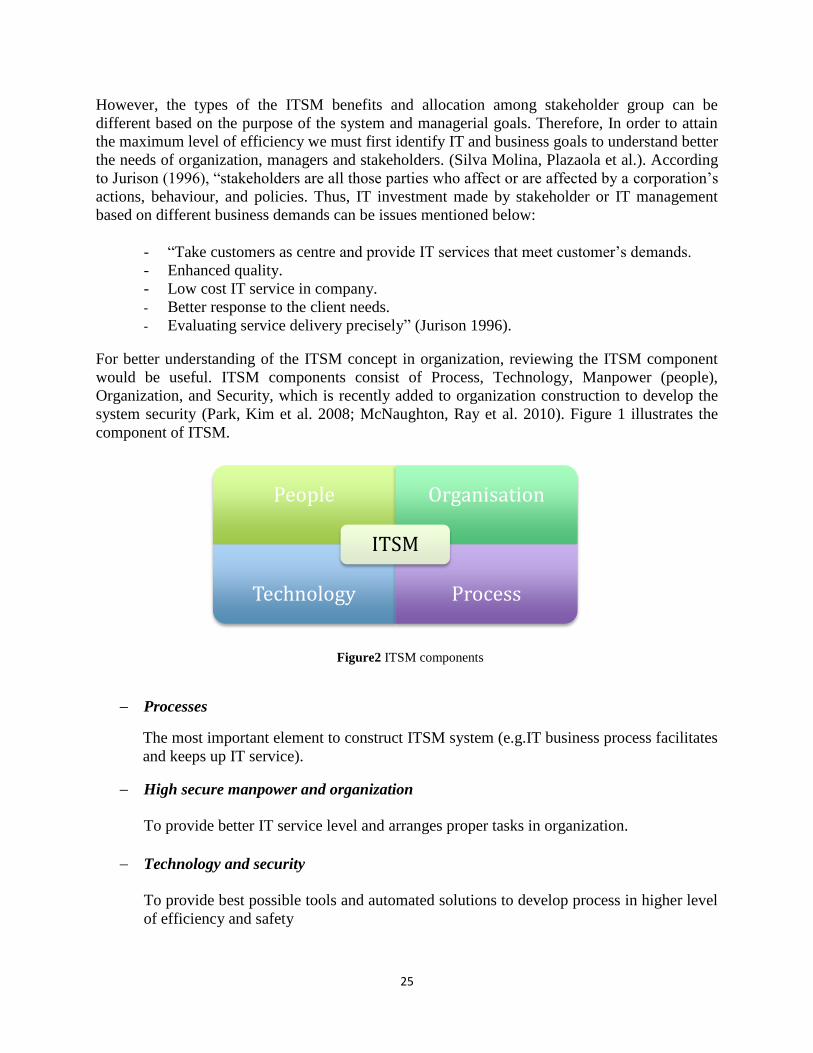
3.7.2 ITIL V2.0 / V3.0 framework
ITIL models were mainly designed to meet the enterprise’s need of services and products. The
most important difference between ITIL V2 and V3 is the new style of lifecycle structure. ITIL
V3 published on May 2007, which is the latest and the best model of ITIL, is looking for
implementing feedback-loops, by managing process in a rounded method. ITIL V3 tried to
provide the alignment of their ITSM processes and overall business requirements. The life cycles
are designed, created and transitioned into the live environment, which is supported and
constantly improved and retired at the end of life cycle. (McNaughton, Ray et al. 2010). ITIL V2
consists of the old structure of Service Support and Service Delivery. Moreover, many
organizations developed their own ITIL models in order to increase the service level, reduce cost
and improve Security such as: Microsoft and HP, Procter & Gamble, Caterpillar, State Farm and
Boeing in the USA. Organization such as Procter & Gamble, Caterpillar, State Farm and Boeing
have incorporated aspects of ITIL and IT Service Management into their IT Management
strategies (Meziani and Saleh).
Figure3 The ITILV2 framework (Wang Zhen Wang and Zhang Xin-yu Zhang 2007)
The process model of ITIL includes the collection of different service management processes.
But it’s totally unfeasible to implement several processes at the same time, which is lead directly
to disapproval of the lower level of process integration and staff. The main part of ITIL V2.0
framework is Service management components, which includes Service support unit. It describes
the processes required for those IT service daily support and maintenance and Service Delivery
sub units which cover up the process involved in planning and delivering IT Services. In
addition, Application Management module details the processes required to manage an
application through all stages of its application lifecycle. And, Security Management focuses on
cross-cuts many of the processes in the other modules of the framework (Wang Zhen Wang and
Zhang Xin-yu Zhang 2007).

31
ITIL V2.0 ITIL V3.0 Service Delivery
Financial Management.
Capacity Management.
Service Level Management.
Availability Management.
IT Service Continuity Management.
Service Strategy
Financial Management.
Demand Management.
Service Portfolio Management.
Service Support
Incident Management.
Problem Management.
Change Management.
Configuration Management.
Release Management.
Service Design
Capacity Management.
Service Level Management.
IT Service Continuity Management.
Service Catalog Management
Supplier Management.
Information Security Management.
Transition Planning & Support ICT Infrastructure Management
Supplier Management.
Service Transition
Change Management.
Configuration Management.
Release Management.
Service Validation & Testing
Knowledge Management.
Evaluation Management. Security Management
Information Security Management.
Access Management.
Service Operation
Incident Management.
Problem Management.
Request Management.
Access Management.
Event Management.
Service Mgmt. Technical Management
IT operations Management.
Application Management.
Business Management
Information Security Management.
Access Management.
Continual Service Improvement
7step Service Improvement process
Business Perspectives
IT Governance
IT Portfolio Management.
Application Management
Knowledge Management.
Table3 ITIL V2.0 /V3.0 processes
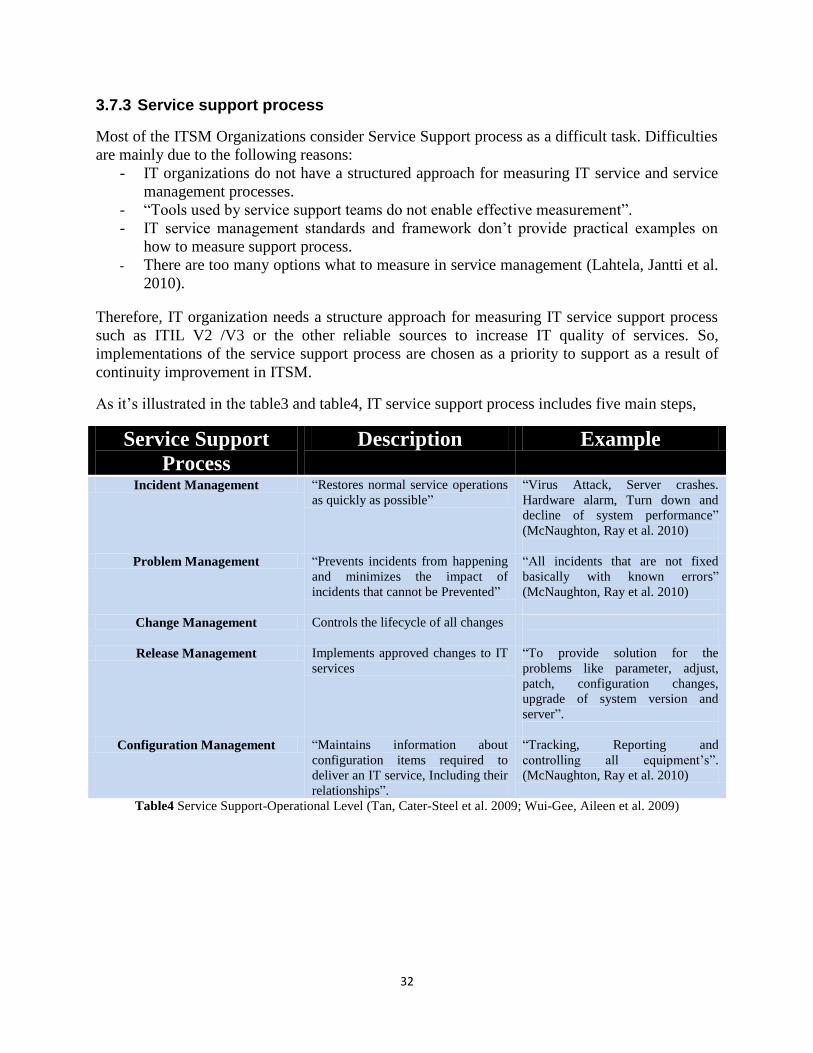
32
3.7.3 Service support process
Most of the ITSM Organizations consider Service Support process as a difficult task. Difficulties
are mainly due to the following reasons: - IT organizations do not have a structured approach for measuring IT service and service
management processes.
- “Tools used by service support teams do not enable effective measurement”.
- IT service management standards and framework don’t provide practical examples on
how to measure support process.
- There are too many options what to measure in service management (Lahtela, Jantti et al.
2010).
Therefore, IT organization needs a structure approach for measuring IT service support process
such as ITIL V2 /V3 or the other reliable sources to increase IT quality of services. So,
implementations of the service support process are chosen as a priority to support as a result of
continuity improvement in ITSM.
As it’s illustrated in the table3 and table4, IT service support process includes five main steps,
Service Support
Process
Description Example
Incident Management “Restores normal service operations
as quickly as possible”
“Virus Attack, Server crashes.
Hardware alarm, Turn down and
decline of system performance”
(McNaughton, Ray et al. 2010)
Problem Management “Prevents incidents from happening
and minimizes the impact of
incidents that cannot be Prevented”
“All incidents that are not fixed
basically with known errors”
(McNaughton, Ray et al. 2010)
Change Management Controls the lifecycle of all changes
Release Management Implements approved changes to IT
services
“To provide solution for the
problems like parameter, adjust,
patch, configuration changes,
upgrade of system version and
server”.
Configuration Management “Maintains information about
configuration items required to
deliver an IT service, Including their
relationships”.
“Tracking, Reporting and
controlling all equipment’s”.
(McNaughton, Ray et al. 2010)
Table4 Service Support-Operational Level (Tan, Cater-Steel et al. 2009; Wui-Gee, Aileen et al. 2009)
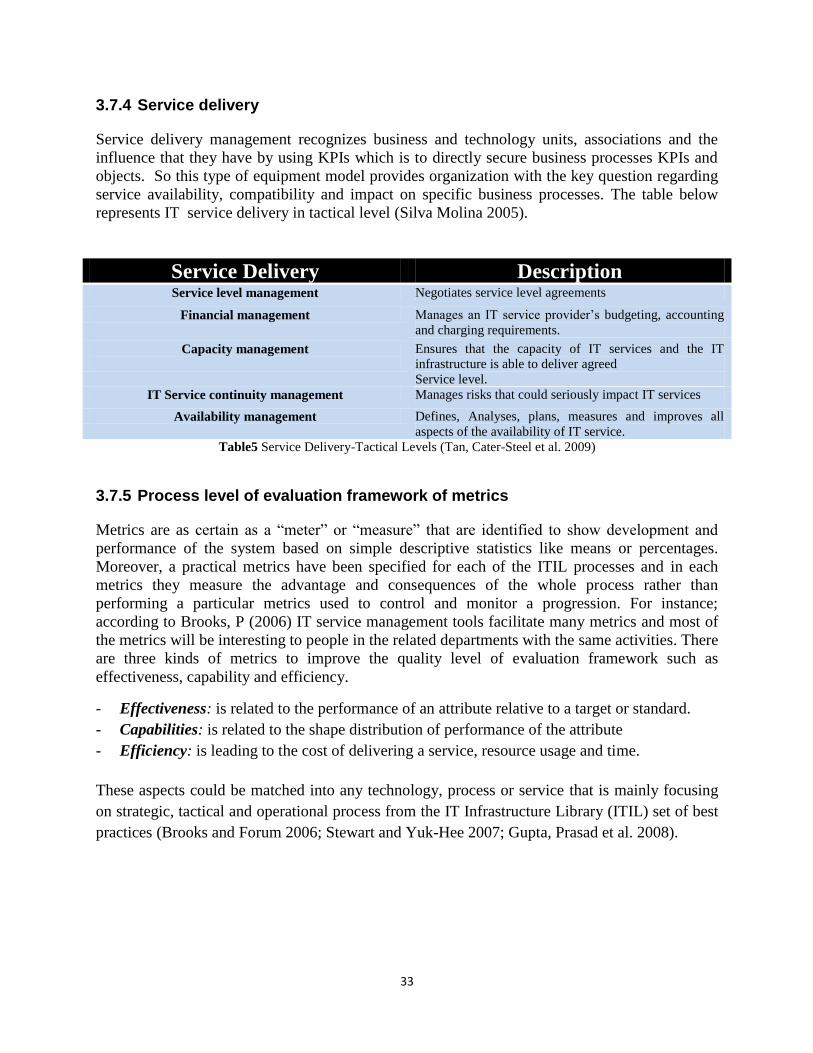
33
3.7.4 Service delivery
Service delivery management recognizes business and technology units, associations and the
influence that they have by using KPIs which is to directly secure business processes KPIs and
objects. So this type of equipment model provides organization with the key question regarding
service availability, compatibility and impact on specific business processes. The table below
represents IT service delivery in tactical level (Silva Molina 2005).
Service Delivery Description Service level management Negotiates service level agreements
Financial management Manages an IT service provider’s budgeting, accounting
and charging requirements.
Capacity management
Ensures that the capacity of IT services and the IT
infrastructure is able to deliver agreed
Service level.
IT Service continuity management Manages risks that could seriously impact IT services
Availability management Defines, Analyses, plans, measures and improves all
aspects of the availability of IT service.
Table5 Service Delivery-Tactical Levels (Tan, Cater-Steel et al. 2009)
3.7.5 Process level of evaluation framework of metrics
Metrics are as certain as a “meter” or “measure” that are identified to show development and
performance of the system based on simple descriptive statistics like means or percentages.
Moreover, a practical metrics have been specified for each of the ITIL processes and in each
metrics they measure the advantage and consequences of the whole process rather than
performing a particular metrics used to control and monitor a progression. For instance;
according to Brooks, P (2006) IT service management tools facilitate many metrics and most of
the metrics will be interesting to people in the related departments with the same activities. There
are three kinds of metrics to improve the quality level of evaluation framework such as
effectiveness, capability and efficiency.
- Effectiveness: is related to the performance of an attribute relative to a target or standard.
- Capabilities: is related to the shape distribution of performance of the attribute
- Efficiency: is leading to the cost of delivering a service, resource usage and time.
These aspects could be matched into any technology, process or service that is mainly focusing
on strategic, tactical and operational process from the IT Infrastructure Library (ITIL) set of best
practices (Brooks and Forum 2006; Stewart and Yuk-Hee 2007; Gupta, Prasad et al. 2008).
34
Service Support Domain – Operational Level
Incident Management
An incident is an intimation of some errors or the failure of some components in an IT
system. “In a typical service desk, incident is either reported by the customer or
automatically generated by the system monitoring” (Gupta, Prasad, & Mohania, 2008).The
main goal of incident manager is to minimize interruption in the business activities and
ensure availability of service (Forte, 2007).
Service Desk
Service desks are requested to report IT problems in the enterprise system. It is a single point
of contact (SPOC) which is basically for the users who need assistance for operating their IT
systems, such as incident management, configuration changes, information and customer’s
problem which is managed by a leve-1 person. Moreover, the Service desk owns and
manages various tasks, such as dealing with tracking and communication by handling the
closure phase and transmitting messages. The Service desk is known as the “Notification”
which is in different cases function. (Gupta, Prasad et al. 2008).
For example, Incident is an indication of some errors in an IT system component; the
majority of historic database incidents are maintained at the service desk. Therefore, the
level-1(L1) person attempts to make the customers satisfied with their requests as much as
possible.
- L1 Person Method: the L1 (Level 1) person could check the service request by searching the
earlier reports of an incident. If it cannot resolve the incident, then a new request is created in
the form of an Incident ticket to initiate the different level of ITSM process. According to
Forte, the functional aspect clarifies who is responsible for resolving the incident and finds
an incident. The Service desks are known as the “notification or recognition phase” to seek
for collecting the Incident type and source, “what information is available additional details
and responsibility for the response” (Forte 2007).Also, the problem management process
would provide the method to find the source of incident(s) to avoid the similar problem in the
future. For example, customers can report problems by employing with different methods
such as “web based, e-mail or telephone” (Gupta, Prasad et al. 2008).
Configuration Management
Is responsible for maintaining the information about configuration items required to deliver
an IT (Meziani and Saleh).There are Some indicators for the configuration management such
as “rate of change management failures caused by original information errors, rate of no
corresponding request service items, rate of unable to execute configuration after changes
occurred” (Meziani and Saleh).

35
Change Management
This is an effective process for implementing changes required by the organization. All the
changes need to evaluated, approved, implemented, and checked. Some of indicators of
change management are rate of change failure, rate of urgent change, rate of unable to
execute the change management process, service interrupt caused by the change (Meziani
and Saleh ; Zhong and Xin).
Release Management
It is a way to communicate and manage expectations of the customer during the planning and
rollout of new releases. For example, for each server, “there should be built an account for all
equipment with attributes such as the type, configuration, duration of equipment, diagnosis
history, change and repairing reports” etc. (Meziani and Saleh ; Zhong and Xin 2010).
Operations Management/ICT Infrastructure Management
To manage and deliver high quality ICT service in line with business requirements in the
areas of Design and Planning, Deployment, Operations and Technical Support.

36
Service Delivery Domain – Tactical Level
Service Level Management (SLM)
“The goal of Service Level Management (SLM) is to maintain and improve IT service
quality, monitoring and reporting upon IT service achievements and investigation of actions
to eliminate poor service” (Meziani and Saleh).
Problem Management
Manages the lifecycle of all problems and minimizes the impact of the incidents that cannot
be prevented (Meziani and Saleh).
Financial Management
It is to manage an IT service provider's budget accounting and charging requirements
(Meziani and Saleh).
Capacity Management
The purpose is to ensure cost-justifiable IT capacity always exists and that it is matched to
the current and future identified needs of the business (Meziani and Saleh).
IT Service Continuity Management (ITSCM)
To support the overall business continuity management process and risks that could seriously
impact IT services (Meziani and Saleh).
Availability Management
Defines analyses, plans, measure and improves all aspects of the availability of IT services
(Meziani and Saleh).
Security Management
“To manage and control the security management process to meet external/internal security
requirements as it is found in SLAs, contracts, legislation and the company security policy”
(Meziani and Saleh).

37
Strategic Level
Business Perspective Metrics:
The goal of business perspective metrics is to deliver effective IT/Business alignment.
Appropriate alignment of business and IT is the Quality of Experience (QoE) (Brooks and Forum
2006; Forte 2007).
Continuous Service Improvement Programs (SIP)
The metric objective is to improve current process operation in line with business requirements.
(Brooks and Forum 2006; Forte 2007).
Risk Management Metrics
It is owned by the availability management process though a number of other areas using risk
management (Brooks and Forum 2006; Forte 2007).
Documentation Management
It is owned by the configuration management which helps to keep documentation control
standards (Brooks and Forum 2006; Forte 2007).
Competence, Awareness and Training (CAT)
To ensure that target levels of training and competence are met and maintained in the
organization to the level required by ISO20000 (Brooks and Forum 2006; Forte 2007).
Metrics for Program and Project Management:
It’s owned by the project office, which is “followed by appropriate project and programmed
standards of delivery, by use of Prince2 or similar project method standard” (Brooks and Forum
2006; Forte 2007).

38
3.7.6 Control objectives for information and related technology
The Control Objectives for Information and related Technology (COBIT) governance has been
generated by Information System Audit and Control Association (ISACA). COBIT is a
combining tool that gives permits the managers to link the activity among technical issues,
control requirements and business risks. The first Version of COBIT was produced in 1996 and
the latest version released in 2007 as V4.1 (Grembergen, 1997). According To COBIT
"governance of information systems is the reference of leaders and the board of directors, it
consists of structures, command and operation processes leading the IT of the enterprise to
support its strategies and business objectives, and allow them to expand” (Grembergen, 1997).
COBIT frameworks of 34 IT processes split into four coherent parts of process. In each of the
processes it defines the “scope, purposes and then lists and develops”. The four process are
divided into four areas (van Grembergen and de Haes 2009).
1. “Plan and organize (PO): Strategic dimension of IT governance
2. Acquire and implement (AI): Gather all process that impact resources
3. Deliver and Support (DS): Devoted to service offered to clients of the CIO
4. Monitor and Evaluate (ME): Controlling and monitoring everything” (Grembergen, 1997).
ITIL versus COBIT
Both methods share the same concepts and values concerning on the management of IT services.
But, ITIL structure approach is based on daily IT Service users and project managers for
monitoring. However, COBIT in the same way provides the needs of business and the desire to
associate supply with demand (Grembergen, 1997).
Table 6 shows the different phases and processes gathered from service delivery and service
support process defined by ITIL and COBIT.
ITIL COBIT
SERVICE
DELIVERY
Service Level management.
Financial Management for IT
Services.
Capacity Management.
IT Service Continuity Management.
Availability Management.
DS1 Define and manage service
levels.
DS2 Manage third-party services.
DS3 Manage performance and
capacity.
DS4 Ensure continuous service.
DS5 Ensure systems security
SERVICE
SUPPORT
Configuration Management.
Change Management.
Release Management.
Incident Management.
Problem Management.
Service Desk.
DS6 Identify and allocate costs.
DS7 Educate and train users.
DS8 Assist and advise customers
DS9 Manage the configuration.
DS10 Manage problems and
incidents.
DS11 Manage data.
DS12 Manage facilities.
DS13 Manage operations
Table6 ITIL/COBIT Processes (Silva Molina 2005; van Grembergen and de Haes 2009)

39
3.7.7 Benefits of ITIL- ITSM
There is a wide range of different published peer-reviewed journal and conferences to examine
the success factors of IT implementation especially in the field of ITSM-ITIL. According to the
Hochstein’s research study on ITIL, it is still on early stages. For example , The main benefit of
ITIL drove from “adapting and then following ITIL guidance through focusing on doing the right
things in the right order according to the decision of management, staff, vendors, customers and
users based on the business demand” (Marquis December 2009). The following table indicates
the summary of advantages recognized by ITIL based on the Hochstein’s research study based
on different aspects.
In New Zealand, Australia, and
United Kingdom
in six German companies
Concentrating more on IT service management Client/service orientation and the quality of IT service
More predictable communications Better efficiency due to standardization
Enhanced consultation with IT groups within the
organization
Process automation, transparency and comparability
through process monitoring and documentation
Smoother negotiation of service level agreements Business profitability and customer service quality are
always dependents on a high availability
Seamless end-to-end service Security of IT service and the performance (Meziani
and Saleh).
Table7 ITIL benefits (Porter 1996; Hochstein 2005; Potgieter BC 2005; Frank 2008; Marrone M 2010)
Moreover, According to Porter (1996) proposed that “improvements created by the ITIL best
practice do not lead to improvements for any organization”. Porter argues that a company should
focus on both the operational effectiveness and the strategic positioning. Also, continual
improvement is necessary to stay relevant in the market” (Porter 1996; Marrone and Kolbe
2011). In addition, an international survey on 441 organizations observed the benefits that ITIL
delivered to the IT firms. These research studies are based on two main questions such as “How
operational benefits and How strategic positioning of the IT organizations, specifically how the
perceived level of business-IT alignment maturity evolved as the adoption of ITIL increased”
(Marrone M 2010).

40
Here, is the summary of the result,
- If adoptions of ITIL increase, the number of realized operational benefits increases
accordingly.
- The higher the implementation of ITIL: the greater the operational and strategic benefits
to the organization.
Therefore, the study comes up with four fundamental remarks to that show the responsibility of
ITIL will increase “IF”:
- “The perception of the level of Business-IT alignment increases.
- The number of realized benefits increases.
- The usage of metrics to measure the benefits of the implementation increases.
- The numbers of benefits provided by IT that are acknowledged by the business Increases”
(Marrone and Kolbe 2011).
According to McNaughton et al (2010), McLaughlin and Damiano and Meziani and Saleh the
most essential parts of the organization which gets benefits from ITIL implementation is divided
into following areas:
- “Improved availability reliability and security of mission critical IT service.
- Improved end-users Satisfaction through a more professional approach service delivery.
- Document and communicate roles and responsibilities in service provision.
- Optimized IT infrastructure to provide for existing and anticipated business requirements.
- Reduce Cost / Known and manageable IT costs.
- More effective change management, enabling the business to keep pace with change and
drive business change to its advantage.
- Improved business productivity, efficiency and effectiveness.
- Increased skills and experience” (McLaughlin and Damiano ; Meziani and Saleh)
-
3.7.8 Metrics for IT service management process
Metrics for IT Service management or "metric" is just another term for a measure. Metrics define
what is to be measured for IT as well as: technology, processes and services. Metrics deliver the
feedback mechanism that allows management to navigate, control and guide IT toward strategic
objectives under continuous improvement process, and changing the process over time (Brooks,
2006). Moreover, the most important aspect in ITSM metrics is how to measure the stakeholder
benefits. For instance, the measures must be well understood and accepted by managers in
different level of organizations. According to Jurison, (1996), “The measures must be selected on
the basis of their ability to reflect the objectives of the stakeholders of the IT investment”
(Jurison 1996).
For instance, it has been estimated that IT expenditure of large amount of companies in the US
has profit margin at 2.2% of all revenues. Moreover, in the previous research study for the
Australian Financial Markets Association (AFMA), by Helen Kang et al, it recognized that, “IT
and other related communication expenses represent over 20% of organizations’ total
expenditure” (Kang and Bradley 2002). Also, McNaughton et al. claimed, “The important factor
41
that comes from IT today is based on the assurance that business performance grows constantly,
is measurable, and can be delivered at standard levels”. Also according to him, there are 50,000
ITIL certified professionals worldwide and 24.1% of IT managers in large organizations are
familiar with the ITSM-ITIL standards (McNaughton, Ray et al. 2010).
Every organization might use different techniques and approaches to improve measurements
process and performance (e.g. ITIL, ISO/IEC2000, and COBIT). These techniques could be a
comprehensive measurement method for individual processes and services to support fulfilment
of business. The two most important parts of ITSM in every organization are service desk and
help (Brooks 2006).
3.7.9 How to measure business- IT alignments
There are different literature studies that reviewed the various measuring approaches of “How
alignment should be measured and what should be measured”. Avison et al. (2004) concluded
that there is no agreement on the factors that can measure Business-IT alignment (Avison, Jones
et al. 2004; Marrone and Kolbe 2011). Researchers like, Das et al. (1991), Reich and Benbasat
(2000) and Luftman (2003) use multi-dimensional scales to measure the alignment as following
steps.
- Das et al. suggest five elements: “Formality, scope, participation, influences and co-
ordination” (Das, Zahra et al. 1991).
- Reich and Benbasat recommend four elements: “Shared domain knowledge, IT
implementation success, communication between IT and the business, and connection
between IT and business planning” (Reich and Benbasat 2000).
- Luftman considers six conditions while measuring: ”Communication Maturity,
Competence/Value Measurement Maturity, Governance Maturity, Partnership Maturity,
Scope and Architecture Maturity and Skills Maturity” (Jerry 2003).
3.7.10 Performance Measurements
Performance measurements (PMs) tasks are one of the most important subjects among
management accounting and operational research study in the past years. According to Lohman,
Fortuin, &Wouters noted that, “PM is an activity that managers perform in order to reach
predefined goals that are derived from the company’s strategic objectives. (Lohman, Fortuin et
al. 2004).In traditional PMs method the purpose is to reduce direct cost by lowered material cost,
higher amount of usage and huge volume of direct labor efficiency. On the other side, in recent
manufacturing methods and service process, focus is merely on comprehensible measures such
as quality, flexibility, and amount of time the process takes (Lohman, Fortuin et al. 2004).
Generally there are four types of PMs such as, Key result indicators (KRIs). Result Indicators
(RIs).Performance Indicators (PIs).and Key performance indicators (KPIs), “which tell you what
to do to increase performance radically” (David 2010).According to different sources and studies
the main significant aspects of performance are as bellow.

42
- Resources:
- “Expenses (e.g. service costs, distribution cost).
- Assets (e.g. inventory carrying costs)” (Bowersox and Closs 1996).
- Flexibility:
- “Volume flexibility: ability to respond to changes in demand.
- Delivery flexibility: ability to respond quickly to tight delivery requests.
- Mix flexibility: ability to respond to changes in the mix of products demand.
- New product and modified product flexibility: ability to respond to demand for
new products” (Bowersox and Closs 1996).
- Output:
- “Financial (e.g. sales, profit, return on investment).
- Time (e.g. customer response time, delivery lead time, on-time deliveries).
- Quality (e.g. reliability, shipping errors, customer complaints)” (Bowersox and
Closs 1996; Lohman, Fortuin et al. 2004).
Key Performance Indicators (KPIs)
According to the literature study, the Key performance indicator (KPI) is a metric, Value or
quantity. Values can calculate from any activity or process and it relates to collected data. The
KPIs provide the opportunity to compare against an internal or external object in order to
indicate of performance, such as, benchmarking of inside performance with external criteria.
However, the collection of different types of performance measure must be suitable for the
company’s strategic purpose and to shape competitive environment. For instance; “if technical
leadership and product innovation are to be the key source of a manufacturing company’s
competitive advantage, then it should be measuring its performance in this area relative to its
competitors” (Ahmad and Dhafr 2002; David 2010).In general the measured KPIs are divided
into six parts as below:
- “Safety and Environment,
- Flexibility,
- Innovation,
- Performance,
- Quality,
- Dependability” (Ahmad and Dhafr 2002)
In addition, if the service corporation comes to the new ideas in order to improve it and
differentiate in the market situation, it must control and monitor the process precisely to reach to
the desired level of quality. For instance, it is necessary the organizations whether is in the
service area or industrialized sector selecting different range of appropriate metrics to balance
them. But, majority of the organization utilize common principles to organize their systems.
Such as; accounting organization using common accounting principles as a short-term measures
which have to be frequently reviewed and calculated like, financial performance indicator,
technical performance indicator and efficiency indicator (Ahmad and Dhafr 2002).

43
3.7.11 Positive and negative consequence of measurements
Measurements improve performance and show the values in organization. The positive benefits
can be weighed against the negative consequences of not having a measurements program.
Table 8 shows the Positive and negative aspects of having measurements program(Brooks 2006;
Smith 2012).
Table8 Measurements advantages and disadvantages(Brooks 2006; Smith 2012)
Positive consequence of metrics Negative consequences of metrics
Provide the necessary tools to control an
organization
Reduces visibility resulting in loss of control
Make it easier to concentrate on the important
matters
Increases focus on "noise" instead of "what's
important”
Well-presented metrics make it easy to spot the
danger at time of correction it.
Decreases morality in an organization
Improve the morality in an organization
Inspires unhealthy political competition
Stimulate healthy competition between
process owners
Increases risk
Metrics help align IT with business goals.
Benefits are not apparent or realized
Drives efficiency, effectiveness and quality.
Cost effectiveness is not understood
Helps reduce Total Cost of Ownership (TCO) Customer complaints that can bring
improvements are lost
Inspires continual improvements
TCO not optimized

44
3.7.12 PMs Development phase
Firms must install processes and operate them continuously to review the system and
implementation design in order to use a collection of performance measures. Below table
summarized the steps of PMs Development phase.
Steps Actions
1 Clearly define the firm’s mission statement.
2 Identify the firm’s strategic objectives using the mission statement as a guide (e.g. profitability, market
share, quality, and cost).
3 Develop an understanding of each functional area’s role in achieving the various strategic objectives.
4 Develop global performance measures capable of defining the firm’s overall competitive position to
top management.
5 Communicate strategic objectives and performance goals to lower levels in the organization.
6 Assure consistency with strategic objectives among the performance criteria used at each level.
7 Assure the compatibility of performance measures used in all functional areas.
8 Use the PMs.
9 Periodically re-evaluate the appropriateness of the established PMs in view of the current competitive
environment.
Table9 PMs development steps (Andy, Mike et al. 2005).
Review process
To involve a measure that might be removed or deleted in a case of changing goal process
and strategy.
Implementing phase
The firm should allow the measurement to be done frequently by collecting and processing
the data while putting systems and procedures in place.
Design phase
To recognizing the key objectives and measurement design (e.g. Data Availability).
Data Availability: is one of the most significant aspects in design phase due to
updated PMs after implementation. According to Kaplan and Norton (1993) there
are different methods to provide better design for new system, such as:
“highlighting data collection, interview, collecting information and
documentation from seminar” (Kaplan 1993).
Use phase design
Mangers evaluate the measurement outcome to measure the strategy and process efficiency
(Lohman, Fortuin et al. 2004; Andy, Mike et al. 2005).

45
Here, are the four types of approaches to design and PMs Plan as following steps,
1. “Asking Methods: to find the needs of manager (Interview, group discussions, planning
meeting and surveys)
2. Prototyping: Is a set of primary requirement via communication with users of the system.
Requirements are updated or changed until the user is satisfied
3. Planning methods: To design suitable measure depends on the firm, like process, strategy
and customers.
4. Existing report: Useful source of information to be used to plan and design the PMs, (e.g. It
is possible to recognize the relevant report available in different levels in organization for
managing process)” (Kaplan 1993; Lohman, Fortuin et al. 2004).
3.8 Decision making process
Decisions made in metrics are based on absolute numbers, percentages and ratio, choosing
wrong metrics for the process might have negative impact on the businesses in long terms.
Metrics are absolute and do not clarify why things are good or bad. Many organizations use
efficiency metrics rather than incomplete metrics as a result of measuring only a portion of the
right productivity and not the false productivity which might lead to incorrect actions. According
to Shatzkin (2005), “most publishers really need to review their own metrics to be sure they are
not leading them to bad business decision” (Shatzkin 2005). For example, the Company would
be able to monitor performance and goal’s fulfilments with the form of the performance
indicator. As the earliest international manufacturing strategy survey (IMSS), which was carried
out in different parts of the globe found that, organizations use different indicators to measure
market performance and their company.
Additionally, to facilitate viewing effectively the standpoint of the full system and measuring all
aspects of manufacturing productivity, the organization must use an “improved methodology”.
This type of appropriate measurement methodology provides advanced management to
concentrate on limited sources which have the greatest influence on the product efficiency.
Moreover, it makes it possible to reach additional production capabilities as well as new
technology or new machinery. For example, the areas of quality, delivery, reliability, cost, and
delivery lead-time are the most important aspects of manufacturing performance to measure, and
analysis (Ahmad and Dhafr 2002).However, for each company it is significant to set priority to
the overview of performance gaps in order to identify the importance of each measurements and
performance area based on specific company’s policy, market situation and environment(Ahmad
and Dhafr 2002).also, the Key Performance Indicators (KPIs) for manufacturing performance
approach are different from each other based on the level of importance between cost, quality,
flexibility, delivery and inventory. For instance, the project survey that has been done to
recognize that KPIs performance are used by manufacturing strategy illustrated that,
profitability, conformance to specifications, customer satisfaction and overhead cost are the most
important elements to measure (Ahmad and Dhafr 2002).
46
3.8.1 Service Quality
The concept of Service Quality (SQ) becomes very important among researchers and IT
managers. IT is as an alternative need for measuring IT performance in IT department, It is
specifically vital for organizations to realize and measure customer’s perception of IT service
and listen to their needs in order to improve the level of service quality and performances within
an organization. First, Quality of IT service is specified and then turns into management control
as results of expanding a conceptual model of IT service quality and associated measurements
method (Kettinger and Lee 1994; Pitt, Watson et al. 1995). Service quality is divided into three
service delivery characteristics such as, Intangibility, Heterogeneity and Inseparability of
manufacturing and consumption.
The most important benefits of service quality characteristics are:
- “Improved decision making via greater information timeliness and quality
- Improved user satisfaction
- Cost saving
- Improve revenue
- Superior user ability and heavier system usage” (Galletta and Lederer 1989; Kang and
Bradley 2002).
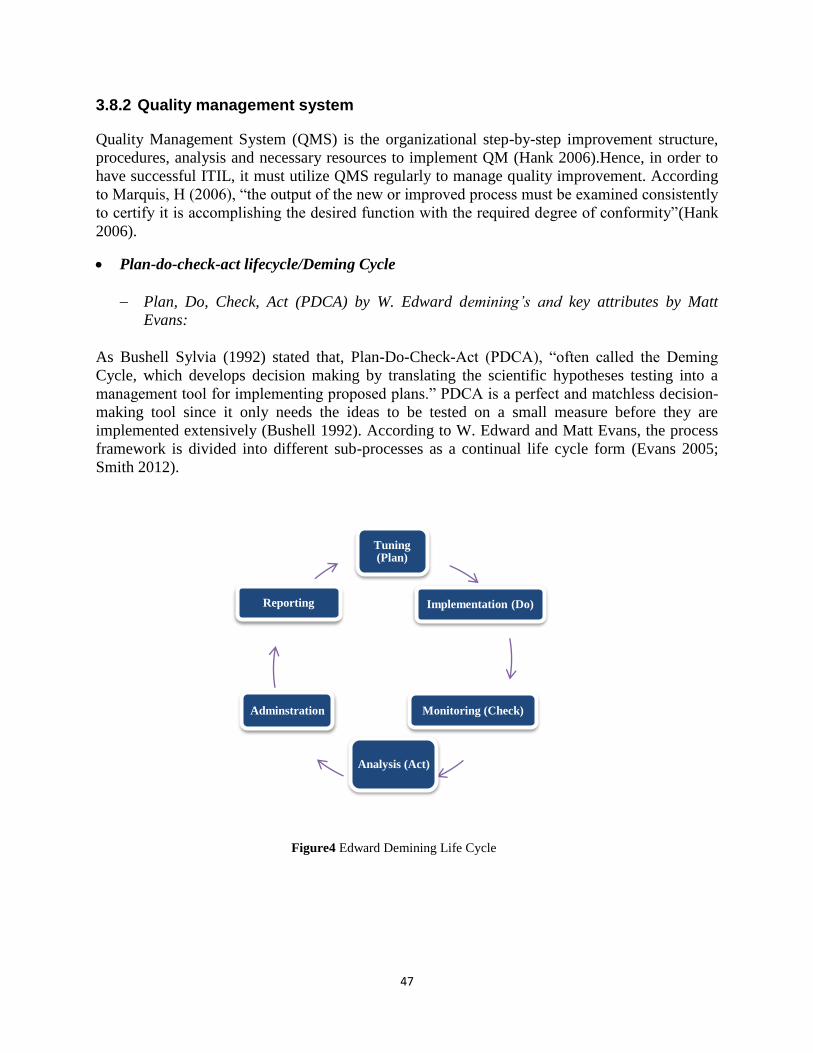
47
3.8.2 Quality management system
Quality Management System (QMS) is the organizational step-by-step improvement structure,
procedures, analysis and necessary resources to implement QM (Hank 2006).Hence, in order to
have successful ITIL, it must utilize QMS regularly to manage quality improvement. According
to Marquis, H (2006), “the output of the new or improved process must be examined consistently
to certify it is accomplishing the desired function with the required degree of conformity”(Hank
2006).
Plan-do-check-act lifecycle/Deming Cycle
Plan, Do, Check, Act (PDCA) by W. Edward demining’s and key attributes by Matt
Evans:
As Bushell Sylvia (1992) stated that, Plan-Do-Check-Act (PDCA), “often called the Deming
Cycle, which develops decision making by translating the scientific hypotheses testing into a
management tool for implementing proposed plans.” PDCA is a perfect and matchless decision-
making tool since it only needs the ideas to be tested on a small measure before they are
implemented extensively (Bushell 1992). According to W. Edward and Matt Evans, the process
framework is divided into different sub-processes as a continual life cycle form (Evans 2005;
Smith 2012).
Figure4 Edward Demining Life Cycle
Tuning (Plan)
Implementation (Do)
Monitoring (Check)
Analysis (Act)
Adminstration
Reporting

48
The below table represent the responsibility of each sub-processes during decision-making
process.
Deming Cycle Responsibilities Tuning (Plan) Identifying improvement opportunities and
recommendations for the subject process that is being
measured.
Implementation (Do) Implementing the recommended changes through
normal change management processes.
Monitoring (Check) Responsible for the data gathering, calculations and
validation of the required measurements.
Analysis (Act) Comparative, causal and predictive analysis of the
measurements to determine what corrective actions
may be required.
Administration (Additional sub-process) Administration of the activities associated with the
maintenance of the metrics and measurement database.
Reporting (Additional sub-process) Reporting the findings and recommendations to
management and various stakeholder groups, keeping
them informed and aware.
Table10 Demining Cycle Responsibilities (Evans 2005; Smith 2012)

49
Key Attributes by Matt Evans:
Continuous improvement of technology service and doing value-based measurement service
needs an IT organization to implement different activities based on “what they want to achieve
and not on what they want to measure”. The main achievement of IT must be the effective
alignment of services with the present and the future requirements of the business and its
customers (Evans. 2005). The below table shows some of the key attributes provided by Matt
Evans (2005) that should be measured during the plan-do-check-act lifecycle of IT metrics
management (Evans. 2005).
Attributes Explanation Vision Identifying the people, processes and technologies that are
required to support the future state vision.
Assess Evaluate the current state of any existing measurement
system
Staffing IT measurement is primarily built around people with clear
roles and responsibilities to ensure efficiency
Documentation
The IT measurement process should also be captured and
documented.
Communication Is required for measurement sustainability and ensures the
entire organization understands and supports the program.
Consistency The core building blocks of measurement should be
established with consistency in order to minimize
measurement costs.
Control With the advent of IT governance, Sarbanes-Oxley and other
legislative requirements, metrics and measurement should be
monitored for completeness, accuracy, validity and
appropriate authorization prior to commencement of any
related activities.
Prototype/proof-of-concept A prototype measurement project may be a key activity in
demonstrating value to the business.
Prioritize Any measurement results should be used as an input for
prioritizing the service improvement program portfolio.
Reporting
Measurement results need to be rationalized, rolled-up and
reported in a non-technical format, to the appropriate
business audience in order to add business value.
Bottom Line IT measures must have context to have meaning. The
appropriate context derived by deciding and investments in
measurement to provide business value.
Table11 Key Attributes By Matt (Evans. 2005)
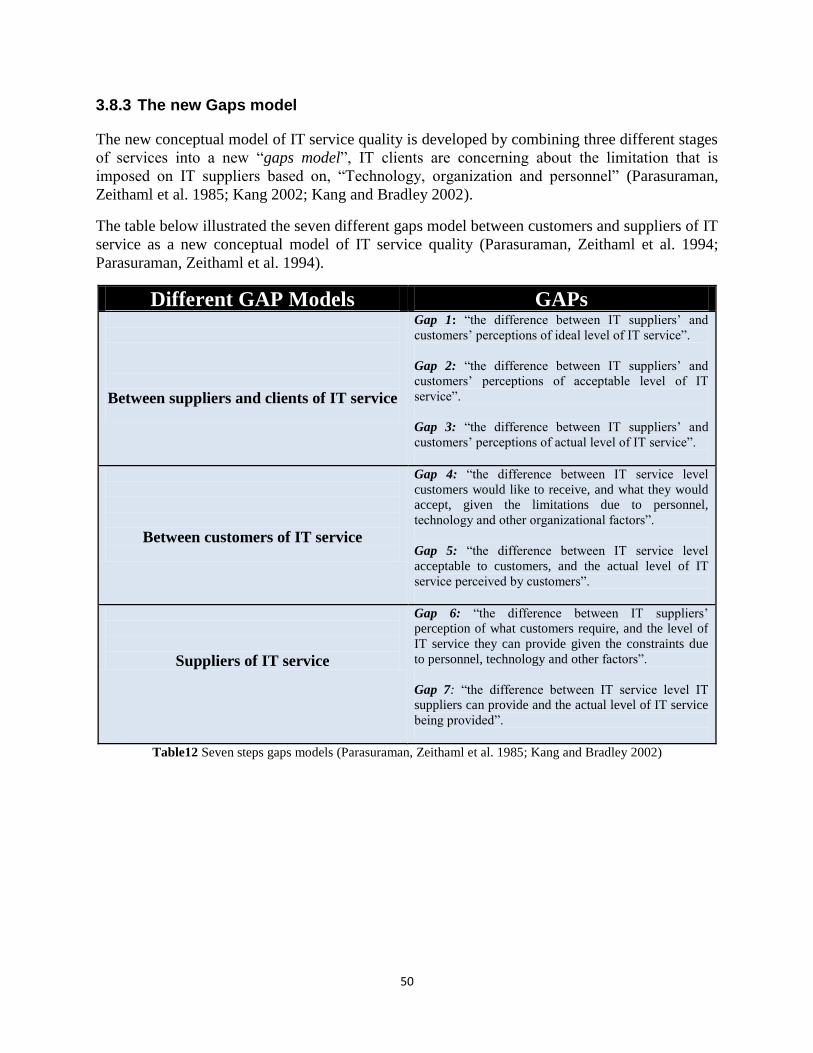
50
3.8.3 The new Gaps model
The new conceptual model of IT service quality is developed by combining three different stages
of services into a new “gaps model”, IT clients are concerning about the limitation that is
imposed on IT suppliers based on, “Technology, organization and personnel” (Parasuraman,
Zeithaml et al. 1985; Kang 2002; Kang and Bradley 2002).
The table below illustrated the seven different gaps model between customers and suppliers of IT
service as a new conceptual model of IT service quality (Parasuraman, Zeithaml et al. 1994;
Parasuraman, Zeithaml et al. 1994).
Different GAP Models GAPs
Between suppliers and clients of IT service
Gap 1: “the difference between IT suppliers’ and
customers’ perceptions of ideal level of IT service”.
Gap 2: “the difference between IT suppliers’ and
customers’ perceptions of acceptable level of IT
service”.
Gap 3: “the difference between IT suppliers’ and
customers’ perceptions of actual level of IT service”.
Between customers of IT service
Gap 4: “the difference between IT service level
customers would like to receive, and what they would
accept, given the limitations due to personnel,
technology and other organizational factors”.
Gap 5: “the difference between IT service level
acceptable to customers, and the actual level of IT
service perceived by customers”.
Suppliers of IT service
Gap 6: “the difference between IT suppliers’
perception of what customers require, and the level of
IT service they can provide given the constraints due
to personnel, technology and other factors”.
Gap 7: “the difference between IT service level IT
suppliers can provide and the actual level of IT service
being provided”.
Table12 Seven steps gaps models (Parasuraman, Zeithaml et al. 1985; Kang and Bradley 2002)

51
3.8.4 SERVQUAL development
“SERVQUAL means to measure the scale of Quality in the service sectors” and it is developed
in the mid-80s by three researchers Zeithaml, Parasuraman& Berry (1988), as a multiphase and
systematic research study to focus on measurement of Service Quality.
Moreover, survey questions were created and distributed based on IS SERVQUAL in order to
measure the gap between customer expectations and their knowledge of user views of service
quality and their satisfaction with the IT services (Parasuraman 1988). The table below
represents one part of summary analysis of potential framework which is collected by
McNaughton et al., (2010). The purpose is to manage greater improvement on service quality.
Method Description What is
assessed
Applicability
to ITIL
Complexity Level of
prescription IS Adapted
SERVQUAL
“Developed in
marketing to measure
service quality through
the constructs of
tangibles, reliability,
responsiveness,
assurance and
empathy”
IS Service
Quality
“Medium: Useful
for assessing any
ITSM
improvement
effort”.
“Low: survey
construction and
analysis of data
required”.
“Medium: survey
questions defined
but method of
analysis is
managerial
choice”.
Table13 Summary analysis of potential evaluation frameworks for ITSM-ITIL (McNaughton, Ray et al. 2010)
3.8.5 SERVQUAL measurement aspects from different views
SERVQUAL has been measured by analyzing on ten different features of service quality. It is
called as a difference scores (reliability, competence, courtesy, communication, credibility,
security, access, understanding the customer tangibility, and responsiveness). However in 1985,
many researches were redesigned to the useful model like service quality “Gaps model”. It has
been done in five dimensions based on Reliability (REL-SQ), Assurance (ASSU-SQ), Tangibles
(TANG-SQ), Empathy (EMP-SQ) and Responsiveness (RESP-SQ). It helped beginning the
process of expanding tools for measuring customer’s assessment of service quality performance
(Kang and Bradley 2002).
Besides that, Francis Buttle analyzed SERVQUAL in the article "SERVQUAL: review, critique,
research agenda” and also summarized five scopes of SERVQUAL’S like Reliability,
Assurance, Tangibility, Empathy and Responsiveness. He mentioned that “the model fails to
draw on established economic, statistical and psychological theory while SERVQUAL’s face
and construct validity are in doubt. It is widely used in published and modified forms to measure
customer expectations and perceptions of service quality”(Francis 1996). Furthermore, Kettinger
and Lee (1994) used the SERVQUAL instrument to deliver more specific information about
“how users of IT department perceive the quality level of IT services being provided”. The study
suggested that, present measures of IT performance, like as user satisfaction may not be
comprehensive enough to capture the more detailed dimensions of service quality covered in
SERVQUAL”. (Kettinger and Lee 1994; Pitt, Watson et al. 1997).
52
Finally the study concluded that SERVQUAL could facilitate additional focus in measuring the
“functional dimensions of IT service”. It also encourage using “difference scores” methods as a
result of customer satisfaction (Kettinger and Lee 1994; Pitt, Watson et al. 1997).

53
4 EMPRICIAL FOUNDATIONS
4.1 Purpose
Having reviewed the literature of ITSM from different scientific sources, a case study will be run
to gather enough information for assessing the situation of ITSM in different organizations. In
this part as mentioned before in the methodology part, the needed information has been extracted
from different methods (i.e. in-depth semi-structured interviews). In this empirical attempt, some
of Swedish IT-related firms have been gone through in investigations.
Currently, it seems that there is no comprehensible ITSM framework system for IT
organizations. Usually the organizational managers within different levels of organizations are
hesitant in choosing trustworthy methods of measurement framework in using the systems. Thus,
the aim is to gain insight into the determinants that encourage effective and reliable metrics
within IT organizations for the purpose of improving ITSM framework upon the future and a
complete model of framework.
4.2 Case study background
Selecting the best-known set of metrics for managing IT services (ITSM) such as ITIL is the
most significant task for the managers. In this thesis, the author tries to introduce the most
important metrics according to ITIL and COBIT guidelines. Afterwards, these metrics will be
evaluated in a real-world case study at three different companies in Sweden.
The collected case samples for this empirical study for this thesis has been conducted in co-
operation with Innovation Lab in University of Borås (who were involved in this project- the
database of the ITSM system installed in DB Schenker, SCA and SOGETI) and an interview
from IT Manager of a German logistics company-DB Schenker as an organization which
provides transports, logistics and information services that meets the market-demands such as
quality, high efficiency, simplicity and environmental responsibility. In brief, DB Schenker has
around 4,000 employees, 4,000 loading units, 6,000 employees in 300 cooperative haulers,
42,000 agreement customers, 17.4 million goods and parcel consignments handled in each year,
83,600 sea and air consignments a year in Sweden, having a turnover of about 14.7 billion SEK,
and Invests in quality – ISO 9001, Active environmental work – ISO 14001 and, National
covering network and frequent departures (DB Schenker 2010).
The above-mentioned companies receive thousands of applications and requests daily that can be
treated as ITIL incidents or any software tools that is certified by the Office of Government
Commerce (OCG), with ITIL V3 certification for Incident, Management, Change Management
and problem management.
So, here a purpose of sampling strategy is underlined by a typical case sampling and selected
ITSM strategist as research information. The considered the goal was to explore, analyze and
54
compare the measurement methods in three different companies and design numbers of
imperative KPIs from informants and earlier studies that examined tasks both internally and
externally form dissimilar point of view.
In this part, I will explain what has to be considered in order to extract a log from such an ITSM
system in order to utilize them for advance analysis.
4.3 Procedure
To perform the case study in an efficient way, the question was sent to our respondent by an e-
mail on November 15th, 2012. The interview question contained a short describing part about the
purpose of the interview and the reason why the results are meaningful to IT-managers.
Approximately a week after, I received the answers. In total, 6 answers to the producers have
been received which are helpful for the analysis part.
The reason of selecting DB Schenker is background, as Fredrik (IT-Manager in DB Schenker)
mentioned, this company is: “historically not caring enough about the maintenance objects and
generally, focused on moving on to the next business development situation within incorporated
some parts of ITIL mostly in the fields of IT Support, Incident, Problem Management and
Deployment fields and apply some parts of the COBIT framework”. This feature can give
accurate answers to the provided questions. Finally, the outcome from the interview will be
presented in sections below.
4.4 The interview
In order to prepare for the research interviews, decisions were made based on the research plan.
These decisions involved different companies to study and various types of data and
documentation of interviews. The provided questions were designed based on interview
technique, which it was related to identified subject and concept.
Moreover, while managing the theoretical study, certain data from different sources were
recognized which directly related to the research questions such as, the book, “Metrics for IT
Service Management”; these models were used as a root for framing the interview questions.
As mentioned above, the primary interview questions were twelve in total but after evaluating
the questions based on the relevancy, seven were selected. The questions in the interview were
then examined and reviewed with fellow colleagues and one of the Assistant Professors-Nicklas
Salomonson (Ph.D.,),an Assistant Professor in Business Administration at the School of
Business and IT, University of Borås- to discuss for possible confusions due to irrelevancy or
incorrect sentence structure. Also, the questions were structured as open-ended to allow the
candidate freely elaborate whenever essential.

55
In addition, the process of semi-structured interview is identified and pre-arrangements related to
specific date, time, and place of the interview and also sharing and collecting the data gathered
from parts of the project “Efficient IT service Management ” in University of Borås were
undertaken.
Semi-structured interview : A semi-structured interview is a data generation technique in
which an interviewer and informant schedule a meeting for the sake of sharing information
concerning predetermined phenomena (2008; 2008).
4.5 Findings
DB Schenker model presented by maturity assessments based on the Capability Maturity Model
Integration (CMMI) and some parts of ITIL and COBIT frameworks will together become a
model suiting the ITSM performance framework. In addition, this model contributes to this area
with helpful guidelines and supports for implementation projects in general. A vital factor to
extend the model as Fredrik mentioned is to find common denominators between different
organizations and to find the targets which are built in different ways depending on whether you
sell services or produce a product. Thus, to succeed the organization must be updated and to have
the market knowledge in mind through the tasks.
Circumstances and identified problems
Fredrik (Interview, 2012-12-08) has divided the identified problems into different categories
such as system and limitations within the system, internal and external.
Firstly, as Fredrik stated: “there is a lack of knowledge about understanding the concept of ITSM
evaluation framework in employees and managers”. The purpose is not fully known by either the
employees working in his department or any other department nor the managers and
management team .The knowledge of why and how to use it is at a basic level. Secondly,
historically the company does not care enough about maintenance objects situation that a project
leaves behind. Thirdly, it is a hard task to create best practice for the organization on both
corporate level and process level. However, at the corporate level this is accepted and it works,
but at a process level some problems are encountered due to the fact that different initiatives are
colliding. There are contradictory efforts due to the fact that knowledge about the framework is
not that widely spread and is also not accepted.
Fourthly, the framework of handling IT service (ITSM) is not fully evolved. For instance, at the
metrics level there are some problems when setting incoherent targets that are incongruent.
However, as he mentioned, it would be manageable at some points. Furthermore, the company
monitors the overall performance of the system mostly in a reactive process but there are quite
weaknesses in the areas of learning from the system performance such as; Inquiry/ feedback of
the system or the measurement performance.

56
4.5.1 Measuring operation
The following section presents the part of the empirical study that concerns and identifies the
measuring system of IT in DB Schenker Sweden, SOGETI and SCA identified. During the
empirical study different possibilities in measuring and comparing the KPIs in different groups
were found. In the following section, measuring operations, visualization of measurements and
Key Performance Indicators will be presented.
DB Schenker’s
The IT manager described that, there are different parts of ITIL that are incorporated in the fields
of IT Support, Service desk SLA’s, Incident and Problem management and Deployment fields.
The most important parameters to measures are targeting Time Deliveries in different channels
such as, General Service management of core system functions, Business projects, Activities,
Operational maintenance and Admin. Other aspect that could be measured is Service
improvement with providing surveys based on a yearly basis (on process and maintenance object
level) to improve and monitor the overall performance of the systems.
Fredrik suggests that: “it is always tricky to find common denominators in validity of the metrics
on both corporate level and process level between different organizations. And the goals and
targets are constructed in different ways depending on whether you sell services or produce a
product”. Also he stresses on the importance of working with the measurement to acknowledge
the fact that the businesses in themselves are responsible for the discontinued operation and the
development of the maintenance object (foremost systems and applications). Moreover, Fredrik
argues that: “the company specific context must always be handled when assessing/evaluating
the maturity level. And it must also be very detailed in how you interpret the different
statements. If you do not document, how can you interpret the statement and what you answered
regarding the context. It is impossible to get a good longitudinal result and you won’t know if it’s
improved/matured due to the answers to “different” question are based on different
interpretations. So, for understanding whether you are matured as an organization or not, you
should consider that you assess yourself on the same criteria. This is very important in the field
of IT due to the advanced and complex nature of it”. He also mentioned that, “the vital part of
struggle to integrate ITSM into the business is focusing on the system ownership by creating a
business-wide process for assigning responsibility and accountability for all systems and
applications. This process is mapped to different roles whereas the IT department often takes the
role as service managers acting on behalf of the system owner”.
Visualization of measurements
DB Schenker IT Manager mentioned: “As we are a part of the DB Schenker, there are of course
internal demands imposed on us to be compliant to COBIT. However, they apply only to some
parts of COBIT framework and not all parts”. In addition, he mentioned that, KPIs should drive
the improvements in the organization and he exemplifies with that not all measure are usable and
some specific KPI’s have contributed to a deeper understanding of the importance of measuring
different fields, and to create best practice in this field is a very hard task and I feel that the
future project will be successful in bring new insights into the question of what contexts specific
business metrics can do. The project has not really created a best practice due to the fact that
ITSM metrics are very affected by the specific business niche of the company in question. He

57
also proposes that, the suggested metrics from the future project (EFFIT) has a good mapping to
what we earlier have used to reveal the underlying problem. Moreover, he emphasized that the
metrics which have been chosen to be use in the IT department are a high extent derived from
DB Schenker’s business strategy. There needs to be an unquestionable relation to the overall
business goals regardless of whether you produce products or services.
Key Performance Indicators in DB Schenker operations
Fredrik mentioned that the major benefits from using the ITSM framework related to the
responsiveness. This area relates to method of binding to the needs of business strategy, which
demands fast moving activities. At the corporate level, this is accepted and is working but at a
process level they encounter a number of difficulties due to the fact that different plans are
crashing.
He also mentioned the importance of using a set of KPIs to measure performance and monitoring
the overall performance of the system but it is mostly a reactive process. And similarly, the
different SLA’s (Help desk) that are provided are of course monitored and the deviations render
task to improve the service. These tasks are performed on a yearly basis with the exception of the
debriefing sessions after large-scale incidents. Moreover, he discusses that different KPIs are
interesting for different stakeholders and different parts of organization. According to his
discussion, about 10 different numbers of KPI’s currently exists are useful for a corporation and
the most important ones are, general service management of core systems/functions, business
projects, activities (less than 50 hours of work), operational maintenance and admin. Incident
management and problem management when deploying application and SLA’s (help desk).
Additionally, in the classical ITIL disciplines there are a lot of cooperation and common
functions within organizations. Hence, it is not possible to use the metrics that are common for
the whole group as they are hard to draw usable conclusions form.

58
Collected metrics from DB Schenker
ITSM Metrics Sources 1 Business projects DB Schenker
2 Distribution of time between services information DB Schenker
3 General Service management of core systems/functions DB Schenker
4 Deployment DB Schenker
5 Delivery times, Productivity delivery time, Delivery performance DB Schenker
6 Number of support incidents per day DB Schenker
7 User Satisfaction DB Schenker
8 Time spent per case, Time required per unit of production fixes DB Schenker
9 Number of cases DB Schenker
10 Responsiveness DB Schenker
11 Number of incidents, Number of recurring errors, Number of incidents on
average per day and terminal, Number of incidents on average per day per
category, Rate of Incident handling
DB Schenker
12 Activities DB Schenker
Table14 collected metrics from DB Schenker
Collected metrics from SCA and SOGETI
ITSM Metrics Sources 1 User Satisfaction SOGETI
2 Competency profile SOGETI
3 Productivity SOGETI
4 Delivery Times SOGETI
5 Time required per unit of production SOGETI
6 Delivery performance, outcomes in relation to financial SOGETI
7 Survey SOGETI
8 Proactivity SOGETI
9 Distribution of time between services / information SOGETI
10 Number of line of code SOGETI
11 Number of function SOGETI
12 Number of program SOGETI
13 Number of support incidents per day/Per Month SCA
14 The number of hours of support for non-business hours SCA
15 Time per support case SCA
16 Incident management in hours per month
SCA
17 Skills Widening of hours per month. SCA
18 Number of planned deliveries compared with the actual delivered SCA Table15 collected metrics from SCA and SOGETI

59
4.6 Study on comprehensible framework model
In this part, the researcher attempts to gather as much as information related to its research as
possible. In this case, the researcher visited different scientific sources as well as visiting the
innovation-lab at university of Borås in order to collect as much ITSM metrics as possible. At
first blush, it seems that users of the implemented IT service management in DB Schenker are
satisfied with it and the benefits are visible to them. The ITSM has integrated different
departments of the organization and the results are noticeable in service quality, in the time and
cost efficiency. In fact, as I understood there are no clear, reliable and comprehensible sources
for IT managers to access ITSM. Therefore, collecting of metrics with categorized details could
be considered as a reliable database and can be guidance to the managerial level for better
decision-making supports.
However, The IT manager in corporation gave this opportunity to researcher to use and have
access to some of the organization metrics. At the first blush, I collected as much as possible
ITSM process and metrics from different sources and then divided into different categories based
on the IT Service Management Process, Metrics title, Frequency1, Internal and external
2 and
more details. But, before implementing metrics the firm must identify the strategic objective to
contribute ITSM framework and to use the mission statement as a guide, such as, profitability,
quality, cost, flexibility and innovation to evaluate the relevancy of established performance
measures in view of the current competitive environment (Andy, Mike et al. 2005).
Moreover, the author collected different example of IT service management metrics in appendix
chapter which could be used as roots for an IT service management framework.
1 Frequency: Is an indication of how often an organization should measure with this particular measurement.
2 Internal and external: Describes if the measurement is internally or externally.
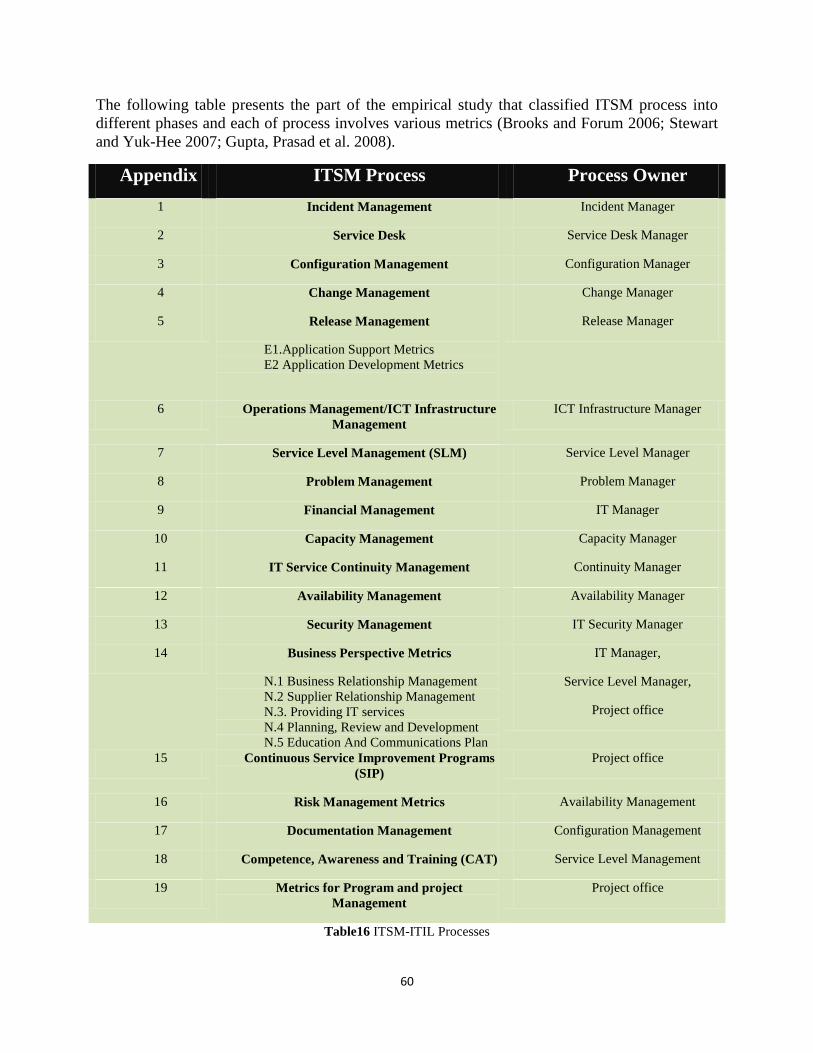
60
The following table presents the part of the empirical study that classified ITSM process into
different phases and each of process involves various metrics (Brooks and Forum 2006; Stewart
and Yuk-Hee 2007; Gupta, Prasad et al. 2008).
Table16 ITSM-ITIL Processes
Appendix ITSM Process Process Owner
1 Incident Management Incident Manager
2 Service Desk Service Desk Manager
3 Configuration Management Configuration Manager
4 Change Management Change Manager
5 Release Management
E1.Application Support Metrics
E2 Application Development Metrics
Release Manager
6 Operations Management/ICT Infrastructure
Management
ICT Infrastructure Manager
7 Service Level Management (SLM) Service Level Manager
8 Problem Management Problem Manager
9 Financial Management IT Manager
10 Capacity Management Capacity Manager
11 IT Service Continuity Management Continuity Manager
12 Availability Management Availability Manager
13 Security Management IT Security Manager
14 Business Perspective Metrics
N.1 Business Relationship Management
N.2 Supplier Relationship Management
N.3. Providing IT services
N.4 Planning, Review and Development
N.5 Education And Communications Plan
IT Manager,
Service Level Manager,
Project office
15 Continuous Service Improvement Programs
(SIP)
Project office
16 Risk Management Metrics Availability Management
17 Documentation Management Configuration Management
18 Competence, Awareness and Training (CAT) Service Level Management
19 Metrics for Program and project
Management
Project office

61
4.7 Empirical study results
To sum up my result from our case study, I would like to say that the current system with all its
features and modules is capable of performing all the ITSM performance mentioned in the
literature. But due to the identified problems and the competitive situation in the market, some of
the important departments of the organization need to be update and improve the ITSM
framework. According to interview, they apply about ten different KPIs. The most important
KPIs are related to those targeting value such as, time delivery in different channels, Number of
recurring errors as Incident and the number of cases measurements process which are common
between other corporations. In analysis part, the reasons and suggestions for improvement will
be discussed in more details.
# Metrics ITSM Process Owner INT/EXT Frequency 1 Business projects Competence, Awareness
and Training (CAT),
Metrics for Programmer
and project Management
DB Schenker’s Internal (Dependable)
2 Distribution of time
between services
information
Operations Management DB Schenker’s Internal,
External
(Dependable)
3 General Service
management of core
systems/functions
Availability
Management, Service
Desk
DB Schenker’s Internal (Dependable)
4 Deployment Operations
Management/ICT
Infrastructure
Management
DB Schenker’s Internal Yearly
5 Productivity delivery
time/Delivery
performance
Delivery Capacity DB Schenker’s,
SOGETI
Internal,
External
(Dependable)
6 Number of support
incidents per day
User Support, Support
and Case Management,
Availability
Management, Incident
Management
DB Schenker’s,
SCA
Internal Daily
7 User Satisfaction Service Desk, Incident
Management, Problem
Management, t,
Financial Management,
Capacity management,
IT Service Continuity
Management, Business
Perspective Metrics
DB Schenker’s,
SOGETI
Internal,
External
(Dependable)
8 Time spent per
case/Time required
per unit of
production fixes
Delivery Capacity,
Release Management
E1.Application Support
Metrics.
DB Schenker’s,
SOGETI
Internal,
External
(Dependable)
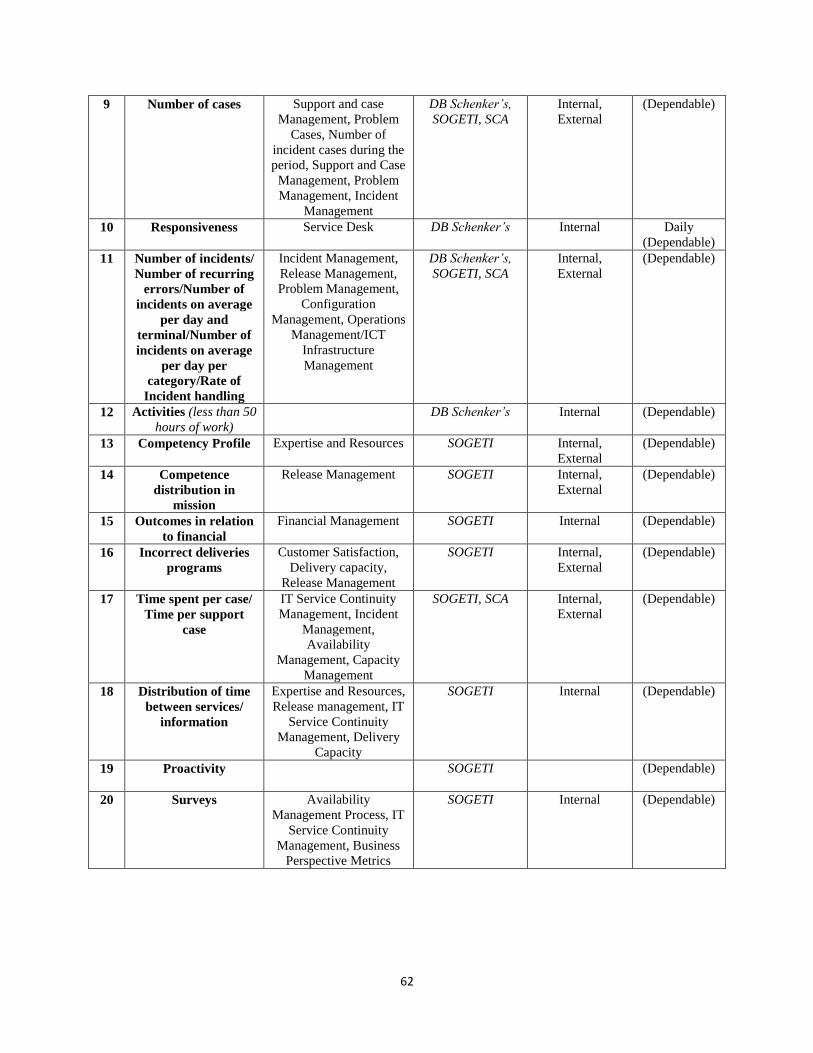
62
9 Number of cases
Support and case
Management, Problem
Cases, Number of
incident cases during the
period, Support and Case
Management, Problem
Management, Incident
Management
DB Schenker’s,
SOGETI, SCA
Internal,
External
(Dependable)
10 Responsiveness
Service Desk DB Schenker’s Internal Daily
(Dependable)
11 Number of incidents/
Number of recurring
errors/Number of
incidents on average
per day and
terminal/Number of
incidents on average
per day per
category/Rate of
Incident handling
Incident Management,
Release Management,
Problem Management,
Configuration
Management, Operations
Management/ICT
Infrastructure
Management
DB Schenker’s,
SOGETI, SCA
Internal,
External
(Dependable)
12 Activities (less than 50
hours of work)
DB Schenker’s Internal (Dependable)
13 Competency Profile
Expertise and Resources SOGETI Internal,
External
(Dependable)
14 Competence
distribution in
mission
Release Management SOGETI
Internal,
External
(Dependable)
15 Outcomes in relation
to financial
Financial Management SOGETI
Internal (Dependable)
16 Incorrect deliveries
programs
Customer Satisfaction,
Delivery capacity,
Release Management
SOGETI
Internal,
External
(Dependable)
17 Time spent per case/
Time per support
case
IT Service Continuity
Management, Incident
Management,
Availability
Management, Capacity
Management
SOGETI, SCA
Internal,
External
(Dependable)
18 Distribution of time
between services/
information
Expertise and Resources,
Release management, IT
Service Continuity
Management, Delivery
Capacity
SOGETI
Internal (Dependable)
19 Proactivity SOGETI
(Dependable)
20 Surveys
Availability
Management Process, IT
Service Continuity
Management, Business
Perspective Metrics
SOGETI
Internal (Dependable)

63
21 Number of lines of
code
Release Management -
Application
Development Metrics,
Technology, Availability
Management
SOGETI
Internal (Dependable)
22 Number of functions
Technology, Availability
Manager, Operations
Management/ICT
Infrastructure
Management
SOGETI
Internal (Dependable)
23 Number of programs
Technology, Operations
Management/ICT
Infrastructure
Management
SOGETI
Internal (Dependable)
24 Total number of
support hours per
month
Support and case
management
SCA Internal (Dependable)
25 Number of planned
deliveries compared
with the actual
delivered
Release Management, IT
Service Continuity
Management, Risk
Management Metrics
SCA Internal,
External
(Dependable)
26
Skills widening of
hours per month.
Competence, Awareness
and Training (CAT)
SCA
Internal (Dependable)
27 The number of hours
of support for non-
business hours
Competence, Awareness
and Training (CAT),
Incident Management
Process, Operations
Management/ICT
Infrastructure
Management, Support
and case
management/Availability
management
SCA Internal,
External
(Dependable)
28 Number of faulty
production settings
Incident Management,
Problem Management
SCA Internal
(Dependable)
29 Estimated time in
relation to the time
spent
Delivery Capacity,
Release Management
SCA Internal (Dependable)
30 Number of support
incidents per month
Support and case
management, Release
Management-
E1.Application Support
Metrics, Problem
Management
SCA Monthly
(Dependable)
Table17 Collected metrics
Looking at the representation of the significant metrics and related ITSM Process to each metric
from three different owners, it has to be shown that not all firms could be apply same techniques
and measuring model to their service performance but also , they could practice other firms
ITSM metrics into their IT management process. Here, more investigation is compulsory in how
successful IT firm’s metrics can be used for improvement of complicated business.

64
5 ANALYSIS AND RESULTS
5.1 Analysis
Here, the spotlight of this chapter is to analyse the secondary and primary information presented
in theoretical framework and empirical findings. I gathered some information from different IT
firms in Sweden to analyse the conditions of building an effective ITSM framework in the IT
organizations .The analysis will track the description on research design chapter. The structure of
analysis will follow the same order with research questions.
Comparative analysis
What are the operational needs related to ITSM framework and how to improve ITSM
efficiency?
Starting with the ITSM framework at DB Schenker, we can easily narrow down the root
cause by looking at the overview of unsatisfied rules in the company’s framework. Through
empirical findings, if we look carefully at the situation of the company in adopting efficient
ITSM framework, IT managers in large organizations are familiar with the ITSM-ITIL
framework but they might not be familiar with other best practices, management techniques
and other standards to apply with ITIL implementation (McNaughton, Ray et al. 2010;
Marquis december 2009). On the other hand, some of the main reasons for ITIL fails is
because of human errors and they think ITIL best practice is a project and when is over is
done (Hank 2006), lack of unit and cohesion structure between metrics, insecurity and doubt
about what to measure (Lohman, Fortuin et al. 2004). According to investigation, DB
Schenker used different parts of ITIL mainly in the fields of IT support, Incident
Management, Problem Management and Deployment fields and some parts of the COBIT
framework. This refers to the integrating the CMMI and also some part of COBIT framework
with ITIL-best practice due to improve management techniques.
From theoretical research result, there are different practices to reduce operational problems
and support ITSM-ITIL usage includes appropriate target setting through a Process Maturity
Framework (PMF), Rigorous auditing and reporting through a Quality Management System
(QMS) ITIL, Project management and a Continuous Service Improvement Program (CSIP)
(Hank 2006). The specified definitions are quite broad. To clarify these definitions in more
points, literature further explains successful ITIL implementation it comes from leadership
skills and empowers staff at different phases.
In addition, according to literature study in order to improve the system performance, it is
impartiality necessary while an organization tries to implement ITIL or other best practices to
employ SERVQUAL as a technique to undergo a Gap-analysis. Gaps indicate IT process
failure as combated to CMMI in an observational form. This refers to the part SERVQUAL
measurement aspects views (Parasuraman 1988). Applying SERVQUAL approach to
measure the scale of service in the service sectors like, responsiveness, competence,
reliability, communication, security, customer needs and tangibles (Hank 2006).
65
Furthermore, PMs Development phases such as, asking method, prototyping, planning
methods, existing report are the four main types of approaches to continuously review the
system performance.
What are the main strength and weakness points of the ITSM Performance in the practical
areas?
There's a clear ambivalence between both managers and users when it comes to system
performance. According to Kang and Bradley (2002) “there is an essential needs for
managers to measure their service performance with large investment and capital expenditure
as an IT Service”(Kang and Bradley 2002). Further, measurement have positive and negative
consequences, like in some pioneer IT organization it’s easy for the mangers to concentrate
only on the important problems, drives efficiency and quality and helps to reduce Total Cost
of Ownership (TCO) by increasing system performances (Brooks 2006; Smith 2012).
According to interview, Fredrik stated that their organization dealing with lack of system
performance, like monitoring only reactive process and different SLA’s in organization on
yearly bases only. This issue refers to measuring system performances, continuous quality
improvement and review.
According to finding, many people in organization put their efforts to improve the efficiency
of ITSM of their corporation. But lack of communication between users and IT service
managers and decentralization are some other examples of system weaknesses. In the case of
DB Schenker, the most strength they have from the system is related to Responsiveness and
Monitoring the overall performance as a result of designing framework in a way to supports
fast responses in deviations and planned changes, but it is mostly a reactive process. For
example, the different SLA’s that provide are monitored and the deviations render task to
improve the services (DB Schenker, E-mail communication, 2012-11-15).
What are the impact of ITSM-ITIL on IT /business operation?
ITSM is the key objective in organization. And as ITIL stated that; ITIL process approach
means that process has to be controlled and managed over more than one area surrounded by
traditional hierarchical construction (Marquis December 2009). Therefore ITSM increase the
level of the communication efficiency between business departments, and provides a
structure in order to plan, research and implement IT services. According to literature, the
needs of ITSM-ITIL best practice in organizations can be changes in the ways they do
business, operate, develop, innovate ,communicate and differentiate themselves to their end
customers (Brooks 2006). Moreover, according to findings, the main difficulty to ITSM-ITIL
approach in their business is organizational resistance as a result of lack of knowledge in
understanding ITIL purposes. Further according to Lohman (2004), there are five problems
could impacts on IT management like; lack of unit and cohesion structure between metrics,
insecurity and doubt about what to measure, decentralized and lack of communication among
users and producers of performance indicator (Lohman, Fortuin et al. 2004). Therefore, by
insuring a business based measurements approach to ITIL-best practice will improve system
performance and show the values in organization.

66
5.2 Solutions to enhance ITSM framework efficiency
In the last part I have proposed different feedbacks about the system performance without
modifying the new solutions for the future model. In this section it would be helpful to be able to
provide experimental model behaviour which has been missing in the Service Quality of IT
Service Management process with some suggestion to improve different approaches which I
have evaluated.
In this table I attempted to manage the challenge of effective ITSM framework in IT
corporations from two different views: the empirical findings and literatures. With analysis of
this challenge it will be feasible to suggest some points to address these issues.
Comparative analysis
Interview/Findings
- Lack of maintenance objects/situation.
- Lack of ITIL support.
- Lack of knowledge evaluation framework by employee and
management team.
- Problem in metrics level.
- Weakness in System performance and QS.
Literature
- Lack of users training and knowledge
- Lack of unit and cohesion structure between metrics.
- Insecurity and doubt about what to measure
- Lack of communication among users and producers of
Performance indicator (PI).
Table18 ITSM drawbacks
It seems that there are many problems in having successful ITSM process. Conversely, as
identified before, many good efforts have been done to improve these issues. For better
understanding the concept of these challenges there are three possible approaches to improve
ITSM efficiency which are:
Structure improvement In IT organization
Many academic and industrial efforts have been done in many IT corporations to improve the
Quality Measurements of business-IT alignment. Researchers like, Das et al. (1991), Reich and
Benbasat (2000) and Luftman (2003) used multi-dimensional scales to measure the business IT-
alignment. The result from my interviews and collected metrics exposed some important
elements to improve the efficiency of ITSM. The IT service management addresses the need to
align the delivery of IT services directly with the requirements of the business. Some of these
concerns are reflected in this organization to provide ITIL-best practices to deliver
comprehensive IT service management framework.

67
Turning to actual cause analysis, several improvements are desirable in DB Schenekr. The
maintenance objects and technical areas for better maintenance and Service Quality (SQ) are not
covered perfectly. Furthermore using the Project Management and a Continuous Service
Improvement Program (CSIP) allows us to reduce that incident problem and increase efficiency
of the system, such a method would also be desirable to support ITIL-best practice by applying
appropriate target setting through a Process Maturity Framework, Rigorous Auditing and
Reporting through a Quality Management System (QMS) to improve ITIL like implementing
Plan, Do, Check, and Act (PDCA) life cycle as a step-by-step development structure (Hank
2006).
Moreover according to Jurison (1996), IT investment made by stakeholders or IT management
based on different needs can expand the business structure like take customers as centre and
provide IT services that meet customers’ needs, enhanced quality , low cost IT service in
company, better response to the client needs and evaluating service delivery precisely (Jurison
1996).
Provide better decision-making techniques
According to literature, The main benefit of ITIL drove from “adapting and then following ITIL
guidance through focusing on doing the right things in the right order according to the decision
of management, staff, vendors, customers and users based on the business demand” (Marquis
December 2009). Moreover, according to Shatzkin (2005) stated that most publishers really need
to review their own metrics to be sure they are not leading them to bad business decision
(Shatzkin 2005). For instance, regarding the improvement of decision-making it must provide
meeting with IT managers, and employee to discuss about the metrics that fits to your
corporation. According to Jurison, (1996), “The measures must be selected on the basis of their
ability to reflect the objectives of the stakeholders of the IT investment”(Jurison 1996).
Although, educate and train the employees about the ITIL-best practices would be advantages for
the corporations. Additionally, it is important for organization to recognize and measure
customer’s perception of IT service in order to improve Service Quality (SQ), Decision making,
User satisfaction, Revenue and Cost saving (Galletta and Lederer 1989; Kang and Bradley
2002).
Collecting metrics
According to the findings, every IT corporations implemented framework to improve IT service
management quality. The implemented framework includes various metrics, policies and
components about different access rights for different users and departments within the
organizations to make it sure that every person and department is restricted to their rights only.
According to our case study, it is always tricky to find common denominators between different
organizations. The goals and targets are constructed in different ways depending on weather you
sell services or manufacture a product. Therefore, different KPIs are interesting for different
stakeholders and parts of organization.

68
Further to the implemented framework allows IT managers to control the quality of service in
order to reduce the incident and problems. According to Porter et al (1996), “improvements
created by the ITIL-best practice do not lead to improvements of any organization”. He argues
that a company should focus on both the Operational effectiveness and the Strategic positioning.
ITIL-ITSM best practice is not a onetime process; it is ongoing activity to control system
performance. According to Porter (1996) continual improvement is necessary to stay relevant in
the market” (Porter 1996; Marrone and Kolbe 2011). Through our case study, we came to know
that the target groups of our research paper are almost employing the same methods but there is a
small difference in IT service management process and measurement implementation. According
to Brooks, P (2006) IT service management tools deals with many IT service management
measurements and most of it will be interesting to people in the related departments with the
same activities. Metrics are identified to show development and the performance of the system.
Therefore, there are three types of metrics to improve the quality level of evaluation framework
like, effectiveness, capabilities and efficiency. These elements could be matched into any
technology, process or service that focuses on Operational Level (Service Support Domain),
Tactical Level (Service Delivery Domain) and Strategic Level.
5.3 Result summary
To conclude the issue, we could say that organizations should seriously take the advantage of
learning from the system performance and should reduce the appropriate Incident management
because successful approach and proper IT service management plan could make the difference
between the organizations continued existence and sudden death. Having shown how changes in
IT service management and system performance can help to overcome some of the challenges in
ITSM framework and operational efficiency, we now want to briefly summarize the results of
our evaluation based on provided metrics from the three sources.
Summing up the results for the root causes analysis presented in the case study evaluation, it can
be deducted that, the five ITSM processes like Incident management, Problem management,
Availability management, Operation management and Configuration management are common
among three organizations. According to Gupta: “Incident is quickly resolving incidents that
affect the normal running of an organization’s IT service” (Gupta, Prasad et al. 2008).And
Problem management pursues to become the main reason of incidents and then begin movements
to improve or correct the condition. It is interesting also to see that establishing of Availability
management process is ranked high between larger organizations as one of the important factor.
Availability management process is to improve the capability of the IT infrastructure and service
and supporting organization. Further, Release management can be considered as one of the top
processes regarding to the design and implementation of an efficient method for the distribution
and installation of changes following by Operations management process for planning and
technical support. In addition, User satisfaction is mentioned both by the SOGETI and DB
Schenker. According to the findings, high satisfaction manifestation will attract a good driver
which adds values to the company. For example, in DB Schenker they monitor overall
performance like learning from system; inquiry, feedback of the system or the measurement
performance report on an annual basis.
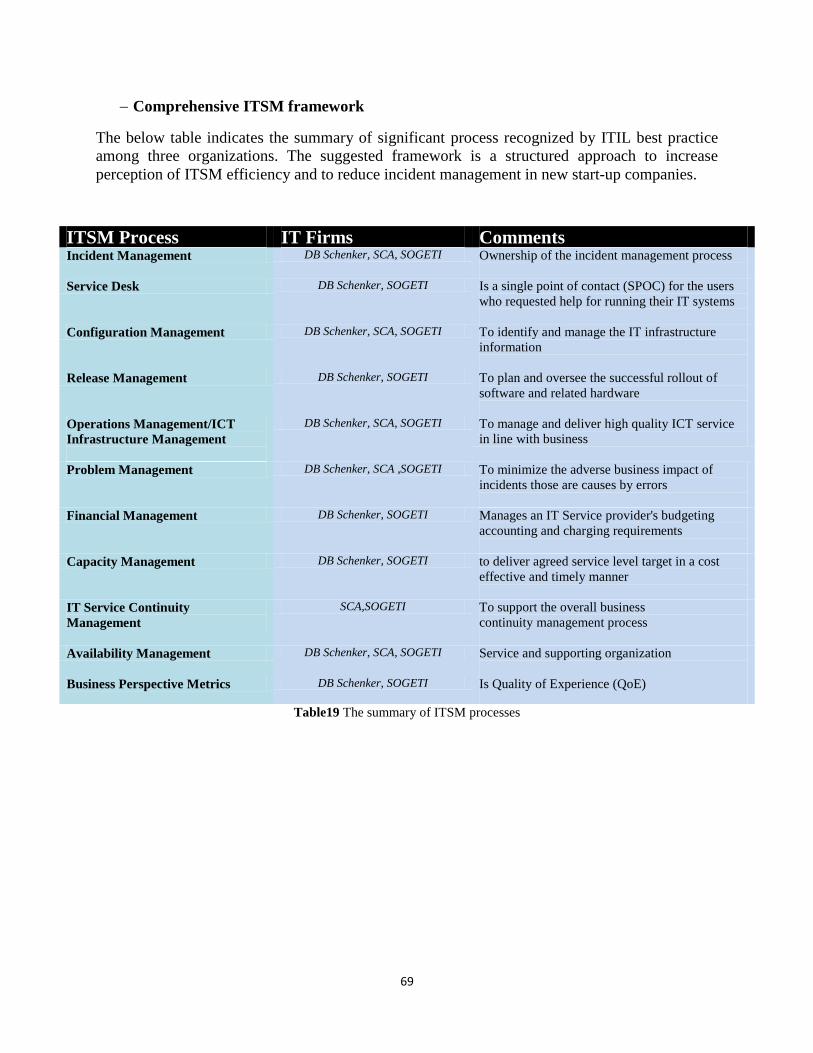
69
Comprehensive ITSM framework
The below table indicates the summary of significant process recognized by ITIL best practice
among three organizations. The suggested framework is a structured approach to increase
perception of ITSM efficiency and to reduce incident management in new start-up companies.
Table19 The summary of ITSM processes
ITSM Process IT Firms Comments Incident Management DB Schenker, SCA, SOGETI Ownership of the incident management process
Service Desk DB Schenker, SOGETI Is a single point of contact (SPOC) for the users
who requested help for running their IT systems
Configuration Management DB Schenker, SCA, SOGETI To identify and manage the IT infrastructure
information
Release Management DB Schenker, SOGETI To plan and oversee the successful rollout of
software and related hardware
Operations Management/ICT
Infrastructure Management
DB Schenker, SCA, SOGETI To manage and deliver high quality ICT service
in line with business
Problem Management DB Schenker, SCA ,SOGETI To minimize the adverse business impact of
incidents those are causes by errors
Financial Management DB Schenker, SOGETI Manages an IT Service provider's budgeting
accounting and charging requirements
Capacity Management DB Schenker, SOGETI to deliver agreed service level target in a cost
effective and timely manner
IT Service Continuity
Management
SCA,SOGETI To support the overall business
continuity management process
Availability Management DB Schenker, SCA, SOGETI Service and supporting organization
Business Perspective Metrics DB Schenker, SOGETI Is Quality of Experience (QoE)

70
6 DISCUSSION
6.1 Conclusion The thesis aims to identify the important aspects that propose a comprehensive framework for
ITSM efficiency. It was collected of theoretical and empirical research study that generated
answers to the sub-level research questions. The author tried to extract a framework based on the
literature review and various sources from practical environment. The framework was used
within the far-reaching empirical study to find ways to compare and identify different
corporation metrics. The organizations becoming more reliant on comprehensive framework to
control IT service management in organizations; how ITIL-ITSM best practices have an effect
on organization efficiency and problem solving.
In theoretical study, the concept and the needs of ITSM in organization, is presented with
applying different methods and improvements techniques, hence proving the most importance of
ITIL-ITSM best practice model. The factors affecting service quality of ITSM in organizations is
significant because it has an impact on the overall IT service management process. It is also
challenged by increasing competition from new players on the market to improve the employee’s
knowledge regarding the perceived benefits provided by ITSM-ITIL or other best practices.
Frequently, the acknowledgment between employee and customers is the first step to improve
the operations by feedbacks or minimizing waste and risk in the operations. This could help
corporation to decrease operational costs and incident ratios and at the same time increase
customer satisfaction. Additionally, performing IT service management is a costly task. Small
changes in the framework process can lead to major changes in profit and management process
within organization, like maintaining and operating an information infrastructure. Thus, firstly, it
is important for an organization to choose the comprehensive ITSM framework which fulfils its
required aims from a specific task and secondly which has a better performing quality in an IT
service management model.
6.2 Implications for the subject area
This thesis investigates the value of comprehensive ITSM framework in IT industries. It points
out that result such as; suggestion for improvement of IT service management can be used in
other IT organization if all aspects are considered correctly. Service quality and performance
measurements should be put in the same important level as IT management activity in
organization, but it is not the first should be considered. Comprehensive ITSM framework is
used for servicing IT manager activities in different subject areas such as, managerial issues,
implementation risks, financial and corporation limitations. In this thesis, only when adaption of
ITIL increases the number of realized operational benefits increases consequently, the more ITIL
implementation the greater operational and strategic benefit to organization (Marrone and Kolbe
2011).In another view, this thesis fulfill the content of metrics for ITSM and tells how an
organization improve service quality and reduce cost using an ITIL best practice.

71
A comprehensive ITSM framework model has been designed. It will be helpful for those IT
managers to understand COBIT and ITIL V2/V3 best practice and design a new ITSM
framework before the project development process begins. From the comprehensive framework
model, IT managers and users can recognize how they influence and improve in designing an
information technology in order to deliver IT service process effectively.
6.3 Evaluation
6.3.1 Method evaluation
According to the second chapter, a combination of some method is used for analysis. The
qualitative research part is one of them. In the theoretical part, the object was to analyse and
review the literature of IT Service Management (ITSM) framework concept for bringing up the
procedure of the research. The problem was that there were a great number of sources in IT
management which is closely related to this subject area. So before the research study begins, it
was thought that it must be essential to set a structure for selecting these materials and review the
most important of them based on their relevance and importance to the topic area. In the first
theoretical part, the research selects relative academic resources which generally cover on ITIL-
ITSM framework processes.
In the next part, it was decided to collect a set of metrics for ITSM from Information Technology
Infrastructure Library (ITIL) and other reality samples (e.g. academic resources and IT firms).
This was a difficult task because there is a lack of sufficient academic resources that their focus
is maintained on the evaluation and improving of the situation of ITSM framework process in IT
organizations by collecting and comparing different parameters. It was attempted to solve this
difficulty by applying other sources like collecting some data from university of Borås and an
interview from IT organization (DB-Schenker). To make a relation between the theoretical
section and practical situation, a case study in an IT organization is provided. As acknowledged
before, the interviews were structured for collecting data. In the interviews, it is attempted to
have meetings with experts and IT managers to investigate the possibility of receiving incorrect
responses. Interview is suitable for this type of subject; as it is not strictly limited to
questionnaire or calculation. The trickiest in this section, was a distress that there might not be
adequate experience and knowledge when the dialog goes deeper in specifics. To solve this
problem, it was decided to arrange questions one by one and to skip the questions that may lead
the conversation in information that are unnecessary for the research. Furthermore, some open-
ended questions were made in the interviews to improve and increase the understanding
whenever crucial. The benefit of interviews executed in this investigation is that they are done
entirely by the researcher in a face-to-face method and through e-mail communication. This kind
of interviews decreases the possibility of collecting incorrect, inappropriate and irrelevant
answers and ensures the validity and reliability of the responses.
However, the stage of data collection took lots of time in order to provide a great deal of data to
compare and analyze the results. Through that way, massive amount of IT service management
processes become simple and easy to read after comparisons. Also Strong quotes from IT
manager can be used as brilliant evidences.

72
6.3.2 Result evaluation
After analysing the theoretical and empirical results, the whole research is inclined to clear tactic
and procedures; here there is different type of categories to evaluate the results in qualitative
research such as, Reliability and measurement validity.
Reliability of data is extremely important which have created the trustworthiness and consistency
of the research, the author tried to collect all information from reliable scientific sources with the
same subject area. However there is a lack of scientific studies related to this subject area
specifically, in the area of metrics for IT service management among various IT organizations.
The empirical findings included of an interview from DB Schenker organization. The researcher
was asked the question directly by sending an email to IT manager and the all approaches used
were ethical in every steps of study.
The author tried to form the entire structure of thesis following the sequence of research question
and research strategy. Moreover, He tried to select an interesting subject (interview) for the case
study which is also a typical method in other IT related industry. The conclusion is not only
acquired from one case study, but also it shaped from different sources such as two other
Swedish companies and a theoretical study. Results of theoretical are from scientific articles,
books have positive relationship with learning that concern with our empirical study in a reality.
As the result is not clear from previous research therefore, findings from interview result and two
other cases (SIGMA, SCA) provided stronger relationship in this subject area. The results in total
are not specifically illuminating for one case, but also they can be applicable for different
situation. Finally, the investigation of this subject is valuable and helpful to IT Service
Management and pushes it on progress. Ethics has been tracked at every step of this study.
6.4 Possibilities to generalize
In this thesis, theoretical outcomes are confirmed by empirical results and then both outcomes
are summarized based on the analysis method. I have gathered appropriate literature and
academic studies which were printed in different journals and books from an online database in
university of Borås.
These relate to an improvement of ITSM efficiency in different IT firms as a theoretical result.
The selected methods involve the success of ITIL-ITSM in combination with other practices. I
have shown the different process levels of evaluation framework of metrics which are commonly
stated in the field of ITIL, like, Service support domain – operational level, Service delivery
domain – tactical level and Strategic level. Also, I have provided and interview for collecting of
my empirical information. In order to satisfy of this study, selected case studies is limited only
into Sweden.
I have done an interview with the IT manager in DB Schenker who has many years of
experiences in the IT- project management field to ensure that the outcome of the study is
securely scientific. After accumulating the empirical information, I had examined and analyzed
empirical result by comparing different organization’s ITSM frameworks for validation of

73
metrics. I hereby used the insights of the earlier performed method analysis in order to stress on
the structure improvement in IT organization by different approaches (e.g. Quality Management
System).It turned out that only the collected metrics and comparison of the process provides
sufficient means to find the root cause for all the reported incident, management problems and
lack of ITIL-ITSM support in an organization. The other approaches also provide some abilities
for the improvement of the process, but it was not possible to explain all methods and
approaches with reasonable effort. I have pointed out possible improvements in the ITSM
process especially the support of a fast and convenient root for selecting the right measurement
methods that is needed to make the already promising approaches applicable in practice. Finally,
the research will present accurate results with a clear understanding. Though one of the
limitations of this thesis that is focusing on only three IT firms and not monitoring and
evaluating metrics into various companies due to the lack of time. In addition, the proposed
metrics tables in the appendix can be used as a future work to assist IT managers to choose the
right metrics for ITSM framework.
6.5 Ideas for continued research
Having summarized the results, I want to emphasize on the points that could not be addressed in
this thesis and are subject for the continued research study. During my research I have
investigated and identified different organization framework for IT service management services
in Sweden. IT service management is a broad area of information technology and is growing
daily which results in with other consequences. Therefore, the study is essential to be continued
in this specific area with more supports and evidences.
Moreover, this investigation could be developed in the same subject area in the future work. I
examined the efficiency of IT service management framework on the business with the
illustrative view of IT corporations in different countries. My empirical part is limited to only
three companies and one interview with its specific condition. Hence, in the continued research it
is also possible to be precise in the case study or to consider with IT managers. The future
research can also include with any type of managers or researchers in any organizations or
academic institutions such as IT manager or IT researcher and over. The investigation also
should be extended to more multi-organizational concept to better reflect the incident found in
reality. I did not analyse the significant points of each metric in organization and the influence of
the each one of them in the corporation as whole. For instance, as I have mentioned before,
Process Maturity Framework (PMF) serves to measure service management as a whole and not
individually. In addition to that, the ability to deal with Automation Decision Support (ADS)
process should provide the better solutions for repetitive management problems. This allows
managers to use and test the electronically available information during runtime and not just after
the process being executed.
In order to calculate the warning level of each metrics for the ITSM process, there would also be
a need for target values and possible values of each metrics. That means, to calculate warning
level of each metrics and compare the result based on the past performance until now. In the
future research there should be a consideration for the evaluation of IT service management
measurements in continues service improvement and service quality in IT firms and adding

74
automation service management operation such as, customer-centric and automated operations.in
order to be quicker, cheaper, and at a better quality rather than measuring manually with longer
time. Although we can see many research and practical works in ITSM area in developed
countries particularly in Scandinavian countries, this concept is still in immaturity in developing
countries and needs to be studied systematically by academic areas. Therefore, it would be
remarkable if an academic study focus on different level of abstraction and features of IT Service
Management.
This thesis paper focused on limited types of metrics and ITSM process in this research and it is
needed to provide fast and easy comprehensible explanation for users and IT managers. Is the
situation in other companies the same of these companies? Can we use this metrics in other
corporations? If it is not applicable, what factors should be added to this framework? Is it
possible to build a general framework for ITSM improvement strategy in all companies? These
are the questions that shall be answered and future studies can work on them.
75
7 REFERENCES (2008). The SAGE encyclopedia of qualitative research methods / Lisa M. Given, editor. Los Angeles, SAGE
Publications. (2008). Semi-Structured Interview. Thousand Oaks, CA, Sage Publications, Inc. 2: 810-811. Ahmad, M. M. and N. Dhafr (2002). "Establishing and improving manufacturing performance measures."
Robotics and Computer-Integrated Manufacturing 18(3–4): 171-176. Andy, N., G. Mike, et al. (2005). "Performance measurement system design." International Journal of Operations
& Production Management 25(12): 1228-1263. Avison, D., J. Jones, et al. (2004). "Using and validating the strategic alignment model." Journal of Strategic
Information Systems 13(3): 223-246. Backman, J. (1998). " Rapporter och uppsatser." Lund: Studentlitteratur. Bartolini, C., M. Salle, et al. IT service management driven by business objectives An application to incident
management. 2006 IEEE/IFIP Network Operations and Management Symposium NOMS 2006, IEEE. Bowersox, D. J. and D. J. Closs (1996). Logistical management: the integrated supply chain process. New York,
McGraw-Hill. Brooks, P. and I. T. S. M. Forum (2006). Metrics for IT service management. Zaltbommel, Van Haren Publishing. Bryman, A., & Bell, E. (2011). Business research methods. Oxford: Oxford University Press. Blatter, J., K. (2008). Case Study. Givens, L. (ed) The Sage Encyclopedia of Qualitative research methods. Volume
1 & 2, CA: Sage Publications. Blumberg, B., D. R. Cooper, et al. (2008). Business research methods. London, McGraw-Hill Higher Education. Bushell, S. (1992). "Implementing plan, do, check and act." The Journal for Quality and Participation 15(5): 58. CHISNALL, P. M. 1981. Marketing research: analysis and measurement, McGraw-Hill London. C. Rudd, i. C. R. E. (2004). "An Introductory Overview of ITIL–A High Level Over- view of the IT Infrastructure
Library." (itSMF Ltd.). Cooper, D. R. and P. S. Schindler (2003). Business research methods. Boston, McGraw-Hill. Das, S. R., S. A. Zahra, et al. (1991). "Integrating the Content and Process of Strategic MIS Planning with
Competitive Strategy." Decision Sciences 22(5): 953-984. David, P. (2010). Key performance indicators: developing, implementing, and using winning KPIs. US, Wiley. Dicico‐Bloom, B., & Crabtree, B. F. (2006). The qualitative research interview. Medical Education, 40(4), 314-321. Evans, M. (2005). "IT Metrics And Successful Measurement." Retrieved 20121106, from
http://www.itsmwatch.com/itil/article.php/3555126/IT-Metrics-And-Successful-Measurement.htm Forte, D. (2007). "Security standardization in incident management: the ITIL approach." Network Security
2007(1): 14-16. Francis, B. (1996). "SERVQUAL: review, critique, research agenda." European Journal of Marketing 30(1): 8-32. Galletta, D. F. and A. L. Lederer (1989). "Some Cautions on the Measurement of User Information Satisfaction."
Decision Sciences 20(3): 419-434. Gupta, R., K. H. Prasad, et al. (2008). Automating ITSM Incident Management Process. Autonomic Computing,
2008. ICAC '08. International Conference on. Hank, M. (2006). "ITIL: What It Is And What It Isn't." Business Communications Review 36(12): 49. Heather, T., A. Wilson, et al. ( 2009). "Ricoeur‟s Theory of Interpretation: An Instrument for Data Interpretation
in Hermeneutic Phenomenology." International Journal of Qualitative Methods
Jerry, L. (2003). "ASSESSING IT/BUSINESS ALIGNMENT." Information Systems Management 20(4): 9-15. Jurison, J. (1996). "Toward more effective management of information technology benefits." The Journal of
Strategic Information Systems 5(4): 263-274. Kang, H. and G. Bradley (2002). "Measuring the performance of IT services: An assessment of SERVQUAL."
International Journal of Accounting Information Systems 3(3): 151-164. Kaplan, R. S. (1993). "PUTTING THE BALANCED SCORECARD TO WORK." Harvard Business Review 71(5): 134. Kettinger, W. J. and C. C. Lee (1994). "Perceived Service Quality and User Satisfaction with the Information
Services Function." Decision Sciences 25(5-6): 737-766. Kumar (2005). "Research methodology: A step by step guide for beginners." Sage Publications, London.

76
Kumbakara, N. (2008). "Managed IT services: the role of IT standards." Information Management & Computer Security 16(4).
Lahtela, A., M. Jantti, et al. (2010). Implementing an ITIL-Based IT Service Management Measurement System. Digital Society, 2010. ICDS '10. Fourth International Conference on.
Lohman, C., L. Fortuin, et al. (2004). "Designing a performance measurement system: A case study." European Journal of Operational Research 156(2): 267-286.
Marquis, H. (December 2009). "ITIL: What It Is And What It Isn't." Article 36(12): 49. Marrone M, K. l. M., Kolbe LM ) . (2010). "Are we really innovating? An exploratory study on innovation
management and service management in." IEEE international conference on innovation and technology, Singapore.
Marrone, M. and L. M. Kolbe (2011). "Uncovering ITIL claims: IT executives’ perception on benefits and Business-IT alignment." Information Systems and e-Business Management 9(3): 363-380.
McLaughlin, K. and F. Damiano American ITIL, ACM. McNaughton, B., P. Ray, et al. (2010). "Designing an evaluation framework for IT service management."
Information & Management 47(4): 219-225. Mehrens, W. A. and I. J. Lehmann (1987). "Using standardized tests in education." New York: Longman. Mesquida, A. L., A. Mas, et al. (2012). "IT Service Management Process Improvement based on ISO/IEC 15504: A
systematic review." Information and Software Technology 54. Meziani, R. and I. Saleh e-government: ITIL-based service management case study. Proceedings of the 12th
International Conference on information integration and web-based applications & services, ACM. Mior, A. (2008). The importance of ITSM. Malaysian Business. Kuala Lumpur, New Straits Times Press, Ltd: 7. Mills, M. C. (2008). Comparative Analysis. The SAGE Encyclopedia of Qualitative Research Methods. Thousand
Oaks, CA, Sage Publications, Inc. 1: 100. Notowidigdo, M. H. (1984). " Information systems: weapons to gain the competitive edge,." Financial
Executive(February): 20-25. Noon, J. (1983). "Marketing research: Analysis and measurement P.M. Chisnall, McGraw-Hill, Maidenhead
(1981), 391 pp. £12.95 (hardback) and £8.50 (softback)." Long Range Planning 16(1): 132-133. Oates, B. J. (2006). Researching information systems and computing. London, SAGE. Parasuraman, A. (1988). "SERVQUAL: A Multiple-Item Scale for Measuring Consumer Perceptions of Service
Quality." Journal of Retailing 64(1): 12. Parasuraman, A., V. A. Zeithaml, et al. (1985). "A Conceptual Model of Service Quality and Its Implications for
Future Research." The Journal of Marketing 49(4): 41-50. Parasuraman, A., V. A. Zeithaml, et al. (1994). "Alternative scales for measuring service quality: A comparative
assessment based on psychometric and diagnostic criteria." Journal of Retailing 70(3): 201-230. Parasuraman, A., V. A. Zeithaml, et al. (1994). "Reassessment of Expectations as a Comparison Standard in
Measuring Service Quality: Implications for Further Research." The Journal of Marketing 58(1): 111-124. Park, J.-O., S.-G. Kim, et al. (2008). The Study on the Maturity Measurement Method of Security Management
for ITSM. Proceedings of the 2008 International Conference on Convergence and Hybrid Information Technology, IEEE Computer Society: 826-830.
Pitt, L. F., R. T. Watson, et al. (1995). "Service Quality: A Measure of Information Systems Effectiveness." MIS Quarterly 19(2): 173-187.
Pitt, L. F., R. T. Watson, et al. (1997). "Measuring Information Systems Service Quality: Concerns for a Complete Canvas." MIS Quarterly 21(2): 209-221.
Porter, M. E. (1996). "What is strategy?" Harvard Business Review 74(6): 61. Rakesh, B. (2009). "IT Governance." Accountancy SA(Journal Article): 34. Reich, B. H. and I. Benbasat (2000). "Factors That Influence the Social Dimension of Alignment between Business
and Information Technology Objectives." MIS Quarterly 24(1): 81-113. Shatzkin, M. (2005). "Sensible decision-making metrics." Publishing Research Quarterly 21(3): 29-34. Silva Molina, E. J. a. P., Leonel and Flores, Jonny and Vargas, Norman (2005). How to Identify and Measure the
Level of Alignment between IT and Business Governance. proceedings of the PICMET. PICMET, Portland, Oregon, USA.
Smith, AM 1995, 'Measuring Service Quality: is SERVQUAL now Redundant?', Journal Of Marketing Management, 11, 1-3, pp. 257-276, Business Source Elite, EBSCOhost, viewed 27 May 2013.

77
Smith, D. (2012). "How To Implement Metrics for IT Service Management." Retrieved 20121106, from http://www.globalknowledge.com/training/generic.asp?pageid=2240&country=United+States.
Stewart, H. C. W. and C. Yuk-Hee (2007). "Improving service management in outsourced IT operations." Journal of Facilities Management 5(3): 188-204.
Strauss, A. and J. Corbin (1990). BASICS OF QUALITATIVE RESEARCH: GROUNDED THEORY PROCEDURES AND TECHNIQUES.
Tan, W.-G., A. Cater-Steel, et al. (2009). "Implementing IT service management: a case study focussing on critical success factors." Journal of Computer Information Systems 50(2): 1-12.
van Grembergen, W. and S. de Haes (2009). COBIT as a Framework for Enterprise Governance of IT. Boston, MA, Springer US: 137-164.
Wang Zhen Wang, Z. and X.-y. Zhang Xin-yu Zhang (2007). "An ITIL-based IT Service Management Model for Chinese Universities." 493-497.
Winniford, M., S. Conger, et al. (2009) "Confusion in the Ranks: IT Service Management Practice and Terminology." 26, 153-163 DOI: 10.1080/10580530902797532.
Wui-Gee, T., C.-S. Aileen, et al. (2009). IMPLEMENTING IT SERVICE MANAGEMENT: A CASE STUDY FOCUSSING ON CRITICAL SUCCESS FACTORS. Stillwater, International Association for Computer Information Systems. 50: 1.
Zhong, Y. and W. Xin An ITIL based ITSM practice: A case study of steel manufacturing enterprise. 2010 7th International Conference on Service Systems and Service Management, IEEE.

78
8 APPENDIXES*
8.1 Incident Management
ITSM process owner: Incident Manager
Goal: To minimize interruption in business activities and ensure availability of service.
Service level: L1 Support
Sources: ITSMF international-Metrics for IT Service Management, Security standardization in
incident management: the ITIL approach by Forte 2007, Automating ITSM Incident
Management Process by Gupta 2008, Improving service management in outsourced IT
operations by stewart 2007.
Audience: Process Owner, IT Management, SLA Process Owner, Business Customer, Team
Member, SIP Process Owner
How to guide: An incident is an intimation of some error or failure of some component in IT
system. In typical service desk, incident is either reported by the customer or automatically
generated by system monitoring.
Formula: Service performance in response to incidents = 1 - (Non-Complaint cases / Total
number .of cases) * 100 percent (Stewart & Yuk-Hee, 2007).
Metric category: Incident management as a part of IT System Management.
Comments: The Incident Process Manager ultimately takes ownership of the incident
management process, and is responsible for determining what they are, supervising them and
monitoring them.“The Help Desk Management, Incident Management and Problem Management
handle incidents” (Stewart & Yuk-Hee, 2007).
Metrics objectives: Incident management process provides most immediate and visible gains to
service quality and cost reduction (Gupta, Prasad, & Mohania, 2008).
*Notice: All the metrics tables presented in the appendix are entirely adopted from the book
Metrics for IT Service Management (Brooks, P. and I. T. S. M. Forum 2006).
79
Title
Descriptions Target
Value
Specification Justification Warning
Level
Possible
Values
Percentage
of incident
resolved by
1st line
support
How Many
Incidents
require no
escalation to
second line
support
85 A count of
incidents that
require no
escalation.
This is measure of a few
things. If the Service
Desk has a good known
error DB supplied by
Problem Management
the number of Incident
resolve by the first line
support will increase.
<65 0-100
Average call
time with no
escalation
This is a
measure of
effectiveness
10 How long do
calls take if
there is no
escalation
Closing calls too
quickly is not good for
customer satisfaction.
>20 999999
Percentage
of incidents
incorrectly
assigned
This is
measured by
checking the
call history for
re-assignment
statutes.
20 How many
incidents are
assigned to the
wrong work
group
Re-assigning calls slows
resolution and reduces
the effectiveness of the
teams. Good call
handling scripts,
training tools and
processes will reduce
the incidence of this
30 0-100
Percentage
of incident
resolved
within target
time by
priority
When a call
arrives at The
Service Desk, it
is allocated a
target
resolution time
according to the
SLA attached to
the service and
the priority of
the call
95 Within target
time by priority
This is direct measure of
how well the Service
Desk is keeping to
agreed SLAs.
<90 0-100
Average
time for
second level
support to
respond
This is time
between a call
being assigned
to second level
support and the
call being
accepted
Minutes Escalation to second
level support is a threat
to SLA times. The time
between dispatch and
acceptance of a call has
direct on how much
longer the call is
delayed.
>10 999999
Average
time to
resolve
incidents
This measures
is the major
part of total call
time-up to the
resolution,
When the User
is satisfied with
the resolution
20 Minutes from
call open to call
resolved
This is a popular metrics
as it shown the overall
effectiveness of the
incident Management
process.
>30 999999
Percentage
of incidents
re-assigned
This measures
incidents that
are assigned to
more than one
second or third
10 Normally
incidents are
closed with no
assignment
Sometimes it is
necessary to get
assistance from other
team so reassignment is
the proper course of
>10 0-100

80
level resources. action.
percentage
of incidents
incorrectly
categorized
When calls are
logged, they are
assigned a
category to
assist in
resolution and
for late
analysis.
40 How many
incidents have
the wrong
description or
category when
first categorized
60 0-100
Percentage
of calls 1st
line support
bypassed
How do often
do customers
call second or
third level
support
directly.-
measured by
calls created in
second and
third line.
5 Calls that do
not come
through the
official channel
Direct calls to support
staff have a number of
disadvantages.
>10 0-100
Customer
Satisfaction
This balances
the other
metrics. If the
calls are closed
too quickly or
take too long
then, whatever
the internal
metrics say.
4 Measure by
asking the
customer for a
when a call is
closes. Can be
done every time
or as a sample.
This will always be one
of the top three or four
metrics for incident
management. This is a
very direct means of
knowing how the
general user community
feels about the service
being provided.
>3 0-5
Percentage
of calls that
are service
requests
The percentage
of calls that are
service
requests, not
incidents or
other calls.
15 Calls that are
deal with the
service Desk as
Service Request
As the service desk
becomes a trusted
advisor to end users and
as the number of
incident decreases, this
metric should increase.
5
Percentage
of incidents
solved
rightly the
first time
The percentage
of incidents that
is resolved in
the first attempt
to resolve it.
90% The managers
of the
resolutions
group should
use this metric
to determine
the
effectiveness of
their resolution
group.
The more effective the
resolution group, the
lesser rework needs to
be done and higher
customer satisfaction
will be.
75% 0-100%
Percentage
of
proactively
solved
incidents
The percentage
of resolved
incident that
was resolved
before the
customers
reported an
error.
15% Incidents
resolved before
customers
experience
problems
management.
Proactively resolved
incidents add value to
the incident
management process
and have not disturbed
business process.
0% 0-100%
81
8.1.1 Example of HAVERBLAD IT Management AB
Metrics Title Quan/Qual Process Owner Source
The ability to
recover and
restore as
service level.
(Quantitative) Incident
Management
Incident
Manager
Haverblad
Organization
Number of
incident cases
during the
period
(Quantitative) Incident
Management
Incident
Manager
Haverblad
Organization
Percentage of
cases by
priority, by
category and
type of error
(Quantitative) Incident
Management
Incident
Manager
Haverblad
Organization
Percentage of
incident cases
assigned to the
wrong group
(Quantitative) Incident
Management
Incident
Manager
Haverblad
Organization
8.2 Service Desk
ITSM process owner: Service Desk Manager
Service level: Managed by L1 Person
Metrics objectives: To restore normal service operation as quickly as possible and minimize the
adverse impact on business operations
Goal: To provide a single point of contact for customers. (Examples: To provide advice and
guidance, and to facilitate the restoration of normal operational service with minimal business
impact on the Customer).
Relates to business objective/s: To restore normal service operation as quickly as possible and
minimize the adverse impact on business operation, thus ensuring the best possible levels of
service quality
Sources: ITSMF international-Metrics for IT Service Management, Security Standardization in
Incident Management the ITIL approach-Network Security
Audience: Process Owner, IT Management, SLA Process Owner, Business Customer, Team
Member, SIP Process Owner.
How to guide: Customer contact the service desk for various purposes such as information,
Configuration change, problem being faced by the customer, and also customer can report
problem using various methods like as, web based, email or telephone (Gupta et al., 2008).

82
Metric category: Service Desk as a part of IT System Management.
Comments: To handling closure, the Service desk might be the company function best suited for
managing preliminary incident response tasks and contracts such as detection and recording.
Metrics
Titles Description Target
value
Specification Justification Warning
level
Possible
values
Number of
calls without
escalation per
agent.
What is the
number of calls
without
escalation taken
per person.
20 The number of
calls without
escalation
taken per
service desk
agent per day.
This is the
number of calls
with no
escalation. That
means the calls
have duration
less than the
minimum
escalation period
for management
escalation and
are not escalated
technically.
40 999999
Percentage of
calls closed
first time per
agent
Simple calls
with no
escalation
65 The percentage
of calls that are
closed after the
first call-with
the answer
given.
Since the ideal-
for all calls to be
dealt with at
once at the first
call -it is
important to
measure how
close the service
desk is to the
ideal.
40 0-100
Number of
calls that
exceed SLA
All CIS have to
be linked to the
appropriate
service and this
measures the
service related to
the call that
exceed its SLA
first
3 The number of
calls per day
exceeds the
SLA.
This is a vital
measure of the
effectiveness of
Service Desk
output.
8 999999
Number of
calls escalated
to second level
support
The number of
calls per day that
are escalated to
second level
support.
5 Any calls that
have a first
escalation, per
day.
This is a measure
of the usefulness
of second level
support-and also
of how effective
the Service Desk
front line support
is.
10 999999
Customer
Satisfaction
Satisfaction is
measured at the
close of every
Service Call or
at a sample
thereof.
4 Include this as
a high value
until it is
consistently
good, and then
put it at lower
Ultimately this is
probably the top
measure for the
Service Desk.
<3 0-5

83
priority.
Measure it for
each call, or
over a fixed
period of time
Number of
calls escalated
to third level
support
Calls that need
third level
support to be
solved.
3 Calls per day,
escalated form
second to third
level support.
If this is too high
it means
improving the
procedures and
effectiveness of
both first and
second level
support.
6 999999
Average time
waiting for call
to be answered
This measures
the loading and
resourcing of the
Service Desk.
10 The number of
seconds that
customers wait
for their call to
be answered.
All source of
delay are a
problem for
meeting its
objective. It is
also a source of
quickly
decreasing
customer
satisfaction,
20 999999
Average time
spent trying to
contact
customers per
call
Call waiting
time,
5 The number of
minutes per
call that the
agent spends
calling back a
customer for
more
information or
to give a
solution.
Of course users
are busy and
may be difficult
to get back to. If
this time is high
then other
methods (SMS,
E-MAIL) might
be used rather
than telephone
calls to reduce
wasted time..
10 999999
Percentage of
calls that come
via the web
A measure of
call source.
60 The ideal is for
most calls to be
placed using
the web
interface.
The easier and
quicker it is to
log a call
accurately the
better for overall
solutions and
solution times.
20 0-100
Percentage of
call with wrong
escalation
This is measured
by a call being
re-assigned with
the reason being
that it was
wrongly
assigned.
5 The percentage
of calls that are
escalated to the
wrong
workgroup.
The service desk
aims to restore
service as
quickly as
possible.
15 0-100
Percentage of
calls dropped
by users
When the
telephone is the
main input
channel to the
Service Desk,
Staffing has to
be adequate to
3% The number of
calls where
users abandon
the call after
the agreed
waiting time or
rings divided
This is an
objective that
contributes
highly to user
satisfaction.
High percentage
would indicate
5% 1-100

84
receive the calls,
as well as staff
should be ready
to take incoming
calls within the
agreed ringing
time. Otherwise
users would not
be able to report
their issue.
by the total
number of calls
that were
recorded at the
Automatic Call
Distribution
(ACD) system.
low availability
caused by
inadequate
staffing, long
call handling
times, Inefficient
processes.
Percentage of
calls converted
to tickets
The Service
Desk receives
many calls, some
of which may
not be recorded
in the ticketing
system for
various reasons
1 Number of
connected calls
at the ACD per
day.
The Service
Desk needs to
have efficient
call handling
workflow in
recording all
calls into the
ticketing system.
equal or >
1.1
equal or >
than 1
Percentage of
incidents from
event
management
Enterprise
management
system generates
automated alerts
that are
integrated into
the incident
ticketing system
to generate
automated
tickets which
may also be
routed to support
teams
automatically.
0 Number of
tickets
generated by
event
management
systems
divided by total
number of
tickets for a
period.
The more the
percentage, the
less the effort of
the Service Desk
in logging calls
and assigning
them.
>0 0-100%
Percentage of
calls rightly
assigned the
first time
The percentage
of calls assigned
by the service
desk to the right
resolutions
groups shows
the effectiveness
of the service
desk and makes
sure the
customer has
confidence in
calling the
service desk.
The amount of
calls that are
not rejected or
immediately
reassigned by
the resolution
groups.
Correctly
assigned calls
make sure the
resolution is
effective.
75% 0-100%
Response
Time.
Response user's
calls as soon as
possible
Call Rate Rate of request
for help (RFH)
That comes from
service desk
Records of
request call
Numbers of the
events and

85
accident
recorded by the
service desk
Rate of
complains
Assessing the
service desk
service. The
little , the better
of service
quality
Accuracy of
accident
classification
Assessing the
service desk
weather handling
accidents by the
defined
categories
Growth rate of
desk accidents.
The rate that
accidents could
not be processed
by the desk
Rate of
incident
handling.
Remote
processing rate
when service
desk the RFH
First call
completion
rate
Connected rate
when users first
calls
8.2.1 Example of Service Desk
Sources: An ITIL Based ITSM Practice: A case study of steel Manufacturing enterprise by
Zhong & Xin, 2010.
Title Descriptions ITSM Process Metrics Owner
Records of request call Numbers of the events
and accident recorded by
the service desk
Service Desk Service Desk Manager
Rate of complains Assessing the service
desk service, the better of
service quality
Service Desk Service Desk Manager
Accuracy of accident
classification ,
Assessing the service
desk weather handling
accidents by the defined
categories
Service Desk Service Desk Manager
Growth rate of desk
accidents.
The rate that accidents
could not be processed by
the desk
Service Desk Service Desk Manager
rate of incident
handling.
Remote processing rate
when service desk the
RFH
Service Desk Service Desk Manager
First call completion
rate
Connected rate when
users first calls.
Service Desk Service Desk Manager
86
8.3 Configuration Management
ITSM process owner: Configuration Manager
Metrics objectives: To identify and manage the IT infrastructure information and relationships
accurately and effectively according to business need and agreed policy standards.
Goal: Account for all the IT assets and configurations within the organization and its services.
Source: ITSMF international- Metrics for IT Service Management , Security standardization in
incident management: the ITIL approach by Forte 2007.
Audience: Process Owner, IT Management, SLA Process Owner, Business Customer, Team
Member, SIP Process Owner
Metrics
Title
Descriptions Target
Value
Specification Justification Warning
Level
Possible
Values
Number of
licenses not
used
The CMDB has
a record of all
software
licenses and
where they are
deployed, so a
report of unused
licenses can be
produced
50 The
Configuration
Management
process should
have control of
software
licenses to
minimize the
cost of unused
licenses.
some unused
license are to
be expected-
they are there
to provide for
capacity needs
over the next
several weeks
80 999999
Number of
failed RFCs
from bad
CMDB data
RFCs are based
on CMDB
information. If
this is incorrect
and they are
eventually
rejected by the
change
Management
process this
must be
recorded.
10 To Improve the
quality of the
CMDB this
metric must be
low, Measuring
it means that the
Configuration
Management
team must be
work closely
with the Change
Manager to
make sure the
RFCs are
consistent with
the CMDB.
Those creating
RFCs must be
able to rely on
the CMDB to
provide
accurate data.
20 999999
Number of
Unauthorized
configurations
Configuration
in the CMDB
that are not
properly
authorized.
5 This is a matter
of
communication
and
management
All
configurations
must be
properly
authorized -
15 999999

87
with the IT and
user
communities.
This should
eventually be
very low indeed.
the process
must be clear
and the CMDB
must be record
these
authorization
accurately.
Number of
incidents from
failed changes
caused by
wrongly
documented
CIS.
Changes are
approved in
terms of the
CMDB which is
taken as an
authority. If a
change fails
because of
wrong
information
about a
component then
it is the
responsibility of
Configuration
Management.
0 This may be
high to begin
with-this metric
should help
bring it down.
CI information
in the CMDB
must be
correct-so
changes will be
correct, and so
incidents will
not arise from
them.
6 999999
Number of
breached SLA
because of
CMDB errors
First priority to
begin with to
make sure that
enough
accuracy is in
the CMDB to
prevent
breeching SLA.
Eventually it
should be
accepted that
this is always 0-
then, When it
has been 0 for
some months,
another metrics
can be
substituted.
0 This should
never happen.
The CMDB is in
place and
Configuration
Management
controls are
working well
with good
change
Management,
Outage ought
not to occur
because of
problems with
the CMDB.
Inaccuracies or
missing
elements in the
CMDB can
lead to poor
problem
solving and
even poor
incident
management.
2 99999
Number of
RFCs without
corresponding
CI updating
Every time a CI
undergoes a
change, there
has to be a
corresponding
authorized RFC
and a
subsequent
updating of the
CMDB to
reflect the
change
completion
None During an audit,
the number of
RFCs for which
the CMDB does
not show
corresponding
configuration
status.
To ensures
accurate and
authorized
information in
the CMDB by
process
adherence.
equal or
less than 5
at any
point of
time
0-100
Percentage of
inaccurate CIS
All corrections
to CIS to 80 This quality of
data input is
Configuration
Management
40 0-5

88
improve
accuracy must
be counted to
contribute to
this metric.
important -some
of the data
comes from
other tools and
organizations so
it might take
time before this
can be reduced
to a consistently
low level.
Process is
designed to
ensure the
accuracy of CI
information.
Customer
Satisfaction
Customer
Satisfaction
measured by
reference to the
Process
Relationship
diagram
4 Customer
Satisfaction
measured by
reference to the
Process
Relationship
diagram
A test of the
effectiveness
of this process.
bigger
than 3
Rate of RFH
failure caused
by CMDB
errors
.Rate of change
management
failures caused
by original
information
errors
Rate of no
corresponding
request service
items.
Rate of
configuration
information
unavailable
after change
occurred due to
no updating the
configuration
database
Rete of unable
to execute
configuration
after changes
occurred
rate of no
upgrading the
accident
numbers after
the change
configuration
execution

89
8.3.1 Example of HAVERBLAD IT Management AB
Title Quan/Qual ITSM Process ITSM Owner
Percent changes that have
caused an incident or
problem.
(Quantitative) Configuration
Management Process
Configuration
Manager
Percent incorrect
information about
configuration devices
(Quantitative) Configuration
Management Process
Configuration
Manager
Percent changes that have
failed due to incorrect
information on
configuration devices.
(Quantitative) Configuration
Management Process
Configuration
Manager
Percent configuration
units that is new in the
period.
(Quantitative) Configuration
Management Process
Configuration
Manager
Percent configuration
devices that have been
phased out over the
period.
(Quantitative) Configuration
Management Process
Configuration
Manager
Percent configuration
devices by category or
type.
(Quantitative) Configuration
Management Process
Configuration
Manager
Percent configuration
devices that will be phased
out during the next
period.
(Quantitative) Configuration
Management Process
Configuration
Manager
Results of verification of
the configuration system.
(Quantitative) Configuration
Management Process
Configuration
Manager
Percent unapproved (also
called certified or
accredited) configuration
devices.
(Quantitative) Configuration
Management Process
Configuration
Manager
Percent configuration
entities registered
properly.
(Quantitative) Configuration
Management Process
Configuration
Manager
Percent configuration
devices that are assigned a
status.
(Quantitative) Configuration
Management Process
Configuration
Manager

90
8.4 Change Management
ITSM process owner: Change Manger.
Metrics objectives: Change Management to be an effective process for implementing changes
required by the organization.
Goal: To ensure that standardized methods and procedures are used for efficient and prompt
handling of all changes.
Source: ITSMF international- Metrics for IT Service Management , Security standardization in
incident management: the ITIL approach
Audience: Process Owner, IT Management, SLA Process Owner, Business Customer, Team
Member, SIP Process Owner.
Metrics
Title
Descriptions Target
Value
Specification Justification Warning
Level
Possible
Values
Percentage of
failed changes
RFCs that
have been
approved, But
then fail to be
implemented.
5 Changes that
have failed to
complete.
Justification: The
change
Management
Process ought to
recognize risks
in RFCs and not
approve those
that will not
complete
properly.
10 0-100
Percentage of
rejected RFCs
Change
proposals are
screened
(Mainly by the
Service Desk).
Once a change
has been
accepted and
developed to
the level of
having an
RFC.
10 This is kept low
by good
communication,
Poor requests
for change
ought to be fair
chance of it
succeeding.
This measures
how well the
screening
process is
working.
20 0-100
Number of
unauthorized
changes
Any change to
the
infrastructure
that is detected
for which
15 This is kept low
by good
communication,
All changes
must be under
change control
30 999999

91
there is not a
standard
change or an
approved
RFC.
Change
backlog
These measure
two things.
One is the
number of
approved
changes that
have not been
auctioned
within target
time, The
other is the
number of
RFCs that
have not been
approved or
rejected.
5 If this is big, the
organization is
not coping.
Maybe there is
too much change
or not enough
people working
on changes.
changes must
be executed as
close to the
target time as
possible.p.112
15 999999
Outages
during
changes
Any service
outages will
be measured
by incidents.
If a change
occurs out of
service hours
then there can,
by definition,
be no service
outage.
0 In a perfect
world there will
never be any
unplanned
outage during
changes,
If a change is
seen to be
failing then it
must be backed
out before it
impacts
services. The
back out plan
ought to have
been tested so
that back-out
does not result
in any service
outages.
6 999999
Number of
failed changes
with no back-
out plan
0 All changes
should have a
back out plan -
This should
always be
checked.
No change
should be
without a
properly tested
back out plan.
If a change fails
and lacks a plan
then at least,
poor risk
analysis has
been
performed.
2 999999
Percentage of
changes on
time
All changes
have a
completion
time. If they
are still open
after this time
they count
toward this
metric.
95 Delays can be
caused by good
reasons. If
percentage failed
changes is Low
then a high value
here might be ok,
SO it should be a
lower priority.
If changes are
consistently
late then it
shows poor
change control
and an
increased risk
of business
disruption.
90 0-100

92
Percentage of
changes
causing
incidents
Any Incident
that is found,
on closing
have been
caused by a
change is
counted
toward this
metric.
5 If there is a
danger of
changes causing
incidents they
should be done
out of SLA hours
during planned
downtime, If
changes cause
incidents, It is
probably a result
of bad planning
or testing
Changes should
never cause
business
disruption.
10 0-100
Number of
CAB items not
action on time
Any
documented
action item for
the CAB will
have a date for
the action to
take place.
0 All CAB items
should be acted
on this metric
should be
unnecessary.
The CAB must
be responsive;
Otherwise the
change
Manager
cannot make
effective
decisions.
3 999999
Number of
Emergency
Changes
All changes
that go
through the
emergency
change
process.
3 The emergency
change process
allows for some
of the safeguards
to be reduced or
circumvented.
There will
always be the
occasional need
for emergency
changes.
However it is
vital that they
never become a
normal way of
operating.
3 999999
Number of
changes that
do not deliver
expected
results
Changes that
don't produce
the result
planned in the
RFC.
3 Changes are
defined in the
RFC which
includes the
expected
outcome.
Planning and
testing are
expected to
ensure that
RFCs result in
effective
changes that are
not disruptive
and produce the
desired result.
3 999999
Customer
satisfaction
Internal
satisfaction
with the
Change
Management
process
measured for
every RFC.
4 Measured in
relation to the
Process
Relationship
diagram.
This is a sound
measure of the
quality of
output.
bigger than
3
0-5
Rate of
change
failure.
Rate of unable
to change of
unsolvable
events. High
will be lower
the customer
satisfaction
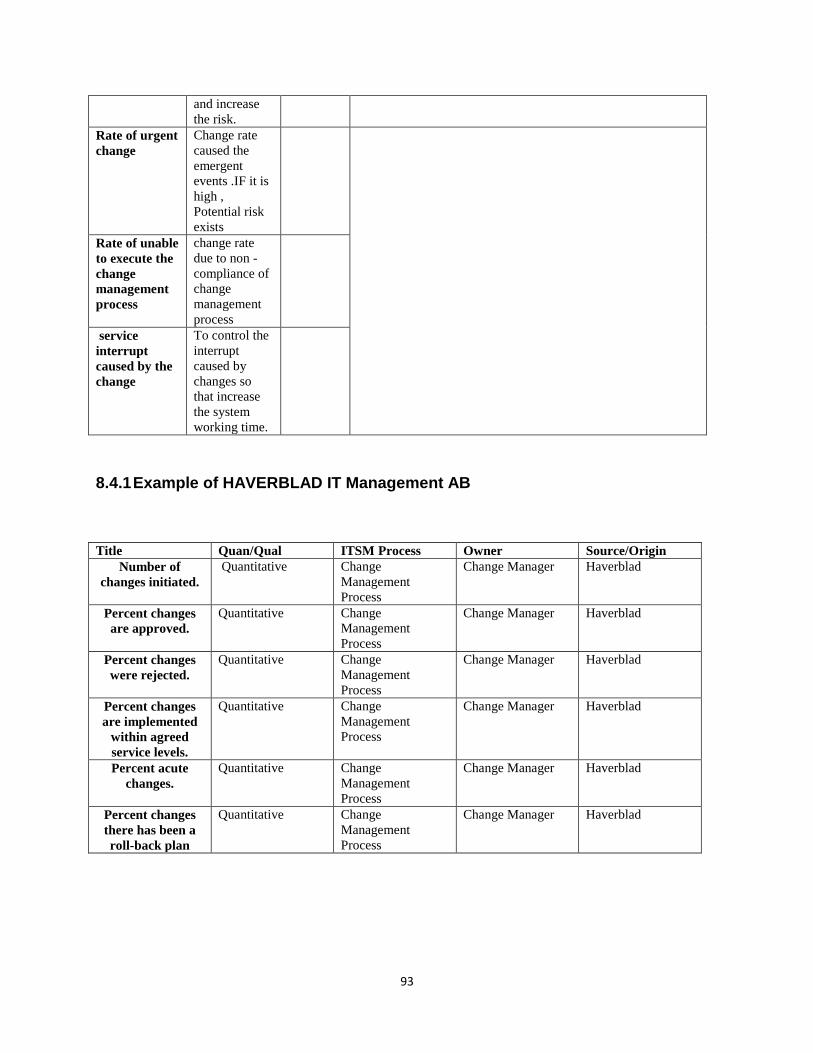
93
and increase
the risk.
Rate of urgent
change
Change rate
caused the
emergent
events .IF it is
high ,
Potential risk
exists
Rate of unable
to execute the
change
management
process
change rate
due to non -
compliance of
change
management
process
service
interrupt
caused by the
change
To control the
interrupt
caused by
changes so
that increase
the system
working time.
8.4.1 Example of HAVERBLAD IT Management AB
Title Quan/Qual ITSM Process Owner Source/Origin
Number of
changes initiated.
Quantitative Change
Management
Process
Change Manager Haverblad
Percent changes
are approved.
Quantitative Change
Management
Process
Change Manager Haverblad
Percent changes
were rejected.
Quantitative Change
Management
Process
Change Manager Haverblad
Percent changes
are implemented
within agreed
service levels.
Quantitative Change
Management
Process
Change Manager Haverblad
Percent acute
changes.
Quantitative Change
Management
Process
Change Manager Haverblad
Percent changes
there has been a
roll-back plan
Quantitative Change
Management
Process
Change Manager Haverblad
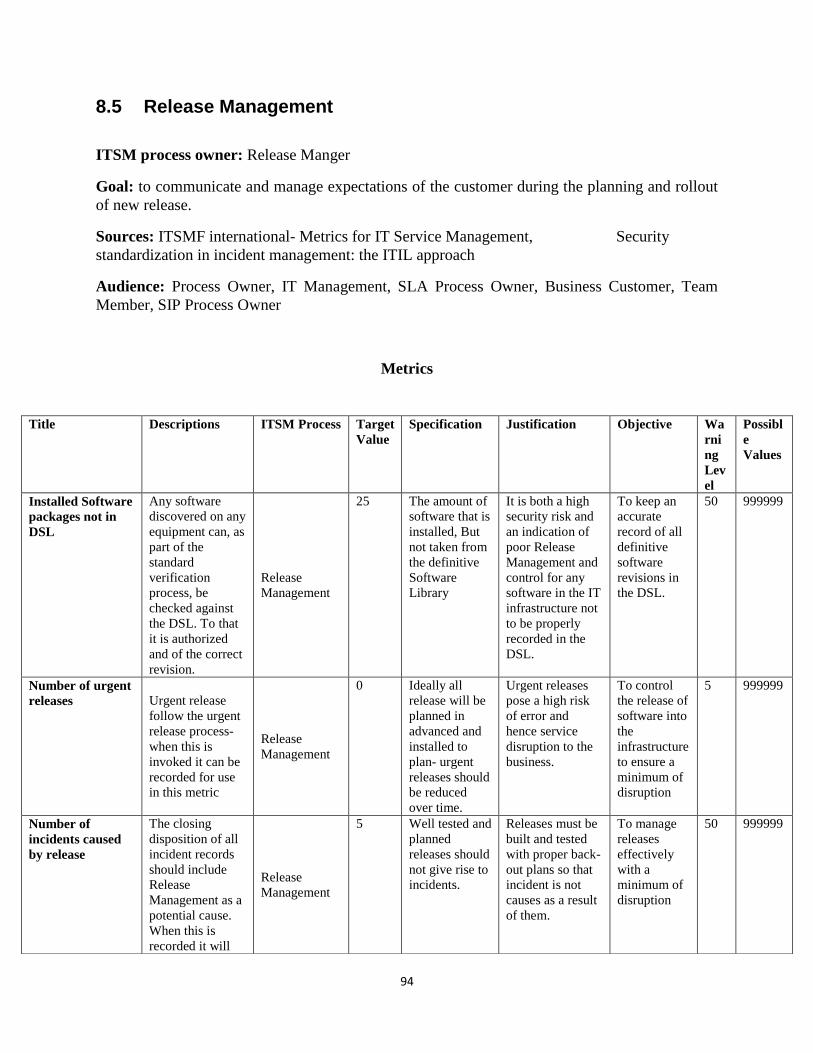
94
8.5 Release Management
ITSM process owner: Release Manger
Goal: to communicate and manage expectations of the customer during the planning and rollout
of new release.
Sources: ITSMF international- Metrics for IT Service Management, Security
standardization in incident management: the ITIL approach
Audience: Process Owner, IT Management, SLA Process Owner, Business Customer, Team
Member, SIP Process Owner
Metrics
Title
Descriptions ITSM Process Target
Value
Specification Justification Objective Wa
rni
ng
Lev
el
Possibl
e
Values
Installed Software
packages not in
DSL
Any software
discovered on any
equipment can, as
part of the
standard
verification
process, be
checked against
the DSL. To that
it is authorized
and of the correct
revision.
Release
Management
25 The amount of
software that is
installed, But
not taken from
the definitive
Software
Library
It is both a high
security risk and
an indication of
poor Release
Management and
control for any
software in the IT
infrastructure not
to be properly
recorded in the
DSL.
To keep an
accurate
record of all
definitive
software
revisions in
the DSL.
50 999999
Number of urgent
releases Urgent release
follow the urgent
release process-
when this is
invoked it can be
recorded for use
in this metric
Release
Management
0 Ideally all
release will be
planned in
advanced and
installed to
plan- urgent
releases should
be reduced
over time.
Urgent releases
pose a high risk
of error and
hence service
disruption to the
business.
To control
the release of
software into
the
infrastructure
to ensure a
minimum of
disruption
5 999999
Number of
incidents caused
by release
The closing
disposition of all
incident records
should include
Release
Management as a
potential cause.
When this is
recorded it will
Release
Management
5 Well tested and
planned
releases should
not give rise to
incidents.
Releases must be
built and tested
with proper back-
out plans so that
incident is not
causes as a result
of them.
To manage
releases
effectively
with a
minimum of
disruption
50 999999

95
contribute to this
metric.
Percentage of
releases on time Release
Management
includes planned
dates for all parts
of all releases in
the CMDB
Release
Management
95 As planning
improves all
releases should
be on time.
There is good
reason to change
release dates.
However, Good
consultation with
all stakeholders
in advance should
make changes
unusual.
To Manage
releases
effectively to
satisfy
business
requirements.
90 0-100
Number of
untested releases
All releases ought
to have a test
carried out and
signed off by a
person
independent of
the person who
built the release.
If this is missing
at the time of the
release then it
will count as part
of this metric.
Release
Management
0 This is an
important
Metric; if
untested
releases are
used there is a
danger of
incidents and
downtime
being caused.
Even emergency
releases ought to
be tested .Any
untested release
poses a very high
risk to business
continuity.
To Manage
releases
effectively to
reduce
disruption to
the business.
0 999999
Average cost of
release
Actual costs in
man-hours are the
simple measure.
Release
Management
300 The target and
limits are
simply guesses
here; the goal
is to reduce the
cost per
release.
Releases must be
designed to be
cost effective.
500 999999
Number of unused
software licenses Software licenses
that are not
installed and not
justified by
Capacity
Management.
Release
Management
100 Software
licenses should
only be paid
for on CIS that
are authorized
to have
software
installed from
the DSL.
If the CMDB is
working properly
, It ought to be
possible to
identify these
easily, p120
200 999999
Percentage of
accuracy of
release estimates
Simply put this is
the absolute
difference in
planned time
from actual time
Release
Management
80 This is
composite
metric, made
up of the
estimated time
it would take
to make the
release, the
man hours
used for the
release, The
number of CIS
Forecast accuracy
allows sound
business
decisions to be
made.
60 0-100%
Customer
Satisfaction
include this as a
high value until it
is consistently
good, then put it
Release
Management
4 As shown by
the process
relationship
diagram. In
Release
Management has
a major impact on
end users and it is
To provide
effective
Service
Management
< 3 0-5

96
at lower priority this case
though, end
user
satisfaction
reports with
particular roll-
out must also
be included
where they are
available.
important that
they have had
proper
communication,
awareness and
training.
processes
Number of bugs
investigated This is a measure
of the
maintainability of
the code. Ideally
there will be more
enhancements
than bug faces.
Release
Management
E1.Application
Support
Metrics
4 The list of
bugs allocated
and signed off
as complete
supplies the
measure.
There are more
detailed
measures. This
lacks the
discrimination
between easy and
difficult problems
to solve.
2 999999
Number of
optimization
Optimization
logged and
approved
Release
Management
E1.Application
Support
Metrics
20 This covers
improvements
to the code that
are not
approved
enhancements
or bug fixes.
These
improvements
must be
managed as
one of the
objectives of
capacity
Management is
to improve the
performance of
applications.
it is important
that application
use resources
effectively.
10 999999
Number of
applications/revisi
ons released to
production
Accepted releases
Release
Management
E1.Application
Support
Metrics
4 As measured
by Release
Management
in The DSL.
This is a measure
of genuine
delivered
productivity -
which not
necessarily
relates to the
quality of the
application.
2 999999
Number of end-
user training
sessions
End-user training
for new release or
new hires.
Release
Management
E1.Application
Support
Metrics
10 This is an
important
measure of
communication
between
application
support and
users.
Though the actual
delivery of
training is the
responsibility of
release
Management, the
writing of
training materials
and the
monitoring of the
quality of the
5 99999

97
courses is a
responsibility of
Application
Support.
Number of
production fixes
This is simply the
number of new
bugs found by
Application
Support them-
selves.
Release
Management
E1.Application
Support
Metrics
4 It is normal to
fix that have
been found by
users.
Measures that can
improve the
quality of the
service to the
business are
important.
2 999999
Number of
production fixes
Production fixes
Release
Management
E1.Application
Support
Metrics
5 This include all
fixes logged by
release
Management
.it could be
measured as an
absolute value
as well as per
person
working in
application
support
These will
include non-
coding fixes, such
as configuration
fixes that it is
responsible for
testing.
3 999999
Number of fixes
returned to
development
Fixes that did not
work
Release
Management
E1.Application
Support
Metrics
2 Fixes rejected
by Release
Management
or roll-back in
production
deployment .it
could be
measured as an
absolute value
as well as per
person
working in
Application
support.
This is an
indication of poor
testing.
1 99999
Number of defects
found during
development or
testing
Defects logged
against in-house
software.
Release
Management
E2 Application
Development
Metrics
20 These are
found during
development
or testing but
not live
deployment.
These are
measure of the
reliability of code
produced.
10 999999
Number of defects
fixed during
testing
Measure by
defects logged as
fixed and tested.
Release
Management
E2 Application
Development
Metrics
25 Measured by
defects
discovered
during testing.
These are a
measure of the
reliability of code
produced.
20 999999
Number of
reported bugs
fixed
Service disrupting
software defects.
Release
Management
E2 Application
Development
Metrics
10 These are
defects
discovered
during testing.
It could be
measured as an
absolute value
as well as per
person
A measure of
productivity.
5 999999

98
working in
Application
Support.
Number of
applications/revisi
ons accepted as
deployed Working releases.
Release
Management
E2 Application
Development
Metrics
3 Bugs
determined to
be the
underlying
problem from
incidents
logged at the
service Desk.
Unlike software
defects through
testing, these are
known to have
caused incidents,
s it is important
that they are
fixed.
1 999999
Number of
application/revisio
ns rejected by
application
support
Defective builds.
Release
Management
E2 Application
Development
Metrics
1 From release
management,
the number of
release
deployed
successfully.
This is measure
of the quality of
build , overtime
this should be a
very low figure as
testing improves
3 999999
Number of
application
designs assigned
off by business Approved designs
Release
Management
E2 Application
Development
Metrics
2 Designs
accepted by the
business.
This ensures that
the design
process is
transparent and
approved by the
business.
10 999999
Number of
successful
application builds
These are
measured by
builds submitted
to the DSL,
which contains
interim non-
production builds
as well as
production builds.
Release
Management
E2 Application
Development
Metrics
2 Builds built
and tested in
development
This is a measure
of internal
productivity.
Internal builds
that are tested and
found acceptable
may go on to
Alpha or Beta
testing or even
production ,
6 999999
Number of days
deployment
slipped
The time is
measured from
the agreed
delivery date of
tested code to the
DSL.
Release
Management
E2 Application
Development
Metrics
5 This is all
application /
Revision
A measure of
how effective
Application
Development is
at working to
schedules.
10 999999

99
8.5.1 Example of HAVERBLAD IT Management AB
Title Quan/Qual ITSM process Process
Owner
Percent of
configuration entities
that have an owner.
quantitatively Release
Management
Process
Release
Manager
Percent acute
releases.
quantitatively Release
Management
Process
Release
Manager
Percentage of
releases that have not
been tested according
to plan.
quantitatively Release
Management
Process
Release
Manager
Intergrades releases
implemented on
schedule.
quantitatively Release
Management
Process
Release
Manager
Time between pre-
release and
implementation.
quantitatively Release
Management
Process
Release
Manager
8.5.2 Example of Pink Elephant
Title Description ITSM process Process Owner Relate To
business
Objective
Number RFC's in
production
Number RFC is
implemented
Release Management
Process
Release
Manager
Operational
specific
solution Team Release Management
Process
Release
Manager
Operational
specific
Ratio part and parcel
releases
Ratio part and parcel
releases
Release Management
Process
Release
Manager
Operational
specific
Number of
distribution which is
interrupted in the
process
Number of distributions
that interrupted during
the process
Release Management
Process
Release
Manager
Operational
specific
Non DSL
construction solutions
Number of software
packages based on
sources other than DSL
Release Management
Process
Release
Manager
Operational
specific
Number of software
construction solutions
emanating from
sources other than
DSL
Release Management
Process
Release
Manager
Operational
specific
Combined release Total cost per release Release Management
Process
Release
Manager
Operational
specific

100
Resource Cost per
release
Release Management
Process
Release
Manager
Operational
specific
Total cost per release Release Management
Process
Release
Manager
Operational
specific
Percentage of releases
that are urgent
Release Management
Process
Release
Manager
Operational
specific
Number of successful
installations
Release Management
Process
Release
Manager
Operational
specific
License-free versions The number of versions
without license
Release Management
Process
Release
Manager
Operational
specific
8.5.3 Example of KPI Library
Title Description ITSM process ITSM Owner Relate To
business
Objective
Successful software
updates
Number% of successful
software updates are
Release Management
Process
Release
Manager
Operational
specific
Lead time for
emergency releases
Average Lead time
between acute releases
Release Management
Process
Release
Manager
Operational
specific
untested releases The number of untested
releases
Release Management
Process
Release
Manager
Operational
specific
unsigned releases The number of unsigned
releases ie not approved.
Release Management
Process
Release
Manager
Operational
specific
Number of reported
bugs that are
included in the
release
% Of reported bugs
from users that are
corrected with this
release
Release Management
Process
Release
Manager
Operational
specific
Ratio found errors in
test vs. corrected
release
% Of the total number
of bugs found during
testing and been time to
be corrected and
delivered before the
release goes live.
Release Management
Process
Release
Manager
Operational
specific
successful releases Percentage of releases
that are built and
implements on time and
within budget
Release Management
Process
Release
Manager
Operational
specific

101
8.6 Operations Management/ICT Infrastructure Management
ITSM process owner: ICT Infrastructure Manager
Metrics objectives: To manage and deliver high quality ICT service in line with business
requirements in the areas of Design and Planning, Deployment, Operations and Technical
Support
Goal: Design and Planning, Deployment. Operations, Technical Support
Sources: ITSMF international- Metrics for IT Service Management , Security standardization in
incident management: the ITIL approach
Audience: Process Owner, IT Management, SLA Process Owner, Business Customer, Team
Member, SIP Process Owner
Metrics
Title
Descriptions Target
Value
Specification Justification Warning
Level
Possible
Values
Number of plans
signed off by the
business
Agreed plans, 2 Design and
planning. These
plans must each
be completed in
detail and
signed off by
the business
owners using
the criteria from
the strategy.
Plans must
each be
properly
managed and
signed off.
5 999999
Number of plans
not ready for sign-
OFF
Plans in the
pipeline.
2 Design &
planning, This is
a measure of the
number of the
plans in the
strategic
document that
are due this
month but not
ready for sign
off.
This is
measure of
future
productivity.
7 999999
Delay from
deployment plan
Plan delayed.
Delay in actual
deployment
dates relative to
planned
deployment
dates. Measure
from the
Froward
Schedule of
change.
2 Deployment.
The deployment
plan will have
milestones.
This is a
measure of
effectiveness.
A high figure
probably
indicates a
problem with
resources or a
problem with
planning
deployment.
5 999999

102
Number defects
during deployment
Any difficulties
found during
deployments.
2 Deployment.
The defects are
events or
incidents that
occur as a result
of the
deployment.
Deployment
ought to be
planned not to
disrupt
services.
250 999999
Number of security
events
Measured from
the
infrastructure
monitoring
tool.
150 Operations. The
management of
firewalls and
virus removal
programs should
keep these to a
minimum. This
count normally
is per day since
most viruses
appear on a
daily base and
require
immediate
response
0.03 999999
Number of serious
critical events per
managed Object.
Measured from
the
infrastructure
monitoring tool
this measures
stability.
0.01 Operations. The
number of
serious or
critical events
per Managed
Object
Operations
task is to
maintain a
stable
infrastructure.
This measures
how effective
this has been
20 999999
Number of
job/script/backup
failures
Scripting
hardware or
process errors
in operations.
5 Operations. The
number of Job,
Script, backup
failures.
All scripts and
job are part of
the DSL,
failures will
require
changes to
these or to
operational
procedures.
10 999999
Number of
incidents as a
result of
operational
changes
Serious
operational
incidents.
5 Measured by the
closing
disposition on
incidents that
list operations
as a cause.
Operational
changes
should take
place out of
service hours,
so this should
be very low, It
is important to
measure to
make sure that
it remains low.
bigger
than 3
999999
Customer
satisfaction
Customer
Satisfaction
4 Customer
Satisfaction measure
as defined in the process Relationship
diagram.
This is a
measure of the
effectiveness
of IT
provision.
5 999999

103
8.7 Service Level Management (SLM)
ITSM process owner: Service Level Manager.
Metrics objectives: IT service Management provides effective services to levels agreed to with
the business.
Goal: To maintain and improve IT service quality, through a constant cycle of agreeing,
monitoring and reporting upon IT service achievements and instigation of actions to eradicate
poor service, in line with business or cost justification. Through these methods, a better
relationship between IT and its Customers can be developed.
Sources: ITSMF international- Metrics for IT Service Management , Security standardization in
incident management: the ITIL approach.
Audience: Process Owner, IT Management, SLA Process Owner, Business Customer, Team
Member, SIP Process Owner
Metrics
Title Descriptions Target
Value
Specification Justification Warning
Level
Possible
Values
Number of SLA
targets missed
This should be
kept low. If this
turns out to be
high, then there
must be an
exceptional
situation or
SLAs must be
re-negotiated.
10 Any incident,
Service call, or
agree
performance
target outside
the SLA is
covered.
This is a
measure of
times when the
service levels
have not been
met and it is
important for
IT have
explanation for
these for the
business as
well as agreed
action to
resolve them.
25 999999
Number of SLA
targets threatened
This is a
measure of how
close IT comes
to breaching
SLAs.
10 This includes
all escalations
that occur
because an SLA
target will be
breached within
thirty minutes.
Though the
business is
properly
concerned only
with actual
breaches of
agrees SLAs,
the process
owner and IT
must be
concerned with
any incidents
that seriously
threaten the
SLA
thresholds.
25 0-100

104
Percentage of
SLAs that require
changes
This measures
unplanned
change to SLA
outside of
review periods.
it suggests a
major mismatch
of expectations
between the
business and IT.
2 If a SLA has
been set badly
then it will be
impossible to
meet and a
discussion with
the customer
will be needed
to rectify the
SLA setting this
metric measures
this problem.
Though this is
expected to be
low -or nil
where SLAs
are properly
concluded, it is
important to
keep track of
any SLAs that
require
substantial.
4 999999
Number of SLA
reviews completed
on time
Reviews are
important and
must include
information that
might lead to
the SLA being
re-negotiated.
95 All SLAs
should have a
renewal date
reducing the
risk of long
review periods
or of reviews
being opened ,
but not
concluded
90 999999
Number of SLA
breaches caused
by third party
support contracts The figure can
help in
negotiating
improved
services from
third parties.
2 All incidents
that breach
SLA that are
caused by third
parties will
show this in the
closing
information so
this can be
reported here.
Unless the
effectiveness
of delivery
against
underpinning
contrast is
measured,
there is no way
to be certain
that they are
being effective.
5 999999
Service Delivery
costs
Whatever the
currency, 100
are representing
the target value,
So 2% of over
that is seen as
the danger area.
100 This metric will
eventually be
measured with
considerable
accuracy.
Though
charging is not
a standard
objective of
Service
Management.
Costing is.
102 999999
Number of
services not
covered by SLA
Service ought
not to exist
unless covered
by an SLA-
Otherwise there
is no evidence
that they are
required for
business
10 this will reduce
as SLA
management is
introduced , the
final aim is to
cover all
services
this is a
measure of the
span of the
SLA process
15 999999
Number of OLAs
Underpinning
Contracts (UCS)
not yet agreed
upon
Operational
level Agreement
and
Underpinning
Contracts will
be negotiated
and this number
will grow as
service level
Management is
25 Without this
measure there
is a danger that
OLAs and
underpinning
Contracts that
are not yet
completed and
Signed off.
40 0-5

105
extended
suppliers.
Customer
Satisfaction
Customer
Satisfaction as
measured by the
process most
closely
associated with
this one.
4 Customer
Satisfaction
metric as
described in the
Process
Relationship
diagram.
This is
subjective, but
genuine,
measure of the
quality of the
output of
process.
< 3 999999
SLR -> SLA
turnaround
The measures
the time from
creation of an
SLR to final
acceptance of
an SLA,
30 days The turnaround
time is the time
it takes to turn
an SLR from
first creation
into and Signed
off SLA.
This time is
clearly affected
by the speed
which the
appropriate
business unit
can respond, as
well as by the
efficiency of
the SLA
process.
60 days 999999
8.8 Problem Management
ITSM process owner: Problem Manager
Metrics objectives:
To determine problems that is related to (Potential) service disruptions and to minimize
their effect or remove them entirely as a cause of disruptions.
To assist problem Management in identifying trends.
To reduce number of incidents reported and increase support effectiveness.
To discover what are the outstanding costs of quality in problem management.
Goal: To minimize the adverse business impact of incidents that are causes by errors within the
IT infrastructure, and to prevent recurrence of incidents related to these errors.
Sources: ITSMF international- Metrics for IT Service Management , Security standardization in
incident management: the ITIL approach
Audience: Process Owner, IT Management, SLA Process Owner, Business Customer, Team
Member, SIP Process Owner
How to guide: The Help Desk Management, Incident Management and problem management
handle incidents and service requests and update into the case library (Stewart & Yuk-Hee,
2007).

106
Metrics
Title
Descriptions Target
Value
Specification Justification Warning
Level
Possible
Values
Number of
problems
closes
This is a
measure of
activity, but
also of
effectiveness.
20 The number
of problem
records
closed.
Problem can take a
long time to solve.
10 999999
Number of
incidents
resolved by
known Errors
incident
closed by
solutions that
were
registered with
known Errors
save time and
re-work as
keeping
customer
service levels
high
50 The number
of resolved
incidents
should
increase.
The known Error
DB is the primary
communication
path between
Problem and
Incident
Management.
20 999999
Total number
of incidents
Incidents are
caused by
problems-if
the problems
are removed,
then the
number of
incidents will
reduce.
200 This , and
Customer
Satisfaction ,
are the main
measures of
problem
management
success
The reduction of
this measure is the
prime means of
establishing the
contribution from
Problem
Management.
400 999999
Total user
downtime
Though this is
really a
measure of
availability, it
is also a
measure of the
effectiveness
of Problem
Management -
if problems
are removed
quickly and
efficiently
then users will
experience
much lower
levels of
downtime.
100 This can be
measured in
hours by
summarizing
the time to
solve
incidents over
all affected
users during
SLA hour.
This customer
facing measure and
gives a direct
picture of how
disruptive unsolved
problems are.
200 999999
Number of
RFCs raised
by problem
Management
RFCs raised
by Problem
Management
connected to
problems
20 The number
of requests
for change
management
connected to
problem,
Each RFC raised
BY Problem
Management in
response to a
problem is an
aimed at realizing a
10 999999

107
solution. So this is
a direct measure of
the output of the
process.
Average
number of
open
problems
Open
problems
reflect the
current
workload of
Problem
Management.
25 The average
number of
Open
problems
Some problems
will be open a long
time, but this gives
a picture of how
effectively, the
workload is being
managed.
40 999999
Average time
to close a
problem
Problems can
take a long
time to be
solved.
Monitoring
may be
necessary for
weeks, before
enough data
are collected
to find a
diagnose
3 Time from
problem
creation to
problem close
for problems
closed this
period
If this figure
reduces over time,
it is an indication
that better tools,
training and
processes are being
used. If it increases
then it is advance
warning that
Problem
Management might
be under -
resourced.
5 999999
Percentage of
incidents not
linked to
problems
This shows
incidents that
have not yet
been
examined by
problem
Management.
The
percentage of
incidents that
are not linked
to a problem
record-this
can be
measured
once a day
averaged over
the week, or
an average
could be
taken every
hour.
All incidents are
caused by
problems, when
they are linked to a
problem it shows
that ultimate
resolution is in the
hands of problem
management.
0-100
Number of
problems that
misses target
resolution
time
Just as with
incidents,
Problems are
given target
solution times
based on SLA
and urgency of
the associated
incidents. This
measures how
effective
Problem
Management
is at meeting
this objective.
The number
of problems
that have
exceeded the
target
solution date
and been
escalated.
This gives a picture
of how many
serious problems.
999999
Customer
Satisfaction
Customer
Satisfaction as
4 Customer
satisfaction
This is a
subjective. But
< 3 0-5
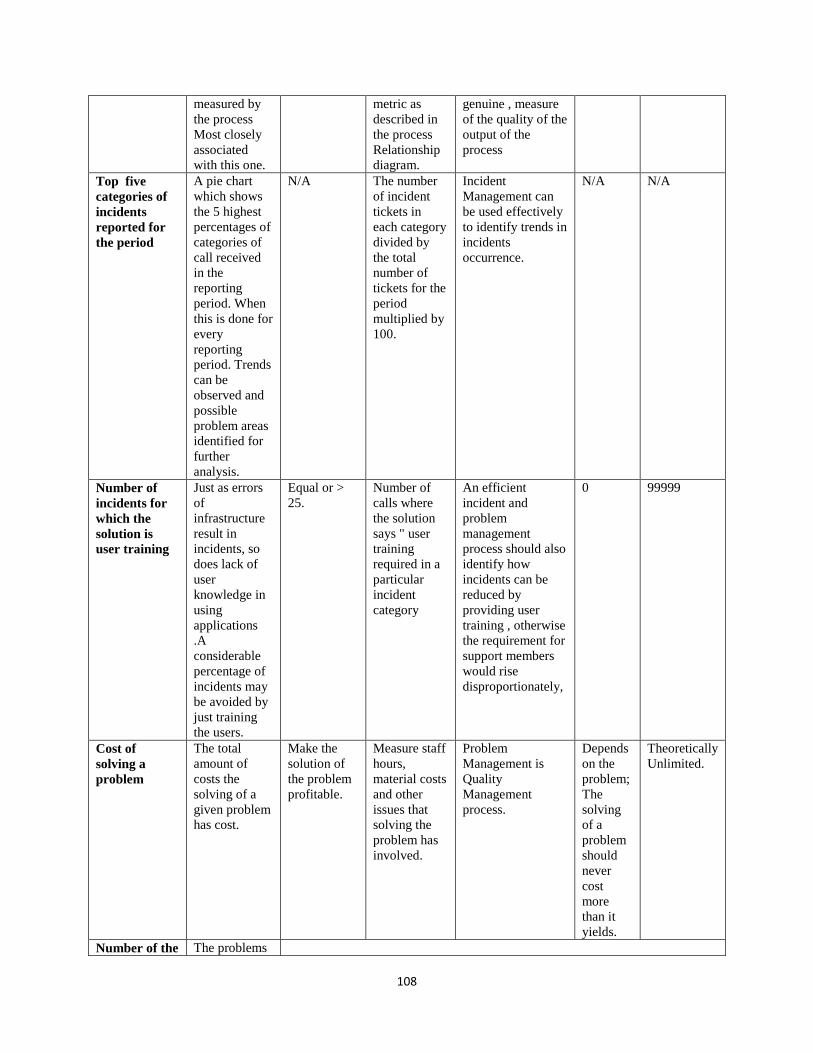
108
measured by
the process
Most closely
associated
with this one.
metric as
described in
the process
Relationship
diagram.
genuine , measure
of the quality of the
output of the
process
Top five
categories of
incidents
reported for
the period
A pie chart
which shows
the 5 highest
percentages of
categories of
call received
in the
reporting
period. When
this is done for
every
reporting
period. Trends
can be
observed and
possible
problem areas
identified for
further
analysis.
N/A The number
of incident
tickets in
each category
divided by
the total
number of
tickets for the
period
multiplied by
100.
Incident
Management can
be used effectively
to identify trends in
incidents
occurrence.
N/A N/A
Number of
incidents for
which the
solution is
user training
Just as errors
of
infrastructure
result in
incidents, so
does lack of
user
knowledge in
using
applications
.A
considerable
percentage of
incidents may
be avoided by
just training
the users.
Equal or >
25.
Number of
calls where
the solution
says " user
training
required in a
particular
incident
category
An efficient
incident and
problem
management
process should also
identify how
incidents can be
reduced by
providing user
training , otherwise
the requirement for
support members
would rise
disproportionately,
0 99999
Cost of
solving a
problem
The total
amount of
costs the
solving of a
given problem
has cost.
Make the
solution of
the problem
profitable.
Measure staff
hours,
material costs
and other
issues that
solving the
problem has
involved.
Problem
Management is
Quality
Management
process.
Depends
on the
problem;
The
solving
of a
problem
should
never
cost
more
than it
yields.
Theoretically
Unlimited.
Number of the The problems

109
problems have
been solved
processed in
available time
range,
Processing
time saved,
Repeated
work avoided
and high
service level
kept.
Number of
problems
changed by
the problem
Management
proposed
change
Management
proposes the
problems that
requested
change
processing
The time
percentage of
no
corresponding
problems
The events
that have not
been checked
by problem
Management ,
20 10 999999
8.8.1 Example of HAVERBLAD IT Management AB
Title Quan/ Qual ITSM Process Process Owner
Minimum and maximum
transactions per second
quantitatively Problem Management
Process
Problem Manager
Number of problem cases
during the period.
quantitatively Problem Management
Process
Problem Manager
Percentage of known bugs. quantitatively Problem Management
Process
Problem Manager
Percentage of solved
problems.
quantitatively Problem Management
Process
Problem Manager
Percent change matters
initiated by
problemhanter-insertion
process.
quantitatively Problem Management
Process
Problem Manager
Average lösningstid. quantitatively Problem Management
Process
Problem Manager

110
8.9 Financial Management
Process owner: IT Manager
Metrics objectives: To manage IT infrastructure costs and to provide a sound basis for business
decisions relating to IT by identifying and accounting for the costs of delivering services
Goal: To provide cost-effective stewardship of the IT assets and resources used in providing IT
services.
Sources: ITSMF international- Metrics for IT Service Management , Security standardization in
incident management: the ITIL approach
Audience: Process Owner, IT Management, SLA Process Owner, Business Customer, Team
Member, SIP Process Owner
Comments: Manages an IT Service provider's budgeting accounting and charging requirements.
Metrics
Title
Descriptions Target
Value
Specification Justification Warning
Level
Possible
Values
Percentage
of IT costs
accounted
for (%Cost)
The scope of
current
costing. The
CMDB will
provide some
costs from the
asset DB -
These can be
checked
against the
records kept
by accounts.
70 Ultimately all IT
Costs, direct and
indirect, Will be
included. To begin
with operation
expenses such as
salaries,
Telephones and
electricity will be
known.
The wider the scope
the better.
50 0-100
Number of
changes
made to
charging
algorithm
How close we
are to a stable
system.
3 The number of
changes made to
the algorithm.
Even if real
charging is not
being carried out, It
is useful to have a
charging algorithm
and to test it
regularly for
reasonableness.
Eventually we
would desire this to
be stable because
we have accurate
models-until it is a
good sign that the
matter is being
actively managed.
10 999999
Delay in
production
of financial
report
How long it
takes to get the
report out.
1 A date is set for the
production of the
regular financial
report; This
indicates slippage
from this date.
Once the process is
mature, The report
will be on time
.Until then, This is a
good mark of how
well it is improving.
2 999999
Delay in Delay in 1 Each month the When mature these 2 999999
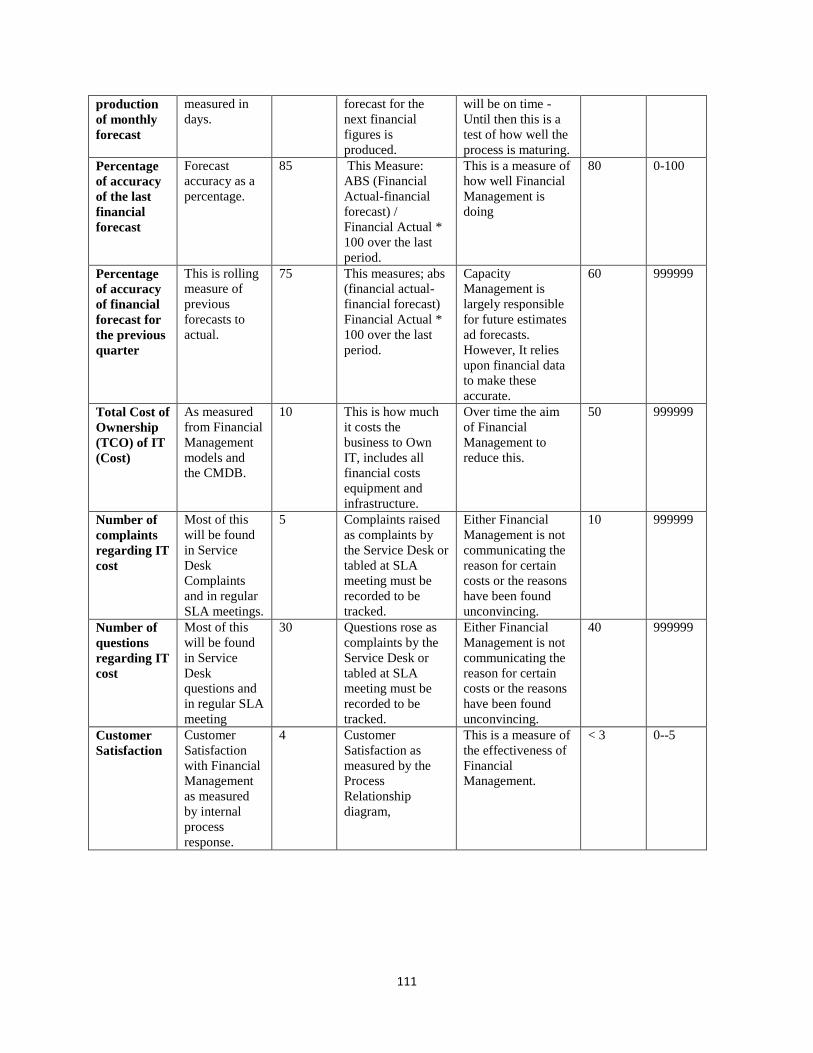
111
production
of monthly
forecast
measured in
days.
forecast for the
next financial
figures is
produced.
will be on time -
Until then this is a
test of how well the
process is maturing.
Percentage
of accuracy
of the last
financial
forecast
Forecast
accuracy as a
percentage.
85 This Measure:
ABS (Financial
Actual-financial
forecast) /
Financial Actual *
100 over the last
period.
This is a measure of
how well Financial
Management is
doing
80 0-100
Percentage
of accuracy
of financial
forecast for
the previous
quarter
This is rolling
measure of
previous
forecasts to
actual.
75 This measures; abs
(financial actual-
financial forecast)
Financial Actual *
100 over the last
period.
Capacity
Management is
largely responsible
for future estimates
ad forecasts.
However, It relies
upon financial data
to make these
accurate.
60 999999
Total Cost of
Ownership
(TCO) of IT
(Cost)
As measured
from Financial
Management
models and
the CMDB.
10 This is how much
it costs the
business to Own
IT, includes all
financial costs
equipment and
infrastructure.
Over time the aim
of Financial
Management to
reduce this.
50 999999
Number of
complaints
regarding IT
cost
Most of this
will be found
in Service
Desk
Complaints
and in regular
SLA meetings.
5 Complaints raised
as complaints by
the Service Desk or
tabled at SLA
meeting must be
recorded to be
tracked.
Either Financial
Management is not
communicating the
reason for certain
costs or the reasons
have been found
unconvincing.
10 999999
Number of
questions
regarding IT
cost
Most of this
will be found
in Service
Desk
questions and
in regular SLA
meeting
30 Questions rose as
complaints by the
Service Desk or
tabled at SLA
meeting must be
recorded to be
tracked.
Either Financial
Management is not
communicating the
reason for certain
costs or the reasons
have been found
unconvincing.
40 999999
Customer
Satisfaction
Customer
Satisfaction
with Financial
Management
as measured
by internal
process
response.
4 Customer
Satisfaction as
measured by the
Process
Relationship
diagram,
This is a measure of
the effectiveness of
Financial
Management.
< 3 0--5

112
8.10 Capacity Management
ITSM process owner: Capacity Manager
Goal: To ensure that cost justifiable IT capacity always exists and that it is matched to the
current and future identified needs of the business.
Sources: ITSMF international- Metrics for IT Service Management , Security standardization in
incident management: the ITIL approach, E-government: ITIL Based Service Management Case
Study.
Audience: Process Owner, IT Management, SLA Process Owner, Business Customer, Team
Member, SIP Process Owner
Comments: Ensures that the capacity of IT service and the IT infrastructure is able to deliver
agreed service level target in a cost effective and timely manner.
Metrics
Title
Descriptions Target
Value
Specification Justification Metric
Objective
Warning
Level
Possible
Values
Number of
SLA
breaches
because of
poor service
performance
Capacity
Management
has the task of
ensuring that
SLA
performance
time is not
exceeded as a
result of
inadequate
capacity.
0 Ultimately all
IT Costs, direct
and indirect,
Will be
included. To
begin with
operation
expenses such
as salaries,
telephones and
electricity will
be known. This
can be
calculated with
help from the
accounting
department.
Call
response
time
exceeded, or
application
response
time.
Capacity
Management
has the job of
anticipating
potential
service
disruption
because of
capacity
issues - this is
measure of
how effective
this job is
being done
2 999999
Number of
SLA
breaches
because of
poor
component
performance
Component
failures as a
result of
performance
or other
capacity
related
problems.
0 The number of
changes made
to the
algorithm.
Even if real
charging is not
being carried
out, It is useful
to have a
charging
algorithm and
to test it
regularly for
reasonableness.
System
performance
poor , For
example,
Resource
Capacity
Management
has the
responsibility
to ensure that
failures as a
result of
insufficient
capacity are
kept to a
minimum.
2 999999
Number of Only 5 A date is set Incident and This is a 10 999999

113
incidents as
a result of
poor
performance
performance
related
incidents are
included.
Monitoring
and tuning
coupled with
trend analysis
ought to
ensure that
performance
related
incidents do
not occur.
for the
production of
the regular
financial
report; This
indicates
slippage from
this date.
Problem
Management
will need to
have
performance
as a possible
closing
cause-and
have good
processes for
making the
decision that
this is the
cause.
direct measure
of effective
Capacity
Management.
Cost of
production
of Capacity
Plan
Total planning
costs. This is
measured
separately
from other
standard
running costs,
so work will
need to be
done with
Financial
Management
to establish
how these
costs can be
monitored
regularly.
10 Each month
the forecast for
the next
financial
figures is
produced.
Man-hours
spent this
planning
period as
well as the
cost of tools
et cetera.
Capacity
Management
ought to be
producing
Capacity
Plans to take
into account
future trends
and business
needs. These
have to be
produced cost
effectively
30 999999
Number of
unplanned
purchases of
performance
related
hardware
Any purchase
required for
performance
related matters
is unplanned
unless it is
listed in the
Capacity Plan.
10 This Measure:
ABS (Financial
Actual-
financial
forecast) /
Financial
Actual * 100
over the last
period.
This would
include extra
RAM, Disk,
CPU, system
or networks
that are
bought to
solve
performance
problems
that were not
planned as
part of the
Capacity
Plan.
Capacity
Management
ought to be
planning
purchases in
advance of
requirements,
in response to
measured
trends and
known
business
plans. This
check that
unplanned
purchases are
reducing in
response to
good
planning.
15 0-100
Percentage
of accuracy
of plan of
forecast
expenditure
How much
spending
exceeds plans
based on
capacity.
90 This measures;
abs (financial
actual-financial
forecast)
Financial
Abs (Period
Planned
expenditure-
Period
Actual
Capacity
management
produces
Capacity
Plans that
80 0-100

114
Actual * 100
over the last
period.
Expenditure)
/ Planned
Expenditure
* 100 over a
specified
period.
forecast
expenditure
against
business
plans, .This is
a measure of
accuracy of
those plan
Percentage
of over-
Capacity of
IT
Performance
level, Disc,
Memory,
CPU, Network
Bandwidth and
so forth, Can
all be
monitored
against an
appropriate
capacity
policy. Over
capacity can
be recorded
and summed
to provide this
metric.
20 This is how
much it costs
the business to
Own IT .it
includes all
financial costs
including
Wages,
depreciation,
equipment and
infrastructure.
Over time the
objective is for
this to
decrease.
This can be
measured by
auditing
performance
levels of key
CIS.
Capacity is
defined in
Management
plan.
Capacity
Management
is responsible
for providing
effective
capacity -Not
too much,
which is
expensive.
30 0-100
Percentage
of CIS
monitored
for
performance
If monitoring
is turned off,
for any reason,
this should
cause an event
that ought to
trigger this
metric.
70 Complaints
raised as
complaints by
the Service
Desk or tabled
at SLA
meeting must
be recorded to
be tracked.
A measure
of CIS that
have
performance
monitoring
turned on.
Capacity
Management
must
understand the
current
capacity level
and the trends
in these
levels..
60 0-100%
Percentage
overall
Business
Load of
expected
Business
Load
Expected
Business Load
is defined in
the Capacity
Management
Plan, As is the
measure of
Business Load
for this metric.
80 Questions
raised as
complaints by
the Service
Desk or tabled
at SLA
meeting must
be recorded to
be tracked.
A measure
of how much
the overall
Business
load on It is
relative to
that
anticipated
in the
Capacity
Management
Plan.
Capacity
Management
must
understand the
current
capacity level
and the trends
in these
levels.
85 0-5
Customer
Satisfaction
Customer
Satisfaction
4 Customer
Satisfaction
measured
according to
the process
Relationship
diagram.
This is
required to
ensure that
effective
process
outputs are
produced.
< 3 999999

115
8.10.1 Example of HAVERBLAD IT Management AB
Title Quantitative / Qualitative ITSM Process Process Owner
Resource Cost per
release.
quantitatively Capacity Management
Process
Capacity Manager
Percent of configuration
units as measured
quantitatively Capacity Management
Process
Capacity Manager
Number of unplanned
purchases.
quantitatively Capacity Management
Process
Capacity Manager
Percentage of IT services
for which there is defined
capacity requirements.
quantitatively Capacity Management
Process
Capacity Manager
Capacity Plan reliability quantitatively Capacity Management
Process
Capacity Manager
Response times quantitatively Capacity Management
Process
Capacity Manager
The percentage of
capacity used
quantitatively Capacity Management
Process
Capacity Manager
8.11 IT Service Continuity Management
ITSM process owner: Continuity Manager
Goal: To support the overall Business continuity management process, by ensuring that the
required IT technical and Services facilities can be recovered within required, and agreed
business timescales.
Metric objective: To support the overall Business continuity management process, by ensuring
that the required IT technical and Services facilities can be recovered within required, and agreed
business timescales.
Sources: ITSMF international- Metrics for IT Service Management . Security standardization in
incident management: the ITIL approach
Audience: Process Owner, IT Management, SLA Process Owner, Business Customer, Team
Member, SIP Process Owner

116
Metrics
Title
Descriptions Target
Value
Specification Justification Warning
Level
Possible
Values
Number of Service
not covered by IT
Service Continuity
(ITSC) plan
Every Service
and SLA will
have links to the
ITSC-even if
they are to say
that the
particular
service will not
be covered in
the event of an
emergency.
5 If any service
is not part of
the ITSC plan
it is under risk.
This metric
ensures that
any services at
risk are
monitored and
dealt with.
10 999999
Delay in ITSC
Plan
completion/Update
This measured
of Business
Risk. The plan
completion and
update dates
must be under
document
control and that
is where they
are measured.
1 Measured in
days, this is the
time delay from
the date the
plan or update
was due (if it
was this month)
and the date
delivered.
IF the plan is
incomplete
then there is a
risk that
recovery will
not be
complete
either. This
measure makes
sure that the
plans are not
incomplete for
too long.
5 999999
Delay IN ITSC
test date
This is
measured from
the ITSC plan
that is under
document
control.
5 Measured in
days , this is the
time delay from
the date the test
was due
There are
many possible
reasons for
these delays.
Most
commonly
individuals
taking part in
the test are
required
elsewhere in
the business
This delay
taking part in
the test are
required
elsewhere in
the business.
10 999999
Number of Issues
raised by last test
still to be
addressed
The Plan, Issues
and actions are
all under
document
control, so it is
there that they
are measured.
5 Each test of the
ITSC plan will
give rise to
some issues
that must be
addressed to
reduce risk.
The number of
The plan is not
working as
long as there
are
unaddressed
issues so, for
business risk to
be kept low,
10 999999
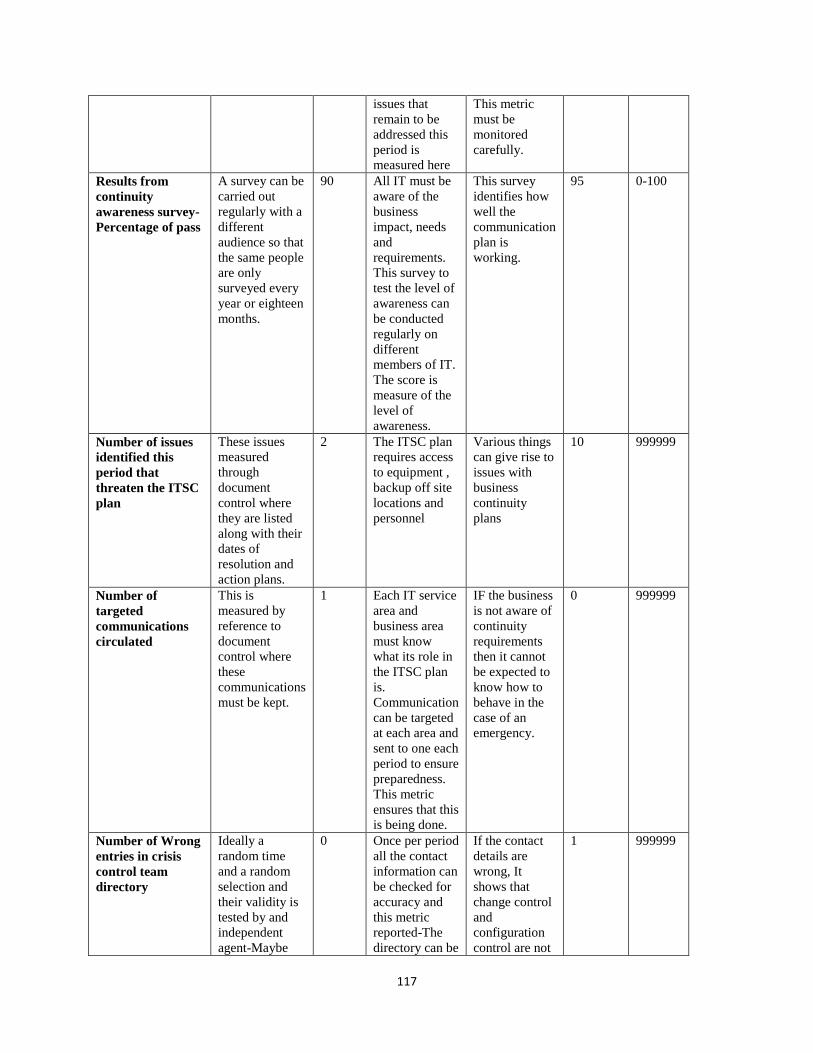
117
issues that
remain to be
addressed this
period is
measured here
This metric
must be
monitored
carefully.
Results from
continuity
awareness survey-
Percentage of pass
A survey can be
carried out
regularly with a
different
audience so that
the same people
are only
surveyed every
year or eighteen
months.
90 All IT must be
aware of the
business
impact, needs
and
requirements.
This survey to
test the level of
awareness can
be conducted
regularly on
different
members of IT.
The score is
measure of the
level of
awareness.
This survey
identifies how
well the
communication
plan is
working.
95 0-100
Number of issues
identified this
period that
threaten the ITSC
plan
These issues
measured
through
document
control where
they are listed
along with their
dates of
resolution and
action plans.
2 The ITSC plan
requires access
to equipment ,
backup off site
locations and
personnel
Various things
can give rise to
issues with
business
continuity
plans
10 999999
Number of
targeted
communications
circulated
This is
measured by
reference to
document
control where
these
communications
must be kept.
1 Each IT service
area and
business area
must know
what its role in
the ITSC plan
is.
Communication
can be targeted
at each area and
sent to one each
period to ensure
preparedness.
This metric
ensures that this
is being done.
IF the business
is not aware of
continuity
requirements
then it cannot
be expected to
know how to
behave in the
case of an
emergency.
0 999999
Number of Wrong
entries in crisis
control team
directory
Ideally a
random time
and a random
selection and
their validity is
tested by and
independent
agent-Maybe
0 Once per period
all the contact
information can
be checked for
accuracy and
this metric
reported-The
directory can be
If the contact
details are
wrong, It
shows that
change control
and
configuration
control are not
1 999999
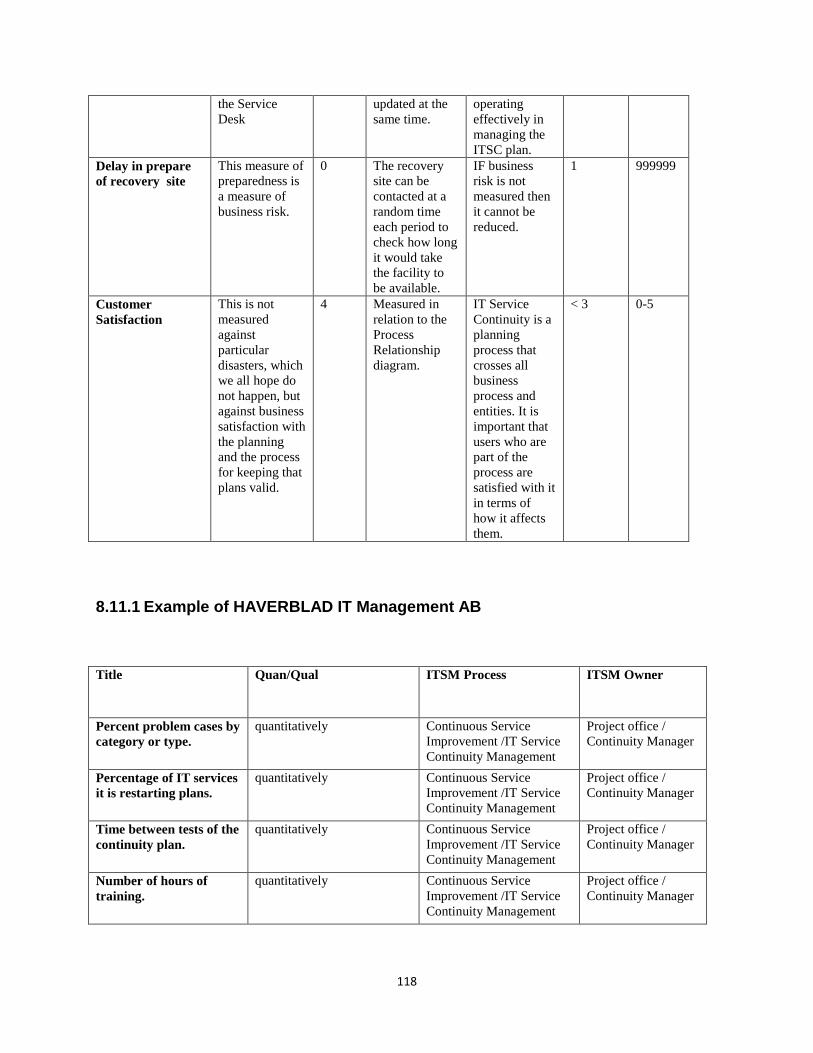
118
the Service
Desk
updated at the
same time.
operating
effectively in
managing the
ITSC plan.
Delay in prepare
of recovery site
This measure of
preparedness is
a measure of
business risk.
0 The recovery
site can be
contacted at a
random time
each period to
check how long
it would take
the facility to
be available.
IF business
risk is not
measured then
it cannot be
reduced.
1 999999
Customer
Satisfaction
This is not
measured
against
particular
disasters, which
we all hope do
not happen, but
against business
satisfaction with
the planning
and the process
for keeping that
plans valid.
4 Measured in
relation to the
Process
Relationship
diagram.
IT Service
Continuity is a
planning
process that
crosses all
business
process and
entities. It is
important that
users who are
part of the
process are
satisfied with it
in terms of
how it affects
them.
< 3 0-5
8.11.1 Example of HAVERBLAD IT Management AB
Title Quan/Qual ITSM Process ITSM Owner
Percent problem cases by
category or type.
quantitatively Continuous Service
Improvement /IT Service
Continuity Management
Project office /
Continuity Manager
Percentage of IT services
it is restarting plans.
quantitatively Continuous Service
Improvement /IT Service
Continuity Management
Project office /
Continuity Manager
Time between tests of the
continuity plan.
quantitatively Continuous Service
Improvement /IT Service
Continuity Management
Project office /
Continuity Manager
Number of hours of
training.
quantitatively Continuous Service
Improvement /IT Service
Continuity Management
Project office /
Continuity Manager
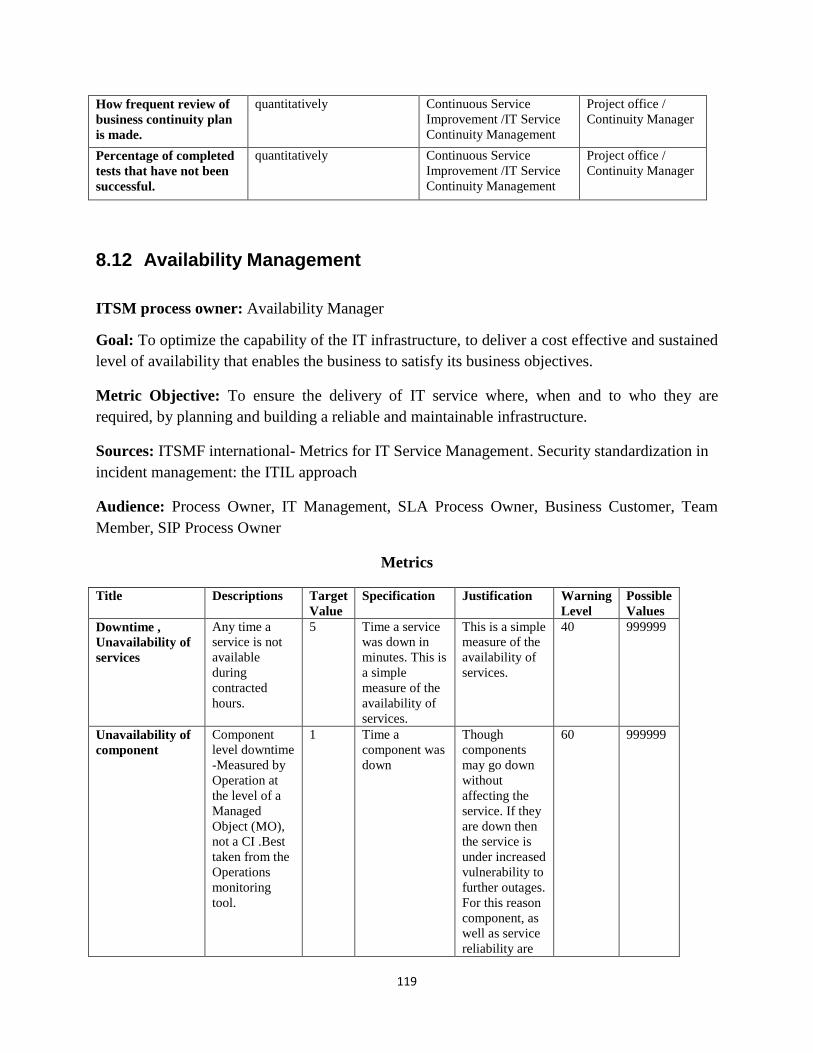
119
How frequent review of
business continuity plan
is made.
quantitatively Continuous Service
Improvement /IT Service
Continuity Management
Project office /
Continuity Manager
Percentage of completed
tests that have not been
successful.
quantitatively Continuous Service
Improvement /IT Service
Continuity Management
Project office /
Continuity Manager
8.12 Availability Management
ITSM process owner: Availability Manager
Goal: To optimize the capability of the IT infrastructure, to deliver a cost effective and sustained
level of availability that enables the business to satisfy its business objectives.
Metric Objective: To ensure the delivery of IT service where, when and to who they are
required, by planning and building a reliable and maintainable infrastructure.
Sources: ITSMF international- Metrics for IT Service Management . Security standardization in
incident management: the ITIL approach
Audience: Process Owner, IT Management, SLA Process Owner, Business Customer, Team
Member, SIP Process Owner
Metrics
Title Descriptions Target
Value
Specification Justification Warning
Level
Possible
Values
Downtime ,
Unavailability of
services
Any time a
service is not
available
during
contracted
hours.
5 Time a service
was down in
minutes. This is
a simple
measure of the
availability of
services.
This is a simple
measure of the
availability of
services.
40 999999
Unavailability of
component
Component
level downtime
-Measured by
Operation at
the level of a
Managed
Object (MO),
not a CI .Best
taken from the
Operations
monitoring
tool.
1 Time a
component was
down
Though
components
may go down
without
affecting the
service. If they
are down then
the service is
under increased
vulnerability to
further outages.
For this reason
component, as
well as service
reliability are
60 999999
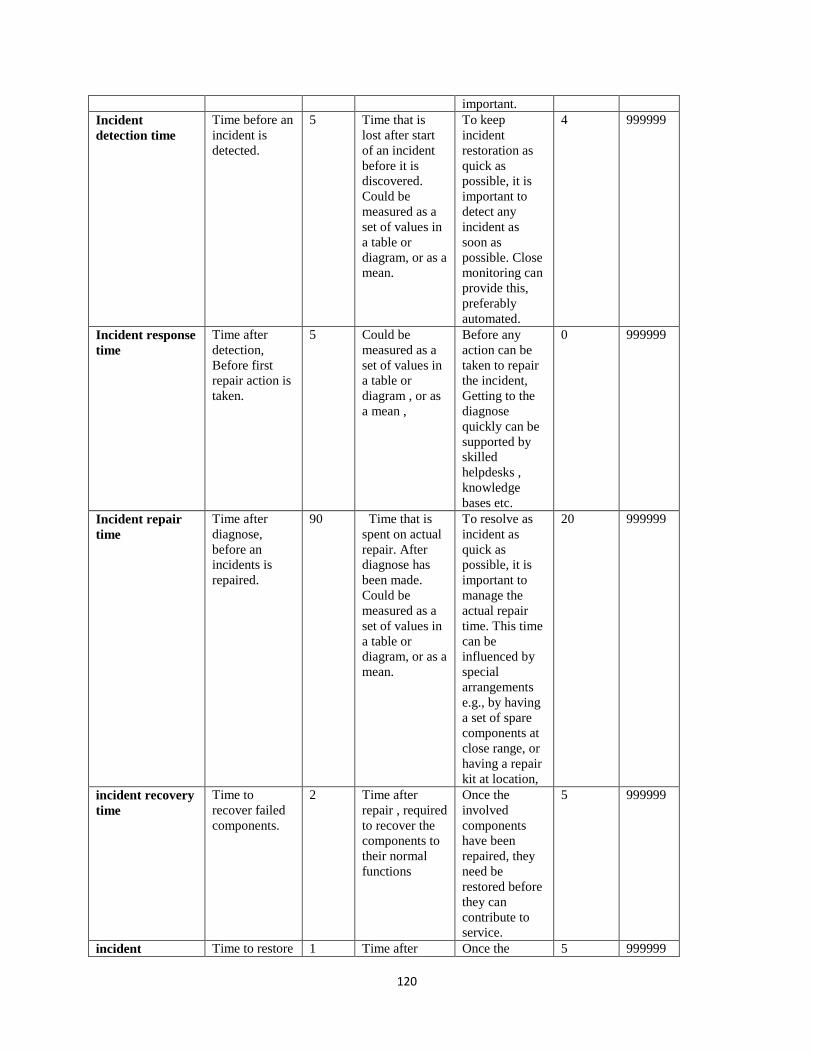
120
important.
Incident
detection time
Time before an
incident is
detected.
5 Time that is
lost after start
of an incident
before it is
discovered.
Could be
measured as a
set of values in
a table or
diagram, or as a
mean.
To keep
incident
restoration as
quick as
possible, it is
important to
detect any
incident as
soon as
possible. Close
monitoring can
provide this,
preferably
automated.
4 999999
Incident response
time
Time after
detection,
Before first
repair action is
taken.
5 Could be
measured as a
set of values in
a table or
diagram , or as
a mean ,
Before any
action can be
taken to repair
the incident,
Getting to the
diagnose
quickly can be
supported by
skilled
helpdesks ,
knowledge
bases etc.
0 999999
Incident repair
time
Time after
diagnose,
before an
incidents is
repaired.
90 Time that is
spent on actual
repair. After
diagnose has
been made.
Could be
measured as a
set of values in
a table or
diagram, or as a
mean.
To resolve as
incident as
quick as
possible, it is
important to
manage the
actual repair
time. This time
can be
influenced by
special
arrangements
e.g., by having
a set of spare
components at
close range, or
having a repair
kit at location,
20 999999
incident recovery
time
Time to
recover failed
components.
2 Time after
repair , required
to recover the
components to
their normal
functions
Once the
involved
components
have been
repaired, they
need be
restored before
they can
contribute to
service.
5 999999
incident Time to restore 1 Time after Once the 5 999999

121
restoration time the service to
the agreed
level.
component
recovery,
required to
restore the
services to the
agreed level.
involved
components
have been
repaired, the
service needs
to be made
available to the
users. This can
depend upon
conditions to
be created, data
to be reset etc.
incident
resolution time
Time till
recovery after
detection of an
incident
0 The sum of
incident
response time,
incident repair
time , Incident
recovery time
and incident
restoration
time,
In a case a
detailed
management of
response/repair
/ recovery /
restoration is
not available;
This sum could
be used to
manage the
time between
detection and
recovery.
40 999999
MTBSI (Mean
Time Between
System Incidents)
Average time
between the
start of
subsequent
incidents,
Indicating the
level of
stability of
service.
0 This is the
mean time
between the
start of
subsequent
incidents as
measured by
the Service
Desk and
incident
Management,
Measured in
minutes, hours
or days.
This figure is
of great
importance to a
good
understanding
of the overall
availability
value. An
availability of
99.99%
measured over
a period of one
year could
come down to
1 outage of
almost 1 hour
as well as 365
outages of
almost seconds.
150 999999
MTTR (Mean
time to Repair
"downtime",
Mean time to
Restore )
MTTR is a
standard
measure of
availability,
Measuring the
average
elapsed time
from the
occurrence of
an incident to
resolution of
the incident
4 This is the
average time to
restore a
service to
operational
status, or
average
downtime per
service
disruption ,
measuring this
by service , not
component ,
enables the
focus to be at
the right level
for the
business,
40 999999
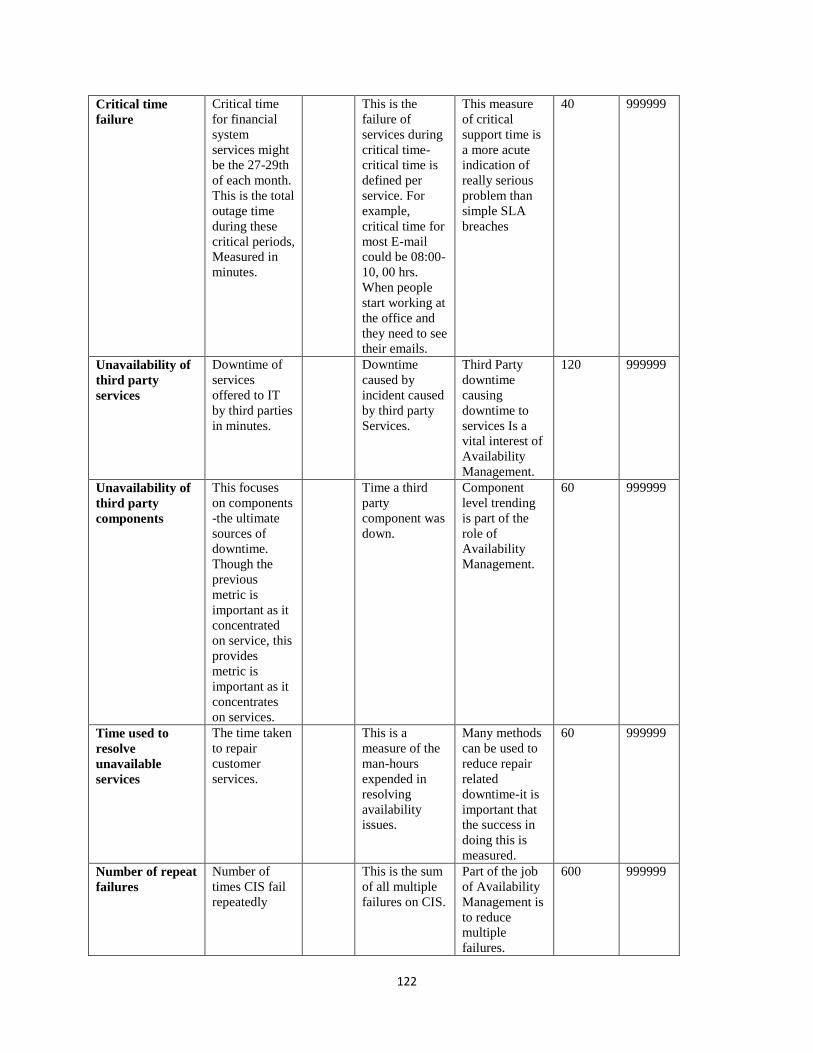
122
Critical time
failure
Critical time
for financial
system
services might
be the 27-29th
of each month.
This is the total
outage time
during these
critical periods,
Measured in
minutes.
This is the
failure of
services during
critical time-
critical time is
defined per
service. For
example,
critical time for
most E-mail
could be 08:00-
10, 00 hrs.
When people
start working at
the office and
they need to see
their emails.
This measure
of critical
support time is
a more acute
indication of
really serious
problem than
simple SLA
breaches
40 999999
Unavailability of
third party
services
Downtime of
services
offered to IT
by third parties
in minutes.
Downtime
caused by
incident caused
by third party
Services.
Third Party
downtime
causing
downtime to
services Is a
vital interest of
Availability
Management.
120 999999
Unavailability of
third party
components
This focuses
on components
-the ultimate
sources of
downtime.
Though the
previous
metric is
important as it
concentrated
on service, this
provides
metric is
important as it
concentrates
on services.
Time a third
party
component was
down.
Component
level trending
is part of the
role of
Availability
Management.
60 999999
Time used to
resolve
unavailable
services
The time taken
to repair
customer
services.
This is a
measure of the
man-hours
expended in
resolving
availability
issues.
Many methods
can be used to
reduce repair
related
downtime-it is
important that
the success in
doing this is
measured.
60 999999
Number of repeat
failures
Number of
times CIS fail
repeatedly
This is the sum
of all multiple
failures on CIS.
Part of the job
of Availability
Management is
to reduce
multiple
failures.
600 999999

123
8.13 Security Management
ITSM process owner: IT security Manager
Goal: To meet the external and internal security requirements.
Metric objective: To manage and control the security management process to meet external
security requirements as found in SLAs, contracts, legislation and the company security policy.
And to meet internal security requirements to assure the continuity of IT service provision.
Sources: ITSMF international- Metrics for IT Service Management . Security standardization in
incident management: the ITIL approach
Audience: Process Owner, IT Management, SLA Process Owner, Business Customer, Team
Member, SIP Process Owner
Metrics
Title Descriptions Target
Value
Specification Justification Warning
Level
Possible
Values
Number of
security related
incidents
This is based
on the
closing
disposition
of incident
and call
records.
50 Benchmark this
over time; this
will depend on
the level of
control as well
as other factors
such as software
quality.
It is vital that
Security
Management
Processes are
aware of the
relevant
incidents.
100 999999
Number of
security related
problems closed
This is a
measure of
problem
closed with a
closing
disposition
linked to it
security.
10 This is a
measure of
problem
management
process
efficiency.
Resolution of
security related
problems will
result in reduced
numbers of
incidents and
improve
availability.
5 999999
Number of Audit
+ internal Review
issues resolved
The issue list
should have
resolution
dates-Those
could be
used to
trigger
alarms if
exceeded.
8 Internal Reviews
and Audits
ought to show
up minor issues
to be resolved.
Security is a
long-term
process of
improving
things.
5 999999
Percentage of
Reviews + Audits
conducted on
time
A measure of
reviews and
Audits
against
100 Internal Audits
or reviews
slipping can be a
sign of over -
We rely upon
internal reviews
Audits to
highlight short
95 0-100

124
planned
dates.
work, a lack of
resources or
matters that are
more serious
comings in this
process. It is
vital that they
are carried.
Number of risks
identified
A process
must be in a
place to log
risks that are
identifies-
and qualify
them with
action to be
taken .This
log is
measured for
this metric.
10 Risks and threats
cannot be
invented where
none exist!
However in any
complex
environment,
new risks, albeit
small ones, can
be uncovered
every week, or
at least every
months.
Security
Management
must be actively
engaged to find
new risks, or
threats.
5 999999
Percentage of
SLAs with
explicit security
specifications,
SLAs are
kept in the
CMDB. Each
SLA has a
security
clause..
100 If SLAs are
static, this might
not be a useful
metric. It is
important that
security
concerns are
considered when
all SLAs are set.
This metric
ensures that no
risks creep in as
new SLAs are
set up or old
ones re-
negotiated.
Whether a
service is new or
of long standing
, its business
requirements can
be a pointer to
possible security
issues and these
must be
highlighted ,
along
70 0-100%
Percentage of
UCS
(Underpinning
Contracts) With
explicit Security
specifications,
As with
SLAs, the
UCS ought
to be in the
CMDB and
their security
clause can be
compared to
ensure that it
is not just
boilerplate.
100 As with the
above, all
underpinning
contracts ought,
eventually, to
comply with
company
security policy.
Underpinning
Contracts must
be considered
actively to
prevent security
issues arising.
This can be
measured by this
metric.
75 0-100%
Number of
release security
issues identified
All release
plans must
have a non-
boilerplate
entry for
security
issues
0 Release
Management is a
highly
vulnerable entry
point for
security threats.
An active
control of
release by
Security
Management
will keep this
Releases provide
a high risk to
security
procedures. This
ensures that
there is an active
external
examination of
the level of risk
appropriate in
each release
planning
5 999999

125
metric properly
low.
document,
Number of
changes backed
out as a result of
security issues
This is
measured by
the closing
disposition
of changes -
if they
indicate
security as
reason for
back-out of
change then
they count
toward this
metric.
0 If changes
introduce
security issues
then they are not
being properly
planned, A
change turning
up here ought to
be fully
investigated to
ensure that it is
not a result of
deliberate attack.
Changes,
including
releases, must be
planned and
tested properly.
If blackouts
occur as a result
of security
issues then there
is a failure of
control.
5 999999
Security patch
releases speed
All sorts of
security
patches and
updates are
released
frequently.
2 days The time
necessary for
implementation
of this security
patches means
vulnerability to a
risk.
The time
necessary for
implementation
of this security
patches means
vulnerability to a
risk.
1 week Theoretically
Unlimited.
8.14 Business Perspective Metrics
ITSM process owner: IT Manager
Purpose: Is Quality of Experience (QoE), a measure of business satisfaction aligned to business
structures.
Metric objectives:
Appropriate alignment of business and IT
To deliver effective IT/Business alignment.
Review plans and make effective changes in line with business requirements.
Sources: ITSMF international- Metrics for IT Service Management , Security standardization in
incident management: the ITIL approach
Audience: Process Owner, IT Management, SLA Process Owner, Business Customer, Team
Member, SIP Process Owner

126
Metrics
Title Description
s
ITSM
PROCESS
Targe
t
Value
Specification Justificatio
n
Warnin
g Level
Possibl
e
Values
Delivery Cost
per service
From the
CMDB -how
much each
service
costs,
Service Calls
*appropriate
cost +
Problem
Management
+ fixed costs
etc.
Business
Perspective
Metrics
20 This depends
on Financial
Management
being in
place;
otherwise
some proxy
for cost will
be required
here. The
calculation is
simple
This is a
difficult
measure
(Not
SMART)!
That does
not mean
that it is not
a good goal
of Financial
Managemen
t to attempt
to measure
this as
accurately
as possible -
to enable the
business
Perspective
to give a
good picture
30 0-100
Customer
Satisfaction
The overall
sum of all
customer
Satisfaction
measures.
Business
Perspective
Metrics
4 Customer
Satisfaction
with IT
Service
Management.
The
Business
Perspective
is
Ultimately
responsible
for
delivering
effective
business / IT
alignment.
< 3 0-5
Business
knowledge of
IT
The level of
satisfaction
in the
business
with the
level of IT
business
knowledge.
Business
Perspective
Metrics
4 Customer
Satisfaction
surveys to
include a
question of
how satisfied
the responder
is with the
level of
knowledge of
the business
shown by IT
All
members of
IT need to
have some
knowledge
and
awareness
of the
Business
that they are
providing
services to,
This metric
< 3 0-5
Number of
Service
complaints
The total
number of
complaints
about the
service
Business
Perspective
Metrics
N.1 Business
Relationship
10 This gives an
indication of
the customer
satisfaction ,
and of the
20 999999

127
reaching the
organization
Management quality of the
organizations
relationships
Number of
outstanding
action against
last Service
Review
The number
of actions,
coming out
of the last
Service
Review, that
hasn’t been
taken care of
yet.
Business
Perspective
Metrics
N.1 Business
Relationship
Management
10 this indicates
how effective
an
organization
handles its
reviewing
process and
completes its
action items
Effective
processing
of action
items will
increase
customer
satisfaction
and improve
business
relationships
.
15 999999
Maximum
incidents per
Supplier
Every
incident will
be traced
back to gives
supplier.
Business
Perspective
Metrics
N.1 Business
Relationship
Management
50 This is the
number of
incidents
found to be
caused, or
partially
caused by the
supplier with
the most
incidents.
For good
supplier
management
,
70 999999
Percentage of
contract
suppliers
conforming to
standards
What part of
your contract
supplier
conforms to
your
standards
Business
Perspective
Metrics
N.2 Supplier
Relationship
Management
85 These are
standards that
are
appropriate
(ISO9000 Or
ISO20000).
The chance
of an
incident or
problem will
decrease
when all
parts of a
system
follow the
same ways
of working.
85 0-100
Percentage of
Supplier
reviews
completed on
time
The
percentage
of regularly
scheduled
reviews of
suppliers
that are
completed
on time,
Business
Perspective
Metrics
N.2 Supplier
Relationship
Management
2 Review
schedules that
show reviews
due in the
past that have
no
completion
summary or
action point.
Supplier
reviews can
seem
unimportant
when things
are going
well.
5 0-100
Number of
outstanding
issue with
suppliers
Issues are
raised either
when they
are
discovered
through
incident or
problem
management
or during
supplier
reviews.
Business
Perspective
Metrics
N.2 Supplier
Relationship
Management
10 The count of
the number of
issues in the
issue log.
It is
important
that
suppliers
respond to
issues raised
in a timely
manner.
20 0-100

128
These are
tracked by
this metric.
Minimum
Customer
Satisfaction
Score
The worst
performing
process.
Business
Perspective
Metrics
N.3. Providing
IT services
4 This is the
minimum
score found in
all process
metrics
measured.
Provision
should be
working
< 3 0-5
Number of
Incident
Ultimately
this process
should
reduce the
number of
incidents
over time,
Business
Perspective
Metrics
N.3. Providing
IT services
100 the total
number of
incident is a
measure of
the level of
service
disruption
found by the
organization,
Incidents are
the ultimate
measure of
service
disruption.
150 999999
9
Customer
Satisfaction
This is a
measure of
delivery at
the Business
level.
Business
Perspective
Metrics
N.3. Providing
IT services
4 Overall
Customer
Satisfaction,
as with
Service Level
Management.
Effective
service
delivery is
measured by
Customer
Satisfaction.
< 3 0-5
Number of
issues
identified in
final plan
Review
Simple issue
count.
Business
Perspective
Metrics
N.4 Planning ,
Review and
Development
6 The number
of issues
shown in the
review.
This gives a
measure of
how much
change is
required to
the
document-
overtime.
8 999999
Number of
Plans signed
off for
implementatio
n
This is a
count of
activity, But
also of
authorization
. Through
this does not
measure the
complexity
of the plans,
It is a
measure of
the number.
Business
Perspective
Metrics
N.4 Planning ,
Review and
Development
4 Since
documentatio
n will be kept
in the CMDB,
the status can
be measured
directly. Plans
that move to
the signed off
status will be
counted.
Plans must
not only be
produced,
but also
authorized.
2 999999
Number of late
actions in
Communicatio
n Plan
All actions
in the Communication Plan should
have a target
date. This
measures the
Number of
actions that
are over
date.
Business
Perspective
Metrics
N.5 Liaison,
Education And
Communication
s Plan
3 Actions not
completed by
date of metric
measure.
Actions
identified
need to be
followed -up
This shows
how
effectively
this is being
done.
5 999999

129
Percentage of
IT staff not at
optimal
training level
for their
position
Either from
HR ,or from
an IT
training and
competence
DB, The
level of
appropriate
education
and
experience
in the
organization,
Business
Perspective
Metrics
N.5 Liaison,
Education And
Communication
s Plan
1 A measure of
staff
competencies.
ISO20000
Requires
that staff can
be shown to
have
appropriate
training and
experience
for their
positions,
2 0-100
8.15 Continuous Service Improvement Programs (SIP)
ITSM process owner: Project office
Goal: Communication with IT Management to ensure that all process is subject to specific SIP
attention at least every two years.
Metric objective: To improve current process operation in line with business requirements.
Sources ITSMF international- Metrics for IT Service Management , Security standardization in
incident management: the ITIL approach
Audience: Process Owner, IT Management, SLA Process Owner, Business Customer, Team
Member, SIP Process Owner
Metrics
Title Descriptions Target
Value
Specification Justification Warning
Level
Possible
Values
Overall Customer
Satisfaction
The mean of all
Customer
satisfaction
measures
4 This is the
overall
satisfaction of
end-customers.
Ultimately the
SIP should be
delivering
improved
Customer
Satisfaction to
end customers as
well as reduction
in cost.
Overtime the
SIP should drive
up Customer
Satisfaction,
< 3 0-5
Percentage of
Cost saving in
How much the
SIP has reduced
10 Usually each
process is, in
The SIP
improvement
5 0-100

130
last process SIP overall IT costs? turn, given the
full attention of
the SIP. Once
this is complete a
measurable cost
saving ought to
be the result.
must have
tangible results
and cost saving
will be
measureable and
tangible,
Percentage of
Process overdue
for SIP
If any process is
overdue for SIP
attention
10 If ten core ITIL
processes go
through the SIP
process every ten
months.
Though the SIP
concentrates
firstly on
processes that
are shown , by
their metrics , to
be in need of
improvement ,
all processes
must be
examined
periodically ,
20 0-100
Number of
Outstanding
approved actions
that have not
achieved their
objective
Action not
successful.
3 All actions that
come out of the
SIP are
documented and
their intended
improvement
target agreed.
Actions
recommended
by the SIP must
be SMART. The
means that we
can monitor the
effects.
5 999999
Number of
outstanding
actions in SIP
Communications
Plan
This establishes
that there is a
communications
plan for the SIP
and that the
actions it take
place on time
5 Improvements
made by the SIP
must be
measured,
Reported and
communicated.
The SIP
Communication
Plan actions are
important to the
success of the
plan-hence this
metric to
monitor them,
10 999999
Numbers of
approved
revisions to
service
Management
policies , Plans
and Procedures
Change to the SIP 5 It is not
necessary that
there are lots of
changes and only
changes that are
actually
approved are
relevant.
This makes the
changes from
the SIP visible -
particularly
those to policies
and procedures.
It is important
that these are
understood to be
part of the
Scope of the
SIP.
2 999999
Number of
Improvements
carried out by
process owner-
outside SIP cycle
Improvements
made by process
owners
5 The SIP is the
on-going engine
of Service
Improvement.
However each
process owner
has a
responsibility to
try to improve
his process.
Process owners
have a
responsibility to
take action to
improve their
processes as
well.
S 999999
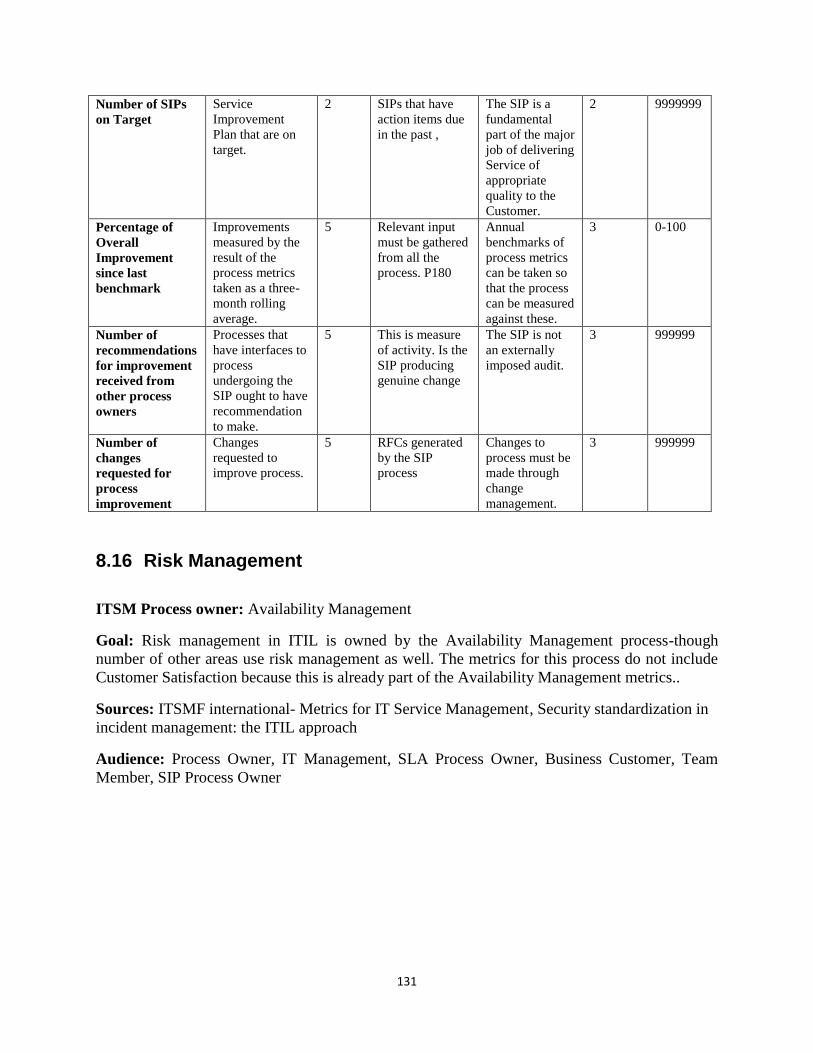
131
Number of SIPs
on Target
Service
Improvement
Plan that are on
target.
2 SIPs that have
action items due
in the past ,
The SIP is a
fundamental
part of the major
job of delivering
Service of
appropriate
quality to the
Customer.
2 9999999
Percentage of
Overall
Improvement
since last
benchmark
Improvements
measured by the
result of the
process metrics
taken as a three-
month rolling
average.
5 Relevant input
must be gathered
from all the
process. P180
Annual
benchmarks of
process metrics
can be taken so
that the process
can be measured
against these.
3 0-100
Number of
recommendations
for improvement
received from
other process
owners
Processes that
have interfaces to
process
undergoing the
SIP ought to have
recommendation
to make.
5 This is measure
of activity. Is the
SIP producing
genuine change
The SIP is not
an externally
imposed audit.
3 999999
Number of
changes
requested for
process
improvement
Changes
requested to
improve process.
5 RFCs generated
by the SIP
process
Changes to
process must be
made through
change
management.
3 999999
8.16 Risk Management
ITSM Process owner: Availability Management
Goal: Risk management in ITIL is owned by the Availability Management process-though
number of other areas use risk management as well. The metrics for this process do not include
Customer Satisfaction because this is already part of the Availability Management metrics..
Sources: ITSMF international- Metrics for IT Service Management , Security standardization in
incident management: the ITIL approach
Audience: Process Owner, IT Management, SLA Process Owner, Business Customer, Team
Member, SIP Process Owner
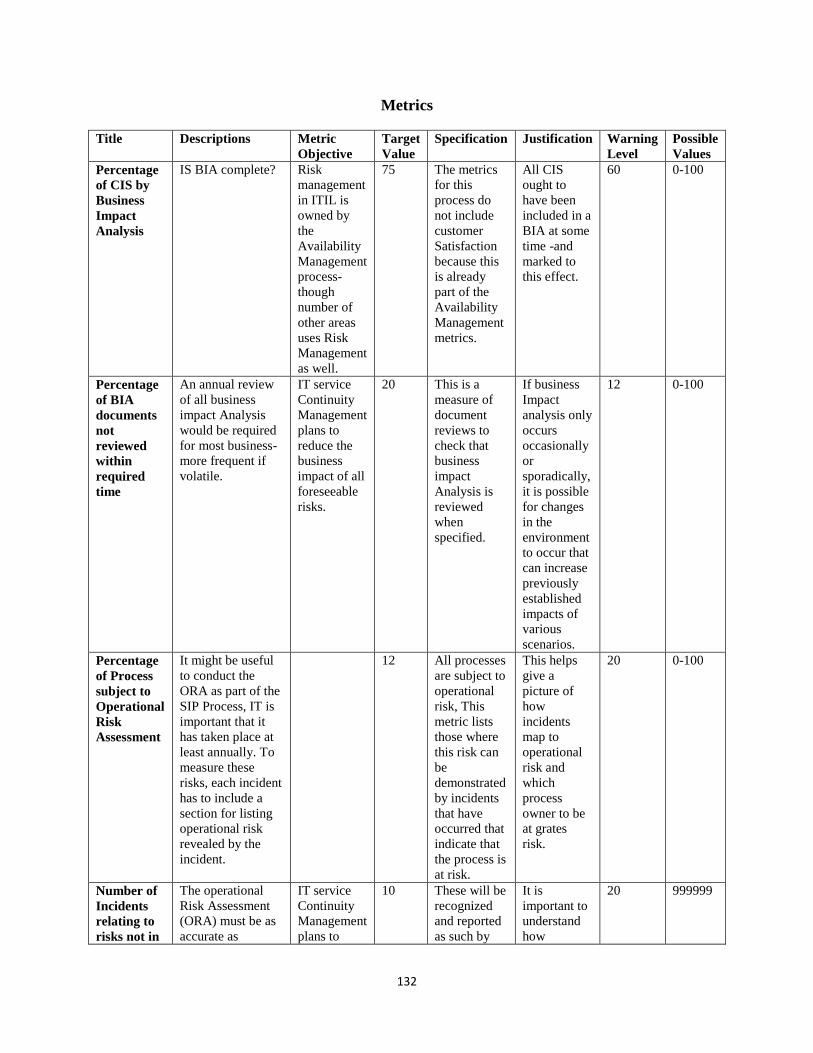
132
Metrics
Title Descriptions Metric
Objective
Target
Value
Specification Justification Warning
Level
Possible
Values
Percentage
of CIS by
Business
Impact
Analysis
IS BIA complete? Risk
management
in ITIL is
owned by
the
Availability
Management
process-
though
number of
other areas
uses Risk
Management
as well.
75 The metrics
for this
process do
not include
customer
Satisfaction
because this
is already
part of the
Availability
Management
metrics.
All CIS
ought to
have been
included in a
BIA at some
time -and
marked to
this effect.
60 0-100
Percentage
of BIA
documents
not
reviewed
within
required
time
An annual review
of all business
impact Analysis
would be required
for most business-
more frequent if
volatile.
IT service
Continuity
Management
plans to
reduce the
business
impact of all
foreseeable
risks.
20 This is a
measure of
document
reviews to
check that
business
impact
Analysis is
reviewed
when
specified.
If business
Impact
analysis only
occurs
occasionally
or
sporadically,
it is possible
for changes
in the
environment
to occur that
can increase
previously
established
impacts of
various
scenarios.
12 0-100
Percentage
of Process
subject to
Operational
Risk
Assessment
It might be useful
to conduct the
ORA as part of the
SIP Process, IT is
important that it
has taken place at
least annually. To
measure these
risks, each incident
has to include a
section for listing
operational risk
revealed by the
incident.
12 All processes
are subject to
operational
risk, This
metric lists
those where
this risk can
be
demonstrated
by incidents
that have
occurred that
indicate that
the process is
at risk.
This helps
give a
picture of
how
incidents
map to
operational
risk and
which
process
owner to be
at grates
risk.
20 0-100
Number of
Incidents
relating to
risks not in
The operational
Risk Assessment
(ORA) must be as
accurate as
IT service
Continuity
Management
plans to
10 These will be
recognized
and reported
as such by
It is
important to
understand
how
20 999999

133
ORA possible. reduce the
business
impact of all
foreseeable
risks.
Problem
Management.
accurate the
ORA
actually is.
Percentage
of incidents
where
occurrence
is higher
than
predicted in
ORA
The ORA predicts
a probability of
High/Medium/Low
for the risk to CIS.
If this is shown to
be wrong
consistently then
the ORA must be
updated in line
with the actual
risk.
50 This metric
requires that
a quantitative
definition for
high (Say
>200 events /
months),
medium
(100-200)
and Low
(<100) is
defined.
This metric
ensures that
forecasts can
be made
more
accurate.
70 0-100
Percentage
of CIS
Where
downtime is
greater
than
predicted in
ORA
The forecast
business impact of
particular risk can
be compared to the
actual occurrence
of these risks so
that forecasts can
be improved. This
is only possible
and appropriate for
fairly common low
level risks.
Using the
linkage
mentioned
above, the
predicted
impact of an
outage to a
particular CI
on the
business can
be calculated
and
compared to
the actual
downtime
experienced
by the
business.
The
forecasting
of business
impact is
important in
deciding
what
resources
ought to be
provided to
reduce a
particular
risk.
0-100
Number of
actions to
reduce risk
The process of
documenting
actions takes in
response to
identified risks
must be under
document control
so that these
actions can
automatically be
identified.
IT service
Continuity
reduces the
impact of all
foreseeable
risks.
5 In reaction to
discrepancies
shown above,
action needs
to be taken to
reduce
particular
risks. This
measures
documented
actions,
New risks
are
identified
but actions
to minimize
the impact or
reduce them
must also be
taken.
3 999999
Number of
newly
identified
risks
New risks that are
documented under
document control.
IT Service
Continuity
minimizes
the likely
risk of all
foreseeable
risks
3 Risks change
over time,
particularly
business
risks. IT risk
assessment
must have an
up-to date
picture of
what the
New risks
are
identified
and then
their impact
to the
business is
analyses and
possible
counter -
2 999999
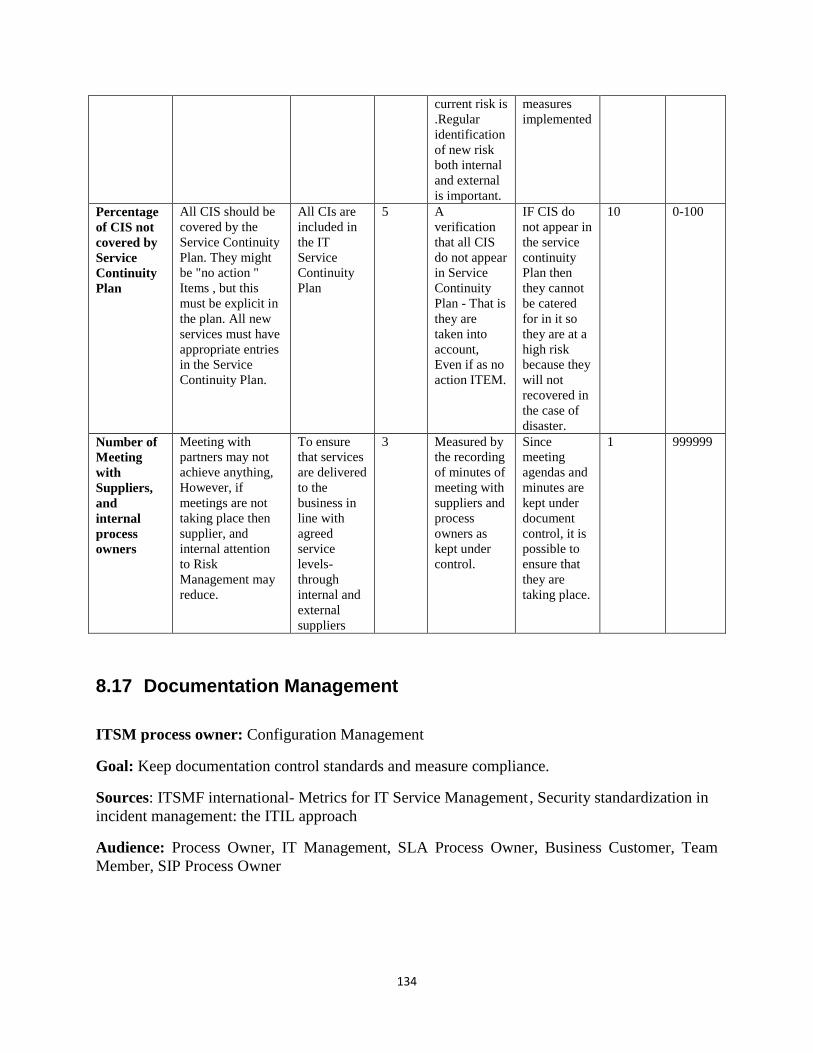
134
current risk is
.Regular
identification
of new risk
both internal
and external
is important.
measures
implemented
Percentage
of CIS not
covered by
Service
Continuity
Plan
All CIS should be
covered by the
Service Continuity
Plan. They might
be "no action "
Items , but this
must be explicit in
the plan. All new
services must have
appropriate entries
in the Service
Continuity Plan.
All CIs are
included in
the IT
Service
Continuity
Plan
5 A
verification
that all CIS
do not appear
in Service
Continuity
Plan - That is
they are
taken into
account,
Even if as no
action ITEM.
IF CIS do
not appear in
the service
continuity
Plan then
they cannot
be catered
for in it so
they are at a
high risk
because they
will not
recovered in
the case of
disaster.
10 0-100
Number of
Meeting
with
Suppliers,
and
internal
process
owners
Meeting with
partners may not
achieve anything,
However, if
meetings are not
taking place then
supplier, and
internal attention
to Risk
Management may
reduce.
To ensure
that services
are delivered
to the
business in
line with
agreed
service
levels-
through
internal and
external
suppliers
3 Measured by
the recording
of minutes of
meeting with
suppliers and
process
owners as
kept under
control.
Since
meeting
agendas and
minutes are
kept under
document
control, it is
possible to
ensure that
they are
taking place.
1 999999
8.17 Documentation Management
ITSM process owner: Configuration Management
Goal: Keep documentation control standards and measure compliance.
Sources: ITSMF international- Metrics for IT Service Management , Security standardization in
incident management: the ITIL approach
Audience: Process Owner, IT Management, SLA Process Owner, Business Customer, Team
Member, SIP Process Owner

135
Metrics
Title
Description
s
Metric
Objective
Targe
t
Value
Specification Justification Warnin
g Level
Possibl
e
Values
Percentage of
Documents late
for planned
revision
Documents
those are out
of date
because
planned
revisions
have not
taken place.
To have
documents
following
the
appropriate
document
management
policy.
3 Documents
with revision
date before
today.
If documents
are not
revised when
agreed then
plans based
on these
documents
will also be
out of date
and my cause
service
outages.
5 0-100
Percentage of
documents not
access for one
year
Documents
unused for a
long period
3 This is set to
one year as
general case,
but will be
time,
according to
document
management
policy during
which
documents
ought to be
reviewed.
All
documents
ought to be
reviewed and
either
changed,
marked as
adequate or
deleted in
light of
weather they
are still
current.
5 0-100
Percentage of
documents not
reviewed by for
one year
Have
documents
had their
annual
review?
10 Documents
that are not
used.
The exact
period will
depend on the
Document
Management
Policy, But
documents
that are not
used must be
reviewed for
deletion or
relevance.
15 0-100
Number of
outstanding
requests for
documents
changes
those
documents
with
unsatisfied
change
requests
10 Document
change
requests not
honoured.
Secure
Documents or
those with
restricted
access will
have requests
for change
lodged against
them -.
15 0-100
Number of
documents not
removed after
end of life
Documents
still existing
that ought to
have been
5 Documents on
the system
after their
delete -by -
Document
Policy,
10 999999

136
deleted. date
Number of
SLAs missing
documentation
SLAs should
comply with
requirement
s as defined
in the policy
2 SLAs lacking
proper
supporting
documentation
.
The SLA
documentatio
n
requirements
must be
carefully
defined to
ensure that
adequate
information is
include
5 999999
Number of
incomplete
Service
Management
policies and
plans
Plans that
are missing
sections or
signatures.
2 These
documents
must follow
standard
templates so
that missing
sections or
signatures can
be measured.
Where plans
have a
consistent
structure (like
SLAs) This
must be
adhered to.
5 999999
Number of
incompatibilitie
s between
specific plan
and the service
management
plan
Manual
cross
checking
will be
required of
specific
plans
according to
a roster if
centralized
scheduling
cannot
achieve this
5 Plans must be
consistent and
follow policy -
this check for
inconsistencies
.
Plans must be
consistent to
be effective.
10 999999
Number of
documentation
related
incidents
This is
based on the
closing
disposition
of incident
and call
records.
To have
secure
documents
that
supports
other
processes
where
appropriate.
20 incidents that
have a closing
code that
relates them to
documentation
errors
Documentation management
must work to
ensure that
incidents are
not caused by
errors or
misleading
documentatio
n
40 999999
Customer
Satisfaction
That
Document
Managemen
t processes
are delivered
effectively,
That
Document
Managemen
t processes
are
delivered
effectively,
4 Customer
satisfaction
metric as
described in
the process
Relationship
diagram.
This is a
subjective,
but genuine,
measure of
the quality of
the output of a
process.
<3 0-5

137
8.18 Competence, Awareness and Training (CAT)
ITSM process owner: Service Level Management
Goal: Ensure that target levels of training and competence are reached and maintained in the
organization to the level required by ISO20000.
Sources: ITSMF international- Metrics for IT Service Management, Security standardization in
incident management: the ITIL approach
Audiences: Process Owner, IT Management, SLA Process Owner, Business Customer, Team
Member, SIP Process Owner
Metrics
Title Descriptions Metric
Objective
Targe
t
Value
Specification Justification Warnin
g Level
Possibl
e
Values
Number of
late actions
from
Awareness
Campaign
Outstanding
actions
To have
suitably
qualified
staff in all
positions.
5 Actions dated
and not
completed
before the
measure of
this metric.
This checks
that the
awareness
campaign is
taking is taking
place
according to
plan.
10 999999
Number of
Job
descriptions
missing
specific
competence
requirement
Job
descriptions
held in HR or
on the CMDB
attached to
organizational
positions can
be linked to
skills
framework for
the
information
Age.
2 Required
competences
might be
derived from
The SFIA.
ISO20000
requires the
demonstration
of staff
competencies
for particular
positions.
5 999999
Percentage
of IT staff
with
professional
industry
recognition
This
information
can be found
in an
appropriate
skills matrix
that includes
training and
experience.
To have
suitably
qualified
staff
10 This is a
Project
Management,
Service
Management,
Computer
Science or
other
recognized
body -a
Member of
BCS, fellow
of the ISM or
Senior staff
experience can
be shown by
such
membership of
recognized
bodies.
5 0-100

138
similar.
Mean
Percentage
of shortfall
from
optimal level
of training
This
information is
to be supplied
by a skills
matrix.
5 For each
member of IT
, that ought to
have
completed N
training
courses, but
has in fact ,
completed M
training
courses , This
is N-M/N*100
with this
metric being
the mean.
This gives a
rough measure
of shortfall.
Suitable
training plans
can improve
this over time
as long as
attrition is not
too high.
10 0-100
Percentage
of staff with
a signed
Personal
Developmen
t Plan
Development
plans properly
approved
95 All Staff
should have
an Up-to-date
signed
personal
development
plan - these
should be kept
in the CMDB
so as to
measure this
metric.
Development
plans ensure
that staff keeps
abreast of latest
developments;
they keep
competence
levels high and
reduced
attrition.
90 999999
Percentage
of staff who
no defined
role or
responsibilit
y
Staffs who are
not linked to
defined roles
and
responsibilities
.
2 Roles and
responsibilitie
s defined at
the
organizational
level link to
staff that hold
them.
When people
join or change
function,
defining a
formal role,
with formal
responsibilities
according to
those defined
can seem like
minor
administrative
details.
3 999999
Percentage
of IT staff
not at
optimal
training
level for
their
position
If training
levels,
Training plans
and training
histories are
kept in the
CMDB then
this can be
determined
from those.
To have
suitably
trained staff
for all
positions.
95 To measure
this , the
optimal
training level
must be
defined for all
IT positions
and a training
plan for each
individual
kept that can
measure
whether the
training is
optimal or not
ISO2000
requires
suitably
qualified staff.
85 0-100
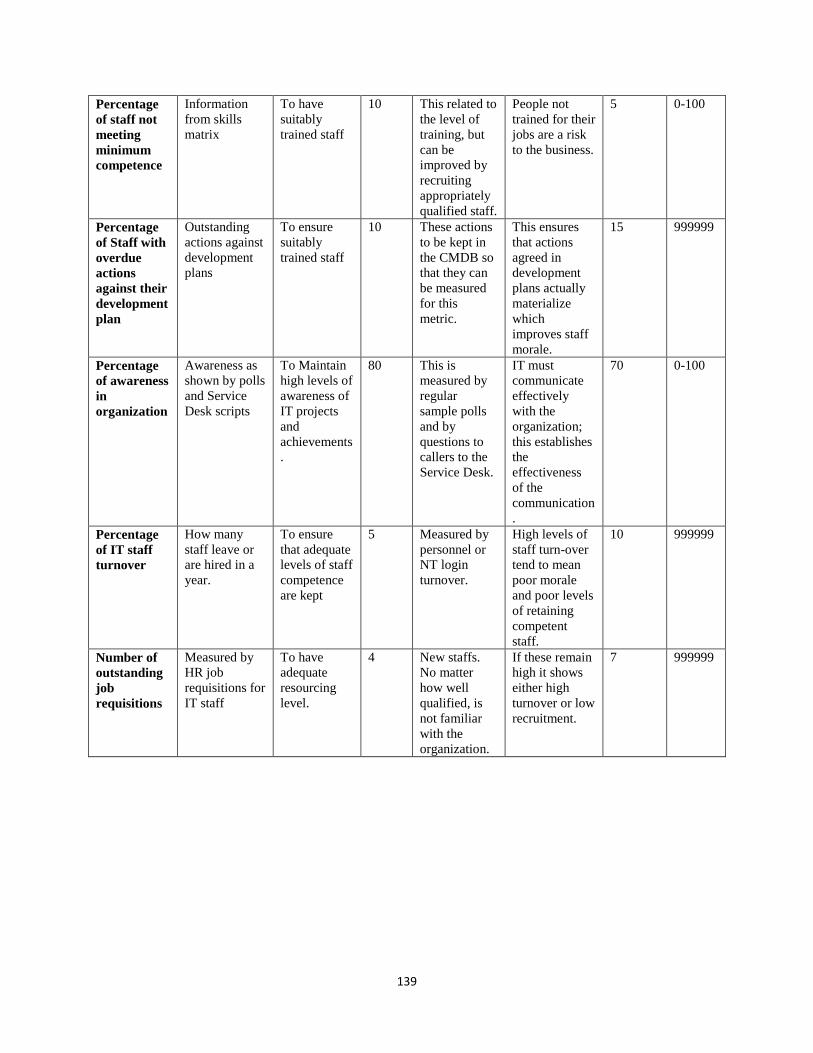
139
Percentage
of staff not
meeting
minimum
competence
Information
from skills
matrix
To have
suitably
trained staff
10 This related to
the level of
training, but
can be
improved by
recruiting
appropriately
qualified staff.
People not
trained for their
jobs are a risk
to the business.
5 0-100
Percentage
of Staff with
overdue
actions
against their
development
plan
Outstanding
actions against
development
plans
To ensure
suitably
trained staff
10 These actions
to be kept in
the CMDB so
that they can
be measured
for this
metric.
This ensures
that actions
agreed in
development
plans actually
materialize
which
improves staff
morale.
15 999999
Percentage
of awareness
in
organization
Awareness as
shown by polls
and Service
Desk scripts
To Maintain
high levels of
awareness of
IT projects
and
achievements
.
80 This is
measured by
regular
sample polls
and by
questions to
callers to the
Service Desk.
IT must
communicate
effectively
with the
organization;
this establishes
the
effectiveness
of the
communication
.
70 0-100
Percentage
of IT staff
turnover
How many
staff leave or
are hired in a
year.
To ensure
that adequate
levels of staff
competence
are kept
5 Measured by
personnel or
NT login
turnover.
High levels of
staff turn-over
tend to mean
poor morale
and poor levels
of retaining
competent
staff.
10 999999
Number of
outstanding
job
requisitions
Measured by
HR job
requisitions for
IT staff
To have
adequate
resourcing
level.
4 New staffs.
No matter
how well
qualified, is
not familiar
with the
organization.
If these remain
high it shows
either high
turnover or low
recruitment.
7 999999
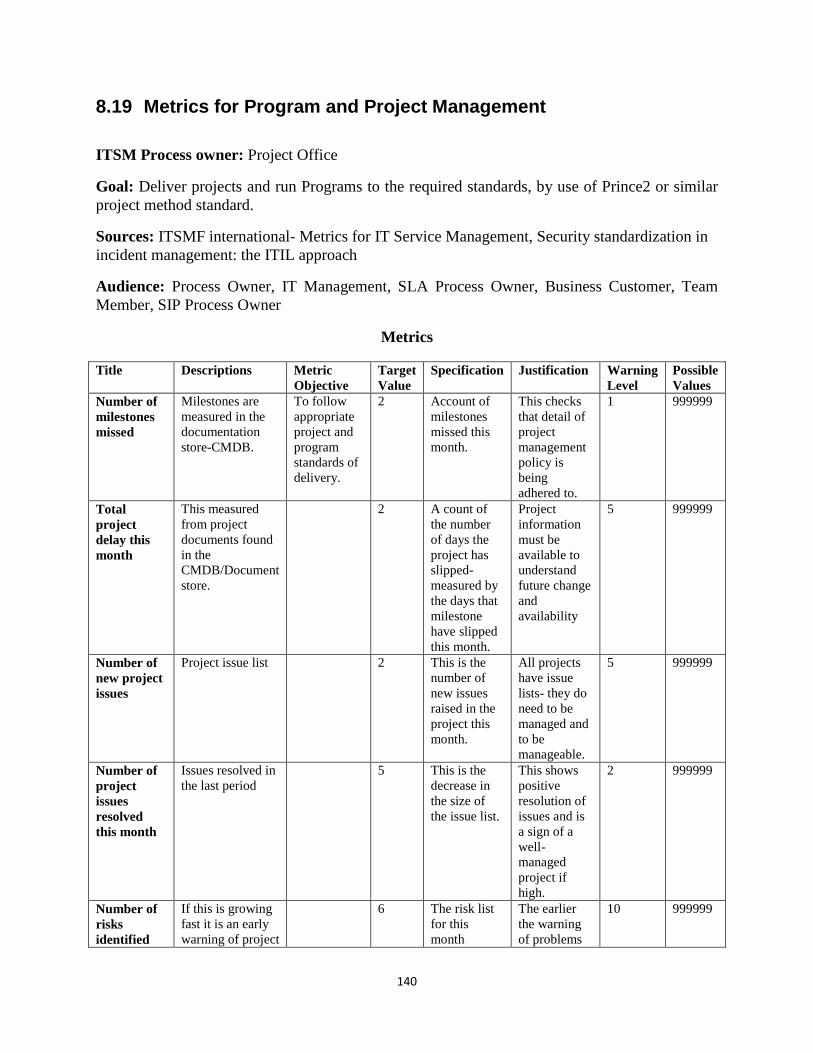
140
8.19 Metrics for Program and Project Management
ITSM Process owner: Project Office
Goal: Deliver projects and run Programs to the required standards, by use of Prince2 or similar
project method standard.
Sources: ITSMF international- Metrics for IT Service Management, Security standardization in
incident management: the ITIL approach
Audience: Process Owner, IT Management, SLA Process Owner, Business Customer, Team
Member, SIP Process Owner
Metrics
Title Descriptions Metric
Objective
Target
Value
Specification Justification Warning
Level
Possible
Values
Number of
milestones
missed
Milestones are
measured in the
documentation
store-CMDB.
To follow
appropriate
project and
program
standards of
delivery.
2 Account of
milestones
missed this
month.
This checks
that detail of
project
management
policy is
being
adhered to.
1 999999
Total
project
delay this
month
This measured
from project
documents found
in the
CMDB/Document
store.
2 A count of
the number
of days the
project has
slipped-
measured by
the days that
milestone
have slipped
this month.
Project
information
must be
available to
understand
future change
and
availability
5 999999
Number of
new project
issues
Project issue list 2 This is the
number of
new issues
raised in the
project this
month.
All projects
have issue
lists- they do
need to be
managed and
to be
manageable.
5 999999
Number of
project
issues
resolved
this month
Issues resolved in
the last period
5 This is the
decrease in
the size of
the issue list.
This shows
positive
resolution of
issues and is
a sign of a
well-
managed
project if
high.
2 999999
Number of
risks
identified
If this is growing
fast it is an early
warning of project
6 The risk list
for this
month
The earlier
the warning
of problems
10 999999

141
difficulties ahead the easier it is
to resolve
them in good
time,
Critical
path delay
A measure of
genuine delay to
projects.
2 The
cumulative
delay of any
sub-projects
on the
identified
critical path
in days.
Requires that
the critical
path is
properly
identified and
documented
and that
delays on it
can be
objectively
measured.
4 999999
Escalation How difficult is
the current
environment.
1 The number
of
issues/Risks
that have
been
escalated by
the Project
Manager
To get an
idea of the
risks faced by
current
projects
5 999999
Number of
project
meeting
slipped
Measured from
the document
store
2 The number
of project
meeting that
have slipped
by more than
1 day this
month,
This is
usually a
minor issue,
but repeated
slippage is a
sign that a
project is
under-
resourced or
under too
much
pressure.
4 999999
Estimated
percentage
of certainty
of meeting
project end-
date on
budget
Documented
forecasts from the
document store
80 How Certain
the project
manager is
that the
project will
end on time
and on
budget?
These
forecasts are
important to
check the
quality of
project
delivery as
well as for
Capacity
Management
Planning.
70 0-100
Number of
Outstanding
action from
steering
meetings
Actions agreed to
at steering
meeting that are
not complete after
their agreed
completion
5 Actions with
a completion
date in the
past and a
status other
than "closed"
If projects are
running into
trouble or out
of resources,
One of the
first signs is
that actions
are agreed to,
but then not
completed on
10 999999

142
time. This
metric
enables the
warning sign
to be picked
up early.
Customer
Satisfaction
This is measure at
project review
time; though
comments related
to projects
received by the
Service Desk
ought to be
included in the
measure.
That Service
Management
processes
are delivered
effectively.
4 Customer
Satisfaction
with all
projects and
programs
delivered.
Projects must
be delivered
so as to
satisfy the
users and
customers
< 3 0-5
8.20 Example of other Metrics
TITLE Description ITSM Process Sources
Number of support incidents per day Number of support
incidents per day
SCA
Number of support incidents per
month
The number of support
cases divided critical,
important and desirable
cases per month
SCA
The number of hours of support for
non-business hours
The number of hours of
support for non-business
hours
SCA
Total number of support hours per
month divided support incident,
problem management, broker admin,
TIR Support
Total number of support
hours per month divided
support incident,
problem Management,
broker admin,
SCA
Time per support case How long an issue takes
to handle the request to
the production launch
SCA
Incident management in hours per
month
Incident management in
hours per month
SCA
Number of incidents on average per
day and terminal
Number of incidents on
average per day and
terminal
SCA
Number of incidents on average per
day per category
Number of incidents on
average per day per
category
SCA

143
Number of cases managed during
office hours per month
Number of cases
managed during office
hours per month.
Priority 1 support errand
During office hours 8-17
SCA
Skills Widening of hours per month. How many hours that
the department spent on
widening (Broadening)
skills. Measured by
competence mapping
SCA
Estimated time in relation to the time
spent
Estimated time in
relation to the time spent
(Used time: support,
competence, service
management,
maintenance.
SCA
Number of faulty production settings Number of faulty
production settings /
quality releases
SCA
Number of planned deliveries
compared with the actual delivered
Number of planned
deliveries compared
with the actual delivered
User Satisfaction The questionnaire was
designed to measure user
satisfaction of SCA's
internal and external
users. Used by SOGETI
to show SCA
Transforms how well
they realize their
mandates. It is
conducted once a year
and the result is used as
the basis for economic
regulation of the
activities SOGETI
implements and
considered as proof that
they meet the service
commitments that they
agreed
SOGETI
Competency Profile Measured using
mapping skills (skills
matrix)
Expertise and
Resources
SOGETI
Competence distribution in mission The aim is to achieve a
healthy turnover of staff
that ensures a long-term
succession planning.
Each mission will have a
well-balanced mix of
experts, self-propelled
consultants and
consultants under
development
Expertise and
Resources
SOGETI

144
Productivity Can include measured
using the concept of
APM, Application
Portfolio Management.
Delivery Capacity SOGETI
Delivery times Can assume planned and
promised delivery date
of release
Delivery Capacity SOGETI
Time required per unit of production Time spent related to the
unit in the Purchaser's
operations, such as
Invoice, Transported
volume etc.
Delivery Capacity SOGETI
Delivery performance, outcomes in
relation to financial
Time spent compared to
calculus.
Delivery Capacity SOGETI
Number of recurring errors Measured by means of
registration of case type
and support monitoring.
SOGETI
Incorrect deliveries programs For example, the number
of bugs in supply
relative to volume in
hours
SOGETI
Diagnoses SOGETI has the tools to
measure how the
processes, procedures
and methods applied in
undertaking works. One
such example is TPI,
Test Process
Improvement with
which to identify and
streamline testing
processes.
SOGETI
Number of cases Support Monitoring and
case registration
Support and case
management
SOGETI
Time spent per case Subject and time
registration.
Support and case
management
SOGETI
Distribution of time between services /
information
i.e. the Support, Service
Management,
Maintenance and further
development.
Other SOGETI
Surveys Customer survey, user
survey, staff survey, etc.
Other SOGETI
Proactivity Measurement of
proactive suggestions.
Other SOGETI
Number of lines of code Can be measured with
APM tool and resource
Miner
Technology SOGETI
Number of functions Can be measured with
APM tool and resource
Miner
Technology SOGETI
Number of programs Can be measured with
APM tool and resource
Miner
Technology SOGETI

145
University of Borås is a modern university in the city center. We give courses in business administration and
informatics, library and information science, fashion and textiles, behavioral sciences and teacher education,
engineering and health sciences.
In the School of Business and IT (HIT), we have focused on the students' future needs. Therefore we have created
programs in which employability is a key word. Subject integration and contextualization are other important
concepts. The department has closeness, both between students and teachers as well as between industry and
education.
Our courses in business administration give students the opportunity to learn more about different businesses and
governments and how governance and organization of these activities take place. They may also learn about society
development and organizations' adaptation to the outside world. They have the opportunity to improve their ability
to analyze, develop and control activities, whether they want to engage in auditing, management or marketing.
Among our IT courses, there's always something for those who want to design the future of IT-based
communications, analyze the needs and demands on organizations' information to design their content structures,
integrating IT and business development, developing their ability to analyze and design business processes or focus
on programming and development of good use of IT in enterprises and organizations.
The research in the school is well recognized and oriented towards professionalism as well as design and
development. The overall research profile is Business-IT-Services which combine knowledge and skills in
informatics as well as in business administration. The research is profession-oriented, which is reflected in the
research, in many cases conducted on action research-based grounds, with businesses and government organizations
at local, national and international arenas. The research design and professional orientation is manifested also in
Innovation Lab, which is the department's and university's unit for research-supporting system development.
VISITING ADDRESS: JÄRNVÄGSGATAN 5 · POSTAL ADDRESS: ALLÉGATAN 1, SE-501 90 BORÅS
PHONE: + 46 33 435 40 00 · E-MAIL: [email protected] · WEB: WWW.HB.SE/HIT
Related Documents