THIS IS CIVIL ENGINEERING. THIS IS AUBURN. PROPOSED RE-CALIBRATION OF AASHTO LRFD SPECIFICATIONS Andrzej S. Nowak and Olga Iatsko Department of Civil Engineering [email protected] June, 2017

Welcome message from author
This document is posted to help you gain knowledge. Please leave a comment to let me know what you think about it! Share it to your friends and learn new things together.
Transcript
THIS IS CIVIL ENGINEERING. THIS IS AUBURN.
PROPOSED RE-CALIBRATION OF AASHTO LRFD SPECIFICATIONS
Andrzej S. Nowak and Olga IatskoDepartment of Civil Engineering
June, 2017
THIS IS CIVIL ENGINEERING. THIS IS AUBURN.
Calibration of Design Code• Bridges have to be designed with an
adequate safety margin
• In LRFD Specifications safety is represented by load and resistance factors
• Code calibration is selection of load and resistance factors so that safety is at an acceptable level

THIS IS CIVIL ENGINEERING. THIS IS AUBURN.
Three Important Questions in Code Calibration
• How to measure safety?
•What is acceptable safety level?
• How to select load and resistance factors so that safety is at acceptable level?
THIS IS CIVIL ENGINEERING. THIS IS AUBURN.
What is needed?
• Statistical parameters of load
• Statistical parameters of resistance
• Reliability analysis procedure to calculate the Reliability Index
• Target Reliability Index
THIS IS CIVIL ENGINEERING. THIS IS AUBURN.
Statistical Parameters
•Mean value
• = Bias factor = mean/nominal
• = Standard deviation
• V = Coefficient of variation = /mean
• Type of distribution function
THIS IS CIVIL ENGINEERING. THIS IS AUBURN.
Calibration of AASHTO LRFD 1994• Live load parameters based on
Ontario truck survey in 1977
• Resistance parameters (concrete, reinforcing steel, prestressing strands, structural steel) based on test results in 1970’s
• Reliability analysis procedure based on techniques from 1980’s
THIS IS CIVIL ENGINEERING. THIS IS AUBURN.
What is new?• Over 200 million Weigh-in-Motion (WIM)
records of trucks (national data base)
• New material test results (ordinary concrete, light-weight concrete, rebars, prestressing strands, structural steel)
• Simulation techniques (Monte Carlo)
• More efficient reliability analysis procedure (reliability index and design point)

THIS IS CIVIL ENGINEERING. THIS IS AUBURN.
What is the effect of new data?• Are current live loads different than
Ontario data (1977)?
• Are new statistical parameters of resistance different than in 1970’s?
• Are target reliability indices in AASHTO Specifications adequate?
• Are load and resistance factors in AASHTO Specifications adequate?
THIS IS CIVIL ENGINEERING. THIS IS AUBURN.
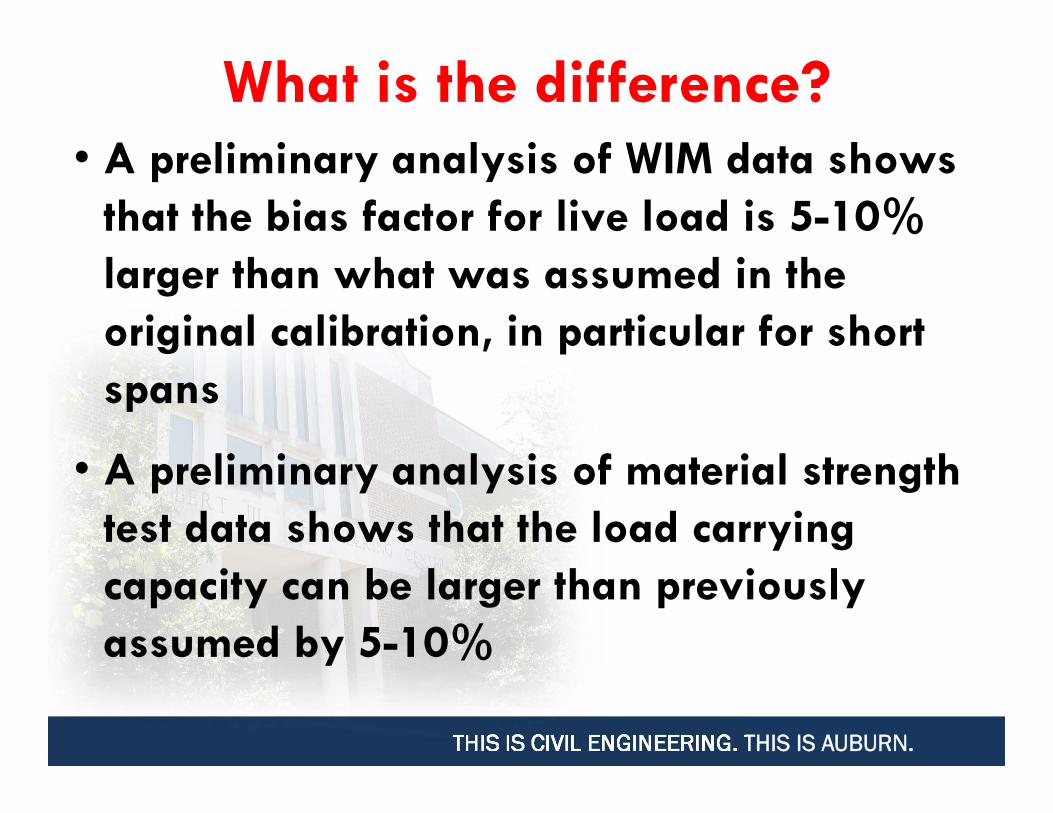
What is the difference?• A preliminary analysis of WIM data shows
that the bias factor for live load is 5-10% larger than what was assumed in the original calibration, in particular for short spans
• A preliminary analysis of material strength test data shows that the load carrying capacity can be larger than previously assumed by 5-10%
THIS IS CIVIL ENGINEERING. THIS IS AUBURN.
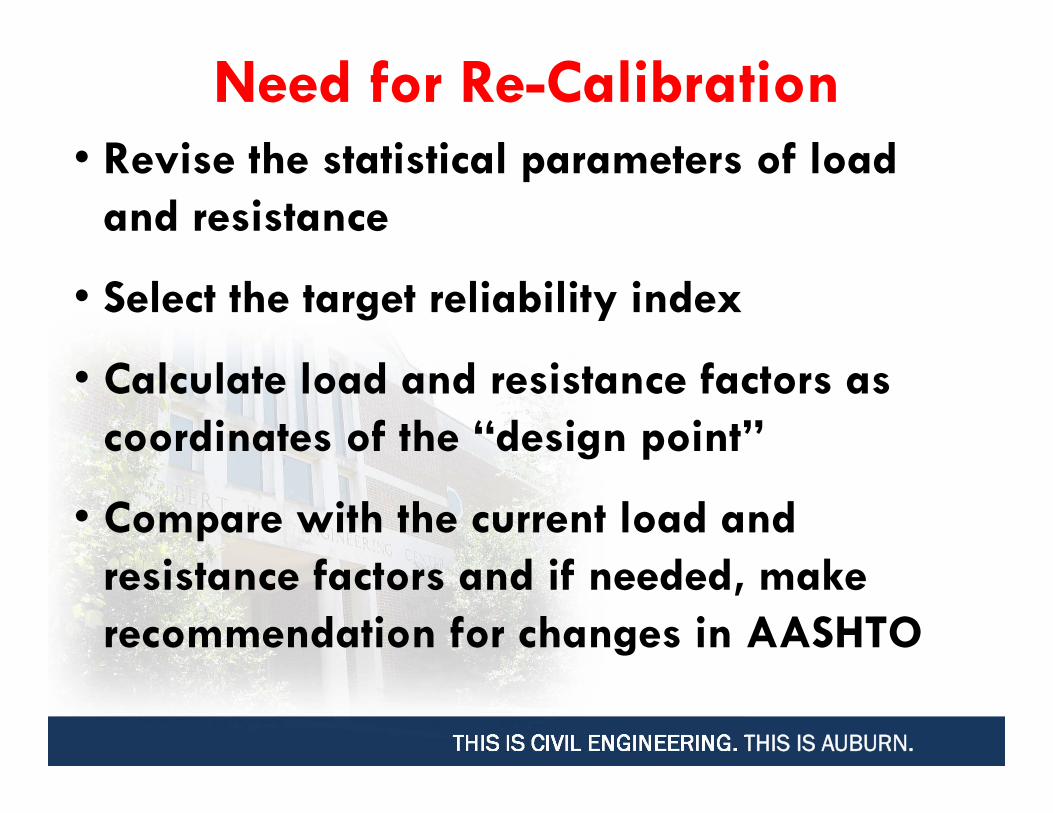
Need for Re-Calibration• Revise the statistical parameters of load
and resistance
• Select the target reliability index
• Calculate load and resistance factors as coordinates of the “design point”
• Compare with the current load and resistance factors and if needed, make recommendation for changes in AASHTO
THIS IS CIVIL ENGINEERING. THIS IS AUBURN.
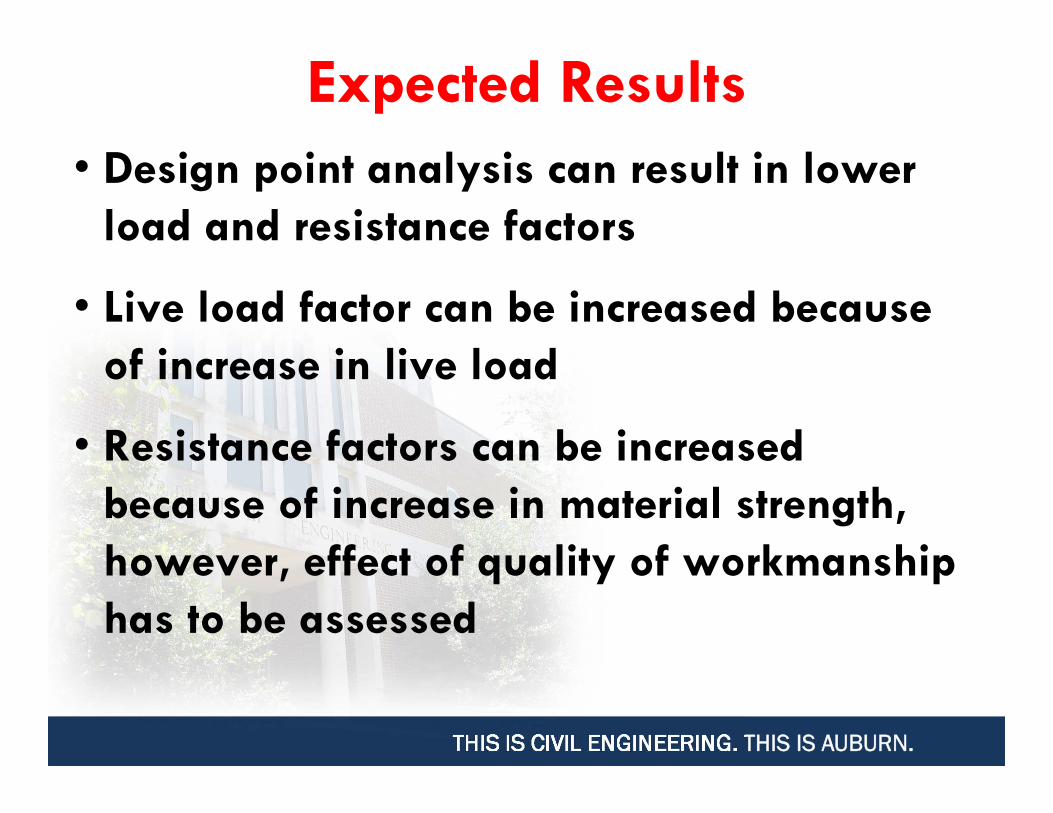
Expected Results• Design point analysis can result in lower
load and resistance factors
• Live load factor can be increased because of increase in live load
• Resistance factors can be increased because of increase in material strength, however, effect of quality of workmanship has to be assessed
THIS IS CIVIL ENGINEERING. THIS IS AUBURN.
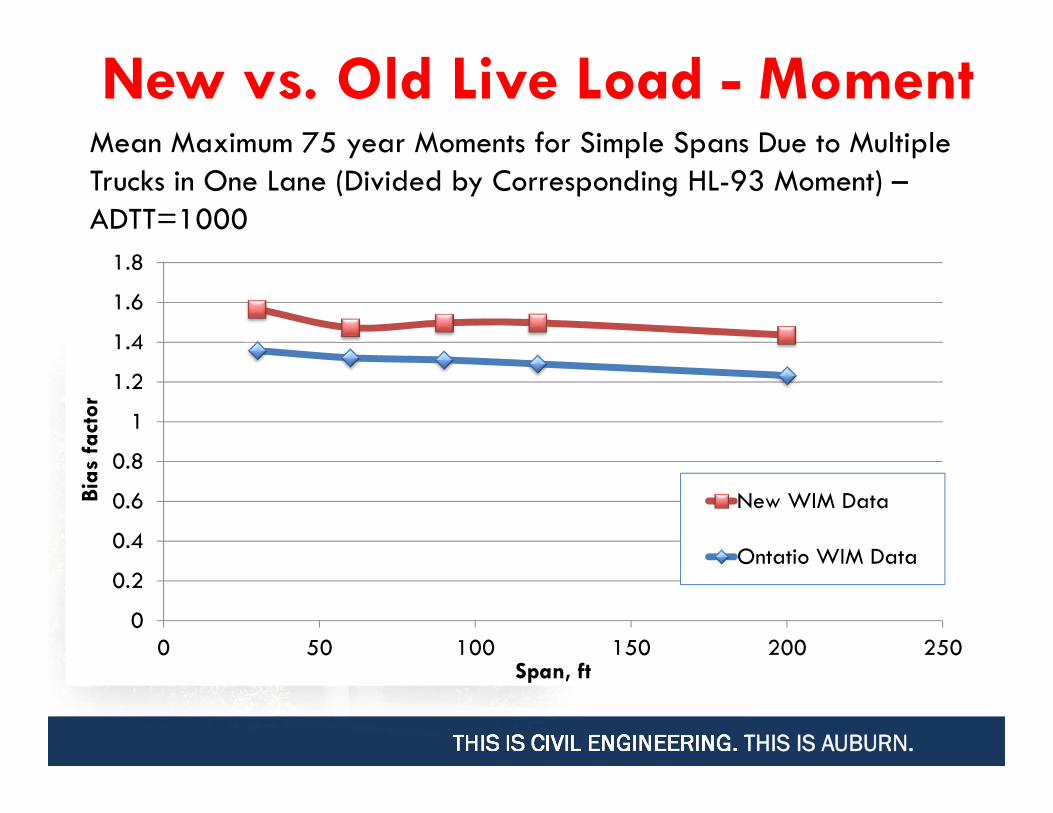
New vs. Old Live Load - MomentMean Maximum 75 year Moments for Simple Spans Due to Multiple Trucks in One Lane (Divided by Corresponding HL-93 Moment) –ADTT=1000
0
0.2
0.4
0.6
0.8
1
1.2
1.4
1.6
1.8
0 50 100 150 200 250
Bias
fac
tor
Span, ft
New WIM Data
Ontatio WIM Data

THIS IS CIVIL ENGINEERING. THIS IS AUBURN.
New vs. Old Live Load - ShearMean Maximum 75 year Shear Force for Simple Spans Due to Multiple Trucks in One Lane (Divided by Corresponding HL-93 Moment) –ADTT=1000
0
0.2
0.4
0.6
0.8
1
1.2
1.4
1.6
1.8
0 50 100 150 200 250
Bias
fac
tor
Span, ft
New WIM Data
Ontario WIM Data
THIS IS CIVIL ENGINEERING. THIS IS AUBURN.
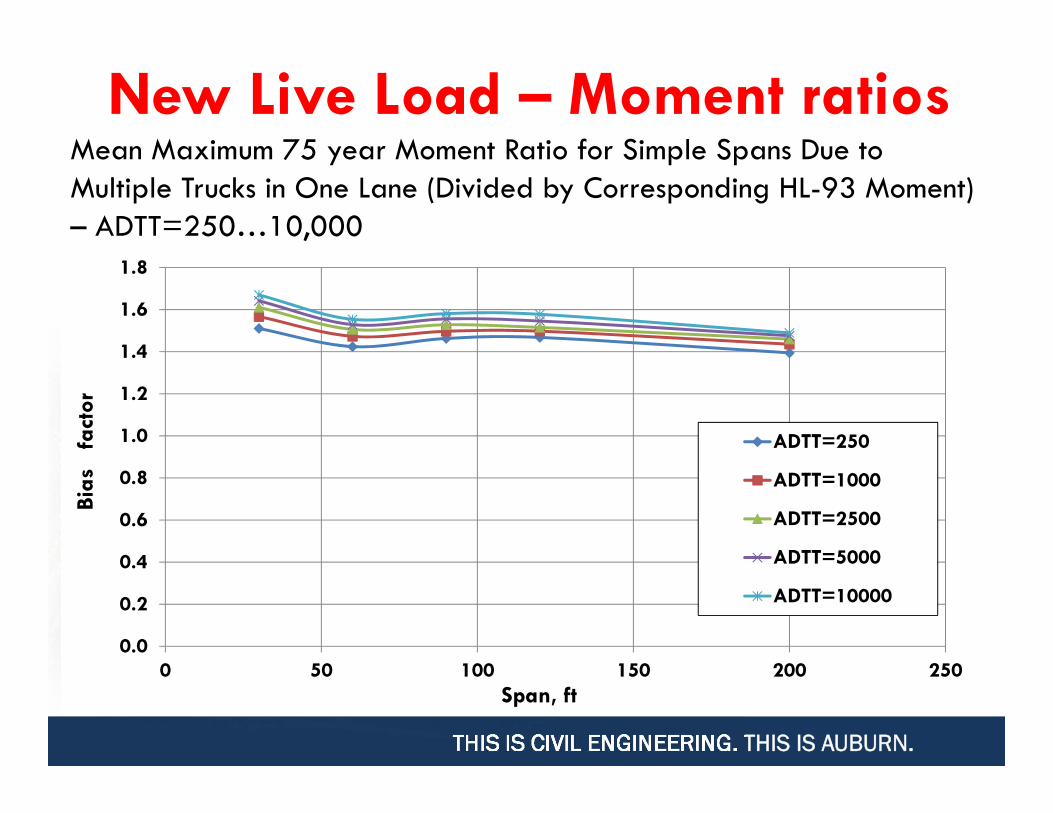
New Live Load – Moment ratios Mean Maximum 75 year Moment Ratio for Simple Spans Due to Multiple Trucks in One Lane (Divided by Corresponding HL-93 Moment) – ADTT=250…10,000
0.0
0.2
0.4
0.6
0.8
1.0
1.2
1.4
1.6
1.8
0 50 100 150 200 250
Bias
fa
ctor
Span, ft
ADTT=250
ADTT=1000
ADTT=2500
ADTT=5000
ADTT=10000
THIS IS CIVIL ENGINEERING. THIS IS AUBURN.
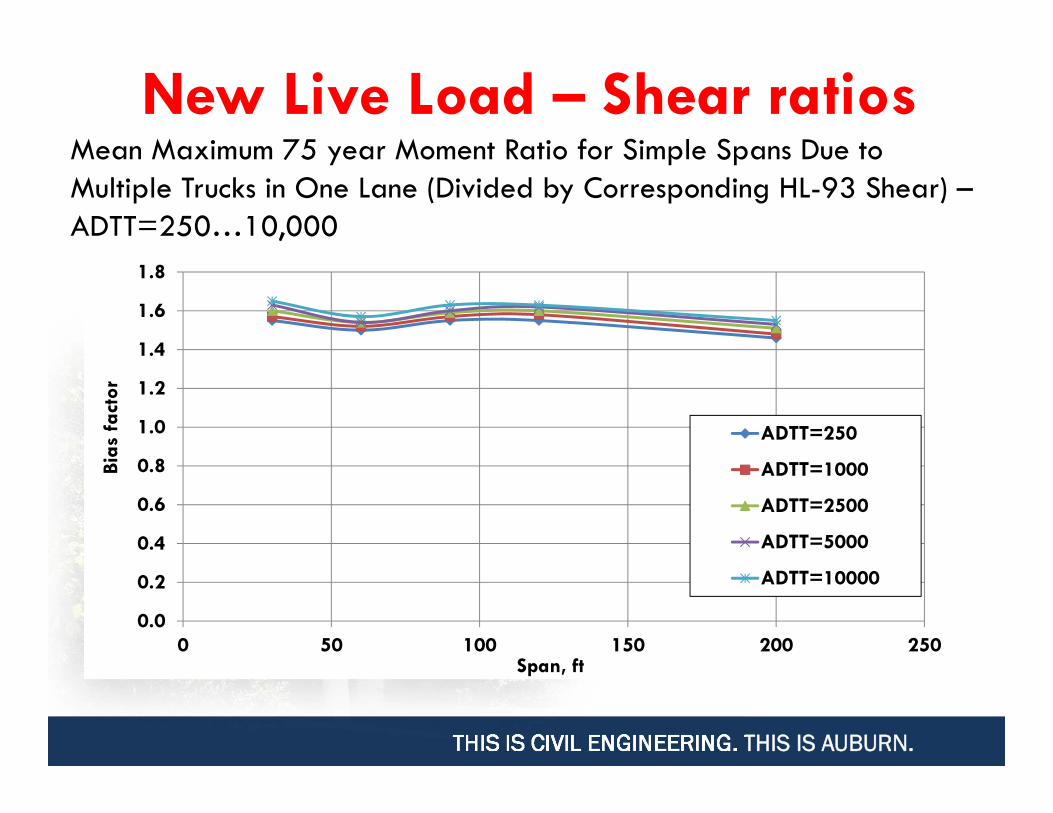
New Live Load – Shear ratios Mean Maximum 75 year Moment Ratio for Simple Spans Due to Multiple Trucks in One Lane (Divided by Corresponding HL-93 Shear) –ADTT=250…10,000
0.0
0.2
0.4
0.6
0.8
1.0
1.2
1.4
1.6
1.8
0 50 100 150 200 250
Bias
fac
tor
Span, ft
ADTT=250
ADTT=1000
ADTT=2500
ADTT=5000
ADTT=10000
THIS IS CIVIL ENGINEERING. THIS IS AUBURN.
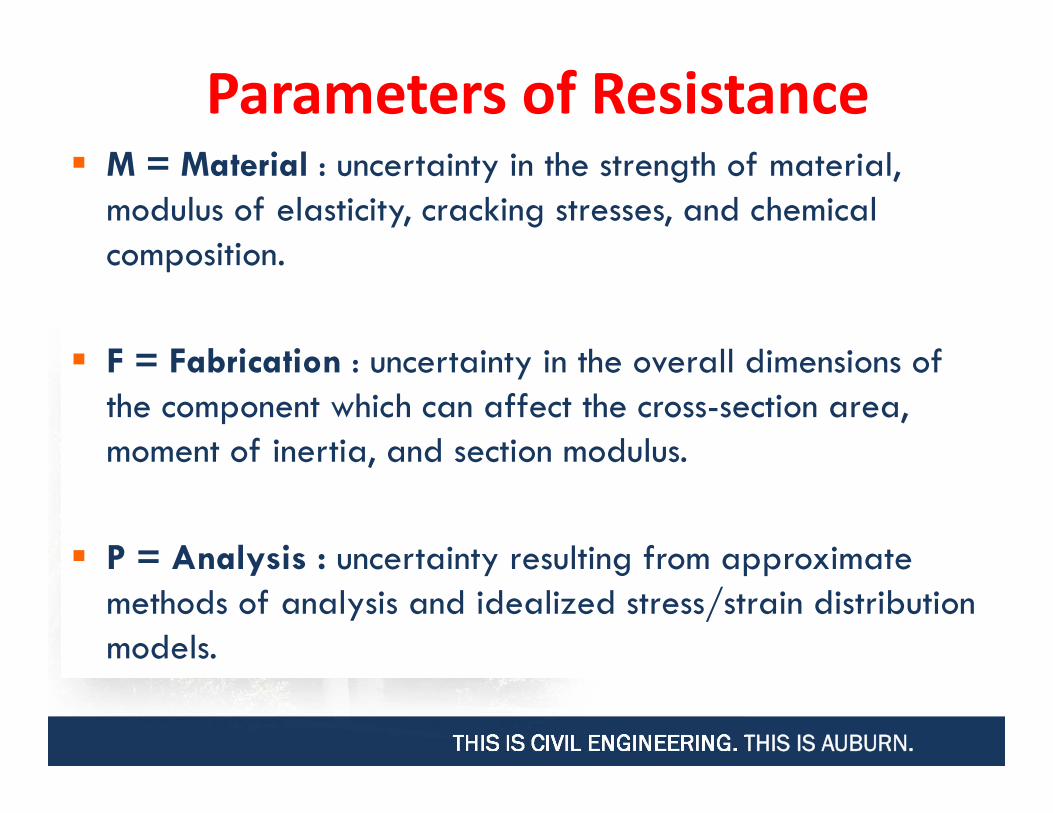
Parameters of Resistance M = Material : uncertainty in the strength of material,
modulus of elasticity, cracking stresses, and chemical composition.
F = Fabrication : uncertainty in the overall dimensions of the component which can affect the cross-section area, moment of inertia, and section modulus.
P = Analysis : uncertainty resulting from approximate methods of analysis and idealized stress/strain distribution models.
THIS IS CIVIL ENGINEERING. THIS IS AUBURN.
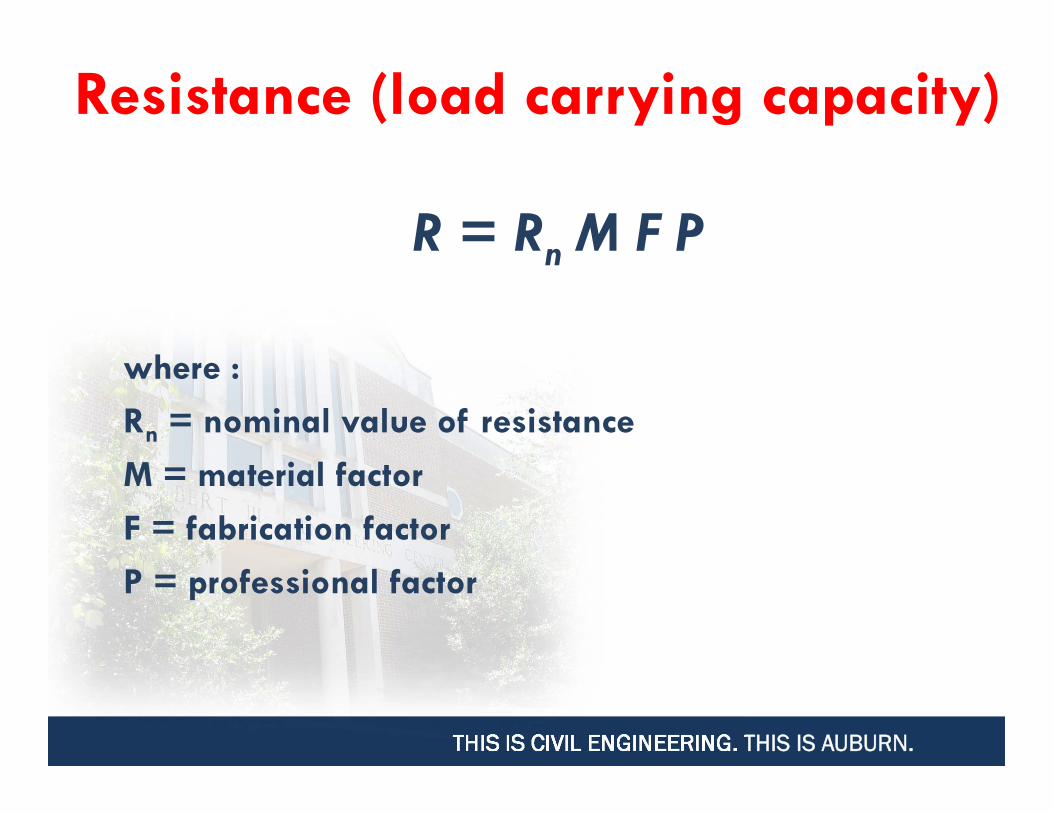
Resistance (load carrying capacity)
R = Rn M F P
where :
Rn = nominal value of resistance
M = material factor
F = fabrication factor
P = professional factor

THIS IS CIVIL ENGINEERING. THIS IS AUBURN.
What is affected?• Bias factor = ratio of mean-to-nominal• for fc’ = 1.10-1.30 • for Fy = 1.12-1.14 (1.12)*• for Fpu = 1.02-1.04
• Coefficient of variation• for fc’ = 11-17% (15-18%)*• for Fy = 2-3% (10%)*• for Fpu = 1.5% (2.5%)*
*NBS Report 577 (1980)
THIS IS CIVIL ENGINEERING. THIS IS AUBURN.
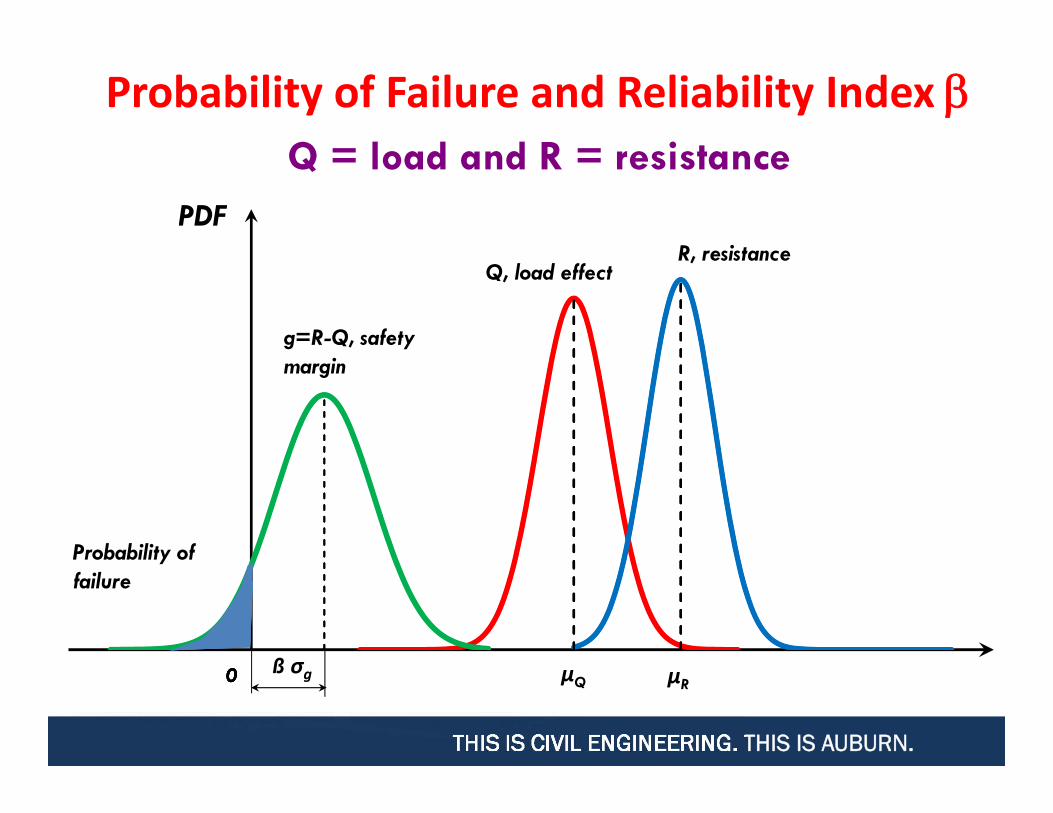
Probability of Failure and Reliability Index Q = load and R = resistance
000
Probability of failure
0
g=R-Q, safety margin
Q, load effectR, resistance
μQ μRß σg
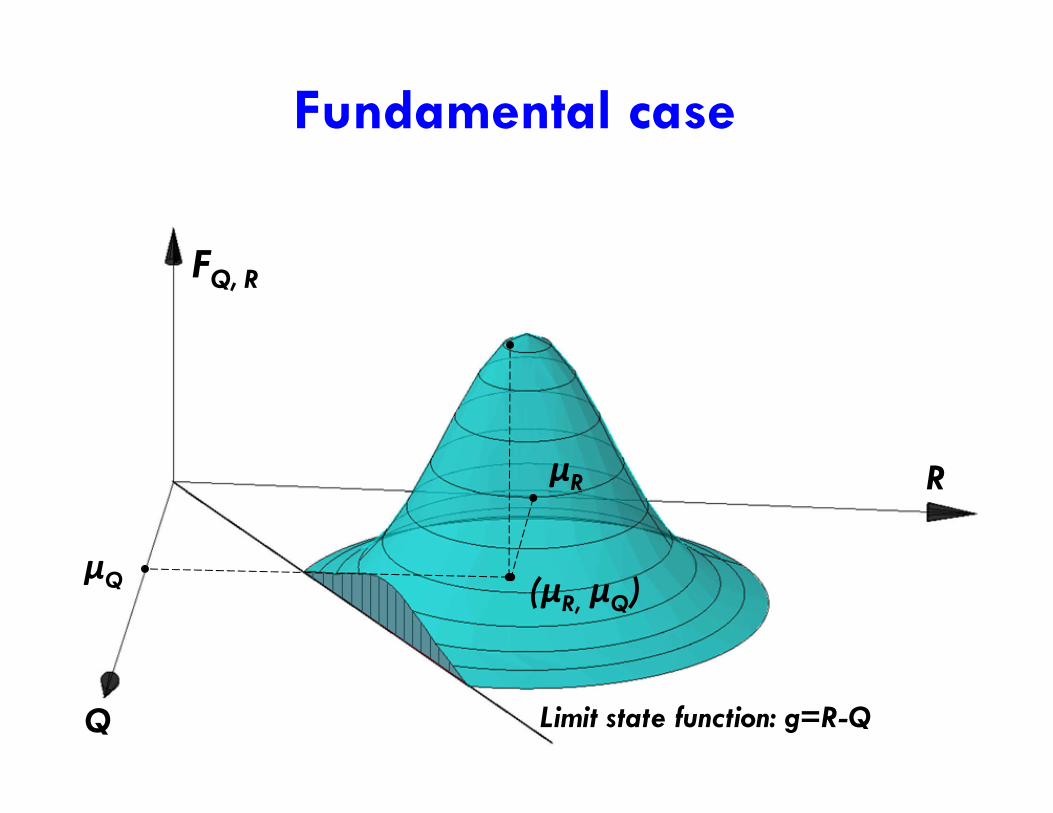
Fundamental case
μR
Q
FQ, R
Limit state function: g=R-Q
μQ (μR, μQ)
μR R
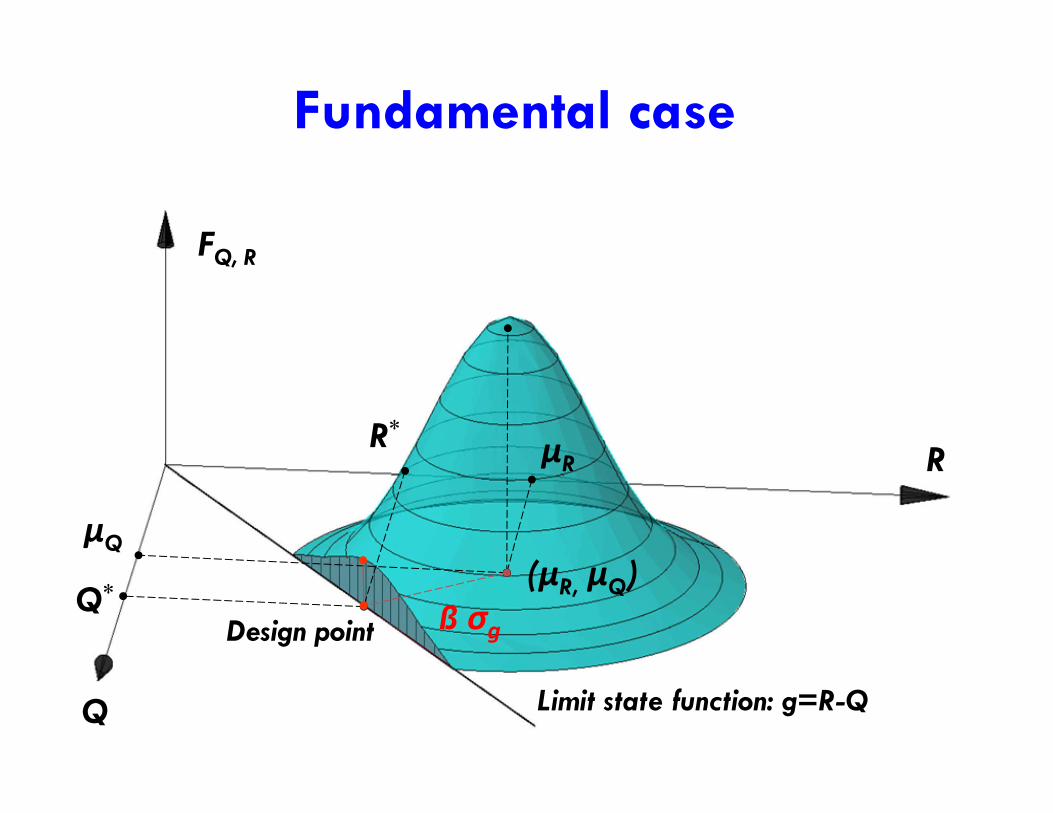
Fundamental case
Q
FQ, R
Limit state function: g=R-Q
μQ(μR, μQ)
μR R
Q*
Design point ß σg
R*
THIS IS CIVIL ENGINEERING. THIS IS AUBURN.
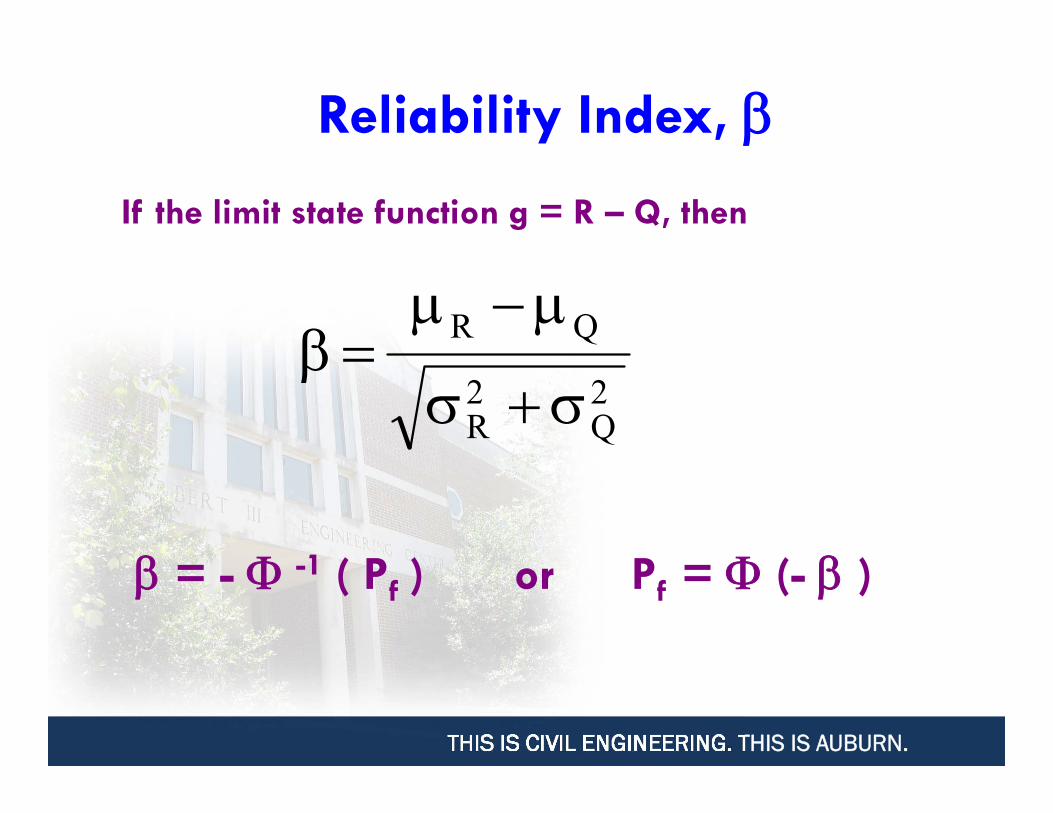
Reliability Index,
If the limit state function g = R – Q, then
= - -1 ( Pf ) or Pf = (- )
R Q
R Q2 2
THIS IS CIVIL ENGINEERING. THIS IS AUBURN.
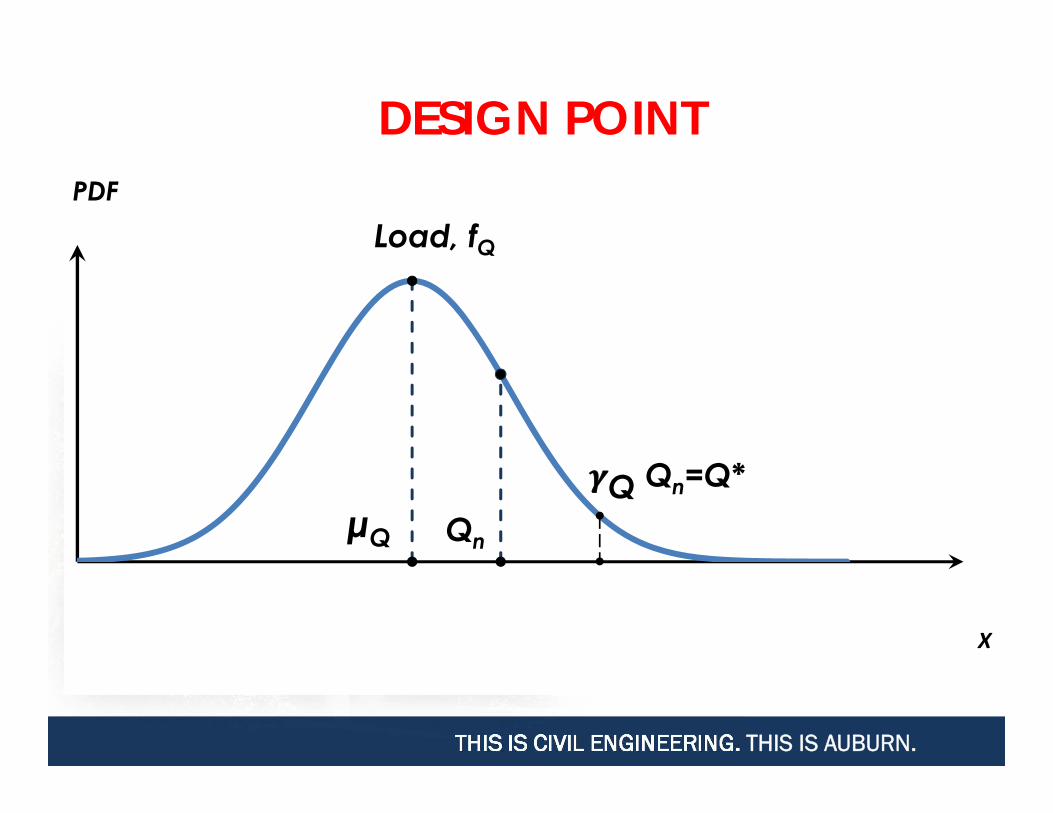
DESIGN POINT
Load, fQ
μQ Qn
X
Q Qn=Q*
THIS IS CIVIL ENGINEERING. THIS IS AUBURN.
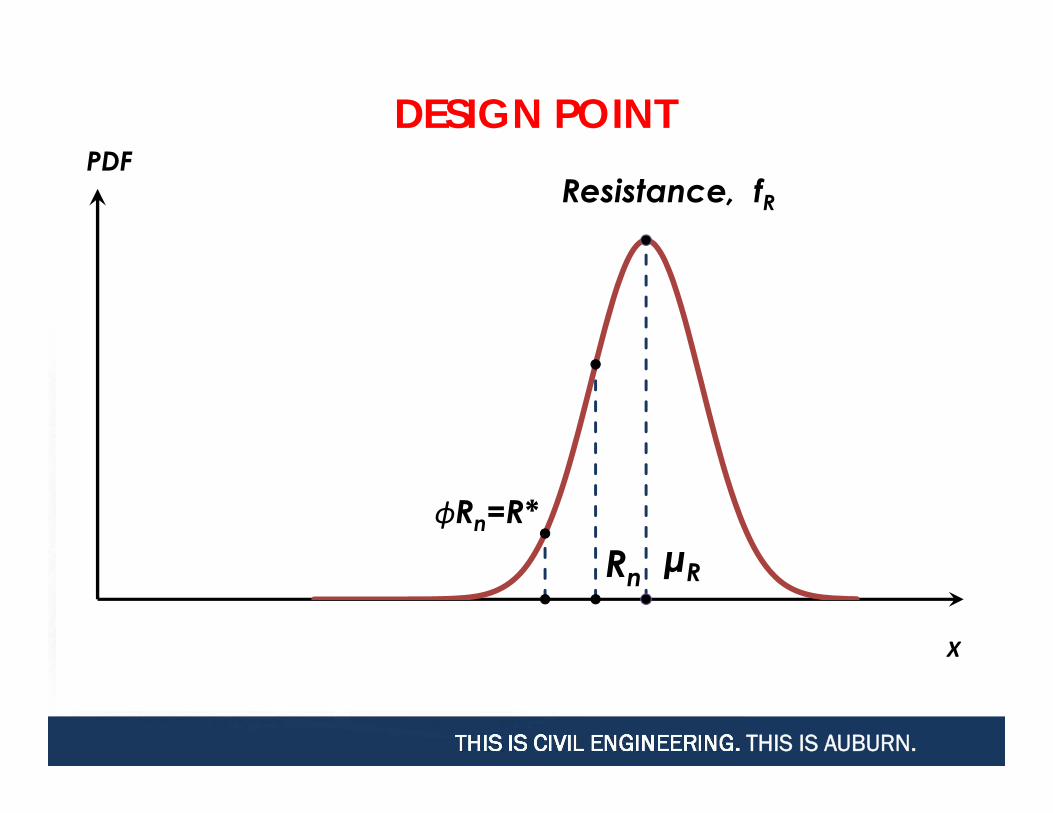
DESIGN POINT
Resistance, fR
μRRn
X
ϕRn=R*
THIS IS CIVIL ENGINEERING. THIS IS AUBURN.
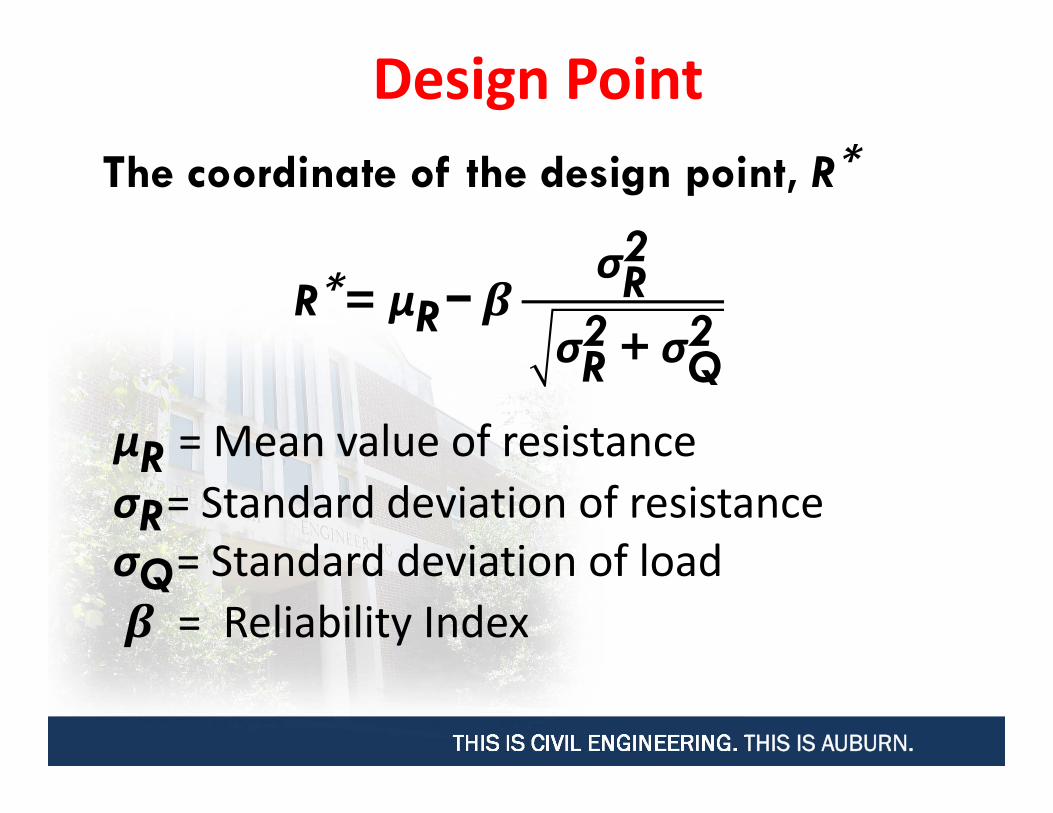
Design PointThe coordinate of the design point, R
R = μR−σR
2
σR2 + σQ
2
μR = Mean value of resistanceσR= Standard deviation of resistanceσQ= Standard deviation of load
= Reliability Index
THIS IS CIVIL ENGINEERING. THIS IS AUBURN.
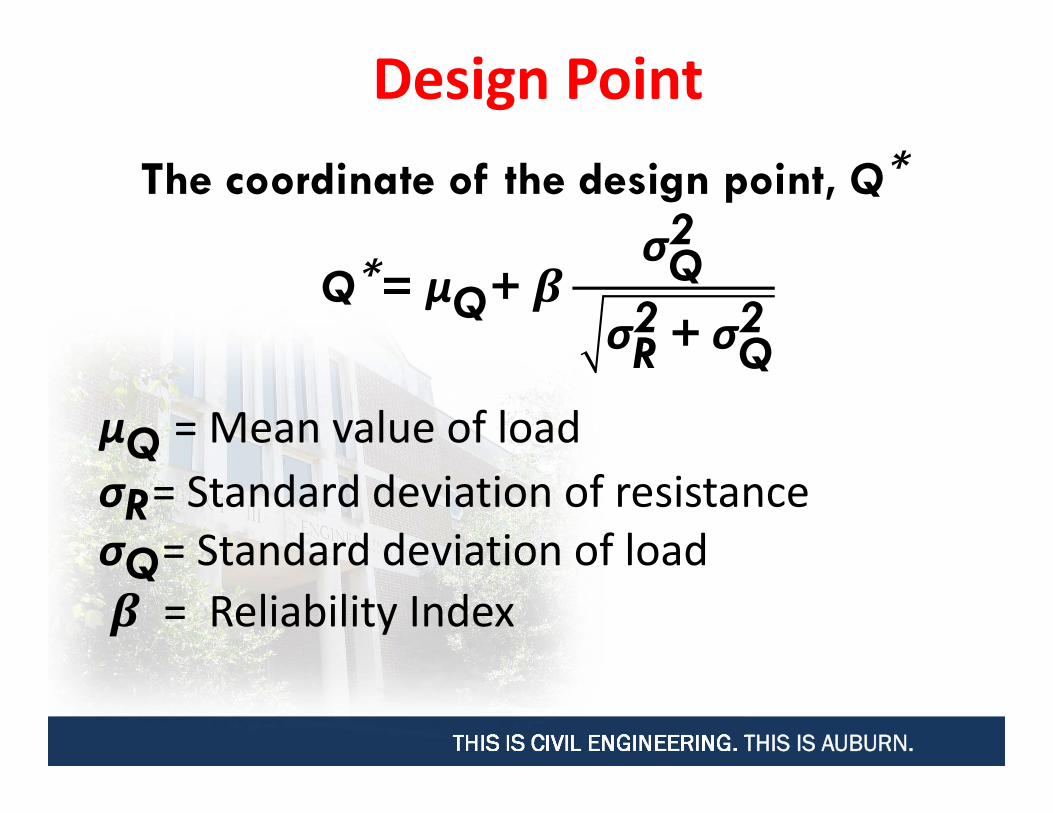
Design PointThe coordinate of the design point, Q
Q = μQ+σQ
2
σR2 + σQ
2
μQ = Mean value of loadσR= Standard deviation of resistanceσQ= Standard deviation of load
= Reliability Index
THIS IS CIVIL ENGINEERING. THIS IS AUBURN.
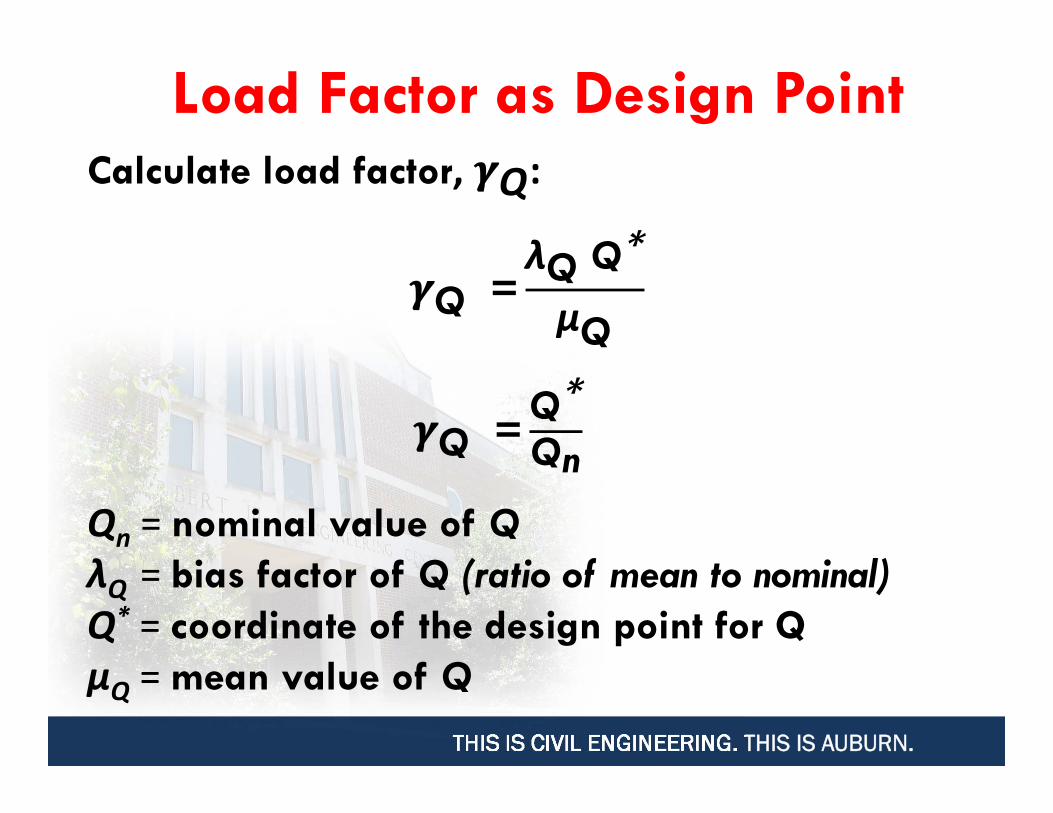
Load Factor as Design PointCalculate load factor, Q:
Q =λQ Q
μQ
Q =
QQn
Qn = nominal value of QλQ = bias factor of Q (ratio of mean to nominal)Q* = coordinate of the design point for QμQ = mean value of Q
THIS IS CIVIL ENGINEERING. THIS IS AUBURN.
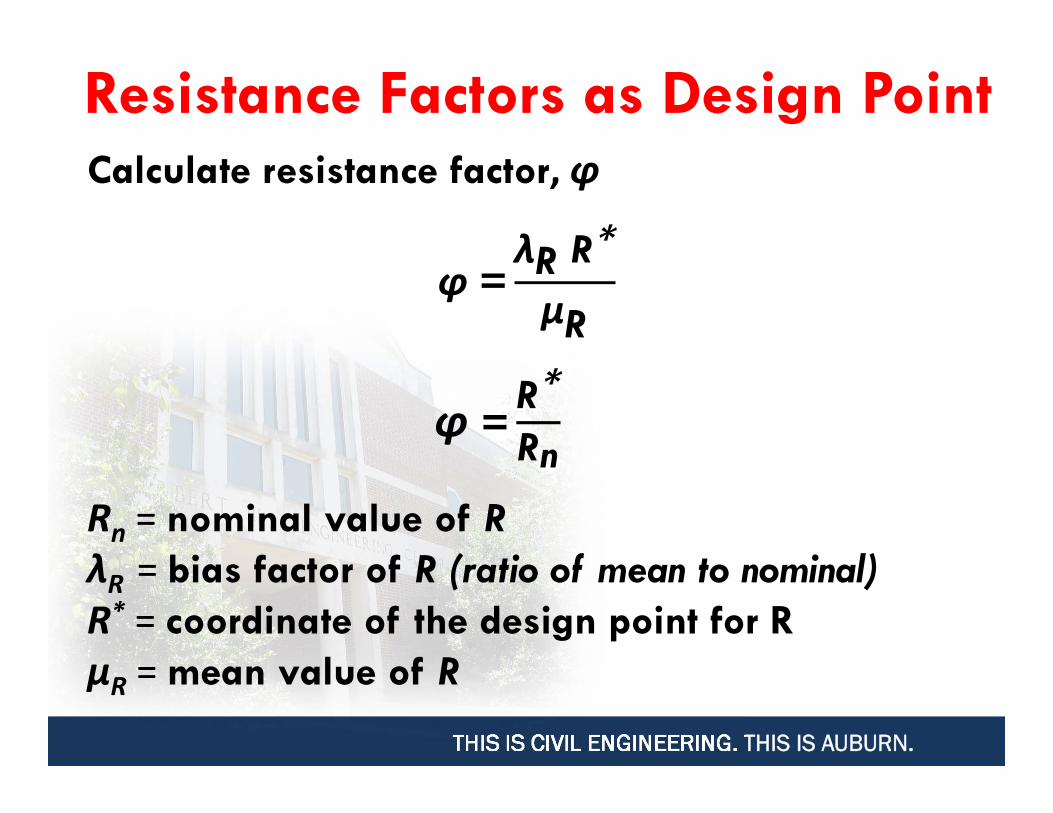
Resistance Factors as Design PointCalculate resistance factor, ϕ
ϕ =λR RμR
ϕ =RRn
Rn = nominal value of RλR = bias factor of R (ratio of mean to nominal)R* = coordinate of the design point for RμR = mean value of R
THIS IS CIVIL ENGINEERING. THIS IS AUBURN.
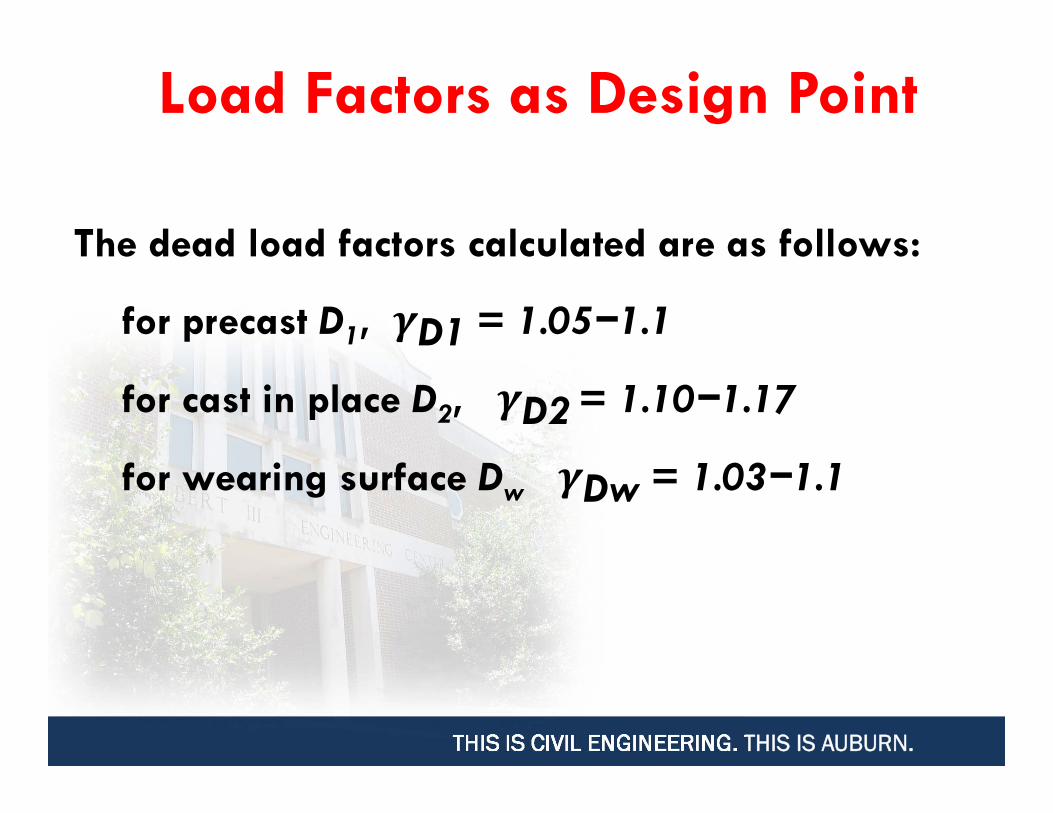
Load Factors as Design Point
The dead load factors calculated are as follows:
for precast D1, D1 = 1.05−1.1
for cast in place D2, D2= 1.10−1.17
for wearing surface Dw Dw = 1.03−1.1
THIS IS CIVIL ENGINEERING. THIS IS AUBURN.
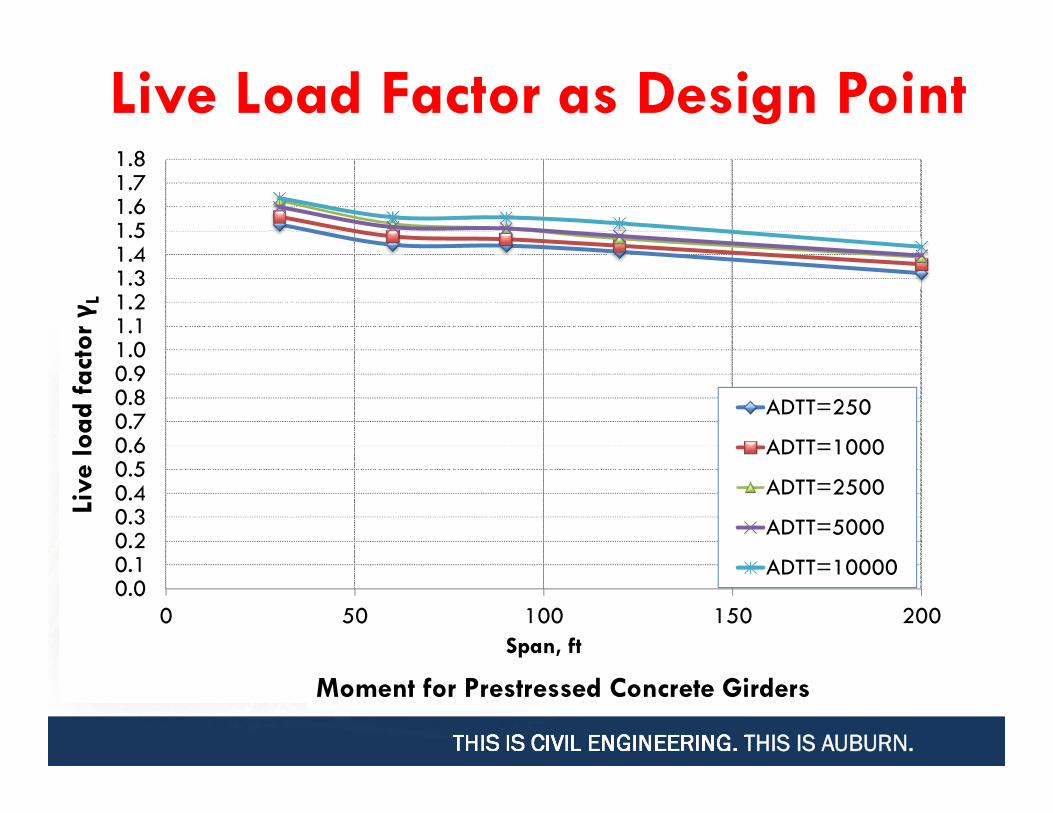
Live Load Factor as Design Point
0.00.10.20.30.40.50.60.70.80.91.01.11.21.31.41.51.61.71.8
0 50 100 150 200
Live
load
fac
tor γ
L
Span, ft
ADTT=250
ADTT=1000
ADTT=2500
ADTT=5000
ADTT=10000
Moment for Prestressed Concrete Girders
THIS IS CIVIL ENGINEERING. THIS IS AUBURN.
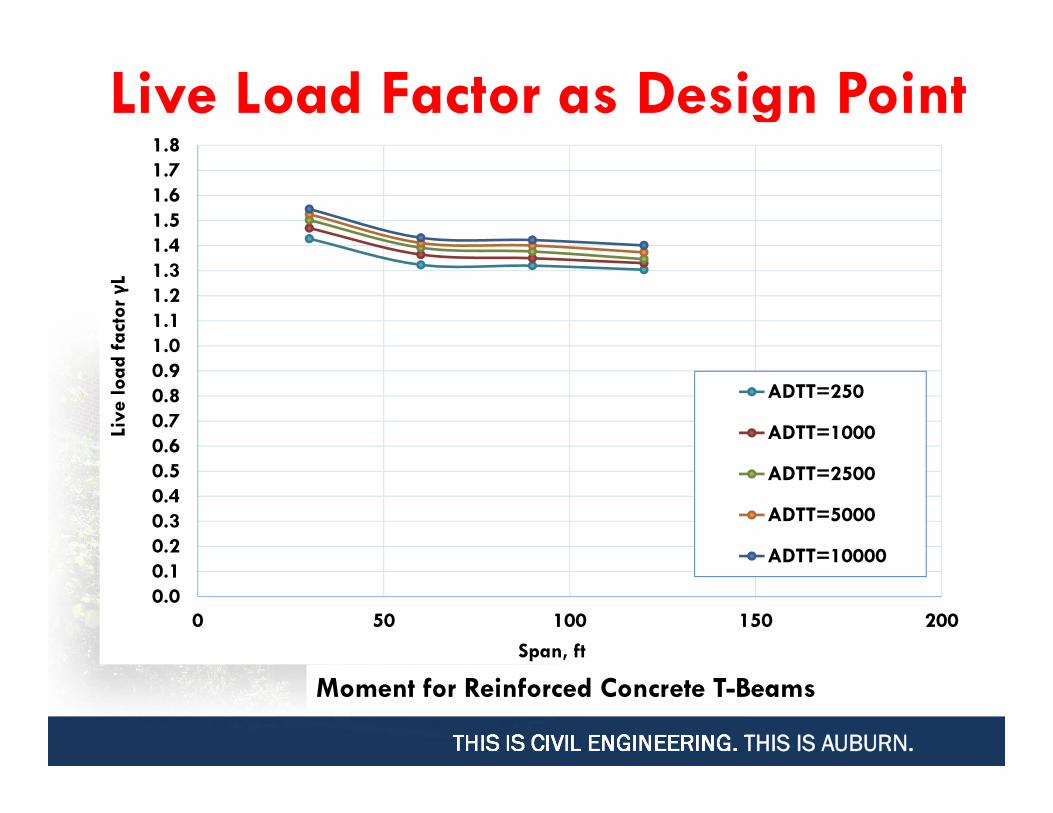
Live Load Factor as Design Point
Moment for Reinforced Concrete T-Beams
0.00.10.20.30.40.50.60.70.80.91.01.11.21.31.41.51.61.71.8
0 50 100 150 200
Live
load
fac
tor γ
L
Span, ft
ADTT=250
ADTT=1000
ADTT=2500
ADTT=5000
ADTT=10000
THIS IS CIVIL ENGINEERING. THIS IS AUBURN.
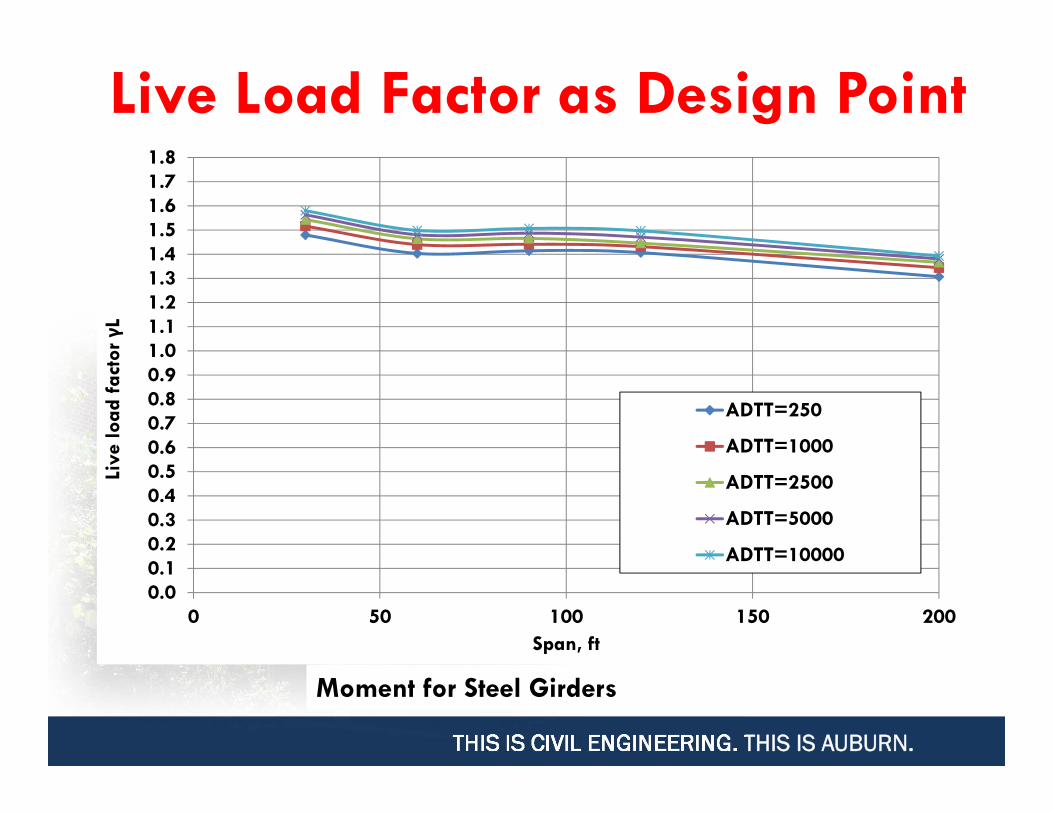
Live Load Factor as Design Point
Moment for Steel Girders
0.00.10.20.30.40.50.60.70.80.91.01.11.21.31.41.51.61.71.8
0 50 100 150 200
Live
load
fac
tor γ
L
Span, ft
ADTT=250
ADTT=1000
ADTT=2500
ADTT=5000
ADTT=10000
THIS IS CIVIL ENGINEERING. THIS IS AUBURN.
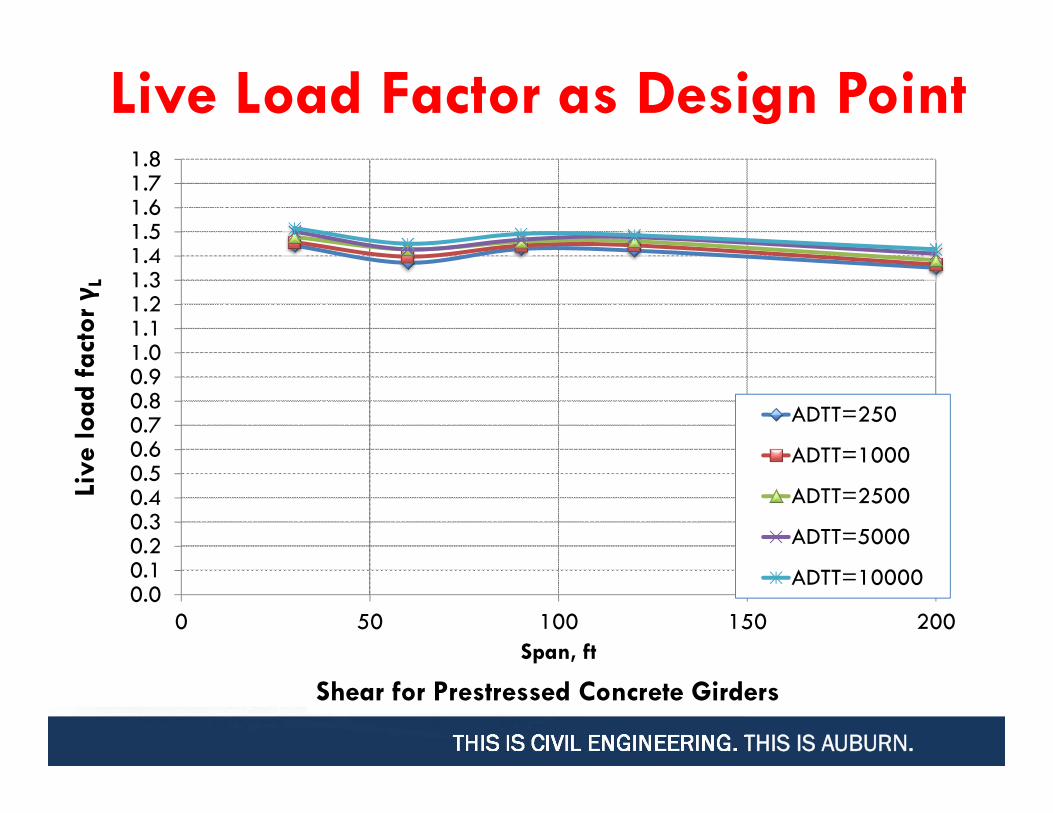
Live Load Factor as Design Point
0.00.10.20.30.40.50.60.70.80.91.01.11.21.31.41.51.61.71.8
0 50 100 150 200
Live
load
fac
tor γ
L
Span, ft
ADTT=250
ADTT=1000
ADTT=2500
ADTT=5000
ADTT=10000
Shear for Prestressed Concrete Girders
THIS IS CIVIL ENGINEERING. THIS IS AUBURN.
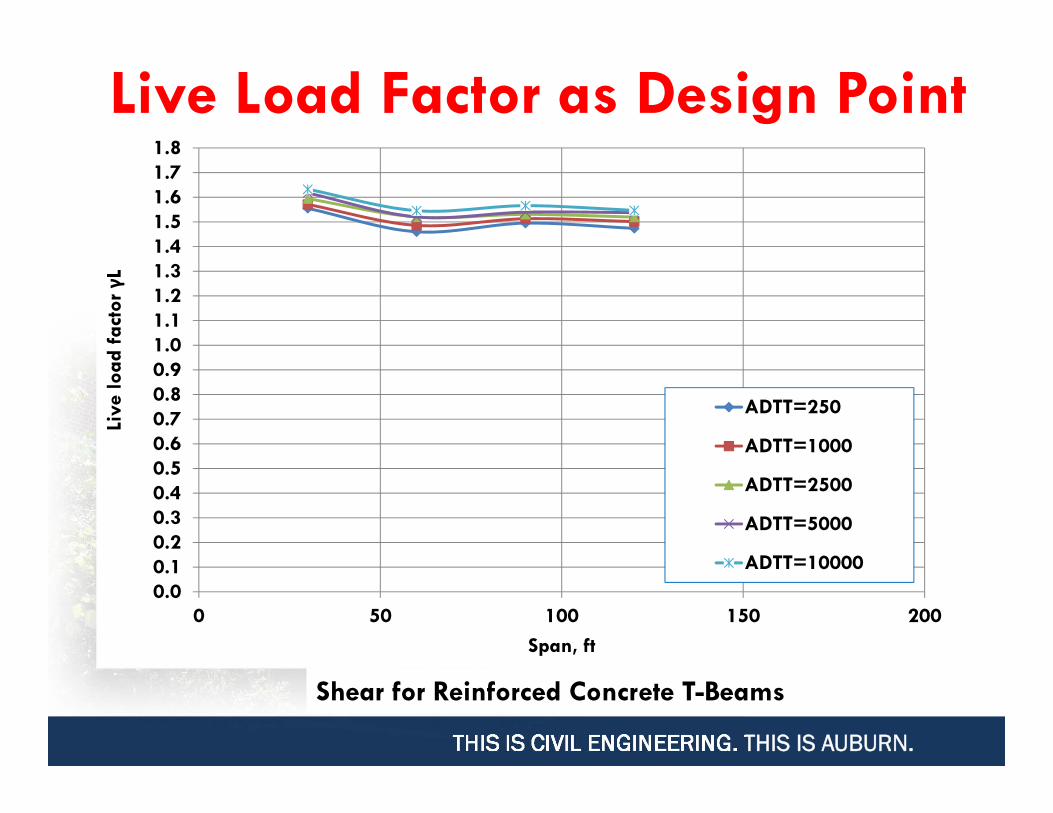
Live Load Factor as Design Point
Shear for Reinforced Concrete T-Beams
0.00.10.20.30.40.50.60.70.80.91.01.11.21.31.41.51.61.71.8
0 50 100 150 200
Live
load
fac
tor γ
L
Span, ft
ADTT=250
ADTT=1000
ADTT=2500
ADTT=5000
ADTT=10000
THIS IS CIVIL ENGINEERING. THIS IS AUBURN.
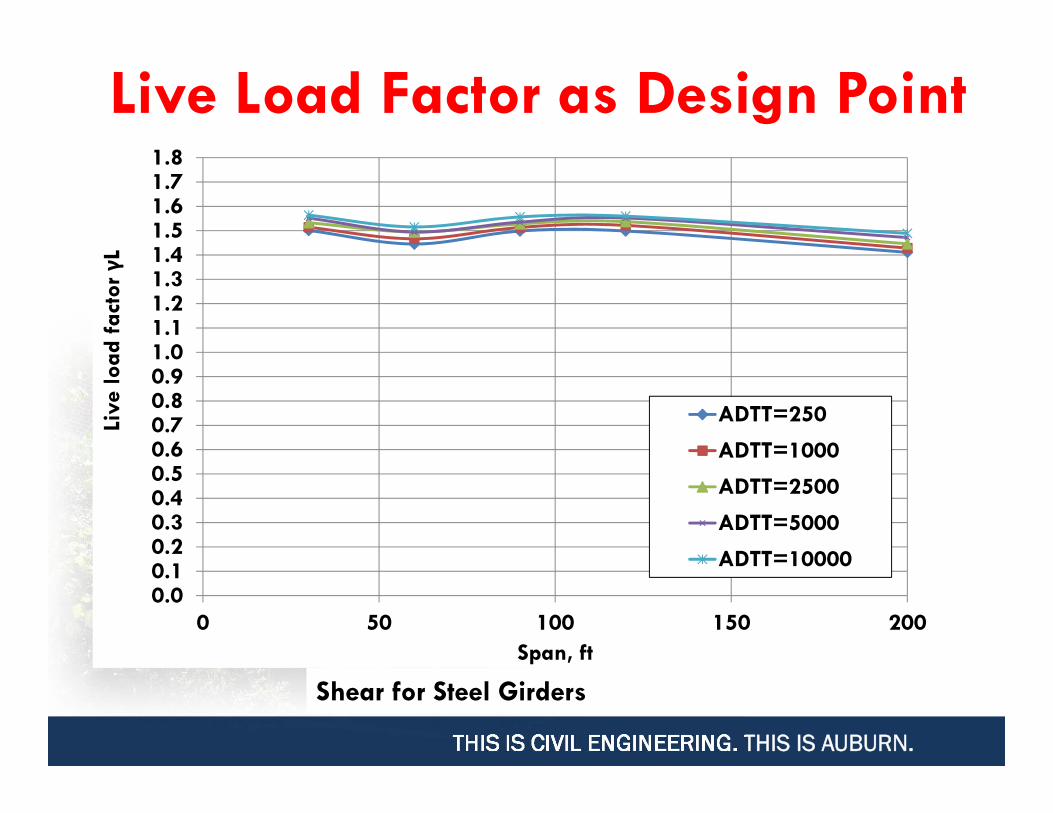
Live Load Factor as Design Point
Shear for Steel Girders
0.00.10.20.30.40.50.60.70.80.91.01.11.21.31.41.51.61.71.8
0 50 100 150 200
Live
load
fac
tor γL
Span, ft
ADTT=250
ADTT=1000
ADTT=2500
ADTT=5000
ADTT=10000
THIS IS CIVIL ENGINEERING. THIS IS AUBURN.
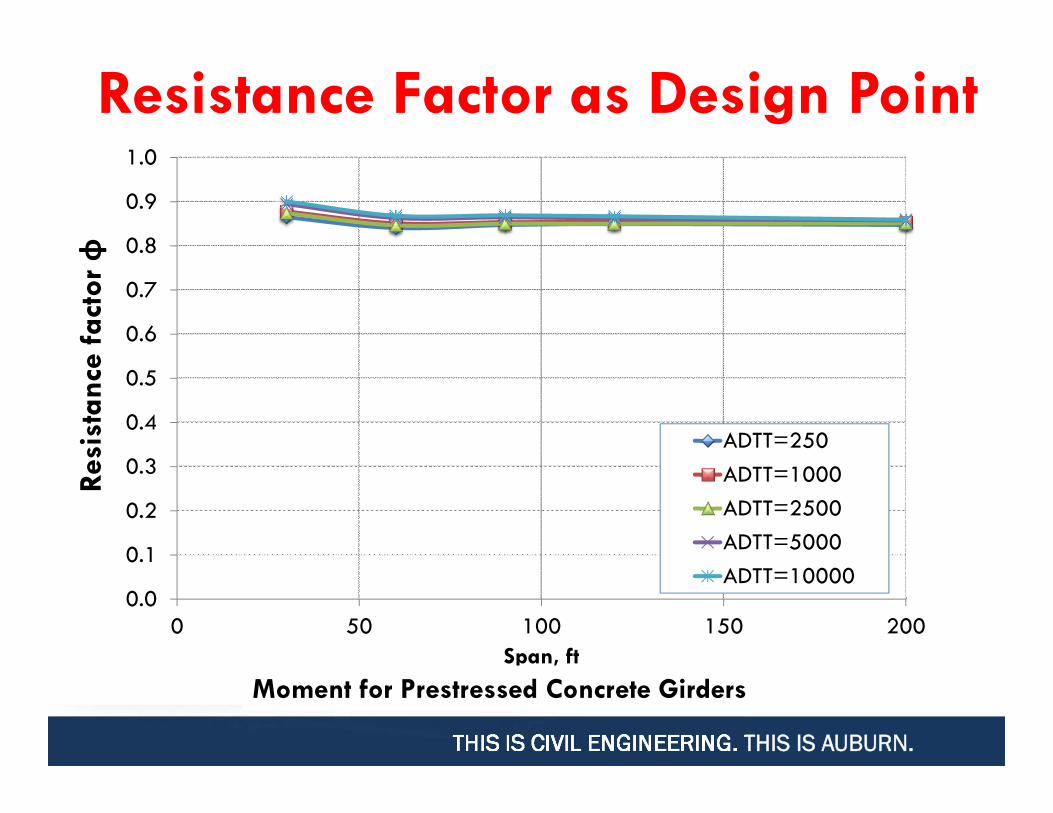
Resistance Factor as Design Point
0.0
0.1
0.2
0.3
0.4
0.5
0.6
0.7
0.8
0.9
1.0
0 50 100 150 200
Resi
stan
ce f
acto
r φ
Span, ft
ADTT=250ADTT=1000ADTT=2500ADTT=5000ADTT=10000
Moment for Prestressed Concrete Girders
THIS IS CIVIL ENGINEERING. THIS IS AUBURN.
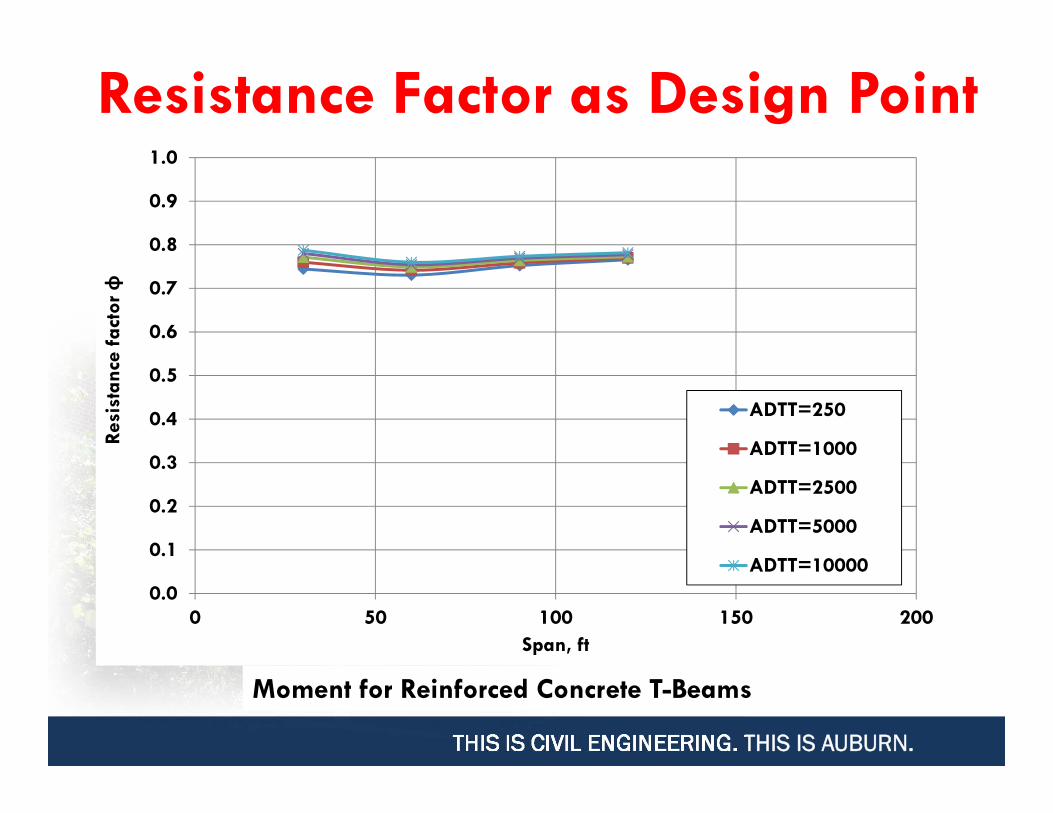
Resistance Factor as Design Point
Moment for Reinforced Concrete T-Beams
0.0
0.1
0.2
0.3
0.4
0.5
0.6
0.7
0.8
0.9
1.0
0 50 100 150 200
Resi
stan
ce f
acto
r φ
Span, ft
ADTT=250
ADTT=1000
ADTT=2500
ADTT=5000
ADTT=10000
THIS IS CIVIL ENGINEERING. THIS IS AUBURN.
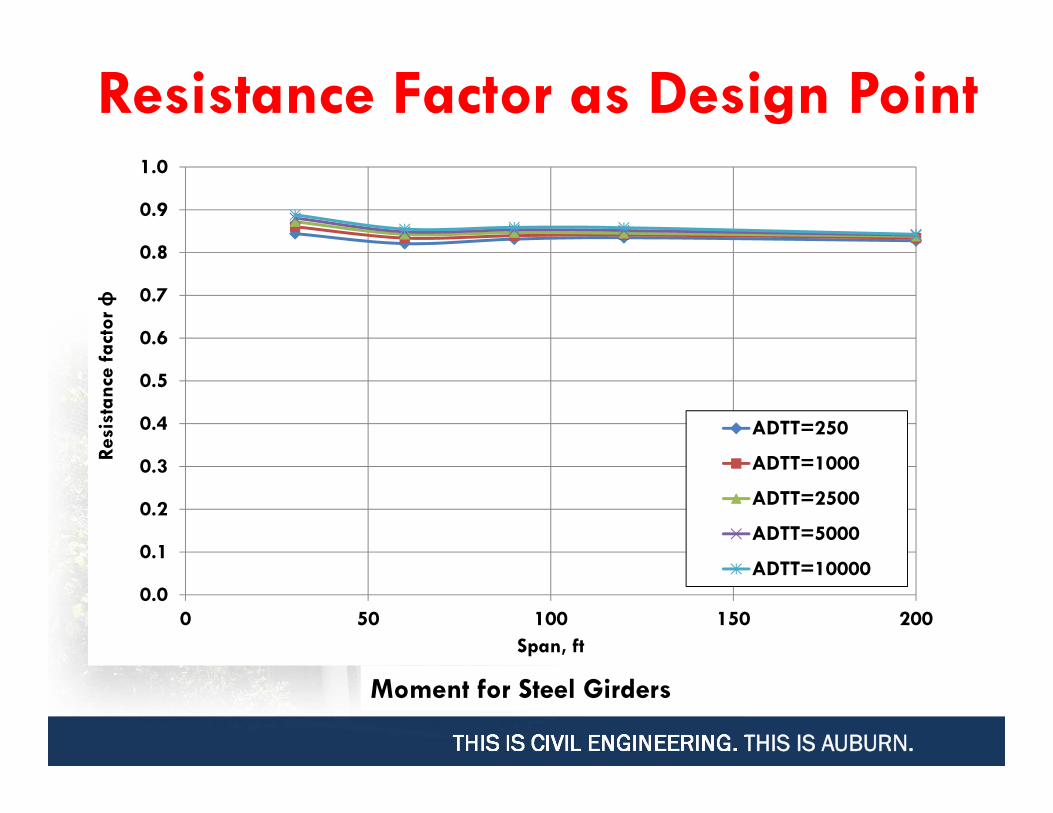
Resistance Factor as Design Point
Moment for Steel Girders
0.0
0.1
0.2
0.3
0.4
0.5
0.6
0.7
0.8
0.9
1.0
0 50 100 150 200
Resi
stan
ce f
acto
r φ
Span, ft
ADTT=250
ADTT=1000
ADTT=2500
ADTT=5000
ADTT=10000
THIS IS CIVIL ENGINEERING. THIS IS AUBURN.
Resistance Factor as Design Point
0.0
0.1
0.2
0.3
0.4
0.5
0.6
0.7
0.8
0.9
1.0
0 50 100 150 200
Resi
stan
ce f
acto
r φ
Span, ft
ADTT=250ADTT=1000ADTT=2500ADTT=5000ADTT=10000
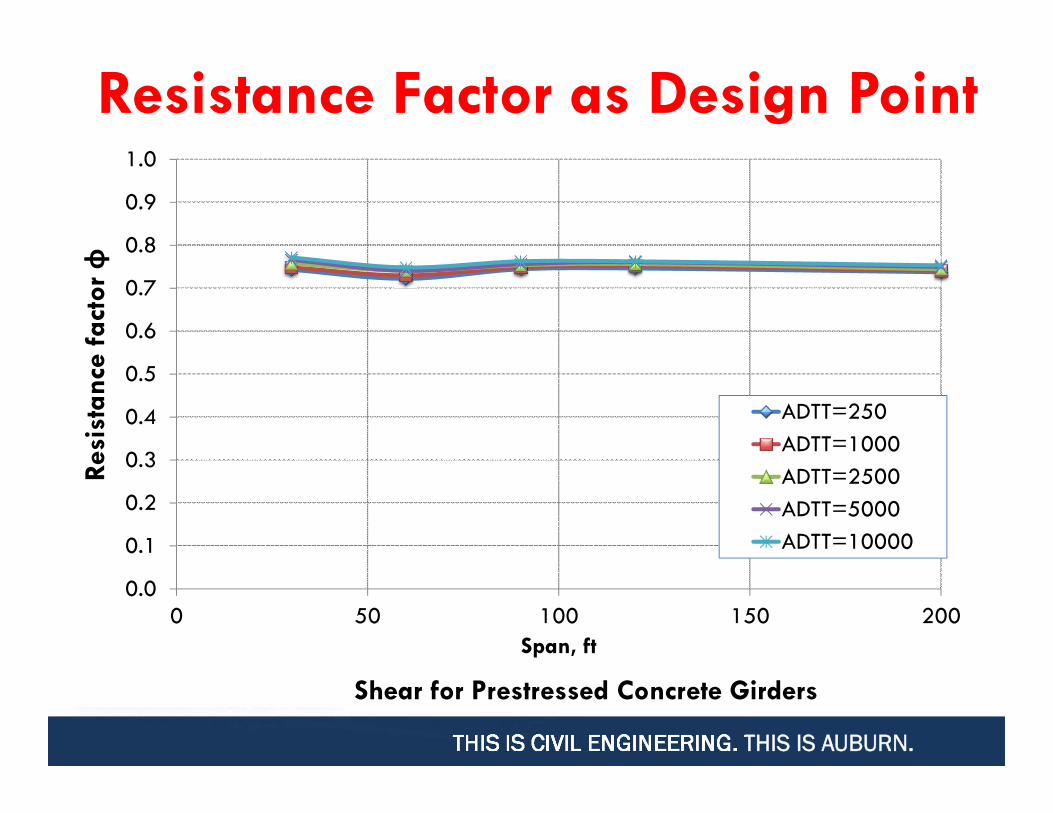
Shear for Prestressed Concrete Girders
THIS IS CIVIL ENGINEERING. THIS IS AUBURN.
Resistance Factor as Design Point
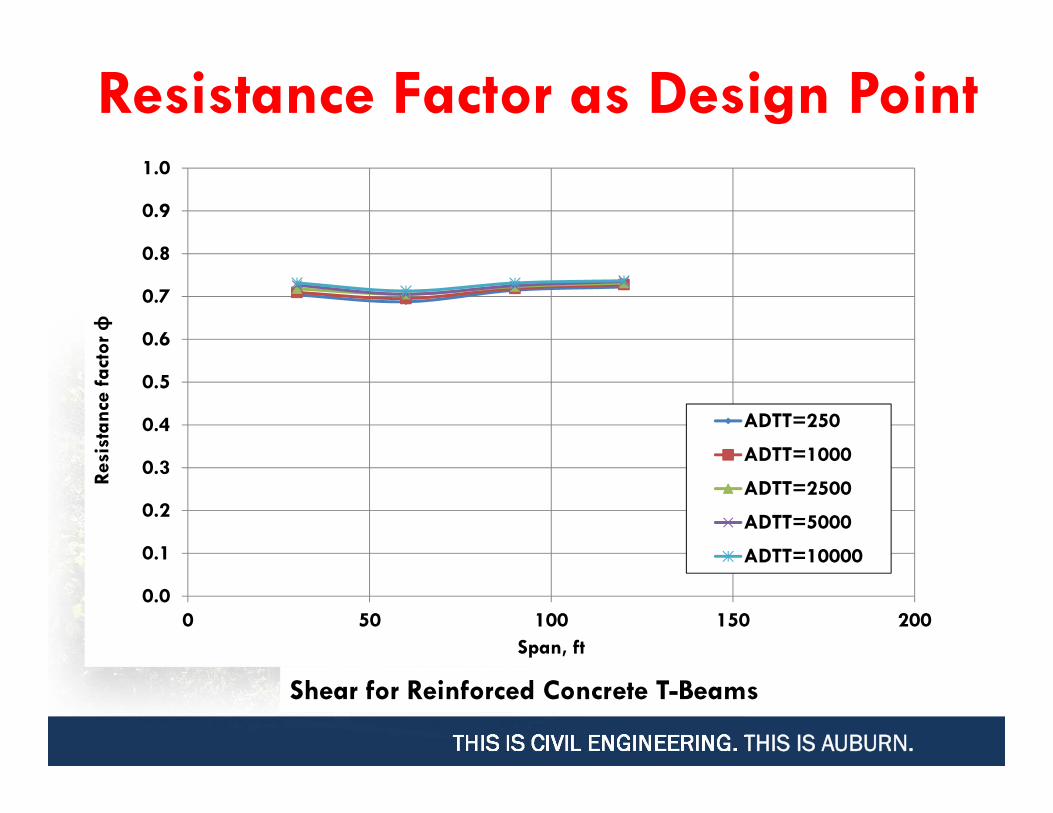
Shear for Reinforced Concrete T-Beams
0.0
0.1
0.2
0.3
0.4
0.5
0.6
0.7
0.8
0.9
1.0
0 50 100 150 200
Resi
stan
ce f
acto
r φ
Span, ft
ADTT=250
ADTT=1000
ADTT=2500
ADTT=5000
ADTT=10000
THIS IS CIVIL ENGINEERING. THIS IS AUBURN.
Resistance Factor as Design Point
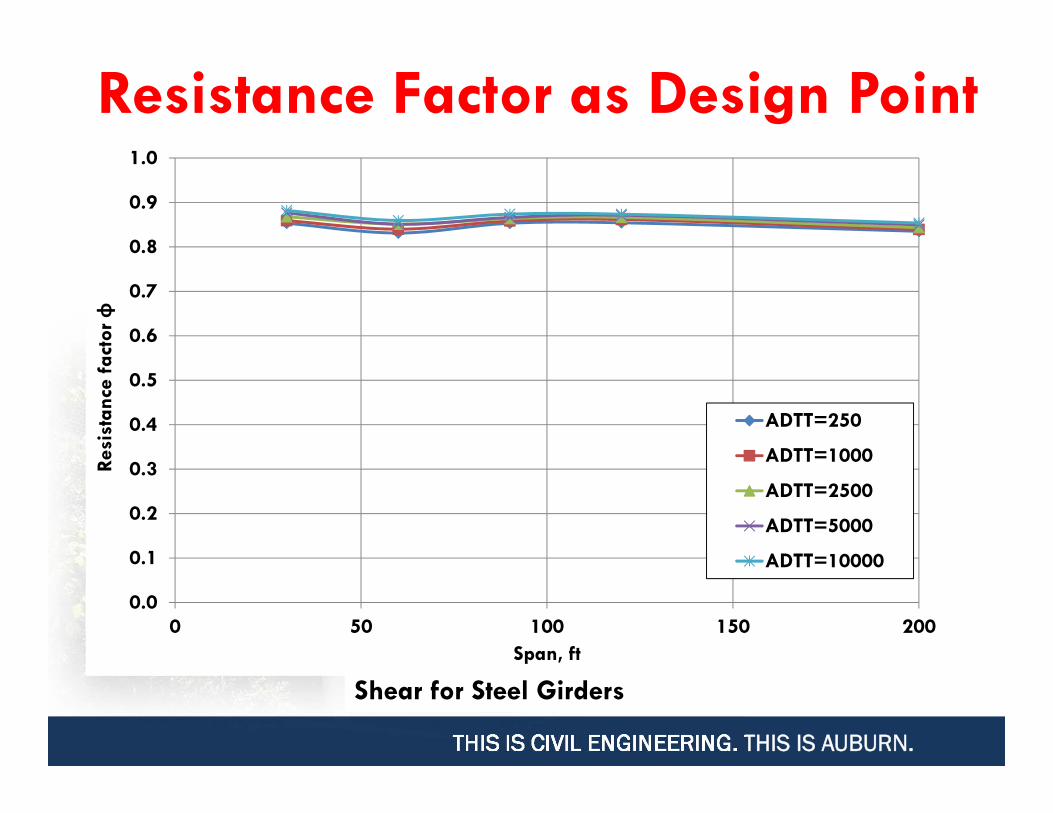
Shear for Steel Girders
0.0
0.1
0.2
0.3
0.4
0.5
0.6
0.7
0.8
0.9
1.0
0 50 100 150 200
Resi
stan
ce f
acto
r φ
Span, ft
ADTT=250
ADTT=1000
ADTT=2500
ADTT=5000
ADTT=10000
THIS IS CIVIL ENGINEERING. THIS IS AUBURN.
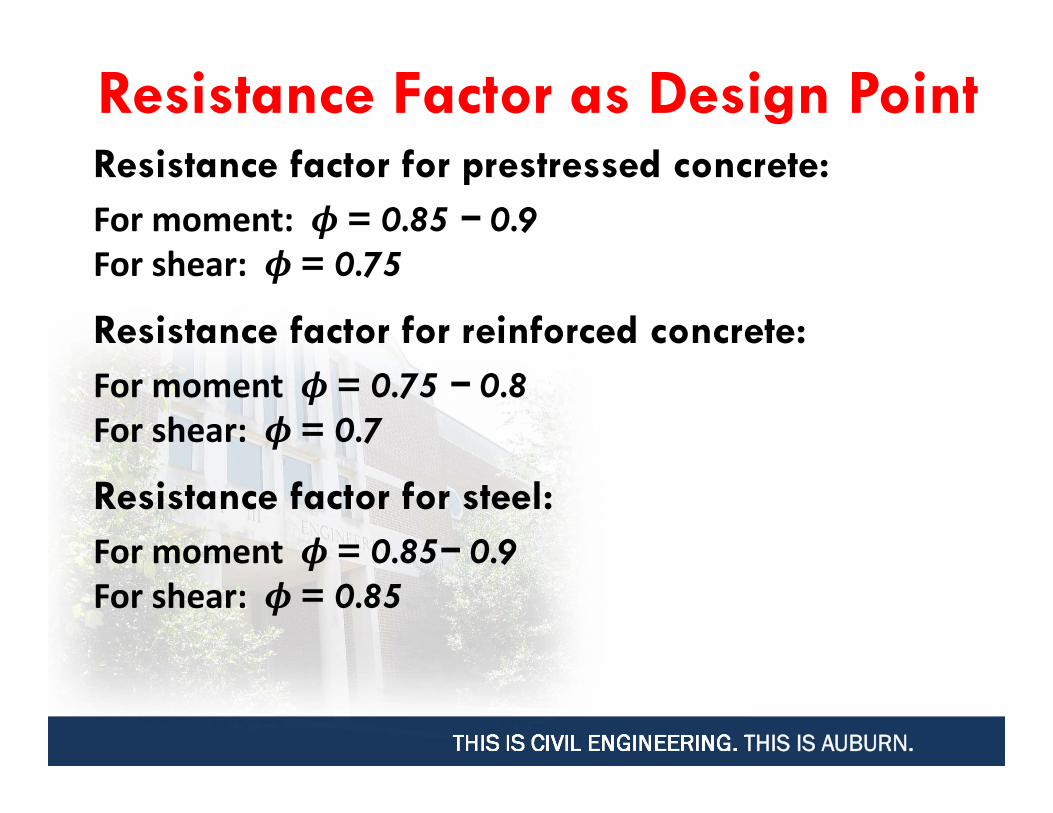
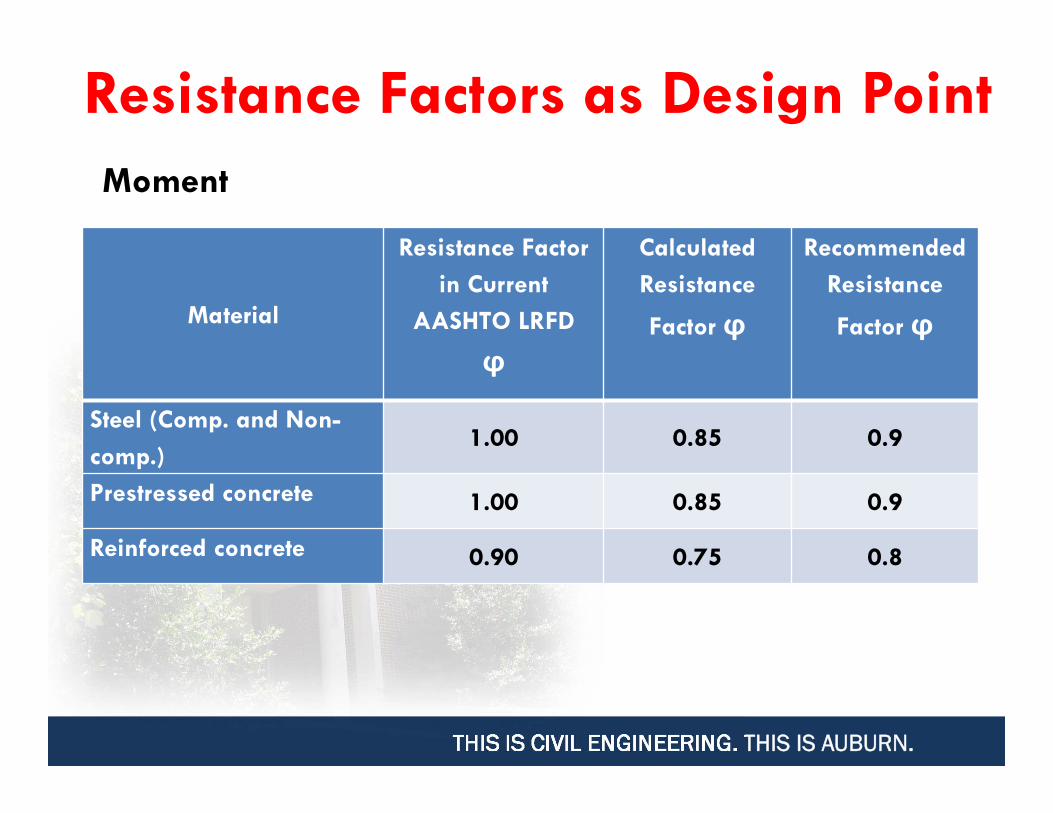
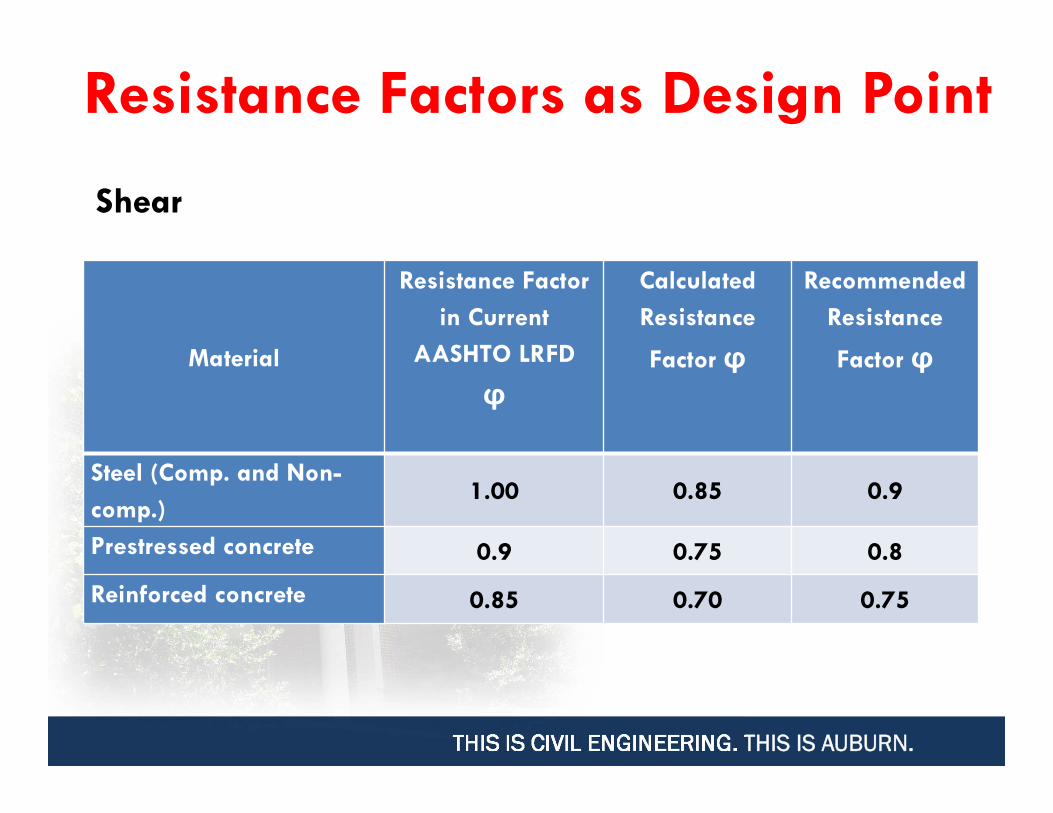
Resistance Factor as Design PointResistance factor for prestressed concrete: For moment: = 0.85 − 0.9 For shear: = 0.75
Resistance factor for reinforced concrete: For moment = 0.75 − 0.8 For shear: = 0.7
Resistance factor for steel: For moment = 0.85− 0.9 For shear: = 0.85
THIS IS CIVIL ENGINEERING. THIS IS AUBURN.
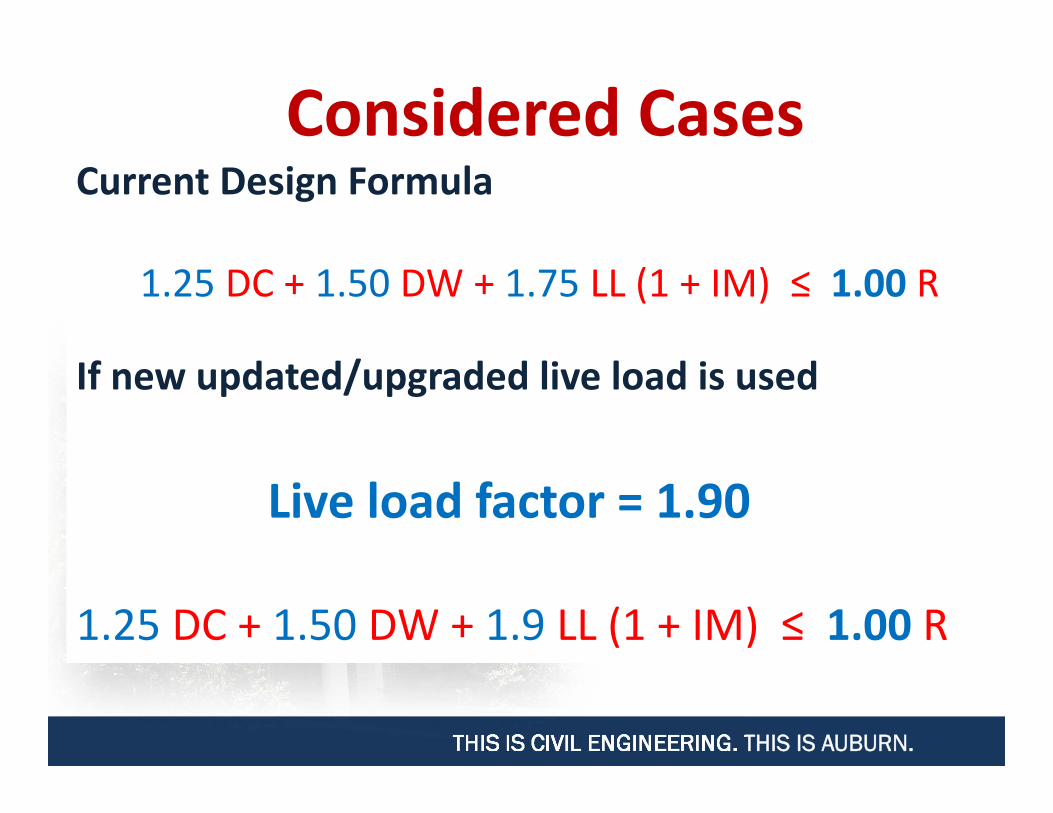
Considered CasesCurrent Design Formula
1.25 DC + 1.50 DW + 1.75 LL (1 + IM) ≤ 1.00 R
If new updated/upgraded live load is used
Live load factor = 1.90
1.25 DC + 1.50 DW + 1.9 LL (1 + IM) ≤ 1.00 R
THIS IS CIVIL ENGINEERING. THIS IS AUBURN.
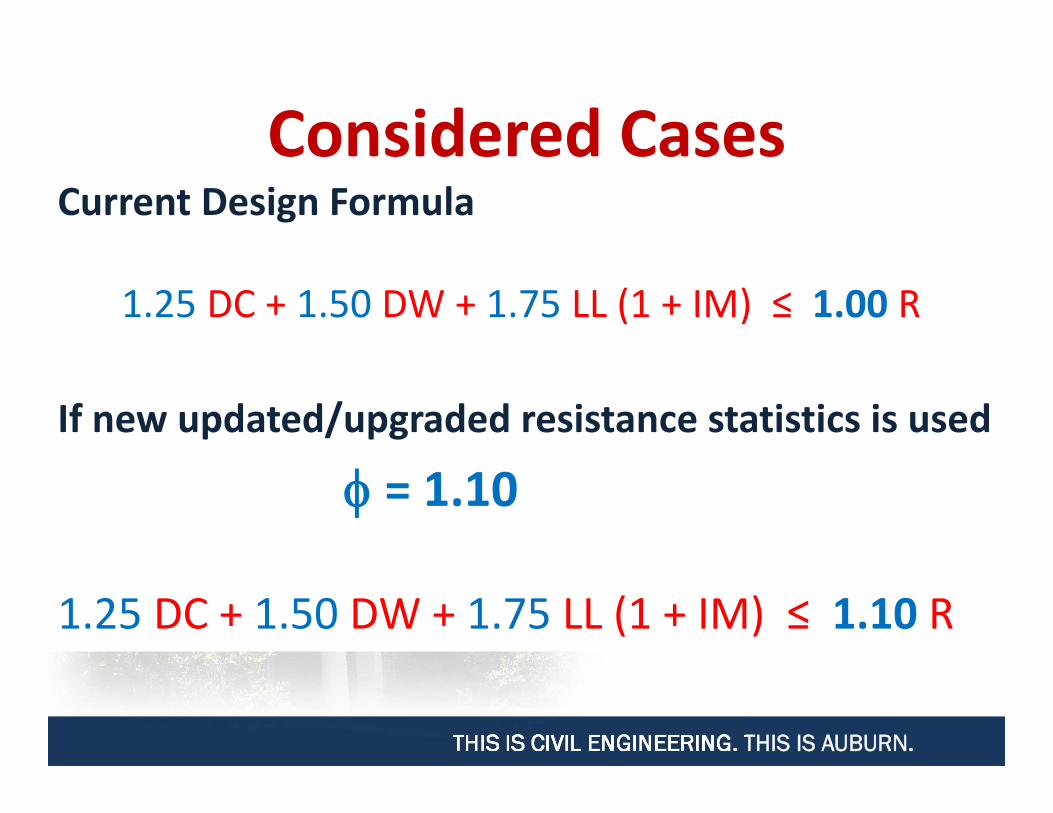
Considered CasesCurrent Design Formula
1.25 DC + 1.50 DW + 1.75 LL (1 + IM) ≤ 1.00 R
If new updated/upgraded resistance statistics is used
= 1.10
1.25 DC + 1.50 DW + 1.75 LL (1 + IM) ≤ 1.10 R
THIS IS CIVIL ENGINEERING. THIS IS AUBURN.
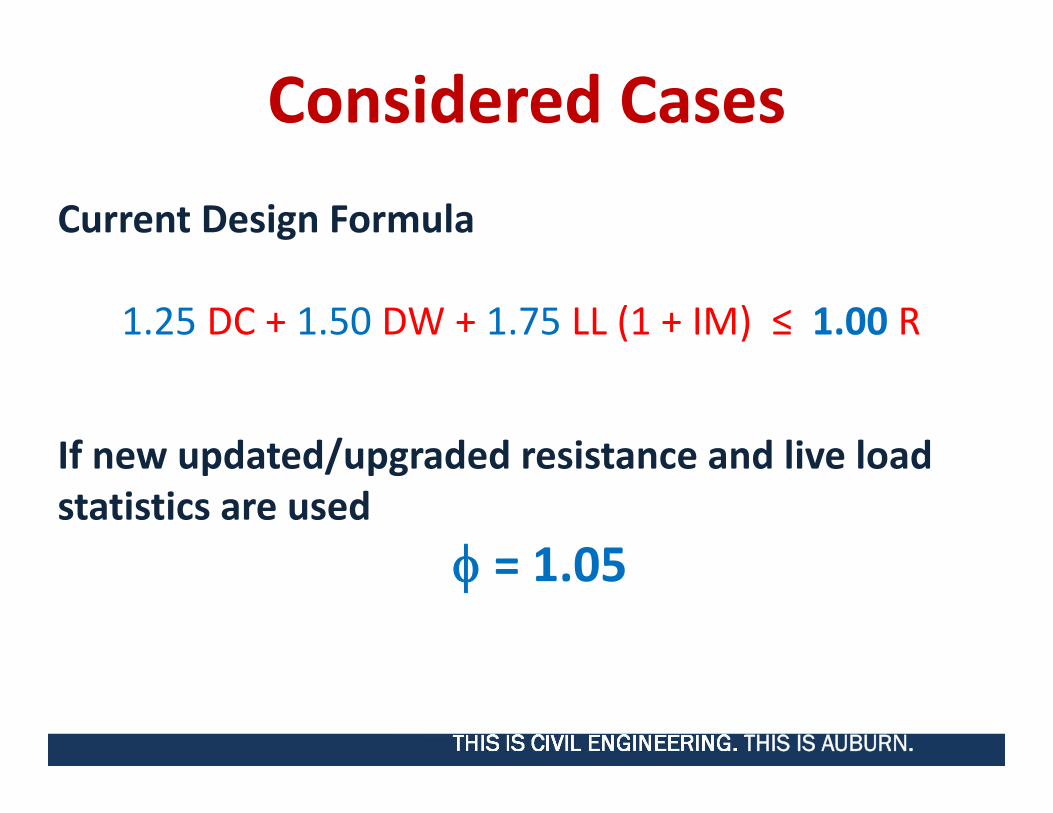
Considered CasesCurrent Design Formula
1.25 DC + 1.50 DW + 1.75 LL (1 + IM) ≤ 1.00 R
If new updated/upgraded resistance and live load statistics are used
= 1.05
THIS IS CIVIL ENGINEERING. THIS IS AUBURN.
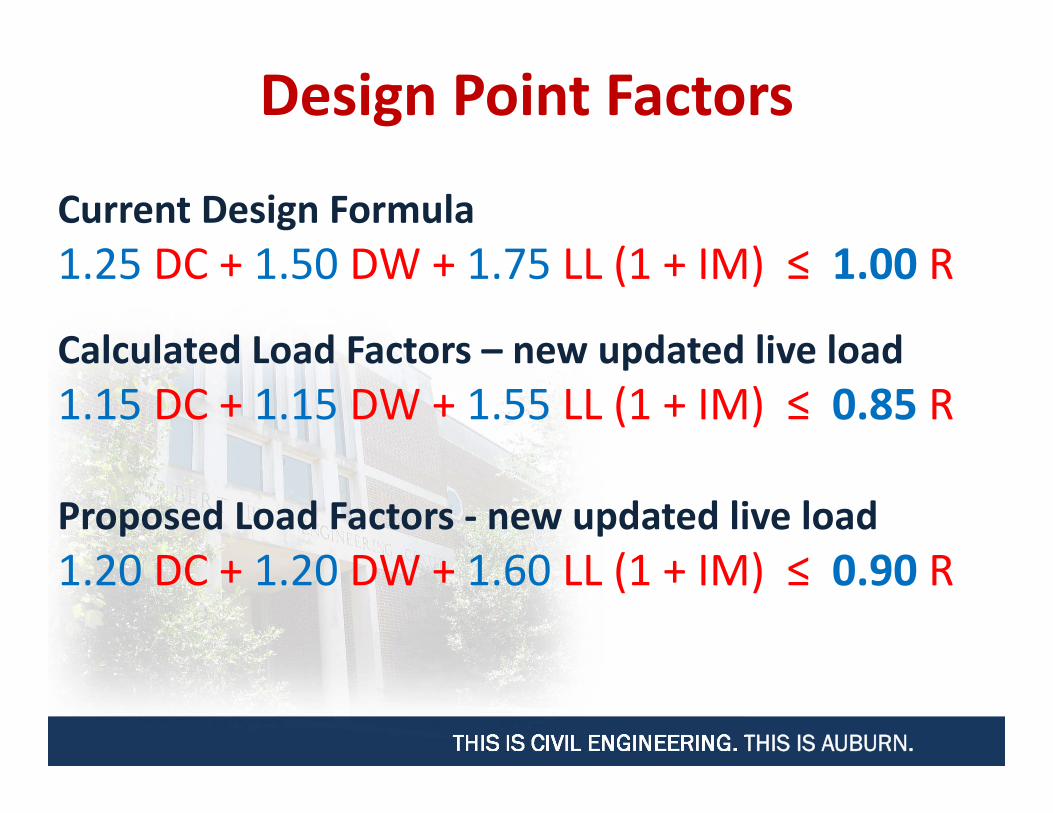
Design Point Factors
Current Design Formula1.25 DC + 1.50 DW + 1.75 LL (1 + IM) ≤ 1.00 R
Calculated Load Factors – new updated live load1.15 DC + 1.15 DW + 1.55 LL (1 + IM) ≤ 0.85 R
Proposed Load Factors ‐ new updated live load1.20 DC + 1.20 DW + 1.60 LL (1 + IM) ≤ 0.90 R
THIS IS CIVIL ENGINEERING. THIS IS AUBURN.
Resistance Factors as Design PointMoment
Material
Resistance Factor in Current
AASHTO LRFD
ϕ
Calculated Resistance
Factor ϕ
Recommended Resistance
Factor ϕ
Steel (Comp. and Non-comp.)
1.00 0.85 0.9
Prestressed concrete 1.00 0.85 0.9
Reinforced concrete 0.90 0.75 0.8
THIS IS CIVIL ENGINEERING. THIS IS AUBURN.
Resistance Factors as Design Point
Shear
Material
Resistance Factor in Current
AASHTO LRFD
ϕ
Calculated Resistance
Factor ϕ
Recommended Resistance
Factor ϕ
Steel (Comp. and Non-comp.)
1.00 0.85 0.9
Prestressed concrete 0.9 0.75 0.8
Reinforced concrete 0.85 0.70 0.75
THIS IS CIVIL ENGINEERING. THIS IS AUBURN.
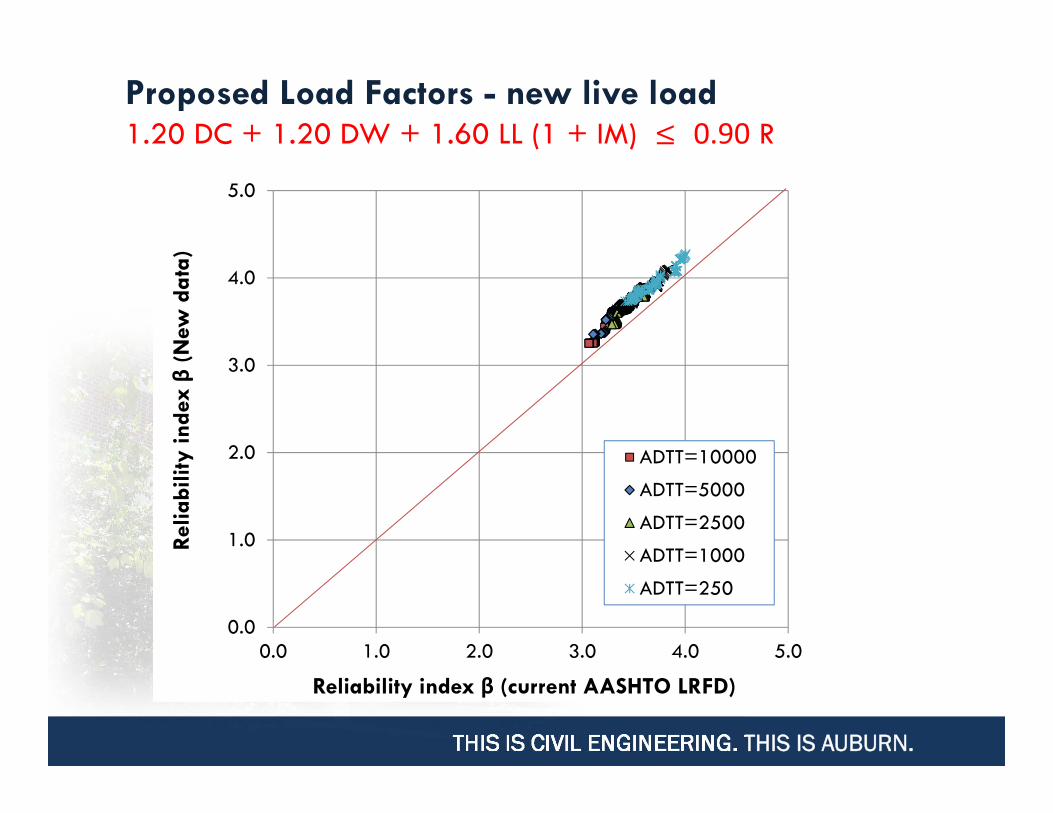
Proposed Load Factors - new live load1.20 DC + 1.20 DW + 1.60 LL (1 + IM) ≤ 0.90 R
0.0
1.0
2.0
3.0
4.0
5.0
0.0 1.0 2.0 3.0 4.0 5.0
Relia
bilit
y in
dex β
(New
dat
a)
Reliability index β (current AASHTO LRFD)
ADTT=10000
ADTT=5000
ADTT=2500
ADTT=1000
ADTT=250
THIS IS CIVIL ENGINEERING. THIS IS AUBURN.
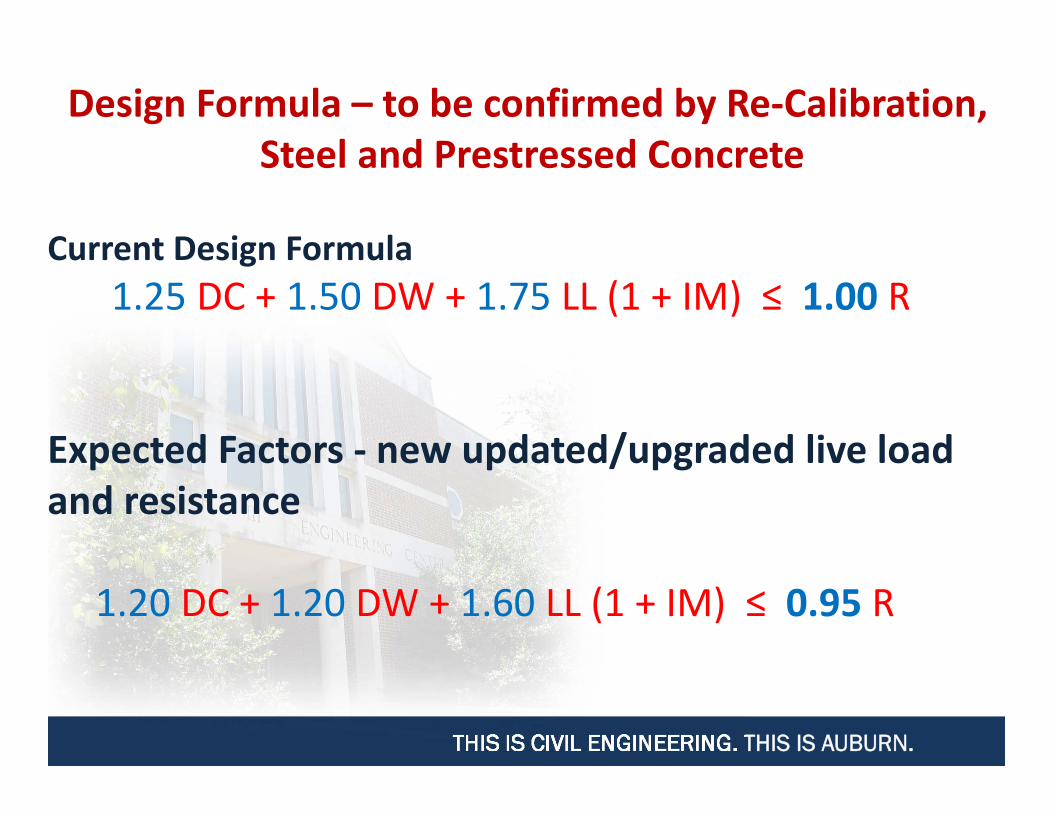
Current Design Formula1.25 DC + 1.50 DW + 1.75 LL (1 + IM) ≤ 1.00 R
Expected Factors ‐ new updated/upgraded live load and resistance
1.20 DC + 1.20 DW + 1.60 LL (1 + IM) ≤ 0.95 R
Design Formula – to be confirmed by Re‐Calibration,Steel and Prestressed Concrete
Related Documents