1 Project Report-Team 8 Advertisement Click-through Rate Prediction Qi Wang Linzhi Li Yadong Xu LiLi Yang

Welcome message from author
This document is posted to help you gain knowledge. Please leave a comment to let me know what you think about it! Share it to your friends and learn new things together.
Transcript

1
Project Report-Team 8
Advertisement Click-through
Rate Prediction
Qi Wang
Linzhi Li
Yadong Xu
LiLi Yang

2
Preface
This project is aimed to train a prediction model to forecast the click-through rate for
advertisements. A prediction and recommendation system will be implemented to predict the
CTRs of potential users, which in turn will recommend the suggested targeting users based on
the CTR predicted and the ideal CTR threshold. The excessive advertising to random users
extensively means a waste of resources, which might be even likely to make users have a
negative impression towards your products. Our prediction and recommendation system on the
basis of the click probability will make it possible that the advertisements only target at the users
who might be interested in the ads, thus maximizing the profit of the advertisers and saving the
excessive resource which is wasted on useless advertising. Meanwhile, the users only receive the
useful advertisements that have a relatively high possibility to attracts them, which is an efficient
and pleasant experience to see the display advertising while surfing the Internet. It is a win-win
procedure for both advertisers and users, and even for website platforms.
This project is to utilize the method and tools within data mining and machine learning field.
This project is made in fulfillment of the requirements in the course project of COEN 281 :
Pattern Recognition & Data Mining in Spring quarter, 2017, under the guidance and support of
Prof. Ming-Hwa Wang.

3
Acknowledgements
We would like to thank Alibaba teams for collecting and sharing the information anonymously.
Without their efforts, this project would not be possible. We would like to express our sincere
gratitude to Prof. Ming-Hwa Wang. It is his tremendous encouragement and support that makes
this project materialized. We especially would like to take this as an opportunity to thank the
support received from all the other people who have been instrumental in the successful
complication of this project.

4
Table of Contents Preface............................................................................................................................................. 2
Acknowledgements ......................................................................................................................... 3
Abstract ......................................................................................................................................... 10
1. Introduction ............................................................................................................................... 11
1.1 Objective ............................................................................................................................. 11
1.2 What is the problem ............................................................................................................ 12
1.3 Why is this a project related the this class .......................................................................... 15
1.4 Why other approach is inadequate ...................................................................................... 16
1.5 Why you think your approach is better ............................................................................... 16
1.6 Statement of the problem .................................................................................................... 17
1.7 Area or scope of investigation ............................................................................................ 17
2. Theoretical bases and literature review..................................................................................... 19
2.1 Definition of the problem.................................................................................................... 19
2.2 Theoretical background of the problem .............................................................................. 19
2.3 Related research to solve the problem and their advantages/disadvantages ....................... 20
2.4 Your solution to solve this problem ................................................................................... 37
2.5 Where your solution different from others ........................................................................ 37
2.6 Why your solution is better ................................................................................................ 38
3. Hypothesis and Goals ............................................................................................................... 39
3.1 Multiple Hypothesis ............................................................................................................ 39
3.2 Positive/Negative Hypothesis ............................................................................................. 39
4. Methodology ............................................................................................................................. 41
4.1 How to generate/collect input data ..................................................................................... 41

5
4.1.1 Data Resource .............................................................................................................. 41
4.1.2 Feature Engineering ..................................................................................................... 41
4.1.3 One-Hot Encoding ....................................................................................................... 44
4.2 How to solve the problem ................................................................................................... 45
4.2.1 Algorithm design ......................................................................................................... 45
4.2.2 Language used ............................................................................................................. 47
4.2.3 Tools used .................................................................................................................... 48
4.3 How to generate output ....................................................................................................... 48
4.4 How to test against hypothesis ............................................................................................ 48
4.5 How to proof correctness .................................................................................................... 49
5. Implementation ......................................................................................................................... 51
5.1 Design document and flowchart ..................................................................................... 51
5.1.1 Data Input..................................................................................................................... 53
5.1.2 Data Cleaning............................................................................................................... 53
5.1.3 Model Training ............................................................................................................ 54
5.1.4 Ad CTR Prediction ...................................................................................................... 56
5.1.5 Target Users Recommendation ................................................................................... 58
5.1.6 Front-end development ................................................................................................ 59
5.2 Code Implementation .......................................................................................................... 67
6. data analysis and discussion...................................................................................................... 68
6.1 Output generation................................................................................................................ 68
6.2 Output analysis.................................................................................................................... 68
6.3 Compare output against hypothesis .................................................................................... 69

6
6.4 Abnormal case explanation (the most important task if you have it) ................................. 71
6.5 Discussion ........................................................................................................................... 72
7. conclusions and recommendations ........................................................................................... 73
7.1 Summary and Conclusions ................................................................................................. 73
7.2 Recommendations for future studies .................................................................................. 74
8. Bibliography ............................................................................................................................. 76
9. Appendices ................................................................................................................................ 79
9.1program source code with documentation ........................................................................... 79
9.1.1 Code for Data Cleaning ............................................................................................... 79
9.1.2 Code for Model Training and Recommendation ......................................................... 82
9.1.3 Code for Front End Development ................................................................................ 98
9.2 input/output listing ............................................................................................................ 108
7
List of Tables
Table 1 term and related term results....................................................................................... 26
Table 2 ad quality results ........................................................................................................... 26
Table 3 order specificity results ................................................................................................. 27
Table 4 search engine data results ............................................................................................. 27
Table 5 dataset............................................................................................................................ 42
Table 6 average CTR rate of a certain industries .................................................................... 58

8
List of Figures
Figure 1 four in one system .......................................................................................................... 12
Figure 2 a) the distribution of similarity between selected pairs of users (red) the IM graph and
(black dashed) users paired randomly; (b) reach-CTR plots comparing the addition of random
users and a user’s friends. ............................................................................................................. 22
Figure 3 CTR of users with friends who clicked in the past. ........................................................ 22
Figure 4 the CTR of an advertisement typically decreases with lower positioned ads ................ 24
Figure 5 eye scan activity on search results page[5]..................................................................... 25
Figure 6 (a) the user graph of GCM with continuous random variables Ri, Ai, Bi (b) the
Bayesian network of GCM. .......................................................................................................... 28
Figure 7 the log-likelihood of different models on the advertisement dataset with different query
frequencies[1] ............................................................................................................................... 29
Figure 8 (a) Actual vs predicted CTR for GCM and DBN (b) Actual vs predicted CTR for
cascade and CCM[1] ..................................................................................................................... 29
Figure 9 comparisons of the predicted and actual CTR with different local hours on the
advertisement dataset. ................................................................................................................... 30
Figure 10 heat map of interaction of feature ................................................................................. 31
Figure 11 implementation of FwFM in TensorFlow .................................................................... 32
Figure 12 comparison among different model .............................................................................. 33
Figure 13 a 4-layer FNN model structure ..................................................................................... 35
Figure 14 relationship between each layer in PNN algorithm ...................................................... 36
Figure 15 differences between Inner Product Operation and Outer Product Operation ............... 36
Figure 16 Simple One-Hot encoding example.............................................................................. 45
Figure 17 the architecture of FM .................................................................................................. 46
Figure 18 the architecture of DNN ............................................................................................... 47
Figure 19 ROC example ............................................................................................................... 49
Figure 20 three types of AUC ....................................................................................................... 50
Figure 21 Prediction Model Training and Recommendation System Development Process ....... 51

9
Figure 22 CTR Prediction Model and Target Users Recommendation System Working
FlowChart ..................................................................................................................................... 52
Figure 23 Homepage .................................................................................................................... 60
Figure 24 Advertiser Home Page .................................................................................................. 61
Figure 25 Advertising Platform Home Page ................................................................................. 62
Figure 26 A single page about what we did .................................................................................. 63
Figure 27 Contact Page ................................................................................................................. 64
Figure 28 Results .......................................................................................................................... 65
Figure 29 ROC curve for partial data ........................................................................................... 69
10
Abstract
A advertisement click-through rate prediction and recommendation system is proposed in this
document. The system is composed of three main part: data cleaning, prediction model training
and front end recommendation system designing. One-hot approach is used to catch the useful
features of the user data and advertisement data. After that, cleaned data is used to training the
prediction model. In order to achieve as much as higher prediction accuracy, DeepFM algorithm
is used after doing many literature review and comparison. Finally, a front end system is
designed for advertiser and advertising platform to use. The system not only predicts the CTR of
a certain advertisement for advertiser but also offer the information and percentage of the target
user whose predicted CTR is higher than the threshold to advertiser.
The document describe the design procedure in details, including introduction, theoretical and
literature review, hypothesis and goals of the system, methodology and concrete implementation
of the predicted system and the result analysis and future scope of the projects.

11
1. Introduction
1.1 Objective
The project is aimed to design a prediction system to predict the click-through rate of a certain
advertisement. An appropriate algorithm and predicted model will be used in the project. The
system will be used by the advertiser to know the probability of the user clicking the
advertisement and then make a decision of whether putting the advertisement on the certain
website. Furthermore, the project will recommend the user whose predicted click rate is equal or
higher than one certain threshold to the advertiser. This operation not only can let the advertiser
get the profit maximization but also let the website reduce the useless advertisement by avoid
recommending the advertisement with low CTR to someone users which will bring a better user
experience to the users.
There are various advertisements in our daily life, some of them is useful and attractive to us,
while other are useless for us and we will never click them. From the perspective of the user, it is
disgusting that receiving many useless advertisement when surfing on the Internet. From the
perspective of the advertiser, it is depressed that the given advertisement is not attractive and
receive a extreme low click rate. Taking the above two aspects into consideration, our project is
aimed to minimize the occurrence of these situation and achieve a win-win outcome.

12
1.2 What is the problem
Figure 1 four in one system
In a normal Internet advertising environment, the relationship between websites, advertisers,
users and advertising center is a bidirectional relationship. They cooperate with each other, but
also intensely compete with each other. Websites attract users and provide advertising spaces.
Advertisers provide advertisement and pay for it. Advertising center allocate advertising space to
advertisement according to certain rules, and collect fees, and share with websites. Users browse
and click the ad. This 4 in 1 system is the reason why most of websites and servers are free, and
how tech companies (like Google, Facebook) earn money.
It is obviously, in this system, that advertisers play the important role. Therefore, how to make
advertising more effective and greater propaganda became a hot topic now. It also spawned a
new sub-discipline, computational advertising. We can say computational advertising is a very
narrow area under machine learning. However, as it generates huge profits every year, this
discipline has become very popular. Now computational advertising already has become frequent
visitor to many academic conferences in computer science field as well as economic field.
We can simply separate computational advertising as display ads and search ads.
13
A display ad is an internet advertisement that appears as a picture or video, when a user browses
a website. Its main purpose is brand promotion rather than directly facilitating transactions. This
is because when users are browsing websites, usually they do not have a clear and specific
purchase intention. It is not easy to stimulate their purchase desire. Hence, usually, display
advertising comes with bright colors, lively pictures. It will attract the attention of the users and
give them a certain impression. According to the current industry standards, as long as the
advertising platform has performed an advertisement for a certain number of times, the advertiser
will pay for a corresponding fee. This model is commonly referred as a CPM model.
A search ad is when users use search engines searching certain things, what advertisements they
saw on the results pages. Search ads usually displayed in a similar format as search results,
including headers, descriptions and hyperlinks. With the development of technology, search
results have become more pluralistic. The form of search advertising is usually enriched with
pictures, videos. Unlike the display ads, users usually have a clearer intention to purchase
something when search on searching engine. And these intentions are usually veiled through
query keywords. In order to precisely match the users’ search intention, advertisers have to
submit keywords that they want to bid in advanced and the highest fees they are willing to pay.
According to industry standard practice, the ad platform charges the advertiser only when the
user clicked on an ad. This is CPC model.
In this proposal, we are going to mainly discuss search ads. The most popular charging model in
search advertising is the click charging model, so accurately click forecasting plays a crucial role
in advertising platform. This model often be called CTR.
Machine learning is the core of CTR, because the purpose of machine learning is prediction.
However, as we all know, algorithms can only process abstract and elegant objects/data. In real
life, our tasks are concrete, so our data are full of defects and noises. How to use abstract
algorithms to solve concrete problems is the main question among all. Usually, we have two
ways to predict in Machine Learning, regression and classification. Regression often is used to

14
handle classifying objects, like human faces, tables, bicycles. Classification is more likely to deal
with numbers.
CTR is typically modeled as a classification problem. Given a user’s query terms, advertisements,
user information and other contextual information. It predicts whether a click will occur.
This problem seems simple, but it is actually very complicated. The data of which ad user
clicked are rare. Even high-quality advertisements only have few percent click rate. For such
data, if the training set sample is unreasonable, or not so good, we lost many important
information, which will lead to model invalidation. Currently, the only effective feature of click
prediction is its historical click behavior. However, although this is a valid feature, is has brought
many challenges to CTR prediction. If you rely too heavily on historical click behavior, it will
bring a lot trouble. For those ads that have not been shown to users in history, even if they are
high-quality ads themselves, or maybe they are too new, or not displayed due to mistakes in the
previously used click model, these new ads will not have opportunities to show to users in the
future. Thus, this will form a vicious circle and the CTR prediction model will not be improved
by training. And CTR prediction model will gradually consolidate the prediction results into a
small number of appeared data.
In order to solve this problem, we need to use online learning to achieve the balance of
exploration and utilization. There has been a lot of useful work in this area, but there is still much
room for development. For example, when doing online learning, user behavior is often regarded
as a “random environment” and the characteristics of the user’s click are understood through
exploration. However, this method ignores the change of the CTR prediction model, which will
also lead to change in the ordering of advertisements. Thus, this will affect the advertisers' profits,
prompt advertisers to change keywords and their bids, and even change the way advertisements
are written. These changes in turn will affect the click prediction model itself, which affects the
revenue of the advertising platform. Therefore, an ideal online learning method should detect
user click behavior and advertiser behavior at the same time.

15
1.3 Why is this a project related the this class
The project focus on processing history big data and training a prediction model to predict the ad
click-through rates(CTR), which not only comes down to data mining but also is related to
machine learning areas. As we all know, digital advertisement is a multi-millions industry in the
recently years, so click prediction model are central to most online advertising systems. How can
the users’ purchase history be related to the advertisement click prediction? The most intuitive
thought is that if someone purchase certain type of items more frequently, they are more likely to
click the related advertisements shown in the website. Considering that more and more online
advertisement systems allows advertisers to only bid and pay for measurable user responses,
such as click on advertisements, so how to predict the click rate of certain advertisement
accurately by analyzing user’s purchase record data is the most important point in this project.
Firstly, about the data mining, the project will preprocess the massive data and extract the some
useful features from these data. In order to obtain an relative optimal approach, various material
and approaches used to extract features from user’s type behaviors, such as ipv for browsing, cart
for adding to shopping cart, fav for favor, buy for buying this item, will be compared and then
their advantages and disadvantages will be carefully discussed. After determining the useful
features, a real-world advertising dataset collect from taobao users by Alibaba will be analyzed
and be used to extract useful features. Then the output of the extracting process will be used to
train the advertisement click prediction model.
Secondly, about the machine learning, one appropriate algorithm will be used to form a suitable
prediction model. There are many parameters should be determined, such as the number of the
hidden layers, format of the input data, values of various parameters of the model and so on. The
useful features extracted from the extracting process will be used as the training data then to
determine the most suitable values of these parameters. Each training data will go through the
prediction model one by one and then get their prediction result. After that, the prediction result
and actual CTR will be compared and the parameter of the prediction model will be adjusted
according to the deviation between them. After the prediction model is trained, it will be used to

16
test some certain input data then obtain a total prediction error rate of the prediction model. If the
accuracy of the prediction model is higher than other similar approaches, it demonstrates that the
algorithm and the model we choose can be used in our real life. Otherwise, we will try other
algorithm which maybe be more suitable for advertisement click rate and go through the training
and testing process on more time.
In a word, the above analysis shows that our project has a tight relationship with the knowledge
point of the data mining and pattern recognition and has a very practical significance for the
development of data mining area.
1.4 Why other approach is inadequate
Almost other approaches are just aimed to do the click-through rate prediction of the
advertisement. Without practical applications, they cannot be used widely in the real-word. Also,
many approaches used some complex algorithms to achieve the prediction function, so they need
many time and many computer resource to get the prediction job done which means they are not
practical enough to be used in the industrial circles. On the other hand, the complex algorithms
and prediction models are hard to people to understand and follow which means they are not
easier to do some improvement to them.
1.5 Why you think your approach is better
Our approach is a combination of prediction and recommendation model, which is easily to be
applied in the industry area. The prediction of CTR is for the purpose of advertising more
efficiently and effectively. Thus, the combination of prediction and recommendation is more
practical. Additionally, the data source of our model is online shopping behavior and browsing
record, which is easy to access because the website platform could provide it if advertiser would
like to advertise on this platform.
17
1.6 Statement of the problem
The CTR prediction system was firstly invented by Google and used in its search advertising
system. After noticed how much profits this business brought to Google, other companies start to
join the market and share the big cake. And the ultimate example is Facebook. Several years ago,
Facebook is about to bankrupt. Their revenue is lower and lower by quarter. However, with the
advertising system, they somehow revived now. Except this, more and more big and small
companies claimed that they have mastered the precise advertising target based on artificial
intelligence. In fact, most of them talked about is CTR. And the application of CTR prediction
also expanded from the initial search engine to display advertisements, recommendation
advertisements.
1.7 Area or scope of investigation
This project is aimed to train a prediction model to forecast the click-through rate for
advertisements. A prediction and recommendation system will be implemented to predict the
CTRs of potential users, which in turn will recommend the suggested targeting users based on
the CTR predicted and the ideal CTR threshold.
In this project, the personal history behavior data in real-world is utilized to train and test the
prediction and recommendation system. The data is collected from Taobao users from Alibaba,
which is consisted of random users from the website of Taobao during consecutive days. The
whole raw data cons contains advertising information, user profile information, user behavior
logs and advertising clicking information.
This project is about extracting key features from the known large scale database, and use these
key features to predict the future tendency. Thus, the method and tools within data mining and
machine learning field will be utilized. The primary algorithm applied in this project is DeepFM,
which we regarded as the most suitable algorithm for our Model, in terms of our purpose and
data composition.

18
This project is made in fulfillment of the requirements in the course project of COEN 281 :
Pattern Recognition & Data Mining in Spring quarter, 2017, with the guidance and support of
Prof. Ming-Hwa Wang.

19
2. Theoretical bases and literature review
2.1 Definition of the problem
The "click forecasting" of ads is a very important technology module. Many search engines
apply relevant technologies on search to click predictions and use relevance and historical click
information to predict future click behavior. However, they have overlooked an important issue,
that is, there are essential differences between online search and advertising. In the network
search, the user actively submits a request for the purpose of finding relevant information.
Therefore, as long as the information provided by the search engine is related to the request, the
user is willing to view and click. However, few users actively "search" ads on search engines,
and they are more passive in accepting recommendations. In this case, relevance is no longer the
dominant factor in user clicks, and whether an advertisement can attract the user's attention and
ultimately motivate their purchase desire is the key. This involves the category of advertising
psychology. Only by understanding and satisfying the psychological needs of users can they
effectively stimulate their click and purchase willingness. For example, some users are
particularly fond of various offers provided by sellers, and some hope that goods will have
quality and return guarantees, some hope good after-sales services, and some require high quality
and high quality. For different users, the same advertising strategy (such as advertising words
and presentation methods) clearly does not apply. A better way is to do psychological modeling
for each user, and then vote for it, placing ads that best meet the user’s psychological needs and
their presentation. However, modeling the user's psychology is more challenging than modeling
the user's age, income, and hobbies, and requires in-depth research and support.
2.2 Theoretical background of the problem
The theoretical we are going to use is commonly accepted by industry. There are based on
logistic regression, LR, factorization machine, FFM, PNN and DeepFM. The simplest and
wildest used model in industry is logistic regression. This algorithm is easy to modify value, the
result is arrange from 0 to 1 and because the model is simple, it can be updated more frequently.

20
Then, LR is also simply and effective, but the disadvantage of LR is also obviously. It is too
simply. The characteristics in internal space are depended with each other. They have no
relationship with each other. This is not correspond to facts. PLOY2 uses binomial formulas to
build the model, but in real environment, data are usually sparse. If we apply these binomial
formulas to these sparse data, we will get 0 in the end. Therefore, we imported factorization
machine. FFM stands for field-aware factorization machine. It added field information to the
former machine.Online advertisement is a multi-billion industry in the recently years. Most
website just ask the advertiser to pay the fee only when the advertisement is clicked. In order to
achieve win-win outcome for both advertising platform and advertiser, how to accurately predict
the click-through rate become more and more significant advertising systems. If a certain
advertising platform has more users, it will become more attractive for advertiser to let them
decide to put the advertisement into this platform because all of the advertiser hope their
advertisement will be noticed by more and more users. On the other hand, we consider that if a
certain user have bought some items in the past, they are more likely to be interested in the
similar or related items. So the target customer of the advertisement will be determined after we
extract the certain features from all of the users. In the recent years, there are many researcher
and approaches are proposed to solve and improve the click-through rate prediction of the
advertisement, but there still be many aspects that should be improved and get done, so the
project we plan to do is meaningful in the advertising field.
2.3 Related research to solve the problem and their advantages/disadvantages
In order to accomplish this project better, we did some research in the relevant field. There have
been a lot of research carried out in developing the prediction models using data mining and
machine learning for click-through rate forecast. This part talks about the researches which
inspires us the most.
1) Combining Behavioral and Social Network Data for Online Advertising

21
Yahoo group conducted a research about combining behavioral and social network data for
online advertising (A. Bagherjeiran, 2008). In this paper, they discovered the relationship
between personal user behavior and the clicking behavior of their friends on social networks. It
turns out that the possibility of a user to click ads is highly correlated with his/her friends’ click
behavior.
It can be observed from Figure 2 (a) that friends are likely to see similar ads. It is also
demonstrated in Figure 2 (a) that users without any social positioning method have similar
enough behavior that they can use similar ads for targeting. Compared to analyzing the targeting
users only, adding either their friends or random users will reduce the CTR versus targeting users
only for a given reach. And the CTRs for adding friends is higher than adding random
users.(shown in Figure 2 (b)) Figure 3 shows that if a user have friends who clicked the ads in
the past, it means the possibility that this user will click the same ad in the future will increase.(A.
Bagherjeiran, 2008)
These can be partially attributed to the face that people usually declare their interests on social
networking sites. (A. Bagherjeiran, 2008) Thus, the mutual interests can be found through the
social connections. Moreover, people with the same interests are likely to be friends and they
like to share interests with their friends in return. Therefore, the social networking sites render us
an opportunity to take an insight into a user’s interests.

22
(a) (b)
Figure 2 a) the distribution of similarity between selected pairs of users (red) the IM graph and
(black dashed) users paired randomly; (b) reach-CTR plots comparing the addition of random
users and a user’s friends.
Figure 3 CTR of users with friends who clicked in the past.
Unlike other researches, this paper discovered the relationship between personal user behavior
and the behavior of their friends on social networks, instead of just merely focusing on the user’s
own past behavior. This research is valuable because it takes the social networking into account
23
when predicting the advertisement CTR. It provides us a new perspective when considering the
CTR impact factors if CTR prediction is needed.
However, predicting CTR based on the targeting user’s friends on social networking sites has its
own limitations. The accuracy of this method is highly depend on which social networking sites
that is used to find users’ friends. Twitter could be a good source for the social connection define,
because lots of the friends relationship on Twitter is highly related to their interests. Not all the
social connections on social networking sites are highly mutual-interest-friends-based. For
example, a large portion of friends on Facebook are the people you know in real life, instead of
the friends who share the same interest. They might be your classmate, relatives, and even people
you just came across in campus and talks for a few minutes. Take LinkedIn as another example,
LinkedIn friends are almost from workplace or alumni. The portion of friends can not reveal the
same interest, so the CTR prediction from these people is not persuasive enough, unless your
advertise is about education, career or other specific industry which has something to do with
your social connection types.
2) Predicting Clicks: Estimating the Click-Through Rate for New Ads
The main task for search advertising system is to solve two problem. First, which advertisement
should be displayed. Second, in what order should these advertisements be displayed. However,
the number of advertisements which are on the waiting list to be displayed are much more than
the number of advertisements which were already displayed. And the CTR will also decrease
with the position of advertisement lower.
For example, when we use Google, a normal user will not go to the second page of Google
search result page. Even on the first page, the CTR is also decreased. This means the lower the
position, the less important the advertisement.
24
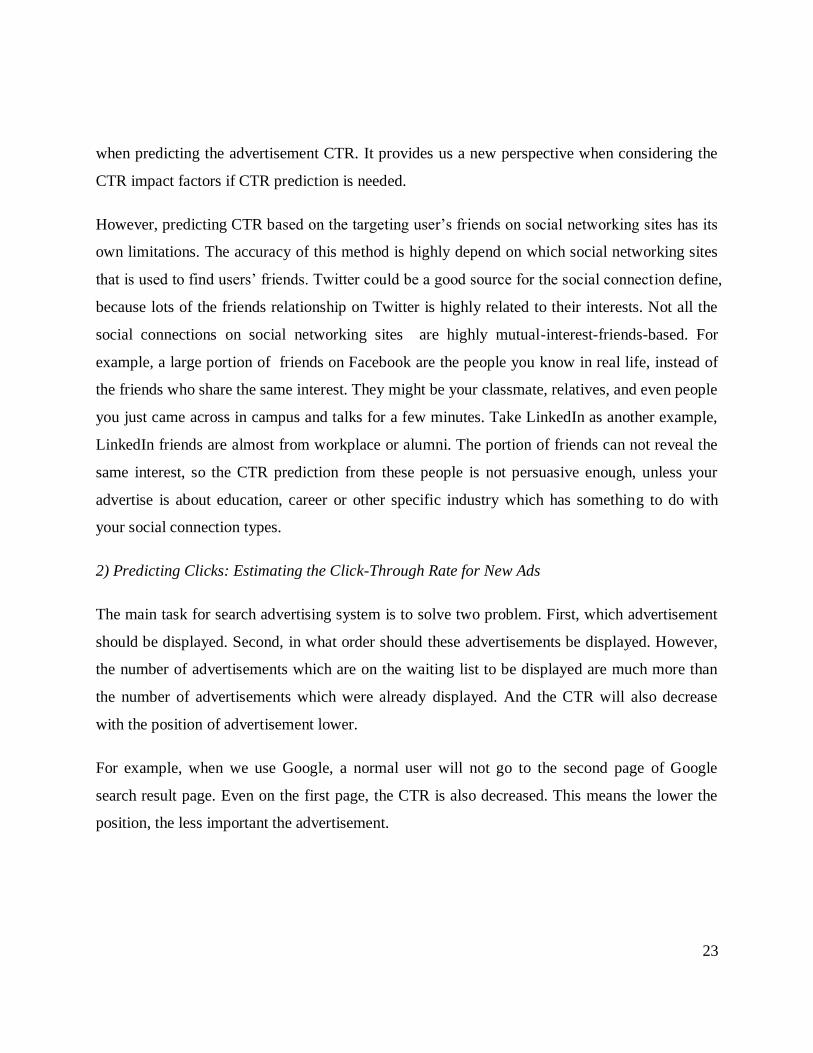
Figure 4 the CTR of an advertisement typically decreases with lower positioned ads
In order to max companies’ revenue, most of them will use a formula to calculate the position of
their ads. Ead[revenue] = pad(click) * CPCad, in which p is CTR (Click Through Rate), CPC is
cost-per-click. Thus, to ideally order a set of ads, it is important to be able to accurately estimate
the p(click) (CTR) for a given ad. And currently we already have a large advertisement
inventory. With the time going on, new ads are adding, new search engines are
implemented and new websites slots are available as well. Which advertisement should
be put on which slot is critical. An incorrect ranking will strong effect the revenue and
user experience. Also advertiser satisfaction is also important to every tech companies.
The authors tried to find a model, which will estimate the CTR through historical data,
but for new ads it will also predict their CTR. They used estimated terms, ads, order and
external feature model. They found that an ad is clicked or not based on two main factors.
1) the probability it has been viewed; 2) the probability that it is clicked on. And they also
found that it is irrelevant with the position where the ads on.
25
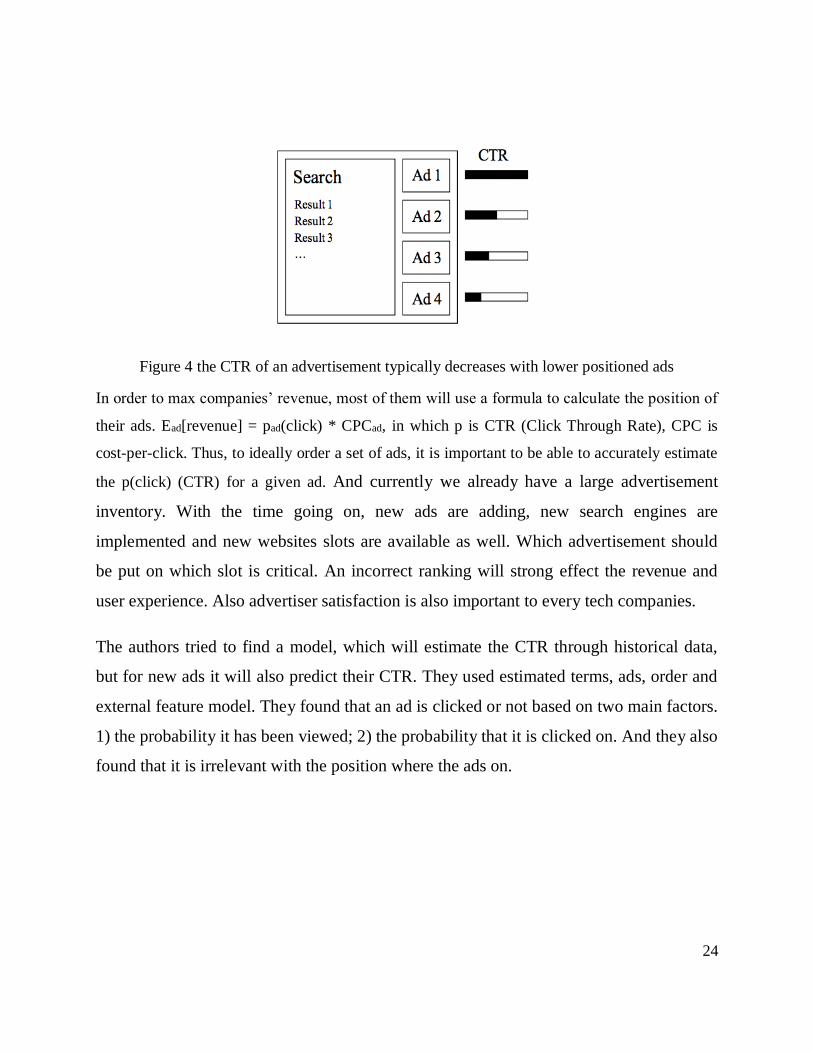
Figure 5 eye scan activity on search results page[5]
Therefore, they simplifying their assumptions and get the following formula:
p(click | ad, pos) =p(click | ad, seen)p(seen| pos)
So, the number of views of an ad is the number of times it was clicked, plus the number of times
it was estimated to have been seen but not clicked. CTR of the ad is just the time user clicks
divided by the times of views. And from figure 5, we could find that no matter the advertisement
at what position at left column, it almost shares the same view probability with main contents.
The Dataset they used includes landing page, bid term, title, body, display URL, click, views.
This contains the final products’ quality, price, the quality of advertisements, and so on. They
randomly placed 70% of the advertisers in the training set, 10% in the validation set, and 20% in

26
the test set. Since authors’ goal is to get a value, they used logistic regression to do prediction,
which will always cast a value between 0 and 1:
CTR = 1/(1+e^(-z))
where fi (ad) is the value of the ith feature for the ad, and wi is the learned weight for that feature.
And then, they started to add different features.
First, they added terms. Some terms are related, some are not. With the related terms, the final
prediction is improved almost 20% from the baseline. The relate terms are like shoes and red
shoes, wine and beer.
Table 1 term and related term results
Secondly, they added ads quality, but we only notice 1% improvement.
Table 2 ad quality results
Then, they also want to see how CTR will be affected by the originally terms.

27
Table 3 order specificity results
As the results in table 3, authors found the result above is closer to entropy of the terms.
Finally, they wondered whether external sources of data will affect the results as well. However,
they didn’t see a huge improvement from this feature. This probably is because there is an
overlap between these features.
Table 4 search engine data results
3) A novel click model and its applications to online advertising
Zeyuan Allen Zhu had proposed a General Click Model based on Bayesian network to learn and
achieve the advertisement click-through rate prediction. The paper not only proposed the above
prediction model but also employed a expectation propagation method to obtain approximate
Bayesian inference. In the paper, it is assumed that the users will browse one certain website by
the following order: top to bottom, and it also assume that the buying probabilities between the
website address based on a list of attributes. The biggest difference between this paper and other
related research is that this paper took the regular attributes such as position and relevance into
consideration and also took the newly-designed local hour and user agent into consideration. this
paper achieved three goals. Firstly, the approach trained the prediction model based on multiple

28
features and its Bayesian inference calculated the each feature’s influence to the final prediction
click-through rate. Secondly, this approach proposed some newly-designed features which also
have an significant influence on the final predicting accuracy, such as local hour and user agent.
Thirdly, they said that almost all of the prediction model proposed by other researcher can be
reduced to their prediction model by doing small change, such as using different parameter or
change the number of the parameters.
This paper have an examination hypothesis which assumed that because general users almost
will not click the advertisement if it is at the lower ranks, so if one certain advertisement is
clicked then it must be examined and relevant which means that the higher the URL is ranked in
the advertisement is at, the higher probability that the advertisement will be clicked. In order to
get a more accurate prediction rate, the paper gave some probability of the binary click event C.
Then the paper proposed a cascade model which is different to the cascade model in [2]. In [2], it
assume that users examines the website address from the top to bottom and whether it is clicked
depends on the relevance of all of the website address shown above. However, the cascade
model in this paper assume that there is at most
(a) (b)
Figure 6 (a) the user graph of GCM with continuous random variables Ri, Ai, Bi (b) the
Bayesian network of GCM.

29
Figure 6 show the flowchart of the user behavior and the outer Bayesian network of the predicted
model, separately. As we can see from these two figures, after examining website address Ui, the
user will see the relevance Ri and then to make a decision whether to click it or not. Otherwise,
the user will examine the next website address u i+1 again. Except the outer model, the
prediction model also includes the inner model which separate all of the specific features into
two major parts, one is user-specific features, another is advertiser-specific features.
About the algorithm, this prediction model used the expectation propagation method which was
introduced in [5] and drawn the following results:
Figure 7 the log-likelihood of different models on the advertisement dataset with different query frequencies[1]
(a) (b)
Figure 8 (a) Actual vs predicted CTR for GCM and DBN (b) Actual vs predicted CTR for
cascade and CCM[1]
As we can see from figure 8 (a) and ( b), the line of the points(xi, yi) looks like y = x which
demonstrate that the predicted CTR and actual CTR has a higher similarity and the prediction

30
model proposed in this paper have a satisfying prediction accuracy. In order to have a more
straightforward view of the proposed prediction model, figure 9 gives the comparison of the
actual CTR and predicted CTR including the prediction models based on GCM, DBN and CCM.
Figure 9 shows that the prediction model proposed in this paper have the closest result to the
actual CTR which means it has the best performance within these three approaches.
Figure 9 comparisons of the predicted and actual CTR with different local hours on the
advertisement dataset.
The advantage of this approach is that the prediction model is based on all possible features and
taking all of the possible influence into consideration which helper the prediction model have a
better generalization and finally achieve a better prediction accuracy, especially for the tail
queries.
The disadvantage of this approach is that it only introduced two newly-designed features in the
model, but it just considered the ad blocks and ignore user click behaviors in other blocks. In
other words, this simplification of this model may sacrifice some useful information in other
blocks. For example, we image there is one user firstly is interested in the organic search block
and he click the relevant advertisement but feel disappointed, then he will go away and change to
make a click on another related advertisement. When encounting this situation, this model will
lose many important information without taking the later click behavior into consideration.

31
4)Field-weighted Factorization Machines for Click-Through Rate Prediction in Display
Advertising
Researchers in Oath, TouchPal, LinkedIn, Alibaba and UC Berkeley proposed a new algorithm
called Field-weight Factorization Machine to predict CTR. In this paper, they noticed that the
interaction of features have some influence to the prediction, whereas other algorithms
considered little about the interaction of features.
Figure 10 heat map of interaction of feature
We can see from the Figure 10 that some fields have strong interaction and some fields have
little even no interaction. This observation indicated that algorithms people used may not
represent the real situation, which means they cannot get a precise prediction.
Based on this observation, this paper proposed a new algorithm: Field-weight Factorization
Machine. Field-weight Factorization Machine come from Field-aware Factorization Machine.
They measure the interaction of features use formula listed below:

32
Then they add this formula to the formula of Field-aware Factorization Machine and got this
formula:
It has additional part to represent the influence of interaction of features.
This paper used data collected by Criteo to do the experiments. They implement the algorithm in
TensorFlow, which is shown in Figure 11.
Figure 11 implementation of FwFM in TensorFlow

33
Figure 12 comparison among different model
The paper used different data and different model to this experiment. They indicate that FwFM
had better performance than Logistic Regression, Factorization Machines and Poly2. However,
FwFMs is not good as FFMs. The paper admit this fact, but found that FFMs are more
vulnerable to overfitting than FwFMs.
In this research, the paper discover the strength of interaction of features. Unlike other research,
they take the interaction of features into consideration, and give it a weight.
In real world, the interaction of features do affect the CTR of advertising. That is, this paper
catch the important part of the CTR problem that other researchers did not noticed. And the
experiments do validate the correctness of this algorithm.
However, because of the consideration of features interactions, the complexity of the model is
much higher than other model. This may cause bad capacity and has much more time
consumption. Also, to calculate the strength of feature interaction, we need to handle the data
first. For a CTR problems, the data source may be in a huge number and has enormous fields.
The data handling process may need much more time and people, whereas the result is
sometimes not as good as FFMs.

34
5) Algorithms to predict CTR
In addition to the algorithms used in the above papers, there are many other ways to predict CTR.
➢ PLOY 2
The advantages of LR are simple and efficient. The disadvantages are obvious. It is too simple. It
considers the features in the feature space are independent of each other. There is no crossover or
combinational relationship. This is inconsistent with the reality. For example, it predicts whether
or not a certain t-shirt will be clicked. If you click, you may click in most areas of the country in
the summer, but in the combined seasons, such as in autumn, people in the northern cities may
not need them at all. So this is reflected in the different characteristics of the data feature
dimension. Therefore, to model the nonlinear relationships is essential to accurately describe the
complex internal relationships. PLOY2 is a complex internal relationship that models such
features through the binomial combination of features. The binomial part is as follows:
However, there is a major problem with PLOY2. In an actual scenario, most of the features are
sparse, that is, most feature values are 0. Binomial combination of these sparse features will find
that most of the last feature values are 0. When the gradient is updated, if most of the features
are 0, the gradient is not updated. Therefore, the PLOY2 method cannot solve the problem of
modeling more complex linear relationships in such scenes. (PLOY, 2000)
➢ FNN
The figure below describe the FNN architecture.
35
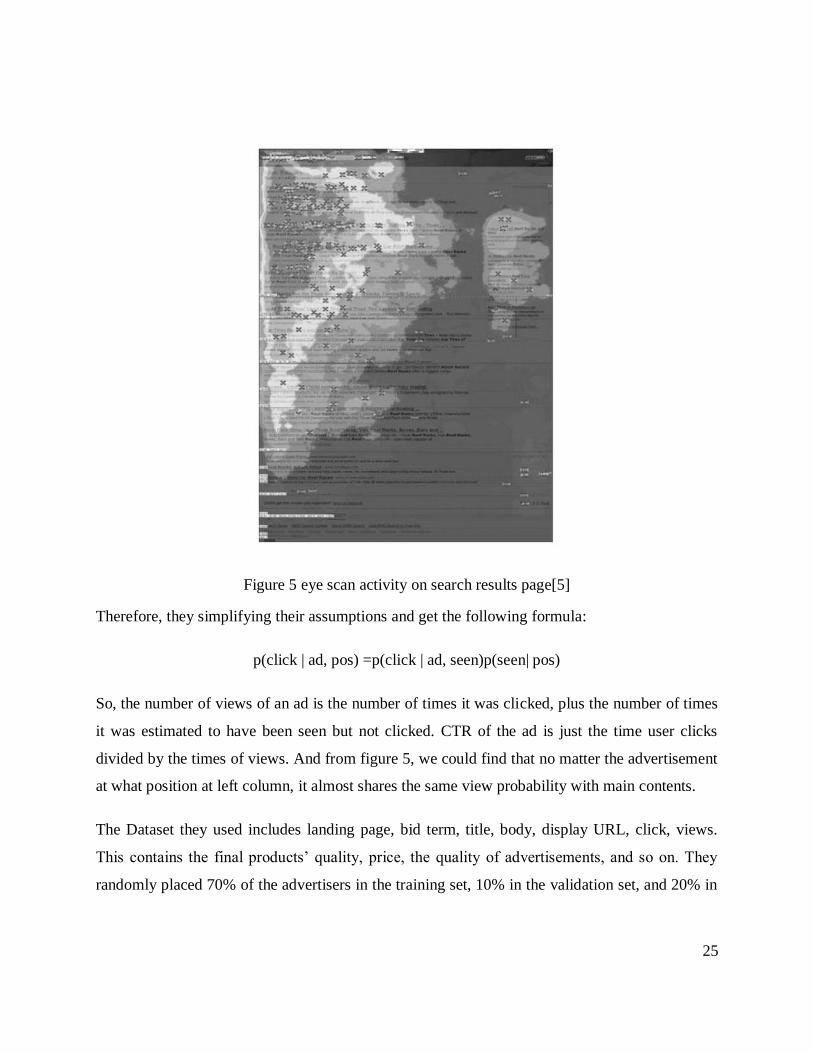
Figure 13 a 4-layer FNN model structure
The underlying network is initialized by FM. The elements of W are initialized by the low-
dimensional continuous space vector representation in FM:
The low-dimensional continuous space vector that constitutes W is represented by FM on the
data set in advance. During the training process, the model updates the FM layer parameters
through BP. There is no difference between the other steps and the common MLP. Here, the
emphasis is on how to intervene in the bottom layer.
➢ PNN
PNN mainly adds an inner/outer to the deep learning network.
The product layer is used to model the relationship before the model is set (Qu, 2016 ). As shown
in the figure below, the product layer part Z is weight * feature, and the P part weight*I(feature_i,
feature_j) is used to model the binomial relationship:

36
Figure 14 relationship between each layer in PNN algorithm
PNN is divided into inner product layer and outer product layer based on the product layer
function, the difference is as follows:
Figure 15 differences between Inner Product Operation and Outer Product Operation

37
Similar to FM, after the network is constructed, embedding the input data results in a low-
dimensional continuous vector representation. And then calculate the inner product or outer
product of any two features. It is easy to find out that the size of this feature will become much
larger (secondary order of magnitude), especially in sparse space. Similar to the problems
encountered by PLOY2, it becomes difficult to train. Inspired by FM, this matrix can be
transformed into a matrix. It is decomposed into a small matrix and its transpose is multiplied to
represent the low-dimensional continuous vector space to reduce the model:
2.4 Your solution to solve this problem
To solve this problem, we decide to utilize the behavior logs of users data to predict the CTR for
the advertisements. What we need is the information of user and his/her behavior logs which are
on a certain website, for example, a shopping website. And also the features of the advertising is
needed. By figuring out the similarities and connections between the targeting advertisements’
features and the key features generated from the users’ history behavior, we can predict the
CTRs. According to the predicted CTR, the advertisers are able to choose the targeting
advertisement readers who have a relatively high probability to click their ads.
The Algorithm used to calculate CTR in this project is DeepFM, which we regarded as the most
suitable and proper method considering our purpose and data source composition. The DeepFM
algorithm will be discussed detailedly in section 5.2.
2.5 Where your solution different from others
DeepFM combines WDL (Wide & Deep) with PNN (Product-based Neural Network). In original
Wide and Deep, the part of Wide used only Logistic Regression. PNN expand Wide and Deep by
using non-linear model. DeepFM simplify the working of feature handling by combining FM
(Factorization Machine) and NN (Neural Network).

38
DeepFM can reduce work in Feature Engineering, comparing with Wide and Deep, and it can
utilize Deep Component to create higher dimension model. By reduction jobs in Feature
Engineering, we can save time and energy and focus more on the algorithm part.
2.6 Why your solution is better
User behavior in shopping website can represent the interest of the users. For advertisers who
want to sell product (including service), interest of users is really important. A electronic game
company like Electronic Art cannot advertising to users who never play electronic games since
Electronic Art has little chance to sell product to these users. That is, our solution can have a
precise prediction based on user behavior.
As for the algorithm, we use DeepFM, which combine Neural Network with Factorization
Machine. DeepFM could reduce work in Feature Engineering. This will give us more time to
focus on parameters choosing and model optimization.
39
3. Hypothesis and Goals
3.1 Multiple Hypothesis
Initially, the primary goals of this project is to train a prediction model to predict the Ad click-
through rates (CTR) based on the key features which are collected and analyzed based on the
online-shopping history and browse record of the users pool. According to the predicted CTR of
a certain user, the advertiser can easily aim at the targeting users who have the relatively high
probability to click the advertisements.
The basic hypothesis of our model is that whether a user click on an advertisement is related to
the user’s history behavior and it can be predicted from the user’s past behavior. To a certain
extent, For a certain user, the probability to click on an advertisement will increase if the
targeting advertisement is more related to his/her interests. The interests is demonstrated by the
key features generated from user’s history behavior. In another word, the stronger connection
with the user’s key features, the higher CTR the targeting advertisement will generate.
3.2 Positive/Negative Hypothesis
Our project will provide a recommendation system which demonstrates the potential targeting
user group based on the CTR calculated. If the CTR of a certain user based on our algorithm is
more than a threshold, the system will tender a positive recommendation, which means this user
has high level of possibility to click your Ad and it is recommended to target him/her, and vice
versa.
Additionally, given adequate potential users and sufficient history information, our
recommendation system can also operate at the custom CTR that advertisers select themselves
on the basis of their own demand if needed, which means the system will provide a list of
targeting users based on particular desired CTRs of advertisers. If the system returns an excess of

40
negative recommendations and just a small portion of users reach the CTR threshold, it is
recommended to either change the users’ pool or advertising platform, or change the
methodology or key features of your advertisements.

41
4. Methodology
4.1 How to generate/collect input data
4.1.1 Data Resource
We use real-world advertising dataset collect from taobao users by Alibaba. The data is formed
by randomly sampled 1140000 users from the website of Taobao for 8 days advertising display
and click. The whole raw data contains advertising information, user profile information, user
behavior logs and advertising clicking information.
4.1.2 Feature Engineering
When working on this problem, we can’t just use raw data to predict the probability. Raw data
are in a status of chaos and contains many useless data. Thus we need to handle these data to get
clean data as input by using feature engineering.
Feature attempts to create additional relevant features from the existing raw features in the data,
and to increase the predictive power of the learning algorithm. The process of feature
engineering is:
1) Brainstorming or Testing features;
2) Deciding what features to create;
3) Creating features;
4) Checking how the features working with model;
5) Improving features if needed;
6) Go back to brainstorming/creating more features until done.
By doing these process multiple times, we define the data set as:

42
Table 5 dataset
Table Description Feature
raw_sample raw training samples User ID, Ad ID, nonclk, clk, timestamp
ad_feature Ad’s basic information Ad ID, campaign ID, Cate ID, Brand
user_profile User profile User ID, age, gender, etc.
raw_behavior_log User behavior log User ID, btag, cate, brand, timestamp
The descriptions of these features are:
1) raw_sample:
User ID: ID for user (int);
time_stamp: timestamp (Bigint, 1494032110 stands for 2017-05-06 08:55:10);
Ad ID: ad group id (int);
pid: scenario;
noclk: 1 for not click, 0 for click;
clk: 1 for click, 0 for not click;
2) ad_feature:
Ad ID: ad group id (int);
campaign_id: campaign id;
43
cate_id: category id;
Brand: brand id;
advertiser_id: advertiser id;
price: the price of item;
One of the ad ID correspond to an item, an item belong to a category, an item belongs to a brand.
3) User_profile:
User ID: ID for user (int);
cms_segid: Micro group ID;
cms_group_id: cms_group_id
final_gender_code: 1 for male, 2 for female;
age_level: age level of users;
pvalue_level: consumption grade, 1: low, 2: mid, 3: high;
shopping_level: shopping depth, 1: shadow user, 2: moderate user, 3: depth user;
new_user_class_level: City level;
occupation: Is he/she a college student? 1 for yes, 2 for no;
4) Raw_behavior_log:
User ID: id for users;
time_stamp: timestamp (Bigint, 1494032110 stands for 2017-05-06 08:55:10);
btag: type for behavior, including follow four: ipv for browsing, cart for adding to shopping cart,
fav for favor, buy for buying this item.

44
cate: category ID;
brand: brand ID;
Here if we use user ID and timestamp as primary key, we will find a lot of duplicate records.
This is because the behavior of different types of the data are collected from different
departments and when packaged together, there are small deviations (i.e. the same two
timestamps may be two different time with a relatively small difference).
4.1.3 One-Hot Encoding
In digital circuits, one-hot is a group of bits among which the legal combinations of values are
only those with a single high (1) bit and all the others low (0).
One-Hot encoding transforms categorical features to a format that works better with
classification and regression algorithms. In CTR data, there are many categorical data which
takes only a limited number of values. For example, if people responded to a survey about what
brand of car they like, the results will be categorical (like BMW, Honda, etc). And we will get a
error output if we use these data as input without any encoding.
Let’s look at a simple example.

45
Figure 16 Simple One-Hot encoding example
The real values are Red, Yellow, and Green in Color category. We create four column data to
represent these data by using 1 and 0.
4.2 How to solve the problem
4.2.1 Algorithm design
Many researchers have done a plenty of research and proposed many algorithms through time.
Researchers proposed Logistic Regression, Factorization Machine and XGBoost in CTR
prediction in many years ago. Some companies have their own algorithms for their special need.
For example, Bayesian LR (introduced by Microsoft), Bayesian MF (introduced by Microsoft)
and Bid Landscape Forecasting (introduced by Yahoo!).
Based on Factorization Machine, researchers proposed some new algorithms to improve.
FFM(Field-aware Factorization Machine) considers the influences of the field. Recently,
researchers introduced new algorithms by combine factorization machine and deep learning, like
DeepFM, FNN and PNN. Each algorithm has its own application scenario. In this problem, we
decide use deep learning algorithm: DeepFM.

46
DeepFM combines WDL (Wide & Deep) with PNN (Product-based Neural Network). In original
Wide and Deep, the part of Wide used only Logistic Regression. PNN expand Wide and Deep by
using non-linear model. DeepFM simplify the working of feature handling by combining FM
(Factorization Machine) and NN (Neural Network).
FM (Factorization Machine) in DeepFM are represented by Figure 17.
Figure 17 the architecture of FM
The FM component is a Factorization Machine, which have sparse field as input. M features
going into embedding layer and embedded into embedding vectors. FM Layer calculates the
inner product of these embedding vectors, which are weight-connected into FM Layer. And FM
Layer add all m fields by normal connection. The output of FM Layer will put into Output Units,
which use sigmoid function to get the final output. As Fig. 5.2 shows, the output is:
Deep component is shown in Figure 18.

47
Figure 18 the architecture of DNN
The deep component is a feed-forward neural network, which is used to learn high-order feature
interactions. Fields are inputted into Hidden Layer by normal connections. In Hidden Layer, each
node has a activation function. After traveling through hidden layer, the output of the hidden
layer go into Output Units that also use sigmoid function to get final output, just like the FM
component.
DeepFM can reduce work in Feature Engineering, comparing with Wide and Deep, and it can
utilize Deep Component to create higher dimension model. By reduction jobs in Feature
Engineering, we can save time and energy and focus more on the algorithm part. One interesting
thing is that Wide and Deep share the Embedding space in DeepFM, which means Wide and
Deep part can both update the Embedding Vectors although Wide part is pure PNN work.
4.2.2 Language used
In this project, Python is used to implement the major part and also used for the back-end
programming. In algorithm part, Python has a relatively good performance and has a plenty of
library for the implementation of neural network as well. Additionally, Python has a good
performance in both math calculation and model representation. Moreover, handling and
48
processing data is more effective and efficient if Python is being utilized. Comparing with
Python, C/C++ and Java have some problems in math implementation and model creating.
Given the advantages above, hence, Python is selected as our primary language. The quicker we
implement the model, the more time we can use to improve the model. We use HTML, CSS and
JavaScript to implement User Interface.
4.2.3 Tools used
TensorFlow: TensorFlow is an open-source software library dataflow programming across a
range of task. We use TensorFlow for Python to implement DeepFM.
Flask: Python back-end framework.
Pycharm: Python IDE.
4.3 How to generate output
The output of the project is the probability that a user click a specific advertising. Final node
calculate the data that handled by hidden layer using sigmoid function to get a real number which
represents the probability.
4.4 How to test against hypothesis
We split the data into three part: training set, validation set and test set. While choosing the
model and parameters, we use K Fold Cross Validation to validate the model. We split 80% of
data as training and validation set. In this part of data, we use K Fold Cross Validation to
evaluate and choosing model.
We divide the data into K subsets. Each time we use one of them as validation set and k-1 of
them as training set. The error estimation is the average over all K trials. Since data are always
not enough, K Fold Cross Validation can help use data efficiently. K Fold Cross Validation can
significantly reduce bias because every single data is used as validation once and only once.
49
4.5 How to proof correctness
CTR problem is a special regression problem, we cannot simply evaluate the correctness by
Precision, Recall and F-Measure. Thus, for this problem, we us AUC to evaluate our model.
Before introducing the AUC (Area under the Curve), we need to know ROC (Receiver
Operating Characteristic Curve) first.
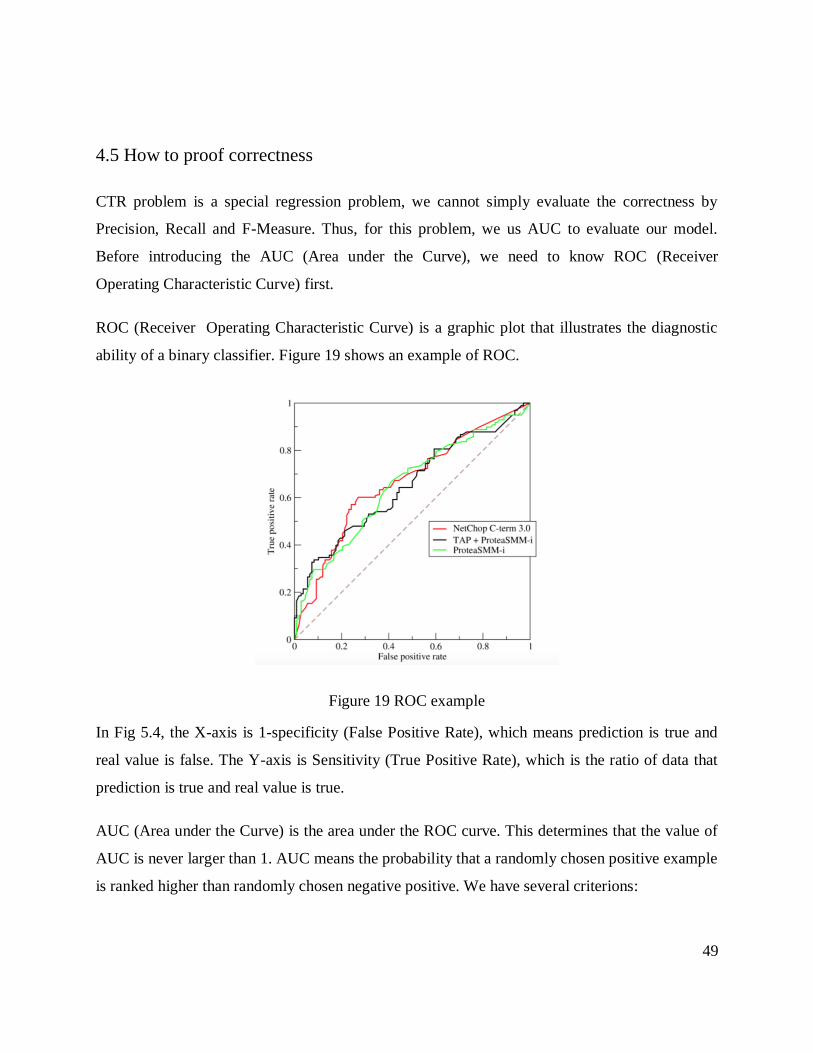
ROC (Receiver Operating Characteristic Curve) is a graphic plot that illustrates the diagnostic
ability of a binary classifier. Figure 19 shows an example of ROC.
Figure 19 ROC example
In Fig 5.4, the X-axis is 1-specificity (False Positive Rate), which means prediction is true and
real value is false. The Y-axis is Sensitivity (True Positive Rate), which is the ratio of data that
prediction is true and real value is true.
AUC (Area under the Curve) is the area under the ROC curve. This determines that the value of
AUC is never larger than 1. AUC means the probability that a randomly chosen positive example
is ranked higher than randomly chosen negative positive. We have several criterions:

50
1) AUC = 1: A perfect model. When using this model, we can have at least one threshold that
get perfect prediction. Unfortunately, there is never a perfect model for most of situation.
2) 0.5 < AUC < 1: Better than randomly prediction. When choosing an appropriate threshold,
it’s possible to predict.
3) AUC = 0.5: Equal with randomly prediction. This model has no value.
4) AUC < 0.5: Worse than randomly prediction. However, we still can get a better prediction by
choosing opposite value.
Figure 20 three types of AUC
Actually CTR prediction can be seen as a soft classification problem. The only difference is that
this classifier can give a probability that the result belongs to which type. For this reason, AUC
can be used in evaluating CTR prediction model.

51
5. Implementation
5.1 Design document and flowchart
Figure 21 Prediction Model Training and Recommendation System Development Process

52
Figure 22 CTR Prediction Model and Target Users Recommendation System Working
FlowChart

53
5.1.1 Data Input
The data we used to train our prediction model is from real-world users behaviour and
advertising dataset which is collected from taobao by Alibaba. The data is collected from
randomly sampled 1140000 users. The data contains 22-days users’ shopping and browsing
behaviour from the website of Taobao and 8 days advertising display and click data. The whole
raw data is consisted of four tables, which shows advertising information, user profile
information, user behavior logs and advertising clicking information.
The data table ‘user_profile’ records all the samples users’ basic information, such as
age,gender,occupation, location. These features are also important contributing factors of ad-
click prediction.
The data table ‘raw_behavior_log’ records every sample user’s shopping behavior in 22 days .
The shopping behavior is defined as four categories, namely view, favour, buy and cart, which
shows if he/she view a good, favour a good, buy a good, or put a good into shopping cart. The
category and brand of the good is recorded as well. This 22-day data combined with
‘user_profile’ is used to generate users’ preference.
The data table ‘ad_feature’ records the basic information of display advertisements on Taobao in
8 days.
The data table ‘raw_sample’ records the sample user’s ad-clicking behavior in the same 8 days,
which demonstrates whether a single user click on ads in thead_feature’ or not.
The detailed information and section of theses four table can be find in Section 4.1 and Section
4.2.
5.1.2 Data Cleaning
1). Data re-organized

54
We have four csv file as original data: raw_sample, ad_feature, user_profile and user_behavior.
All data are stored as csv file. We organized these four file into two file: training and test. Firstly,
we remove useless feature in user behavior file, and group the file by user and category. The user
behavior file is too big (20g), so we split this file into 6 files. After we process all data file by file,
we merge these 6 file into one behavior file. Even though, this file is till 5g.
After that, we merge all file into one raw file. Firstly we merge raw_sample and ad_feature on
key “category id”. Then we merge above file with user behavior and user profile.
Once we merge all data into one file, we split it into two file: training file and test file. We using
7 days data as training set and 1days data as test set.
2). Data resize
The files we got are too big that we don’t have machine to read the data. Thus we resize the data
using several ways. We downcast the data type in files. For example, we change the int64 to
unsigned int32 and change the float64 to float32 by using numpy and pandas. Also, we found
that some category feature are Object type. We map the object category to int value.
3). Data normalization
After we analysis the data, we found the numeric data have very large range. The price range
from 0 to 100000000. We remove these big value because we thought these data are noise. And
we fill the NAN (missing value) with 0 for numeric and -1 for category. For these numeric value,
we try several normalization method: Min Max scale and Robust Scale using sklearn. For every
method, we generate a file for training to see which method is better.
5.1.3 Model Training
Our CTR prediction model training process is tried to figure out the connection between the
users’ preference and their ad- click probability of different categories.

55
After finishing the data clean process, each user record would include many features for
themselves which demonstrates the behavior and interest of the certain user. The all of the user
record will be used to as the training data. Because the user record will go through the prediction
model one by one, so the number of the user record is the same to the number of model training
iteration and each user record is used as the training data one by one. For example, firstly we use
the first user features as the input data, the the data will go through the DeepFM model, then the
model will produce an initial predicted click rate. Then the initial predicted click rate and the
actual click rate(click the advertisement or not) will be compared. According to the comparison
and discrepancy, the various parameters of the prediction model, such as the number of the
hidden layer, various coefficients of the activation function, the number of the training record
and so on, will be adjusted which make the prediction model has a higher accuracy.
Generally speaking, more training data means more higher of the prediction accuracy. However,
more training data means more iterations in the training process and more time needed in the
training process. Furthermore, according to many related references, after the training data
bigger than some number, the accuracy of the prediction model will tend to be stable.
As mentioned in the chapter 4, we use the DeepFM algorithm to build the prediction model. The
DeepFM algorithm combines the WDL with the PNN algorithm shown in Figure 17 and Figure
18. Originally, the Wide part is used only to solve the logistic regression problem, in the
DeepFM algorithm, the PNN part is combined with the Wide and Deep part by using some non-
linear model. By combining Factorization Machine and Neural Network, DeepFM simplify the
working of feature handling. DeepFM not only can reduce the work in Feature Engineering but
also can create higher dimension model by utilizing the Deep Component. The reduction jobs in
Feature Engineering let us save a plenty of time and energy which means we can spend more
time and put more effort on designing the specific algorithm.
Because the quality of the predicted model will have the biggest influence on the final predicted
result, so we spend a lot of time to train the model by use as much training data as possible. After
several forward and backward of batches’ and several iteration of epochs, the parameters, such as

56
the number of hidden layer, the number of the node in each layer, the initial value of the
functions are determined and the predicted model is used to do real life prediction work.
After training the model over and over again, the values of parameters of the prediction model
are determined and then the prediction model will be used in real life prediction.
5.1.4 Ad CTR Prediction
After the prediction model is built, it can be used in real life advertisement CTR prediction. In
order to finish the prediction process, we not only need the information of one specific
advertisement but also the information of one certain users.
For the advertisement, some details of it is needed, such as the category, the price, the brand and
the keywords. For example, if the advertiser want to put an certain advertisement on the
facebook platform, the facebook platform need to recognize the information of the advertisement
before deciding whether and where to put it. There are two different approaches that can be used
to obtain the features of one certain advertisement, one is to ask the advertiser to enter all of the
details, such as the category, the price, the brand and some keywords on some page, then the
prediction model can easily get all of the details of that advertisements. Generally speaking,
more details and information of the advertisement will be more helpful when doing the CTR
prediction. Another approach is that the advertiser only will be asked to enter the name of the
advertisement. Then we can propose some algorithm to extract the details and keywords for that
advertisement which will be used in the later prediction process. After thinking this problem
seriously, the first approach is chosen by our project. It has three reasons as described detaily in
the following. The most important reason is our project is aimed to achieve the CTR prediction
of the advertisement and obtaining the details and information of the advertisement is only a
small trival part in our project, so we should pay more attention to the design algorithm and
model training instead of spending much time on the trival work. One the other hand, we will get
more accurate description and features of the advertisement if they are entered by the advertiser,
if we use some algorithm to extract the features of it, it may cause some misunderstanding or
57
mistake. Such as the advertiser think their product belongs to the luxury class but our algorithm
think it belongs to the daily commodity, then the prediction model will have a opposite
prediction result for the user who just is interested in some product with lower price. So the first
approach will avoid misunderstanding between our prediction model and thought of the
advertiser. One more reason is that it easily for the advertiser to enter the information of the
advertisement and this process of thinking also can help the advertiser better locate their product
and advertisement before putting the advertisement to the public.
In order to let the advertiser enter the keywords, an interactive page is designed in our project.
The advertiser will be asked to choose the category, and at most ten keywords in the page. Then
the page will store them into a database and the advertisement will be used to prediction the CTR
of it.
Besides the advertisement features, the user informations is also needed. Because it is hard for
some user to get their features, so we just ask the advertisement platform to put all of the user’s
information into the user pool. For example, as an amazon user, it is hard for me to obtain my
browsing history, so it is hard for me to enter the feature for myself. However, it is easy for
Amazon platform to collect all of the behaviors for me, such as the products I bought before, the
products I liked, and the website and advertisement I have clicked. As an advertisement platform,
they have already collection all of the information for all of the users. The only thing they need
to do for our prediction system is that they should process the informations of each user
according to our rule and produce certain features for each user. When the platform want to
predict the how much probability for the certain user to click the certain advertisement, they only
need to select that user from the user pool, then make the user’s features and the advertisement’s
features as the inputs of the prediction model and click start button, then the prediction model
will produce the predicted CTR and the page will show it to the user.

58
5.1.5 Target Users Recommendation
In addition, our project proposed a novel idea based on CTR prediction system. That is a target
user-recommendation system which demonstrates the potential targeting user group based on the
click probability calculated by the prediction model.
In our target user recommendation system, CTR threshold is used to decide whether a user
should be a target user. If the click probability of a certain user, which is forecasted from the
prediction model, is larger than the CTR threshold, then this user is recommended as a target
user by our system.
The current advertisements on the display network have a low average CTR, which is only
0.35%. (https://blog.hubspot.com/agency/google-adwords-benchmark-data). The CTR threshold
should guarantee a much higher CTR than the current CTR, so that the advertiser would not
waste excessive resources on the people who are unlikely to be their potential customers.
However, in reality, the CTR threshold is not always the same value, it can be different
according to the various industry that the advertisements belong to. The current statistic data
shows that the CTR of different industries vary greatly. Thus, it is reasonable to consider
different CTR threshold for different industry category when setting the benchmark to
recommendation. The decision of single user CTR benchmark can be done in the future work.
(Table generated from https://www.wordstream.com/google-adwords-benchmark-tools)
Table 6 average CTR rate of a certain industries
Industry Average CTR
Technology 0.84%
Dating & Personels 0.52%
Travel & Hospitality 0.48%
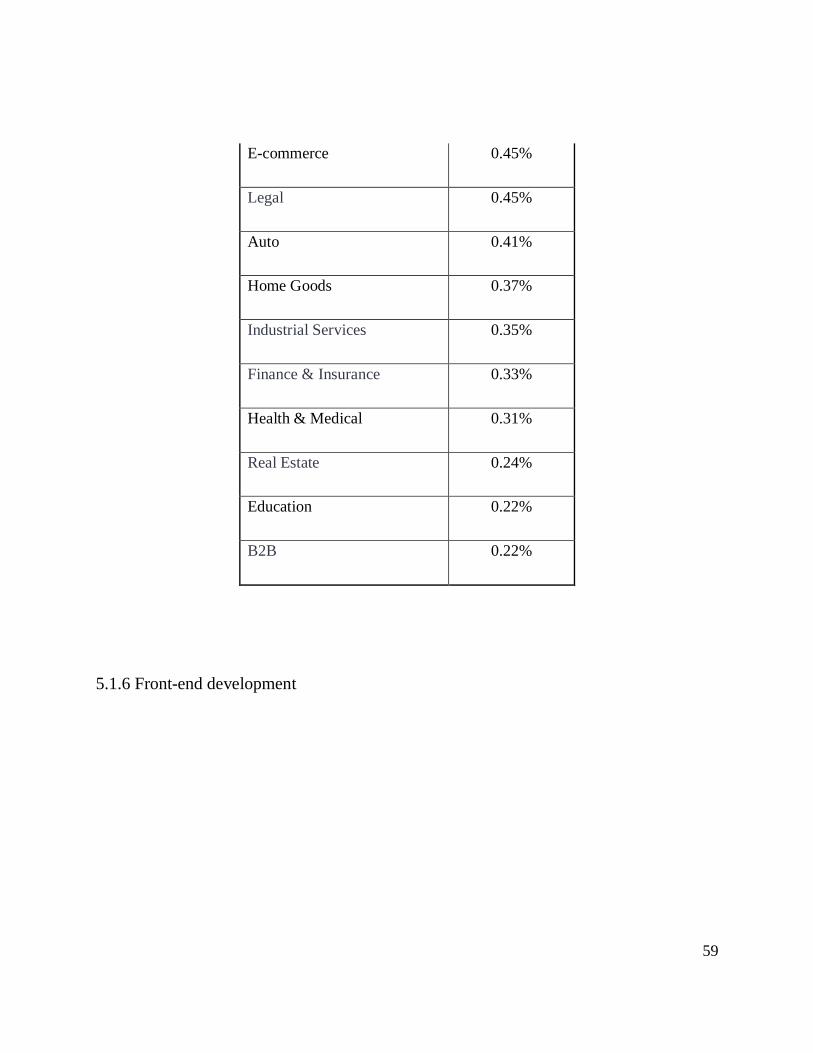
59
E-commerce 0.45%
Legal 0.45%
Auto 0.41%
Home Goods 0.37%
Industrial Services 0.35%
Finance & Insurance 0.33%
Health & Medical 0.31%
Real Estate 0.24%
Education 0.22%
B2B 0.22%
5.1.6 Front-end development

60
Figure 23 Homepage

61
Figure 24 Advertiser Home Page

62
Figure 25 Advertising Platform Home Page

63
Figure 26 A single page about what we did
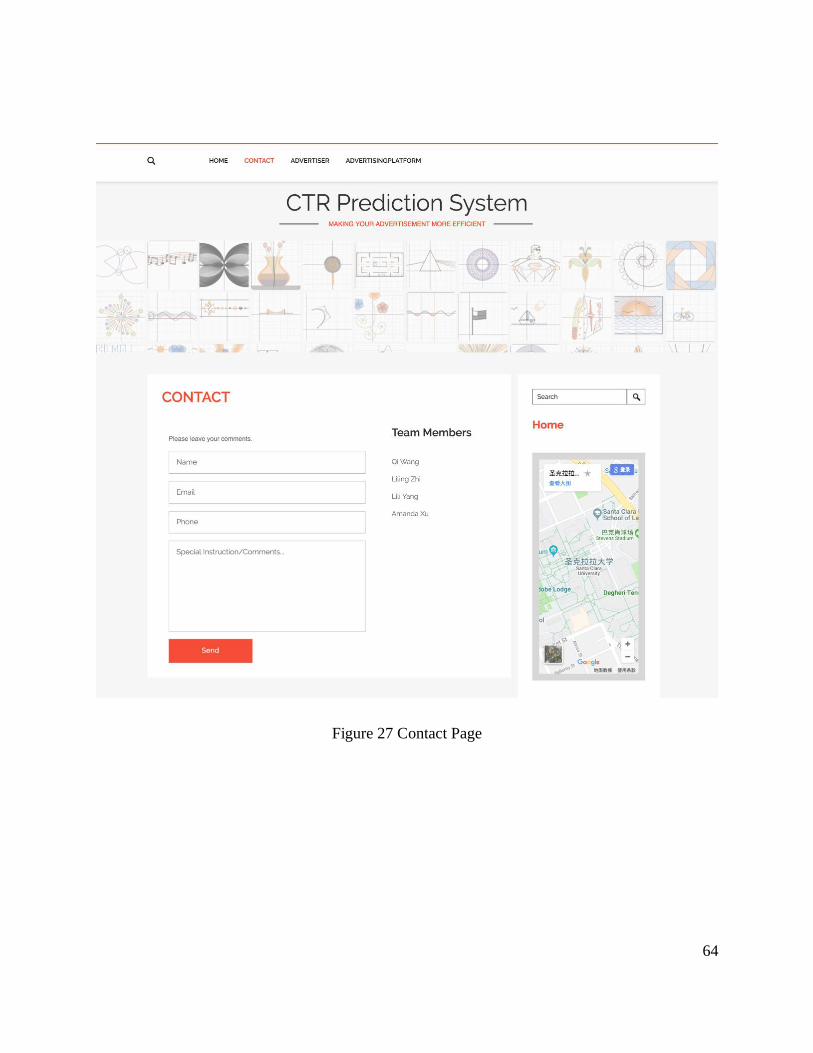
64
Figure 27 Contact Page
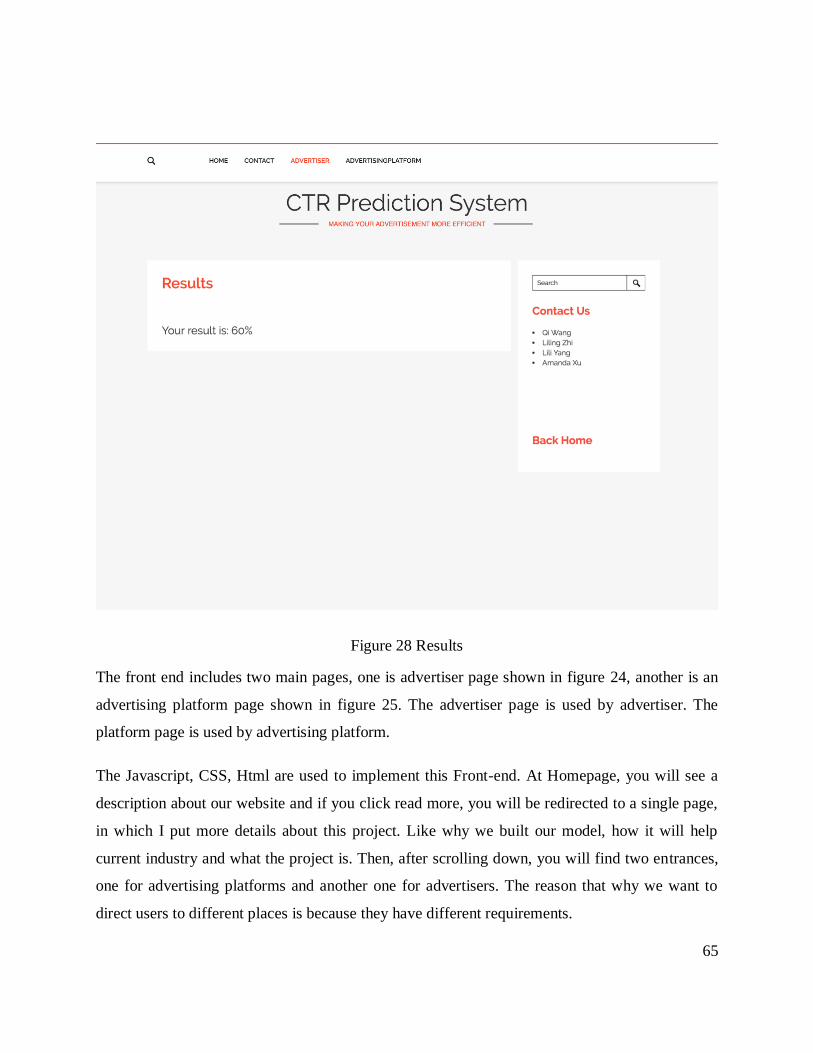
65
Figure 28 Results
The front end includes two main pages, one is advertiser page shown in figure 24, another is an
advertising platform page shown in figure 25. The advertiser page is used by advertiser. The
platform page is used by advertising platform.
The Javascript, CSS, Html are used to implement this Front-end. At Homepage, you will see a
description about our website and if you click read more, you will be redirected to a single page,
in which I put more details about this project. Like why we built our model, how it will help
current industry and what the project is. Then, after scrolling down, you will find two entrances,
one for advertising platforms and another one for advertisers. The reason that why we want to
direct users to different places is because they have different requirements.

66
For advertising platforms, they have their own user pool. This is the biggest comparative
advantage, because they know who are their target users, through these targeted users, these
platforms will get a better result. In the advertising platform homepage, we allow them to upload
their use pool. We prefer .csv file, because this file type could save us a lot of calculating time. If
they gave us other file type, we will switch it to .csv by ourselves.
Besides this, advertising platform could also choose their advertisement category. We provide 11
categories for them to choose, including clothing, shoes, books, food, garden, baby/kids, beauty,
games, electronics, handmade, sports. And they will have 4 keywords to define their scopes, the
first keyword is required, other 3 are optional. For example, if they chose Shoes in advertisement
category, they can put Nike, $100, footwear manufacturing company as keywords. Then, the
next important number is threshold. This threshold means under current user pool, how many
users are more likely to click your advertisement and their click probability is higher than the
threshold. In result, we will give you an average number of lick probability and a database,
which contains those users, who are more likely to click the advertisement.
For advertisers part, I believe they have natural weakness of asymmetric information. They only
know their target users(who probably will click their advertisements), but they have no idea
about who will use the advertising platform. It is a blind advertise. Under these circumstances,
we kindly provide a interface for advertisers to choose which platform they want to advertise.
For now, we do not have most platforms’ user pool. We only have Taobao’s partial user pool.
However, in the future, we could cooperate with platforms, use their user pool as input. And they
don’t need to actually upload their user pool to us, if they want to protect their users’ privacy. All
we need is an anonymous database.
They also have 11 advertisement categories, 1 required keyword, 3 optional keywords and a
threshold to fulfill. Moreover, they will have a choice to choose which
67
5.2 Code Implementation
The following are the steps which we followed in the project for achieving the results:
a) The raw data are collected by Alibaba. Raw data contains 700 million rows of user
behavior and 20 million rows of advertising click log.
b) DeepFM model is implemented by using tensorflow in DeepFM.py.
c) Data preparing is implemented several times using pandas, numpy and sklearn.
d) Model has been trained based on data set we processed. And we optimized model by
tuning the batch size, epoch, deep network parameters.
e) The output will be the probabilities of every sample and the AUC score for all test data.

68
6. data analysis and discussion
6.1 Output generation
The program read user behavior logs, advertisement information and user profile from csv file to
generate the probability that user will click this advertising. For the using of analysis, we
generator some other output including: ROC curve and AUC score. And for the final usage, we
could generator the probability and a list of users.
In the implementation, we add the code to calculate the AUC score. For every iteration in
training, we got the out which is the probability for every sample. We generator a AUC score by
using the real value and the predictive value to evaluate the model.
The output of one sample is the probability that the user will click a specific advertising. And out
front-end could calculate the total probability that users who are in our user pool will click a
specific advertising.
We generator the average probability the users will click a specific advertising by cancating the
advertising feature with our user behavior and information as input feature. After a whole predict
process, we could get a list of probabilities. Then we could calculate the average as output.
The users who will click the advertising is generator by using a threshold the advertiser set.
When advertiser sets a threshold of 0.5, we could return a list of users who have at least 0.5
probability to click this advertising from what we got from process what I talked above.
6.2 Output analysis
In training process, we generator AUC score to evaluate our model. When we try to define a
threshold for AUC to determine that our model works, we found 0.68 would be a good value. We
calculate the probability that user click the advertising by group data by advertisement category
and brand, then we just put probability to the test set and calculate the AUC score. We found that

69
AUC score is 0.58, which means we could got 0.68 AUC score even if we don’t use any
methodology. Thus, we must get a value that is larger than 0.68 so that our model could work for
prediction. Our model get 0.89 for partial data. We don’t use full dataset because the data file is
too big that we don’t have time and machine to train model. So we choose part of data to train
and test the model.
Figure 29 ROC curve for partial data
After we trained our model, we could generator the probability that users will click a specific
advertising, and we could also return a list of users who will click a specific advertising using a
threshold from our user pool. The probability is the average probability for users who ever view,
add to cart or buy the goods in same category.
6.3 Compare output against hypothesis
In chapter 3, we proposed multiple hypothesis for this advertisement CTR prediction and
recommendation system. The following will compare the output with the hypothesis one by one.

70
Firstly, the primary goals of this project is to train a prediction model to predict the Ad click-
through rates (CTR) based on the key features which are collected and analyzed based on the
online-shopping history and browse record of the users pool. In actual implementation of this
project, we do the data clean process for the input user records and input advertisement records.
Then these cleaned users’ data and advertisements’ datas are used as the input data of our
prediction model to training it. The input data is cut into many batches and each batch is
composed of a certain number of input data. For each batch, the prediction model is trained one
forward and one backward. Because each input data run once is not enough, the number of epoch
is set to 60 which means all of the input data record will go through the prediction model 60*2 =
120 times. After that, the training process is finished and then the model is suitable for real life
prediction work.
Secondly, we proposed that our project will build a recommendation system which demonstrates
the potential targeting user group whose predicted CTR is equal or bigger than the threshold. If
the CTR of a certain user based on our algorithm is more than a threshold, the system will tender
a positive recommendation, which means this user has high level of possibility to click your Ad
and it is recommended to target him/her, and vice versa. In the front end parts, it allows
advertiser to determine the threshold in their account. Then the advertisement record be
submitted to the advertising platform, then they advertising platform will let each user record to
go through the predicted model and pick the user whose predicted CTR is higher than the
threshold. Finally, all of the targeting user will be caught. The target user recommendation is not
only beneficial to the advertiser but also beneficial to the advertising platform. For advertiser,
they will know which users is interested in their advertisement and is more likely to click their
advertisement which will not damage their brand. For advertising platform, it will not waste
excessive resources to the users who are unlikely to click the advertisement at all. It will reduce
the user’s disgusted feeling and avoid advertisement pollution in their platform.
In addition, our front end also can produce the percentage of the user whose prediction CTR is
higher than the threshold. Compared to the target user recommendation, it make more sense to
give the percentage. As we all know, in the recent years, almost all of the advertising platform

71
just charge the fee from the advertiser only the putting advertisement is clicked. Taking this
situation into consideration, we propose an idea that the advertising platform can charge different
fee when the prediction percentage target user is different. For example, if the predicted
percentage is small which means the users of this platform is less likely to be interested in this
advertisement, then if the advertiser still want to put the advertisement on this platform, then this
platform will charge less fee considering the less effect. On the contrary, if the predicted
percentage is extremely high which means the users of this platform is more likely to be
interested in this advertisement, then this platform will charge more fee considering the extreme
good effect. We have finished this work on our predicted model and backend work. We also
regarded it as an feature of the front end page which means it will be integrated as a part of the
front end page in the future.
Additionally, for the custom choice, our project achieves that it allows advertiser to choose
different advertisement platform. Our system will provide a list of platform for the advertiser to
choose, after knowing each platforms’ predicted percentage, the advertiser can make final
decision about where to put their advertisement. If all of the platform returns low result which
means in all of the platform, this advertisement cannot attract users’ eyes, then the advertiser is
recommended to either reposition their advertisement or change some key features of your
advertisements in order to meet more users’ interest.
6.4 Abnormal case explanation (the most important task if you have it)
1. We found there are some abnormal data including: abnormal value and missing data. For
abnormal value. We simply remove some and scale the numeric value into range(0, 1) for better
computing performance. For missing data, we fill by 0 and -1 for different scenario.
2. During training process, we got unexpected validation result. We expect that validation result
would rise with training result. The thing is we found the validation result fall down every time.
And for every fold of K-Fold, the validation result has a high value at the first, then falls down.
We think it is because of the data. The data we have contains too many sample, which cause

72
validation set has many features that training set doesn’t contain. However, we found that the
AUC values of validation and training go closer and closer.
6.5 Discussion
1. Feature extracting
We extract feature from four different csv files. These feature may be not so good because we
don’t know the relationship between features and result. Some relationship are obvious and some
are not. There may be different ways to extract feature. We don’t have time to do more
experiments.
2. How to get better performance
The performance of our model are not good enough. We define lots of parameters to run
DeepFM model, including deep depth, number of nodes, embedding layer size, learning rate, etc.
Tuning these parameters would change the performance. However, the performance could be
better or worse. It would take us a lot of time to do optimize our model. Due to the time limit, we
could not continue to optimize our model.
73
7. Conclusions and Recommendations
7.1 Summary and Conclusions
The project almost achieve the proposed goals and hypothesis. The main work of this project is
composed of the following main three part: massive data cleaning and data feature catching,
prediction model training and front end recommendation system designing.
Firstly we cleaned the massive data and caught the data features from them. We use real-world
advertising dataset collect from taobao users by Alibaba. The data is formed by randomly
sampled 1140000 users from the website of Taobao for 8 days advertising display and click. The
whole raw data contains advertising information, user profile information, user behavior logs and
advertising clicking information. Before we use them as the input data of the training model, we
analyze the data in details and do a lot of clean work for them. We firstly discuss about how
many features should be kept for the user input data. The features of the user data is used to
demonstrate the preference and interest of one certain user, so finally we choose six typical
features from the user profile: sex, age, consumption level, shopping dependency, whether is a
student or not, the city they live and combined them with the user’s history shopping and
browsing list and click history record in the previous seven days to entirely demonstrate the
preference of one user. Then all of the user datas are processed and store as a row of the csv file.
Similarly, we keep some main features for the advertisement, including the advertiser name,
category and brand of the product, price of the product and some keywords of the advertisement.
In a word, we did the data clean for not only the user information, but also the advertisement
information.
Secondly we choose an appropriate algorithm and proposed and suitable prediction model then
trained it. After comparing other algorithm and other approaches used in advertisement CTR
prediction, DeepFM is chosen by our project. Considering that the quality of the predicted model

74
will have the biggest influence on the final predicted result, so we spend a lot of time to train the
model by use as much training data as possible. After several forward and backward of batches’
and several iteration of epochs, the parameters, such as the number of hidden layer, the number
of the node in each layer, the initial value of the functions are determined and the predicted
model is used to do real life prediction work.
Thirdly we designed the front end recommendation system. The front end recommendation
system includes two main part, one is advertiser part which is used by the advertiser who want to
put the advertisement on the platform, another is platform part which is used by various
advertising platform who want to attract more advertiser to put their advertisement on their
platform. The advertiser is required to enter the category, brand, price and other features in the
home page, then they also have the personal choice to choose one specific platform to do the
prediction. The advertising platform is required to submit their user data which is already
processed in the specific format. If more and more advertiser and advertising platform are
willing to our prediction system, then the advertiser will have more choice when deciding to use
which platform and the platform will know more information about coming advertisement which
achieve a win-win result. In the recommendation system,
In a word, our project successfully achieved an advertisement CTR prediction and
recommendation system which has a relative high prediction accuracy. The system is beneficial
to user, advertiser and also to the advertising platform by decreasing the advertisement pollution
on the Internet. The goals and hypothesis are almost achieved in our project and even get a better
result.
7.2 Recommendations for future studies
The AUC is a used to evaluate the prediction model performance. The higher AUC is, the better
the prediction model perform. Thus, to improve the AUC of our prediction model through
adjusting coefficients and choose the data features would be a direction in the future study.

75
Our project will provide a recommendation system which demonstrates the potential targeting
user group based on the click probability calculated by the prediction model . In our target user
recommendation system, CTR threshold is used to decide whether a user should be a target user.
If the click probability of a certain user, which is forecasted from the prediction model, is larger
than the CTR threshold, then this user is recommended as a target user by our system.
It is obvious that a reasonable CTR threshold is of great importance for the effectiveness and
economical efficiency recommendation system. A reasonable CTR threshold should ensure a
desirable actual ad click through rate of target users, meanwhile it should also ensure the
advocacy of advertisers, which keeps the appearance on public and increases the awareness of
companies and products.If CTR threshold is set to be too high, the target users will have a very
high probability to click the ad. However, a high CTR threshold will make the target user pool
too small, so that this ad make only a small coverage. On the other hand, a low CTR threshold
will guarantee this ad a high coverage, but make the this ad a low actual CTR. Thus, the
contributing factors that should be considered for setting a reasonable CTR includes the desired
advertisements coverage and the desired actual CTR wanted.
Additionally, the current statistic data shows that the CTR of different industries vary greatly
(shown in Table 6). Thus, it is reasonable to consider different CTR threshold for different
industry category when setting the benchmark to recommendation.
The decision of a reasonable CTR threshold could be studied in the future work.

76
8. Bibliography
Bagherjeiran, A., & Parekh, R. (2008, December). Combining behavioral and social network data for online
advertising. In Data Mining Workshops, 2008. ICDMW'08. IEEE International Conference on (pp. 837-846). IEEE.
Zhu, Z. A., Chen, W., Minka, T., Zhu, C., & Chen, Z. (2010, February). A novel click model and its applications to
online advertising. In Proceedings of the third ACM international conference on Web search and data mining (pp.
321-330). ACM.
Craswell, N., Zoeter, O., Taylor, M., & Ramsey, B. (2008, February). An experimental comparison of click position-
bias models. In Proceedings of the 2008 international conference on web search and data mining (pp. 87-94). ACM.
Richardson, M., Dominowska, E., & Ragno, R. (2007, May). Predicting clicks: estimating the click-through rate for
new ads. In Proceedings of the 16th international conference on World Wide Web (pp. 521-530). ACM.
Chen, J., Sun, B., Li, H., Lu, H., & Hua, X. S. (2016, October). Deep ctr prediction in display advertising. In
Proceedings of the 2016 ACM on Multimedia Conference (pp. 811-820). ACM.
Minka, T. P. (2001). A family of algorithms for approximate Bayesian inference (Doctoral dissertation,
Massachusetts Institute of Technology).
Pan, J., Xu, J., Ruiz, A. L., Zhao, W., Pan, S., Sun, Y., & Lu, Q. (2018). Field-weighted Factorization Machines for
Click-Through Rate Prediction in Display Advertising. Proceedings of the 2018 World Wide Web Conference on
World Wide Web - WWW 18.

77
Qu, Y., Cai, H., Ren, K., Zhang, W., Yu, Y., Wen, Y., & Wang, J. (2016, December). Product-based neural
networks for user response prediction. In Data Mining (ICDM), 2016 IEEE 16th International Conference on (pp.
1149-1154). IEEE.
Ploy, M. C., Denis, F., Courvalin, P., & Lambert, T. (2000). Molecular Characterization of Integrons
inAcinetobacter baumannii: Description of a Hybrid Class 2 Integron. Antimicrobial agents and chemotherapy,
44(10), 2684-2688.
Zhang, W., Du, T., & Wang, J. (2016, March). Deep learning over multi-field categorical data. In European
conference on information retrieval (pp. 45-57). Springer, Cham.
Ren, K., Zhang, W., Rong, Y., Zhang, H., Yu, Y., & Wang, J. (2016, October). User response learning for directly
optimizing campaign performance in display advertising. In Proceedings of the 25th ACM International on
Conference on Information and Knowledge Management (pp. 679-688). ACM.
Wang, T., Bian, J., Liu, S., Zhang, Y., & Liu, T. Y. (2013, August). Psychological advertising: exploring user
psychology for click prediction in sponsored search. In Proceedings of the 19th ACM SIGKDD international
conference on Knowledge discovery and data mining (pp. 563-571). ACM.
Chapelle, O. (2015, May). Offline evaluation of response prediction in online advertising auctions. In Proceedings
of the 24th International Conference on World Wide Web (pp. 919-922). ACM.
Oentaryo, R. J., Lim, E. P., Low, J. W., Lo, D., & Finegold, M. (2014, February). Predicting response in mobile
advertising with hierarchical importance-aware factorization machine. In Proceedings of the 7th ACM international
conference on Web search and data mining (pp. 123-132). ACM.

78
Vasile, F., & Lefortier, D. (2016). Cost-sensitive learning for bidding in online advertising auctions. CoRR.
Lee, K. C., Jalali, A., & Dasdan, A. (2013, August). Real time bid optimization with smooth budget delivery in
online advertising. In Proceedings of the Seventh International Workshop on Data Mining for Online Advertising (p.
1). ACM.
Ren, K., Zhang, W., Rong, Y., Zhang, H., Yu, Y., & Wang, J. (2016, October). User response learning for directly
optimizing campaign performance in display advertising. In Proceedings of the 25th ACM International on
Conference on Information and Knowledge Management (pp. 679-688). ACM.
Ren, K., Zhang, W., Chang, K., Rong, Y., Yu, Y., & Wang, J. (2018). Bidding Machine: Learning to Bid for
Directly Optimizing Profits in Display Advertising. IEEE Transactions on Knowledge and Data Engineering, 30(4),
645-659.
Lim, J. S. (2017). The third-person effect of online advertising of cosmetic surgery: A path model for predicting
restrictive versus corrective actions. Journalism & Mass Communication Quarterly, 94(4), 972-993.
Kim, H., & Hanssens, D. M. (2017). Advertising and word-of-mouth effects on pre-launch consumer interest and
initial sales of experience products. Journal of Interactive Marketing, 37, 57-74.
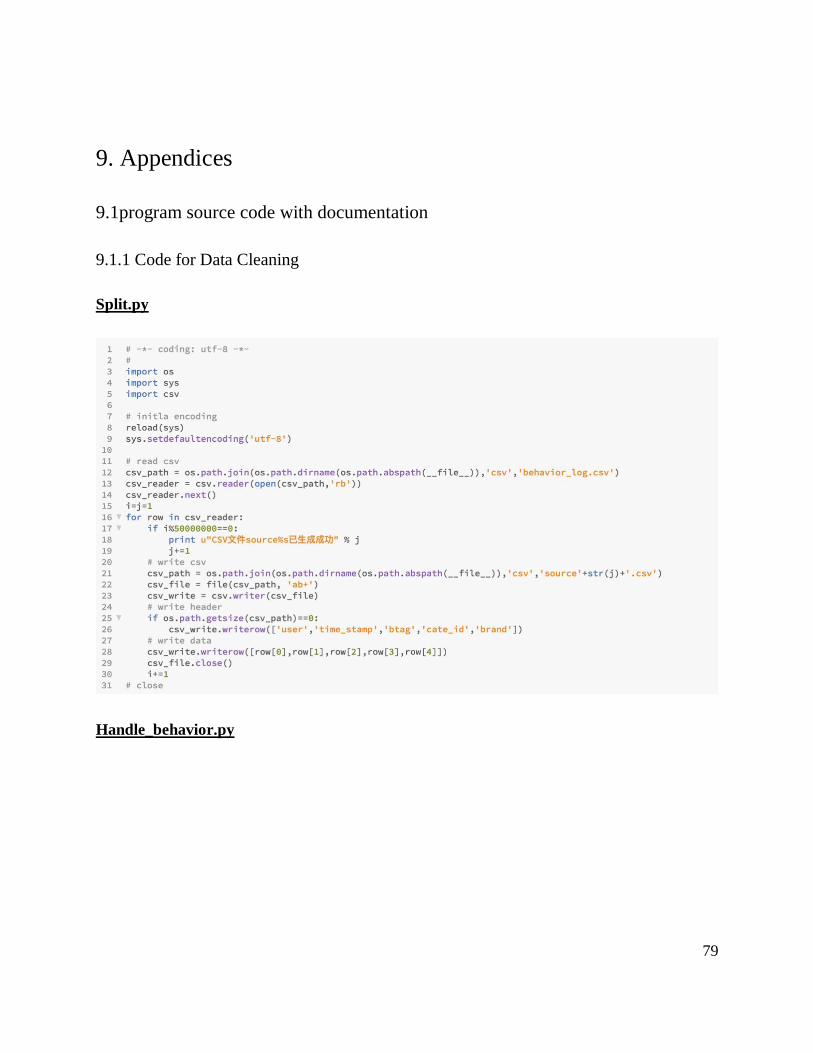
79
9. Appendices
9.1program source code with documentation
9.1.1 Code for Data Cleaning
Split.py
Handle_behavior.py

80
Merge.py

81

82
9.1.2 Code for Model Training and Recommendation
DeepFM.py

83
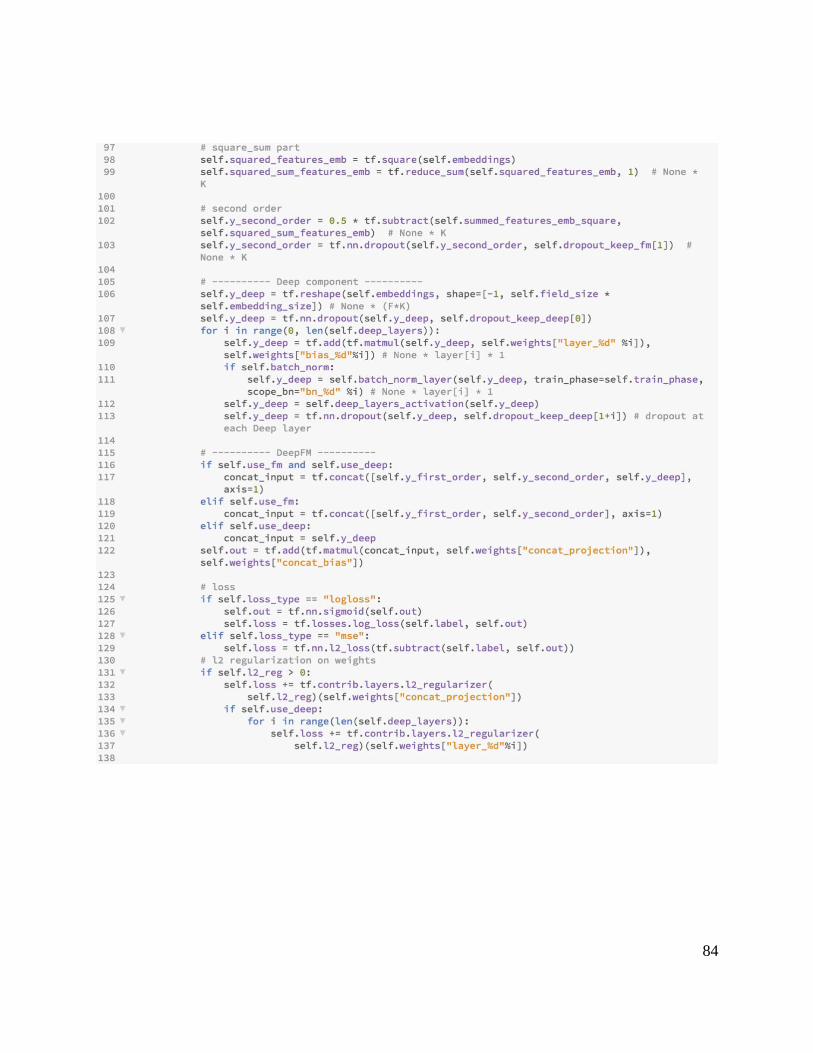
84
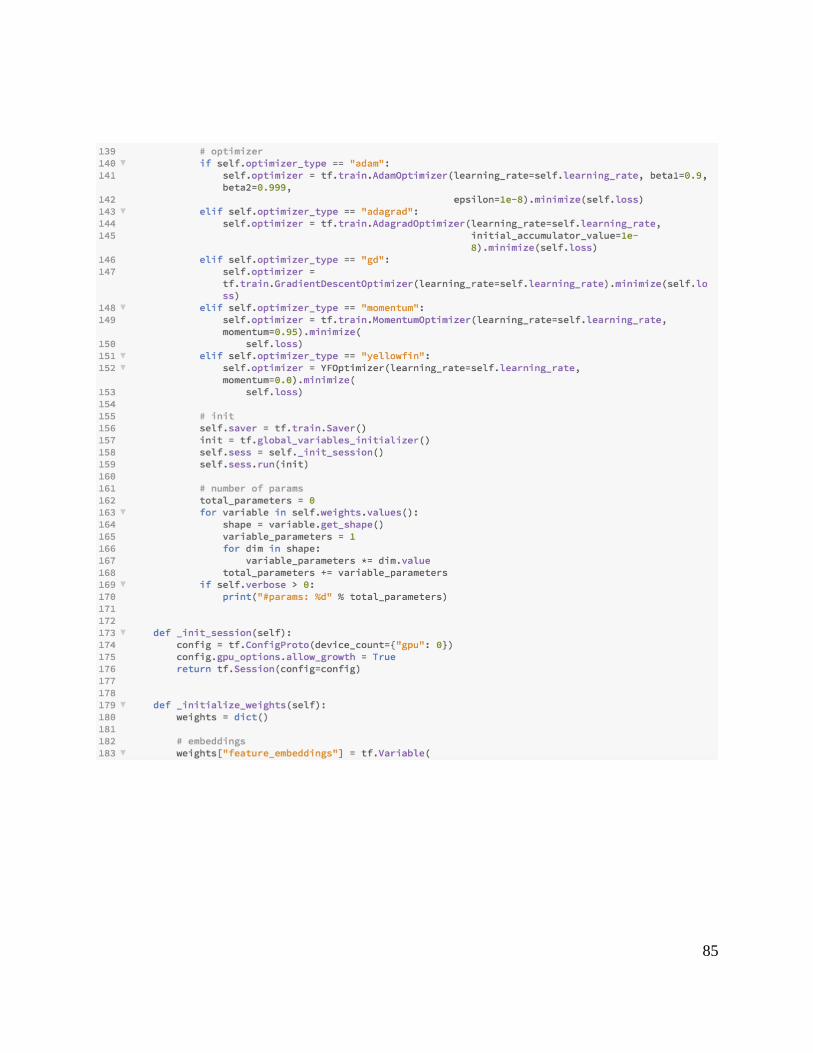
85

86

87

88

89
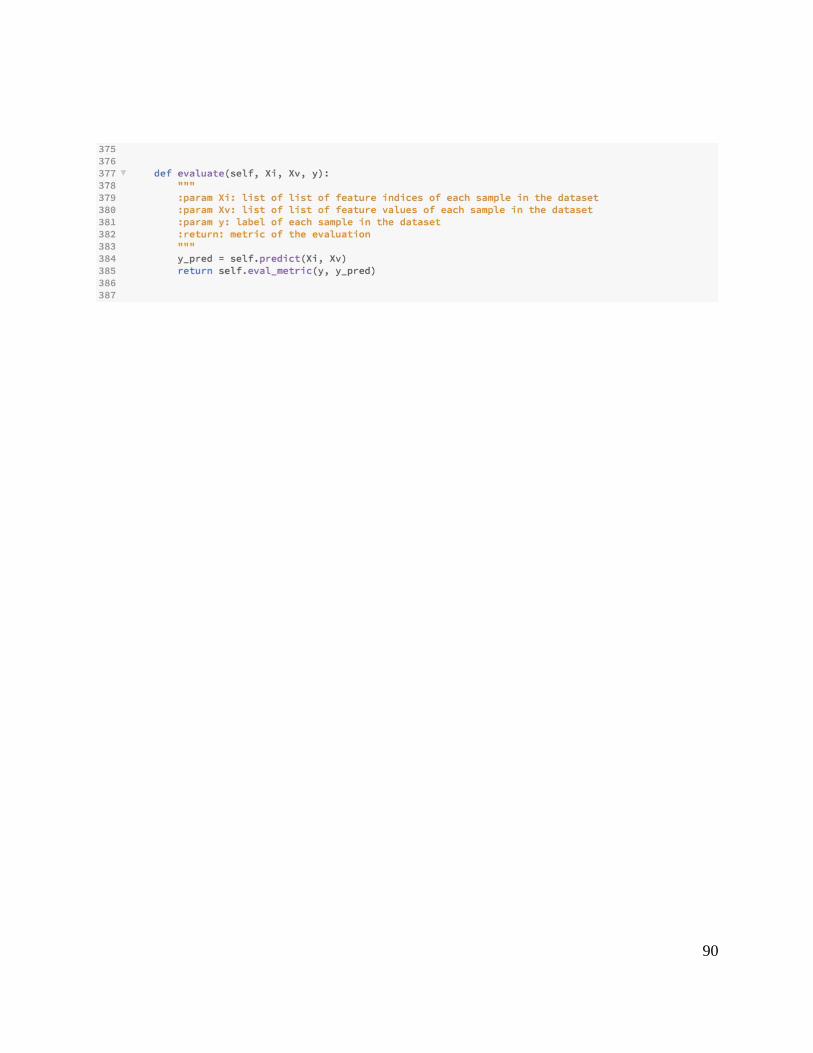
90

91
Main.py
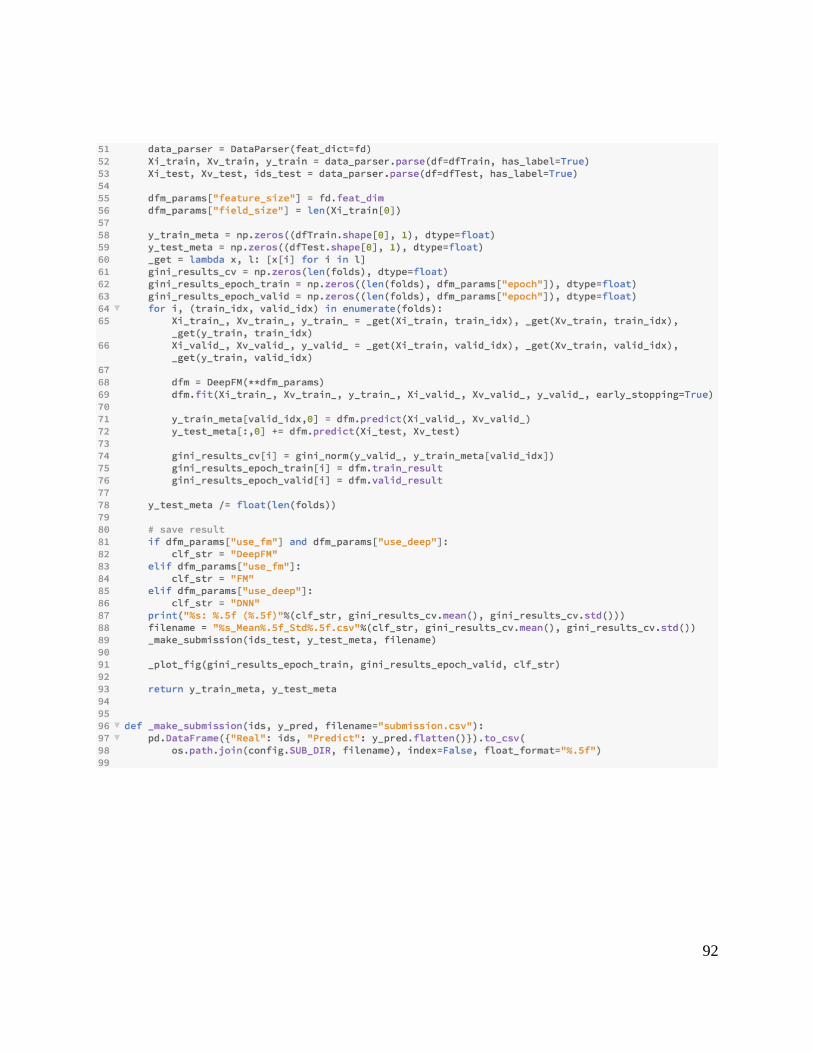
92
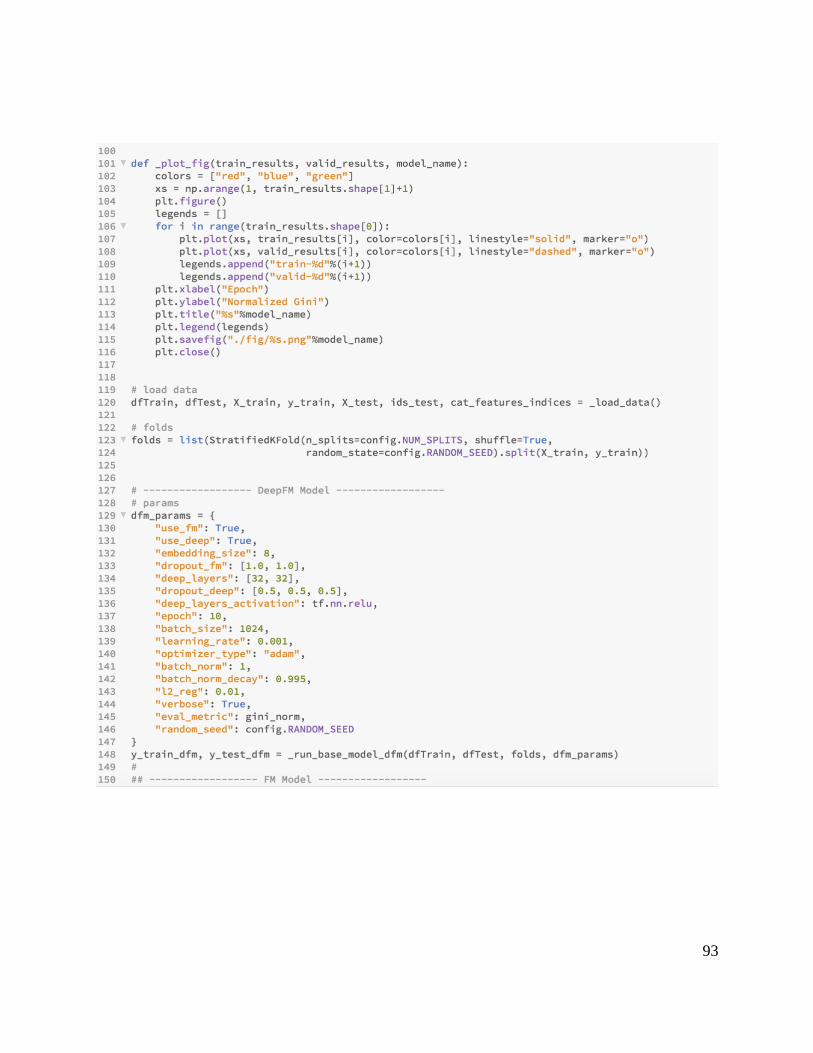
93
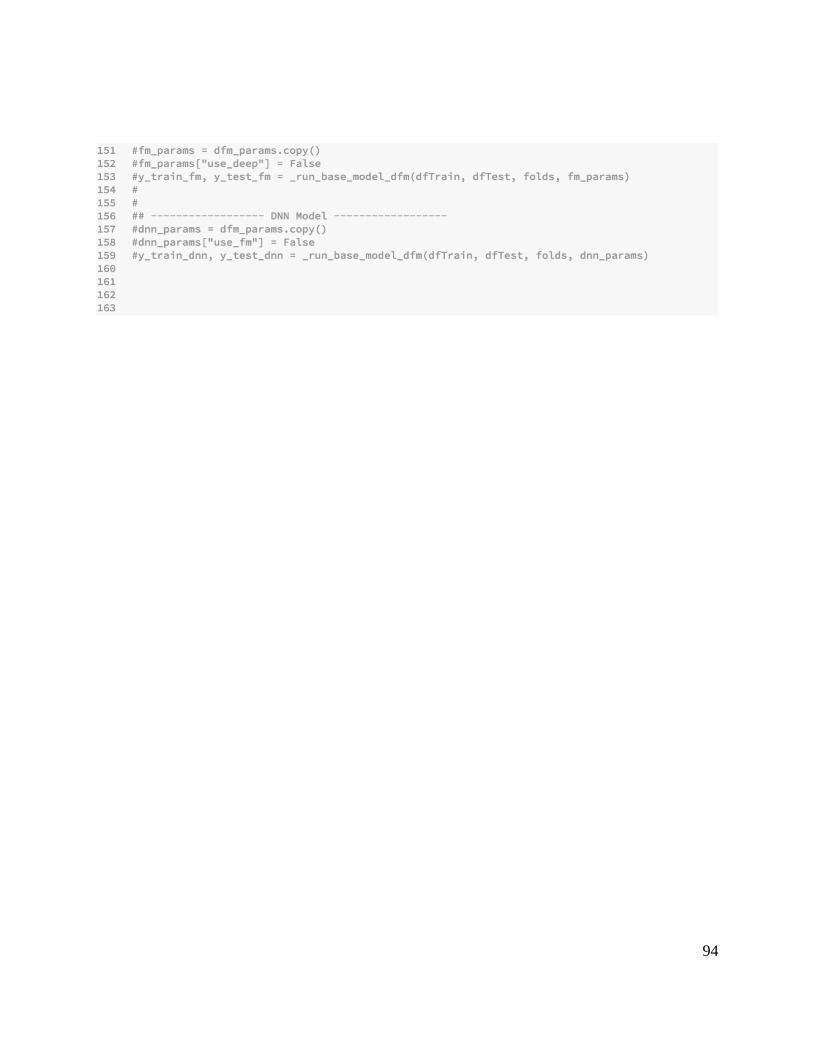
94
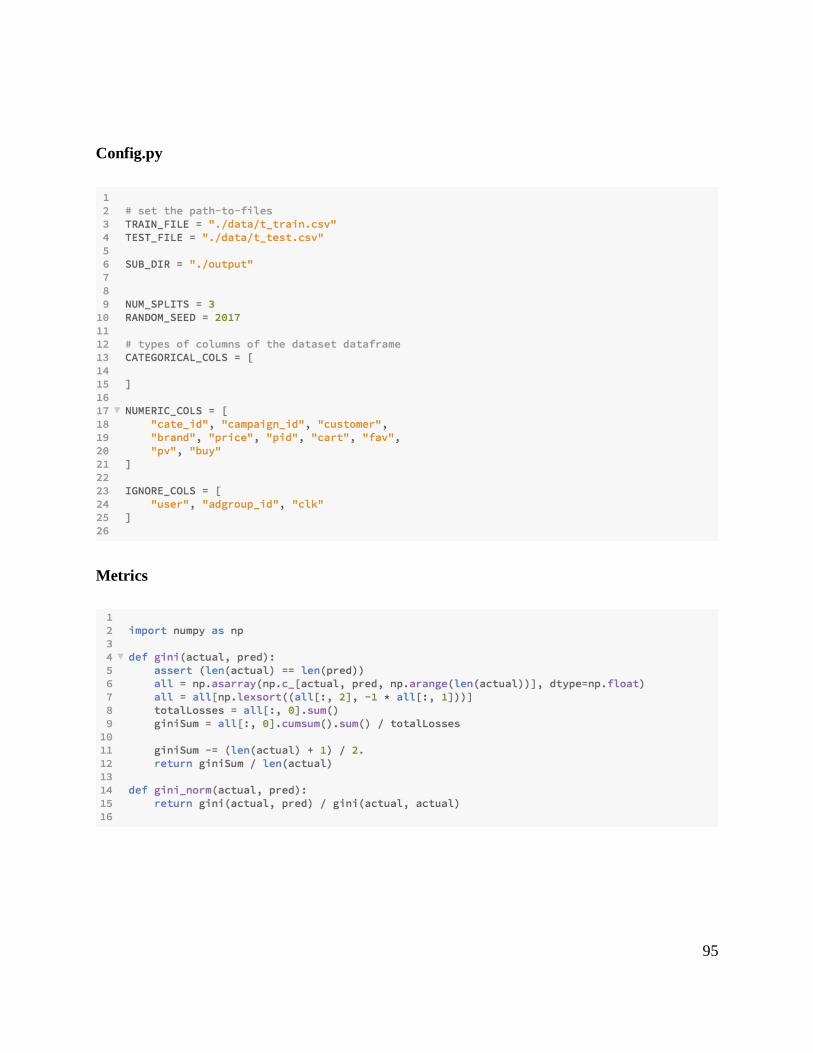
95
Config.py
Metrics
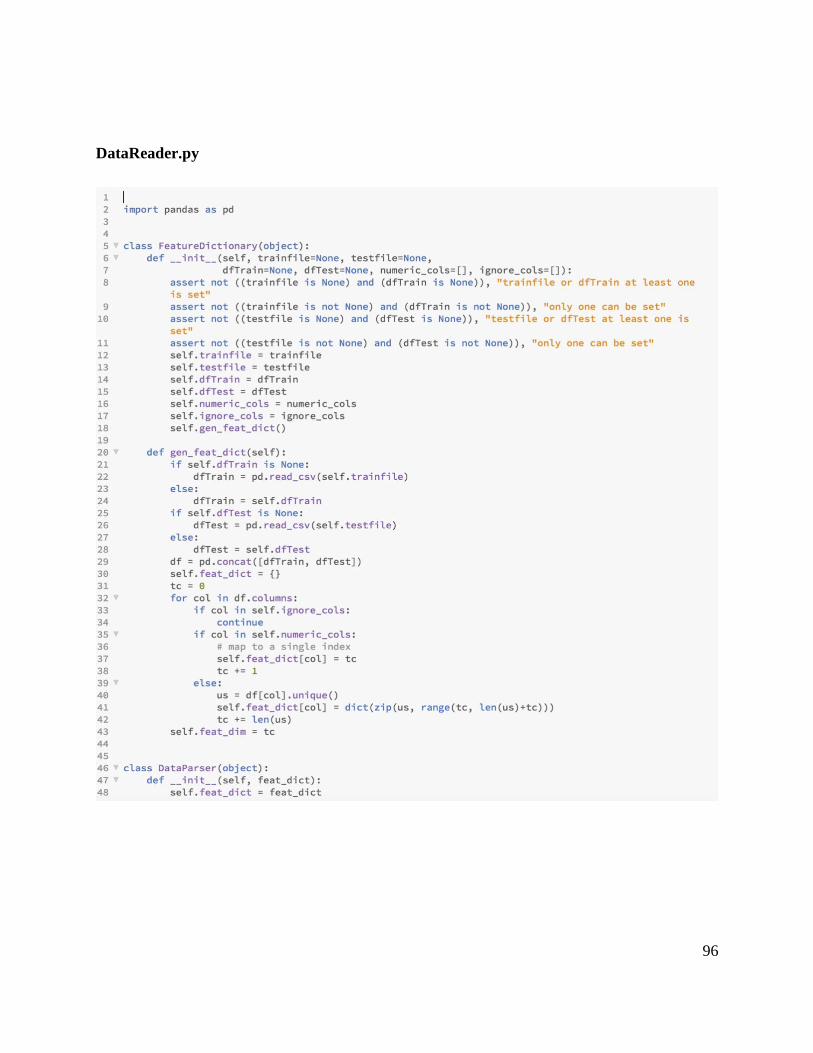
96
DataReader.py

97

98
9.1.3 Code for Front End Development
Home page
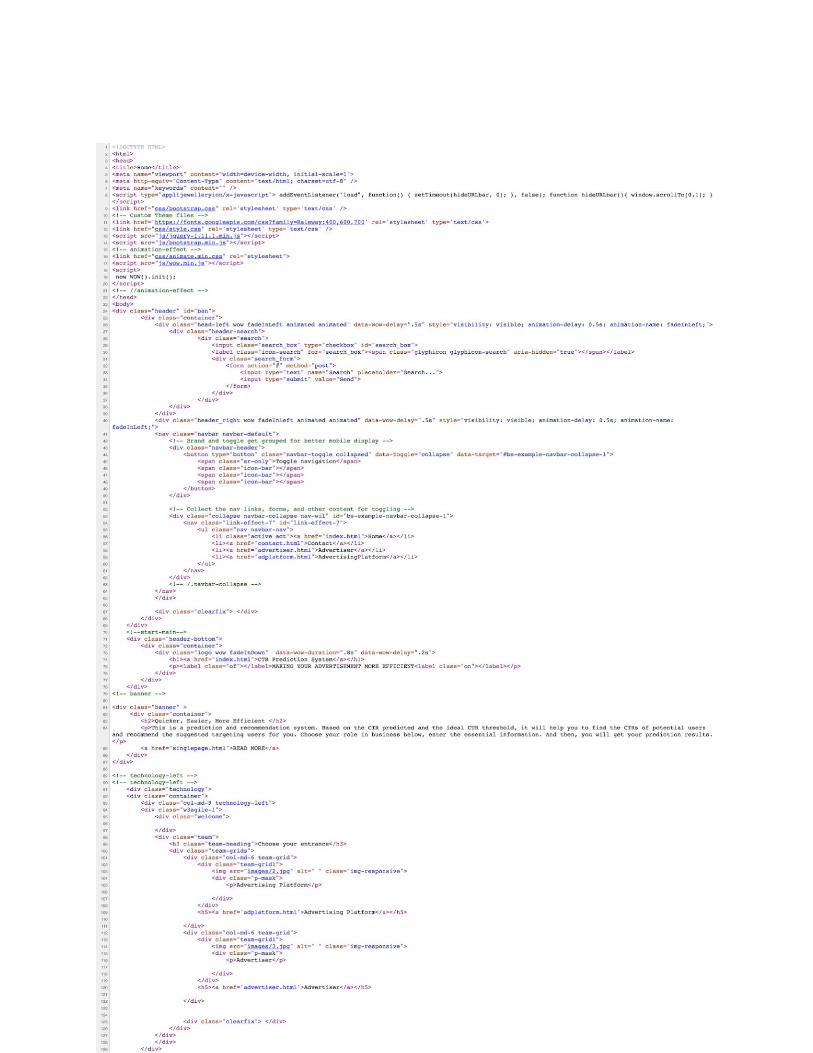
99

100
Advertising platform page

101

102
Advertiser page

103

104
Contact page
105
106
CSS

107

108
9.2 input/output listing
Our input contains a list of advertising features user advertiser input from website. And we
concate these features with the user features we have in our user pool to a format that our model
require. For every sample, we process the data into index:value format as input.
Our output contains probability that every user will click the advertising, and a list of users
whose probability is larger that the threshold.
Related Documents


![[Study] The Definitive Organic Click Through Rate Study](https://static.cupdf.com/doc/110x72/58ad166f1a28ab50728b4925/study-the-definitive-organic-click-through-rate-study.jpg)