ORIGINAL RESEARCH Progressive right ventricular functional and structural changes in a mouse model of pulmonary arterial hypertension Zhijie Wang 1 , David A. Schreier 1 , Timothy A. Hacker 2 & Naomi C. Chesler 1,2 1 Department of Biomedical Engineering, University of Wisconsin – Madison, Madison, 53706, Wisconsin 2 Department of Medicine, University of Wisconsin, Madison, 53706, Wisconsin Keywords RV dysfunction, RV overload, SUGEN, ventricular–vascular coupling. Correspondence Naomi C. Chesler, Department of Biomedical Engineering, University of Wisconsin – Madison, 2146 Engineering Centers Building, 1550 Engineering Drive, Madison, WI 53706. Tel: 608/265-8920 Fax: 608/265-9239 E-mail: [email protected] Funding Information National Institutes of Health (NIH) R01 HL086939 (N. C. C.) and AHA Midwest Affiliate Postdoctoral Fellowship 10POST2640148 (Z. W.). Received: 2 September 2013; Revised: 13 October 2013; Accepted: 18 October 2013 doi: 10.1002/phy2.184 Physiol Rep, 1 (7), 2013, e00184, doi: 10.1002/phy2.184 Abstract Right ventricle (RV) dysfunction occurs with progression of pulmonary arterial hypertension (PAH) due to persistently elevated ventricular afterload. A critical knowledge gap is the molecular mechanisms that govern the transition from RV adaptation to RV maladaptation, which leads to failure. Here, we hypothesize that the recently established mouse model of PAH, via hypoxia and SU5416 treatment (HySu), captures that transition from adaptive to maladaptive RV remodeling including impairments in RV function and decreases in the efficiency of RV interactions with the pulmonary vasculature. To test this hypothesis, we exposed C57BL6 male mice to 0 (control), 14, 21, and 28 days of HySu and then obtained synchronized RV pressure and volume measurements in vivo. With increasing HySu exposure duration, arte- rial afterload increased monotonically, leading to a continuous increase in RV stroke work, RV fibrosis, and RV wall stiffening (P < 0.05). RV contractility increased at 14 days of HySu exposure and then plateaued (P < 0.05). As a result, ventricular–vascular coupling efficiency tended to increase at 14 days and then decrease. Our results suggest that RV remodeling may begin to shift from adaptive to maladaptive with increasing duration of HySu exposure, which would mimic changes in RV function with PAH progression found clinically. However, for the duration of HySu exposure used here, no drop in cardiac output was found. We conclude that the establishment of a mouse model for overt RV failure due to PAH remains an important task. Introduction Pulmonary arterial hypertension (PAH) is the most severe form of pulmonary hypertension due to its rapid progression to right ventricular (RV) failure (McLaughlin et al. 2009). It is manifested as marked arterial remodeling and occlusion, mostly at the small distal arte- rioles, as well as mechanical stiffening of both proximal and distal pulmonary arteries (McLaughlin et al. 2009; Wang and Chesler 2011). Left untreated, the estimated median survival of PAH is 2.8 years (D’Alonzo et al. 1991; Humbert et al. 2010). Historical perspectives of PAH focus on the pulmonary vascular changes during PAH progression and thus treatment strategies often target these changes. However, even with modern therapy, the clinical outcomes of PAH are poor (Voelkel et al. 2012), which suggests that understanding the mechanisms that underlie RV dysfunction and failure may be critical to more successful treatments of the disease. A well-established rat model to study PAH is the combination of chronic hypoxia with antiproliferation treatment by SU5416 (i.e., HySu exposure) (Taraseviciene- Stewart et al. 2001) (Also, see a recent review from Nicolls et al. [2012]). However, unless genetic modification is employed, no known treatment creates severe or irreversible PAH in mice (Gomez-Arroyo et al. 2012). Mice are advan- tageous as a species for modeling human disease because they can be more easily genetically modified and are less ª 2013 The Authors. Physiological Reports published by Wiley Periodicals, Inc. on behalf of the American Physiological Society and The Physiological Society. This is an open access article under the terms of the Creative Commons Attribution License, which permits use, distribution and reproduction in any medium, provided the original work is properly cited. 2013 | Vol. 1 | Iss. 7 | e00184 Page 1 Physiological Reports ISSN 2051-817X

Welcome message from author
This document is posted to help you gain knowledge. Please leave a comment to let me know what you think about it! Share it to your friends and learn new things together.
Transcript
ORIGINAL RESEARCH
Progressive right ventricular functional and structuralchanges in a mouse model of pulmonary arterialhypertensionZhijie Wang1, David A. Schreier1, Timothy A. Hacker2 & Naomi C. Chesler1,2
1 Department of Biomedical Engineering, University of Wisconsin – Madison, Madison, 53706, Wisconsin
2 Department of Medicine, University of Wisconsin, Madison, 53706, Wisconsin
Keywords
RV dysfunction, RV overload, SUGEN,
ventricular–vascular coupling.
Correspondence
Naomi C. Chesler, Department of Biomedical
Engineering, University of Wisconsin –
Madison, 2146 Engineering Centers Building,
1550 Engineering Drive, Madison, WI 53706.
Tel: 608/265-8920
Fax: 608/265-9239
E-mail: [email protected]
Funding Information
National Institutes of Health (NIH) R01
HL086939 (N. C. C.) and AHA Midwest
Affiliate Postdoctoral Fellowship
10POST2640148 (Z. W.).
Received: 2 September 2013; Revised: 13
October 2013; Accepted: 18 October 2013
doi: 10.1002/phy2.184
Physiol Rep, 1 (7), 2013, e00184, doi:
10.1002/phy2.184
Abstract
Right ventricle (RV) dysfunction occurs with progression of pulmonary
arterial hypertension (PAH) due to persistently elevated ventricular afterload.
A critical knowledge gap is the molecular mechanisms that govern the
transition from RV adaptation to RV maladaptation, which leads to failure.
Here, we hypothesize that the recently established mouse model of PAH, via
hypoxia and SU5416 treatment (HySu), captures that transition from adaptive
to maladaptive RV remodeling including impairments in RV function and
decreases in the efficiency of RV interactions with the pulmonary vasculature.
To test this hypothesis, we exposed C57BL6 male mice to 0 (control), 14, 21,
and 28 days of HySu and then obtained synchronized RV pressure and
volume measurements in vivo. With increasing HySu exposure duration, arte-
rial afterload increased monotonically, leading to a continuous increase in RV
stroke work, RV fibrosis, and RV wall stiffening (P < 0.05). RV contractility
increased at 14 days of HySu exposure and then plateaued (P < 0.05). As a
result, ventricular–vascular coupling efficiency tended to increase at 14 days
and then decrease. Our results suggest that RV remodeling may begin to shift
from adaptive to maladaptive with increasing duration of HySu exposure,
which would mimic changes in RV function with PAH progression found
clinically. However, for the duration of HySu exposure used here, no drop in
cardiac output was found. We conclude that the establishment of a mouse
model for overt RV failure due to PAH remains an important task.
Introduction
Pulmonary arterial hypertension (PAH) is the most severe
form of pulmonary hypertension due to its rapid
progression to right ventricular (RV) failure (McLaughlin
et al. 2009). It is manifested as marked arterial
remodeling and occlusion, mostly at the small distal arte-
rioles, as well as mechanical stiffening of both proximal
and distal pulmonary arteries (McLaughlin et al. 2009;
Wang and Chesler 2011). Left untreated, the estimated
median survival of PAH is 2.8 years (D’Alonzo et al.
1991; Humbert et al. 2010). Historical perspectives of
PAH focus on the pulmonary vascular changes during
PAH progression and thus treatment strategies often
target these changes. However, even with modern therapy,
the clinical outcomes of PAH are poor (Voelkel et al.
2012), which suggests that understanding the mechanisms
that underlie RV dysfunction and failure may be critical
to more successful treatments of the disease.
A well-established rat model to study PAH is the
combination of chronic hypoxia with antiproliferation
treatment by SU5416 (i.e., HySu exposure) (Taraseviciene-
Stewart et al. 2001) (Also, see a recent review from Nicolls
et al. [2012]). However, unless genetic modification is
employed, no known treatment creates severe or irreversible
PAH in mice (Gomez-Arroyo et al. 2012). Mice are advan-
tageous as a species for modeling human disease because
they can be more easily genetically modified and are less
ª 2013 The Authors. Physiological Reports published by Wiley Periodicals, Inc. on behalf of
the American Physiological Society and The Physiological Society.
This is an open access article under the terms of the Creative Commons Attribution License,
which permits use, distribution and reproduction in any medium, provided the original work is properly cited.
2013 | Vol. 1 | Iss. 7 | e00184Page 1
Physiological Reports ISSN 2051-817X
expensive for long-term studies compared to rats and other
larger animals. Recently, it has been reported that after
21 days of HySu exposure, C57BL6 mice develop pulmo-
nary hypertension that recapitulates hallmarks of human
PAH, especially distal arteriolar neointima formation and
obliteration (Ciuclan et al. 2011). Incipient RV failure
(defined by decreased cardiac output) was reported after
21 days of HySu exposure; however, the changes in RV
function were not examined comprehensively. Thus, the
suitability of this model for studying the molecular mecha-
nisms of RV dysfunction and even failure remains unclear.
Our group has recently established expertise and
techniques to measure hemodynamics and evaluate RV
function in mice in vivo (Tabima et al. 2010). Employ-
ing these methodologies, here we investigate the hypoth-
esis that the HySu mouse model recapitulates the
transition from compensatory, adaptive RV remodeling
to noncompensatory, maladaptive RV remodeling found
in PAH clinically. Unlike in the Ciuclan et al.’s (2011)
study, we did not observe a significant drop in cardiac
output, but we did find changes indicative of RV dys-
function with PAH progression. Furthermore, our hemo-
dynamic data are suitable for identifying a mathematical
model to provide additional insights into the tissue-level
RV and pulmonary vascular changes that occur in this
mouse model of PAH (Tewari et al. 2013, companion
paper).
Methods
Animals
Male C57BL6/J mice, with a body weight of 23.6 � 0.3 g,
were obtained from Jackson Laboratory (Bar Harbor,
ME). These mice were randomized into four groups
(Normoxia, 14-day HySu, 21-day HySu, and 28-day
HySu) and then exposed to 0 (N = 8), 14 (N = 9), 21
(N = 9), or 28 (N = 8) days of normobaric hypoxia (10%
oxygen) created in an environmentally controlled cham-
ber in which nitrogen was mixed with room air (Ooi
et al. 2010). The mice exposed to hypoxia were also
treated with SUGEN (SU5416; Sigma, St. Louis, MO) at
a dose of 20 mg/kg once weekly via intraperitoneal
(i.p.) injection. The hypoxia chamber was opened for
10–20 min two to three times per week to give injections,
change cages, and replenish food and water. The normox-
ia control group was housed in room air and treated with
vehicle (CMC [0.5% (w/v) carboxymethylcellulose
sodium, 0.9% (w/v) sodium chloride, 0.4% (v/v) polysor-
bate 80, 0.9% (v/v) benzyl alcohol in deionized water]
solution) once weekly via i.p. injection for 3–8 weeks. All
mice were 10–12 weeks old at the time of euthanasia.
All mice were exposed to a 12-h light-dark cycle. The
University of Wisconsin Institutional Animal Care and
Use Committee approved all procedures.
Anesthesia, ventilation, and ventricularexposure
For in vivo RV pressure–volume (PV) measurements,
mice were anesthetized with urethane solution (1000–1200 mg/kg-bw i.p.), intubated, and placed on a ventila-
tor (Harvard Apparatus, Holliston, MA) using a tidal
volume of ~225 lL and respiratory rate of ~125 breaths/
min. They were then placed supine on a heated pad to
maintain body temperature at 38° to 39°C. A ventral
midline skin incision was made from the lower mandible
inferior to the xiphoid process. The thoracic cavity was
entered through the sternum. The chest wall and lungs
were carefully retracted to expose the RV. Hydroxyethyl-
starch (~24 lg) (6%; 2 mg/g body weight) was injected
intravenously to restore vascular volumes as reported
previously (Pacher et al. 2008; Porterfield et al. 2009).
Instrumentation and in vivo hemodynamicmeasurements
The left carotid artery was cannulated with a 1.2 F cathe-
ter tipped pressure transducer (Scisense, London, Ontario,
Canada) and advanced into the ascending aorta to mea-
sure systemic blood pressure. Subsequently, the apex of
the RV was localized and a 1.4 F admittance PV catheter
(Scisense, Ithaca, NY) was introduced using a 20-gauge
needle leaving the pericardium intact. This apical punc-
ture technique was used because the stiffness of the
admittance catheter precludes a closed chest approach
with catheter insertion through the jugular vein, which
has been used previously to measure right ventricular
pressure (only) in mice (Tabima et al. 2010). After instru-
mentation was established and initial RV PV measure-
ments were obtained, the inferior vena cava was isolated
and briefly occluded to obtain alterations in venous
return for determination of end-systolic and end-diastolic
pressure relations. This vena cava occlusion (VCO) was
limited to a few seconds in duration to avoid reflex
responses. VCO was performed at least three times. Mea-
surements were obtained under normoxic ventilation con-
ditions. One mouse from the 21-day group died after
instrumentation was established but before hemodynamic
data could be obtained; one mouse from the 0-day group
exhibited abnormally high pulmonary pressure (computed
mean pulmonary arterial pressure >35 mmHg). There-
fore, these two mice were excluded from our data analysis
and N = 8–9 per group.
The magnitude and phase of the electrical admittance
as well as the RV pressure were continuously recorded at
2013 | Vol. 1 | Iss. 7 | e00184Page 2
ª 2013 The Authors. Physiological Reports published by Wiley Periodicals, Inc. on behalf of
the American Physiological Society and The Physiological Society.
Right Ventricular Dysfunction in Pressure Overload Z. Wang et al.
1000 Hz and analyzed on commercially available software
(Notocord Systems, Croissy Sur Seine, France). These
methods are identical to those previously established by
our group (Tabima et al. 2010).
After the in vivo hemodynamic measurements,
animals were euthanized by exsanguinations under
anesthesia and then RV free wall, left ventricle (LV) and
septum tissue were harvested and weighted. RV
hypertrophy was calculated by Fulton index as the
weight ratio of RV and (LV + septum). Then, RV tissue
was saved frozen (�80°C) for biochemical analyses.
Hematocrit was obtained for each mouse immediately
after euthanasia.
Hemodynamic data analysis
The pressure and volume signals were visually checked
for quality and recorded for later analysis. At least 10
consecutive cardiac cycles free of extrasystolic beats were
selected and used for the analysis. Standard hemody-
namic variables including heart rate (HR), RV peak
systolic pressure (RVSP), total PVR (TPVR, estimated
as RVSP/cardiac output), and RV function parameters
such as stroke volume (SV), stroke work (SW), ejection
fraction (EF), cardiac output (CO = SV 9 HR), cham-
ber compliance (DV/DP), pulse pressure (PP), and
effective arterial elastance (Ea) were calculated. RV
contractile function was quantified in three ways: as the
slope of the end-systolic pressure–volume relations
(ESPVR) (Ees), preload-recruitable stroke work (PRSW),
and dP/dtmax. RV end-diastolic indices such as dP/dtmin,
end-diastolic volume (EDV), and relaxation factor
s were calculated as well. Finally, ventricular–vascularcoupling efficiency (g) was calculated as Ees/Ea. Details
on the calculation of the above parameters have been
reported previously by our group (Tabima et al. 2010).
To estimate the efficiency of each contractile myofila-
ment, we further calculated the SW density (mmHg/
beat) as SW (lL mmHg�1 beat�1) per RV free wall tis-
sue volume assuming a tissue density of 1.053 g/mL for
all groups (Vinnakota and Bassingthwaighte 2004).
Biochemical analysis
To examine the RV fibrosis during PAH, collagen
content and cross-linking were measured in frozen RVs
biochemically by hydroxyproline (OHP) and pyridinoline
(PYD) using adapted methods established in previous
studies (Ooi et al. 2010; Wang and Chesler 2012). For
each RV, random cut of the RV tissue sample was
performed to allow collagen content and cross-linking
measurements from single specimen. The results are
presented as lg of OHP per RV tissue weight (lg/mg)
or nmol of PYD per RV tissue weight (nmol/mg).
N = 4–6 per group for the OHP assay and N = 3–6 per
group for the PYD assay.
Statistical analysis
Statistical analysis of in vivo hemodynamics was
performed using a one-way analysis of variance (ANOVA)
with Dunnett’s test for exposure group (Normoxia vs.
14-day HySu/21-day HySu/28-day HySu) or generalized
least squares with multiple comparisons for exposure. To
identify the correlation between RV collagen content and
RV wall compliance, we applied the nonparametric
Spearman rank correlation test with a permutation
analysis using SAS version 9.2, in combination with a
simple linear correlation analysis by Microsoft Excel as
used previously(Ooi et al. 2010; Wang et al. 2013). Data
analysis was conducted using the R software version 2.5.1
(R Foundation for Statistical Computing, Vienna,
Austria). All P-values were two sided and P < 0.05 was
taken as statistically significant. All values are presented as
mean � SE.
Results
Progression of PAH
The success of the HySu treatment in generating severe
PAH was evidenced by the measurements of RVSP
(Table 1), which increased progressively with increased
HySu exposure duration (P < 0.05). This chronic increase
in RV afterload led to RV hypertrophy, which was
measured by Fulton index (Table 1; P < 0.05). In addi-
tion, mice in the HySu exposure groups had increased
hematocrit (Table 1; P < 0.05). We did not observe sig-
nificant changes in systemic pressures or LV mass
(Table 1) between the experimental groups.
Changes in RV function
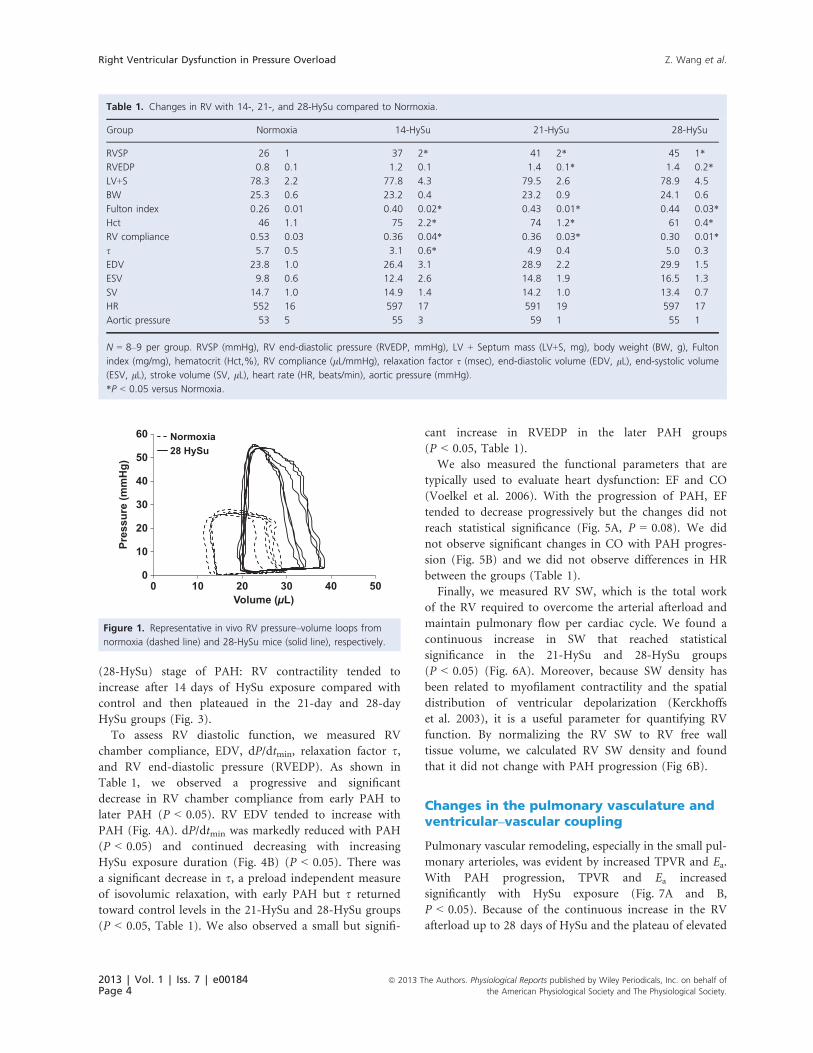
Representative RV PV loops for the normoxia control
and the advanced PAH (28-day HySu) groups are pre-
sented in Figure 1. In addition to the increase in mean
and peak systolic RV pressure with PAH, both EDV and
end-systolic volume (ESV) shifted to the right and there
was a noticeable but nonsignificant decrease in SV. More-
over, we found that after the VCO, it took more heart
beats (cardiac cycles) for the 28-day HySu RVs to recover
compared to the normoxia control (Fig. 2), which may
indicate an impaired RV response with severe PAH.
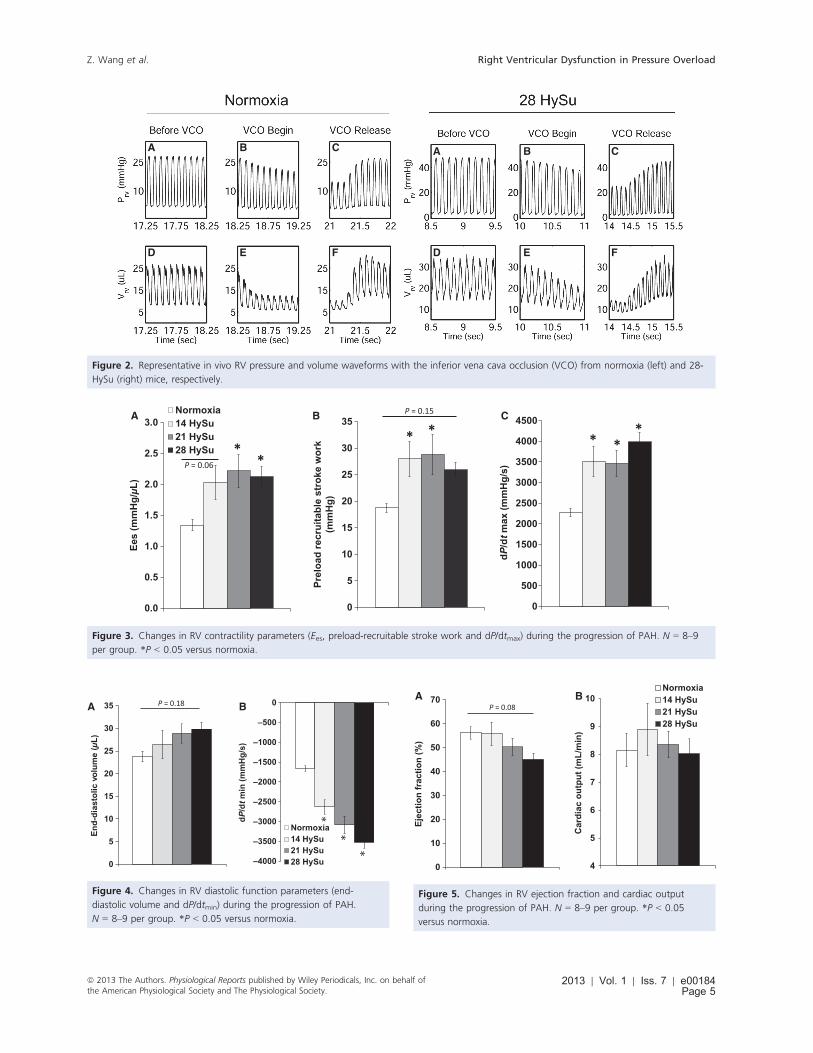
We quantified RV contractile function by Ees, PRSW,
and dP/dtmax. All three parameters showed the same
trends of changes from an early (14-HySu) to later
ª 2013 The Authors. Physiological Reports published by Wiley Periodicals, Inc. on behalf ofthe American Physiological Society and The Physiological Society.
2013 | Vol. 1 | Iss. 7 | e00184Page 3
Z. Wang et al. Right Ventricular Dysfunction in Pressure Overload
(28-HySu) stage of PAH: RV contractility tended to
increase after 14 days of HySu exposure compared with
control and then plateaued in the 21-day and 28-day
HySu groups (Fig. 3).
To assess RV diastolic function, we measured RV
chamber compliance, EDV, dP/dtmin, relaxation factor s,and RV end-diastolic pressure (RVEDP). As shown in
Table 1, we observed a progressive and significant
decrease in RV chamber compliance from early PAH to
later PAH (P < 0.05). RV EDV tended to increase with
PAH (Fig. 4A). dP/dtmin was markedly reduced with PAH
(P < 0.05) and continued decreasing with increasing
HySu exposure duration (Fig. 4B) (P < 0.05). There was
a significant decrease in s, a preload independent measure
of isovolumic relaxation, with early PAH but s returned
toward control levels in the 21-HySu and 28-HySu groups
(P < 0.05, Table 1). We also observed a small but signifi-
cant increase in RVEDP in the later PAH groups
(P < 0.05, Table 1).
We also measured the functional parameters that are
typically used to evaluate heart dysfunction: EF and CO
(Voelkel et al. 2006). With the progression of PAH, EF
tended to decrease progressively but the changes did not
reach statistical significance (Fig. 5A, P = 0.08). We did
not observe significant changes in CO with PAH progres-
sion (Fig. 5B) and we did not observe differences in HR
between the groups (Table 1).
Finally, we measured RV SW, which is the total work
of the RV required to overcome the arterial afterload and
maintain pulmonary flow per cardiac cycle. We found a
continuous increase in SW that reached statistical
significance in the 21-HySu and 28-HySu groups
(P < 0.05) (Fig. 6A). Moreover, because SW density has
been related to myofilament contractility and the spatial
distribution of ventricular depolarization (Kerckhoffs
et al. 2003), it is a useful parameter for quantifying RV
function. By normalizing the RV SW to RV free wall
tissue volume, we calculated RV SW density and found
that it did not change with PAH progression (Fig 6B).
Changes in the pulmonary vasculature andventricular–vascular coupling
Pulmonary vascular remodeling, especially in the small pul-
monary arterioles, was evident by increased TPVR and Ea.
With PAH progression, TPVR and Ea increased
significantly with HySu exposure (Fig. 7A and B,
P < 0.05). Because of the continuous increase in the RV
afterload up to 28 days of HySu and the plateau of elevated
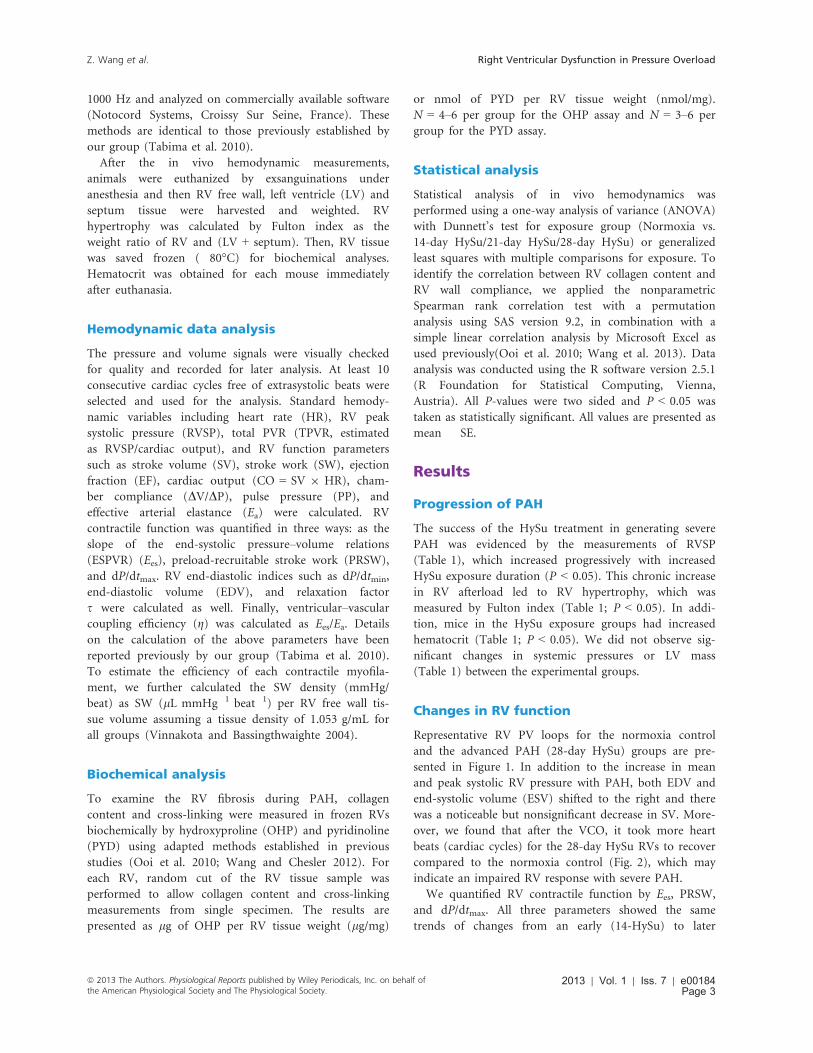
Table 1. Changes in RV with 14-, 21-, and 28-HySu compared to Normoxia.
Group Normoxia 14-HySu 21-HySu 28-HySu
RVSP 26 � 1 37 � 2* 41 � 2* 45 � 1*
RVEDP 0.8 � 0.1 1.2 � 0.1 1.4 � 0.1* 1.4 � 0.2*
LV+S 78.3 � 2.2 77.8 � 4.3 79.5 � 2.6 78.9 � 4.5
BW 25.3 � 0.6 23.2 � 0.4 23.2 � 0.9 24.1 � 0.6
Fulton index 0.26 � 0.01 0.40 � 0.02* 0.43 � 0.01* 0.44 � 0.03*
Hct 46 � 1.1 75 � 2.2* 74 � 1.2* 61 � 0.4*
RV compliance 0.53 � 0.03 0.36 � 0.04* 0.36 � 0.03* 0.30 � 0.01*
s 5.7 � 0.5 3.1 � 0.6* 4.9 � 0.4 5.0 � 0.3
EDV 23.8 � 1.0 26.4 � 3.1 28.9 � 2.2 29.9 � 1.5
ESV 9.8 � 0.6 12.4 � 2.6 14.8 � 1.9 16.5 � 1.3
SV 14.7 � 1.0 14.9 � 1.4 14.2 � 1.0 13.4 � 0.7
HR 552 � 16 597 � 17 591 � 19 597 � 17
Aortic pressure 53 � 5 55 � 3 59 � 1 55 � 1
N = 8–9 per group. RVSP (mmHg), RV end-diastolic pressure (RVEDP, mmHg), LV + Septum mass (LV+S, mg), body weight (BW, g), Fulton
index (mg/mg), hematocrit (Hct,%), RV compliance (lL/mmHg), relaxation factor s (msec), end-diastolic volume (EDV, lL), end-systolic volume
(ESV, lL), stroke volume (SV, lL), heart rate (HR, beats/min), aortic pressure (mmHg).
*P < 0.05 versus Normoxia.
0
10
20
30
40
50
60
0 10 20 30 40 50
Pres
sure
(mm
Hg)
Volume (μL)
Normoxia28 HySu
Figure 1. Representative in vivo RV pressure–volume loops from
normoxia (dashed line) and 28-HySu mice (solid line), respectively.
2013 | Vol. 1 | Iss. 7 | e00184Page 4
ª 2013 The Authors. Physiological Reports published by Wiley Periodicals, Inc. on behalf of
the American Physiological Society and The Physiological Society.
Right Ventricular Dysfunction in Pressure Overload Z. Wang et al.
A B C
D E F
A B C
D E F
Figure 2. Representative in vivo RV pressure and volume waveforms with the inferior vena cava occlusion (VCO) from normoxia (left) and 28-
HySu (right) mice, respectively.
0
500
1000
1500
2000
2500
3000
3500
4000
4500
dP/d
t max
(mm
Hg/
s)
0
5
10
15
20
25
30
35
0.0
0.5
1.0
1.5
2.0
2.5
3.0
Ees
(mm
Hg/μL
)
CB
**
*
A
**
*P = 0.06
*
P = 0.15Normoxia14 HySu21 HySu28 HySu
Prel
oad
recr
uita
ble
stro
ke w
ork
(mm
Hg)
Figure 3. Changes in RV contractility parameters (Ees, preload-recruitable stroke work and dP/dtmax) during the progression of PAH. N = 8–9
per group. *P < 0.05 versus normoxia.
0
5
10
15
20
25
30
35
End-
dias
tolic
vol
ume
(μL)
–4000
–3500
–3000
–2500
–2000
–1500
–1000
–500
0
dP/d
t min
(mm
Hg/
s)
**
*
A BP = 0.18
Normoxia14 HySu21 HySu28 HySu
Figure 4. Changes in RV diastolic function parameters (end-
diastolic volume and dP/dtmin) during the progression of PAH.
N = 8–9 per group. *P < 0.05 versus normoxia.
4
5
6
7
8
9
10
Car
diac
out
put (
mL/
min
)
0
10
20
30
40
50
60
70
Ejec
tion
frac
tion
(%)
A BP = 0.08
Normoxia14 HySu21 HySu28 HySu
Figure 5. Changes in RV ejection fraction and cardiac output
during the progression of PAH. N = 8–9 per group. *P < 0.05
versus normoxia.
ª 2013 The Authors. Physiological Reports published by Wiley Periodicals, Inc. on behalf ofthe American Physiological Society and The Physiological Society.
2013 | Vol. 1 | Iss. 7 | e00184Page 5
Z. Wang et al. Right Ventricular Dysfunction in Pressure Overload
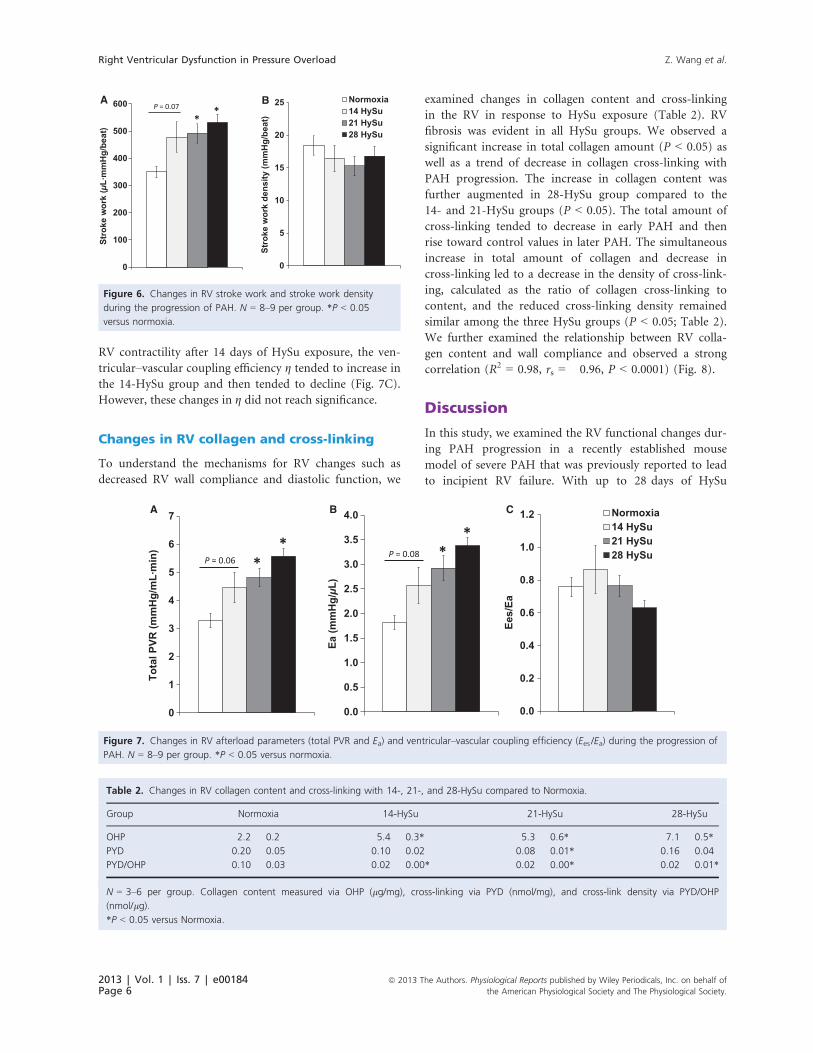
RV contractility after 14 days of HySu exposure, the ven-
tricular–vascular coupling efficiency g tended to increase in
the 14-HySu group and then tended to decline (Fig. 7C).
However, these changes in g did not reach significance.
Changes in RV collagen and cross-linking
To understand the mechanisms for RV changes such as
decreased RV wall compliance and diastolic function, we
examined changes in collagen content and cross-linking
in the RV in response to HySu exposure (Table 2). RV
fibrosis was evident in all HySu groups. We observed a
significant increase in total collagen amount (P < 0.05) as
well as a trend of decrease in collagen cross-linking with
PAH progression. The increase in collagen content was
further augmented in 28-HySu group compared to the
14- and 21-HySu groups (P < 0.05). The total amount of
cross-linking tended to decrease in early PAH and then
rise toward control values in later PAH. The simultaneous
increase in total amount of collagen and decrease in
cross-linking led to a decrease in the density of cross-link-
ing, calculated as the ratio of collagen cross-linking to
content, and the reduced cross-linking density remained
similar among the three HySu groups (P < 0.05; Table 2).
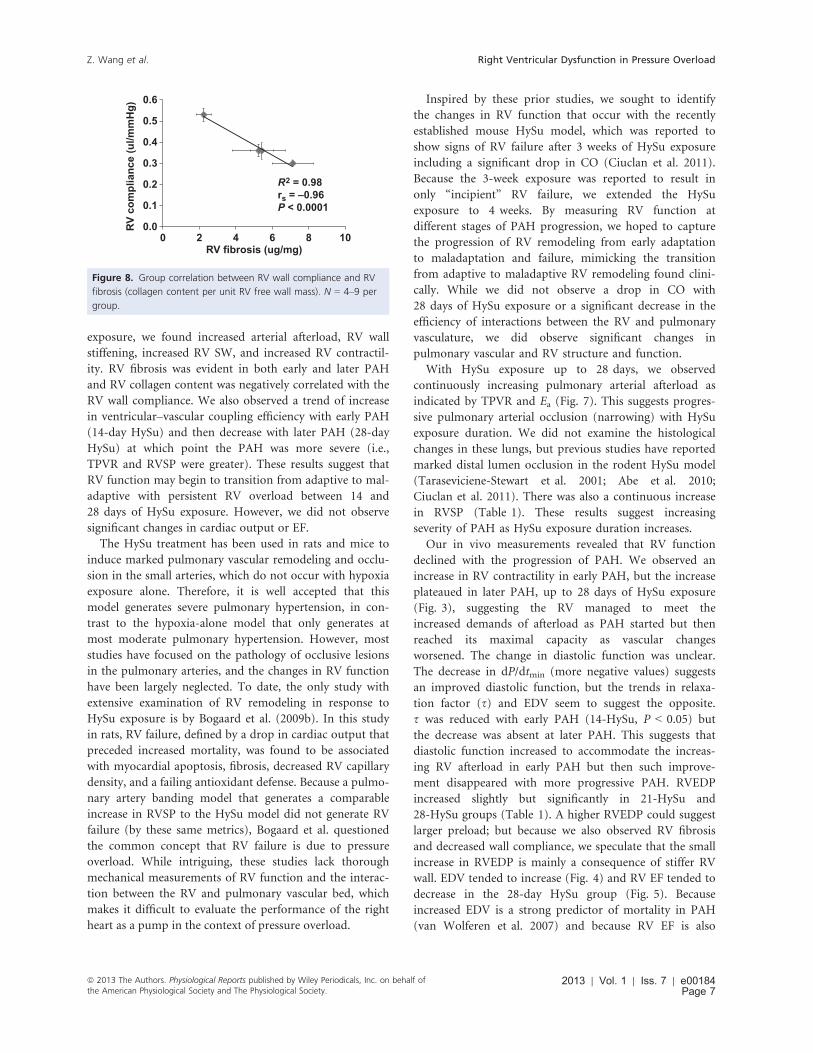
We further examined the relationship between RV colla-
gen content and wall compliance and observed a strong
correlation (R2 = 0.98, rs = �0.96, P < 0.0001) (Fig. 8).
Discussion
In this study, we examined the RV functional changes dur-
ing PAH progression in a recently established mouse
model of severe PAH that was previously reported to lead
to incipient RV failure. With up to 28 days of HySu
0
5
10
15
20
25
Stro
ke w
ork
dens
ity (m
mH
g/be
at)
0
100
200
300
400
500
600St
roke
wor
k (μ
L·m
mH
g/be
at)
*A B
*P = 0.07
Normoxia14 HySu21 HySu28 HySu
Figure 6. Changes in RV stroke work and stroke work density
during the progression of PAH. N = 8–9 per group. *P < 0.05
versus normoxia.
0.0
0.2
0.4
0.6
0.8
1.0
1.2Ee
s/Ea
0.0
0.5
1.0
1.5
2.0
2.5
3.0
3.5
4.0
Ea (m
mH
g/μL
)
0
1
2
3
4
5
6
7
Tota
l PVR
(mm
Hg/
mL·
min
)
A
*
B
*C
**
P = 0.06P = 0.08
Normoxia14 HySu21 HySu28 HySu
Figure 7. Changes in RV afterload parameters (total PVR and Ea) and ventricular–vascular coupling efficiency (Ees /Ea) during the progression of
PAH. N = 8–9 per group. *P < 0.05 versus normoxia.
Table 2. Changes in RV collagen content and cross-linking with 14-, 21-, and 28-HySu compared to Normoxia.
Group Normoxia 14-HySu 21-HySu 28-HySu
OHP 2.2 � 0.2 5.4 � 0.3* 5.3 � 0.6* 7.1 � 0.5*
PYD 0.20 � 0.05 0.10 � 0.02 0.08 � 0.01* 0.16 � 0.04
PYD/OHP 0.10 � 0.03 0.02 � 0.00* 0.02 � 0.00* 0.02 � 0.01*
N = 3–6 per group. Collagen content measured via OHP (lg/mg), cross-linking via PYD (nmol/mg), and cross-link density via PYD/OHP
(nmol/lg).
*P < 0.05 versus Normoxia.
2013 | Vol. 1 | Iss. 7 | e00184Page 6
ª 2013 The Authors. Physiological Reports published by Wiley Periodicals, Inc. on behalf of
the American Physiological Society and The Physiological Society.
Right Ventricular Dysfunction in Pressure Overload Z. Wang et al.
exposure, we found increased arterial afterload, RV wall
stiffening, increased RV SW, and increased RV contractil-
ity. RV fibrosis was evident in both early and later PAH
and RV collagen content was negatively correlated with the
RV wall compliance. We also observed a trend of increase
in ventricular–vascular coupling efficiency with early PAH
(14-day HySu) and then decrease with later PAH (28-day
HySu) at which point the PAH was more severe (i.e.,
TPVR and RVSP were greater). These results suggest that
RV function may begin to transition from adaptive to mal-
adaptive with persistent RV overload between 14 and
28 days of HySu exposure. However, we did not observe
significant changes in cardiac output or EF.
The HySu treatment has been used in rats and mice to
induce marked pulmonary vascular remodeling and occlu-
sion in the small arteries, which do not occur with hypoxia
exposure alone. Therefore, it is well accepted that this
model generates severe pulmonary hypertension, in con-
trast to the hypoxia-alone model that only generates at
most moderate pulmonary hypertension. However, most
studies have focused on the pathology of occlusive lesions
in the pulmonary arteries, and the changes in RV function
have been largely neglected. To date, the only study with
extensive examination of RV remodeling in response to
HySu exposure is by Bogaard et al. (2009b). In this study
in rats, RV failure, defined by a drop in cardiac output that
preceded increased mortality, was found to be associated
with myocardial apoptosis, fibrosis, decreased RV capillary
density, and a failing antioxidant defense. Because a pulmo-
nary artery banding model that generates a comparable
increase in RVSP to the HySu model did not generate RV
failure (by these same metrics), Bogaard et al. questioned
the common concept that RV failure is due to pressure
overload. While intriguing, these studies lack thorough
mechanical measurements of RV function and the interac-
tion between the RV and pulmonary vascular bed, which
makes it difficult to evaluate the performance of the right
heart as a pump in the context of pressure overload.
Inspired by these prior studies, we sought to identify
the changes in RV function that occur with the recently
established mouse HySu model, which was reported to
show signs of RV failure after 3 weeks of HySu exposure
including a significant drop in CO (Ciuclan et al. 2011).
Because the 3-week exposure was reported to result in
only “incipient” RV failure, we extended the HySu
exposure to 4 weeks. By measuring RV function at
different stages of PAH progression, we hoped to capture
the progression of RV remodeling from early adaptation
to maladaptation and failure, mimicking the transition
from adaptive to maladaptive RV remodeling found clini-
cally. While we did not observe a drop in CO with
28 days of HySu exposure or a significant decrease in the
efficiency of interactions between the RV and pulmonary
vasculature, we did observe significant changes in
pulmonary vascular and RV structure and function.
With HySu exposure up to 28 days, we observed
continuously increasing pulmonary arterial afterload as
indicated by TPVR and Ea (Fig. 7). This suggests progres-
sive pulmonary arterial occlusion (narrowing) with HySu
exposure duration. We did not examine the histological
changes in these lungs, but previous studies have reported
marked distal lumen occlusion in the rodent HySu model
(Taraseviciene-Stewart et al. 2001; Abe et al. 2010;
Ciuclan et al. 2011). There was also a continuous increase
in RVSP (Table 1). These results suggest increasing
severity of PAH as HySu exposure duration increases.
Our in vivo measurements revealed that RV function
declined with the progression of PAH. We observed an
increase in RV contractility in early PAH, but the increase
plateaued in later PAH, up to 28 days of HySu exposure
(Fig. 3), suggesting the RV managed to meet the
increased demands of afterload as PAH started but then
reached its maximal capacity as vascular changes
worsened. The change in diastolic function was unclear.
The decrease in dP/dtmin (more negative values) suggests
an improved diastolic function, but the trends in relaxa-
tion factor (s) and EDV seem to suggest the opposite.
s was reduced with early PAH (14-HySu, P < 0.05) but
the decrease was absent at later PAH. This suggests that
diastolic function increased to accommodate the increas-
ing RV afterload in early PAH but then such improve-
ment disappeared with more progressive PAH. RVEDP
increased slightly but significantly in 21-HySu and
28-HySu groups (Table 1). A higher RVEDP could suggest
larger preload; but because we also observed RV fibrosis
and decreased wall compliance, we speculate that the small
increase in RVEDP is mainly a consequence of stiffer RV
wall. EDV tended to increase (Fig. 4) and RV EF tended to
decrease in the 28-day HySu group (Fig. 5). Because
increased EDV is a strong predictor of mortality in PAH
(van Wolferen et al. 2007) and because RV EF is also
0.0
0.1
0.2
0.3
0.4
0.5
0.6
0 2 4 6 8 10
)gH
mm/lu(
ecnailpmoc
VR
RV fibrosis (ug/mg)
R2 = 0.98rs = –0.96P < 0.0001
Figure 8. Group correlation between RV wall compliance and RV
fibrosis (collagen content per unit RV free wall mass). N = 4–9 per
group.
ª 2013 The Authors. Physiological Reports published by Wiley Periodicals, Inc. on behalf ofthe American Physiological Society and The Physiological Society.
2013 | Vol. 1 | Iss. 7 | e00184Page 7
Z. Wang et al. Right Ventricular Dysfunction in Pressure Overload
closely related to the RV dilatation and has been recognized
as a strong predictor of mortality in PAH (Kawut et al.
2005; van de Veerdonk et al. 2011), these trends likely indi-
cate that RV remodeling has become maladaptive. Another
sign of RV dysfunction at 28 days of HySu exposure lies in
Ees/Ea, an index of hemodynamic coupling or the efficiency
of the ventricular–vascular interactions. Interestingly, we
observed a trend of increase in Ees/Ea with early PAH
(14-HySu) and a possible decreasing trend with later PAH
(28-HySu) (Fig. 7). This suggests that in an early or mild
stage of the disease, the RV adapts to preserve efficiency; but
as disease progresses and becomes more severe, neither
remodeling nor increased contractility allows the RV to meet
the increasing demands. Subsequently, hemodynamic cou-
pling efficiency decreases, as observed in patients with PAH
previously (Kuehne et al. 2004; Gupta et al. 2011; Sanz et al.
2012). The lower Ees/Ea may be indicative of maladaptive RV
remodeling, which awaits further investigation. We speculate
that RV remodeling becomes dysfunctional at 28 days of
HySu and, if extended to an even longer HySu exposure time
(i.e. 8~12 week), RV failure would occur.
We also examined biological changes in the RV tissues
and found significant hypertrophy and fibrosis. RV hyper-
trophy occurred with early PAH but like contractility, did
not increase much with later PAH (Table 1). In contrast,
the collagen accumulation in RV continued to increase as
PAH progressed, and we found a strong, negative correla-
tion between collagen content and RV wall compliance
(Table 2, Fig. 8). Similar to the LV, RV fibrosis is a hall-
mark of dysfunctional or failing RV (Bogaard et al.
2009a,b). It is known that the predominant matrix scaf-
fold in the heart is collagen, which surrounds, supports,
and interconnects the myocytes, myofibrils, and muscles
to maintain ventricular shape and size and contributes to
tissue stiffness (Janicki et al. 2006). Changes in collagen
have been found to affect the myocardial systolic and dia-
stolic functions in the pressure-overloaded LV (Weber
et al. 1988; Weber 1989; Baicu et al. 2003). For example,
Lopez et al. recently showed that that increased collagen
cross-linking is associated with increased filling pressure,
increased chamber stiffness, and decreased EF in LVs with
chronic stage C heart failure (Lopez et al. 2012). In PAH,
RV fibrosis has been correlated with elevated mean pul-
monary arterial pressure and PVR (Sanz et al. 2007;
Shehata et al. 2011), as well as RV hypertrophy (Shehata
et al. 2011). How the collagen network affects myocyte
function and eventually the macroscopic function of the
RV may be critical to the mechanisms of RV failure.
In our study, we did not observe a significant drop in
CO in the HySu groups, which does not agree with the
prior findings of Ciuclan et al. (2011). However, Ciuclan
et al. measured CO echocardiographically in the aorta,
whereas we measured CO invasively in the RV. These
different technical approaches may greatly affect the mea-
surement. Furthermore, we used a different control group
than Ciuclan. A drop in CO was found by Ciuclan when
compared to a SUGEN-treated control group, not a vehi-
cle-treated control group as we did. Another discrepancy
is that the RVSP did not increase as much as previously
reported (~50 mmHg in Ciuclan et al.) even after 28-day
HySu exposure, which may be related to the maintenance
of CO. All procedures and treatments for the HySu model
were identical between our study and the prior study,
except for two aspects: (Abe et al. 2010) we used i.p.
injection instead of s.c. and (Baicu et al. 2003) our mice
were older (8–10 weeks old) than in the prior study
(~6 weeks old) at the beginning of the HySu exposure.
The ways in which these differences may affect the cardio-
pulmonary responses to HySu are unknown. For example,
with regard to the first point, with i.p. injection the drug
enters the systemic circulation via the hepatic portal sys-
tem, which may induce some portal hypertension via
endothelial damage. Moreover, although both the previ-
ous and current studies use C57BL6 strains, some carry a
mutation in nicotinamide nucleotide transhydrogenase
(NNT), a mitochondrial protein, that influences mito-
chondrial respiration (Ripoll et al. 2012), which would
potentially affect the outcomes of the HySu exposure.
In our hands, up to 28 days of HySu exposure does not
decrease the SV, which is maintained by increased EDV.
Thus, at the cellular level, the Frank–Starling mechanism
should be preserved. However, our data are based on whole
chamber function and details of the RV myocyte length–tension relationships, which may deteriorate with PAH
progression, were not directly measured. We estimated the
efficiency of the myofilaments by SW density and did not
find difference between the HySu groups and the control
group. In the calculation of SW density, we assume con-
stant tissue density for all experimental groups. Future
examination on tissue density changes in a hypertrophied
or fibrotic RV may be useful. Because we used the RV tis-
sues for collagen quantification, we were not able to quan-
tify RV wall thickness or myofilament density to confirm
the structural changes, which can be examined in a future
study. To gain further insight into potential changes in RV
free wall mechanics as well as pulmonary vascular changes
both such as stiffening and narrowing, Tewari et al. (2013,
companion paper) fit a mathematical model of realistic
ventricular mechanics coupled with a simple model of the
pulmonary and systemic vascular systems to these data.
These model results provide additional insights into the
tissue and cellular level changes in RV and pulmonary vas-
cular function during the progression of severe PAH and
support the suggestion that the 28-day time point may rep-
resent a transition from RV adaptive remodeling to RV
maladaptive remodeling that precedes overt RV failure.
2013 | Vol. 1 | Iss. 7 | e00184Page 8
ª 2013 The Authors. Physiological Reports published by Wiley Periodicals, Inc. on behalf of
the American Physiological Society and The Physiological Society.
Right Ventricular Dysfunction in Pressure Overload Z. Wang et al.
While “RV dysfunction/failure” is becoming a new
research area in pulmonary hypertension (PH), its defini-
tion, especially in terms of hemodynamic measurements,
remains unclear. In the literature, impaired compliance,
worsened contractile function, and uncoupled ventricu-
lar–vascular efficiency have all been used as indicator of
RV dysfunction or failure. Clinically, the definition of RV
failure is also challenging with limited acceptance of echo-
cardiographic measures of RV EF and limited PV loop
data in this domain. Moreover, parameters like CO or EF
do not necessarily change in severe patients with dysfunc-
tional or failed hearts (Guazzi et al. 2011; Rain et al.
2013). In our study, hematocrit (Hct) increased (Table 1)
in all HySu groups, which would increase blood viscosity
and both systemic and pulmonary vascular resistance
(Schreier et al. 2013). Our data did not allow us to dis-
tinguish the effects of increased resistance (both systemic
and pulmonary) and increased oxygen carrying capacity
of blood on the maintenance of CO. Since increases in
Hct occur clinically (Persson et al. 1991), and these may
affect CO, this is another reason maintenance of CO may
not be the best measure of RV function in PH progres-
sion. Therefore, a better understanding of the key hemo-
dynamic parameters that may indicate the transition from
adaptive to maladaptive remodeling is needed. Investiga-
tions such as these, combined with other factors such as
the metabolic changes that indicate the shift from com-
pensated (adaptive) to decompensated (maladaptive) RV
hypertrophy (Sutendra et al. 2013), may eventually assist
in the prognosis and treatment of PAH.
Conclusion
In summary, our results demonstrate RV functional
changes with PAH development in a mouse model. With
up to 28 days of HySu exposure, we found continuously
increased arterial afterload and increased RV contractility
that plateaued with later PAH (>14-day HySu). RV fibro-
sis and hypertrophy were evident in all stages of PAH
and RV collagen content was negatively correlated with
the RV wall compliance. Our results suggest that RV
remodeling may begin to transition from adaptive to
maladaptive with persistent RV overload, which would
mimic changes in RV function with PAH progression
found clinically. To investigate the critical transition to
RV failure, younger mice, longer exposure to HySu or a
different model may be required.
Acknowledgments
We thank Guoqing Song for surgical procedures and Jens
C. Eickhoff for statistical analysis.
Conflict of Interest
None declared.
References
Abe, K., M. Toba, A. Alzoubi, M. Ito, K. A. Fagan, C. D. Cool,
et al. 2010. Formation of plexiform lesions in experimental
severe pulmonary arterial hypertension. Circulation
121:2747–2754.
Baicu, C. F., J. D. Stroud, V. A. Livesay, E. Hapke, J. Holder,
F. G. Spinale, et al. 2003. Changes in extracellular collagen
matrix alter myocardial systolic performance. Am. J. Physiol.
Heart Circ. Physiol. 284:H122–H132.
Bogaard, H. J., K. Abe, A. Vonk Noordegraaf, and
N. F. Voelkel. 2009a. The right ventricle under pressure:
cellular and molecular mechanisms of right-heart failure in
pulmonary hypertension. Chest 135:794–804.
Bogaard, H. J., R. Natarajan, S. C. Henderson, C. S. Long,
D. Kraskauskas, L. Smithson, et al. 2009b. Chronic
pulmonary artery pressure elevation is insufficient to explain
right heart failure. Circulation 120:1951–1960.
Ciuclan, L., O. Bonneau, M. Hussey, N. Duggan,
A. M. Holmes, R. Good, et al. 2011. A novel murine model
of severe pulmonary arterial hypertension. Am. J. Respir.
Crit. Care Med. 184:1171–1182.
D’Alonzo, G. E., R. J. Barst, S. M. Ayres, E. H. Bergofsky,
B. H. Brundage, K. M. Detre, et al. 1991. Survival in patients
with primary pulmonary hypertension. Results from a
national prospective registry. Ann. Intern. Med. 115:343–349.
Gomez-Arroyo, J., S. J. Saleem, S. Mizuno, A. A. Syed,
H. J. Bogaard, A. Abbate, et al. 2012. A brief overview of
mouse models of pulmonary arterial hypertension: problems
and prospects. Am. J. Physiol. Lung Cell. Mol. Physiol. 302:
L977–L991.
Guazzi, M., M. Vicenzi, R. Arena, and M. D. Guazzi. 2011.
Pulmonary hypertension in heart failure with preserved
ejection fraction: a target of phosphodiesterase-5 inhibition
in a 1-year study. Circulation 124:164–174.
Gupta, H., G. Ghimire, and R. Naeije. 2011. The value of tools
to assess pulmonary arterial hypertension. Eur. Respir. Rev.
20:222–235.
Humbert, M., O. Sitbon, A. Chaouat, M. Bertocchi, G. Habib,
V. Gressin, et al. 2010. Survival in patients with idiopathic,
familial, and anorexigen-associated pulmonary arterial
hypertension in the modern management era. Circulation
122:156–163.
Janicki, J. S., G. L. Brower, J. D. Gardner, M. F. Forman,
J. A. Jr Stewart, D. B. Murray, et al. 2006. Cardiac mast cell
regulation of matrix metalloproteinase-related ventricular
remodeling in chronic pressure or volume overload.
Cardiovasc. Res. 69:657–665.
Kawut, S. M., E. M. Horn, K. K. Berekashvili, R. P. Garofano,
R. L. Goldsmith, A. C. Widlitz, et al. 2005. New predictors
ª 2013 The Authors. Physiological Reports published by Wiley Periodicals, Inc. on behalf ofthe American Physiological Society and The Physiological Society.
2013 | Vol. 1 | Iss. 7 | e00184Page 9
Z. Wang et al. Right Ventricular Dysfunction in Pressure Overload
of outcome in idiopathic pulmonary arterial hypertension.
Am. J. Cardiol. 95:199–203.
Kerckhoffs, R. C. P., P. H. M. Bovendeerd, F. W. Prinzen,
K. Smits, and T. Arts. 2003. Intra- and interventricular
asynchrony of electromechanics in the ventricularly paced
heart. J. Eng. Math. 47:201–216.
Kuehne, T., S. Yilmaz, P. Steendijk, P. Moore, M. Groenink,
M. Saaed, et al. 2004. Magnetic resonance imaging analysis
of right ventricular pressure-volume loops: in vivo
validation and clinical application in patients with
pulmonary hypertension. Circulation 110:2010–2016.
Lopez, B., R. Querejeta, A. Gonzalez, M. Larman, and J. Diez.
2012. Collagen cross-linking but not collagen amount
associates with elevated filling pressures in hypertensive
patients with stage C heart failure: potential role of lysyl
oxidase. Hypertension 60:677–683.
McLaughlin, V. V., S. L. Archer, D. B. Badesch, R. J. Barst,
H. W. Farber, J. R. Lindner, et al. 2009. ACCF/AHA 2009
expert consensus document on pulmonary hypertension: a
report of the American College of Cardiology Foundation
Task Force on Expert Consensus Documents and the
American Heart Association: developed in collaboration
with the American College of Chest Physicians, American
Thoracic Society, Inc., and the Pulmonary Hypertension
Association. Circulation 119:2250–2294.
Nicolls, M. R., S. Mizuno, L. Taraseviciene-Stewart, L. Farkas,
J. I. Drake, A. Al Husseini, et al. 2012. New models of
pulmonary hypertension based on VEGF receptor
blockade-induced endothelial cell apoptosis. Pulm. Circ. 2:
434–442.
Ooi, C. Y., Z. Wang, D. M. Tabima, J. C. Eickhoff, and
N. C. Chesler. 2010. The role of collagen in extralobar
pulmonary artery stiffening in response to hypoxia-induced
pulmonary hypertension. Am. J. Physiol. Heart Circ.
Physiol. 299:H1823–H1831.
Pacher, P. N. T., P. Mukhopadhyay, S. Batkai, and D. A. Kass.
2008. Measurement of cardiac function using
pressure-volume conductance catheter technique in mice
and rats. Nat. Protoc. 3:1422–1434.
Persson, S. U., C. G. Gustavsson, H. Larsson, and S. Persson.
1991. Studies on blood rheology in patients with primary
pulmonary hypertension. Angiology 42:836–842.
Porterfield, J. E. K. A., K. Raghavan, D. Escobedo,
J. T. Jenkins, E. R. Larson, R. J. Trevino, et al. 2009.
Dynamic correction for parallel conductance, GP, and gain
factor, alpha, in invasive murine left ventricular volume
measurements. J. Appl. Physiol. 107:1693–1703.
Rain, S., M. L. Handoko, P. Trip, T. J. Gan, N. Westerhof,
G. Stienen, et al. 2013. Right ventricular diastolic
impairment in patients with pulmonary arterial
hypertension. Circulation 128:2016–2025.
Ripoll, V. M., N. A. Meadows, M. Bangert, A. W. Lee,
A. Kadioglu, and R. D. Cox. 2012. Nicotinamide nucleotide
transhydrogenase (NNT) acts as a novel modulator of
macrophage inflammatory responses. FASEB J. 26:
3550–3562.
Sanz, J., S. Dellegrottaglie, M. Kariisa, R. Sulica, M. Poon,
T. P. O’Donnell, et al. 2007. Prevalence and correlates of
septal delayed contrast enhancement in patients with
pulmonary hypertension. Am. J. Cardiol. 100:
731–735.
Sanz, J., A. Garcia-Alvarez, L. Fernandez-Friera, A. Nair,
J. G. Mirelis, S. T. Sawit, et al. 2012. Right
ventriculo-arterial coupling in pulmonary hypertension: a
magnetic resonance study. Heart 98:238–243.
Schreier, D. A., T. A. Hacker, G. Song, and N. C. Chesler.
2013. Impact of blood viscosity on right ventricular
afterload during hypoxic pulmonary hypertension. P. 111 in
Biomedical Engineering Society Conference, BMES Annual
Meeting, Seattle, WA, 25–28 September 2013.
Shehata, M. L., D. Lossnitzer, J. Skrok, D. Boyce, N. Lechtzin,
S. C. Mathai, et al. 2011. Myocardial delayed enhancement
in pulmonary hypertension: pulmonary hemodynamics,
right ventricular function, and remodeling. AJR Am.
J. Roentgenol. 196:87–94.
Sutendra, G., P. Dromparis, R. Paulin, S. Zervopoulos,
A. Haromy, J. Nagendran, et al. 2013. A metabolic
remodeling in right ventricular hypertrophy is associated
with decreased angiogenesis and a transition from a
compensated to a decompensated state in pulmonary
hypertension. J. Mol. Med. (Berl) 91:1315–1327.
Tabima, D. M., T. A. Hacker, and N. C. Chesler. 2010.
Measuring right ventricular function in the normal and
hypertensive mouse hearts using admittance-derived
pressure-volume loops. Am. J. Physiol. Heart Circ. Physiol.
299:H2069–H2075.
Taraseviciene-Stewart, L., Y. Kasahara, L. Alger, P. Hirth,
G. Mc Mahon, J. Waltenberger, et al. 2001. Inhibition of
the VEGF receptor 2 combined with chronic hypoxia causes
cell death-dependent pulmonary endothelial cell
proliferation and severe pulmonary hypertension. FASEB J.
15:427–438.
Tewari, S. G., S. M. Bugenhagen, Z. Wang, D. A. Schreier,
B. E. Carlson, N. C. Chesler, et al. 2013. Analysis of
cardiovascular dynamics in pulmonary hypertensive
C57BL6/J mice. Frontiers (companion paper in press) 4.
doi: 10.3389/fphys.2013.00355.
van de Veerdonk, M. C., T. Kind, J. T. Marcus, G. J. Mauritz,
M. W. Heymans, H. J. Bogaard, et al. 2011. Progressive
right ventricular dysfunction in patients with pulmonary
arterial hypertension responding to therapy. J. Am. Coll.
Cardiol. 58:2511–2519.
Vinnakota, K. C., and J. B. Bassingthwaighte. 2004. Myocardial
density and composition: a basis for calculating intracellular
metabolite concentrations. Am. J. Physiol. Heart Circ.
Physiol. 286:H1742–H1749.
Voelkel, N. F., R. A. Quaife, L. A. Leinwand, R. J. Barst,
M. D. McGoon, D. R. Meldrum, et al. 2006. Right
2013 | Vol. 1 | Iss. 7 | e00184Page 10
ª 2013 The Authors. Physiological Reports published by Wiley Periodicals, Inc. on behalf of
the American Physiological Society and The Physiological Society.
Right Ventricular Dysfunction in Pressure Overload Z. Wang et al.
ventricular function and failure: report of a National Heart,
Lung, and Blood Institute working group on cellular and
molecular mechanisms of right heart failure. Circulation
114:1883–1891.
Voelkel, N. F., J. Gomez-Arroyo, A. Abbate, H. J. Bogaard,
and M. R. Nicolls. 2012. Pathobiology of pulmonary arterial
hypertension and right ventricular failure. Eur. Respir.
J. 40:1555–1565.
Wang, Z., and N. C. Chesler. 2011. Pulmonary vascular wall
stiffness: An important contributor to the increased right
ventricular afterload with pulmonary hypertension. Pulm.
Circ. 1:212–223.
Wang, Z., and N. C. Chesler. 2012. Role of collagen content
and cross-linking in large pulmonary arterial stiffening after
chronic hypoxia. Biomech. Model. Mechanobiol. 11:279–
289.
Wang, Z., R. S. Lakes, J. C. Eickhoff, and N. C. Chesler. 2013.
Effects of collagen deposition on passive and active
mechanical properties of large pulmonary arteries in
hypoxic pulmonary hypertension. Biomech. Model.
Mechanobiol. 12:1115–1125.
Weber, K. T. 1989. Cardiac interstitium in health and disease: the
fibrillar collagen network. J. Am. Coll. Cardiol. 13:1637–1652.
Weber, K. T., J. S. Janicki, S. G. Shroff, R. Pick, R. M. Chen,
and R. I. Bashey. 1988. Collagen remodeling of the
pressure-overloaded, hypertrophied nonhuman primate
myocardium. Circ. Res. 62:757–765.
van Wolferen, S. A., J. T. Marcus, A. Boonstra,
K. M. Marques, J. G. Bronzwaer, M. D. Spreeuwenberg,
et al. 2007. Prognostic value of right ventricular mass,
volume, and function in idiopathic pulmonary arterial
hypertension. Eur. Heart J. 28:1250–1257.
ª 2013 The Authors. Physiological Reports published by Wiley Periodicals, Inc. on behalf ofthe American Physiological Society and The Physiological Society.
2013 | Vol. 1 | Iss. 7 | e00184Page 11
Z. Wang et al. Right Ventricular Dysfunction in Pressure Overload
Related Documents